Cities with the Largest South American Community in Illinois
RELATED REPORTS & OPTIONS
South American
Illinois
Compare Cities
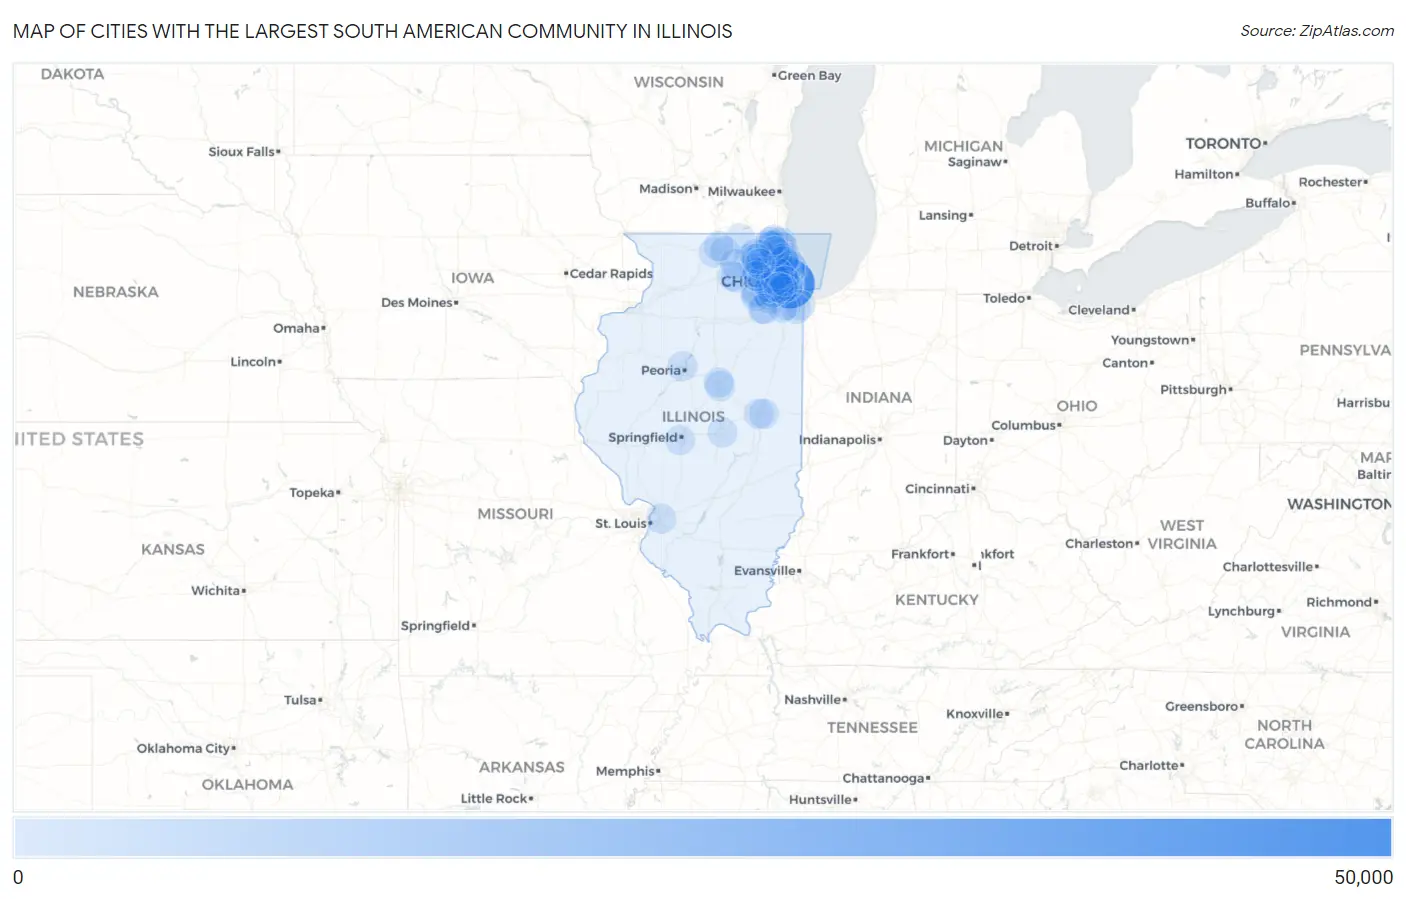
Map of Cities with the Largest South American Community in Illinois
0
50,000
Cities with the Largest South American Community in Illinois
| City | South American | vs State | vs National | |
| 1. | Chicago | 48,740 | 102,476(47.56%)#1 | 4,248,408(1.15%)#4 |
| 2. | Aurora | 1,722 | 102,476(1.68%)#2 | 4,248,408(0.04%)#336 |
| 3. | Elgin | 1,398 | 102,476(1.36%)#3 | 4,248,408(0.03%)#423 |
| 4. | Naperville | 1,232 | 102,476(1.20%)#4 | 4,248,408(0.03%)#486 |
| 5. | Cicero | 1,182 | 102,476(1.15%)#5 | 4,248,408(0.03%)#515 |
| 6. | Berwyn | 1,143 | 102,476(1.12%)#6 | 4,248,408(0.03%)#542 |
| 7. | Carol Stream | 909 | 102,476(0.89%)#7 | 4,248,408(0.02%)#656 |
| 8. | Joliet | 886 | 102,476(0.86%)#8 | 4,248,408(0.02%)#673 |
| 9. | Des Plaines | 802 | 102,476(0.78%)#9 | 4,248,408(0.02%)#736 |
| 10. | Streamwood | 799 | 102,476(0.78%)#10 | 4,248,408(0.02%)#738 |
| 11. | Evanston | 749 | 102,476(0.73%)#11 | 4,248,408(0.02%)#794 |
| 12. | Schaumburg | 745 | 102,476(0.73%)#12 | 4,248,408(0.02%)#797 |
| 13. | Palatine | 716 | 102,476(0.70%)#13 | 4,248,408(0.02%)#828 |
| 14. | Bloomingdale | 700 | 102,476(0.68%)#14 | 4,248,408(0.02%)#839 |
| 15. | Skokie | 697 | 102,476(0.68%)#15 | 4,248,408(0.02%)#843 |
| 16. | Waukegan | 692 | 102,476(0.68%)#16 | 4,248,408(0.02%)#847 |
| 17. | Elmwood Park | 671 | 102,476(0.65%)#17 | 4,248,408(0.02%)#877 |
| 18. | Hanover Park | 616 | 102,476(0.60%)#18 | 4,248,408(0.01%)#958 |
| 19. | Wheeling | 606 | 102,476(0.59%)#19 | 4,248,408(0.01%)#967 |
| 20. | Arlington Heights | 596 | 102,476(0.58%)#20 | 4,248,408(0.01%)#980 |
| 21. | Hoffman Estates | 590 | 102,476(0.58%)#21 | 4,248,408(0.01%)#988 |
| 22. | Lombard | 582 | 102,476(0.57%)#22 | 4,248,408(0.01%)#1,004 |
| 23. | River Grove | 519 | 102,476(0.51%)#23 | 4,248,408(0.01%)#1,087 |
| 24. | Franklin Park | 518 | 102,476(0.51%)#24 | 4,248,408(0.01%)#1,090 |
| 25. | Oak Park | 515 | 102,476(0.50%)#25 | 4,248,408(0.01%)#1,097 |
| 26. | Melrose Park | 492 | 102,476(0.48%)#26 | 4,248,408(0.01%)#1,137 |
| 27. | Champaign | 478 | 102,476(0.47%)#27 | 4,248,408(0.01%)#1,157 |
| 28. | Gurnee | 475 | 102,476(0.46%)#28 | 4,248,408(0.01%)#1,165 |
| 29. | Burbank | 472 | 102,476(0.46%)#29 | 4,248,408(0.01%)#1,171 |
| 30. | Bartlett | 470 | 102,476(0.46%)#30 | 4,248,408(0.01%)#1,176 |
| 31. | Lyons | 456 | 102,476(0.44%)#31 | 4,248,408(0.01%)#1,203 |
| 32. | North Chicago | 434 | 102,476(0.42%)#32 | 4,248,408(0.01%)#1,248 |
| 33. | Romeoville | 428 | 102,476(0.42%)#33 | 4,248,408(0.01%)#1,258 |
| 34. | Bolingbrook | 423 | 102,476(0.41%)#34 | 4,248,408(0.01%)#1,279 |
| 35. | Wheaton | 413 | 102,476(0.40%)#35 | 4,248,408(0.01%)#1,305 |
| 36. | Mount Prospect | 394 | 102,476(0.38%)#36 | 4,248,408(0.01%)#1,343 |
| 37. | Lake In The Hills | 394 | 102,476(0.38%)#37 | 4,248,408(0.01%)#1,346 |
| 38. | Glenview | 378 | 102,476(0.37%)#38 | 4,248,408(0.01%)#1,376 |
| 39. | Norridge | 377 | 102,476(0.37%)#39 | 4,248,408(0.01%)#1,378 |
| 40. | Decatur | 374 | 102,476(0.36%)#40 | 4,248,408(0.01%)#1,382 |
| 41. | Urbana | 369 | 102,476(0.36%)#41 | 4,248,408(0.01%)#1,398 |
| 42. | Buffalo Grove | 356 | 102,476(0.35%)#42 | 4,248,408(0.01%)#1,429 |
| 43. | Huntley | 355 | 102,476(0.35%)#43 | 4,248,408(0.01%)#1,433 |
| 44. | Harvard | 354 | 102,476(0.35%)#44 | 4,248,408(0.01%)#1,436 |
| 45. | Glendale Heights | 352 | 102,476(0.34%)#45 | 4,248,408(0.01%)#1,441 |
| 46. | Park Ridge | 342 | 102,476(0.33%)#46 | 4,248,408(0.01%)#1,469 |
| 47. | Maywood | 335 | 102,476(0.33%)#47 | 4,248,408(0.01%)#1,495 |
| 48. | Oak Lawn | 333 | 102,476(0.32%)#48 | 4,248,408(0.01%)#1,502 |
| 49. | Bloomington | 332 | 102,476(0.32%)#49 | 4,248,408(0.01%)#1,507 |
| 50. | Cortland | 327 | 102,476(0.32%)#50 | 4,248,408(0.01%)#1,541 |
| 51. | Rosemont | 320 | 102,476(0.31%)#51 | 4,248,408(0.01%)#1,567 |
| 52. | Justice | 316 | 102,476(0.31%)#52 | 4,248,408(0.01%)#1,578 |
| 53. | Springfield | 310 | 102,476(0.30%)#53 | 4,248,408(0.01%)#1,589 |
| 54. | Wilmette | 307 | 102,476(0.30%)#54 | 4,248,408(0.01%)#1,603 |
| 55. | Round Lake | 303 | 102,476(0.30%)#55 | 4,248,408(0.01%)#1,622 |
| 56. | Carpentersville | 302 | 102,476(0.29%)#56 | 4,248,408(0.01%)#1,624 |
| 57. | Rockford | 301 | 102,476(0.29%)#57 | 4,248,408(0.01%)#1,626 |
| 58. | Peoria | 301 | 102,476(0.29%)#58 | 4,248,408(0.01%)#1,627 |
| 59. | Elmhurst | 300 | 102,476(0.29%)#59 | 4,248,408(0.01%)#1,633 |
| 60. | Montgomery | 292 | 102,476(0.28%)#60 | 4,248,408(0.01%)#1,666 |
| 61. | Elk Grove Village | 287 | 102,476(0.28%)#61 | 4,248,408(0.01%)#1,687 |
| 62. | Dekalb | 285 | 102,476(0.28%)#62 | 4,248,408(0.01%)#1,693 |
| 63. | Lansing | 281 | 102,476(0.27%)#63 | 4,248,408(0.01%)#1,714 |
| 64. | Grayslake | 280 | 102,476(0.27%)#64 | 4,248,408(0.01%)#1,719 |
| 65. | Oswego | 270 | 102,476(0.26%)#65 | 4,248,408(0.01%)#1,768 |
| 66. | Niles | 258 | 102,476(0.25%)#66 | 4,248,408(0.01%)#1,822 |
| 67. | Tinley Park | 256 | 102,476(0.25%)#67 | 4,248,408(0.01%)#1,830 |
| 68. | Vernon Hills | 255 | 102,476(0.25%)#68 | 4,248,408(0.01%)#1,838 |
| 69. | Highland Park | 252 | 102,476(0.25%)#69 | 4,248,408(0.01%)#1,845 |
| 70. | Addison | 239 | 102,476(0.23%)#70 | 4,248,408(0.01%)#1,916 |
| 71. | Crystal Lake | 237 | 102,476(0.23%)#71 | 4,248,408(0.01%)#1,928 |
| 72. | Round Lake Park | 236 | 102,476(0.23%)#72 | 4,248,408(0.01%)#1,937 |
| 73. | West Chicago | 232 | 102,476(0.23%)#73 | 4,248,408(0.01%)#1,955 |
| 74. | Lincolnwood | 232 | 102,476(0.23%)#74 | 4,248,408(0.01%)#1,957 |
| 75. | South Elgin | 229 | 102,476(0.22%)#75 | 4,248,408(0.01%)#1,973 |
| 76. | Deerfield | 227 | 102,476(0.22%)#76 | 4,248,408(0.01%)#1,982 |
| 77. | Chicago Heights | 226 | 102,476(0.22%)#77 | 4,248,408(0.01%)#1,991 |
| 78. | Mokena | 218 | 102,476(0.21%)#78 | 4,248,408(0.01%)#2,029 |
| 79. | Cary | 218 | 102,476(0.21%)#79 | 4,248,408(0.01%)#2,030 |
| 80. | Woodridge | 214 | 102,476(0.21%)#80 | 4,248,408(0.01%)#2,050 |
| 81. | Round Lake Beach | 201 | 102,476(0.20%)#81 | 4,248,408(0.00%)#2,117 |
| 82. | Collinsville | 201 | 102,476(0.20%)#82 | 4,248,408(0.00%)#2,119 |
| 83. | Belvidere | 197 | 102,476(0.19%)#83 | 4,248,408(0.00%)#2,152 |
| 84. | Genoa | 197 | 102,476(0.19%)#84 | 4,248,408(0.00%)#2,156 |
| 85. | Forest View | 191 | 102,476(0.19%)#85 | 4,248,408(0.00%)#2,186 |
| 86. | Lisle | 187 | 102,476(0.18%)#86 | 4,248,408(0.00%)#2,210 |
| 87. | St Charles | 181 | 102,476(0.18%)#87 | 4,248,408(0.00%)#2,248 |
| 88. | Bensenville | 180 | 102,476(0.18%)#88 | 4,248,408(0.00%)#2,256 |
| 89. | Villa Park | 179 | 102,476(0.17%)#89 | 4,248,408(0.00%)#2,270 |
| 90. | Northbrook | 178 | 102,476(0.17%)#90 | 4,248,408(0.00%)#2,274 |
| 91. | Loves Park | 175 | 102,476(0.17%)#91 | 4,248,408(0.00%)#2,298 |
| 92. | Countryside | 174 | 102,476(0.17%)#92 | 4,248,408(0.00%)#2,312 |
| 93. | Lindenhurst | 168 | 102,476(0.16%)#93 | 4,248,408(0.00%)#2,361 |
| 94. | Forest Park | 168 | 102,476(0.16%)#94 | 4,248,408(0.00%)#2,362 |
| 95. | Normal | 160 | 102,476(0.16%)#95 | 4,248,408(0.00%)#2,415 |
| 96. | Mundelein | 159 | 102,476(0.16%)#96 | 4,248,408(0.00%)#2,422 |
| 97. | Hinsdale | 154 | 102,476(0.15%)#97 | 4,248,408(0.00%)#2,468 |
| 98. | Algonquin | 153 | 102,476(0.15%)#98 | 4,248,408(0.00%)#2,474 |
| 99. | Shorewood | 152 | 102,476(0.15%)#99 | 4,248,408(0.00%)#2,487 |
| 100. | East Dundee | 152 | 102,476(0.15%)#100 | 4,248,408(0.00%)#2,495 |
Common Questions
What are the Top 10 Cities with the Largest South American Community in Illinois?
Top 10 Cities with the Largest South American Community in Illinois are:
#1
48,740
#2
1,722
#3
1,398
#4
1,232
#5
1,182
#6
1,143
#7
909
#8
886
#9
802
#10
799
What city has the Largest South American Community in Illinois?
Chicago has the Largest South American Community in Illinois with 48,740.
What is the Total South American Population in the State of Illinois?
Total South American Population in Illinois is 102,476.
What is the Total South American Population in the United States?
Total South American Population in the United States is 4,248,408.