Cities with the Highest Percentage of Belgian Population in Illinois
RELATED REPORTS & OPTIONS
Belgian
Illinois
Compare Cities
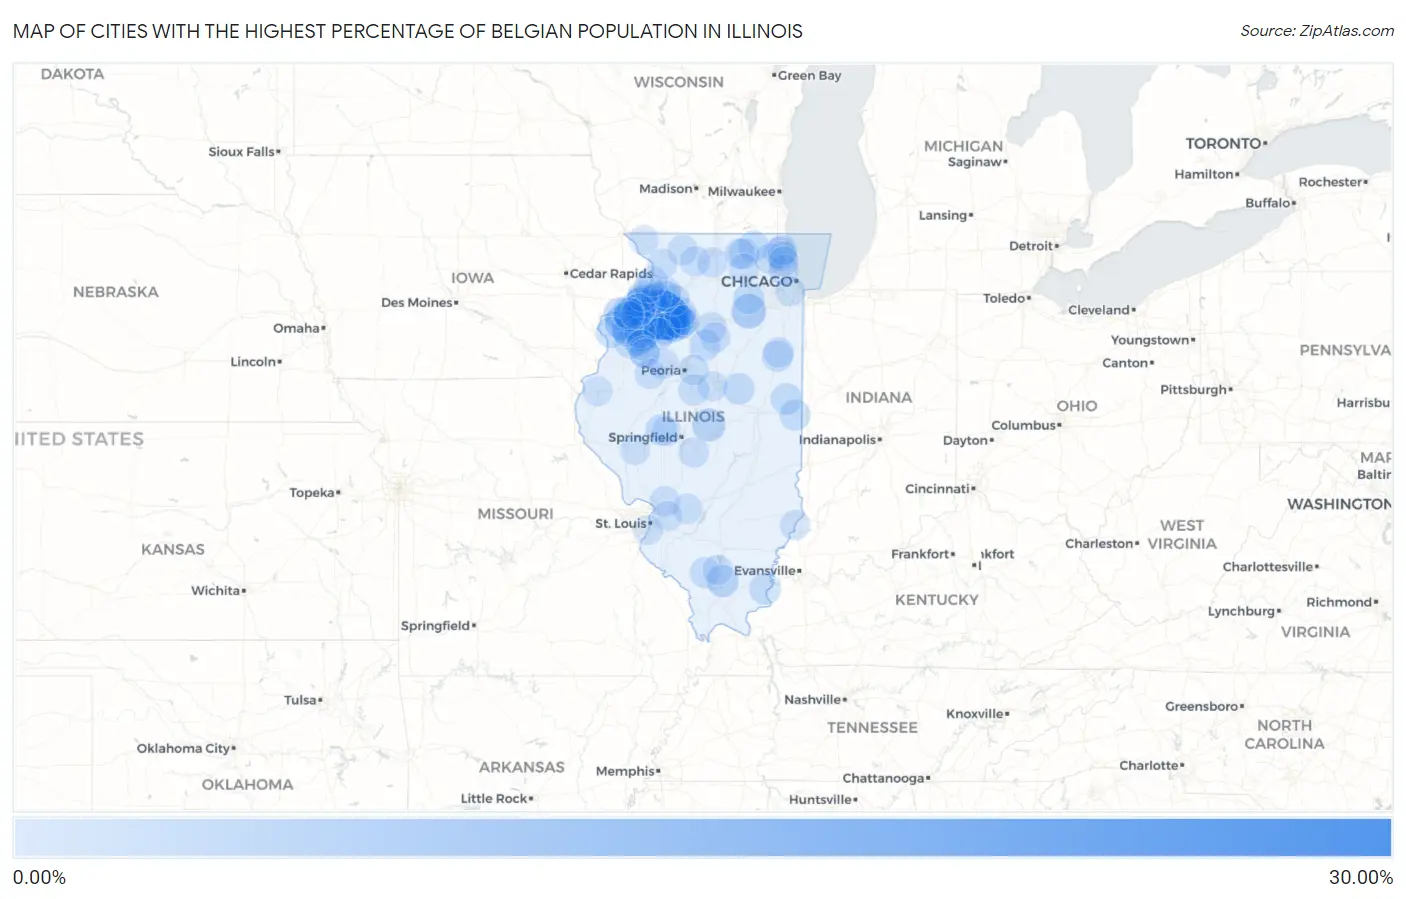
Map of Cities with the Highest Percentage of Belgian Population in Illinois
0.00%
30.00%
Cities with the Highest Percentage of Belgian Population in Illinois
| City | Belgian | vs State | vs National | |
| 1. | Atkinson | 25.40% | 0.19%(+25.2)#1 | 0.099%(+25.3)#5 |
| 2. | Annawan | 19.37% | 0.19%(+19.2)#2 | 0.099%(+19.3)#7 |
| 3. | Geneseo | 13.36% | 0.19%(+13.2)#3 | 0.099%(+13.3)#16 |
| 4. | Mineral | 8.93% | 0.19%(+8.74)#4 | 0.099%(+8.83)#36 |
| 5. | Ophiem | 7.37% | 0.19%(+7.18)#5 | 0.099%(+7.27)#51 |
| 6. | Cleveland | 7.06% | 0.19%(+6.87)#6 | 0.099%(+6.96)#55 |
| 7. | Reynolds | 6.88% | 0.19%(+6.69)#7 | 0.099%(+6.78)#60 |
| 8. | Sheffield | 6.74% | 0.19%(+6.55)#8 | 0.099%(+6.64)#62 |
| 9. | Lisbon | 6.25% | 0.19%(+6.06)#9 | 0.099%(+6.15)#67 |
| 10. | Woodhull | 5.71% | 0.19%(+5.51)#10 | 0.099%(+5.61)#77 |
| 11. | Neponset | 5.30% | 0.19%(+5.11)#11 | 0.099%(+5.20)#84 |
| 12. | Preemption | 5.26% | 0.19%(+5.07)#12 | 0.099%(+5.16)#86 |
| 13. | Cambridge | 4.98% | 0.19%(+4.78)#13 | 0.099%(+4.88)#98 |
| 14. | Buda | 4.91% | 0.19%(+4.72)#14 | 0.099%(+4.82)#102 |
| 15. | Hillsdale | 4.71% | 0.19%(+4.52)#15 | 0.099%(+4.61)#108 |
| 16. | Sherrard | 4.57% | 0.19%(+4.38)#16 | 0.099%(+4.47)#110 |
| 17. | Hampton | 4.51% | 0.19%(+4.32)#17 | 0.099%(+4.41)#115 |
| 18. | Latham | 4.44% | 0.19%(+4.25)#18 | 0.099%(+4.35)#116 |
| 19. | Rio | 4.10% | 0.19%(+3.91)#19 | 0.099%(+4.00)#129 |
| 20. | Orion | 4.07% | 0.19%(+3.88)#20 | 0.099%(+3.97)#131 |
| 21. | Rapids City | 3.96% | 0.19%(+3.77)#21 | 0.099%(+3.86)#135 |
| 22. | Coyne Center | 3.90% | 0.19%(+3.71)#22 | 0.099%(+3.80)#137 |
| 23. | Andalusia | 3.85% | 0.19%(+3.66)#23 | 0.099%(+3.75)#140 |
| 24. | Port Byron | 3.73% | 0.19%(+3.54)#24 | 0.099%(+3.63)#146 |
| 25. | Carbon Cliff | 3.53% | 0.19%(+3.34)#25 | 0.099%(+3.43)#160 |
| 26. | Silvis | 3.34% | 0.19%(+3.15)#26 | 0.099%(+3.24)#174 |
| 27. | Johnston City | 3.32% | 0.19%(+3.12)#27 | 0.099%(+3.22)#177 |
| 28. | Colona | 3.13% | 0.19%(+2.93)#28 | 0.099%(+3.03)#189 |
| 29. | Moline | 3.08% | 0.19%(+2.89)#29 | 0.099%(+2.98)#196 |
| 30. | East Moline | 2.90% | 0.19%(+2.71)#30 | 0.099%(+2.80)#205 |
| 31. | Kewanee | 2.90% | 0.19%(+2.71)#31 | 0.099%(+2.80)#206 |
| 32. | Matherville | 2.90% | 0.19%(+2.70)#32 | 0.099%(+2.80)#207 |
| 33. | Manlius | 2.77% | 0.19%(+2.57)#33 | 0.099%(+2.67)#216 |
| 34. | Mettawa | 2.66% | 0.19%(+2.47)#34 | 0.099%(+2.56)#230 |
| 35. | Rock Island | 2.60% | 0.19%(+2.41)#35 | 0.099%(+2.50)#237 |
| 36. | Galva | 2.59% | 0.19%(+2.40)#36 | 0.099%(+2.49)#240 |
| 37. | Shawneetown | 2.54% | 0.19%(+2.34)#37 | 0.099%(+2.44)#245 |
| 38. | Alexis | 2.52% | 0.19%(+2.32)#38 | 0.099%(+2.42)#248 |
| 39. | Arrowsmith | 2.51% | 0.19%(+2.32)#39 | 0.099%(+2.41)#249 |
| 40. | Tampico | 2.42% | 0.19%(+2.22)#40 | 0.099%(+2.32)#265 |
| 41. | Alvan | 2.33% | 0.19%(+2.13)#41 | 0.099%(+2.23)#281 |
| 42. | Potomac | 2.31% | 0.19%(+2.12)#42 | 0.099%(+2.22)#283 |
| 43. | Ashland | 2.31% | 0.19%(+2.11)#43 | 0.099%(+2.21)#285 |
| 44. | Ashkum | 2.17% | 0.19%(+1.98)#44 | 0.099%(+2.08)#306 |
| 45. | Joy | 2.14% | 0.19%(+1.95)#45 | 0.099%(+2.04)#313 |
| 46. | Viola | 2.13% | 0.19%(+1.94)#46 | 0.099%(+2.03)#316 |
| 47. | Ridgefield | 2.11% | 0.19%(+1.91)#47 | 0.099%(+2.01)#321 |
| 48. | Varna | 2.05% | 0.19%(+1.86)#48 | 0.099%(+1.96)#328 |
| 49. | Bull Valley | 2.00% | 0.19%(+1.81)#49 | 0.099%(+1.90)#339 |
| 50. | Yorkville | 1.94% | 0.19%(+1.75)#50 | 0.099%(+1.84)#352 |
| 51. | Union | 1.94% | 0.19%(+1.74)#51 | 0.099%(+1.84)#354 |
| 52. | Alpha | 1.89% | 0.19%(+1.70)#52 | 0.099%(+1.80)#361 |
| 53. | Tilton | 1.86% | 0.19%(+1.66)#53 | 0.099%(+1.76)#367 |
| 54. | Prophetstown | 1.83% | 0.19%(+1.63)#54 | 0.099%(+1.73)#372 |
| 55. | Milan | 1.78% | 0.19%(+1.58)#55 | 0.099%(+1.68)#384 |
| 56. | Hopedale | 1.74% | 0.19%(+1.55)#56 | 0.099%(+1.64)#392 |
| 57. | Edgington | 1.69% | 0.19%(+1.49)#57 | 0.099%(+1.59)#409 |
| 58. | East Galesburg | 1.62% | 0.19%(+1.43)#58 | 0.099%(+1.52)#431 |
| 59. | Lyndon | 1.60% | 0.19%(+1.41)#59 | 0.099%(+1.51)#438 |
| 60. | Coal Valley | 1.57% | 0.19%(+1.37)#60 | 0.099%(+1.47)#455 |
| 61. | East Lynn | 1.51% | 0.19%(+1.32)#61 | 0.099%(+1.41)#478 |
| 62. | Cedar Point | 1.50% | 0.19%(+1.31)#62 | 0.099%(+1.40)#481 |
| 63. | Dowell | 1.42% | 0.19%(+1.23)#63 | 0.099%(+1.32)#512 |
| 64. | Cordova | 1.38% | 0.19%(+1.19)#64 | 0.099%(+1.28)#527 |
| 65. | Deer Park | 1.38% | 0.19%(+1.19)#65 | 0.099%(+1.28)#529 |
| 66. | Erie | 1.35% | 0.19%(+1.16)#66 | 0.099%(+1.25)#547 |
| 67. | Elmwood | 1.34% | 0.19%(+1.15)#67 | 0.099%(+1.24)#550 |
| 68. | Fairview | 1.32% | 0.19%(+1.12)#68 | 0.099%(+1.22)#563 |
| 69. | Bulpitt | 1.26% | 0.19%(+1.07)#69 | 0.099%(+1.16)#582 |
| 70. | Clifton | 1.16% | 0.19%(+0.967)#70 | 0.099%(+1.06)#641 |
| 71. | Davis Junction | 1.15% | 0.19%(+0.957)#71 | 0.099%(+1.05)#647 |
| 72. | Freeport | 1.15% | 0.19%(+0.954)#72 | 0.099%(+1.05)#651 |
| 73. | Leaf River | 1.14% | 0.19%(+0.951)#73 | 0.099%(+1.05)#654 |
| 74. | Park Ridge | 1.10% | 0.19%(+0.909)#74 | 0.099%(+1.00)#684 |
| 75. | Buckner | 1.07% | 0.19%(+0.879)#75 | 0.099%(+0.973)#700 |
| 76. | St Francisville | 1.05% | 0.19%(+0.853)#76 | 0.099%(+0.947)#710 |
| 77. | Washington | 1.04% | 0.19%(+0.852)#77 | 0.099%(+0.946)#713 |
| 78. | Fulton | 1.02% | 0.19%(+0.830)#78 | 0.099%(+0.924)#728 |
| 79. | Albany | 1.01% | 0.19%(+0.820)#79 | 0.099%(+0.914)#741 |
| 80. | Holiday Shores | 1.00% | 0.19%(+0.812)#80 | 0.099%(+0.906)#747 |
| 81. | Lostant | 1.00% | 0.19%(+0.805)#81 | 0.099%(+0.899)#753 |
| 82. | Pocahontas | 1.00% | 0.19%(+0.802)#82 | 0.099%(+0.896)#756 |
| 83. | Marengo | 0.98% | 0.19%(+0.784)#83 | 0.099%(+0.878)#771 |
| 84. | Mount Carroll | 0.96% | 0.19%(+0.769)#84 | 0.099%(+0.863)#782 |
| 85. | Burlington | 0.93% | 0.19%(+0.739)#85 | 0.099%(+0.834)#812 |
| 86. | Knoxville | 0.87% | 0.19%(+0.681)#86 | 0.099%(+0.775)#869 |
| 87. | Wyanet | 0.87% | 0.19%(+0.677)#87 | 0.099%(+0.771)#872 |
| 88. | Carthage | 0.86% | 0.19%(+0.666)#88 | 0.099%(+0.761)#882 |
| 89. | Knollwood | 0.85% | 0.19%(+0.658)#89 | 0.099%(+0.752)#890 |
| 90. | Twin Grove | 0.85% | 0.19%(+0.657)#90 | 0.099%(+0.751)#892 |
| 91. | Oak Grove | 0.85% | 0.19%(+0.657)#91 | 0.099%(+0.751)#893 |
| 92. | Bannockburn | 0.85% | 0.19%(+0.652)#92 | 0.099%(+0.746)#897 |
| 93. | The Galena Territory | 0.81% | 0.19%(+0.617)#93 | 0.099%(+0.711)#926 |
| 94. | Pleasant Plains | 0.80% | 0.19%(+0.610)#94 | 0.099%(+0.704)#934 |
| 95. | Hometown | 0.79% | 0.19%(+0.598)#95 | 0.099%(+0.692)#946 |
| 96. | Henderson | 0.79% | 0.19%(+0.594)#96 | 0.099%(+0.689)#951 |
| 97. | Winchester | 0.78% | 0.19%(+0.586)#97 | 0.099%(+0.680)#966 |
| 98. | Troy | 0.77% | 0.19%(+0.576)#98 | 0.099%(+0.670)#977 |
| 99. | East Carondelet | 0.75% | 0.19%(+0.556)#99 | 0.099%(+0.650)#1,002 |
| 100. | Northbrook | 0.74% | 0.19%(+0.551)#100 | 0.099%(+0.645)#1,009 |
Common Questions
What are the Top 10 Cities with the Highest Percentage of Belgian Population in Illinois?
Top 10 Cities with the Highest Percentage of Belgian Population in Illinois are:
What city has the Highest Percentage of Belgian Population in Illinois?
Atkinson has the Highest Percentage of Belgian Population in Illinois with 25.40%.
What is the Percentage of Belgian Population in the State of Illinois?
Percentage of Belgian Population in Illinois is 0.19%.
What is the Percentage of Belgian Population in the United States?
Percentage of Belgian Population in the United States is 0.099%.