Cities with the Highest Percentage of Immigrants from Australia in Illinois
RELATED REPORTS & OPTIONS
Australia
Illinois
Compare Cities
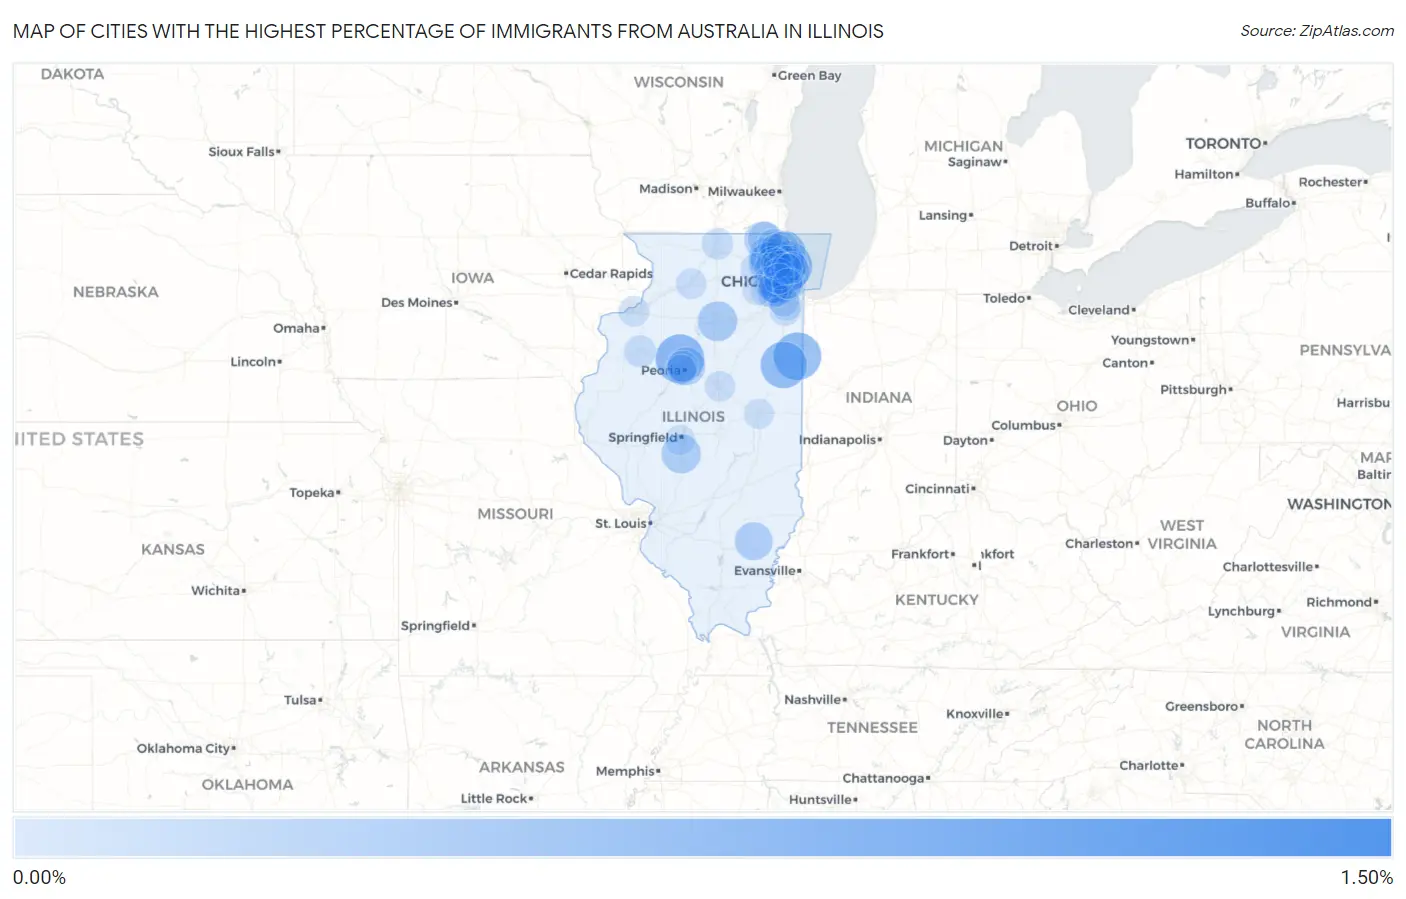
Map of Cities with the Highest Percentage of Immigrants from Australia in Illinois
0.00%
1.50%
Cities with the Highest Percentage of Immigrants from Australia in Illinois
| City | Australia | vs State | vs National | |
| 1. | Edgington | 1.45% | 0.019%(+1.43)#-1 | 0.030%(+1.42)#0 |
| 2. | Golf | 0.73% | 0.019%(+0.713)#0 | 0.030%(+0.703)#1 |
| 3. | Dunlap | 0.71% | 0.019%(+0.686)#1 | 0.030%(+0.676)#2 |
| 4. | Donovan | 0.66% | 0.019%(+0.639)#2 | 0.030%(+0.628)#3 |
| 5. | Crescent City | 0.61% | 0.019%(+0.594)#3 | 0.030%(+0.584)#4 |
| 6. | Lake Forest | 0.50% | 0.019%(+0.485)#4 | 0.030%(+0.475)#5 |
| 7. | Northfield | 0.39% | 0.019%(+0.366)#5 | 0.030%(+0.356)#6 |
| 8. | Inverness | 0.38% | 0.019%(+0.356)#6 | 0.030%(+0.346)#7 |
| 9. | North Utica | 0.35% | 0.019%(+0.333)#7 | 0.030%(+0.322)#8 |
| 10. | Divernon | 0.34% | 0.019%(+0.317)#8 | 0.030%(+0.306)#9 |
| 11. | Lincolnwood | 0.33% | 0.019%(+0.312)#17 | 0.030%(+0.302)#239 |
| 12. | Fairfield | 0.29% | 0.019%(+0.274)#18 | 0.030%(+0.264)#240 |
| 13. | Peoria Heights | 0.29% | 0.019%(+0.269)#19 | 0.030%(+0.259)#241 |
| 14. | Pistakee Highlands | 0.24% | 0.019%(+0.224)#20 | 0.030%(+0.213)#242 |
| 15. | Riverside | 0.24% | 0.019%(+0.219)#21 | 0.030%(+0.209)#243 |
| 16. | Hinsdale | 0.19% | 0.019%(+0.167)#67 | 0.030%(+0.157)#1,000 |
| 17. | River Forest | 0.17% | 0.019%(+0.154)#68 | 0.030%(+0.143)#1,001 |
| 18. | Lake Barrington | 0.17% | 0.019%(+0.148)#69 | 0.030%(+0.138)#1,002 |
| 19. | Barrington | 0.16% | 0.019%(+0.141)#70 | 0.030%(+0.130)#1,003 |
| 20. | Long Grove | 0.16% | 0.019%(+0.138)#71 | 0.030%(+0.127)#1,004 |
| 21. | Clarendon Hills | 0.15% | 0.019%(+0.131)#72 | 0.030%(+0.121)#1,005 |
| 22. | Fox Lake | 0.15% | 0.019%(+0.129)#73 | 0.030%(+0.119)#1,006 |
| 23. | Rosemont | 0.13% | 0.019%(+0.110)#74 | 0.030%(+0.100)#1,007 |
| 24. | Wilmette | 0.11% | 0.019%(+0.089)#75 | 0.030%(+0.078)#1,008 |
| 25. | Westmont | 0.099% | 0.019%(+0.080)#76 | 0.030%(+0.069)#1,009 |
| 26. | Addison | 0.087% | 0.019%(+0.068)#77 | 0.030%(+0.057)#1,010 |
| 27. | Grayslake | 0.082% | 0.019%(+0.062)#78 | 0.030%(+0.052)#1,011 |
| 28. | Libertyville | 0.078% | 0.019%(+0.059)#120 | 0.030%(+0.048)#1,809 |
| 29. | Galesburg | 0.074% | 0.019%(+0.054)#121 | 0.030%(+0.044)#1,810 |
| 30. | Niles | 0.072% | 0.019%(+0.053)#122 | 0.030%(+0.042)#1,811 |
| 31. | Palatine | 0.061% | 0.019%(+0.042)#123 | 0.030%(+0.031)#1,812 |
| 32. | Northbrook | 0.060% | 0.019%(+0.041)#124 | 0.030%(+0.030)#1,813 |
| 33. | Machesney Park | 0.057% | 0.019%(+0.038)#125 | 0.030%(+0.027)#1,814 |
| 34. | Frankfort | 0.054% | 0.019%(+0.035)#126 | 0.030%(+0.025)#1,815 |
| 35. | North Chicago | 0.052% | 0.019%(+0.033)#127 | 0.030%(+0.022)#1,816 |
| 36. | Evanston | 0.044% | 0.019%(+0.025)#128 | 0.030%(+0.014)#1,817 |
| 37. | Tinley Park | 0.043% | 0.019%(+0.024)#129 | 0.030%(+0.014)#1,818 |
| 38. | Chicago | 0.042% | 0.019%(+0.023)#130 | 0.030%(+0.013)#1,819 |
| 39. | Schaumburg | 0.041% | 0.019%(+0.022)#131 | 0.030%(+0.012)#1,820 |
| 40. | Lombard | 0.041% | 0.019%(+0.022)#133 | 0.030%(+0.011)#2,049 |
| 41. | Elgin | 0.040% | 0.019%(+0.021)#134 | 0.030%(+0.011)#2,050 |
| 42. | Wheaton | 0.035% | 0.019%(+0.016)#135 | 0.030%(+0.006)#2,051 |
| 43. | Maywood | 0.034% | 0.019%(+0.015)#136 | 0.030%(+0.005)#2,052 |
| 44. | Glencoe | 0.034% | 0.019%(+0.015)#137 | 0.030%(+0.004)#2,053 |
| 45. | Darien | 0.032% | 0.019%(+0.013)#138 | 0.030%(+0.002)#2,054 |
| 46. | Peoria | 0.032% | 0.019%(+0.013)#139 | 0.030%(+0.002)#2,055 |
| 47. | Mount Prospect | 0.028% | 0.019%(+0.009)#140 | 0.030%(-0.001)#2,056 |
| 48. | Naperville | 0.028% | 0.019%(+0.009)#141 | 0.030%(-0.001)#2,057 |
| 49. | Dixon | 0.026% | 0.019%(+0.006)#142 | 0.030%(-0.004)#2,058 |
| 50. | Downers Grove | 0.024% | 0.019%(+0.005)#143 | 0.030%(-0.006)#2,059 |
| 51. | West Peoria | 0.024% | 0.019%(+0.004)#144 | 0.030%(-0.006)#2,060 |
| 52. | Bensenville | 0.021% | 0.019%(+0.002)#145 | 0.030%(-0.008)#2,061 |
| 53. | Moline | 0.021% | 0.019%(+0.002)#146 | 0.030%(-0.008)#2,062 |
| 54. | Woodridge | 0.021% | 0.019%(+0.001)#147 | 0.030%(-0.009)#2,063 |
| 55. | Orland Park | 0.021% | 0.019%(+0.001)#148 | 0.030%(-0.009)#2,064 |
| 56. | Morton Grove | 0.020% | 0.019%(+0.001)#149 | 0.030%(-0.010)#2,065 |
| 57. | Bloomington | 0.016% | 0.019%(-0.003)#150 | 0.030%(-0.013)#2,066 |
| 58. | Arlington Heights | 0.016% | 0.019%(-0.004)#151 | 0.030%(-0.014)#2,067 |
| 59. | Skokie | 0.013% | 0.019%(-0.006)#152 | 0.030%(-0.016)#2,068 |
| 60. | Elmhurst | 0.011% | 0.019%(-0.008)#153 | 0.030%(-0.019)#2,069 |
| 61. | Springfield | 0.0079% | 0.019%(-0.011)#154 | 0.030%(-0.022)#2,070 |
| 62. | Champaign | 0.0056% | 0.019%(-0.014)#155 | 0.030%(-0.024)#2,071 |
| 63. | Aurora | 0.0050% | 0.019%(-0.014)#156 | 0.030%(-0.025)#2,072 |
| 64. | Berwyn | 0.0018% | 0.019%(-0.017)#157 | 0.030%(-0.028)#2,073 |
Common Questions
What are the Top 10 Cities with the Highest Percentage of Immigrants from Australia in Illinois?
Top 10 Cities with the Highest Percentage of Immigrants from Australia in Illinois are:
#1
0.73%
#2
0.71%
#3
0.66%
#4
0.61%
#5
0.50%
#6
0.39%
#7
0.38%
#8
0.35%
#9
0.34%
#10
0.33%
What city has the Highest Percentage of Immigrants from Australia in Illinois?
Golf has the Highest Percentage of Immigrants from Australia in Illinois with 0.73%.
What is the Percentage of Immigrants from Australia in the State of Illinois?
Percentage of Immigrants from Australia in Illinois is 0.019%.
What is the Percentage of Immigrants from Australia in the United States?
Percentage of Immigrants from Australia in the United States is 0.030%.