Cities with the Highest Percentage of American Population in Illinois
RELATED REPORTS & OPTIONS
American
Illinois
Compare Cities
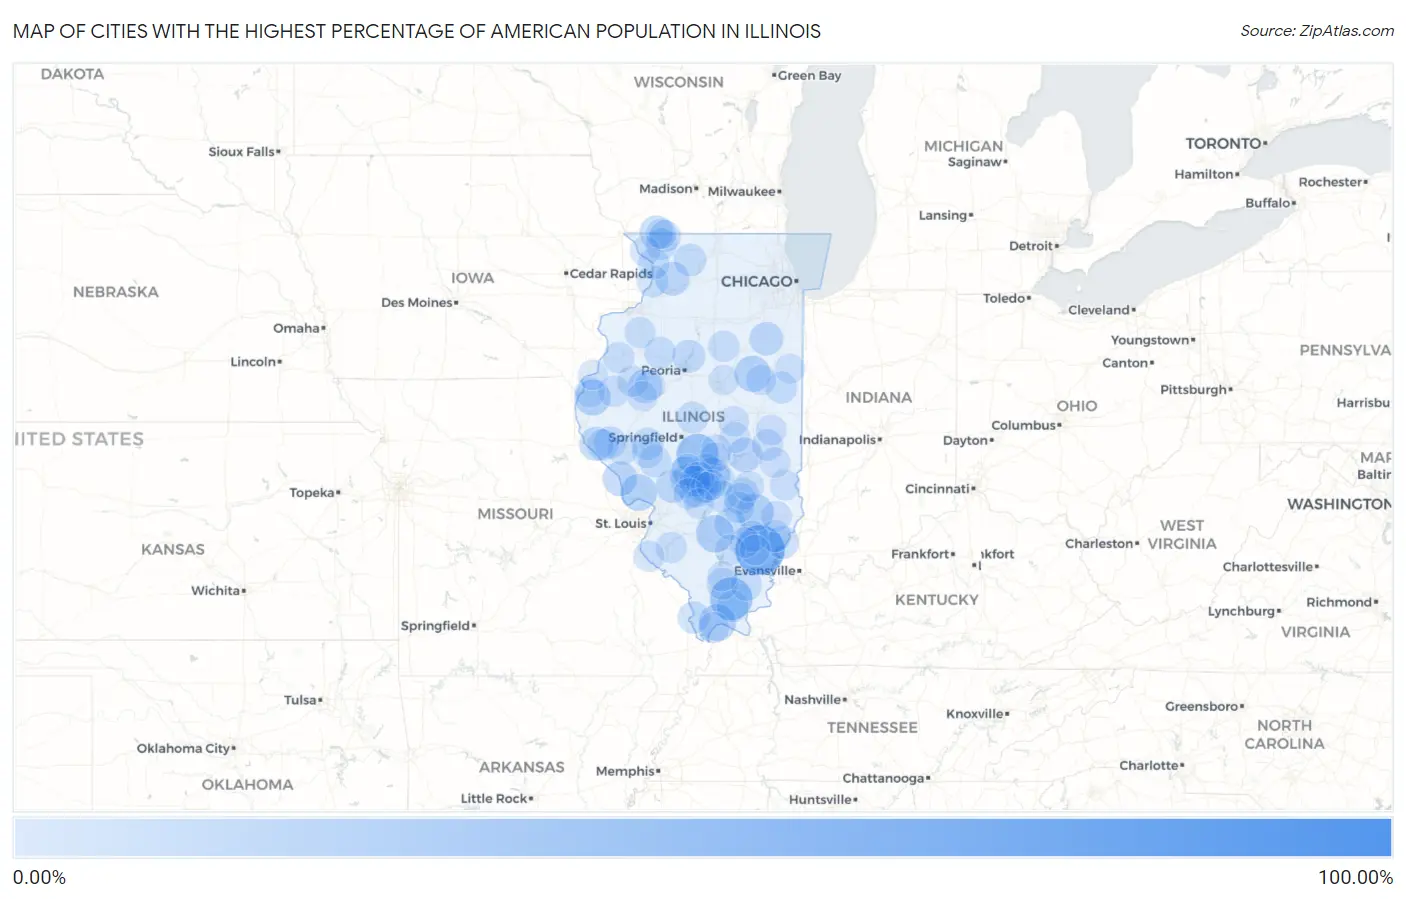
Map of Cities with the Highest Percentage of American Population in Illinois
0.00%
100.00%
Cities with the Highest Percentage of American Population in Illinois
| City | American | vs State | vs National | |
| 1. | Goodenow | 100.00% | 3.43%(+96.6)#1 | 5.59%(+94.4)#36 |
| 2. | Riggston | 72.22% | 3.43%(+68.8)#2 | 5.59%(+66.6)#111 |
| 3. | Niota | 69.23% | 3.43%(+65.8)#3 | 5.59%(+63.6)#122 |
| 4. | Burnt Prairie | 64.95% | 3.43%(+61.5)#4 | 5.59%(+59.4)#143 |
| 5. | Beverly | 50.00% | 3.43%(+46.6)#5 | 5.59%(+44.4)#305 |
| 6. | New Burnside | 46.30% | 3.43%(+42.9)#6 | 5.59%(+40.7)#368 |
| 7. | Langleyville | 45.32% | 3.43%(+41.9)#7 | 5.59%(+39.7)#378 |
| 8. | Joslin | 40.68% | 3.43%(+37.2)#8 | 5.59%(+35.1)#498 |
| 9. | Walnut Hill | 33.05% | 3.43%(+29.6)#9 | 5.59%(+27.5)#807 |
| 10. | Sailor Springs | 32.67% | 3.43%(+29.2)#10 | 5.59%(+27.1)#825 |
| 11. | New Grand Chain | 31.43% | 3.43%(+28.0)#11 | 5.59%(+25.8)#892 |
| 12. | Otterville | 30.57% | 3.43%(+27.1)#12 | 5.59%(+25.0)#949 |
| 13. | Strawn | 29.87% | 3.43%(+26.4)#13 | 5.59%(+24.3)#994 |
| 14. | Basco | 29.41% | 3.43%(+26.0)#14 | 5.59%(+23.8)#1,029 |
| 15. | Lowpoint | 26.92% | 3.43%(+23.5)#15 | 5.59%(+21.3)#1,215 |
| 16. | Oconee | 26.26% | 3.43%(+22.8)#16 | 5.59%(+20.7)#1,257 |
| 17. | Hamburg | 26.02% | 3.43%(+22.6)#17 | 5.59%(+20.4)#1,282 |
| 18. | Coffeen | 25.57% | 3.43%(+22.1)#18 | 5.59%(+20.0)#1,333 |
| 19. | Allenville | 25.26% | 3.43%(+21.8)#19 | 5.59%(+19.7)#1,364 |
| 20. | Smithfield | 24.53% | 3.43%(+21.1)#20 | 5.59%(+18.9)#1,450 |
| 21. | Millersburg | 24.19% | 3.43%(+20.8)#21 | 5.59%(+18.6)#1,486 |
| 22. | Kinderhook | 24.06% | 3.43%(+20.6)#22 | 5.59%(+18.5)#1,505 |
| 23. | Coleta | 23.76% | 3.43%(+20.3)#23 | 5.59%(+18.2)#1,547 |
| 24. | Butler | 23.43% | 3.43%(+20.0)#24 | 5.59%(+17.8)#1,585 |
| 25. | Apple River | 23.43% | 3.43%(+20.0)#25 | 5.59%(+17.8)#1,586 |
| 26. | Union Hill | 23.33% | 3.43%(+19.9)#26 | 5.59%(+17.7)#1,596 |
| 27. | East Gillespie | 22.15% | 3.43%(+18.7)#27 | 5.59%(+16.6)#1,761 |
| 28. | Rome | 21.50% | 3.43%(+18.1)#28 | 5.59%(+15.9)#1,872 |
| 29. | Keensburg | 21.19% | 3.43%(+17.8)#29 | 5.59%(+15.6)#1,918 |
| 30. | Ohlman | 20.55% | 3.43%(+17.1)#30 | 5.59%(+15.0)#2,013 |
| 31. | Adeline | 20.48% | 3.43%(+17.0)#31 | 5.59%(+14.9)#2,025 |
| 32. | Dewey | 20.47% | 3.43%(+17.0)#32 | 5.59%(+14.9)#2,028 |
| 33. | Baylis | 20.14% | 3.43%(+16.7)#33 | 5.59%(+14.5)#2,106 |
| 34. | Solon Mills | 20.05% | 3.43%(+16.6)#34 | 5.59%(+14.5)#2,127 |
| 35. | Scottville | 19.75% | 3.43%(+16.3)#35 | 5.59%(+14.2)#2,186 |
| 36. | Mcclure | 19.34% | 3.43%(+15.9)#36 | 5.59%(+13.8)#2,262 |
| 37. | South Jacksonville | 19.32% | 3.43%(+15.9)#37 | 5.59%(+13.7)#2,265 |
| 38. | Simpson | 19.23% | 3.43%(+15.8)#38 | 5.59%(+13.6)#2,284 |
| 39. | Raymond | 19.00% | 3.43%(+15.6)#39 | 5.59%(+13.4)#2,331 |
| 40. | Fulton | 18.98% | 3.43%(+15.5)#40 | 5.59%(+13.4)#2,339 |
| 41. | Rankin | 18.98% | 3.43%(+15.5)#41 | 5.59%(+13.4)#2,340 |
| 42. | Watson | 18.86% | 3.43%(+15.4)#42 | 5.59%(+13.3)#2,376 |
| 43. | Herrick | 18.77% | 3.43%(+15.3)#43 | 5.59%(+13.2)#2,392 |
| 44. | Stockton | 18.76% | 3.43%(+15.3)#44 | 5.59%(+13.2)#2,393 |
| 45. | Nora | 18.75% | 3.43%(+15.3)#45 | 5.59%(+13.2)#2,395 |
| 46. | Bone Gap | 18.69% | 3.43%(+15.3)#46 | 5.59%(+13.1)#2,402 |
| 47. | Harvel | 18.61% | 3.43%(+15.2)#47 | 5.59%(+13.0)#2,415 |
| 48. | Fillmore | 18.55% | 3.43%(+15.1)#48 | 5.59%(+13.0)#2,438 |
| 49. | Whiteash | 18.52% | 3.43%(+15.1)#49 | 5.59%(+12.9)#2,443 |
| 50. | Brownstown | 18.42% | 3.43%(+15.0)#50 | 5.59%(+12.8)#2,460 |
| 51. | Barry | 18.35% | 3.43%(+14.9)#51 | 5.59%(+12.8)#2,481 |
| 52. | Broadwell | 18.33% | 3.43%(+14.9)#52 | 5.59%(+12.7)#2,487 |
| 53. | Mason | 18.33% | 3.43%(+14.9)#53 | 5.59%(+12.7)#2,488 |
| 54. | Savanna | 18.07% | 3.43%(+14.6)#54 | 5.59%(+12.5)#2,542 |
| 55. | Williamsfield | 18.05% | 3.43%(+14.6)#55 | 5.59%(+12.5)#2,548 |
| 56. | Iuka | 17.95% | 3.43%(+14.5)#56 | 5.59%(+12.4)#2,578 |
| 57. | Muddy | 17.78% | 3.43%(+14.3)#57 | 5.59%(+12.2)#2,624 |
| 58. | Tennessee | 17.65% | 3.43%(+14.2)#58 | 5.59%(+12.1)#2,655 |
| 59. | Jeffersonville | 17.58% | 3.43%(+14.1)#59 | 5.59%(+12.0)#2,672 |
| 60. | Long Point | 17.51% | 3.43%(+14.1)#60 | 5.59%(+11.9)#2,693 |
| 61. | Witt | 17.33% | 3.43%(+13.9)#61 | 5.59%(+11.7)#2,743 |
| 62. | Iola | 17.24% | 3.43%(+13.8)#62 | 5.59%(+11.7)#2,764 |
| 63. | Bushnell | 17.09% | 3.43%(+13.7)#63 | 5.59%(+11.5)#2,808 |
| 64. | Lenzburg | 17.08% | 3.43%(+13.6)#64 | 5.59%(+11.5)#2,810 |
| 65. | Kirkwood | 17.01% | 3.43%(+13.6)#65 | 5.59%(+11.4)#2,833 |
| 66. | Irving | 16.94% | 3.43%(+13.5)#66 | 5.59%(+11.3)#2,849 |
| 67. | Hindsboro | 16.83% | 3.43%(+13.4)#67 | 5.59%(+11.2)#2,882 |
| 68. | Murrayville | 16.72% | 3.43%(+13.3)#68 | 5.59%(+11.1)#2,904 |
| 69. | Fults | 16.67% | 3.43%(+13.2)#69 | 5.59%(+11.1)#2,925 |
| 70. | Alpha | 16.41% | 3.43%(+13.0)#70 | 5.59%(+10.8)#2,990 |
| 71. | Bingham | 16.31% | 3.43%(+12.9)#71 | 5.59%(+10.7)#3,025 |
| 72. | Olmsted | 16.13% | 3.43%(+12.7)#72 | 5.59%(+10.5)#3,067 |
| 73. | Laplace | 16.11% | 3.43%(+12.7)#73 | 5.59%(+10.5)#3,078 |
| 74. | Panama | 16.09% | 3.43%(+12.7)#74 | 5.59%(+10.5)#3,084 |
| 75. | Moweaqua | 16.02% | 3.43%(+12.6)#75 | 5.59%(+10.4)#3,106 |
| 76. | Teutopolis | 15.90% | 3.43%(+12.5)#76 | 5.59%(+10.3)#3,151 |
| 77. | Cisco | 15.88% | 3.43%(+12.5)#77 | 5.59%(+10.3)#3,154 |
| 78. | Longview | 15.85% | 3.43%(+12.4)#78 | 5.59%(+10.3)#3,170 |
| 79. | Annapolis | 15.79% | 3.43%(+12.4)#79 | 5.59%(+10.2)#3,192 |
| 80. | Claremont | 15.72% | 3.43%(+12.3)#80 | 5.59%(+10.1)#3,224 |
| 81. | Hanover | 15.55% | 3.43%(+12.1)#81 | 5.59%(+9.96)#3,274 |
| 82. | Westfield | 15.51% | 3.43%(+12.1)#82 | 5.59%(+9.92)#3,284 |
| 83. | Melvin | 15.47% | 3.43%(+12.0)#83 | 5.59%(+9.88)#3,295 |
| 84. | Assumption | 15.33% | 3.43%(+11.9)#84 | 5.59%(+9.74)#3,342 |
| 85. | Warren | 15.31% | 3.43%(+11.9)#85 | 5.59%(+9.72)#3,352 |
| 86. | Sims | 15.30% | 3.43%(+11.9)#86 | 5.59%(+9.71)#3,353 |
| 87. | Opdyke | 15.06% | 3.43%(+11.6)#87 | 5.59%(+9.47)#3,432 |
| 88. | Mill Shoals | 14.97% | 3.43%(+11.5)#88 | 5.59%(+9.38)#3,463 |
| 89. | Smithboro | 14.85% | 3.43%(+11.4)#89 | 5.59%(+9.26)#3,513 |
| 90. | Detroit | 14.81% | 3.43%(+11.4)#90 | 5.59%(+9.23)#3,529 |
| 91. | Towanda | 14.79% | 3.43%(+11.4)#91 | 5.59%(+9.20)#3,536 |
| 92. | Fowler | 14.63% | 3.43%(+11.2)#92 | 5.59%(+9.04)#3,585 |
| 93. | Elvaston | 14.46% | 3.43%(+11.0)#93 | 5.59%(+8.87)#3,663 |
| 94. | Pontoosuc | 14.42% | 3.43%(+11.0)#94 | 5.59%(+8.83)#3,686 |
| 95. | Cuba | 14.40% | 3.43%(+11.0)#95 | 5.59%(+8.81)#3,694 |
| 96. | Ramsey | 14.33% | 3.43%(+10.9)#96 | 5.59%(+8.74)#3,720 |
| 97. | Paloma | 14.29% | 3.43%(+10.9)#97 | 5.59%(+8.70)#3,738 |
| 98. | West Frankfort | 14.20% | 3.43%(+10.8)#98 | 5.59%(+8.61)#3,766 |
| 99. | Woodland | 14.19% | 3.43%(+10.8)#99 | 5.59%(+8.60)#3,769 |
| 100. | Ipava | 14.16% | 3.43%(+10.7)#100 | 5.59%(+8.57)#3,782 |
Common Questions
What are the Top 10 Cities with the Highest Percentage of American Population in Illinois?
Top 10 Cities with the Highest Percentage of American Population in Illinois are:
#1
64.95%
#2
46.30%
#3
45.32%
#4
33.05%
#5
32.67%
#6
31.43%
#7
30.57%
#8
29.87%
#9
29.41%
#10
26.26%
What city has the Highest Percentage of American Population in Illinois?
Burnt Prairie has the Highest Percentage of American Population in Illinois with 64.95%.
What is the Percentage of American Population in the State of Illinois?
Percentage of American Population in Illinois is 3.43%.
What is the Percentage of American Population in the United States?
Percentage of American Population in the United States is 5.59%.