Cities with the Largest Japanese Community in Illinois
RELATED REPORTS & OPTIONS
Japanese
Illinois
Compare Cities
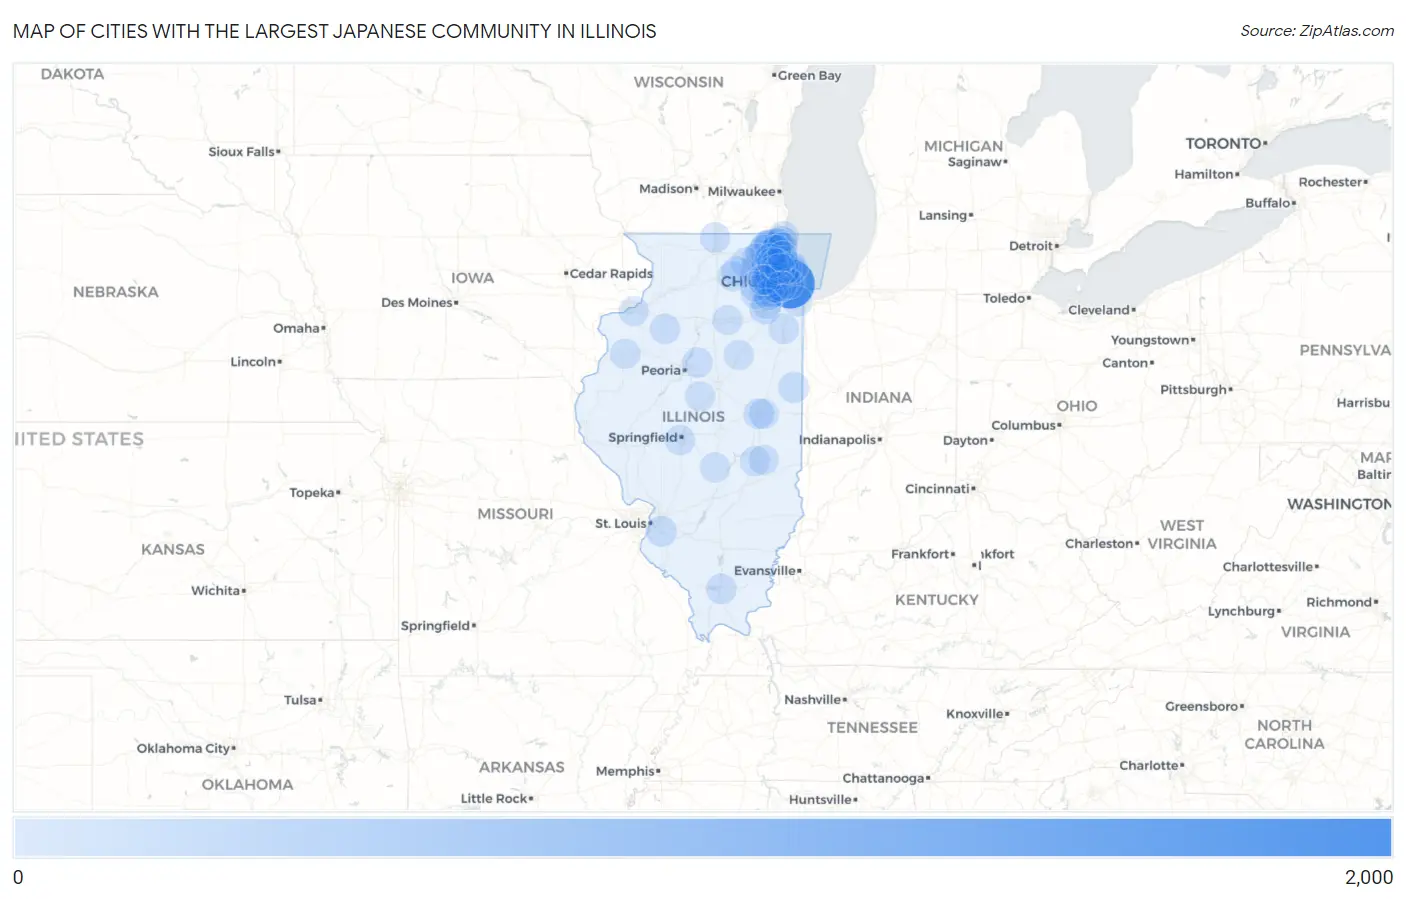
Map of Cities with the Largest Japanese Community in Illinois
0
2,000
Cities with the Largest Japanese Community in Illinois
| City | Japanese | vs State | vs National | |
| 1. | Chicago | 1,948 | 5,545(35.13%)#1 | 351,951(0.55%)#17 |
| 2. | Morton Grove | 269 | 5,545(4.85%)#2 | 351,951(0.08%)#208 |
| 3. | Waukegan | 243 | 5,545(4.38%)#3 | 351,951(0.07%)#231 |
| 4. | Hanover Park | 213 | 5,545(3.84%)#4 | 351,951(0.06%)#269 |
| 5. | Mundelein | 199 | 5,545(3.59%)#5 | 351,951(0.06%)#290 |
| 6. | Skokie | 157 | 5,545(2.83%)#6 | 351,951(0.04%)#340 |
| 7. | Bloomingdale | 122 | 5,545(2.20%)#7 | 351,951(0.03%)#432 |
| 8. | Cary | 113 | 5,545(2.04%)#8 | 351,951(0.03%)#459 |
| 9. | Evanston | 104 | 5,545(1.88%)#9 | 351,951(0.03%)#486 |
| 10. | Hainesville | 100 | 5,545(1.80%)#10 | 351,951(0.03%)#509 |
| 11. | Volo | 99 | 5,545(1.79%)#11 | 351,951(0.03%)#517 |
| 12. | Joliet | 93 | 5,545(1.68%)#12 | 351,951(0.03%)#531 |
| 13. | Naperville | 89 | 5,545(1.61%)#13 | 351,951(0.03%)#554 |
| 14. | Schaumburg | 89 | 5,545(1.61%)#14 | 351,951(0.03%)#555 |
| 15. | Gages Lake | 86 | 5,545(1.55%)#15 | 351,951(0.02%)#575 |
| 16. | Hoopeston | 80 | 5,545(1.44%)#16 | 351,951(0.02%)#609 |
| 17. | Elgin | 67 | 5,545(1.21%)#17 | 351,951(0.02%)#696 |
| 18. | Park Ridge | 62 | 5,545(1.12%)#18 | 351,951(0.02%)#739 |
| 19. | Glendale Heights | 62 | 5,545(1.12%)#19 | 351,951(0.02%)#742 |
| 20. | Addison | 61 | 5,545(1.10%)#20 | 351,951(0.02%)#748 |
| 21. | Belleville | 56 | 5,545(1.01%)#21 | 351,951(0.02%)#793 |
| 22. | Champaign | 51 | 5,545(0.92%)#22 | 351,951(0.01%)#832 |
| 23. | Manteno | 46 | 5,545(0.83%)#23 | 351,951(0.01%)#902 |
| 24. | Streamwood | 44 | 5,545(0.79%)#24 | 351,951(0.01%)#921 |
| 25. | Island Lake | 42 | 5,545(0.76%)#25 | 351,951(0.01%)#946 |
| 26. | Marion | 41 | 5,545(0.74%)#26 | 351,951(0.01%)#961 |
| 27. | Carol Stream | 39 | 5,545(0.70%)#27 | 351,951(0.01%)#986 |
| 28. | Hampshire | 36 | 5,545(0.65%)#28 | 351,951(0.01%)#1,040 |
| 29. | Round Lake | 35 | 5,545(0.63%)#29 | 351,951(0.01%)#1,053 |
| 30. | Gurnee | 34 | 5,545(0.61%)#30 | 351,951(0.01%)#1,067 |
| 31. | Metamora | 34 | 5,545(0.61%)#31 | 351,951(0.01%)#1,075 |
| 32. | Lombard | 32 | 5,545(0.58%)#32 | 351,951(0.01%)#1,091 |
| 33. | River Forest | 32 | 5,545(0.58%)#33 | 351,951(0.01%)#1,097 |
| 34. | Kewanee | 31 | 5,545(0.56%)#34 | 351,951(0.01%)#1,111 |
| 35. | Northbrook | 29 | 5,545(0.52%)#35 | 351,951(0.01%)#1,147 |
| 36. | Boulder Hill | 29 | 5,545(0.52%)#36 | 351,951(0.01%)#1,154 |
| 37. | Wheaton | 28 | 5,545(0.50%)#37 | 351,951(0.01%)#1,167 |
| 38. | Wheeling | 25 | 5,545(0.45%)#38 | 351,951(0.01%)#1,219 |
| 39. | Warrenville | 25 | 5,545(0.45%)#39 | 351,951(0.01%)#1,227 |
| 40. | Downers Grove | 24 | 5,545(0.43%)#40 | 351,951(0.01%)#1,241 |
| 41. | Algonquin | 24 | 5,545(0.43%)#41 | 351,951(0.01%)#1,245 |
| 42. | Wood Dale | 23 | 5,545(0.41%)#42 | 351,951(0.01%)#1,268 |
| 43. | Woodridge | 22 | 5,545(0.40%)#43 | 351,951(0.01%)#1,291 |
| 44. | Zion | 22 | 5,545(0.40%)#44 | 351,951(0.01%)#1,292 |
| 45. | South Holland | 21 | 5,545(0.38%)#45 | 351,951(0.01%)#1,317 |
| 46. | Roselle | 20 | 5,545(0.36%)#46 | 351,951(0.01%)#1,335 |
| 47. | Libertyville | 20 | 5,545(0.36%)#47 | 351,951(0.01%)#1,336 |
| 48. | Springfield | 19 | 5,545(0.34%)#48 | 351,951(0.01%)#1,352 |
| 49. | Dekalb | 19 | 5,545(0.34%)#49 | 351,951(0.01%)#1,359 |
| 50. | Rockton | 19 | 5,545(0.34%)#50 | 351,951(0.01%)#1,372 |
| 51. | Pana | 17 | 5,545(0.31%)#51 | 351,951(0.00%)#1,410 |
| 52. | Deer Park | 16 | 5,545(0.29%)#52 | 351,951(0.00%)#1,435 |
| 53. | Bolingbrook | 15 | 5,545(0.27%)#53 | 351,951(0.00%)#1,444 |
| 54. | Monmouth | 15 | 5,545(0.27%)#54 | 351,951(0.00%)#1,458 |
| 55. | Sycamore | 14 | 5,545(0.25%)#55 | 351,951(0.00%)#1,479 |
| 56. | North Aurora | 12 | 5,545(0.22%)#56 | 351,951(0.00%)#1,546 |
| 57. | Cicero | 11 | 5,545(0.20%)#57 | 351,951(0.00%)#1,562 |
| 58. | Mattoon | 11 | 5,545(0.20%)#58 | 351,951(0.00%)#1,572 |
| 59. | Pontiac | 10 | 5,545(0.18%)#59 | 351,951(0.00%)#1,608 |
| 60. | Urbana | 9 | 5,545(0.16%)#60 | 351,951(0.00%)#1,634 |
| 61. | Elk Grove Village | 9 | 5,545(0.16%)#61 | 351,951(0.00%)#1,638 |
| 62. | North Chicago | 9 | 5,545(0.16%)#62 | 351,951(0.00%)#1,640 |
| 63. | Westmont | 9 | 5,545(0.16%)#63 | 351,951(0.00%)#1,641 |
| 64. | Winfield | 9 | 5,545(0.16%)#64 | 351,951(0.00%)#1,653 |
| 65. | Moline | 8 | 5,545(0.14%)#65 | 351,951(0.00%)#1,679 |
| 66. | Niles | 8 | 5,545(0.14%)#66 | 351,951(0.00%)#1,683 |
| 67. | Arlington Heights | 7 | 5,545(0.13%)#67 | 351,951(0.00%)#1,716 |
| 68. | Ottawa | 7 | 5,545(0.13%)#68 | 351,951(0.00%)#1,730 |
| 69. | Crystal Lawns | 7 | 5,545(0.13%)#69 | 351,951(0.00%)#1,755 |
| 70. | Palatine | 6 | 5,545(0.11%)#70 | 351,951(0.00%)#1,763 |
| 71. | Des Plaines | 5 | 5,545(0.09%)#71 | 351,951(0.00%)#1,803 |
| 72. | West Chicago | 4 | 5,545(0.07%)#72 | 351,951(0.00%)#1,847 |
| 73. | Western Springs | 4 | 5,545(0.07%)#73 | 351,951(0.00%)#1,849 |
| 74. | Bannockburn | 4 | 5,545(0.07%)#74 | 351,951(0.00%)#1,862 |
| 75. | Charleston | 3 | 5,545(0.05%)#75 | 351,951(0.00%)#1,873 |
| 76. | Armington | 1 | 5,545(0.02%)#76 | 351,951(0.00%)#1,946 |
Common Questions
What are the Top 10 Cities with the Largest Japanese Community in Illinois?
Top 10 Cities with the Largest Japanese Community in Illinois are:
#1
1,948
#2
269
#3
243
#4
213
#5
199
#6
157
#7
122
#8
113
#9
104
#10
100
What city has the Largest Japanese Community in Illinois?
Chicago has the Largest Japanese Community in Illinois with 1,948.
What is the Total Japanese Population in the State of Illinois?
Total Japanese Population in Illinois is 5,545.
What is the Total Japanese Population in the United States?
Total Japanese Population in the United States is 351,951.