Cities with the Largest Hawaiian / Pacific Community in Illinois
RELATED REPORTS & OPTIONS
Hawaiian / Pacific
Illinois
Compare Cities
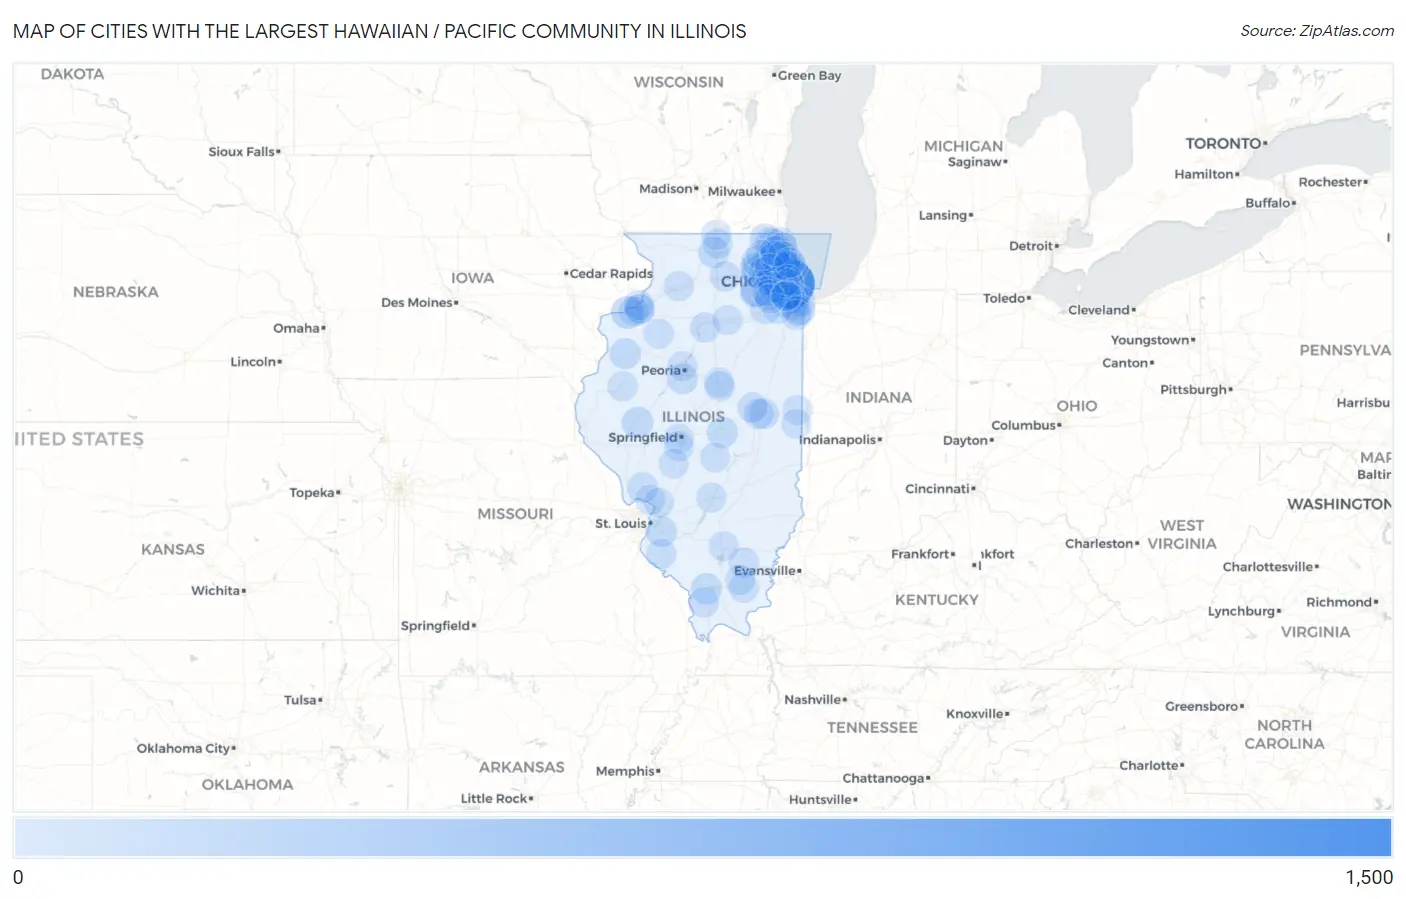
Map of Cities with the Largest Hawaiian / Pacific Community in Illinois
0
1,500
Cities with the Largest Hawaiian / Pacific Community in Illinois
| City | Hawaiian / Pacific | vs State | vs National | |
| 1. | Chicago | 1,409 | 5,476(25.73%)#1 | 624,863(0.23%)#76 |
| 2. | Palatine | 328 | 5,476(5.99%)#2 | 624,863(0.05%)#328 |
| 3. | Aurora | 213 | 5,476(3.89%)#3 | 624,863(0.03%)#467 |
| 4. | Rock Island | 174 | 5,476(3.18%)#4 | 624,863(0.03%)#555 |
| 5. | Elgin | 167 | 5,476(3.05%)#5 | 624,863(0.03%)#579 |
| 6. | South Elgin | 142 | 5,476(2.59%)#6 | 624,863(0.02%)#654 |
| 7. | South Barrington | 116 | 5,476(2.12%)#7 | 624,863(0.02%)#761 |
| 8. | Beardstown | 100 | 5,476(1.83%)#8 | 624,863(0.02%)#838 |
| 9. | Grayslake | 95 | 5,476(1.73%)#9 | 624,863(0.02%)#862 |
| 10. | Wood Dale | 94 | 5,476(1.72%)#10 | 624,863(0.02%)#875 |
| 11. | Buffalo Grove | 87 | 5,476(1.59%)#11 | 624,863(0.01%)#918 |
| 12. | Carpentersville | 85 | 5,476(1.55%)#12 | 624,863(0.01%)#934 |
| 13. | Rockford | 84 | 5,476(1.53%)#13 | 624,863(0.01%)#941 |
| 14. | Monmouth | 71 | 5,476(1.30%)#14 | 624,863(0.01%)#1,044 |
| 15. | Carbondale | 70 | 5,476(1.28%)#15 | 624,863(0.01%)#1,049 |
| 16. | Decatur | 69 | 5,476(1.26%)#16 | 624,863(0.01%)#1,053 |
| 17. | Orland Park | 68 | 5,476(1.24%)#17 | 624,863(0.01%)#1,063 |
| 18. | Libertyville | 66 | 5,476(1.21%)#18 | 624,863(0.01%)#1,090 |
| 19. | Blue Island | 65 | 5,476(1.19%)#19 | 624,863(0.01%)#1,098 |
| 20. | Belleville | 63 | 5,476(1.15%)#20 | 624,863(0.01%)#1,120 |
| 21. | Skokie | 60 | 5,476(1.10%)#21 | 624,863(0.01%)#1,159 |
| 22. | Homewood | 58 | 5,476(1.06%)#22 | 624,863(0.01%)#1,193 |
| 23. | Carol Stream | 57 | 5,476(1.04%)#23 | 624,863(0.01%)#1,205 |
| 24. | Pekin | 53 | 5,476(0.97%)#24 | 624,863(0.01%)#1,249 |
| 25. | Calumet City | 51 | 5,476(0.93%)#25 | 624,863(0.01%)#1,271 |
| 26. | Bensenville | 51 | 5,476(0.93%)#26 | 624,863(0.01%)#1,272 |
| 27. | Urbana | 39 | 5,476(0.71%)#27 | 624,863(0.01%)#1,464 |
| 28. | Jerseyville | 37 | 5,476(0.68%)#28 | 624,863(0.01%)#1,516 |
| 29. | Glendale Heights | 35 | 5,476(0.64%)#29 | 624,863(0.01%)#1,545 |
| 30. | Lyons | 29 | 5,476(0.53%)#30 | 624,863(0.00%)#1,698 |
| 31. | Joliet | 27 | 5,476(0.49%)#31 | 624,863(0.00%)#1,757 |
| 32. | Highland Park | 27 | 5,476(0.49%)#32 | 624,863(0.00%)#1,765 |
| 33. | Bartlett | 26 | 5,476(0.47%)#33 | 624,863(0.00%)#1,800 |
| 34. | Hinsdale | 26 | 5,476(0.47%)#34 | 624,863(0.00%)#1,810 |
| 35. | Silvis | 26 | 5,476(0.47%)#35 | 624,863(0.00%)#1,816 |
| 36. | Champaign | 25 | 5,476(0.46%)#36 | 624,863(0.00%)#1,829 |
| 37. | Round Lake Beach | 25 | 5,476(0.46%)#37 | 624,863(0.00%)#1,838 |
| 38. | Malta | 25 | 5,476(0.46%)#38 | 624,863(0.00%)#1,852 |
| 39. | Waukegan | 24 | 5,476(0.44%)#39 | 624,863(0.00%)#1,856 |
| 40. | Montgomery | 24 | 5,476(0.44%)#40 | 624,863(0.00%)#1,871 |
| 41. | Crestwood | 24 | 5,476(0.44%)#41 | 624,863(0.00%)#1,879 |
| 42. | Mcleansboro | 24 | 5,476(0.44%)#42 | 624,863(0.00%)#1,891 |
| 43. | Mahomet | 23 | 5,476(0.42%)#43 | 624,863(0.00%)#1,918 |
| 44. | Fox Lake | 22 | 5,476(0.40%)#44 | 624,863(0.00%)#1,961 |
| 45. | Sauk Village | 22 | 5,476(0.40%)#45 | 624,863(0.00%)#1,964 |
| 46. | Cobden | 22 | 5,476(0.40%)#46 | 624,863(0.00%)#1,978 |
| 47. | Harrisburg | 21 | 5,476(0.38%)#47 | 624,863(0.00%)#2,016 |
| 48. | Niles | 20 | 5,476(0.37%)#48 | 624,863(0.00%)#2,048 |
| 49. | Chatham | 20 | 5,476(0.37%)#49 | 624,863(0.00%)#2,053 |
| 50. | North Chicago | 19 | 5,476(0.35%)#50 | 624,863(0.00%)#2,094 |
| 51. | Hampton | 18 | 5,476(0.33%)#51 | 624,863(0.00%)#2,175 |
| 52. | Evanston | 17 | 5,476(0.31%)#52 | 624,863(0.00%)#2,190 |
| 53. | Mount Prospect | 17 | 5,476(0.31%)#53 | 624,863(0.00%)#2,192 |
| 54. | Arlington Heights | 16 | 5,476(0.29%)#54 | 624,863(0.00%)#2,239 |
| 55. | Glenview | 15 | 5,476(0.27%)#55 | 624,863(0.00%)#2,298 |
| 56. | Red Bud | 15 | 5,476(0.27%)#56 | 624,863(0.00%)#2,332 |
| 57. | Granville | 15 | 5,476(0.27%)#57 | 624,863(0.00%)#2,344 |
| 58. | Oak Lawn | 14 | 5,476(0.26%)#58 | 624,863(0.00%)#2,359 |
| 59. | Downers Grove | 14 | 5,476(0.26%)#59 | 624,863(0.00%)#2,360 |
| 60. | Glen Ellyn | 14 | 5,476(0.26%)#60 | 624,863(0.00%)#2,368 |
| 61. | Sterling | 14 | 5,476(0.26%)#61 | 624,863(0.00%)#2,380 |
| 62. | Galva | 14 | 5,476(0.26%)#62 | 624,863(0.00%)#2,410 |
| 63. | Peoria | 13 | 5,476(0.24%)#63 | 624,863(0.00%)#2,428 |
| 64. | Long Grove | 13 | 5,476(0.24%)#64 | 624,863(0.00%)#2,459 |
| 65. | Broadview | 13 | 5,476(0.24%)#65 | 624,863(0.00%)#2,461 |
| 66. | Normal | 12 | 5,476(0.22%)#66 | 624,863(0.00%)#2,507 |
| 67. | Cary | 12 | 5,476(0.22%)#67 | 624,863(0.00%)#2,526 |
| 68. | Leland Grove | 12 | 5,476(0.22%)#68 | 624,863(0.00%)#2,568 |
| 69. | Moline | 11 | 5,476(0.20%)#69 | 624,863(0.00%)#2,581 |
| 70. | Machesney Park | 11 | 5,476(0.20%)#70 | 624,863(0.00%)#2,592 |
| 71. | Crete | 11 | 5,476(0.20%)#71 | 624,863(0.00%)#2,608 |
| 72. | Bannockburn | 11 | 5,476(0.20%)#72 | 624,863(0.00%)#2,643 |
| 73. | Galatia | 11 | 5,476(0.20%)#73 | 624,863(0.00%)#2,644 |
| 74. | Schaumburg | 10 | 5,476(0.18%)#74 | 624,863(0.00%)#2,663 |
| 75. | Oak Park | 10 | 5,476(0.18%)#75 | 624,863(0.00%)#2,666 |
| 76. | Vandalia | 10 | 5,476(0.18%)#76 | 624,863(0.00%)#2,691 |
| 77. | Bolingbrook | 9 | 5,476(0.16%)#77 | 624,863(0.00%)#2,736 |
| 78. | Danville | 9 | 5,476(0.16%)#78 | 624,863(0.00%)#2,750 |
| 79. | Godfrey | 9 | 5,476(0.16%)#79 | 624,863(0.00%)#2,757 |
| 80. | Cahokia Heights | 9 | 5,476(0.16%)#80 | 624,863(0.00%)#2,758 |
| 81. | Mundelein | 8 | 5,476(0.15%)#81 | 624,863(0.00%)#2,831 |
| 82. | East Moline | 8 | 5,476(0.15%)#82 | 624,863(0.00%)#2,841 |
| 83. | Cicero | 7 | 5,476(0.13%)#83 | 624,863(0.00%)#2,930 |
| 84. | Bloomington | 7 | 5,476(0.13%)#84 | 624,863(0.00%)#2,931 |
| 85. | New Lenox | 7 | 5,476(0.13%)#85 | 624,863(0.00%)#2,940 |
| 86. | Macomb | 7 | 5,476(0.13%)#86 | 624,863(0.00%)#2,954 |
| 87. | South Beloit | 7 | 5,476(0.13%)#87 | 624,863(0.00%)#2,968 |
| 88. | Naperville | 6 | 5,476(0.11%)#88 | 624,863(0.00%)#3,031 |
| 89. | Mount Vernon | 6 | 5,476(0.11%)#89 | 624,863(0.00%)#3,055 |
| 90. | Worth | 6 | 5,476(0.11%)#90 | 624,863(0.00%)#3,063 |
| 91. | Girard | 6 | 5,476(0.11%)#91 | 624,863(0.00%)#3,111 |
| 92. | Assumption | 6 | 5,476(0.11%)#92 | 624,863(0.00%)#3,121 |
| 93. | Golf | 6 | 5,476(0.11%)#93 | 624,863(0.00%)#3,137 |
| 94. | Romeoville | 5 | 5,476(0.09%)#94 | 624,863(0.00%)#3,153 |
| 95. | Winnetka | 5 | 5,476(0.09%)#95 | 624,863(0.00%)#3,174 |
| 96. | Steger | 4 | 5,476(0.07%)#96 | 624,863(0.00%)#3,301 |
| 97. | Bethalto | 4 | 5,476(0.07%)#97 | 624,863(0.00%)#3,302 |
| 98. | Georgetown | 4 | 5,476(0.07%)#98 | 624,863(0.00%)#3,323 |
| 99. | Ottawa | 3 | 5,476(0.05%)#99 | 624,863(0.00%)#3,403 |
| 100. | Palos Heights | 3 | 5,476(0.05%)#100 | 624,863(0.00%)#3,414 |
Common Questions
What are the Top 10 Cities with the Largest Hawaiian / Pacific Community in Illinois?
Top 10 Cities with the Largest Hawaiian / Pacific Community in Illinois are:
#1
1,409
#2
328
#3
213
#4
174
#5
167
#6
142
#7
116
#8
100
#9
95
#10
94
What city has the Largest Hawaiian / Pacific Community in Illinois?
Chicago has the Largest Hawaiian / Pacific Community in Illinois with 1,409.
What is the Total Hawaiian / Pacific Population in the State of Illinois?
Total Hawaiian / Pacific Population in Illinois is 5,476.
What is the Total Hawaiian / Pacific Population in the United States?
Total Hawaiian / Pacific Population in the United States is 624,863.