Cities with the Largest Haitian Community in Illinois
RELATED REPORTS & OPTIONS
Haitian
Illinois
Compare Cities
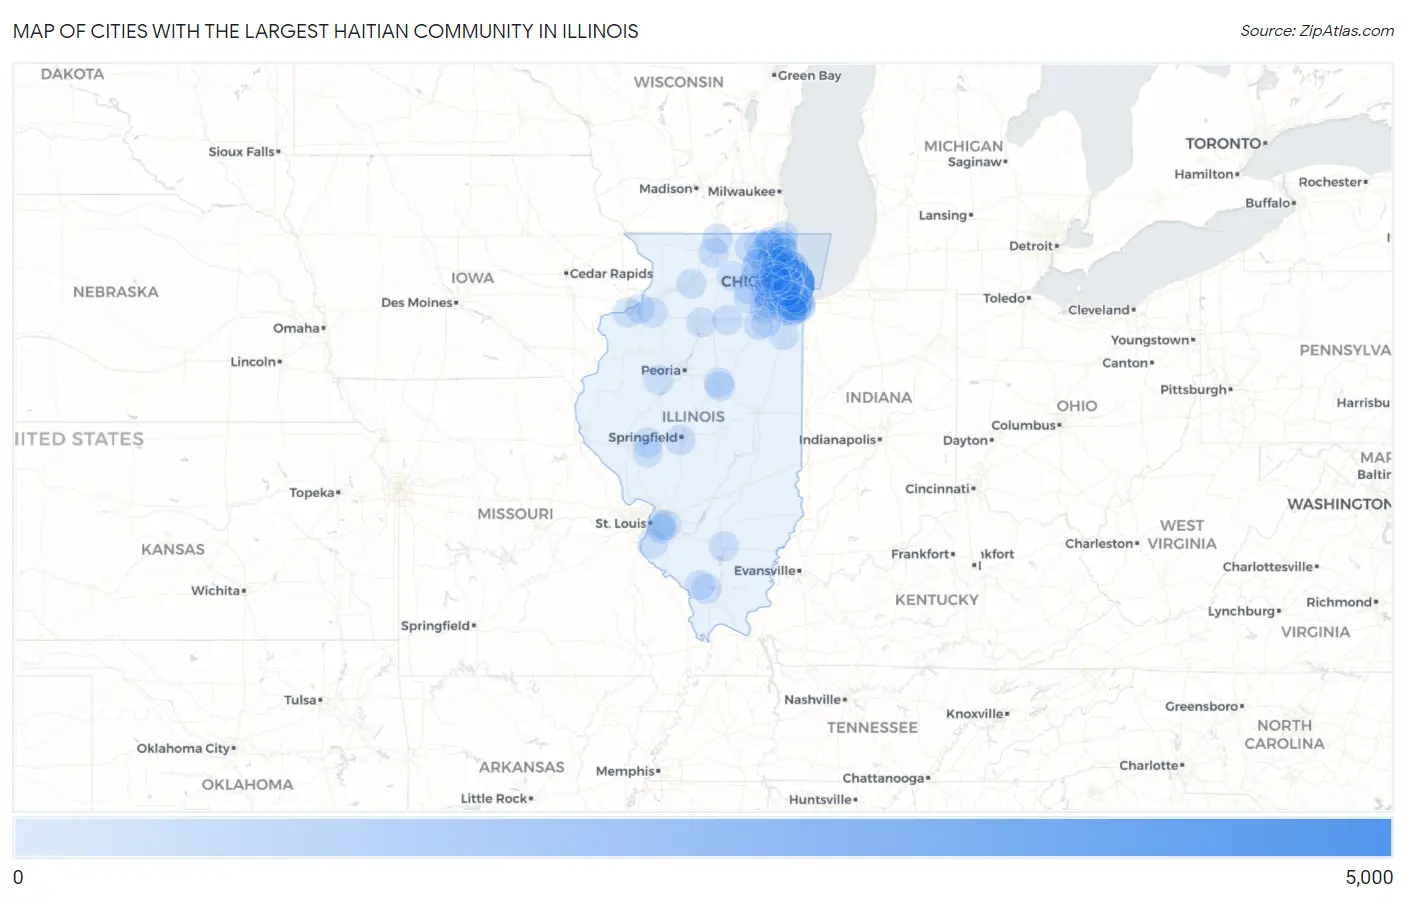
Map of Cities with the Largest Haitian Community in Illinois
0
5,000
Cities with the Largest Haitian Community in Illinois
| City | Haitian | vs State | vs National | |
| 1. | Chicago | 4,746 | 10,223(46.42%)#1 | 1,060,713(0.45%)#34 |
| 2. | Evanston | 452 | 10,223(4.42%)#2 | 1,060,713(0.04%)#270 |
| 3. | Grayslake | 298 | 10,223(2.91%)#3 | 1,060,713(0.03%)#348 |
| 4. | Skokie | 252 | 10,223(2.47%)#4 | 1,060,713(0.02%)#405 |
| 5. | Homewood | 251 | 10,223(2.46%)#5 | 1,060,713(0.02%)#407 |
| 6. | Palatine | 204 | 10,223(2.00%)#6 | 1,060,713(0.02%)#479 |
| 7. | Orland Park | 140 | 10,223(1.37%)#7 | 1,060,713(0.01%)#640 |
| 8. | Naperville | 138 | 10,223(1.35%)#8 | 1,060,713(0.01%)#646 |
| 9. | Des Plaines | 136 | 10,223(1.33%)#9 | 1,060,713(0.01%)#655 |
| 10. | Bolingbrook | 132 | 10,223(1.29%)#10 | 1,060,713(0.01%)#664 |
| 11. | Joliet | 122 | 10,223(1.19%)#11 | 1,060,713(0.01%)#698 |
| 12. | Waukegan | 115 | 10,223(1.12%)#12 | 1,060,713(0.01%)#732 |
| 13. | Lynwood | 113 | 10,223(1.11%)#13 | 1,060,713(0.01%)#748 |
| 14. | Sugar Grove | 111 | 10,223(1.09%)#14 | 1,060,713(0.01%)#758 |
| 15. | Springfield | 92 | 10,223(0.90%)#15 | 1,060,713(0.01%)#849 |
| 16. | Harvey | 87 | 10,223(0.85%)#16 | 1,060,713(0.01%)#877 |
| 17. | Elgin | 82 | 10,223(0.80%)#17 | 1,060,713(0.01%)#911 |
| 18. | Romeoville | 76 | 10,223(0.74%)#18 | 1,060,713(0.01%)#943 |
| 19. | Roscoe | 76 | 10,223(0.74%)#19 | 1,060,713(0.01%)#947 |
| 20. | Niles | 71 | 10,223(0.69%)#20 | 1,060,713(0.01%)#984 |
| 21. | Hoffman Estates | 70 | 10,223(0.68%)#21 | 1,060,713(0.01%)#992 |
| 22. | Olympia Fields | 68 | 10,223(0.67%)#22 | 1,060,713(0.01%)#1,011 |
| 23. | Robbins | 66 | 10,223(0.65%)#23 | 1,060,713(0.01%)#1,025 |
| 24. | Woodstock | 65 | 10,223(0.64%)#24 | 1,060,713(0.01%)#1,033 |
| 25. | La Grange | 65 | 10,223(0.64%)#25 | 1,060,713(0.01%)#1,035 |
| 26. | Lansing | 64 | 10,223(0.63%)#26 | 1,060,713(0.01%)#1,042 |
| 27. | Vernon Hills | 62 | 10,223(0.61%)#27 | 1,060,713(0.01%)#1,060 |
| 28. | Frankfort | 62 | 10,223(0.61%)#28 | 1,060,713(0.01%)#1,065 |
| 29. | Rockford | 57 | 10,223(0.56%)#29 | 1,060,713(0.01%)#1,108 |
| 30. | Lombard | 56 | 10,223(0.55%)#30 | 1,060,713(0.01%)#1,120 |
| 31. | Buffalo Grove | 56 | 10,223(0.55%)#31 | 1,060,713(0.01%)#1,121 |
| 32. | Country Club Hills | 56 | 10,223(0.55%)#32 | 1,060,713(0.01%)#1,129 |
| 33. | Oak Lawn | 55 | 10,223(0.54%)#33 | 1,060,713(0.01%)#1,131 |
| 34. | Cary | 52 | 10,223(0.51%)#34 | 1,060,713(0.00%)#1,164 |
| 35. | Glendale Heights | 51 | 10,223(0.50%)#35 | 1,060,713(0.00%)#1,176 |
| 36. | South Holland | 48 | 10,223(0.47%)#36 | 1,060,713(0.00%)#1,209 |
| 37. | Dolton | 47 | 10,223(0.46%)#37 | 1,060,713(0.00%)#1,222 |
| 38. | Dekalb | 45 | 10,223(0.44%)#38 | 1,060,713(0.00%)#1,250 |
| 39. | Oak Forest | 45 | 10,223(0.44%)#39 | 1,060,713(0.00%)#1,255 |
| 40. | Bradley | 44 | 10,223(0.43%)#40 | 1,060,713(0.00%)#1,268 |
| 41. | Oakbrook Terrace | 43 | 10,223(0.42%)#41 | 1,060,713(0.00%)#1,283 |
| 42. | Carol Stream | 41 | 10,223(0.40%)#42 | 1,060,713(0.00%)#1,302 |
| 43. | Zion | 40 | 10,223(0.39%)#43 | 1,060,713(0.00%)#1,317 |
| 44. | Glenwood | 38 | 10,223(0.37%)#44 | 1,060,713(0.00%)#1,355 |
| 45. | Mount Vernon | 36 | 10,223(0.35%)#45 | 1,060,713(0.00%)#1,383 |
| 46. | O Fallon | 32 | 10,223(0.31%)#46 | 1,060,713(0.00%)#1,467 |
| 47. | Wilmington | 30 | 10,223(0.29%)#47 | 1,060,713(0.00%)#1,507 |
| 48. | Jacksonville | 27 | 10,223(0.26%)#48 | 1,060,713(0.00%)#1,560 |
| 49. | Waterloo | 26 | 10,223(0.25%)#49 | 1,060,713(0.00%)#1,587 |
| 50. | Bellwood | 25 | 10,223(0.24%)#50 | 1,060,713(0.00%)#1,610 |
| 51. | Canton | 24 | 10,223(0.23%)#51 | 1,060,713(0.00%)#1,654 |
| 52. | Wheeling | 23 | 10,223(0.22%)#52 | 1,060,713(0.00%)#1,675 |
| 53. | Round Lake Beach | 23 | 10,223(0.22%)#53 | 1,060,713(0.00%)#1,678 |
| 54. | St Charles | 22 | 10,223(0.22%)#54 | 1,060,713(0.00%)#1,703 |
| 55. | Oak Park | 21 | 10,223(0.21%)#55 | 1,060,713(0.00%)#1,720 |
| 56. | Mokena | 21 | 10,223(0.21%)#56 | 1,060,713(0.00%)#1,724 |
| 57. | Round Lake | 21 | 10,223(0.21%)#57 | 1,060,713(0.00%)#1,725 |
| 58. | Elk Grove Village | 20 | 10,223(0.20%)#58 | 1,060,713(0.00%)#1,756 |
| 59. | Calumet City | 19 | 10,223(0.19%)#59 | 1,060,713(0.00%)#1,796 |
| 60. | Morton Grove | 19 | 10,223(0.19%)#60 | 1,060,713(0.00%)#1,802 |
| 61. | Worth | 19 | 10,223(0.19%)#61 | 1,060,713(0.00%)#1,807 |
| 62. | Kildeer | 19 | 10,223(0.19%)#62 | 1,060,713(0.00%)#1,813 |
| 63. | Crest Hill | 18 | 10,223(0.18%)#63 | 1,060,713(0.00%)#1,831 |
| 64. | Lemont | 18 | 10,223(0.18%)#64 | 1,060,713(0.00%)#1,836 |
| 65. | Carbondale | 16 | 10,223(0.16%)#65 | 1,060,713(0.00%)#1,894 |
| 66. | Elmhurst | 15 | 10,223(0.15%)#66 | 1,060,713(0.00%)#1,933 |
| 67. | Mchenry | 15 | 10,223(0.15%)#67 | 1,060,713(0.00%)#1,942 |
| 68. | Chicago Heights | 15 | 10,223(0.15%)#68 | 1,060,713(0.00%)#1,943 |
| 69. | Coal City | 15 | 10,223(0.15%)#69 | 1,060,713(0.00%)#1,971 |
| 70. | Lisle | 14 | 10,223(0.14%)#70 | 1,060,713(0.00%)#1,997 |
| 71. | Yorkville | 14 | 10,223(0.14%)#71 | 1,060,713(0.00%)#1,998 |
| 72. | Normal | 13 | 10,223(0.13%)#72 | 1,060,713(0.00%)#2,025 |
| 73. | Lake Forest | 13 | 10,223(0.13%)#73 | 1,060,713(0.00%)#2,035 |
| 74. | Murphysboro | 13 | 10,223(0.13%)#74 | 1,060,713(0.00%)#2,044 |
| 75. | Cicero | 12 | 10,223(0.12%)#75 | 1,060,713(0.00%)#2,064 |
| 76. | Bloomington | 12 | 10,223(0.12%)#76 | 1,060,713(0.00%)#2,065 |
| 77. | Palos Hills | 12 | 10,223(0.12%)#77 | 1,060,713(0.00%)#2,077 |
| 78. | Cahokia Heights | 12 | 10,223(0.12%)#78 | 1,060,713(0.00%)#2,078 |
| 79. | Flossmoor | 12 | 10,223(0.12%)#79 | 1,060,713(0.00%)#2,087 |
| 80. | Wheaton | 11 | 10,223(0.11%)#80 | 1,060,713(0.00%)#2,117 |
| 81. | Blue Island | 11 | 10,223(0.11%)#81 | 1,060,713(0.00%)#2,125 |
| 82. | Bridgeview | 11 | 10,223(0.11%)#82 | 1,060,713(0.00%)#2,130 |
| 83. | De Pue | 11 | 10,223(0.11%)#83 | 1,060,713(0.00%)#2,161 |
| 84. | Berwyn | 10 | 10,223(0.10%)#84 | 1,060,713(0.00%)#2,175 |
| 85. | Ottawa | 10 | 10,223(0.10%)#85 | 1,060,713(0.00%)#2,192 |
| 86. | Arlington Heights | 9 | 10,223(0.09%)#86 | 1,060,713(0.00%)#2,231 |
| 87. | Wilmette | 9 | 10,223(0.09%)#87 | 1,060,713(0.00%)#2,238 |
| 88. | Geneseo | 9 | 10,223(0.09%)#88 | 1,060,713(0.00%)#2,261 |
| 89. | Murrayville | 9 | 10,223(0.09%)#89 | 1,060,713(0.00%)#2,279 |
| 90. | Rock Island | 8 | 10,223(0.08%)#90 | 1,060,713(0.00%)#2,294 |
| 91. | East Moline | 8 | 10,223(0.08%)#91 | 1,060,713(0.00%)#2,303 |
| 92. | Fairview Heights | 8 | 10,223(0.08%)#92 | 1,060,713(0.00%)#2,306 |
| 93. | Addison | 7 | 10,223(0.07%)#93 | 1,060,713(0.00%)#2,353 |
| 94. | Northbrook | 7 | 10,223(0.07%)#94 | 1,060,713(0.00%)#2,354 |
| 95. | Villa Park | 7 | 10,223(0.07%)#95 | 1,060,713(0.00%)#2,363 |
| 96. | Dixon | 7 | 10,223(0.07%)#96 | 1,060,713(0.00%)#2,371 |
| 97. | North Chicago | 6 | 10,223(0.06%)#97 | 1,060,713(0.00%)#2,420 |
| 98. | Park Forest | 6 | 10,223(0.06%)#98 | 1,060,713(0.00%)#2,423 |
| 99. | Swansea | 6 | 10,223(0.06%)#99 | 1,060,713(0.00%)#2,433 |
| 100. | Sleepy Hollow | 6 | 10,223(0.06%)#100 | 1,060,713(0.00%)#2,454 |
Common Questions
What are the Top 10 Cities with the Largest Haitian Community in Illinois?
Top 10 Cities with the Largest Haitian Community in Illinois are:
#1
4,746
#2
452
#3
298
#4
252
#5
251
#6
204
#7
140
#8
138
#9
136
#10
132
What city has the Largest Haitian Community in Illinois?
Chicago has the Largest Haitian Community in Illinois with 4,746.
What is the Total Haitian Population in the State of Illinois?
Total Haitian Population in Illinois is 10,223.
What is the Total Haitian Population in the United States?
Total Haitian Population in the United States is 1,060,713.