Zip Codes with the Highest Percentage of Population Employed in Food Preparation & Serving in Hoffman Estates, IL
RELATED REPORTS & OPTIONS
Food Preparation & Serving
Hoffman Estates
Compare Zip Codes
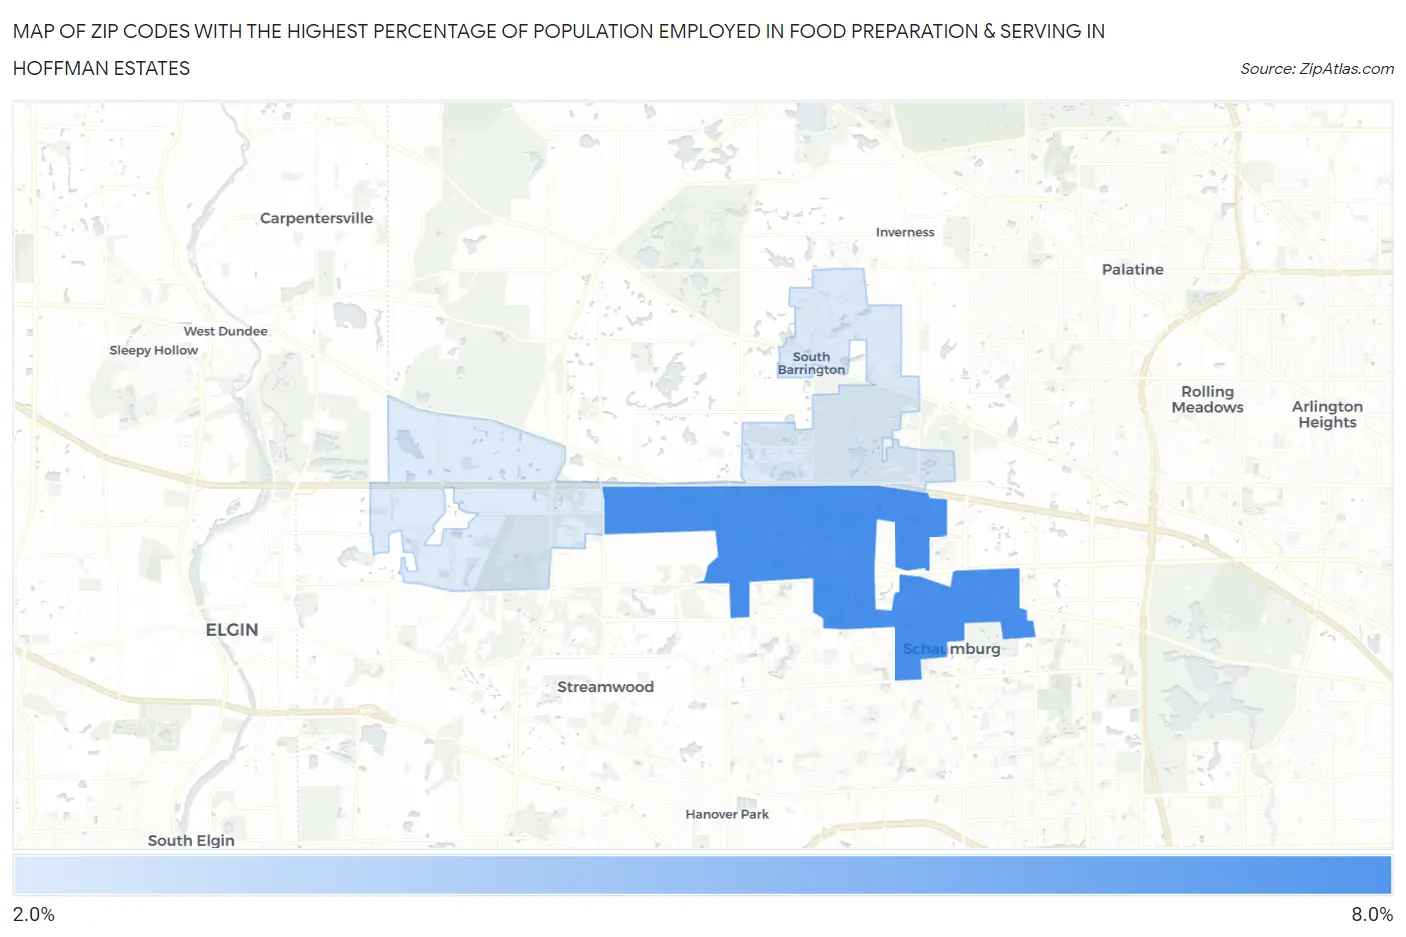
Map of Zip Codes with the Highest Percentage of Population Employed in Food Preparation & Serving in Hoffman Estates
2.4%
6.3%
Zip Codes with the Highest Percentage of Population Employed in Food Preparation & Serving in Hoffman Estates, IL
| Zip Code | % Employed | vs State | vs National | |
| 1. | 60169 | 6.3% | 5.0%(+1.28)#353 | 5.3%(+1.03)#8,400 |
| 2. | 60192 | 2.4% | 5.0%(-2.59)#1,035 | 5.3%(-2.84)#23,318 |
1
Common Questions
What are the Top Zip Codes with the Highest Percentage of Population Employed in Food Preparation & Serving in Hoffman Estates, IL?
Top Zip Codes with the Highest Percentage of Population Employed in Food Preparation & Serving in Hoffman Estates, IL are:
What zip code has the Highest Percentage of Population Employed in Food Preparation & Serving in Hoffman Estates, IL?
60169 has the Highest Percentage of Population Employed in Food Preparation & Serving in Hoffman Estates, IL with 6.3%.
What is the Percentage of Population Employed in Food Preparation & Serving in Hoffman Estates, IL?
Percentage of Population Employed in Food Preparation & Serving in Hoffman Estates is 5.0%.
What is the Percentage of Population Employed in Food Preparation & Serving in Illinois?
Percentage of Population Employed in Food Preparation & Serving in Illinois is 5.0%.
What is the Percentage of Population Employed in Food Preparation & Serving in the United States?
Percentage of Population Employed in Food Preparation & Serving in the United States is 5.3%.