Cities with the Largest Cuban Community in Illinois
RELATED REPORTS & OPTIONS
Cuban
Illinois
Compare Cities
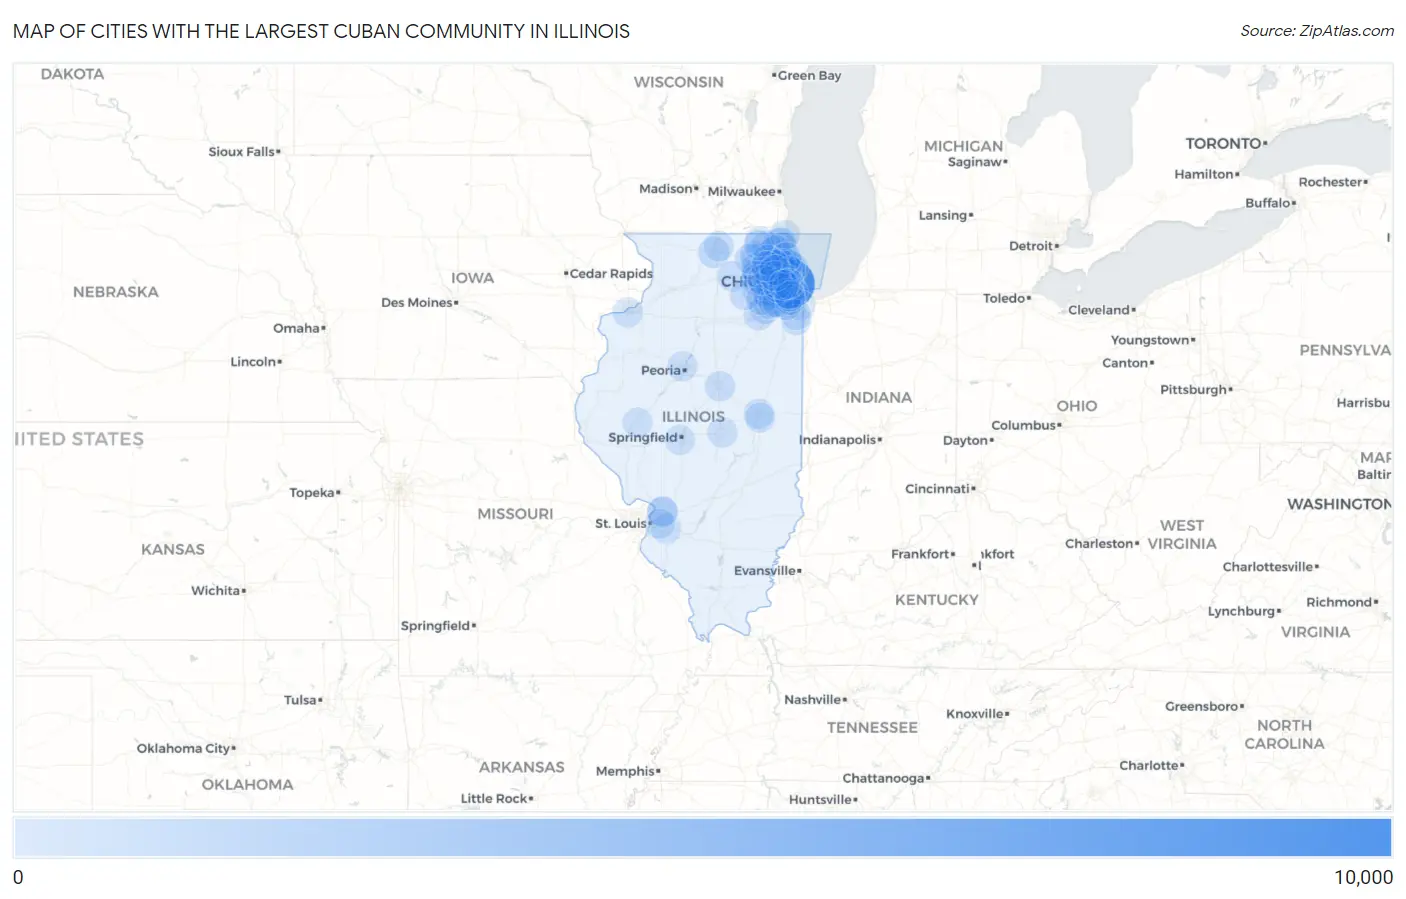
Map of Cities with the Largest Cuban Community in Illinois
0
10,000
Cities with the Largest Cuban Community in Illinois
| City | Cuban | vs State | vs National | |
| 1. | Chicago | 9,163 | 28,595(32.04%)#1 | 2,405,080(0.38%)#38 |
| 2. | Orland Park | 697 | 28,595(2.44%)#2 | 2,405,080(0.03%)#325 |
| 3. | Aurora | 498 | 28,595(1.74%)#3 | 2,405,080(0.02%)#413 |
| 4. | Rockford | 491 | 28,595(1.72%)#4 | 2,405,080(0.02%)#415 |
| 5. | Skokie | 464 | 28,595(1.62%)#5 | 2,405,080(0.02%)#442 |
| 6. | Evanston | 461 | 28,595(1.61%)#6 | 2,405,080(0.02%)#443 |
| 7. | Melrose Park | 444 | 28,595(1.55%)#7 | 2,405,080(0.02%)#461 |
| 8. | Schaumburg | 389 | 28,595(1.36%)#8 | 2,405,080(0.02%)#505 |
| 9. | Bensenville | 382 | 28,595(1.34%)#9 | 2,405,080(0.02%)#516 |
| 10. | Gurnee | 369 | 28,595(1.29%)#10 | 2,405,080(0.02%)#534 |
| 11. | Elmwood Park | 303 | 28,595(1.06%)#11 | 2,405,080(0.01%)#636 |
| 12. | Niles | 297 | 28,595(1.04%)#12 | 2,405,080(0.01%)#648 |
| 13. | Bartlett | 291 | 28,595(1.02%)#13 | 2,405,080(0.01%)#660 |
| 14. | Joliet | 288 | 28,595(1.01%)#14 | 2,405,080(0.01%)#667 |
| 15. | Mount Prospect | 270 | 28,595(0.94%)#15 | 2,405,080(0.01%)#713 |
| 16. | Palos Heights | 270 | 28,595(0.94%)#16 | 2,405,080(0.01%)#715 |
| 17. | Elmhurst | 265 | 28,595(0.93%)#17 | 2,405,080(0.01%)#724 |
| 18. | Channahon | 247 | 28,595(0.86%)#18 | 2,405,080(0.01%)#764 |
| 19. | Glenview | 239 | 28,595(0.84%)#19 | 2,405,080(0.01%)#786 |
| 20. | Dekalb | 222 | 28,595(0.78%)#20 | 2,405,080(0.01%)#843 |
| 21. | Lake In The Hills | 222 | 28,595(0.78%)#21 | 2,405,080(0.01%)#844 |
| 22. | Arlington Heights | 221 | 28,595(0.77%)#22 | 2,405,080(0.01%)#849 |
| 23. | Evergreen Park | 215 | 28,595(0.75%)#23 | 2,405,080(0.01%)#874 |
| 24. | Downers Grove | 211 | 28,595(0.74%)#24 | 2,405,080(0.01%)#888 |
| 25. | Des Plaines | 203 | 28,595(0.71%)#25 | 2,405,080(0.01%)#916 |
| 26. | Elgin | 200 | 28,595(0.70%)#26 | 2,405,080(0.01%)#929 |
| 27. | St Charles | 187 | 28,595(0.65%)#27 | 2,405,080(0.01%)#981 |
| 28. | Naperville | 183 | 28,595(0.64%)#28 | 2,405,080(0.01%)#994 |
| 29. | Morton Grove | 178 | 28,595(0.62%)#29 | 2,405,080(0.01%)#1,024 |
| 30. | Berwyn | 168 | 28,595(0.59%)#30 | 2,405,080(0.01%)#1,075 |
| 31. | Harwood Heights | 159 | 28,595(0.56%)#31 | 2,405,080(0.01%)#1,120 |
| 32. | Mundelein | 147 | 28,595(0.51%)#32 | 2,405,080(0.01%)#1,193 |
| 33. | Algonquin | 146 | 28,595(0.51%)#33 | 2,405,080(0.01%)#1,201 |
| 34. | Crest Hill | 146 | 28,595(0.51%)#34 | 2,405,080(0.01%)#1,203 |
| 35. | Park Ridge | 141 | 28,595(0.49%)#35 | 2,405,080(0.01%)#1,240 |
| 36. | Bloomington | 140 | 28,595(0.49%)#36 | 2,405,080(0.01%)#1,248 |
| 37. | North Chicago | 138 | 28,595(0.48%)#37 | 2,405,080(0.01%)#1,273 |
| 38. | Wilmette | 137 | 28,595(0.48%)#38 | 2,405,080(0.01%)#1,284 |
| 39. | Geneva | 131 | 28,595(0.46%)#39 | 2,405,080(0.01%)#1,327 |
| 40. | Plano | 129 | 28,595(0.45%)#40 | 2,405,080(0.01%)#1,343 |
| 41. | Carol Stream | 128 | 28,595(0.45%)#41 | 2,405,080(0.01%)#1,346 |
| 42. | Hanover Park | 123 | 28,595(0.43%)#42 | 2,405,080(0.01%)#1,399 |
| 43. | Glen Ellyn | 115 | 28,595(0.40%)#43 | 2,405,080(0.00%)#1,475 |
| 44. | Woodridge | 114 | 28,595(0.40%)#44 | 2,405,080(0.00%)#1,486 |
| 45. | Oak Park | 113 | 28,595(0.40%)#45 | 2,405,080(0.00%)#1,498 |
| 46. | Rock Island | 111 | 28,595(0.39%)#46 | 2,405,080(0.00%)#1,518 |
| 47. | Lansing | 105 | 28,595(0.37%)#47 | 2,405,080(0.00%)#1,564 |
| 48. | River Forest | 104 | 28,595(0.36%)#48 | 2,405,080(0.00%)#1,584 |
| 49. | Warrenville | 101 | 28,595(0.35%)#49 | 2,405,080(0.00%)#1,617 |
| 50. | Shiloh | 101 | 28,595(0.35%)#50 | 2,405,080(0.00%)#1,618 |
| 51. | South Elgin | 100 | 28,595(0.35%)#51 | 2,405,080(0.00%)#1,633 |
| 52. | Glen Carbon | 99 | 28,595(0.35%)#52 | 2,405,080(0.00%)#1,650 |
| 53. | Springfield | 98 | 28,595(0.34%)#53 | 2,405,080(0.00%)#1,658 |
| 54. | Bolingbrook | 98 | 28,595(0.34%)#54 | 2,405,080(0.00%)#1,661 |
| 55. | Wheaton | 96 | 28,595(0.34%)#55 | 2,405,080(0.00%)#1,693 |
| 56. | Waukegan | 95 | 28,595(0.33%)#56 | 2,405,080(0.00%)#1,700 |
| 57. | Huntley | 94 | 28,595(0.33%)#57 | 2,405,080(0.00%)#1,717 |
| 58. | Villa Park | 93 | 28,595(0.33%)#58 | 2,405,080(0.00%)#1,732 |
| 59. | Northfield | 93 | 28,595(0.33%)#59 | 2,405,080(0.00%)#1,739 |
| 60. | Bloomingdale | 92 | 28,595(0.32%)#60 | 2,405,080(0.00%)#1,742 |
| 61. | Libertyville | 92 | 28,595(0.32%)#61 | 2,405,080(0.00%)#1,743 |
| 62. | Prospect Heights | 91 | 28,595(0.32%)#62 | 2,405,080(0.00%)#1,757 |
| 63. | Franklin Park | 89 | 28,595(0.31%)#63 | 2,405,080(0.00%)#1,780 |
| 64. | Riverside | 89 | 28,595(0.31%)#64 | 2,405,080(0.00%)#1,785 |
| 65. | Volo | 86 | 28,595(0.30%)#65 | 2,405,080(0.00%)#1,822 |
| 66. | Lincolnwood | 84 | 28,595(0.29%)#66 | 2,405,080(0.00%)#1,837 |
| 67. | Harding | 83 | 28,595(0.29%)#67 | 2,405,080(0.00%)#1,856 |
| 68. | Palatine | 81 | 28,595(0.28%)#68 | 2,405,080(0.00%)#1,875 |
| 69. | Rolling Meadows | 81 | 28,595(0.28%)#69 | 2,405,080(0.00%)#1,885 |
| 70. | Decatur | 80 | 28,595(0.28%)#70 | 2,405,080(0.00%)#1,893 |
| 71. | Beecher | 80 | 28,595(0.28%)#71 | 2,405,080(0.00%)#1,905 |
| 72. | Crete | 79 | 28,595(0.28%)#72 | 2,405,080(0.00%)#1,915 |
| 73. | Westchester | 78 | 28,595(0.27%)#73 | 2,405,080(0.00%)#1,934 |
| 74. | Tinley Park | 77 | 28,595(0.27%)#74 | 2,405,080(0.00%)#1,942 |
| 75. | Champaign | 76 | 28,595(0.27%)#75 | 2,405,080(0.00%)#1,953 |
| 76. | Plainfield | 76 | 28,595(0.27%)#76 | 2,405,080(0.00%)#1,958 |
| 77. | Lockport | 73 | 28,595(0.26%)#77 | 2,405,080(0.00%)#2,006 |
| 78. | Midlothian | 73 | 28,595(0.26%)#78 | 2,405,080(0.00%)#2,007 |
| 79. | Johnsburg | 72 | 28,595(0.25%)#79 | 2,405,080(0.00%)#2,031 |
| 80. | Beardstown | 68 | 28,595(0.24%)#80 | 2,405,080(0.00%)#2,098 |
| 81. | Barrington | 66 | 28,595(0.23%)#81 | 2,405,080(0.00%)#2,130 |
| 82. | Peoria | 65 | 28,595(0.23%)#82 | 2,405,080(0.00%)#2,141 |
| 83. | Loves Park | 64 | 28,595(0.22%)#83 | 2,405,080(0.00%)#2,168 |
| 84. | Mchenry | 63 | 28,595(0.22%)#84 | 2,405,080(0.00%)#2,188 |
| 85. | Winthrop Harbor | 60 | 28,595(0.21%)#85 | 2,405,080(0.00%)#2,259 |
| 86. | Homer Glen | 59 | 28,595(0.21%)#86 | 2,405,080(0.00%)#2,272 |
| 87. | Hinsdale | 59 | 28,595(0.21%)#87 | 2,405,080(0.00%)#2,278 |
| 88. | Oak Brook | 59 | 28,595(0.21%)#88 | 2,405,080(0.00%)#2,287 |
| 89. | Oak Lawn | 58 | 28,595(0.20%)#89 | 2,405,080(0.00%)#2,297 |
| 90. | West Chicago | 57 | 28,595(0.20%)#90 | 2,405,080(0.00%)#2,328 |
| 91. | Alsip | 56 | 28,595(0.20%)#91 | 2,405,080(0.00%)#2,357 |
| 92. | Addison | 55 | 28,595(0.19%)#92 | 2,405,080(0.00%)#2,381 |
| 93. | Highland Park | 55 | 28,595(0.19%)#93 | 2,405,080(0.00%)#2,382 |
| 94. | Hoffman Estates | 53 | 28,595(0.19%)#94 | 2,405,080(0.00%)#2,427 |
| 95. | Elk Grove Village | 53 | 28,595(0.19%)#95 | 2,405,080(0.00%)#2,431 |
| 96. | Cicero | 49 | 28,595(0.17%)#96 | 2,405,080(0.00%)#2,535 |
| 97. | Edwardsville | 48 | 28,595(0.17%)#97 | 2,405,080(0.00%)#2,578 |
| 98. | Brookfield | 47 | 28,595(0.16%)#98 | 2,405,080(0.00%)#2,609 |
| 99. | Savoy | 47 | 28,595(0.16%)#99 | 2,405,080(0.00%)#2,621 |
| 100. | Caseyville | 46 | 28,595(0.16%)#100 | 2,405,080(0.00%)#2,653 |
Common Questions
What are the Top 10 Cities with the Largest Cuban Community in Illinois?
Top 10 Cities with the Largest Cuban Community in Illinois are:
#1
9,163
#2
697
#3
498
#4
491
#5
464
#6
461
#7
444
#8
389
#9
382
#10
369
What city has the Largest Cuban Community in Illinois?
Chicago has the Largest Cuban Community in Illinois with 9,163.
What is the Total Cuban Population in the State of Illinois?
Total Cuban Population in Illinois is 28,595.
What is the Total Cuban Population in the United States?
Total Cuban Population in the United States is 2,405,080.