Zip Codes with the Highest Percentage of Population Employed in Food Preparation & Serving in Carbondale, IL
RELATED REPORTS & OPTIONS
Food Preparation & Serving
Carbondale
Compare Zip Codes
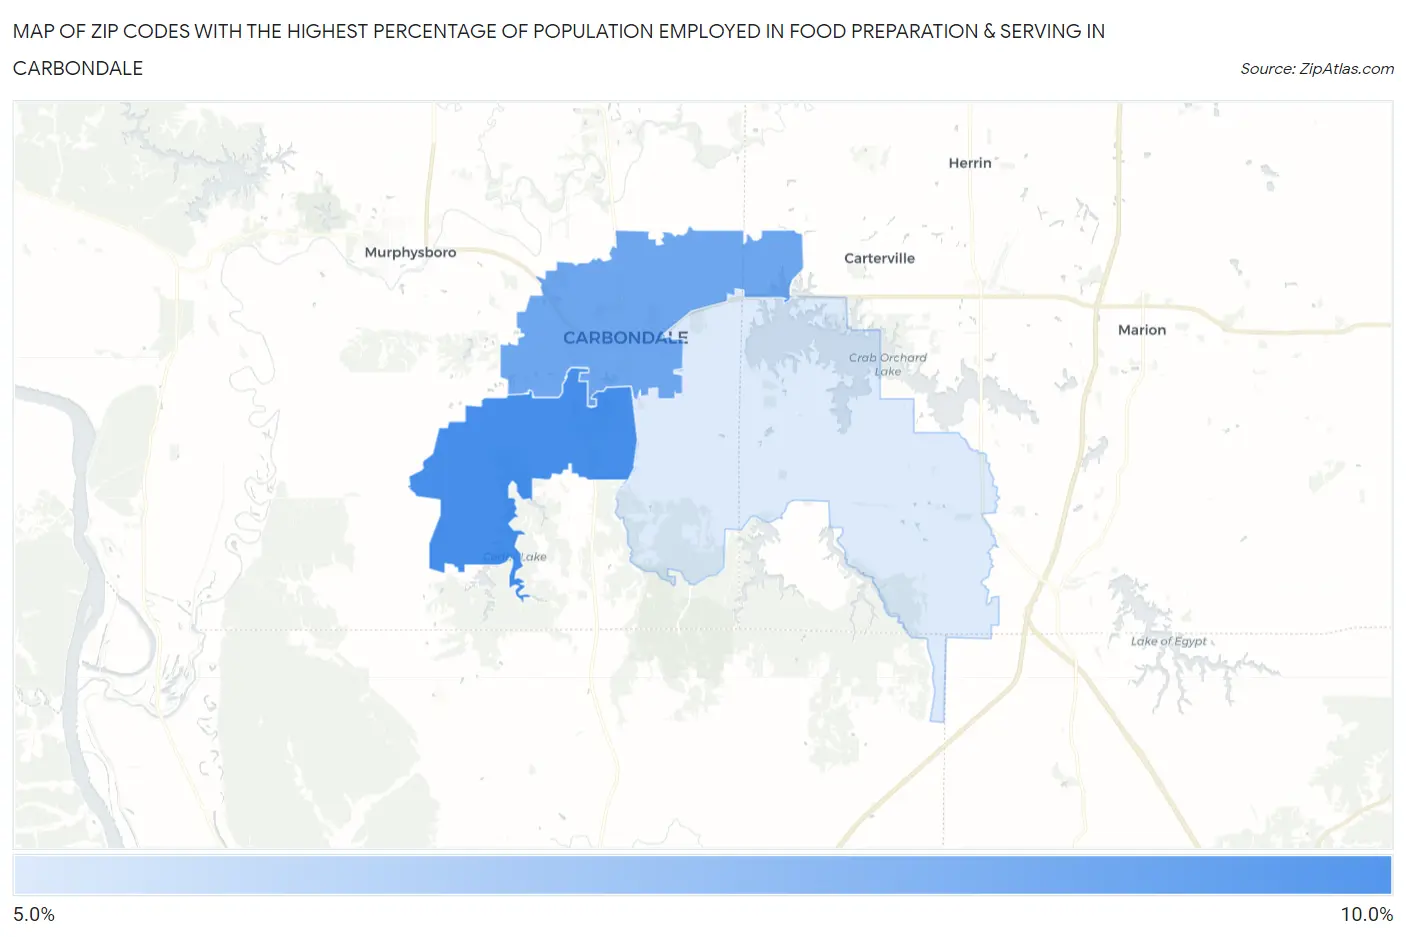
Map of Zip Codes with the Highest Percentage of Population Employed in Food Preparation & Serving in Carbondale
5.9%
9.2%
Zip Codes with the Highest Percentage of Population Employed in Food Preparation & Serving in Carbondale, IL
| Zip Code | % Employed | vs State | vs National | |
| 1. | 62903 | 9.2% | 5.0%(+4.16)#137 | 5.3%(+3.91)#3,325 |
| 2. | 62901 | 8.3% | 5.0%(+3.28)#176 | 5.3%(+3.03)#4,301 |
| 3. | 62902 | 5.9% | 5.0%(+0.909)#399 | 5.3%(+0.657)#9,530 |
1
Common Questions
What are the Top Zip Codes with the Highest Percentage of Population Employed in Food Preparation & Serving in Carbondale, IL?
Top Zip Codes with the Highest Percentage of Population Employed in Food Preparation & Serving in Carbondale, IL are:
What zip code has the Highest Percentage of Population Employed in Food Preparation & Serving in Carbondale, IL?
62903 has the Highest Percentage of Population Employed in Food Preparation & Serving in Carbondale, IL with 9.2%.
What is the Percentage of Population Employed in Food Preparation & Serving in Carbondale, IL?
Percentage of Population Employed in Food Preparation & Serving in Carbondale is 9.9%.
What is the Percentage of Population Employed in Food Preparation & Serving in Illinois?
Percentage of Population Employed in Food Preparation & Serving in Illinois is 5.0%.
What is the Percentage of Population Employed in Food Preparation & Serving in the United States?
Percentage of Population Employed in Food Preparation & Serving in the United States is 5.3%.