Cities with the Largest Nicaraguan Community in Illinois
RELATED REPORTS & OPTIONS
Nicaraguan
Illinois
Compare Cities
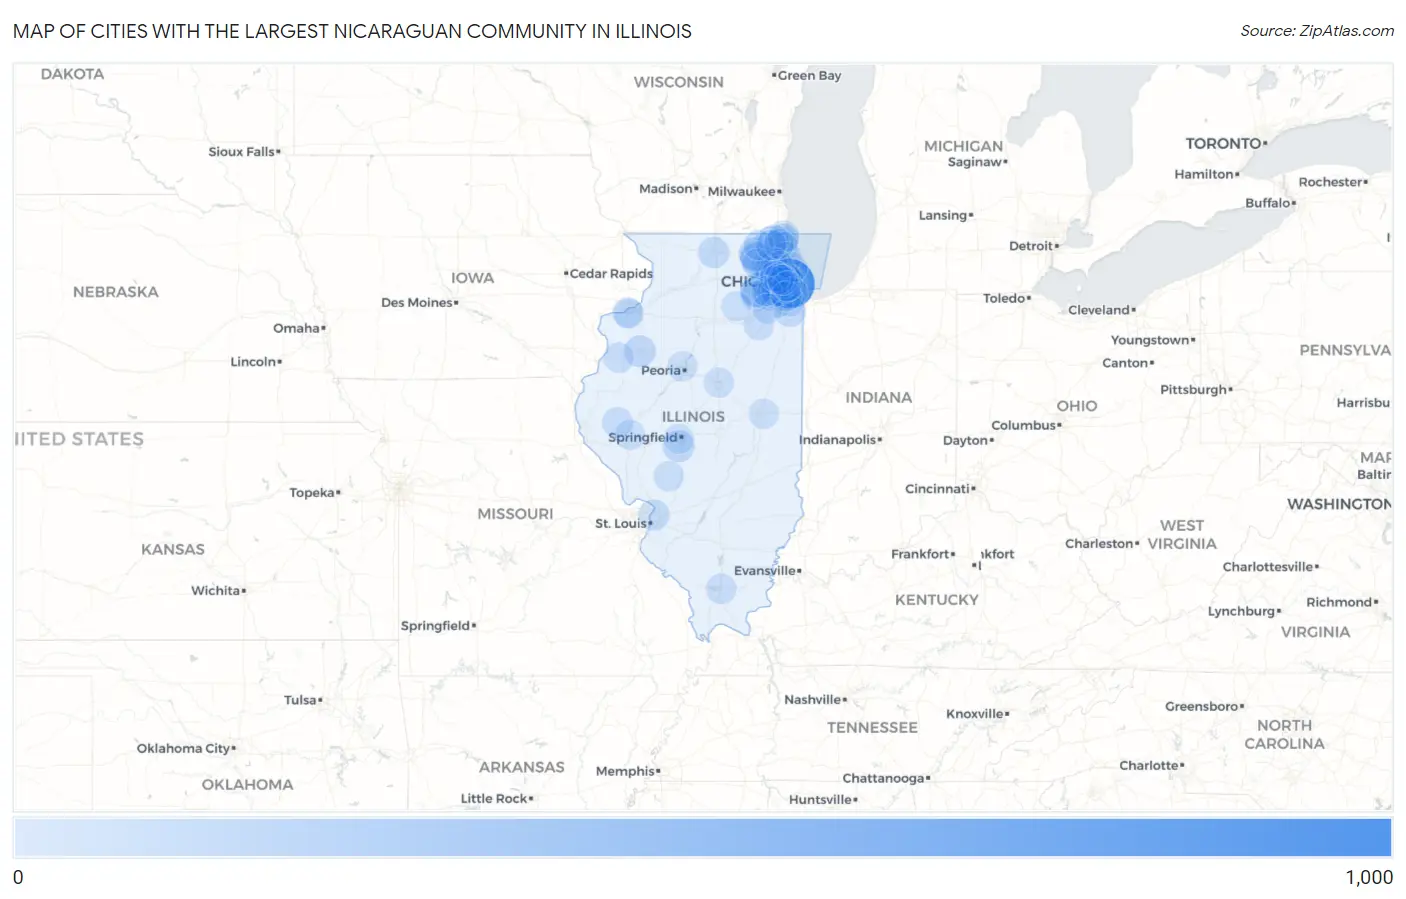
Map of Cities with the Largest Nicaraguan Community in Illinois
0
1,000
Cities with the Largest Nicaraguan Community in Illinois
| City | Nicaraguan | vs State | vs National | |
| 1. | Chicago | 953 | 4,025(23.68%)#1 | 441,378(0.22%)#72 |
| 2. | Berwyn | 442 | 4,025(10.98%)#2 | 441,378(0.10%)#168 |
| 3. | Wheaton | 174 | 4,025(4.32%)#3 | 441,378(0.04%)#402 |
| 4. | Cicero | 155 | 4,025(3.85%)#4 | 441,378(0.04%)#445 |
| 5. | Aurora | 153 | 4,025(3.80%)#5 | 441,378(0.03%)#453 |
| 6. | River Grove | 149 | 4,025(3.70%)#6 | 441,378(0.03%)#467 |
| 7. | Crystal Lake | 117 | 4,025(2.91%)#7 | 441,378(0.03%)#550 |
| 8. | Algonquin | 89 | 4,025(2.21%)#8 | 441,378(0.02%)#670 |
| 9. | Galesburg | 78 | 4,025(1.94%)#9 | 441,378(0.02%)#732 |
| 10. | Chatham | 78 | 4,025(1.94%)#10 | 441,378(0.02%)#734 |
| 11. | Waukegan | 68 | 4,025(1.69%)#11 | 441,378(0.02%)#804 |
| 12. | Glendale Heights | 63 | 4,025(1.57%)#12 | 441,378(0.01%)#854 |
| 13. | Round Lake Beach | 56 | 4,025(1.39%)#13 | 441,378(0.01%)#908 |
| 14. | Rockford | 55 | 4,025(1.37%)#14 | 441,378(0.01%)#915 |
| 15. | Richton Park | 55 | 4,025(1.37%)#15 | 441,378(0.01%)#923 |
| 16. | Zion | 46 | 4,025(1.14%)#16 | 441,378(0.01%)#1,034 |
| 17. | Granite City | 44 | 4,025(1.09%)#17 | 441,378(0.01%)#1,060 |
| 18. | Schaumburg | 42 | 4,025(1.04%)#18 | 441,378(0.01%)#1,089 |
| 19. | Elk Grove Village | 40 | 4,025(0.99%)#19 | 441,378(0.01%)#1,120 |
| 20. | North Chicago | 38 | 4,025(0.94%)#20 | 441,378(0.01%)#1,164 |
| 21. | Oak Forest | 33 | 4,025(0.82%)#21 | 441,378(0.01%)#1,244 |
| 22. | Bolingbrook | 30 | 4,025(0.75%)#22 | 441,378(0.01%)#1,308 |
| 23. | Highland Park | 29 | 4,025(0.72%)#23 | 441,378(0.01%)#1,327 |
| 24. | Mount Sterling | 29 | 4,025(0.72%)#24 | 441,378(0.01%)#1,338 |
| 25. | Lyons | 27 | 4,025(0.67%)#25 | 441,378(0.01%)#1,367 |
| 26. | Oak Park | 24 | 4,025(0.60%)#26 | 441,378(0.01%)#1,429 |
| 27. | Palatine | 23 | 4,025(0.57%)#27 | 441,378(0.01%)#1,451 |
| 28. | Beach Park | 23 | 4,025(0.57%)#28 | 441,378(0.01%)#1,466 |
| 29. | Hoffman Estates | 22 | 4,025(0.55%)#29 | 441,378(0.00%)#1,482 |
| 30. | Lindenhurst | 21 | 4,025(0.52%)#30 | 441,378(0.00%)#1,521 |
| 31. | Arlington Heights | 20 | 4,025(0.50%)#31 | 441,378(0.00%)#1,531 |
| 32. | Northlake | 19 | 4,025(0.47%)#32 | 441,378(0.00%)#1,574 |
| 33. | Berkeley | 18 | 4,025(0.45%)#33 | 441,378(0.00%)#1,617 |
| 34. | Coal City | 17 | 4,025(0.42%)#34 | 441,378(0.00%)#1,644 |
| 35. | Homer Glen | 15 | 4,025(0.37%)#35 | 441,378(0.00%)#1,698 |
| 36. | Marion | 15 | 4,025(0.37%)#36 | 441,378(0.00%)#1,705 |
| 37. | Summit | 15 | 4,025(0.37%)#37 | 441,378(0.00%)#1,712 |
| 38. | Lombard | 14 | 4,025(0.35%)#38 | 441,378(0.00%)#1,731 |
| 39. | Lake In The Hills | 14 | 4,025(0.35%)#39 | 441,378(0.00%)#1,737 |
| 40. | Mount Prospect | 13 | 4,025(0.32%)#40 | 441,378(0.00%)#1,766 |
| 41. | Oswego | 13 | 4,025(0.32%)#41 | 441,378(0.00%)#1,772 |
| 42. | West Dundee | 13 | 4,025(0.32%)#42 | 441,378(0.00%)#1,792 |
| 43. | Woodridge | 12 | 4,025(0.30%)#43 | 441,378(0.00%)#1,809 |
| 44. | Darien | 11 | 4,025(0.27%)#44 | 441,378(0.00%)#1,852 |
| 45. | Mchenry | 10 | 4,025(0.25%)#45 | 441,378(0.00%)#1,902 |
| 46. | Carlinville | 10 | 4,025(0.25%)#46 | 441,378(0.00%)#1,928 |
| 47. | Kirkwood | 10 | 4,025(0.25%)#47 | 441,378(0.00%)#1,942 |
| 48. | Broadview | 9 | 4,025(0.22%)#48 | 441,378(0.00%)#1,965 |
| 49. | Hainesville | 9 | 4,025(0.22%)#49 | 441,378(0.00%)#1,973 |
| 50. | Evanston | 8 | 4,025(0.20%)#50 | 441,378(0.00%)#1,987 |
| 51. | Montgomery | 8 | 4,025(0.20%)#51 | 441,378(0.00%)#2,002 |
| 52. | Evergreen Park | 8 | 4,025(0.20%)#52 | 441,378(0.00%)#2,003 |
| 53. | Milan | 8 | 4,025(0.20%)#53 | 441,378(0.00%)#2,017 |
| 54. | Sheridan | 8 | 4,025(0.20%)#54 | 441,378(0.00%)#2,023 |
| 55. | Peoria | 7 | 4,025(0.17%)#55 | 441,378(0.00%)#2,029 |
| 56. | Addison | 7 | 4,025(0.17%)#56 | 441,378(0.00%)#2,036 |
| 57. | Gurnee | 7 | 4,025(0.17%)#57 | 441,378(0.00%)#2,040 |
| 58. | Urbana | 6 | 4,025(0.15%)#58 | 441,378(0.00%)#2,090 |
| 59. | Rock Island | 6 | 4,025(0.15%)#59 | 441,378(0.00%)#2,091 |
| 60. | Rockdale | 6 | 4,025(0.15%)#60 | 441,378(0.00%)#2,111 |
| 61. | Elmhurst | 5 | 4,025(0.12%)#61 | 441,378(0.00%)#2,125 |
| 62. | Normal | 4 | 4,025(0.10%)#62 | 441,378(0.00%)#2,182 |
| 63. | Leland Grove | 3 | 4,025(0.07%)#63 | 441,378(0.00%)#2,243 |
| 64. | Meredosia | 3 | 4,025(0.07%)#64 | 441,378(0.00%)#2,247 |
| 65. | Naperville | 2 | 4,025(0.05%)#65 | 441,378(0.00%)#2,257 |
| 66. | Palos Heights | 2 | 4,025(0.05%)#66 | 441,378(0.00%)#2,267 |
| 67. | Forest View | 2 | 4,025(0.05%)#67 | 441,378(0.00%)#2,285 |
| 68. | Bellwood | 1 | 4,025(0.02%)#68 | 441,378(0.00%)#2,304 |
Common Questions
What are the Top 10 Cities with the Largest Nicaraguan Community in Illinois?
Top 10 Cities with the Largest Nicaraguan Community in Illinois are:
#1
953
#2
442
#3
174
#4
155
#5
153
#6
149
#7
117
#8
89
#9
78
#10
78
What city has the Largest Nicaraguan Community in Illinois?
Chicago has the Largest Nicaraguan Community in Illinois with 953.
What is the Total Nicaraguan Population in the State of Illinois?
Total Nicaraguan Population in Illinois is 4,025.
What is the Total Nicaraguan Population in the United States?
Total Nicaraguan Population in the United States is 441,378.