Cities with the Highest Percentage of Assyrian / Chaldean / Syriac Population in Illinois
RELATED REPORTS & OPTIONS
Assyrian / Chaldean / Syriac
Illinois
Compare Cities
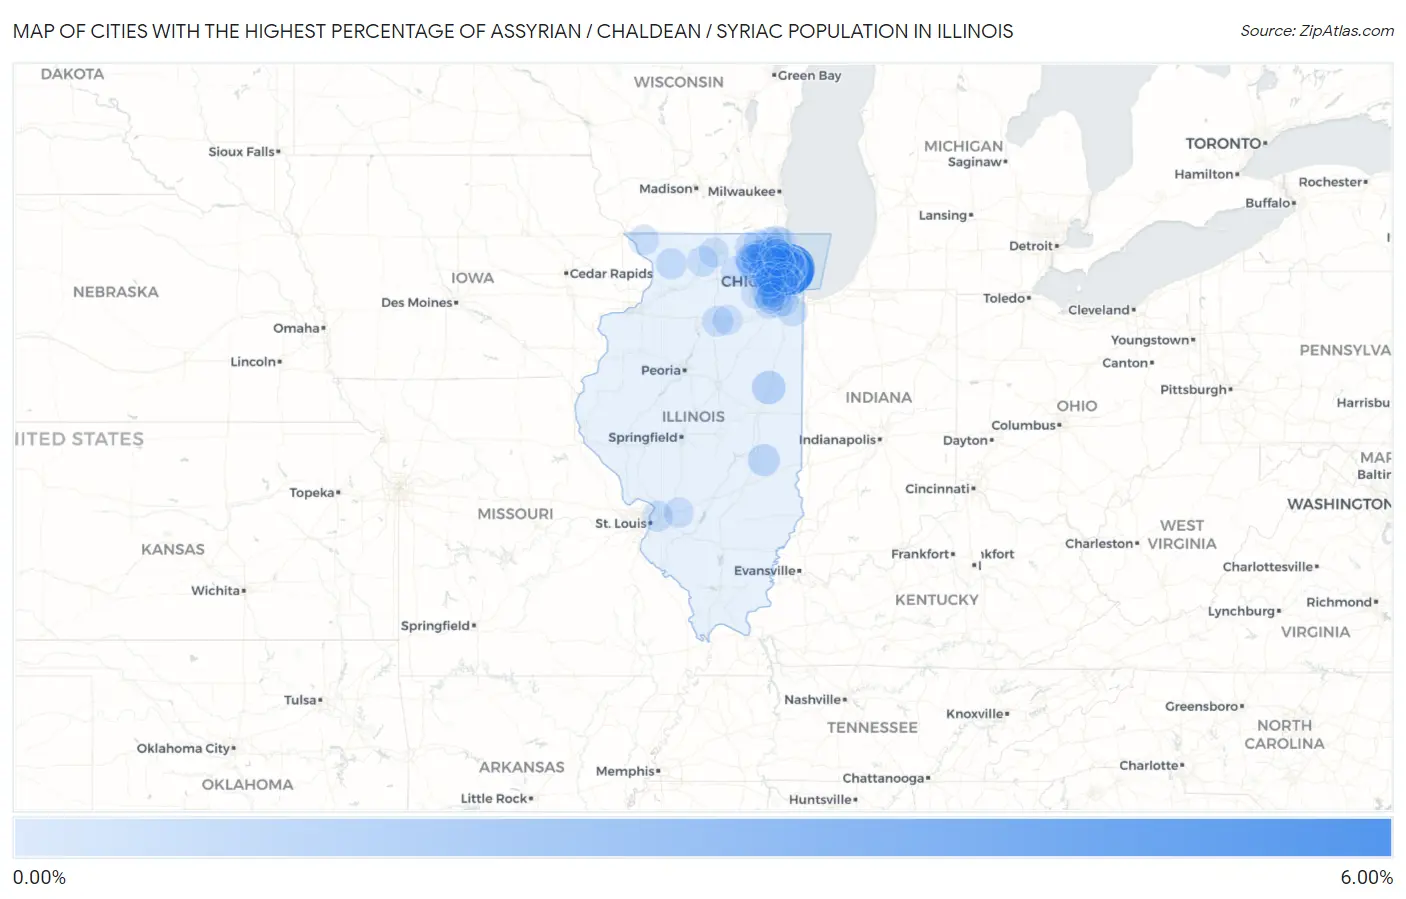
Map of Cities with the Highest Percentage of Assyrian / Chaldean / Syriac Population in Illinois
0.00%
6.00%
Cities with the Highest Percentage of Assyrian / Chaldean / Syriac Population in Illinois
| City | Assyrian / Chaldean / Syriac | vs State | vs National | |
| 1. | Skokie | 5.48% | 0.12%(+5.36)#1 | 0.029%(+5.45)#5 |
| 2. | Lincolnwood | 4.96% | 0.12%(+4.84)#2 | 0.029%(+4.93)#7 |
| 3. | Rosemont | 2.85% | 0.12%(+2.73)#3 | 0.029%(+2.82)#16 |
| 4. | Morton Grove | 2.68% | 0.12%(+2.56)#4 | 0.029%(+2.65)#17 |
| 5. | Niles | 2.56% | 0.12%(+2.45)#5 | 0.029%(+2.53)#18 |
| 6. | Gilberts | 1.36% | 0.12%(+1.24)#6 | 0.029%(+1.33)#36 |
| 7. | Roselle | 1.31% | 0.12%(+1.19)#7 | 0.029%(+1.28)#39 |
| 8. | Mount Prospect | 0.92% | 0.12%(+0.806)#8 | 0.029%(+0.893)#48 |
| 9. | Paxton | 0.90% | 0.12%(+0.783)#9 | 0.029%(+0.870)#50 |
| 10. | North Barrington | 0.90% | 0.12%(+0.782)#10 | 0.029%(+0.869)#51 |
| 11. | Hoffman Estates | 0.87% | 0.12%(+0.754)#11 | 0.029%(+0.841)#52 |
| 12. | Glenview | 0.76% | 0.12%(+0.646)#12 | 0.029%(+0.733)#57 |
| 13. | Franklin Park | 0.65% | 0.12%(+0.532)#13 | 0.029%(+0.619)#60 |
| 14. | Winfield | 0.55% | 0.12%(+0.437)#14 | 0.029%(+0.524)#72 |
| 15. | Park Ridge | 0.52% | 0.12%(+0.407)#15 | 0.029%(+0.494)#78 |
| 16. | Charleston | 0.52% | 0.12%(+0.407)#16 | 0.029%(+0.493)#79 |
| 17. | Northfield | 0.51% | 0.12%(+0.392)#17 | 0.029%(+0.479)#82 |
| 18. | Barrington Hills | 0.46% | 0.12%(+0.347)#18 | 0.029%(+0.434)#89 |
| 19. | Elk Grove Village | 0.45% | 0.12%(+0.336)#19 | 0.029%(+0.423)#92 |
| 20. | Des Plaines | 0.43% | 0.12%(+0.310)#20 | 0.029%(+0.397)#98 |
| 21. | Northbrook | 0.36% | 0.12%(+0.247)#21 | 0.029%(+0.334)#112 |
| 22. | Rolling Meadows | 0.35% | 0.12%(+0.233)#22 | 0.029%(+0.320)#113 |
| 23. | Harwood Heights | 0.29% | 0.12%(+0.175)#23 | 0.029%(+0.262)#123 |
| 24. | Arlington Heights | 0.28% | 0.12%(+0.168)#24 | 0.029%(+0.255)#125 |
| 25. | Libertyville | 0.28% | 0.12%(+0.161)#25 | 0.029%(+0.248)#128 |
| 26. | Buffalo Grove | 0.27% | 0.12%(+0.152)#26 | 0.029%(+0.239)#133 |
| 27. | Lake Zurich | 0.26% | 0.12%(+0.142)#27 | 0.029%(+0.229)#136 |
| 28. | Lanark | 0.26% | 0.12%(+0.142)#28 | 0.029%(+0.228)#138 |
| 29. | Wilmette | 0.25% | 0.12%(+0.136)#29 | 0.029%(+0.223)#141 |
| 30. | Bloomingdale | 0.22% | 0.12%(+0.102)#30 | 0.029%(+0.189)#151 |
| 31. | Pontoon Beach | 0.20% | 0.12%(+0.083)#31 | 0.029%(+0.170)#156 |
| 32. | Streamwood | 0.19% | 0.12%(+0.074)#32 | 0.029%(+0.160)#162 |
| 33. | Byron | 0.19% | 0.12%(+0.071)#33 | 0.029%(+0.158)#163 |
| 34. | Grandwood Park | 0.19% | 0.12%(+0.069)#34 | 0.029%(+0.156)#166 |
| 35. | North Utica | 0.18% | 0.12%(+0.060)#35 | 0.029%(+0.147)#173 |
| 36. | Lake In The Hills | 0.17% | 0.12%(+0.057)#36 | 0.029%(+0.144)#174 |
| 37. | Highland Park | 0.16% | 0.12%(+0.040)#37 | 0.029%(+0.126)#186 |
| 38. | Downers Grove | 0.15% | 0.12%(+0.038)#38 | 0.029%(+0.125)#188 |
| 39. | Norridge | 0.14% | 0.12%(+0.028)#39 | 0.029%(+0.115)#199 |
| 40. | Bartlett | 0.14% | 0.12%(+0.026)#40 | 0.029%(+0.113)#200 |
| 41. | Elgin | 0.14% | 0.12%(+0.022)#41 | 0.029%(+0.109)#202 |
| 42. | Schaumburg | 0.13% | 0.12%(+0.010)#42 | 0.029%(+0.097)#215 |
| 43. | The Galena Territory | 0.12% | 0.12%(+0.009)#43 | 0.029%(+0.095)#218 |
| 44. | Chicago | 0.11% | 0.12%(-0.005)#44 | 0.029%(+0.081)#228 |
| 45. | Brookfield | 0.11% | 0.12%(-0.007)#45 | 0.029%(+0.079)#231 |
| 46. | Huntley | 0.11% | 0.12%(-0.008)#46 | 0.029%(+0.079)#232 |
| 47. | Evanston | 0.10% | 0.12%(-0.011)#47 | 0.029%(+0.076)#237 |
| 48. | Sycamore | 0.10% | 0.12%(-0.011)#48 | 0.029%(+0.075)#238 |
| 49. | Riverwoods | 0.100% | 0.12%(-0.016)#49 | 0.029%(+0.071)#244 |
| 50. | Winnetka | 0.087% | 0.12%(-0.029)#50 | 0.029%(+0.058)#262 |
| 51. | Wood Dale | 0.086% | 0.12%(-0.030)#51 | 0.029%(+0.057)#263 |
| 52. | Lombard | 0.084% | 0.12%(-0.032)#52 | 0.029%(+0.055)#268 |
| 53. | Homer Glen | 0.082% | 0.12%(-0.034)#53 | 0.029%(+0.052)#274 |
| 54. | Highland | 0.078% | 0.12%(-0.038)#54 | 0.029%(+0.049)#279 |
| 55. | Deerfield | 0.078% | 0.12%(-0.038)#55 | 0.029%(+0.049)#280 |
| 56. | Cary | 0.073% | 0.12%(-0.043)#56 | 0.029%(+0.044)#290 |
| 57. | Round Lake Beach | 0.070% | 0.12%(-0.046)#57 | 0.029%(+0.041)#297 |
| 58. | Crest Hill | 0.065% | 0.12%(-0.051)#58 | 0.029%(+0.036)#305 |
| 59. | Mchenry | 0.062% | 0.12%(-0.054)#59 | 0.029%(+0.033)#310 |
| 60. | Woodstock | 0.061% | 0.12%(-0.055)#60 | 0.029%(+0.032)#311 |
| 61. | Bensenville | 0.059% | 0.12%(-0.057)#61 | 0.029%(+0.030)#313 |
| 62. | Glencoe | 0.057% | 0.12%(-0.059)#62 | 0.029%(+0.028)#318 |
| 63. | Prospect Heights | 0.057% | 0.12%(-0.059)#63 | 0.029%(+0.028)#320 |
| 64. | Addison | 0.053% | 0.12%(-0.063)#64 | 0.029%(+0.024)#330 |
| 65. | Waukegan | 0.053% | 0.12%(-0.063)#65 | 0.029%(+0.023)#331 |
| 66. | Park Forest | 0.052% | 0.12%(-0.064)#66 | 0.029%(+0.023)#332 |
| 67. | Glen Ellyn | 0.049% | 0.12%(-0.067)#67 | 0.029%(+0.020)#335 |
| 68. | Oak Park | 0.048% | 0.12%(-0.068)#68 | 0.029%(+0.019)#340 |
| 69. | Ottawa | 0.048% | 0.12%(-0.068)#69 | 0.029%(+0.019)#343 |
| 70. | Bolingbrook | 0.047% | 0.12%(-0.069)#70 | 0.029%(+0.018)#347 |
| 71. | Elmhurst | 0.042% | 0.12%(-0.074)#71 | 0.029%(+0.013)#365 |
| 72. | Naperville | 0.040% | 0.12%(-0.076)#72 | 0.029%(+0.010)#374 |
| 73. | La Grange Park | 0.038% | 0.12%(-0.079)#73 | 0.029%(+0.008)#383 |
| 74. | Boulder Hill | 0.031% | 0.12%(-0.085)#74 | 0.029%(+0.002)#397 |
| 75. | Algonquin | 0.030% | 0.12%(-0.086)#75 | 0.029%(+0.001)#399 |
| 76. | Mundelein | 0.028% | 0.12%(-0.088)#76 | 0.029%(-0.001)#406 |
| 77. | Carol Stream | 0.025% | 0.12%(-0.091)#77 | 0.029%(-0.004)#419 |
| 78. | Orland Park | 0.024% | 0.12%(-0.092)#78 | 0.029%(-0.005)#427 |
| 79. | Lemont | 0.023% | 0.12%(-0.093)#79 | 0.029%(-0.006)#436 |
| 80. | Palatine | 0.019% | 0.12%(-0.097)#80 | 0.029%(-0.010)#466 |
| 81. | Vernon Hills | 0.015% | 0.12%(-0.101)#81 | 0.029%(-0.014)#497 |
| 82. | Woodridge | 0.015% | 0.12%(-0.101)#82 | 0.029%(-0.014)#499 |
| 83. | Glendale Heights | 0.012% | 0.12%(-0.104)#83 | 0.029%(-0.017)#518 |
| 84. | Wheaton | 0.011% | 0.12%(-0.105)#84 | 0.029%(-0.018)#523 |
| 85. | Romeoville | 0.0100% | 0.12%(-0.106)#85 | 0.029%(-0.019)#532 |
| 86. | Elmwood Park | 0.0082% | 0.12%(-0.108)#86 | 0.029%(-0.021)#547 |
| 87. | Wheeling | 0.0077% | 0.12%(-0.108)#87 | 0.029%(-0.021)#549 |
| 88. | Rockford | 0.0040% | 0.12%(-0.112)#88 | 0.029%(-0.025)#582 |
Common Questions
What are the Top 10 Cities with the Highest Percentage of Assyrian / Chaldean / Syriac Population in Illinois?
Top 10 Cities with the Highest Percentage of Assyrian / Chaldean / Syriac Population in Illinois are:
#1
5.48%
#2
4.96%
#3
2.85%
#4
2.68%
#5
2.56%
#6
1.36%
#7
1.31%
#8
0.92%
#9
0.90%
#10
0.90%
What city has the Highest Percentage of Assyrian / Chaldean / Syriac Population in Illinois?
Skokie has the Highest Percentage of Assyrian / Chaldean / Syriac Population in Illinois with 5.48%.
What is the Percentage of Assyrian / Chaldean / Syriac Population in the State of Illinois?
Percentage of Assyrian / Chaldean / Syriac Population in Illinois is 0.12%.
What is the Percentage of Assyrian / Chaldean / Syriac Population in the United States?
Percentage of Assyrian / Chaldean / Syriac Population in the United States is 0.029%.