Cities with the Highest Percentage of Population Enrolled in College in Illinois
RELATED REPORTS & OPTIONS
College
Illinois
Compare Cities
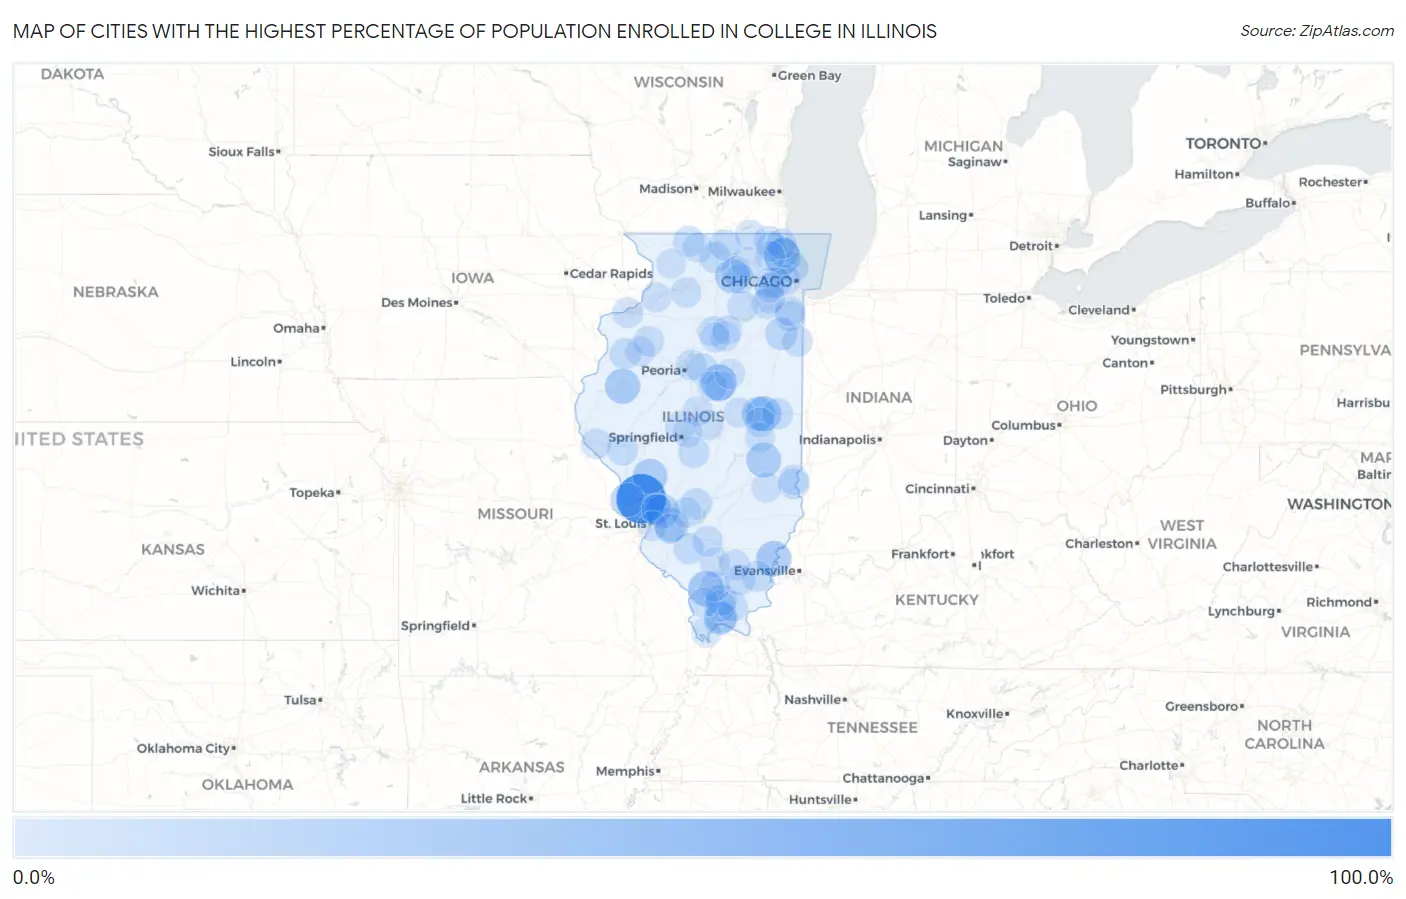
Map of Cities with the Highest Percentage of Population Enrolled in College in Illinois
0.0%
100.0%
Cities with the Highest Percentage of Population Enrolled in College in Illinois
| City | % in College | vs State | vs National | |
| 1. | Elsah | 83.5% | 5.1%(+78.4)#1 | 5.5%(+78.0)#58 |
| 2. | Janesville | 68.2% | 5.1%(+63.1)#2 | 5.5%(+62.7)#84 |
| 3. | Ridgefield | 31.8% | 5.1%(+26.7)#3 | 5.5%(+26.4)#278 |
| 4. | Bannockburn | 31.8% | 5.1%(+26.6)#4 | 5.5%(+26.3)#281 |
| 5. | Normal | 29.8% | 5.1%(+24.7)#5 | 5.5%(+24.4)#302 |
| 6. | Carbondale | 28.4% | 5.1%(+23.3)#6 | 5.5%(+22.9)#323 |
| 7. | Phillipstown | 27.1% | 5.1%(+22.0)#7 | 5.5%(+21.6)#361 |
| 8. | Urbana | 26.1% | 5.1%(+21.0)#8 | 5.5%(+20.7)#384 |
| 9. | Macomb | 26.0% | 5.1%(+20.9)#9 | 5.5%(+20.6)#386 |
| 10. | Rockbridge | 25.6% | 5.1%(+20.5)#10 | 5.5%(+20.1)#399 |
| 11. | Charleston | 25.0% | 5.1%(+19.9)#11 | 5.5%(+19.6)#410 |
| 12. | Dekalb | 23.5% | 5.1%(+18.4)#12 | 5.5%(+18.0)#443 |
| 13. | Lebanon | 23.1% | 5.1%(+17.9)#13 | 5.5%(+17.6)#455 |
| 14. | Edwardsville | 22.2% | 5.1%(+17.1)#14 | 5.5%(+16.8)#476 |
| 15. | Champaign | 21.7% | 5.1%(+16.6)#15 | 5.5%(+16.2)#492 |
| 16. | Brussels | 21.6% | 5.1%(+16.5)#16 | 5.5%(+16.2)#494 |
| 17. | Paloma | 18.3% | 5.1%(+13.1)#17 | 5.5%(+12.8)#627 |
| 18. | Karnak | 17.0% | 5.1%(+11.9)#18 | 5.5%(+11.5)#699 |
| 19. | Bourbonnais | 15.9% | 5.1%(+10.8)#19 | 5.5%(+10.4)#771 |
| 20. | Arbury Hills | 15.7% | 5.1%(+10.6)#20 | 5.5%(+10.3)#782 |
| 21. | Kings | 15.2% | 5.1%(+10.0)#21 | 5.5%(+9.70)#822 |
| 22. | Lockport Heights | 14.8% | 5.1%(+9.64)#22 | 5.5%(+9.29)#854 |
| 23. | Belknap | 14.5% | 5.1%(+9.38)#23 | 5.5%(+9.03)#884 |
| 24. | Trivoli | 12.6% | 5.1%(+7.53)#24 | 5.5%(+7.19)#1,090 |
| 25. | Osco | 12.6% | 5.1%(+7.49)#25 | 5.5%(+7.14)#1,099 |
| 26. | Evanston | 12.6% | 5.1%(+7.46)#26 | 5.5%(+7.11)#1,105 |
| 27. | New Milford | 12.1% | 5.1%(+7.00)#27 | 5.5%(+6.65)#1,162 |
| 28. | Timberlane | 12.0% | 5.1%(+6.88)#28 | 5.5%(+6.54)#1,178 |
| 29. | South Roxana | 11.9% | 5.1%(+6.80)#29 | 5.5%(+6.45)#1,197 |
| 30. | Buncombe | 11.7% | 5.1%(+6.58)#30 | 5.5%(+6.24)#1,243 |
| 31. | Greenville | 11.7% | 5.1%(+6.56)#31 | 5.5%(+6.21)#1,247 |
| 32. | Goreville | 11.5% | 5.1%(+6.38)#32 | 5.5%(+6.03)#1,280 |
| 33. | Bulpitt | 11.3% | 5.1%(+6.23)#33 | 5.5%(+5.88)#1,304 |
| 34. | Monmouth | 11.2% | 5.1%(+6.10)#34 | 5.5%(+5.75)#1,329 |
| 35. | Rest Haven | 11.1% | 5.1%(+6.00)#35 | 5.5%(+5.65)#1,338 |
| 36. | Detroit | 11.1% | 5.1%(+6.00)#36 | 5.5%(+5.65)#1,342 |
| 37. | Dakota | 11.1% | 5.1%(+5.94)#37 | 5.5%(+5.59)#1,352 |
| 38. | Ogden | 10.8% | 5.1%(+5.66)#38 | 5.5%(+5.32)#1,405 |
| 39. | Oakdale | 10.7% | 5.1%(+5.54)#39 | 5.5%(+5.19)#1,430 |
| 40. | West York | 10.5% | 5.1%(+5.41)#40 | 5.5%(+5.06)#1,462 |
| 41. | Galt | 10.5% | 5.1%(+5.41)#41 | 5.5%(+5.06)#1,464 |
| 42. | Eureka | 10.5% | 5.1%(+5.36)#42 | 5.5%(+5.02)#1,473 |
| 43. | Omaha | 10.3% | 5.1%(+5.23)#43 | 5.5%(+4.88)#1,513 |
| 44. | River Forest | 10.3% | 5.1%(+5.17)#44 | 5.5%(+4.82)#1,525 |
| 45. | Oneida | 10.0% | 5.1%(+4.89)#45 | 5.5%(+4.54)#1,591 |
| 46. | Pierron | 9.8% | 5.1%(+4.73)#46 | 5.5%(+4.38)#1,642 |
| 47. | Rock Island | 9.8% | 5.1%(+4.69)#47 | 5.5%(+4.34)#1,655 |
| 48. | Hopkins Park | 9.7% | 5.1%(+4.58)#48 | 5.5%(+4.24)#1,685 |
| 49. | Simpson | 9.6% | 5.1%(+4.50)#49 | 5.5%(+4.15)#1,706 |
| 50. | Newark | 9.6% | 5.1%(+4.48)#50 | 5.5%(+4.13)#1,717 |
| 51. | Hampshire | 9.6% | 5.1%(+4.45)#51 | 5.5%(+4.10)#1,729 |
| 52. | Lake Forest | 9.5% | 5.1%(+4.43)#52 | 5.5%(+4.08)#1,743 |
| 53. | Macedonia | 9.5% | 5.1%(+4.41)#53 | 5.5%(+4.06)#1,753 |
| 54. | Germantown Hills | 9.5% | 5.1%(+4.38)#54 | 5.5%(+4.03)#1,758 |
| 55. | Kinderhook | 9.3% | 5.1%(+4.17)#55 | 5.5%(+3.82)#1,826 |
| 56. | Wheaton | 9.3% | 5.1%(+4.15)#56 | 5.5%(+3.80)#1,839 |
| 57. | Richview | 9.3% | 5.1%(+4.14)#57 | 5.5%(+3.80)#1,841 |
| 58. | Galatia | 9.3% | 5.1%(+4.14)#58 | 5.5%(+3.79)#1,845 |
| 59. | Monee | 9.2% | 5.1%(+4.12)#59 | 5.5%(+3.78)#1,855 |
| 60. | Harmon | 9.2% | 5.1%(+4.10)#60 | 5.5%(+3.75)#1,865 |
| 61. | Round Lake Heights | 8.7% | 5.1%(+3.59)#61 | 5.5%(+3.25)#2,077 |
| 62. | Cantrall | 8.7% | 5.1%(+3.58)#62 | 5.5%(+3.23)#2,095 |
| 63. | Oakbrook Terrace | 8.6% | 5.1%(+3.48)#63 | 5.5%(+3.13)#2,124 |
| 64. | Crainville | 8.6% | 5.1%(+3.48)#64 | 5.5%(+3.13)#2,126 |
| 65. | Bloomington | 8.6% | 5.1%(+3.44)#65 | 5.5%(+3.09)#2,144 |
| 66. | Crystal Lawns | 8.5% | 5.1%(+3.35)#66 | 5.5%(+3.00)#2,186 |
| 67. | Latham | 8.2% | 5.1%(+3.12)#67 | 5.5%(+2.78)#2,311 |
| 68. | Richton Park | 8.2% | 5.1%(+3.07)#68 | 5.5%(+2.72)#2,348 |
| 69. | Lincoln | 8.2% | 5.1%(+3.05)#69 | 5.5%(+2.70)#2,361 |
| 70. | Hebron | 8.1% | 5.1%(+2.98)#70 | 5.5%(+2.64)#2,395 |
| 71. | Round Lake Park | 8.1% | 5.1%(+2.98)#71 | 5.5%(+2.63)#2,396 |
| 72. | Hartford | 8.1% | 5.1%(+2.94)#72 | 5.5%(+2.59)#2,421 |
| 73. | Rockport | 8.0% | 5.1%(+2.93)#73 | 5.5%(+2.58)#2,426 |
| 74. | Tonica | 7.9% | 5.1%(+2.83)#74 | 5.5%(+2.49)#2,500 |
| 75. | Park City | 7.9% | 5.1%(+2.82)#75 | 5.5%(+2.47)#2,520 |
| 76. | Romeoville | 7.9% | 5.1%(+2.75)#76 | 5.5%(+2.40)#2,565 |
| 77. | Galesburg | 7.8% | 5.1%(+2.72)#77 | 5.5%(+2.38)#2,589 |
| 78. | Cobden | 7.8% | 5.1%(+2.66)#78 | 5.5%(+2.31)#2,631 |
| 79. | Pecatonica | 7.7% | 5.1%(+2.63)#79 | 5.5%(+2.28)#2,644 |
| 80. | Mounds | 7.6% | 5.1%(+2.52)#80 | 5.5%(+2.17)#2,725 |
| 81. | West Union | 7.6% | 5.1%(+2.50)#81 | 5.5%(+2.15)#2,737 |
| 82. | Sauget | 7.6% | 5.1%(+2.46)#82 | 5.5%(+2.11)#2,768 |
| 83. | De Land | 7.6% | 5.1%(+2.44)#83 | 5.5%(+2.10)#2,783 |
| 84. | Lake Zurich | 7.5% | 5.1%(+2.42)#84 | 5.5%(+2.08)#2,807 |
| 85. | Sesser | 7.5% | 5.1%(+2.39)#85 | 5.5%(+2.04)#2,836 |
| 86. | Rose Hill | 7.5% | 5.1%(+2.39)#86 | 5.5%(+2.04)#2,846 |
| 87. | Tuscola | 7.5% | 5.1%(+2.36)#87 | 5.5%(+2.01)#2,871 |
| 88. | Spaulding | 7.4% | 5.1%(+2.27)#88 | 5.5%(+1.92)#2,956 |
| 89. | Erie | 7.4% | 5.1%(+2.26)#89 | 5.5%(+1.91)#2,962 |
| 90. | Kangley | 7.3% | 5.1%(+2.21)#90 | 5.5%(+1.87)#3,007 |
| 91. | Lanark | 7.3% | 5.1%(+2.19)#91 | 5.5%(+1.85)#3,033 |
| 92. | Twin Grove | 7.3% | 5.1%(+2.18)#92 | 5.5%(+1.84)#3,045 |
| 93. | Scott Afb | 7.3% | 5.1%(+2.17)#93 | 5.5%(+1.82)#3,058 |
| 94. | Lexington | 7.2% | 5.1%(+2.10)#94 | 5.5%(+1.75)#3,110 |
| 95. | Grand Ridge | 7.2% | 5.1%(+2.09)#95 | 5.5%(+1.74)#3,120 |
| 96. | Tolono | 7.2% | 5.1%(+2.08)#96 | 5.5%(+1.73)#3,131 |
| 97. | Maple Park | 7.2% | 5.1%(+2.05)#97 | 5.5%(+1.70)#3,157 |
| 98. | Sycamore | 7.1% | 5.1%(+2.03)#98 | 5.5%(+1.69)#3,173 |
| 99. | Lostant | 7.1% | 5.1%(+2.03)#99 | 5.5%(+1.68)#3,178 |
| 100. | Lisle | 7.1% | 5.1%(+2.03)#100 | 5.5%(+1.68)#3,187 |
Common Questions
What are the Top 10 Cities with the Highest Percentage of Population Enrolled in College in Illinois?
Top 10 Cities with the Highest Percentage of Population Enrolled in College in Illinois are:
#1
83.5%
#2
31.8%
#3
29.8%
#4
28.4%
#5
27.1%
#6
26.1%
#7
26.0%
#8
25.6%
#9
25.0%
#10
23.5%
What city has the Highest Percentage of Population Enrolled in College in Illinois?
Elsah has the Highest Percentage of Population Enrolled in College in Illinois with 83.5%.
What is the Percentage of Population Enrolled in College in the State of Illinois?
Percentage of Population Enrolled in College in Illinois is 5.1%.
What is the Percentage of Population Enrolled in College in the United States?
Percentage of Population Enrolled in College in the United States is 5.5%.