Cities with the Largest Luxembourger Community in Iowa
RELATED REPORTS & OPTIONS
Luxembourger
Iowa
Compare Cities
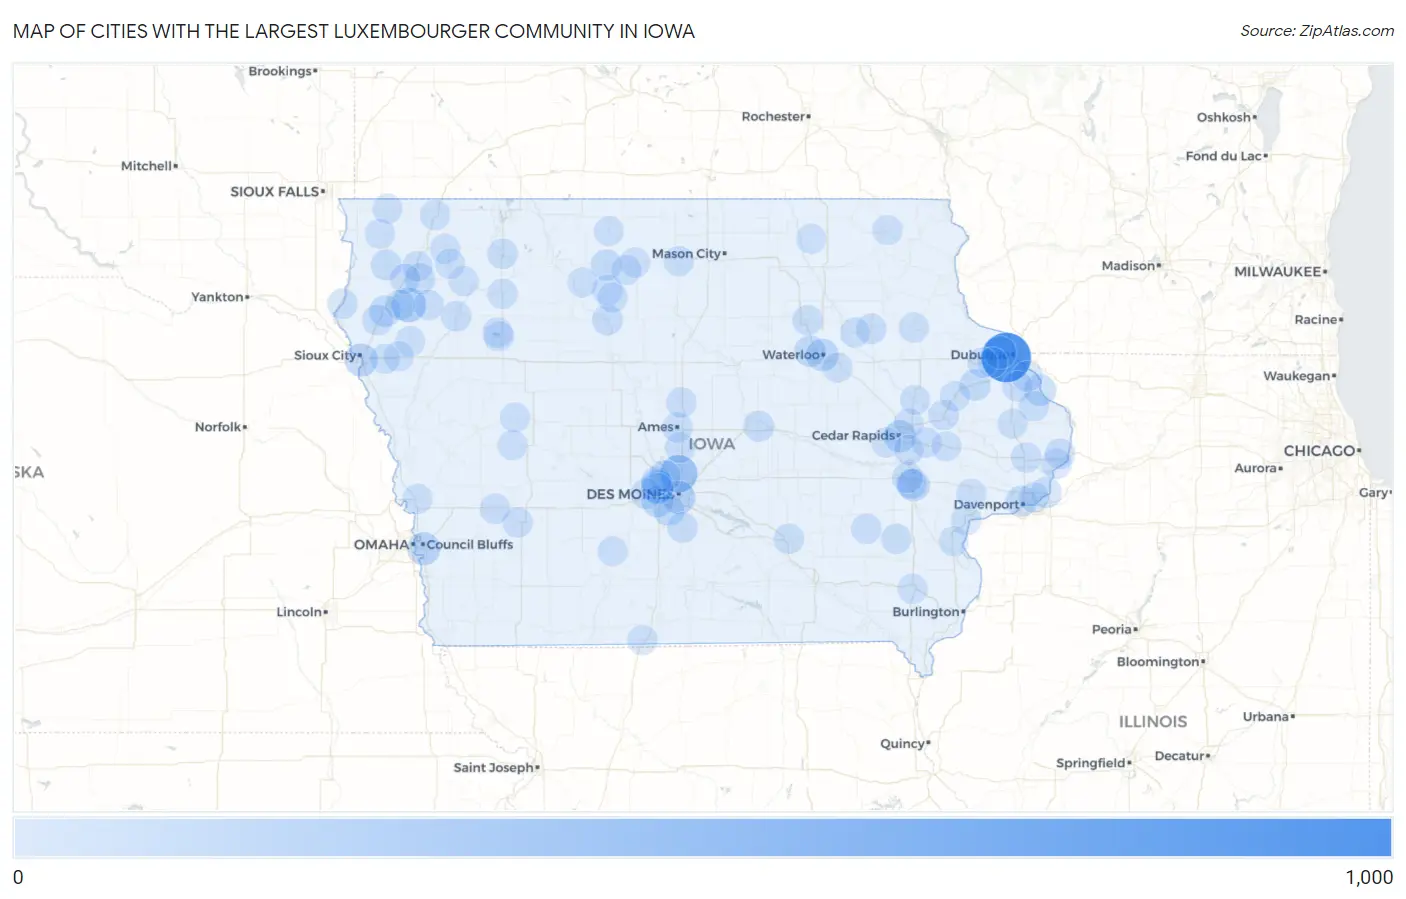
Map of Cities with the Largest Luxembourger Community in Iowa
0
1,000
Cities with the Largest Luxembourger Community in Iowa
| City | Luxembourger | vs State | vs National | |
| 1. | Dubuque | 830 | 5,295(15.68%)#1 | 42,059(1.97%)#1 |
| 2. | Ankeny | 298 | 5,295(5.63%)#2 | 42,059(0.71%)#10 |
| 3. | Remsen | 182 | 5,295(3.44%)#3 | 42,059(0.43%)#21 |
| 4. | Des Moines | 128 | 5,295(2.42%)#4 | 42,059(0.30%)#30 |
| 5. | Urbandale | 123 | 5,295(2.32%)#5 | 42,059(0.29%)#36 |
| 6. | Council Bluffs | 118 | 5,295(2.23%)#6 | 42,059(0.28%)#39 |
| 7. | Sioux City | 117 | 5,295(2.21%)#7 | 42,059(0.28%)#40 |
| 8. | Asbury | 105 | 5,295(1.98%)#8 | 42,059(0.25%)#49 |
| 9. | Waterloo | 95 | 5,295(1.79%)#9 | 42,059(0.23%)#54 |
| 10. | Cedar Rapids | 91 | 5,295(1.72%)#10 | 42,059(0.22%)#57 |
| 11. | Iowa City | 86 | 5,295(1.62%)#11 | 42,059(0.20%)#60 |
| 12. | West Des Moines | 77 | 5,295(1.45%)#12 | 42,059(0.18%)#71 |
| 13. | Bellevue | 70 | 5,295(1.32%)#13 | 42,059(0.17%)#81 |
| 14. | Johnston | 67 | 5,295(1.27%)#14 | 42,059(0.16%)#88 |
| 15. | Norwalk | 60 | 5,295(1.13%)#15 | 42,059(0.14%)#105 |
| 16. | Clive | 59 | 5,295(1.11%)#16 | 42,059(0.14%)#109 |
| 17. | Le Mars | 59 | 5,295(1.11%)#17 | 42,059(0.14%)#110 |
| 18. | Cascade | 56 | 5,295(1.06%)#18 | 42,059(0.13%)#120 |
| 19. | Cedar Falls | 54 | 5,295(1.02%)#19 | 42,059(0.13%)#126 |
| 20. | Davenport | 48 | 5,295(0.91%)#20 | 42,059(0.11%)#148 |
| 21. | Algona | 41 | 5,295(0.77%)#21 | 42,059(0.10%)#180 |
| 22. | Le Claire | 36 | 5,295(0.68%)#22 | 42,059(0.09%)#218 |
| 23. | Sioux Center | 35 | 5,295(0.66%)#23 | 42,059(0.08%)#224 |
| 24. | Merrill | 33 | 5,295(0.62%)#24 | 42,059(0.08%)#241 |
| 25. | Waukee | 32 | 5,295(0.60%)#25 | 42,059(0.08%)#248 |
| 26. | Coralville | 32 | 5,295(0.60%)#26 | 42,059(0.08%)#250 |
| 27. | St Donatus | 32 | 5,295(0.60%)#27 | 42,059(0.08%)#253 |
| 28. | Marshalltown | 31 | 5,295(0.59%)#28 | 42,059(0.07%)#262 |
| 29. | Granville | 31 | 5,295(0.59%)#29 | 42,059(0.07%)#265 |
| 30. | Humboldt | 30 | 5,295(0.57%)#30 | 42,059(0.07%)#274 |
| 31. | Indianola | 23 | 5,295(0.43%)#31 | 42,059(0.05%)#349 |
| 32. | Anamosa | 22 | 5,295(0.42%)#32 | 42,059(0.05%)#367 |
| 33. | Huxley | 22 | 5,295(0.42%)#33 | 42,059(0.05%)#368 |
| 34. | La Motte | 21 | 5,295(0.40%)#34 | 42,059(0.05%)#385 |
| 35. | Cherokee | 20 | 5,295(0.38%)#35 | 42,059(0.05%)#405 |
| 36. | Camanche | 20 | 5,295(0.38%)#36 | 42,059(0.05%)#406 |
| 37. | Oelwein | 18 | 5,295(0.34%)#37 | 42,059(0.04%)#455 |
| 38. | Hospers | 18 | 5,295(0.34%)#38 | 42,059(0.04%)#459 |
| 39. | St Joseph | 18 | 5,295(0.34%)#39 | 42,059(0.04%)#460 |
| 40. | Bettendorf | 16 | 5,295(0.30%)#40 | 42,059(0.04%)#490 |
| 41. | Ames | 15 | 5,295(0.28%)#41 | 42,059(0.04%)#514 |
| 42. | Story City | 15 | 5,295(0.28%)#42 | 42,059(0.04%)#544 |
| 43. | Marcus | 15 | 5,295(0.28%)#43 | 42,059(0.04%)#547 |
| 44. | Keota | 15 | 5,295(0.28%)#44 | 42,059(0.04%)#548 |
| 45. | Muscatine | 14 | 5,295(0.26%)#45 | 42,059(0.03%)#568 |
| 46. | Spencer | 14 | 5,295(0.26%)#46 | 42,059(0.03%)#580 |
| 47. | Waverly | 13 | 5,295(0.25%)#47 | 42,059(0.03%)#619 |
| 48. | Washington | 13 | 5,295(0.25%)#48 | 42,059(0.03%)#623 |
| 49. | Dewitt | 13 | 5,295(0.25%)#49 | 42,059(0.03%)#627 |
| 50. | Akron | 13 | 5,295(0.25%)#50 | 42,059(0.03%)#636 |
| 51. | Atlantic | 12 | 5,295(0.23%)#51 | 42,059(0.03%)#668 |
| 52. | Clinton | 11 | 5,295(0.21%)#52 | 42,059(0.03%)#691 |
| 53. | Oskaloosa | 11 | 5,295(0.21%)#53 | 42,059(0.03%)#705 |
| 54. | Storm Lake | 11 | 5,295(0.21%)#54 | 42,059(0.03%)#707 |
| 55. | Mount Vernon | 11 | 5,295(0.21%)#55 | 42,059(0.03%)#715 |
| 56. | University Heights | 11 | 5,295(0.21%)#56 | 42,059(0.03%)#719 |
| 57. | Garner | 10 | 5,295(0.19%)#57 | 42,059(0.02%)#755 |
| 58. | Epworth | 10 | 5,295(0.19%)#58 | 42,059(0.02%)#758 |
| 59. | Alton | 10 | 5,295(0.19%)#59 | 42,059(0.02%)#761 |
| 60. | Walnut | 10 | 5,295(0.19%)#60 | 42,059(0.02%)#764 |
| 61. | Springbrook | 10 | 5,295(0.19%)#61 | 42,059(0.02%)#767 |
| 62. | Sibley | 9 | 5,295(0.17%)#62 | 42,059(0.02%)#809 |
| 63. | Missouri Valley | 9 | 5,295(0.17%)#63 | 42,059(0.02%)#810 |
| 64. | Oyens | 9 | 5,295(0.17%)#64 | 42,059(0.02%)#816 |
| 65. | Grimes | 8 | 5,295(0.15%)#65 | 42,059(0.02%)#854 |
| 66. | Monticello | 8 | 5,295(0.15%)#66 | 42,059(0.02%)#866 |
| 67. | Wilton | 8 | 5,295(0.15%)#67 | 42,059(0.02%)#871 |
| 68. | Marion | 7 | 5,295(0.13%)#68 | 42,059(0.02%)#894 |
| 69. | Fairfax | 7 | 5,295(0.13%)#69 | 42,059(0.02%)#918 |
| 70. | Kingsley | 7 | 5,295(0.13%)#70 | 42,059(0.02%)#923 |
| 71. | Decorah | 6 | 5,295(0.11%)#71 | 42,059(0.01%)#959 |
| 72. | Maquoketa | 6 | 5,295(0.11%)#72 | 42,059(0.01%)#961 |
| 73. | Peosta | 6 | 5,295(0.11%)#73 | 42,059(0.01%)#971 |
| 74. | West Bend | 6 | 5,295(0.11%)#74 | 42,059(0.01%)#978 |
| 75. | Lakeside | 6 | 5,295(0.11%)#75 | 42,059(0.01%)#982 |
| 76. | Livermore | 6 | 5,295(0.11%)#76 | 42,059(0.01%)#986 |
| 77. | Mount Pleasant | 5 | 5,295(0.09%)#77 | 42,059(0.01%)#1,016 |
| 78. | Lamoni | 5 | 5,295(0.09%)#78 | 42,059(0.01%)#1,031 |
| 79. | Ely | 5 | 5,295(0.09%)#79 | 42,059(0.01%)#1,032 |
| 80. | Strawberry Point | 5 | 5,295(0.09%)#80 | 42,059(0.01%)#1,039 |
| 81. | Sioux Rapids | 5 | 5,295(0.09%)#81 | 42,059(0.01%)#1,042 |
| 82. | Elma | 5 | 5,295(0.09%)#82 | 42,059(0.01%)#1,047 |
| 83. | Doon | 5 | 5,295(0.09%)#83 | 42,059(0.01%)#1,048 |
| 84. | Sutherland | 5 | 5,295(0.09%)#84 | 42,059(0.01%)#1,049 |
| 85. | Wesley | 5 | 5,295(0.09%)#85 | 42,059(0.01%)#1,050 |
| 86. | Moville | 4 | 5,295(0.08%)#86 | 42,059(0.01%)#1,093 |
| 87. | Sanborn | 4 | 5,295(0.08%)#87 | 42,059(0.01%)#1,095 |
| 88. | Grandview | 4 | 5,295(0.08%)#88 | 42,059(0.01%)#1,117 |
| 89. | Macksburg | 4 | 5,295(0.08%)#89 | 42,059(0.01%)#1,122 |
| 90. | St Benedict | 4 | 5,295(0.08%)#90 | 42,059(0.01%)#1,124 |
| 91. | Rock Rapids | 3 | 5,295(0.06%)#91 | 42,059(0.01%)#1,140 |
| 92. | Fairbank | 3 | 5,295(0.06%)#92 | 42,059(0.01%)#1,149 |
| 93. | Manning | 3 | 5,295(0.06%)#93 | 42,059(0.01%)#1,151 |
| 94. | Central City | 3 | 5,295(0.06%)#94 | 42,059(0.01%)#1,163 |
| 95. | Lawton | 3 | 5,295(0.06%)#95 | 42,059(0.01%)#1,167 |
| 96. | Mechanicsville | 3 | 5,295(0.06%)#96 | 42,059(0.01%)#1,170 |
| 97. | Arcadia | 3 | 5,295(0.06%)#97 | 42,059(0.01%)#1,171 |
| 98. | Primghar | 3 | 5,295(0.06%)#98 | 42,059(0.01%)#1,172 |
| 99. | Gilbertville | 3 | 5,295(0.06%)#99 | 42,059(0.01%)#1,179 |
| 100. | Bancroft | 3 | 5,295(0.06%)#100 | 42,059(0.01%)#1,183 |
Common Questions
What are the Top 10 Cities with the Largest Luxembourger Community in Iowa?
Top 10 Cities with the Largest Luxembourger Community in Iowa are:
#1
830
#2
298
#3
182
#4
128
#5
123
#6
118
#7
117
#8
105
#9
95
#10
91
What city has the Largest Luxembourger Community in Iowa?
Dubuque has the Largest Luxembourger Community in Iowa with 830.
What is the Total Luxembourger Population in the State of Iowa?
Total Luxembourger Population in Iowa is 5,295.
What is the Total Luxembourger Population in the United States?
Total Luxembourger Population in the United States is 42,059.