Montebello, NY Map & Demographics
Montebello Map
Montebello Overview
$61,032
PER CAPITA INCOME
$172,125
AVG FAMILY INCOME
$144,167
AVG HOUSEHOLD INCOME
12.1%
WAGE / INCOME GAP [ % ]
87.9¢/ $1
WAGE / INCOME GAP [ $ ]
0.44
INEQUALITY / GINI INDEX
4,645
TOTAL POPULATION
2,222
MALE POPULATION
2,423
FEMALE POPULATION
91.70
MALES / 100 FEMALES
109.05
FEMALES / 100 MALES
37.6
MEDIAN AGE
3.6
AVG FAMILY SIZE
3.0
AVG HOUSEHOLD SIZE
2,284
LABOR FORCE [ PEOPLE ]
65.1%
PERCENT IN LABOR FORCE
7.1%
UNEMPLOYMENT RATE
Montebello Area Codes
Income in Montebello
Income Overview in Montebello
Per Capita Income in Montebello is $61,032, while median incomes of families and households are $172,125 and $144,167 respectively.
| Characteristic | Number | Measure |
| Per Capita Income | 4,645 | $61,032 |
| Median Family Income | 1,172 | $172,125 |
| Mean Family Income | 1,172 | $208,793 |
| Median Household Income | 1,560 | $144,167 |
| Mean Household Income | 1,560 | $180,821 |
| Income Deficit | 1,172 | $0 |
| Wage / Income Gap (%) | 4,645 | 12.06% |
| Wage / Income Gap ($) | 4,645 | 87.94¢ per $1 |
| Gini / Inequality Index | 4,645 | 0.44 |
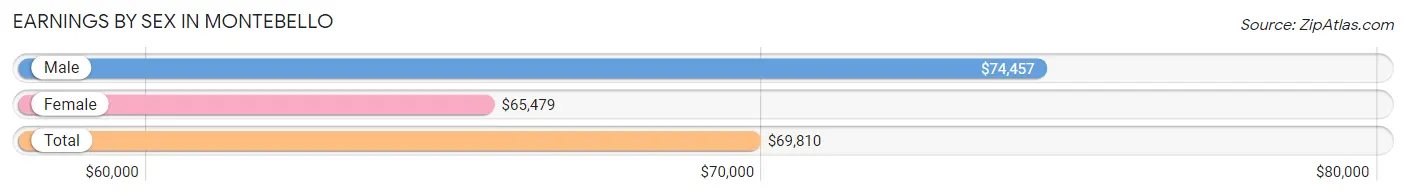
Earnings by Sex in Montebello
Average Earnings in Montebello are $69,810, $74,457 for men and $65,479 for women, a difference of 12.1%.
| Sex | Number | Average Earnings |
| Male | 1,214 (52.1%) | $74,457 |
| Female | 1,116 (47.9%) | $65,479 |
| Total | 2,330 (100.0%) | $69,810 |
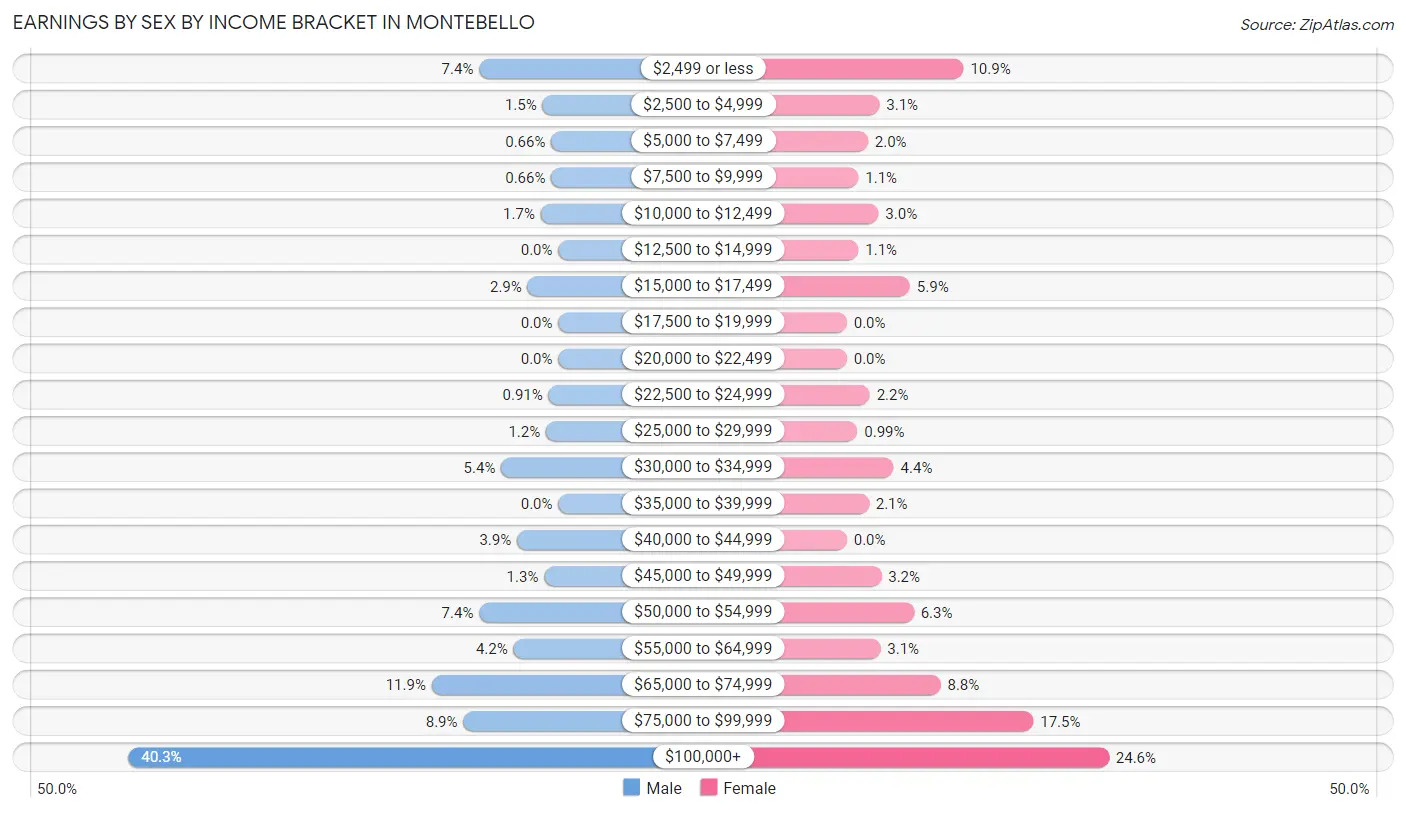
Earnings by Sex by Income Bracket in Montebello
The most common earnings brackets in Montebello are $100,000+ for men (489 | 40.3%) and $100,000+ for women (274 | 24.5%).
| Income | Male | Female |
| $2,499 or less | 90 (7.4%) | 122 (10.9%) |
| $2,500 to $4,999 | 18 (1.5%) | 34 (3.0%) |
| $5,000 to $7,499 | 8 (0.7%) | 22 (2.0%) |
| $7,500 to $9,999 | 8 (0.7%) | 12 (1.1%) |
| $10,000 to $12,499 | 20 (1.7%) | 33 (3.0%) |
| $12,500 to $14,999 | 0 (0.0%) | 12 (1.1%) |
| $15,000 to $17,499 | 35 (2.9%) | 66 (5.9%) |
| $17,500 to $19,999 | 0 (0.0%) | 0 (0.0%) |
| $20,000 to $22,499 | 0 (0.0%) | 0 (0.0%) |
| $22,500 to $24,999 | 11 (0.9%) | 24 (2.1%) |
| $25,000 to $29,999 | 14 (1.1%) | 11 (1.0%) |
| $30,000 to $34,999 | 65 (5.3%) | 49 (4.4%) |
| $35,000 to $39,999 | 0 (0.0%) | 23 (2.1%) |
| $40,000 to $44,999 | 47 (3.9%) | 0 (0.0%) |
| $45,000 to $49,999 | 16 (1.3%) | 36 (3.2%) |
| $50,000 to $54,999 | 90 (7.4%) | 70 (6.3%) |
| $55,000 to $64,999 | 51 (4.2%) | 35 (3.1%) |
| $65,000 to $74,999 | 144 (11.9%) | 98 (8.8%) |
| $75,000 to $99,999 | 108 (8.9%) | 195 (17.5%) |
| $100,000+ | 489 (40.3%) | 274 (24.5%) |
| Total | 1,214 (100.0%) | 1,116 (100.0%) |
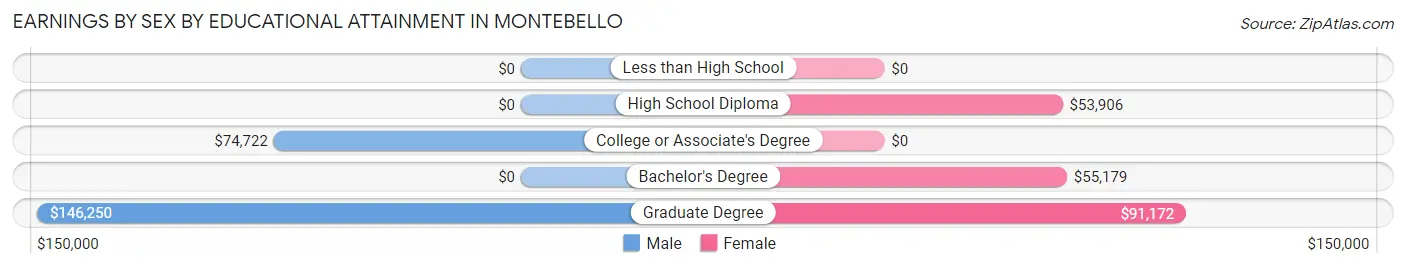
Earnings by Sex by Educational Attainment in Montebello
Average earnings in Montebello are $97,841 for men and $80,429 for women, a difference of 17.8%. Men with an educational attainment of graduate degree enjoy the highest average annual earnings of $146,250, while those with college or associate's degree education earn the least with $74,722. Women with an educational attainment of graduate degree earn the most with the average annual earnings of $91,172, while those with high school diploma education have the smallest earnings of $53,906.
| Educational Attainment | Male Income | Female Income |
| Less than High School | - | - |
| High School Diploma | - | - |
| College or Associate's Degree | $74,722 | $0 |
| Bachelor's Degree | - | - |
| Graduate Degree | $146,250 | $91,172 |
| Total | $97,841 | $80,429 |
Family Income in Montebello
Family Income Brackets in Montebello
According to the Montebello family income data, there are 452 families falling into the $200,000+ income range, which is the most common income bracket and makes up 38.6% of all families.
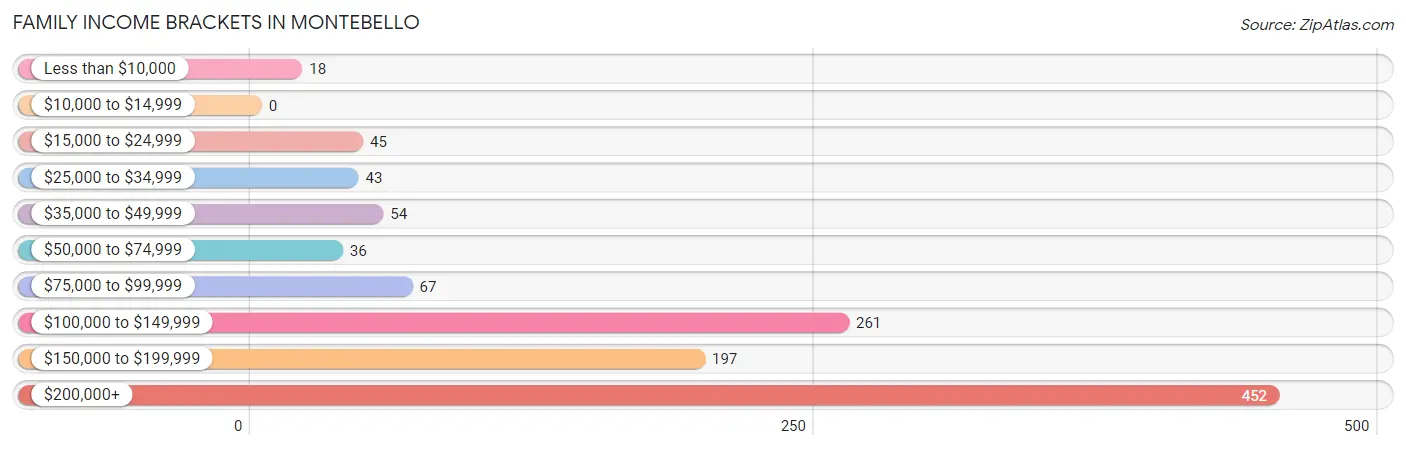
| Income Bracket | # Families | % Families |
| Less than $10,000 | 18 | 1.5% |
| $10,000 to $14,999 | 0 | 0.0% |
| $15,000 to $24,999 | 45 | 3.8% |
| $25,000 to $34,999 | 43 | 3.7% |
| $35,000 to $49,999 | 54 | 4.6% |
| $50,000 to $74,999 | 36 | 3.1% |
| $75,000 to $99,999 | 67 | 5.7% |
| $100,000 to $149,999 | 261 | 22.3% |
| $150,000 to $199,999 | 197 | 16.8% |
| $200,000+ | 452 | 38.6% |
Family Income by Famaliy Size in Montebello
3-person families (397 | 33.9%) account for the highest median family income in Montebello with $198,125 per family, while 2-person families (285 | 24.3%) have the highest median income of $77,402 per family member.
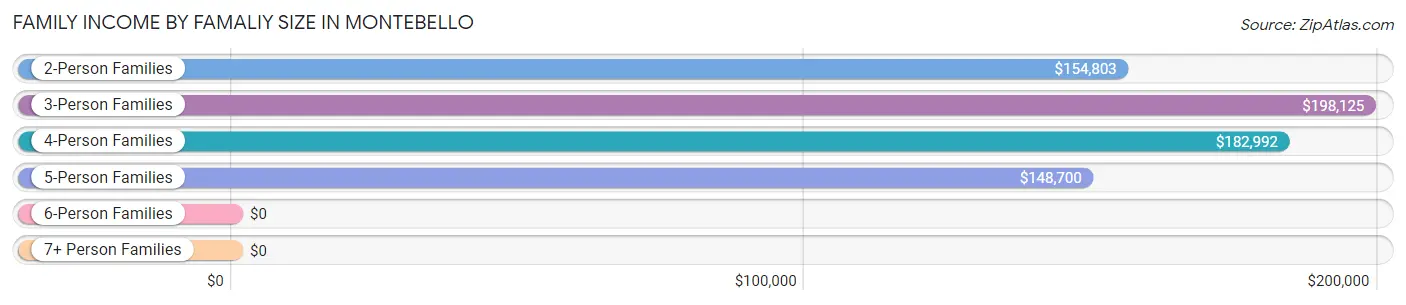
| Income Bracket | # Families | Median Income |
| 2-Person Families | 285 (24.3%) | $154,803 |
| 3-Person Families | 397 (33.9%) | $198,125 |
| 4-Person Families | 327 (27.9%) | $182,992 |
| 5-Person Families | 92 (7.9%) | $148,700 |
| 6-Person Families | 24 (2.1%) | $0 |
| 7+ Person Families | 47 (4.0%) | $0 |
| Total | 1,172 (100.0%) | $172,125 |
Family Income by Number of Earners in Montebello
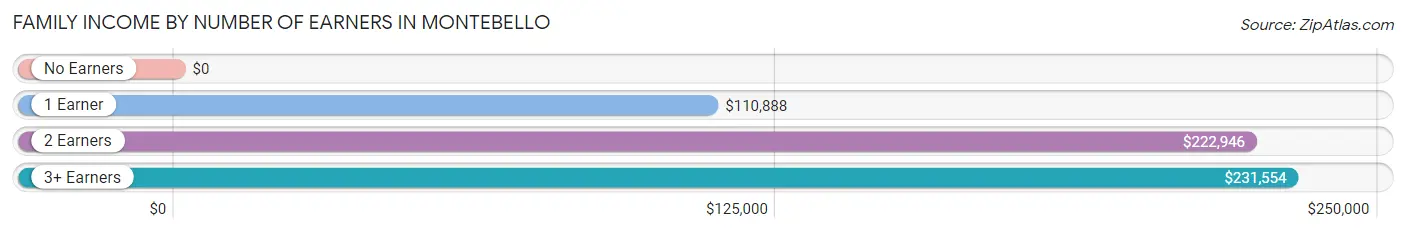
| Number of Earners | # Families | Median Income |
| No Earners | 133 (11.4%) | $0 |
| 1 Earner | 422 (36.0%) | $110,888 |
| 2 Earners | 387 (33.0%) | $222,946 |
| 3+ Earners | 230 (19.6%) | $231,554 |
| Total | 1,172 (100.0%) | $172,125 |
Household Income in Montebello
Household Income Brackets in Montebello
With 502 households falling in the category, the $200,000+ income range is the most frequent in Montebello, accounting for 32.2% of all households.
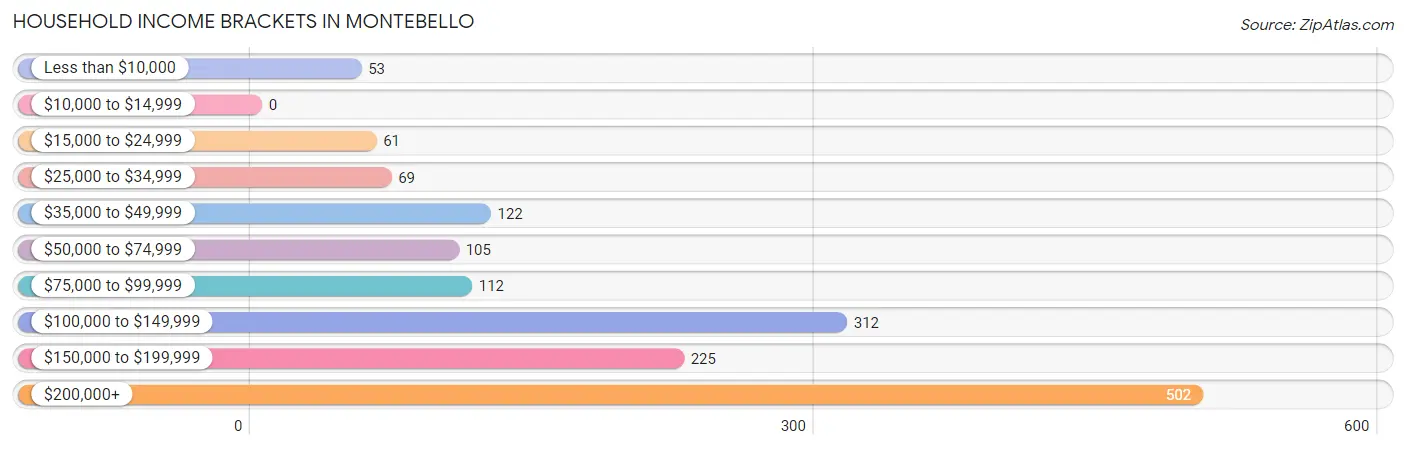
| Income Bracket | # Households | % Households |
| Less than $10,000 | 53 | 3.4% |
| $10,000 to $14,999 | 0 | 0.0% |
| $15,000 to $24,999 | 61 | 3.9% |
| $25,000 to $34,999 | 69 | 4.4% |
| $35,000 to $49,999 | 122 | 7.8% |
| $50,000 to $74,999 | 105 | 6.7% |
| $75,000 to $99,999 | 112 | 7.2% |
| $100,000 to $149,999 | 312 | 20.0% |
| $150,000 to $199,999 | 225 | 14.4% |
| $200,000+ | 502 | 32.2% |
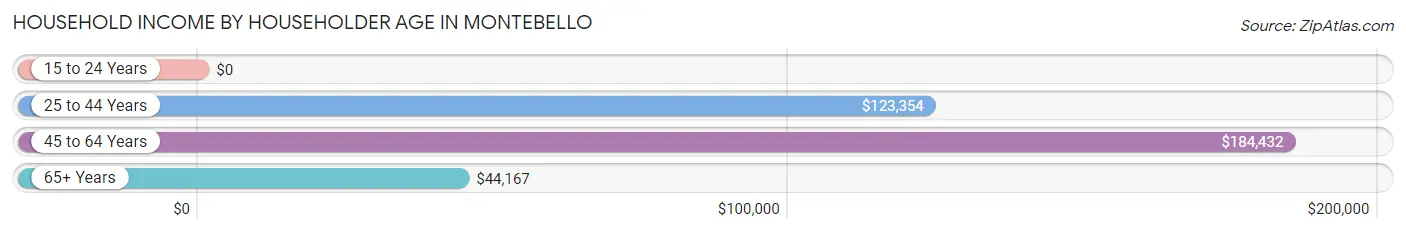
Household Income by Householder Age in Montebello
The median household income in Montebello is $144,167, with the highest median household income of $184,432 found in the 45 to 64 years age bracket for the primary householder. A total of 844 households (54.1%) fall into this category.
| Income Bracket | # Households | Median Income |
| 15 to 24 Years | 0 (0.0%) | $0 |
| 25 to 44 Years | 264 (16.9%) | $123,354 |
| 45 to 64 Years | 844 (54.1%) | $184,432 |
| 65+ Years | 452 (29.0%) | $44,167 |
| Total | 1,560 (100.0%) | $144,167 |
Poverty in Montebello
Income Below Poverty by Sex and Age in Montebello
With 12.4% poverty level for males and 9.6% for females among the residents of Montebello, under 5 year old males and 12 to 14 year old females are the most vulnerable to poverty, with 42 males (61.8%) and 32 females (26.9%) in their respective age groups living below the poverty level.
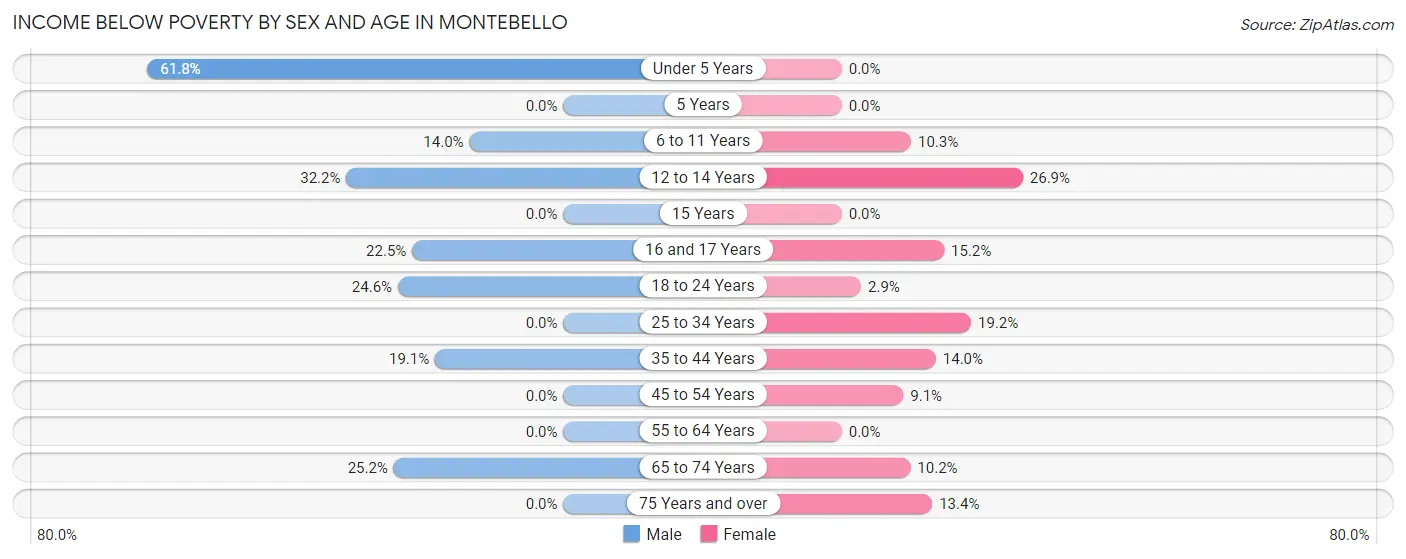
| Age Bracket | Male | Female |
| Under 5 Years | 42 (61.8%) | 0 (0.0%) |
| 5 Years | 0 (0.0%) | 0 (0.0%) |
| 6 to 11 Years | 42 (14.0%) | 22 (10.3%) |
| 12 to 14 Years | 39 (32.2%) | 32 (26.9%) |
| 15 Years | 0 (0.0%) | 0 (0.0%) |
| 16 and 17 Years | 22 (22.5%) | 24 (15.2%) |
| 18 to 24 Years | 72 (24.6%) | 6 (2.9%) |
| 25 to 34 Years | 0 (0.0%) | 24 (19.2%) |
| 35 to 44 Years | 24 (19.1%) | 25 (14.0%) |
| 45 to 54 Years | 0 (0.0%) | 53 (9.1%) |
| 55 to 64 Years | 0 (0.0%) | 0 (0.0%) |
| 65 to 74 Years | 34 (25.2%) | 11 (10.2%) |
| 75 Years and over | 0 (0.0%) | 36 (13.4%) |
| Total | 275 (12.4%) | 233 (9.6%) |
Income Above Poverty by Sex and Age in Montebello
According to the poverty statistics in Montebello, males aged 5 years and females aged under 5 years are the age groups that are most secure financially, with 100.0% of males and 100.0% of females in these age groups living above the poverty line.
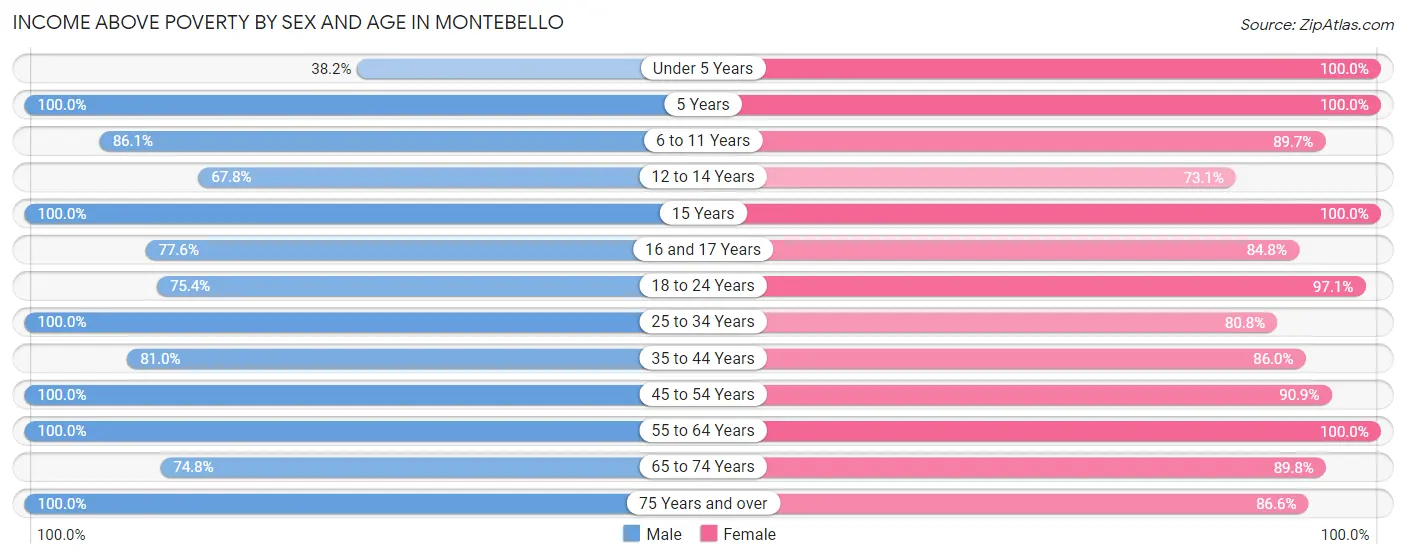
| Age Bracket | Male | Female |
| Under 5 Years | 26 (38.2%) | 147 (100.0%) |
| 5 Years | 28 (100.0%) | 10 (100.0%) |
| 6 to 11 Years | 259 (86.1%) | 192 (89.7%) |
| 12 to 14 Years | 82 (67.8%) | 87 (73.1%) |
| 15 Years | 67 (100.0%) | 62 (100.0%) |
| 16 and 17 Years | 76 (77.5%) | 134 (84.8%) |
| 18 to 24 Years | 221 (75.4%) | 203 (97.1%) |
| 25 to 34 Years | 231 (100.0%) | 101 (80.8%) |
| 35 to 44 Years | 102 (80.9%) | 154 (86.0%) |
| 45 to 54 Years | 277 (100.0%) | 527 (90.9%) |
| 55 to 64 Years | 369 (100.0%) | 244 (100.0%) |
| 65 to 74 Years | 101 (74.8%) | 97 (89.8%) |
| 75 Years and over | 108 (100.0%) | 232 (86.6%) |
| Total | 1,947 (87.6%) | 2,190 (90.4%) |
Income Below Poverty Among Married-Couple Families in Montebello
The poverty statistics for married-couple families in Montebello show that 6.2% or 58 of the total 934 families live below the poverty line. Families with 5 or more children have the highest poverty rate of 72.7%, comprising of 24 families. On the other hand, families with no children have the lowest poverty rate of 0.0%, which includes 0 families.
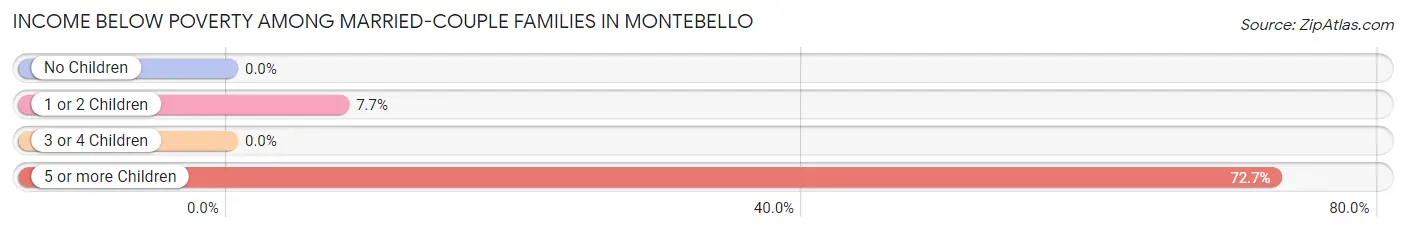
| Children | Above Poverty | Below Poverty |
| No Children | 354 (100.0%) | 0 (0.0%) |
| 1 or 2 Children | 405 (92.3%) | 34 (7.7%) |
| 3 or 4 Children | 108 (100.0%) | 0 (0.0%) |
| 5 or more Children | 9 (27.3%) | 24 (72.7%) |
| Total | 876 (93.8%) | 58 (6.2%) |
Income Below Poverty Among Single-Parent Households in Montebello
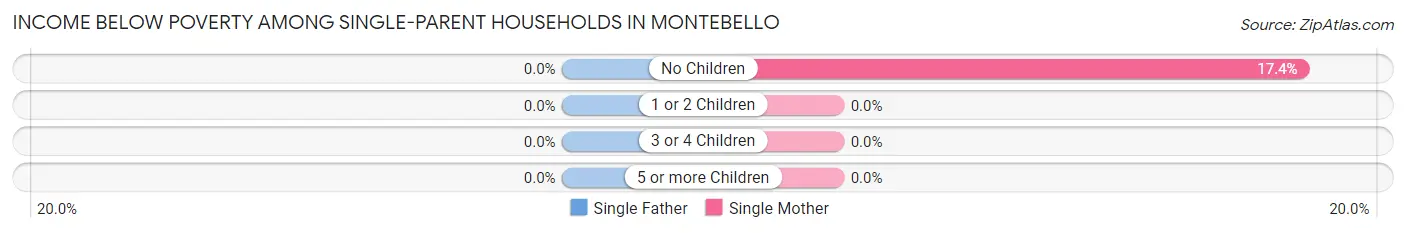
| Children | Single Father | Single Mother |
| No Children | 0 (0.0%) | 17 (17.3%) |
| 1 or 2 Children | 0 (0.0%) | 0 (0.0%) |
| 3 or 4 Children | 0 (0.0%) | 0 (0.0%) |
| 5 or more Children | 0 (0.0%) | 0 (0.0%) |
| Total | 0 (0.0%) | 17 (7.1%) |
Income Below Poverty Among Married-Couple vs Single-Parent Households in Montebello
The poverty data for Montebello shows that 58 of the married-couple family households (6.2%) and 17 of the single-parent households (7.1%) are living below the poverty level. Within the married-couple family households, those with 5 or more children have the highest poverty rate, with 24 households (72.7%) falling below the poverty line. Among the single-parent households, those with no children have the highest poverty rate, with 17 household (17.3%) living below poverty.
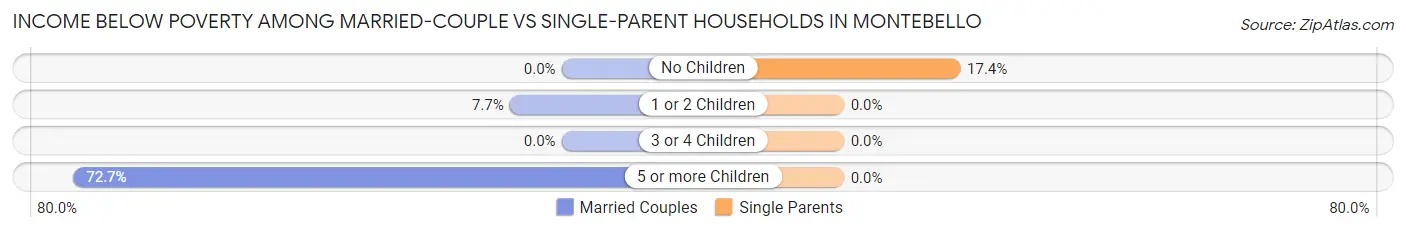
| Children | Married-Couple Families | Single-Parent Households |
| No Children | 0 (0.0%) | 17 (17.3%) |
| 1 or 2 Children | 34 (7.7%) | 0 (0.0%) |
| 3 or 4 Children | 0 (0.0%) | 0 (0.0%) |
| 5 or more Children | 24 (72.7%) | 0 (0.0%) |
| Total | 58 (6.2%) | 17 (7.1%) |
Race in Montebello
The most populous races in Montebello are White / Caucasian (3,734 | 80.4%), Two or more Races (391 | 8.4%), and Hispanic or Latino (271 | 5.8%).
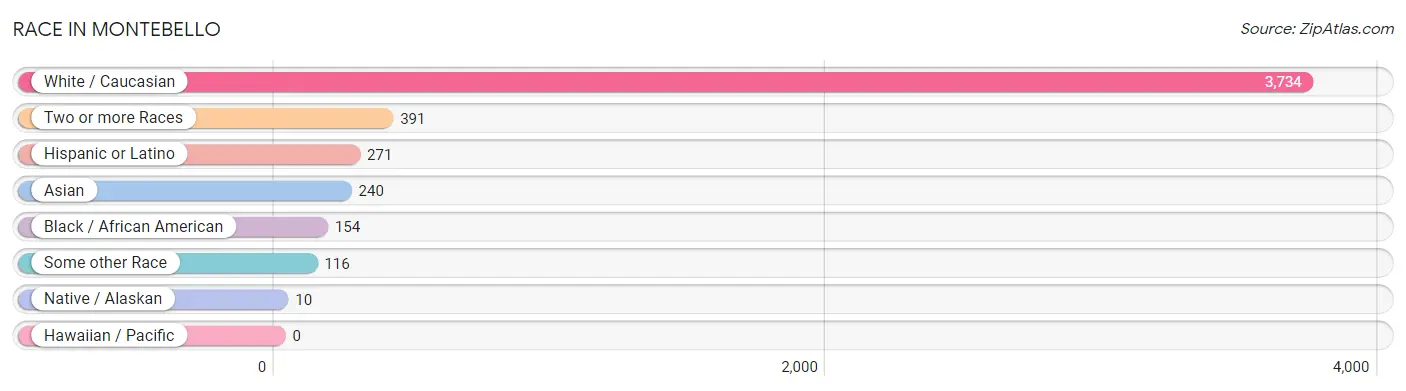
| Race | # Population | % Population |
| Asian | 240 | 5.2% |
| Black / African American | 154 | 3.3% |
| Hawaiian / Pacific | 0 | 0.0% |
| Hispanic or Latino | 271 | 5.8% |
| Native / Alaskan | 10 | 0.2% |
| White / Caucasian | 3,734 | 80.4% |
| Two or more Races | 391 | 8.4% |
| Some other Race | 116 | 2.5% |
| Total | 4,645 | 100.0% |
Ancestry in Montebello
The most populous ancestries reported in Montebello are American (767 | 16.5%), Italian (559 | 12.0%), Irish (547 | 11.8%), Polish (280 | 6.0%), and Russian (234 | 5.0%), together accounting for 51.4% of all Montebello residents.
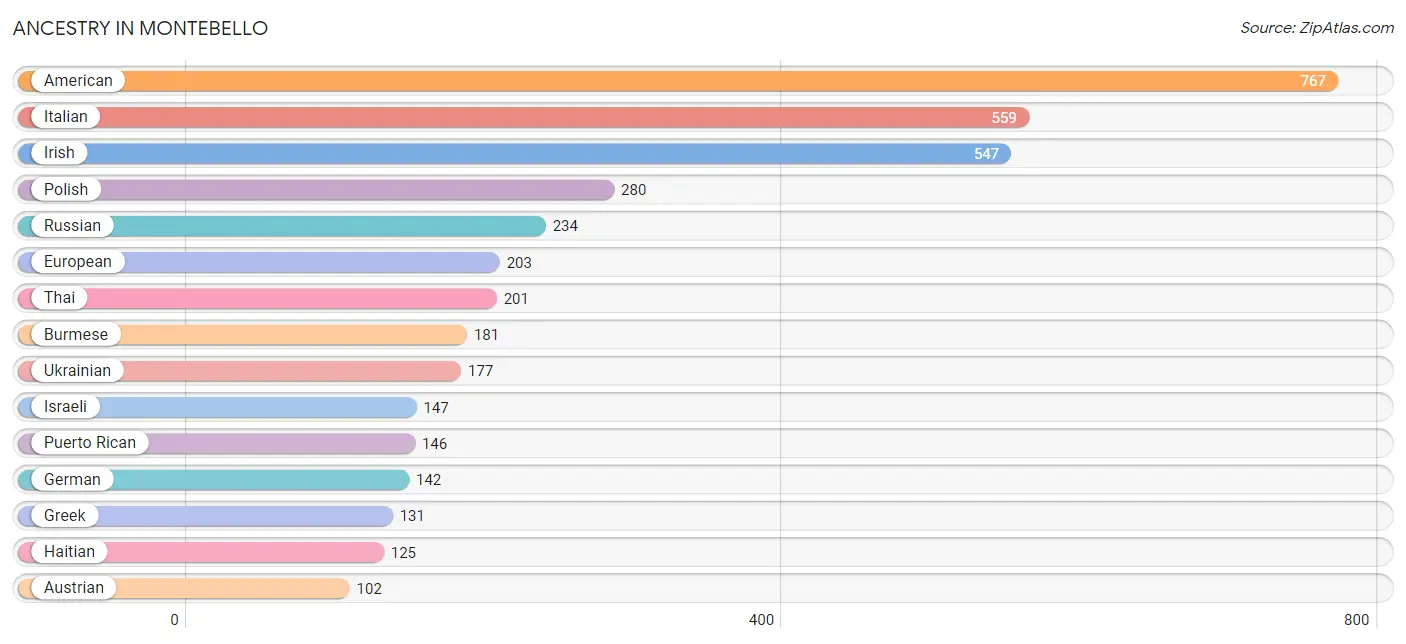
| Ancestry | # Population | % Population |
| American | 767 | 16.5% |
| Arab | 37 | 0.8% |
| Argentinean | 9 | 0.2% |
| Austrian | 102 | 2.2% |
| British | 11 | 0.2% |
| Burmese | 181 | 3.9% |
| Colombian | 13 | 0.3% |
| Danish | 11 | 0.2% |
| Dominican | 62 | 1.3% |
| Eastern European | 42 | 0.9% |
| English | 64 | 1.4% |
| European | 203 | 4.4% |
| Finnish | 25 | 0.5% |
| French | 27 | 0.6% |
| German | 142 | 3.1% |
| Greek | 131 | 2.8% |
| Haitian | 125 | 2.7% |
| Hungarian | 51 | 1.1% |
| Irish | 547 | 11.8% |
| Israeli | 147 | 3.2% |
| Italian | 559 | 12.0% |
| Korean | 82 | 1.8% |
| Lebanese | 37 | 0.8% |
| Lithuanian | 36 | 0.8% |
| Northern European | 11 | 0.2% |
| Norwegian | 11 | 0.2% |
| Peruvian | 6 | 0.1% |
| Polish | 280 | 6.0% |
| Puerto Rican | 146 | 3.1% |
| Romanian | 68 | 1.5% |
| Russian | 234 | 5.0% |
| Scandinavian | 25 | 0.5% |
| Scottish | 12 | 0.3% |
| Slavic | 8 | 0.2% |
| South African | 7 | 0.2% |
| South American | 28 | 0.6% |
| Spanish | 12 | 0.3% |
| Subsaharan African | 7 | 0.2% |
| Swedish | 9 | 0.2% |
| Thai | 201 | 4.3% |
| Trinidadian and Tobagonian | 25 | 0.5% |
| Turkish | 17 | 0.4% |
| Ukrainian | 177 | 3.8% | View All 43 Rows |
Immigrants in Montebello
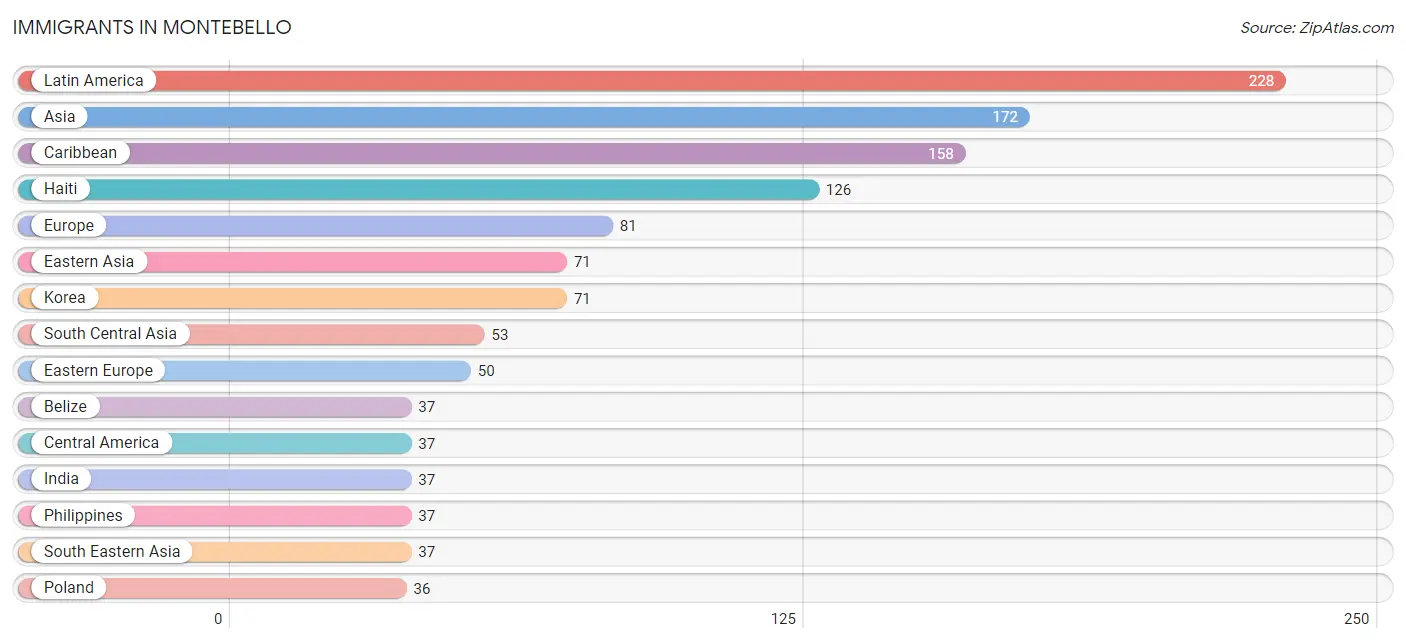
The most numerous immigrant groups reported in Montebello came from Latin America (228 | 4.9%), Asia (172 | 3.7%), Caribbean (158 | 3.4%), Haiti (126 | 2.7%), and Europe (81 | 1.7%), together accounting for 16.5% of all Montebello residents.
| Immigration Origin | # Population | % Population |
| Argentina | 9 | 0.2% |
| Asia | 172 | 3.7% |
| Belize | 37 | 0.8% |
| Canada | 11 | 0.2% |
| Caribbean | 158 | 3.4% |
| Central America | 37 | 0.8% |
| Colombia | 13 | 0.3% |
| Dominican Republic | 20 | 0.4% |
| Eastern Asia | 71 | 1.5% |
| Eastern Europe | 50 | 1.1% |
| Europe | 81 | 1.7% |
| Haiti | 126 | 2.7% |
| India | 37 | 0.8% |
| Italy | 21 | 0.4% |
| Korea | 71 | 1.5% |
| Latin America | 228 | 4.9% |
| Northern Europe | 10 | 0.2% |
| Pakistan | 16 | 0.3% |
| Peru | 11 | 0.2% |
| Philippines | 37 | 0.8% |
| Poland | 36 | 0.8% |
| Romania | 14 | 0.3% |
| South America | 33 | 0.7% |
| South Central Asia | 53 | 1.1% |
| South Eastern Asia | 37 | 0.8% |
| Southern Europe | 21 | 0.4% |
| Trinidad and Tobago | 12 | 0.3% |
| Turkey | 11 | 0.2% |
| Western Asia | 11 | 0.2% | View All 29 Rows |
Sex and Age in Montebello
Sex and Age in Montebello
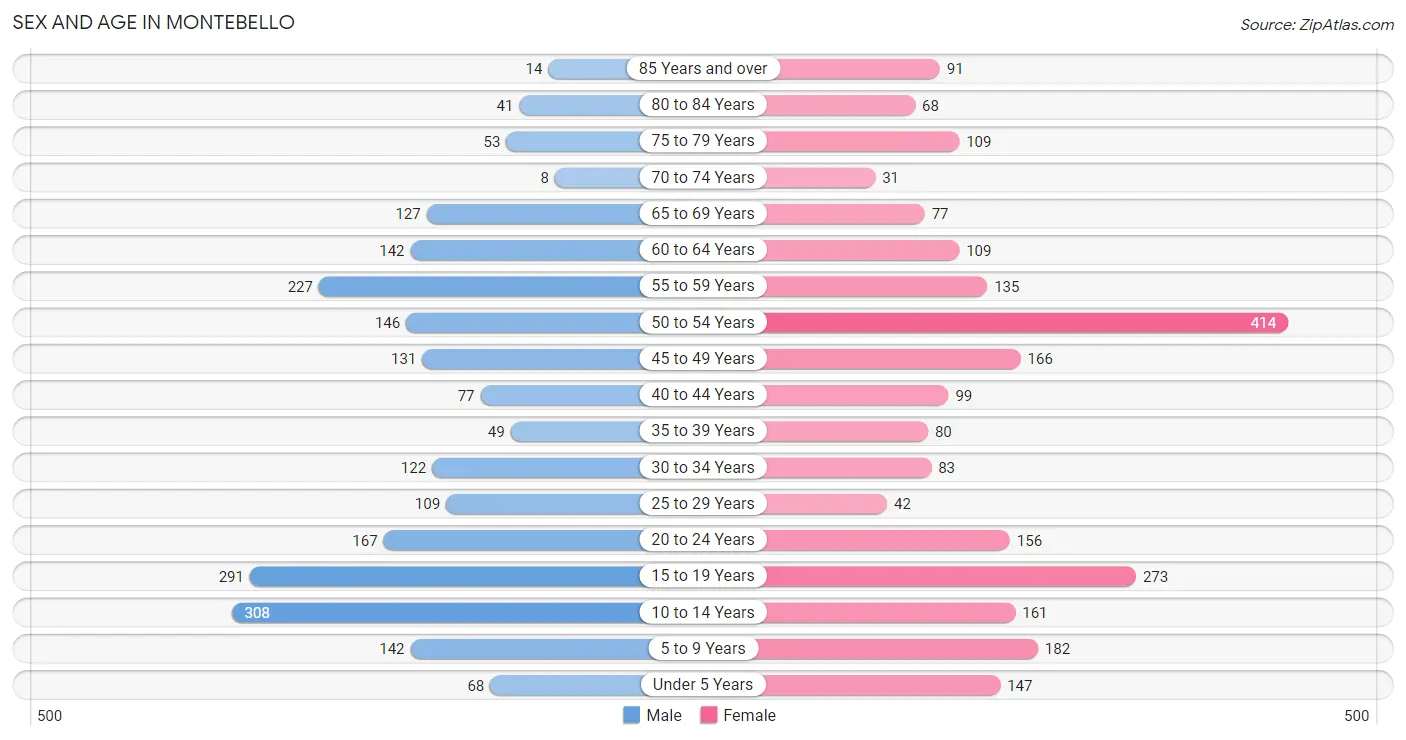
The most populous age groups in Montebello are 10 to 14 Years (308 | 13.9%) for men and 50 to 54 Years (414 | 17.1%) for women.
| Age Bracket | Male | Female |
| Under 5 Years | 68 (3.1%) | 147 (6.1%) |
| 5 to 9 Years | 142 (6.4%) | 182 (7.5%) |
| 10 to 14 Years | 308 (13.9%) | 161 (6.6%) |
| 15 to 19 Years | 291 (13.1%) | 273 (11.3%) |
| 20 to 24 Years | 167 (7.5%) | 156 (6.4%) |
| 25 to 29 Years | 109 (4.9%) | 42 (1.7%) |
| 30 to 34 Years | 122 (5.5%) | 83 (3.4%) |
| 35 to 39 Years | 49 (2.2%) | 80 (3.3%) |
| 40 to 44 Years | 77 (3.5%) | 99 (4.1%) |
| 45 to 49 Years | 131 (5.9%) | 166 (6.9%) |
| 50 to 54 Years | 146 (6.6%) | 414 (17.1%) |
| 55 to 59 Years | 227 (10.2%) | 135 (5.6%) |
| 60 to 64 Years | 142 (6.4%) | 109 (4.5%) |
| 65 to 69 Years | 127 (5.7%) | 77 (3.2%) |
| 70 to 74 Years | 8 (0.4%) | 31 (1.3%) |
| 75 to 79 Years | 53 (2.4%) | 109 (4.5%) |
| 80 to 84 Years | 41 (1.8%) | 68 (2.8%) |
| 85 Years and over | 14 (0.6%) | 91 (3.8%) |
| Total | 2,222 (100.0%) | 2,423 (100.0%) |
Families and Households in Montebello
Median Family Size in Montebello

| Family Type | # Families | Family Size |
| Married-Couple | 934 (79.7%) | 3.73 |
| Single Male/Father | 0 (0.0%) | - |
| Single Female/Mother | 238 (20.3%) | 2.90 |
| Total Families | 1,172 (100.0%) | 3.56 |
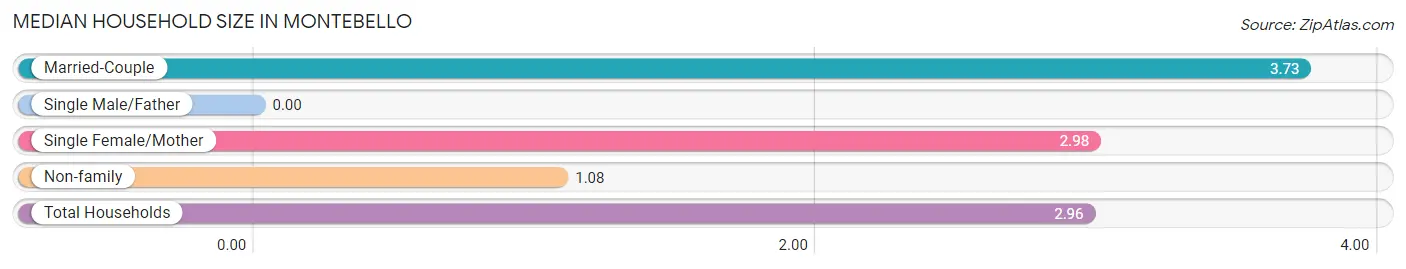
Median Household Size in Montebello
| Household Type | # Households | Household Size |
| Married-Couple | 934 (59.9%) | 3.73 |
| Single Male/Father | 0 (0.0%) | - |
| Single Female/Mother | 238 (15.3%) | 2.98 |
| Non-family | 388 (24.9%) | 1.08 |
| Total Households | 1,560 (100.0%) | 2.96 |
Household Size by Marriage Status in Montebello
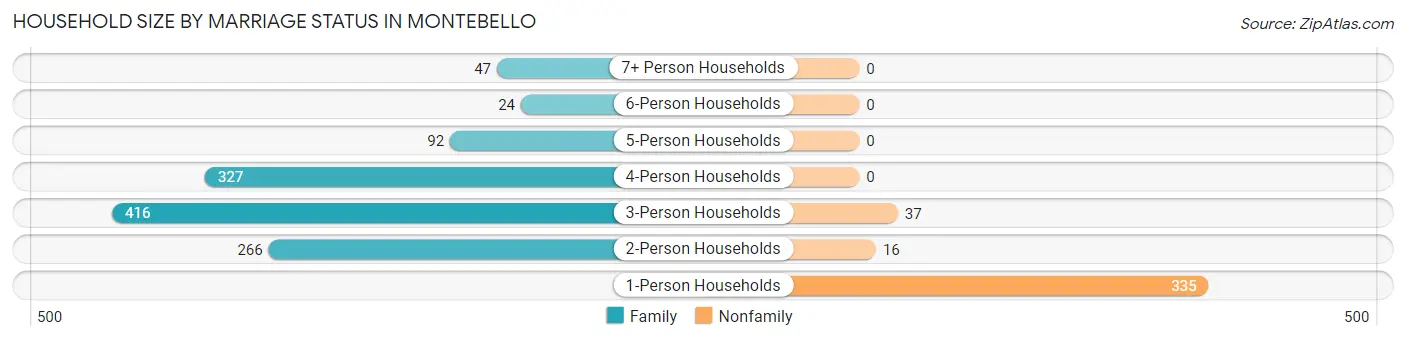
Out of a total of 1,560 households in Montebello, 1,172 (75.1%) are family households, while 388 (24.9%) are nonfamily households. The most numerous type of family households are 3-person households, comprising 416, and the most common type of nonfamily households are 1-person households, comprising 335.
| Household Size | Family Households | Nonfamily Households |
| 1-Person Households | - | 335 (21.5%) |
| 2-Person Households | 266 (17.1%) | 16 (1.0%) |
| 3-Person Households | 416 (26.7%) | 37 (2.4%) |
| 4-Person Households | 327 (21.0%) | 0 (0.0%) |
| 5-Person Households | 92 (5.9%) | 0 (0.0%) |
| 6-Person Households | 24 (1.5%) | 0 (0.0%) |
| 7+ Person Households | 47 (3.0%) | 0 (0.0%) |
| Total | 1,172 (75.1%) | 388 (24.9%) |
Female Fertility in Montebello
Fertility by Age in Montebello
Average fertility rate in Montebello is 20.0 births per 1,000 women. Women in the age bracket of 35 to 50 years have the highest fertility rate with 30.0 births per 1,000 women. Women in the age bracket of 35 to 50 years acount for 63.2% of all women with births.
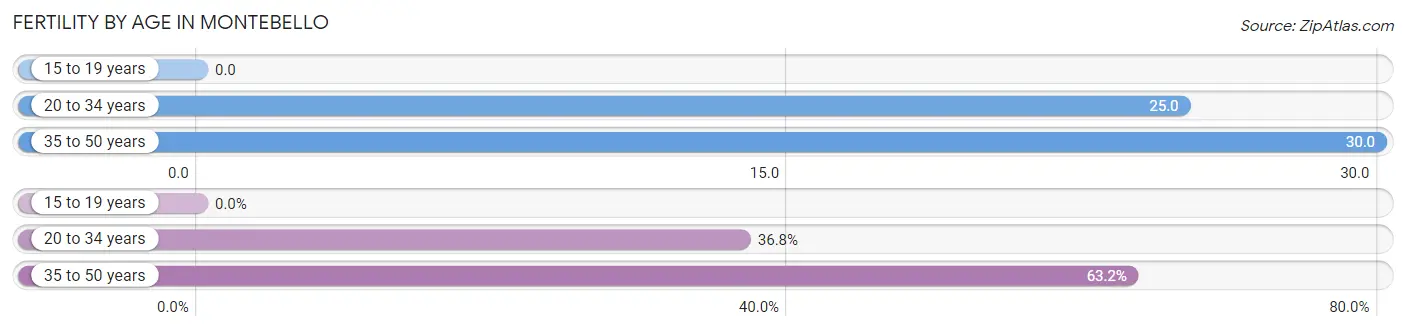
| Age Bracket | Women with Births | Births / 1,000 Women |
| 15 to 19 years | 0 (0.0%) | 0.0 |
| 20 to 34 years | 7 (36.8%) | 25.0 |
| 35 to 50 years | 12 (63.2%) | 30.0 |
| Total | 19 (100.0%) | 20.0 |
Fertility by Age by Marriage Status in Montebello
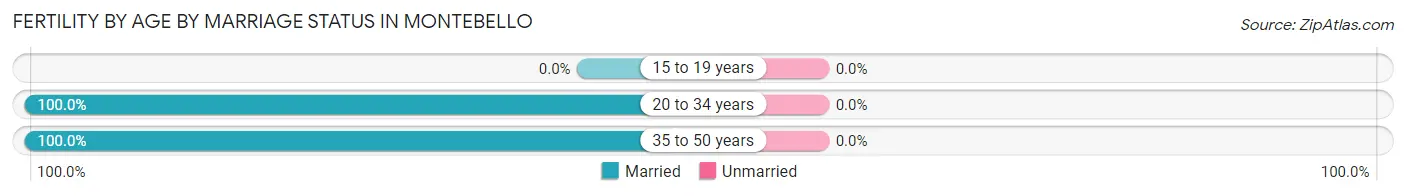
| Age Bracket | Married | Unmarried |
| 15 to 19 years | 0 (0.0%) | 0 (0.0%) |
| 20 to 34 years | 7 (100.0%) | 0 (0.0%) |
| 35 to 50 years | 12 (100.0%) | 0 (0.0%) |
| Total | 19 (100.0%) | 0 (0.0%) |
Fertility by Education in Montebello
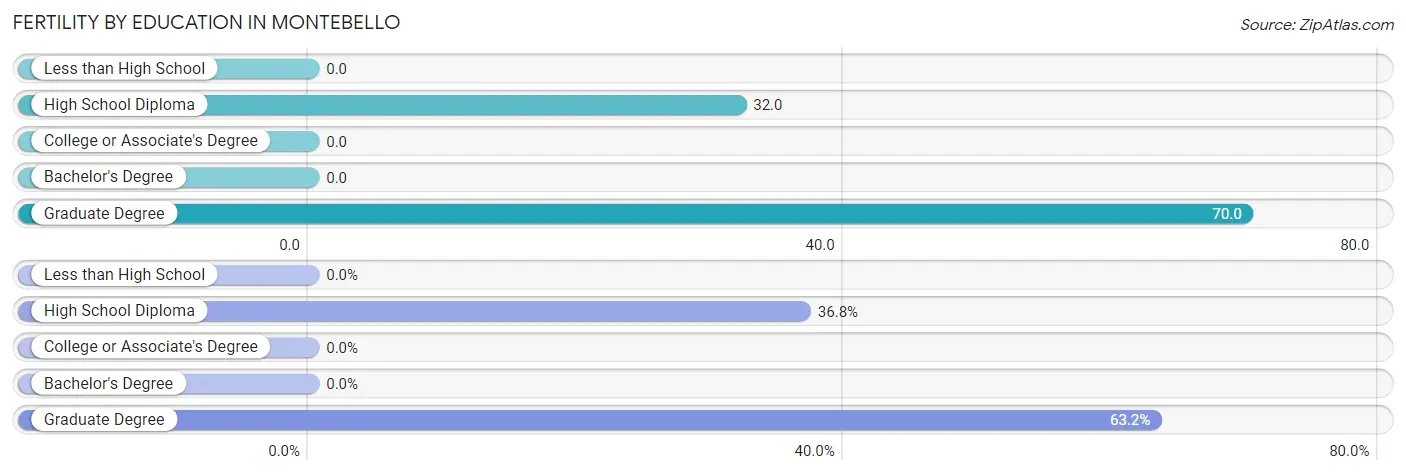
| Educational Attainment | Women with Births | Births / 1,000 Women |
| Less than High School | 0 (0.0%) | 0.0 |
| High School Diploma | 7 (36.8%) | 32.0 |
| College or Associate's Degree | 0 (0.0%) | 0.0 |
| Bachelor's Degree | 0 (0.0%) | 0.0 |
| Graduate Degree | 12 (63.2%) | 70.0 |
| Total | 19 (100.0%) | 20.0 |
Fertility by Education by Marriage Status in Montebello
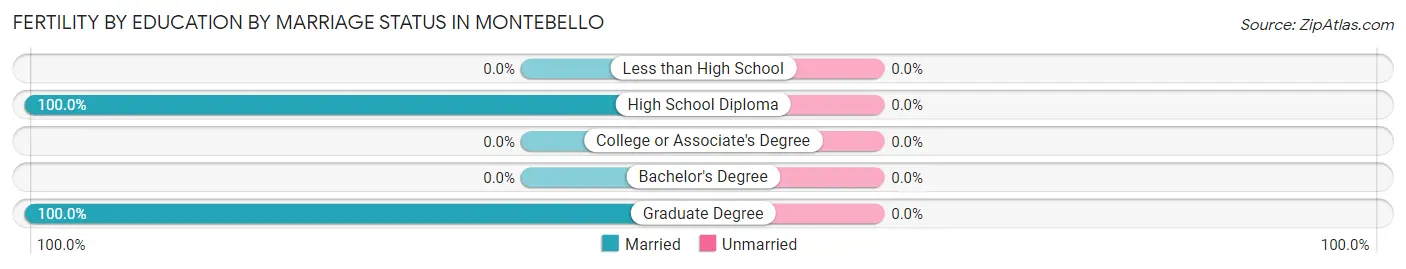
| Educational Attainment | Married | Unmarried |
| Less than High School | 0 (0.0%) | 0 (0.0%) |
| High School Diploma | 7 (100.0%) | 0 (0.0%) |
| College or Associate's Degree | 0 (0.0%) | 0 (0.0%) |
| Bachelor's Degree | 0 (0.0%) | 0 (0.0%) |
| Graduate Degree | 12 (100.0%) | 0 (0.0%) |
| Total | 19 (100.0%) | 0 (0.0%) |
Employment Characteristics in Montebello
Employment by Class of Employer in Montebello
Among the 2,124 employed individuals in Montebello, private company employees (1,197 | 56.4%), self-employed (incorporated) (355 | 16.7%), and local government employees (191 | 9.0%) make up the most common classes of employment.
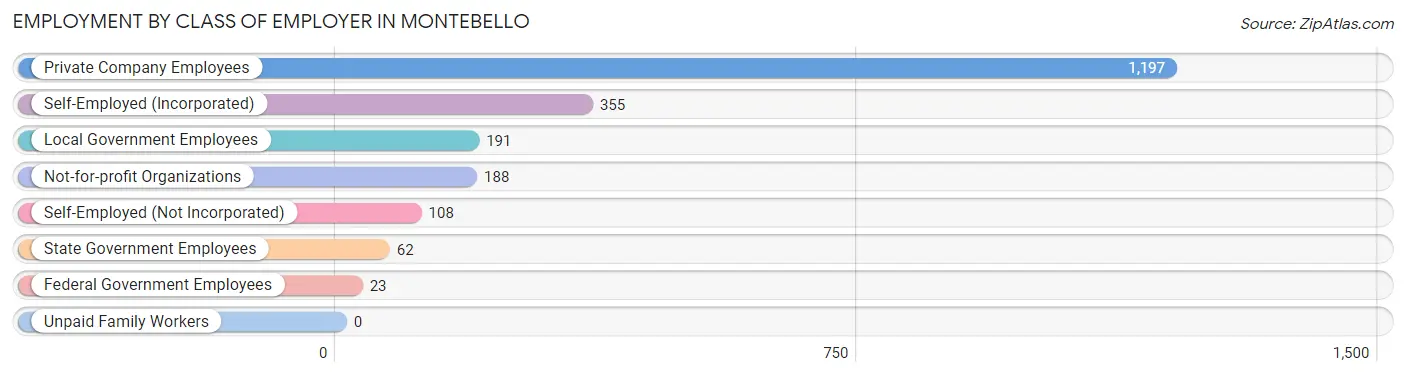
| Employer Class | # Employees | % Employees |
| Private Company Employees | 1,197 | 56.4% |
| Self-Employed (Incorporated) | 355 | 16.7% |
| Self-Employed (Not Incorporated) | 108 | 5.1% |
| Not-for-profit Organizations | 188 | 8.8% |
| Local Government Employees | 191 | 9.0% |
| State Government Employees | 62 | 2.9% |
| Federal Government Employees | 23 | 1.1% |
| Unpaid Family Workers | 0 | 0.0% |
| Total | 2,124 | 100.0% |
Employment Status by Age in Montebello
According to the labor force statistics for Montebello, out of the total population over 16 years of age (3,508), 65.1% or 2,284 individuals are in the labor force, with 7.1% or 162 of them unemployed. The age group with the highest labor force participation rate is 55 to 59 years, with 91.2% or 330 individuals in the labor force. Within the labor force, the 20 to 24 years age range has the highest percentage of unemployed individuals, with 30.5% or 71 of them being unemployed.
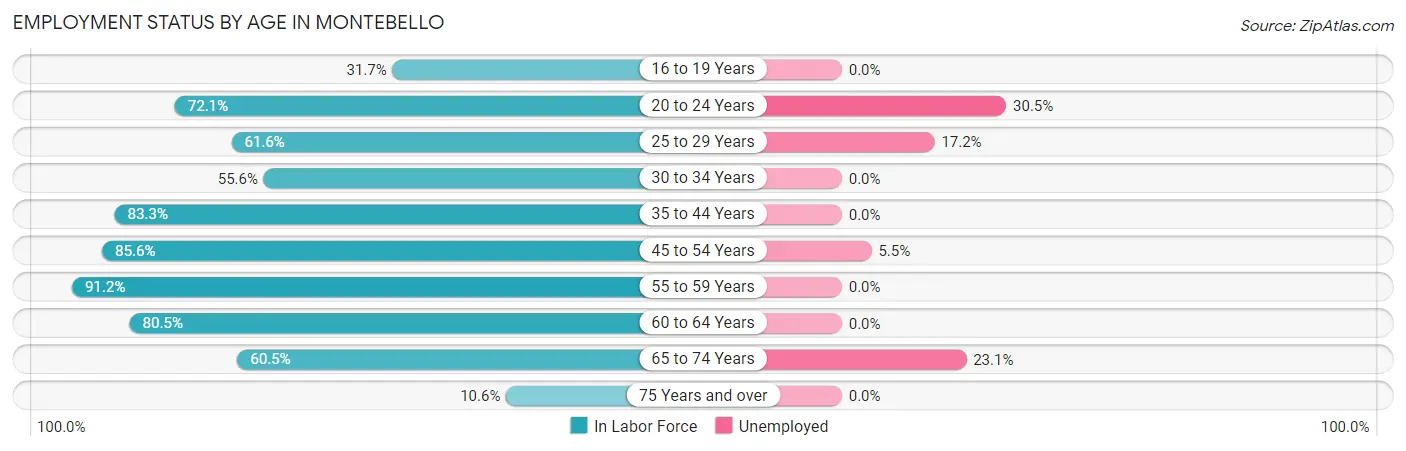
| Age Bracket | In Labor Force | Unemployed |
| 16 to 19 Years | 138 (31.7%) | 0 (0.0%) |
| 20 to 24 Years | 233 (72.1%) | 71 (30.5%) |
| 25 to 29 Years | 93 (61.6%) | 16 (17.2%) |
| 30 to 34 Years | 114 (55.6%) | 0 (0.0%) |
| 35 to 44 Years | 254 (83.3%) | 0 (0.0%) |
| 45 to 54 Years | 734 (85.6%) | 40 (5.5%) |
| 55 to 59 Years | 330 (91.2%) | 0 (0.0%) |
| 60 to 64 Years | 202 (80.5%) | 0 (0.0%) |
| 65 to 74 Years | 147 (60.5%) | 34 (23.1%) |
| 75 Years and over | 40 (10.6%) | 0 (0.0%) |
| Total | 2,284 (65.1%) | 162 (7.1%) |
Employment Status by Educational Attainment in Montebello
According to labor force statistics for Montebello, 81.0% of individuals (1,726) out of the total population between 25 and 64 years of age (2,131) are in the labor force, with 3.3% or 57 of them being unemployed. The group with the highest labor force participation rate are those with the educational attainment of bachelor's degree or higher, with 88.7% or 1,228 individuals in the labor force. Within the labor force, individuals with high school diploma education have the highest percentage of unemployment, with 12.6% or 16 of them being unemployed.
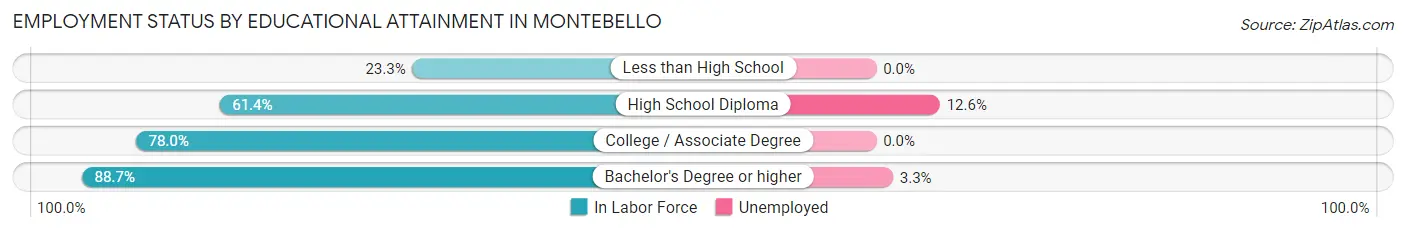
| Educational Attainment | In Labor Force | Unemployed |
| Less than High School | 21 (23.3%) | 0 (0.0%) |
| High School Diploma | 127 (61.4%) | 26 (12.6%) |
| College / Associate Degree | 351 (78.0%) | 0 (0.0%) |
| Bachelor's Degree or higher | 1,228 (88.7%) | 46 (3.3%) |
| Total | 1,726 (81.0%) | 70 (3.3%) |
Employment Occupations by Sex in Montebello
Management, Business, Science and Arts Occupations
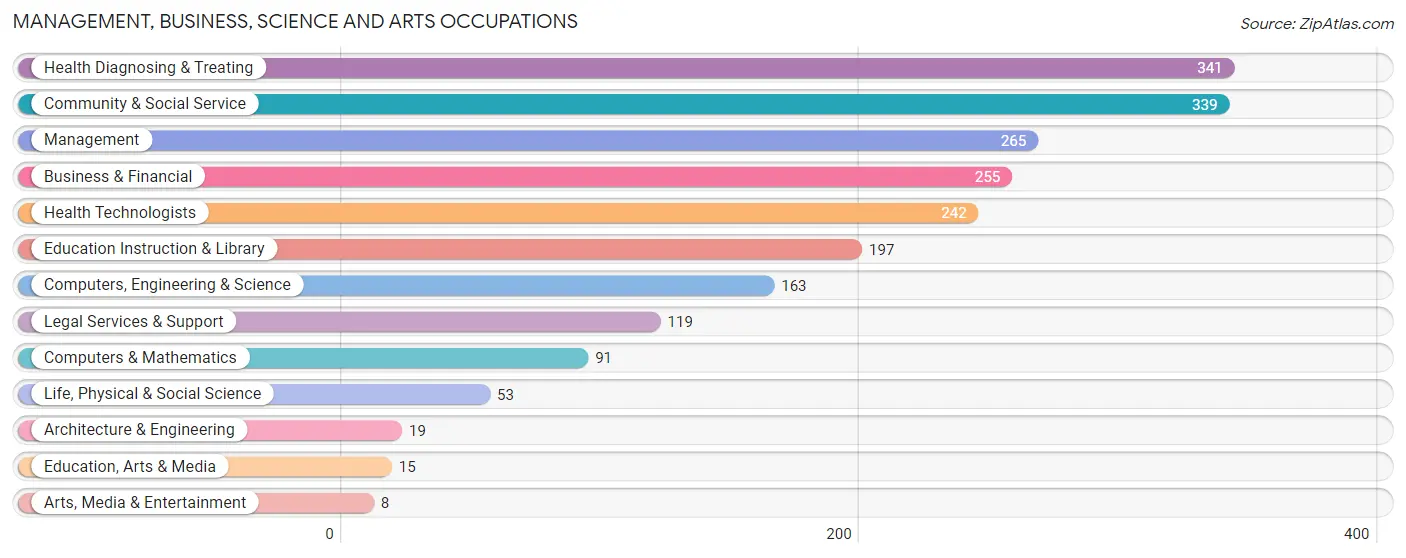
The most common Management, Business, Science and Arts occupations in Montebello are Health Diagnosing & Treating (341 | 16.1%), Community & Social Service (339 | 16.0%), Management (265 | 12.5%), Business & Financial (255 | 12.1%), and Health Technologists (242 | 11.4%).
Management, Business, Science and Arts Occupations by Sex
Within the Management, Business, Science and Arts occupations in Montebello, the most male-oriented occupations are Computers & Mathematics (100.0%), Architecture & Engineering (100.0%), and Arts, Media & Entertainment (100.0%), while the most female-oriented occupations are Education Instruction & Library (67.0%), Health Technologists (63.6%), and Health Diagnosing & Treating (62.8%).
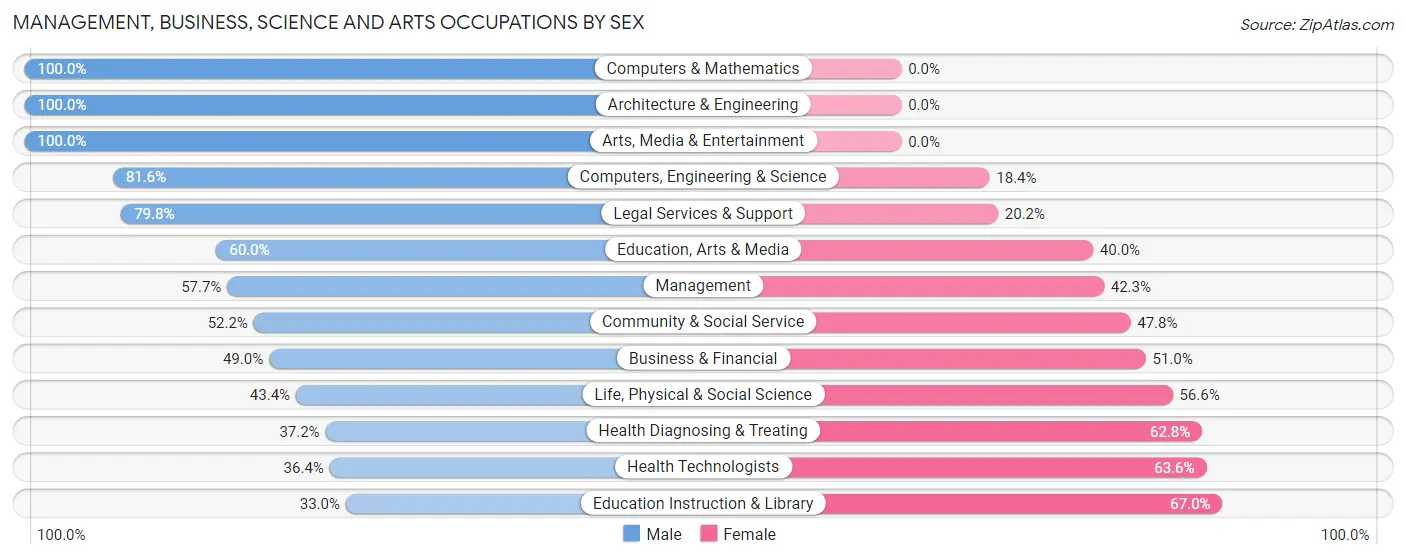
| Occupation | Male | Female |
| Management | 153 (57.7%) | 112 (42.3%) |
| Business & Financial | 125 (49.0%) | 130 (51.0%) |
| Computers, Engineering & Science | 133 (81.6%) | 30 (18.4%) |
| Computers & Mathematics | 91 (100.0%) | 0 (0.0%) |
| Architecture & Engineering | 19 (100.0%) | 0 (0.0%) |
| Life, Physical & Social Science | 23 (43.4%) | 30 (56.6%) |
| Community & Social Service | 177 (52.2%) | 162 (47.8%) |
| Education, Arts & Media | 9 (60.0%) | 6 (40.0%) |
| Legal Services & Support | 95 (79.8%) | 24 (20.2%) |
| Education Instruction & Library | 65 (33.0%) | 132 (67.0%) |
| Arts, Media & Entertainment | 8 (100.0%) | 0 (0.0%) |
| Health Diagnosing & Treating | 127 (37.2%) | 214 (62.8%) |
| Health Technologists | 88 (36.4%) | 154 (63.6%) |
| Total (Category) | 715 (52.5%) | 648 (47.5%) |
| Total (Overall) | 1,168 (55.2%) | 947 (44.8%) |
Services Occupations
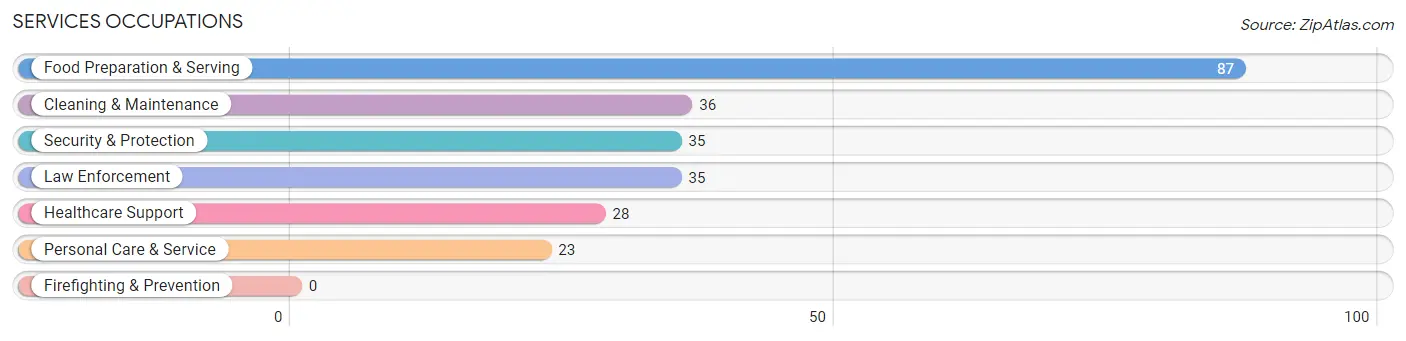
The most common Services occupations in Montebello are Food Preparation & Serving (87 | 4.1%), Cleaning & Maintenance (36 | 1.7%), Security & Protection (35 | 1.7%), Law Enforcement (35 | 1.7%), and Healthcare Support (28 | 1.3%).
Services Occupations by Sex
Within the Services occupations in Montebello, the most male-oriented occupations are Security & Protection (100.0%), Law Enforcement (100.0%), and Cleaning & Maintenance (100.0%), while the most female-oriented occupations are Healthcare Support (100.0%), Personal Care & Service (100.0%), and Food Preparation & Serving (11.5%).
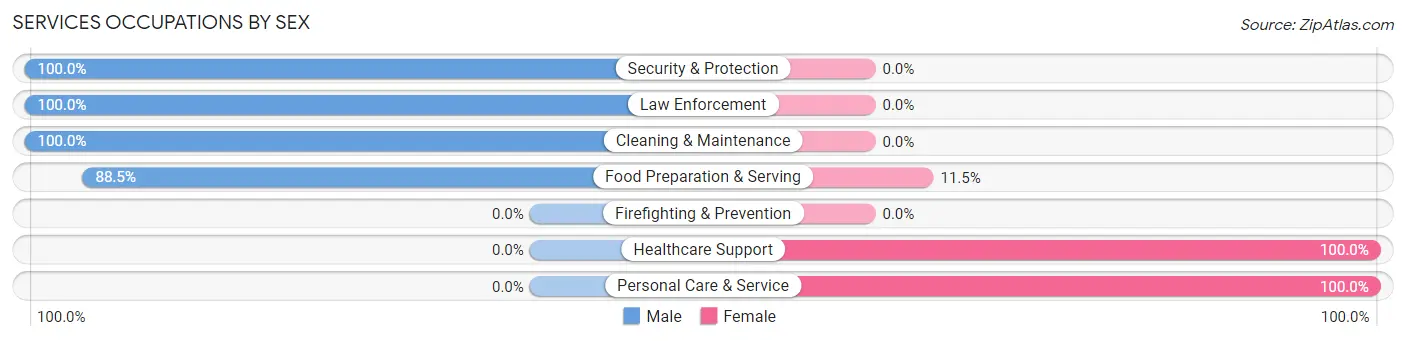
| Occupation | Male | Female |
| Healthcare Support | 0 (0.0%) | 28 (100.0%) |
| Security & Protection | 35 (100.0%) | 0 (0.0%) |
| Firefighting & Prevention | 0 (0.0%) | 0 (0.0%) |
| Law Enforcement | 35 (100.0%) | 0 (0.0%) |
| Food Preparation & Serving | 77 (88.5%) | 10 (11.5%) |
| Cleaning & Maintenance | 36 (100.0%) | 0 (0.0%) |
| Personal Care & Service | 0 (0.0%) | 23 (100.0%) |
| Total (Category) | 148 (70.8%) | 61 (29.2%) |
| Total (Overall) | 1,168 (55.2%) | 947 (44.8%) |
Sales and Office Occupations
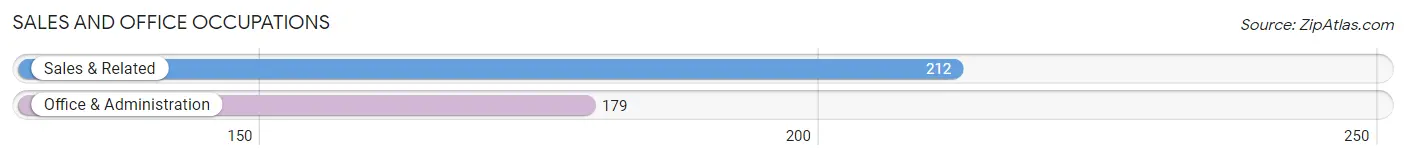
The most common Sales and Office occupations in Montebello are Sales & Related (212 | 10.0%), and Office & Administration (179 | 8.5%).
Sales and Office Occupations by Sex
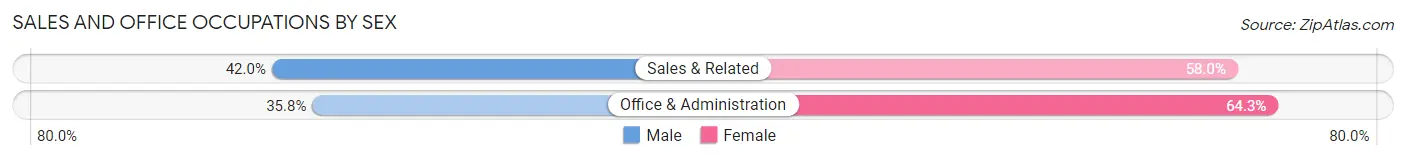
| Occupation | Male | Female |
| Sales & Related | 89 (42.0%) | 123 (58.0%) |
| Office & Administration | 64 (35.7%) | 115 (64.2%) |
| Total (Category) | 153 (39.1%) | 238 (60.9%) |
| Total (Overall) | 1,168 (55.2%) | 947 (44.8%) |
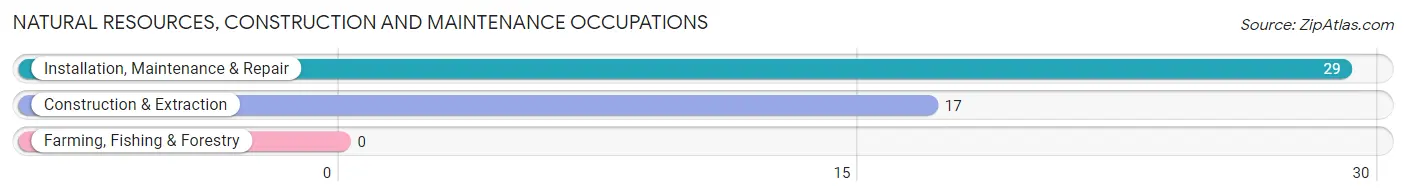
Natural Resources, Construction and Maintenance Occupations
The most common Natural Resources, Construction and Maintenance occupations in Montebello are Installation, Maintenance & Repair (29 | 1.4%), and Construction & Extraction (17 | 0.8%).
Natural Resources, Construction and Maintenance Occupations by Sex
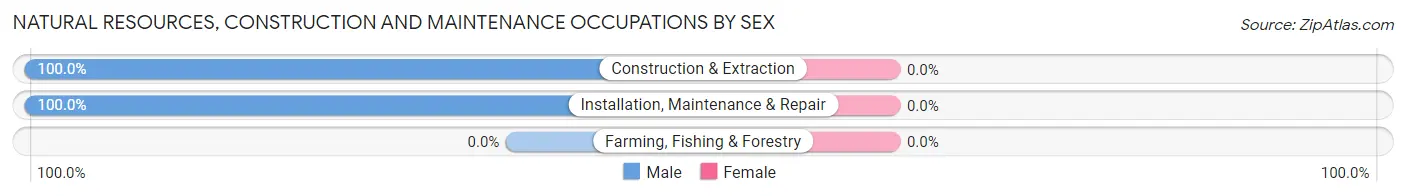
| Occupation | Male | Female |
| Farming, Fishing & Forestry | 0 (0.0%) | 0 (0.0%) |
| Construction & Extraction | 17 (100.0%) | 0 (0.0%) |
| Installation, Maintenance & Repair | 29 (100.0%) | 0 (0.0%) |
| Total (Category) | 46 (100.0%) | 0 (0.0%) |
| Total (Overall) | 1,168 (55.2%) | 947 (44.8%) |
Production, Transportation and Moving Occupations
The most common Production, Transportation and Moving occupations in Montebello are Production (57 | 2.7%), Transportation (40 | 1.9%), and Material Moving (9 | 0.4%).
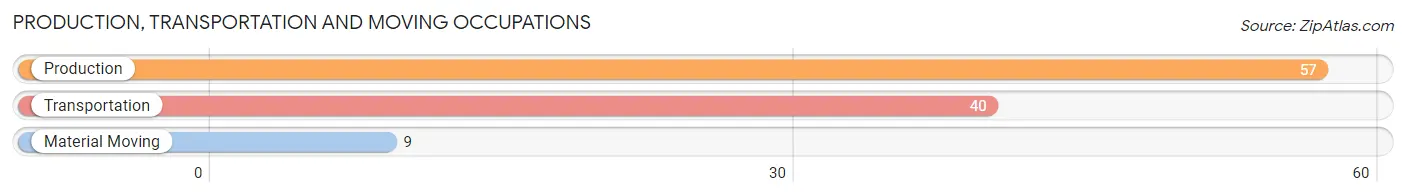
Production, Transportation and Moving Occupations by Sex
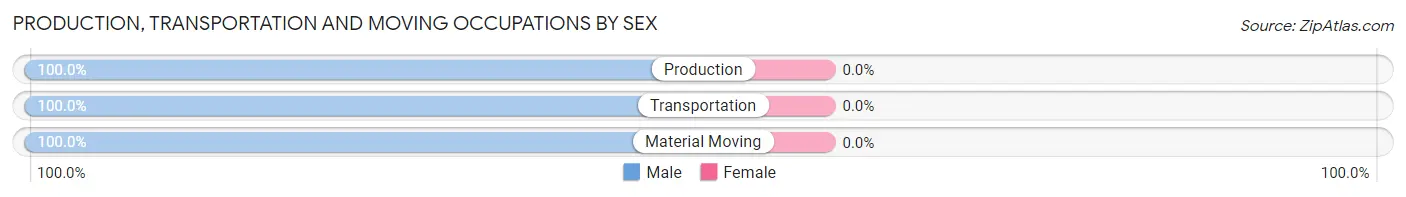
| Occupation | Male | Female |
| Production | 57 (100.0%) | 0 (0.0%) |
| Transportation | 40 (100.0%) | 0 (0.0%) |
| Material Moving | 9 (100.0%) | 0 (0.0%) |
| Total (Category) | 106 (100.0%) | 0 (0.0%) |
| Total (Overall) | 1,168 (55.2%) | 947 (44.8%) |
Employment Industries by Sex in Montebello
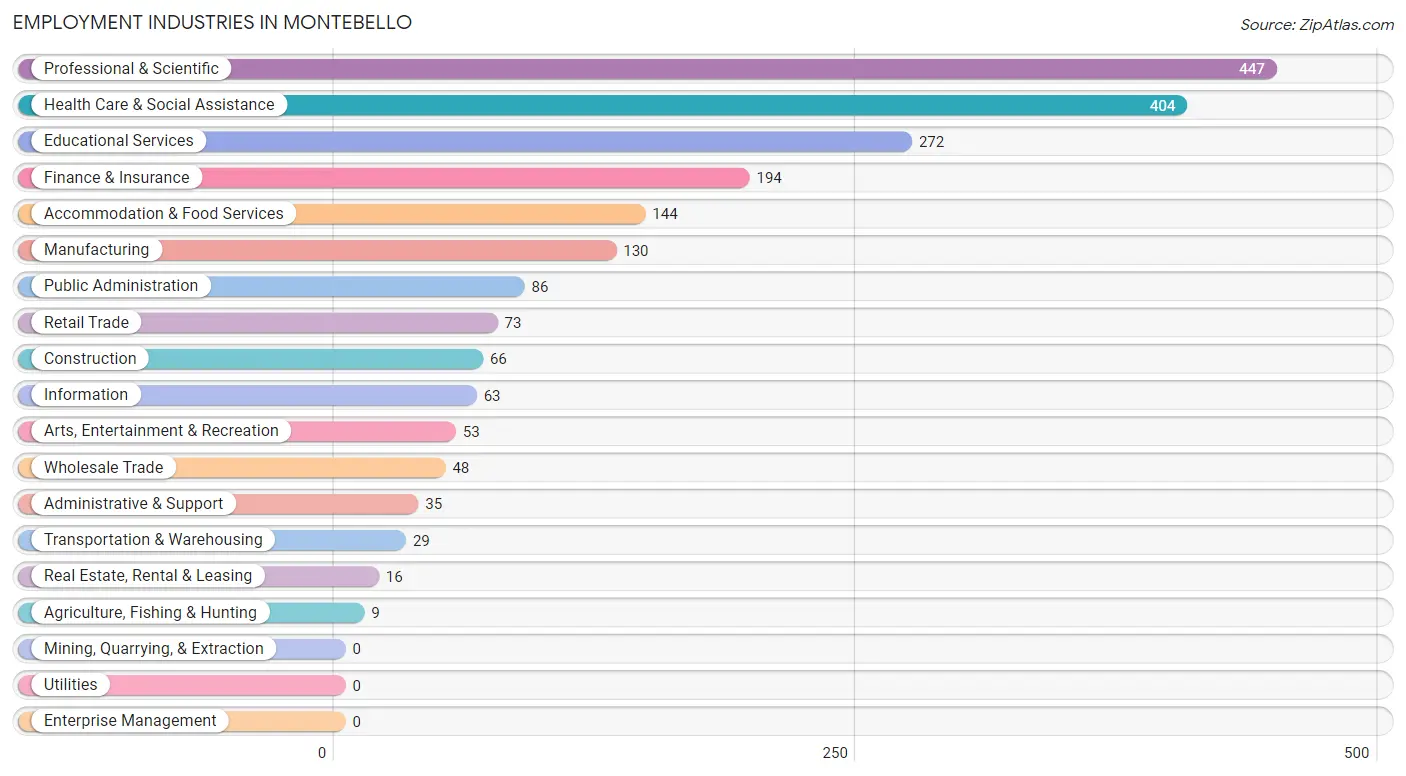
Employment Industries in Montebello
The major employment industries in Montebello include Professional & Scientific (447 | 21.1%), Health Care & Social Assistance (404 | 19.1%), Educational Services (272 | 12.9%), Finance & Insurance (194 | 9.2%), and Accommodation & Food Services (144 | 6.8%).
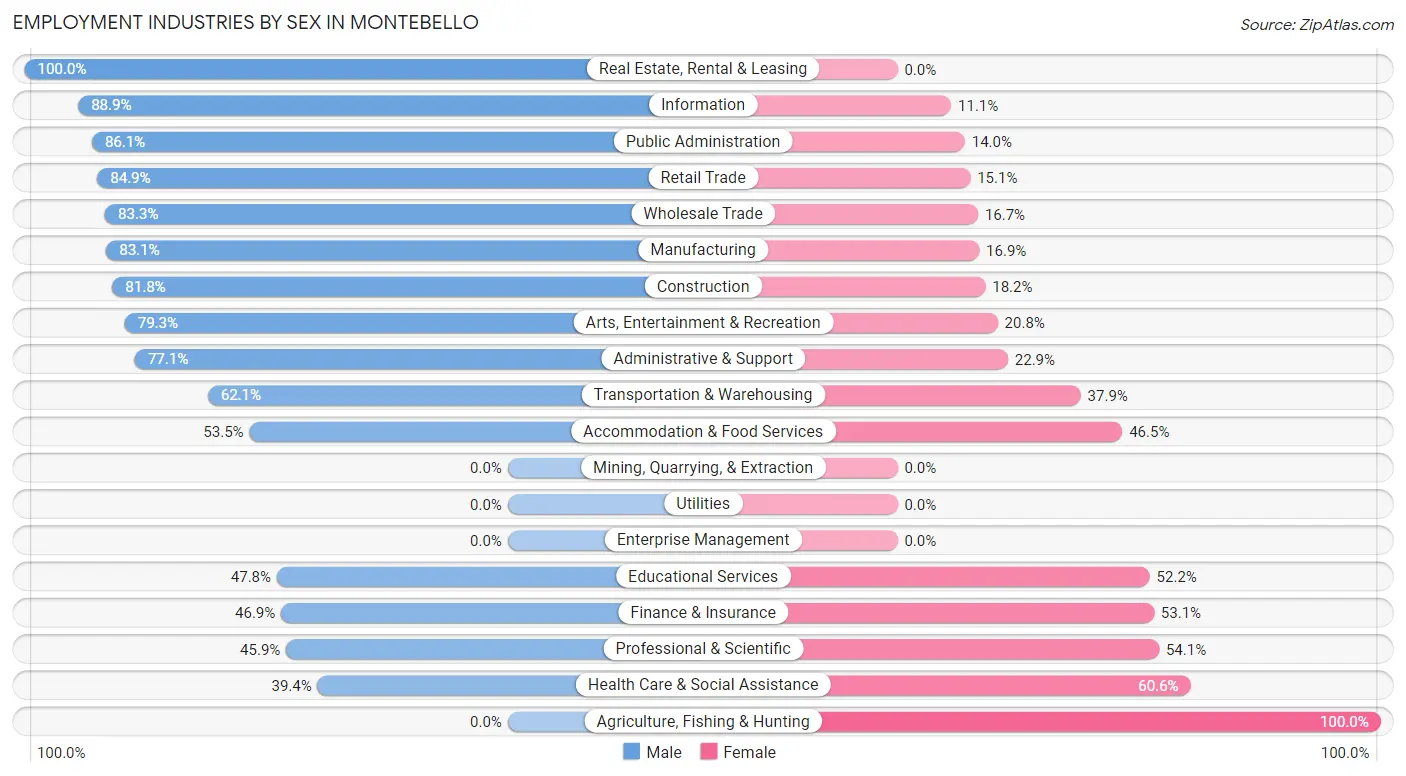
Employment Industries by Sex in Montebello
The Montebello industries that see more men than women are Real Estate, Rental & Leasing (100.0%), Information (88.9%), and Public Administration (86.1%), whereas the industries that tend to have a higher number of women are Agriculture, Fishing & Hunting (100.0%), Health Care & Social Assistance (60.6%), and Professional & Scientific (54.1%).
| Industry | Male | Female |
| Agriculture, Fishing & Hunting | 0 (0.0%) | 9 (100.0%) |
| Mining, Quarrying, & Extraction | 0 (0.0%) | 0 (0.0%) |
| Construction | 54 (81.8%) | 12 (18.2%) |
| Manufacturing | 108 (83.1%) | 22 (16.9%) |
| Wholesale Trade | 40 (83.3%) | 8 (16.7%) |
| Retail Trade | 62 (84.9%) | 11 (15.1%) |
| Transportation & Warehousing | 18 (62.1%) | 11 (37.9%) |
| Utilities | 0 (0.0%) | 0 (0.0%) |
| Information | 56 (88.9%) | 7 (11.1%) |
| Finance & Insurance | 91 (46.9%) | 103 (53.1%) |
| Real Estate, Rental & Leasing | 16 (100.0%) | 0 (0.0%) |
| Professional & Scientific | 205 (45.9%) | 242 (54.1%) |
| Enterprise Management | 0 (0.0%) | 0 (0.0%) |
| Administrative & Support | 27 (77.1%) | 8 (22.9%) |
| Educational Services | 130 (47.8%) | 142 (52.2%) |
| Health Care & Social Assistance | 159 (39.4%) | 245 (60.6%) |
| Arts, Entertainment & Recreation | 42 (79.2%) | 11 (20.7%) |
| Accommodation & Food Services | 77 (53.5%) | 67 (46.5%) |
| Public Administration | 74 (86.1%) | 12 (14.0%) |
| Total | 1,168 (55.2%) | 947 (44.8%) |
Education in Montebello
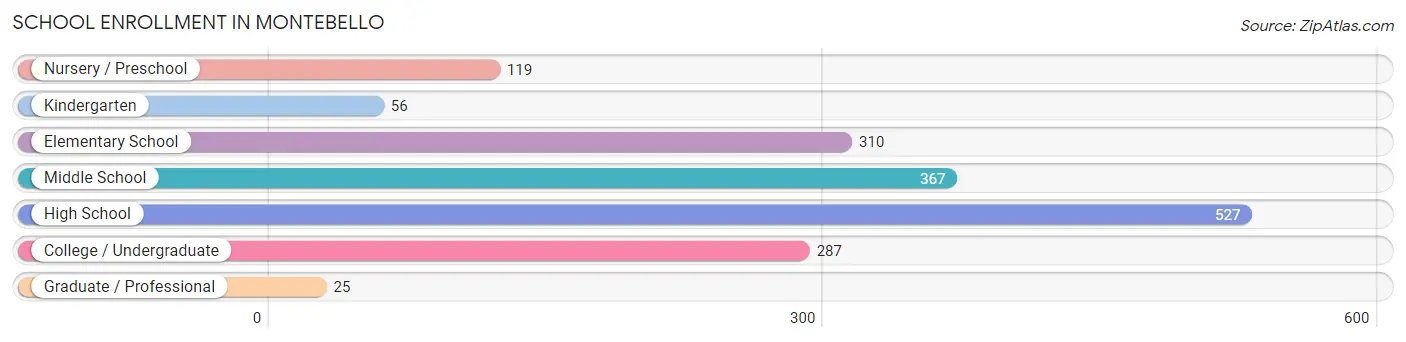
School Enrollment in Montebello
The most common levels of schooling among the 1,691 students in Montebello are high school (527 | 31.2%), middle school (367 | 21.7%), and elementary school (310 | 18.3%).
| School Level | # Students | % Students |
| Nursery / Preschool | 119 | 7.0% |
| Kindergarten | 56 | 3.3% |
| Elementary School | 310 | 18.3% |
| Middle School | 367 | 21.7% |
| High School | 527 | 31.2% |
| College / Undergraduate | 287 | 17.0% |
| Graduate / Professional | 25 | 1.5% |
| Total | 1,691 | 100.0% |
School Enrollment by Age by Funding Source in Montebello
Out of a total of 1,691 students who are enrolled in schools in Montebello, 671 (39.7%) attend a private institution, while the remaining 1,020 (60.3%) are enrolled in public schools. The age group of 20 to 24 year olds has the highest likelihood of being enrolled in private schools, with 87 (76.3% in the age bracket) enrolled. Conversely, the age group of 18 to 19 year olds has the lowest likelihood of being enrolled in a private school, with 179 (100.0% in the age bracket) attending a public institution.
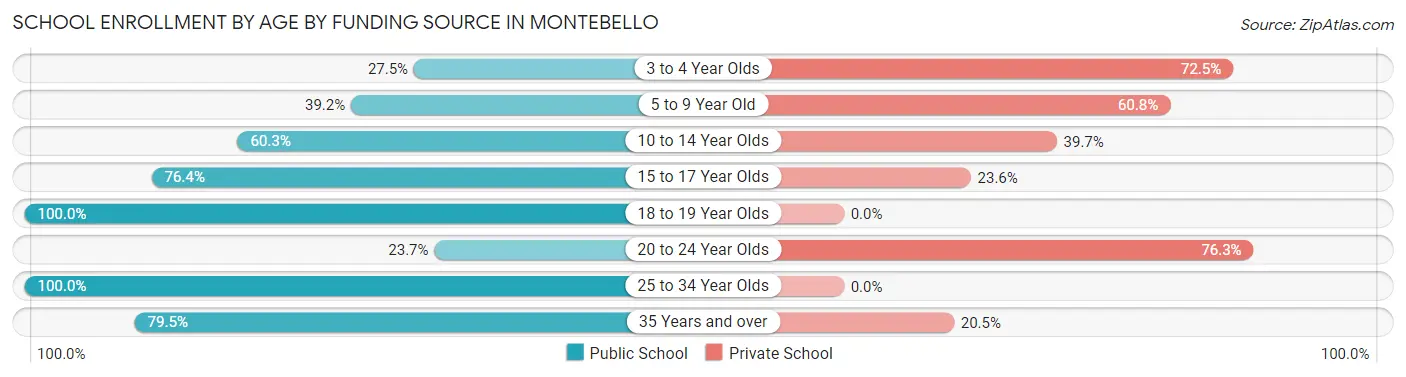
| Age Bracket | Public School | Private School |
| 3 to 4 Year Olds | 36 (27.5%) | 95 (72.5%) |
| 5 to 9 Year Old | 127 (39.2%) | 197 (60.8%) |
| 10 to 14 Year Olds | 283 (60.3%) | 186 (39.7%) |
| 15 to 17 Year Olds | 294 (76.4%) | 91 (23.6%) |
| 18 to 19 Year Olds | 179 (100.0%) | 0 (0.0%) |
| 20 to 24 Year Olds | 27 (23.7%) | 87 (76.3%) |
| 25 to 34 Year Olds | 11 (100.0%) | 0 (0.0%) |
| 35 Years and over | 62 (79.5%) | 16 (20.5%) |
| Total | 1,020 (60.3%) | 671 (39.7%) |
Educational Attainment by Field of Study in Montebello
Business (302 | 15.8%), visual & performing arts (224 | 11.7%), science & technology (209 | 10.9%), social sciences (194 | 10.1%), and education (173 | 9.0%) are the most common fields of study among 1,914 individuals in Montebello who have obtained a bachelor's degree or higher.
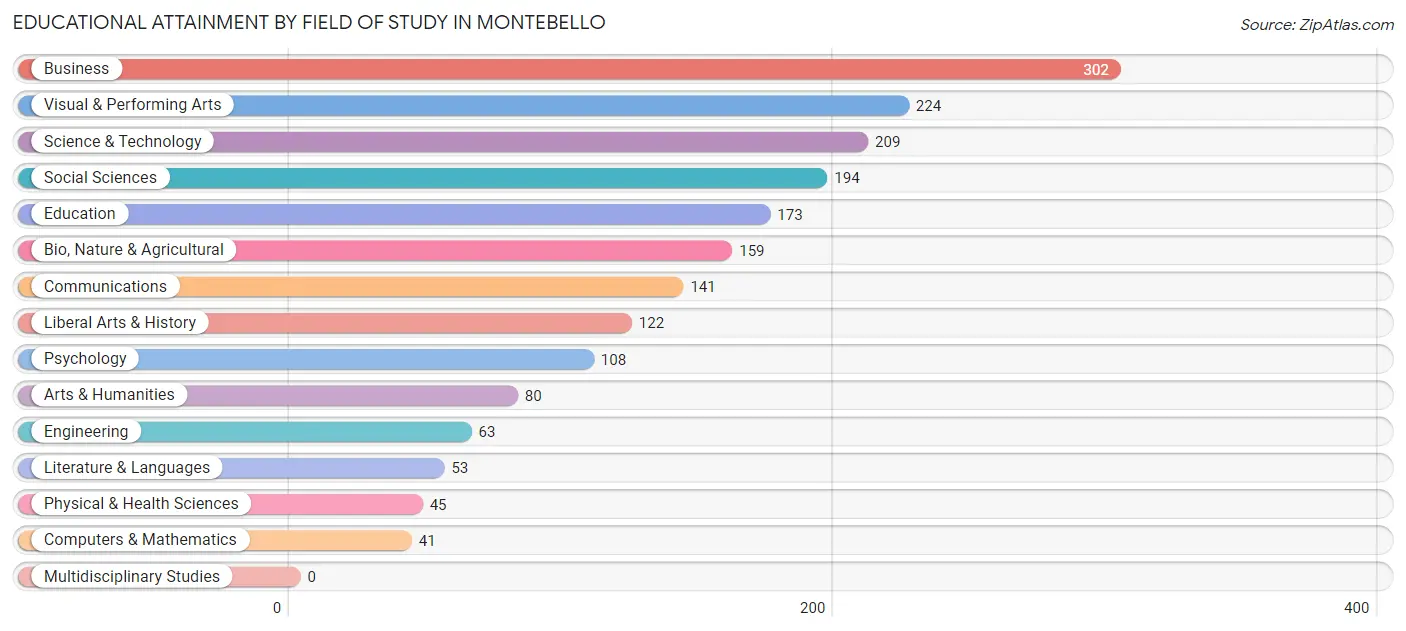
| Field of Study | # Graduates | % Graduates |
| Computers & Mathematics | 41 | 2.1% |
| Bio, Nature & Agricultural | 159 | 8.3% |
| Physical & Health Sciences | 45 | 2.4% |
| Psychology | 108 | 5.6% |
| Social Sciences | 194 | 10.1% |
| Engineering | 63 | 3.3% |
| Multidisciplinary Studies | 0 | 0.0% |
| Science & Technology | 209 | 10.9% |
| Business | 302 | 15.8% |
| Education | 173 | 9.0% |
| Literature & Languages | 53 | 2.8% |
| Liberal Arts & History | 122 | 6.4% |
| Visual & Performing Arts | 224 | 11.7% |
| Communications | 141 | 7.4% |
| Arts & Humanities | 80 | 4.2% |
| Total | 1,914 | 100.0% |
Transportation & Commute in Montebello
Vehicle Availability by Sex in Montebello
The most prevalent vehicle ownership categories in Montebello are males with 3 vehicles (495, accounting for 42.1%) and females with 3 vehicles (342, making up 52.3%).
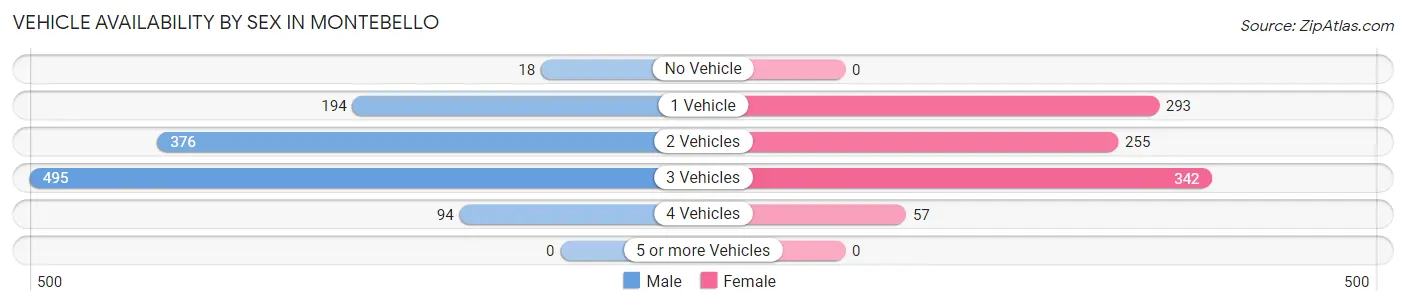
| Vehicles Available | Male | Female |
| No Vehicle | 18 (1.5%) | 0 (0.0%) |
| 1 Vehicle | 194 (16.5%) | 293 (30.9%) |
| 2 Vehicles | 376 (32.0%) | 255 (26.9%) |
| 3 Vehicles | 495 (42.1%) | 342 (36.1%) |
| 4 Vehicles | 94 (8.0%) | 57 (6.0%) |
| 5 or more Vehicles | 0 (0.0%) | 0 (0.0%) |
| Total | 1,177 (100.0%) | 947 (100.0%) |
Commute Time in Montebello
The most frequently occuring commute durations in Montebello are 15 to 19 minutes (355 commuters, 19.5%), 60 to 89 minutes (265 commuters, 14.6%), and 20 to 24 minutes (212 commuters, 11.7%).
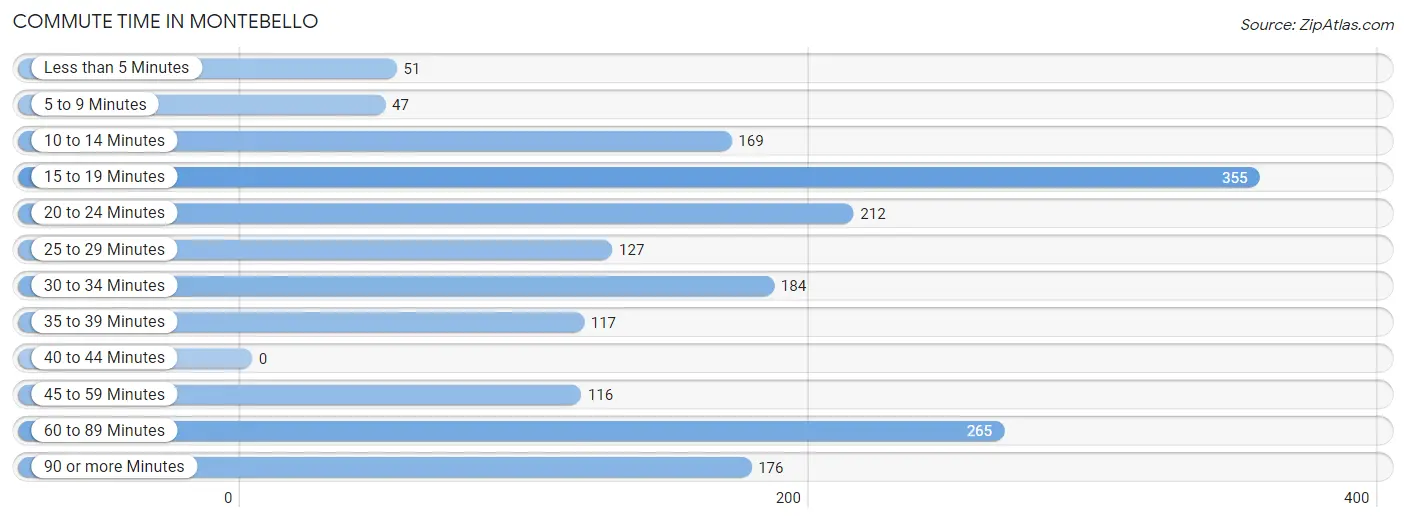
| Commute Time | # Commuters | % Commuters |
| Less than 5 Minutes | 51 | 2.8% |
| 5 to 9 Minutes | 47 | 2.6% |
| 10 to 14 Minutes | 169 | 9.3% |
| 15 to 19 Minutes | 355 | 19.5% |
| 20 to 24 Minutes | 212 | 11.7% |
| 25 to 29 Minutes | 127 | 7.0% |
| 30 to 34 Minutes | 184 | 10.1% |
| 35 to 39 Minutes | 117 | 6.4% |
| 40 to 44 Minutes | 0 | 0.0% |
| 45 to 59 Minutes | 116 | 6.4% |
| 60 to 89 Minutes | 265 | 14.6% |
| 90 or more Minutes | 176 | 9.7% |
Commute Time by Sex in Montebello
The most common commute times in Montebello are 60 to 89 minutes (187 commuters, 18.6%) for males and 15 to 19 minutes (221 commuters, 27.1%) for females.
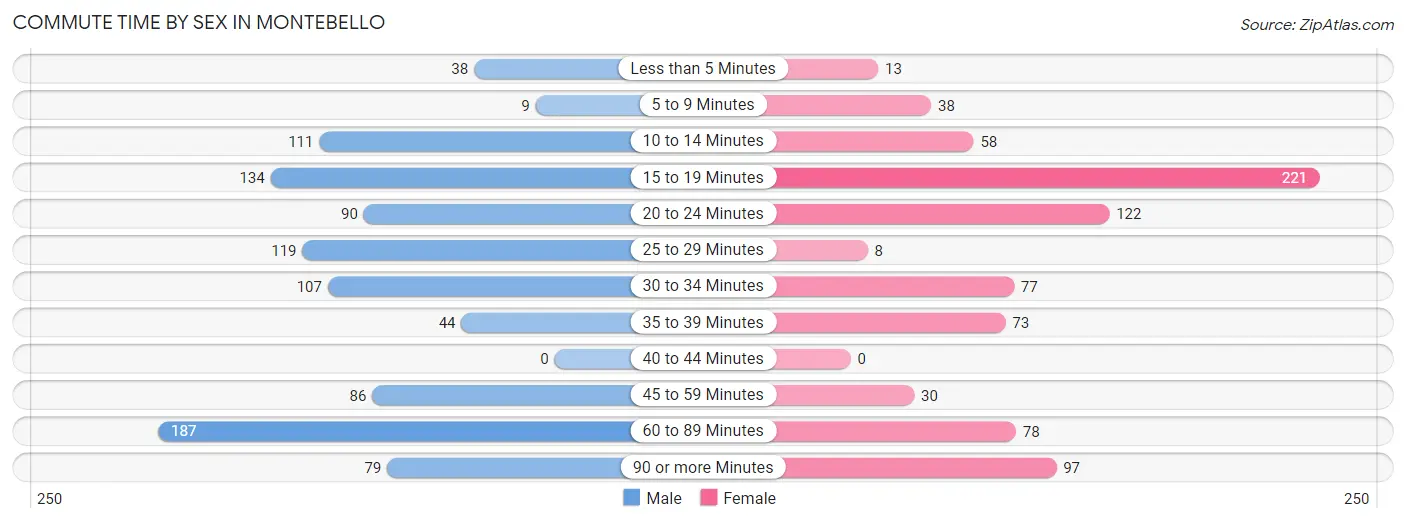
| Commute Time | Male | Female |
| Less than 5 Minutes | 38 (3.8%) | 13 (1.6%) |
| 5 to 9 Minutes | 9 (0.9%) | 38 (4.7%) |
| 10 to 14 Minutes | 111 (11.1%) | 58 (7.1%) |
| 15 to 19 Minutes | 134 (13.4%) | 221 (27.1%) |
| 20 to 24 Minutes | 90 (9.0%) | 122 (15.0%) |
| 25 to 29 Minutes | 119 (11.8%) | 8 (1.0%) |
| 30 to 34 Minutes | 107 (10.7%) | 77 (9.5%) |
| 35 to 39 Minutes | 44 (4.4%) | 73 (9.0%) |
| 40 to 44 Minutes | 0 (0.0%) | 0 (0.0%) |
| 45 to 59 Minutes | 86 (8.6%) | 30 (3.7%) |
| 60 to 89 Minutes | 187 (18.6%) | 78 (9.6%) |
| 90 or more Minutes | 79 (7.9%) | 97 (11.9%) |
Time of Departure to Work by Sex in Montebello
The most frequent times of departure to work in Montebello are 7:30 AM to 7:59 AM (190, 18.9%) for males and 8:00 AM to 8:29 AM (171, 21.0%) for females.
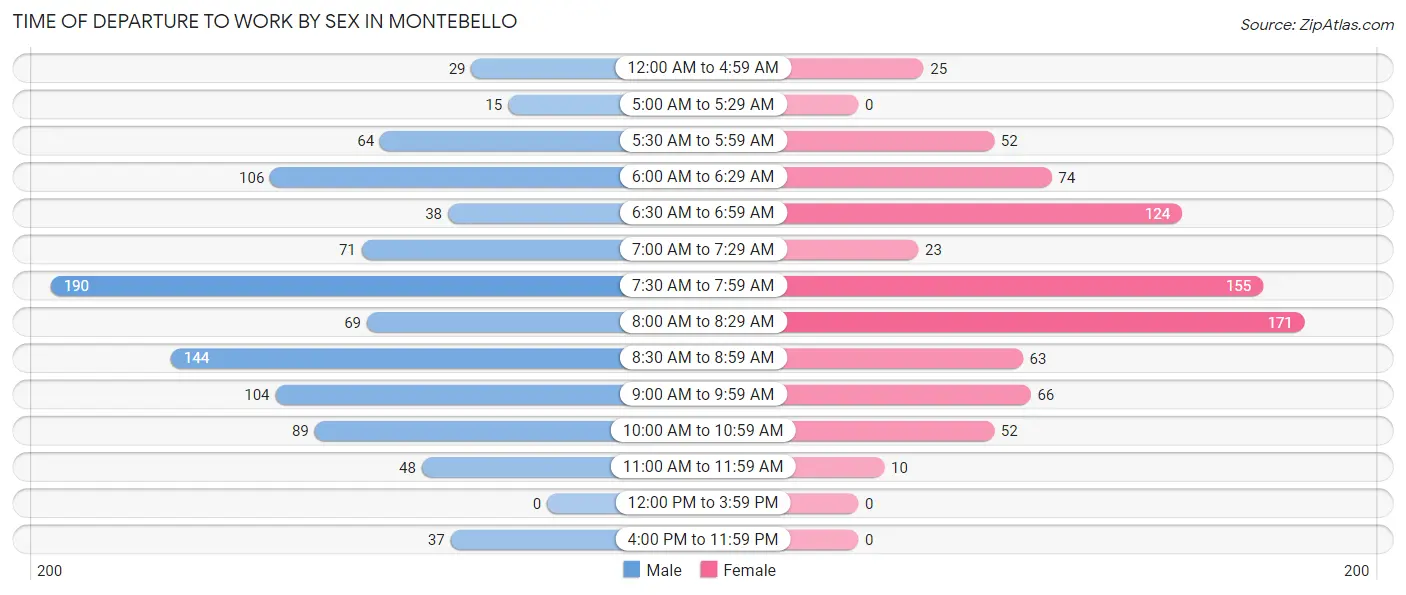
| Time of Departure | Male | Female |
| 12:00 AM to 4:59 AM | 29 (2.9%) | 25 (3.1%) |
| 5:00 AM to 5:29 AM | 15 (1.5%) | 0 (0.0%) |
| 5:30 AM to 5:59 AM | 64 (6.4%) | 52 (6.4%) |
| 6:00 AM to 6:29 AM | 106 (10.6%) | 74 (9.1%) |
| 6:30 AM to 6:59 AM | 38 (3.8%) | 124 (15.2%) |
| 7:00 AM to 7:29 AM | 71 (7.1%) | 23 (2.8%) |
| 7:30 AM to 7:59 AM | 190 (18.9%) | 155 (19.0%) |
| 8:00 AM to 8:29 AM | 69 (6.9%) | 171 (21.0%) |
| 8:30 AM to 8:59 AM | 144 (14.3%) | 63 (7.7%) |
| 9:00 AM to 9:59 AM | 104 (10.4%) | 66 (8.1%) |
| 10:00 AM to 10:59 AM | 89 (8.9%) | 52 (6.4%) |
| 11:00 AM to 11:59 AM | 48 (4.8%) | 10 (1.2%) |
| 12:00 PM to 3:59 PM | 0 (0.0%) | 0 (0.0%) |
| 4:00 PM to 11:59 PM | 37 (3.7%) | 0 (0.0%) |
| Total | 1,004 (100.0%) | 815 (100.0%) |
Housing Occupancy in Montebello
Occupancy by Ownership in Montebello
Of the total 1,560 dwellings in Montebello, owner-occupied units account for 1,293 (82.9%), while renter-occupied units make up 267 (17.1%).
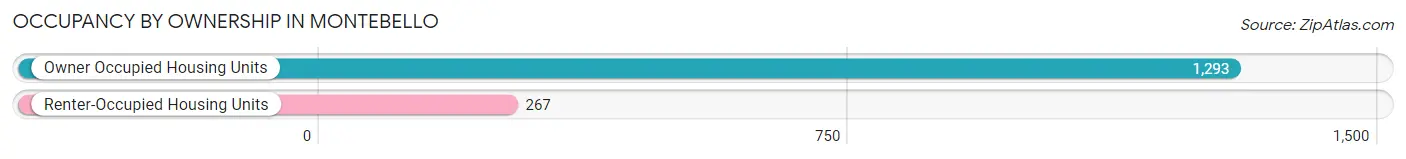
| Occupancy | # Housing Units | % Housing Units |
| Owner Occupied Housing Units | 1,293 | 82.9% |
| Renter-Occupied Housing Units | 267 | 17.1% |
| Total Occupied Housing Units | 1,560 | 100.0% |
Occupancy by Household Size in Montebello
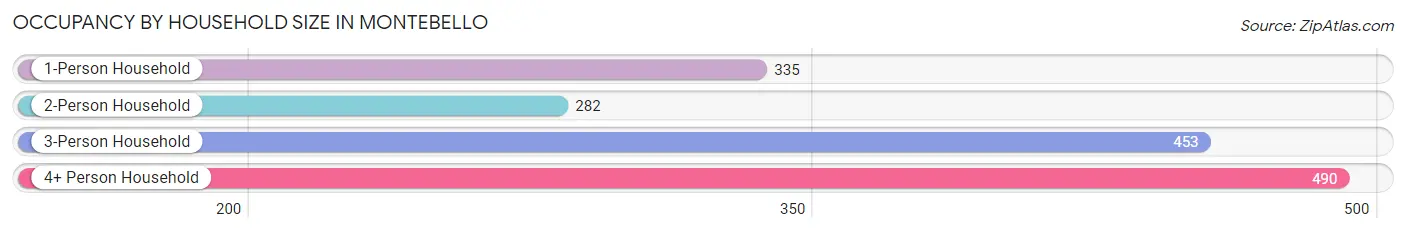
| Household Size | # Housing Units | % Housing Units |
| 1-Person Household | 335 | 21.5% |
| 2-Person Household | 282 | 18.1% |
| 3-Person Household | 453 | 29.0% |
| 4+ Person Household | 490 | 31.4% |
| Total Housing Units | 1,560 | 100.0% |
Occupancy by Ownership by Household Size in Montebello
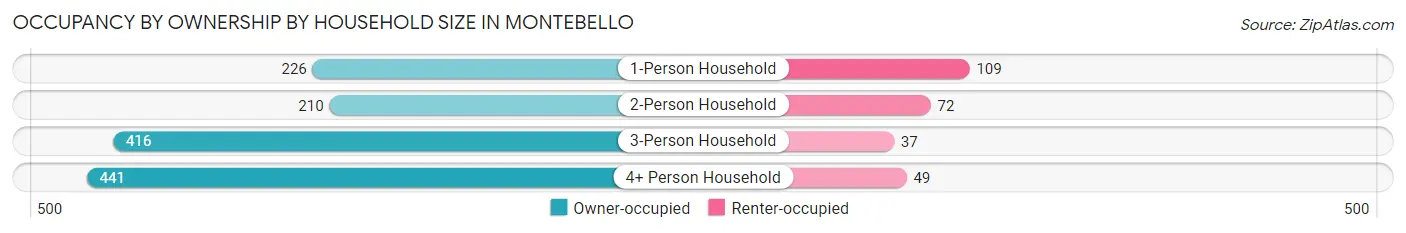
| Household Size | Owner-occupied | Renter-occupied |
| 1-Person Household | 226 (67.5%) | 109 (32.5%) |
| 2-Person Household | 210 (74.5%) | 72 (25.5%) |
| 3-Person Household | 416 (91.8%) | 37 (8.2%) |
| 4+ Person Household | 441 (90.0%) | 49 (10.0%) |
| Total Housing Units | 1,293 (82.9%) | 267 (17.1%) |
Occupancy by Educational Attainment in Montebello
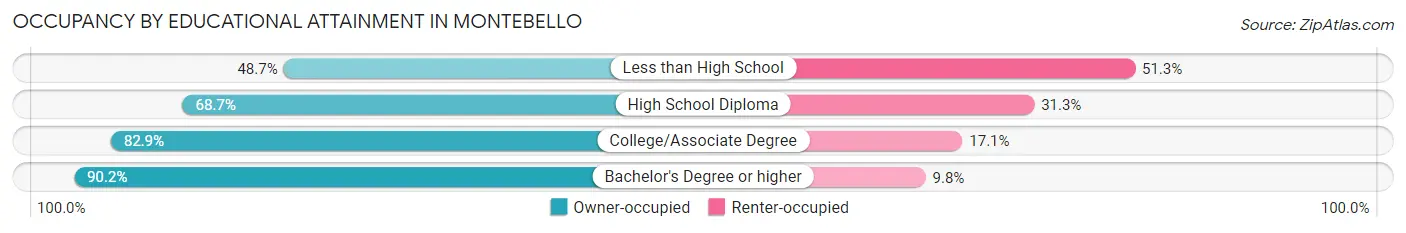
| Household Size | Owner-occupied | Renter-occupied |
| Less than High School | 55 (48.7%) | 58 (51.3%) |
| High School Diploma | 160 (68.7%) | 73 (31.3%) |
| College/Associate Degree | 194 (82.9%) | 40 (17.1%) |
| Bachelor's Degree or higher | 884 (90.2%) | 96 (9.8%) |
Occupancy by Age of Householder in Montebello
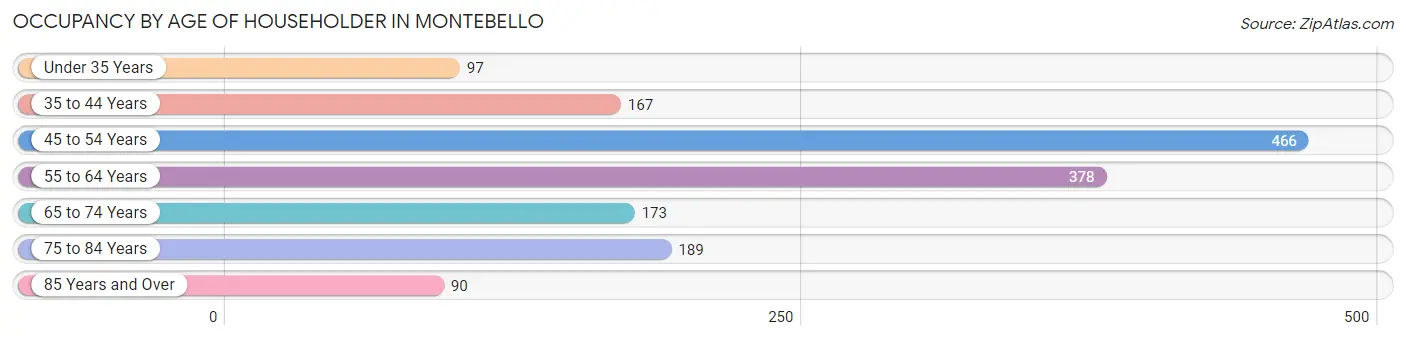
| Age Bracket | # Households | % Households |
| Under 35 Years | 97 | 6.2% |
| 35 to 44 Years | 167 | 10.7% |
| 45 to 54 Years | 466 | 29.9% |
| 55 to 64 Years | 378 | 24.2% |
| 65 to 74 Years | 173 | 11.1% |
| 75 to 84 Years | 189 | 12.1% |
| 85 Years and Over | 90 | 5.8% |
| Total | 1,560 | 100.0% |
Housing Finances in Montebello
Median Income by Occupancy in Montebello
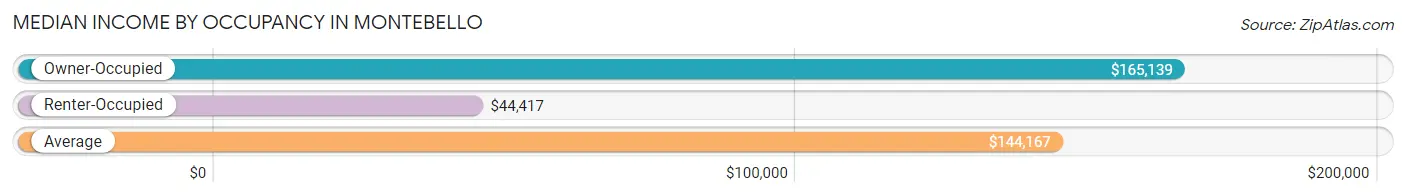
| Occupancy Type | # Households | Median Income |
| Owner-Occupied | 1,293 (82.9%) | $165,139 |
| Renter-Occupied | 267 (17.1%) | $44,417 |
| Average | 1,560 (100.0%) | $144,167 |
Occupancy by Householder Income Bracket in Montebello
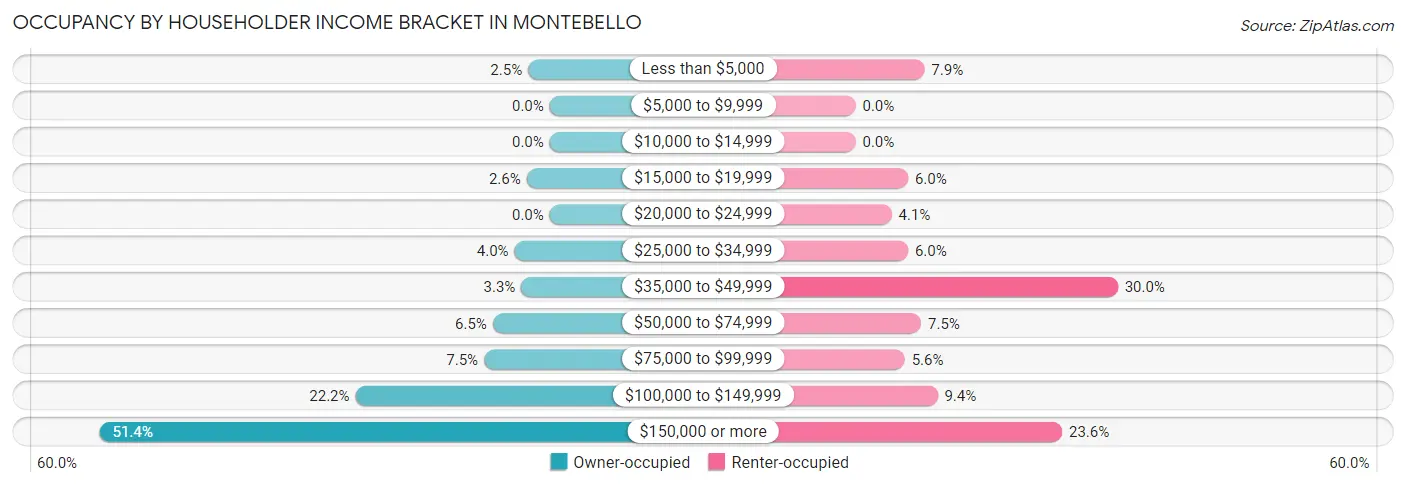
| Income Bracket | Owner-occupied | Renter-occupied |
| Less than $5,000 | 32 (2.5%) | 21 (7.9%) |
| $5,000 to $9,999 | 0 (0.0%) | 0 (0.0%) |
| $10,000 to $14,999 | 0 (0.0%) | 0 (0.0%) |
| $15,000 to $19,999 | 34 (2.6%) | 16 (6.0%) |
| $20,000 to $24,999 | 0 (0.0%) | 11 (4.1%) |
| $25,000 to $34,999 | 52 (4.0%) | 16 (6.0%) |
| $35,000 to $49,999 | 42 (3.3%) | 80 (30.0%) |
| $50,000 to $74,999 | 84 (6.5%) | 20 (7.5%) |
| $75,000 to $99,999 | 97 (7.5%) | 15 (5.6%) |
| $100,000 to $149,999 | 287 (22.2%) | 25 (9.4%) |
| $150,000 or more | 665 (51.4%) | 63 (23.6%) |
| Total | 1,293 (100.0%) | 267 (100.0%) |
Monthly Housing Cost Tiers in Montebello
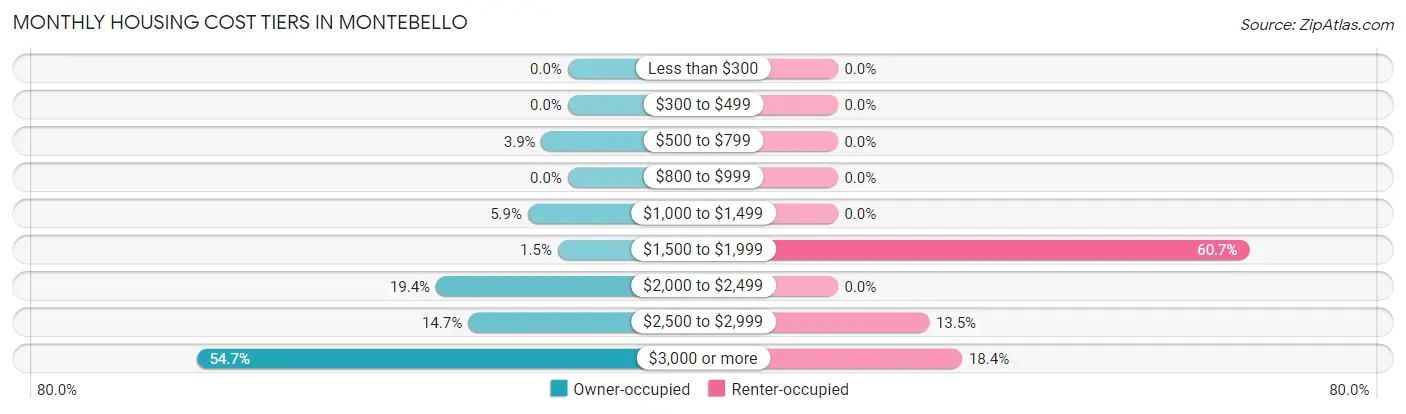
| Monthly Cost | Owner-occupied | Renter-occupied |
| Less than $300 | 0 (0.0%) | 0 (0.0%) |
| $300 to $499 | 0 (0.0%) | 0 (0.0%) |
| $500 to $799 | 50 (3.9%) | 0 (0.0%) |
| $800 to $999 | 0 (0.0%) | 0 (0.0%) |
| $1,000 to $1,499 | 76 (5.9%) | 0 (0.0%) |
| $1,500 to $1,999 | 19 (1.5%) | 162 (60.7%) |
| $2,000 to $2,499 | 251 (19.4%) | 0 (0.0%) |
| $2,500 to $2,999 | 190 (14.7%) | 36 (13.5%) |
| $3,000 or more | 707 (54.7%) | 49 (18.3%) |
| Total | 1,293 (100.0%) | 267 (100.0%) |
Physical Housing Characteristics in Montebello
Housing Structures in Montebello
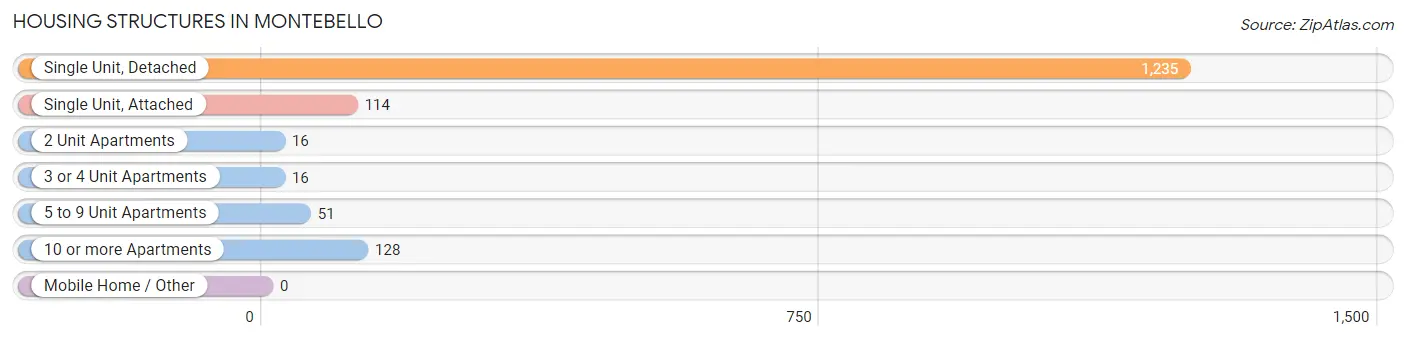
| Structure Type | # Housing Units | % Housing Units |
| Single Unit, Detached | 1,235 | 79.2% |
| Single Unit, Attached | 114 | 7.3% |
| 2 Unit Apartments | 16 | 1.0% |
| 3 or 4 Unit Apartments | 16 | 1.0% |
| 5 to 9 Unit Apartments | 51 | 3.3% |
| 10 or more Apartments | 128 | 8.2% |
| Mobile Home / Other | 0 | 0.0% |
| Total | 1,560 | 100.0% |
Housing Structures by Occupancy in Montebello
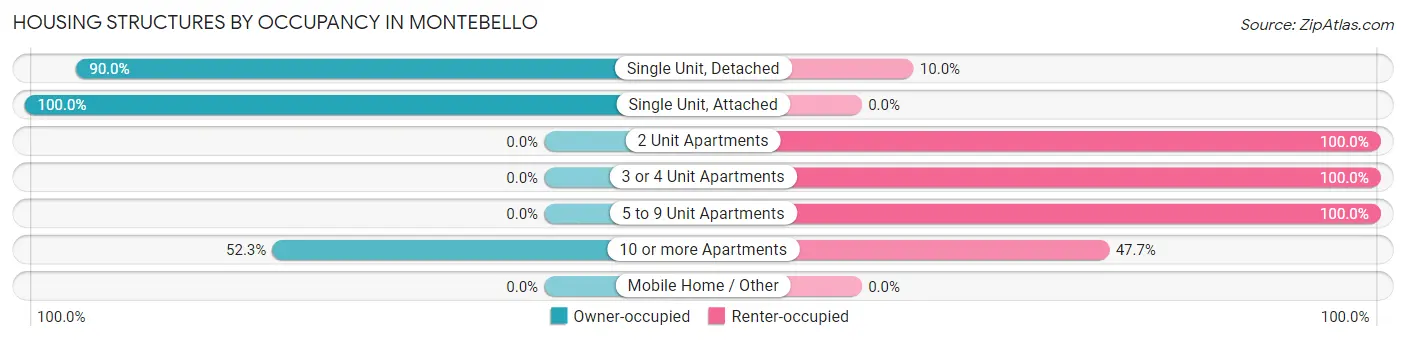
| Structure Type | Owner-occupied | Renter-occupied |
| Single Unit, Detached | 1,112 (90.0%) | 123 (10.0%) |
| Single Unit, Attached | 114 (100.0%) | 0 (0.0%) |
| 2 Unit Apartments | 0 (0.0%) | 16 (100.0%) |
| 3 or 4 Unit Apartments | 0 (0.0%) | 16 (100.0%) |
| 5 to 9 Unit Apartments | 0 (0.0%) | 51 (100.0%) |
| 10 or more Apartments | 67 (52.3%) | 61 (47.7%) |
| Mobile Home / Other | 0 (0.0%) | 0 (0.0%) |
| Total | 1,293 (82.9%) | 267 (17.1%) |
Housing Structures by Number of Rooms in Montebello
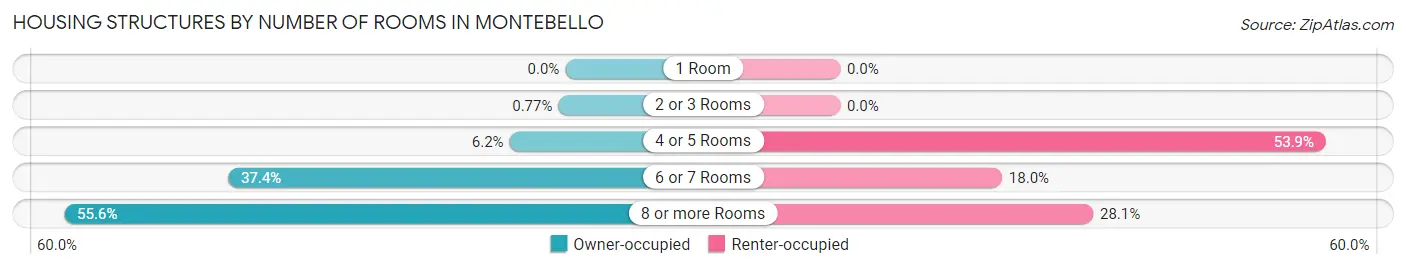
| Number of Rooms | Owner-occupied | Renter-occupied |
| 1 Room | 0 (0.0%) | 0 (0.0%) |
| 2 or 3 Rooms | 10 (0.8%) | 0 (0.0%) |
| 4 or 5 Rooms | 80 (6.2%) | 144 (53.9%) |
| 6 or 7 Rooms | 484 (37.4%) | 48 (18.0%) |
| 8 or more Rooms | 719 (55.6%) | 75 (28.1%) |
| Total | 1,293 (100.0%) | 267 (100.0%) |
Housing Structure by Heating Type in Montebello
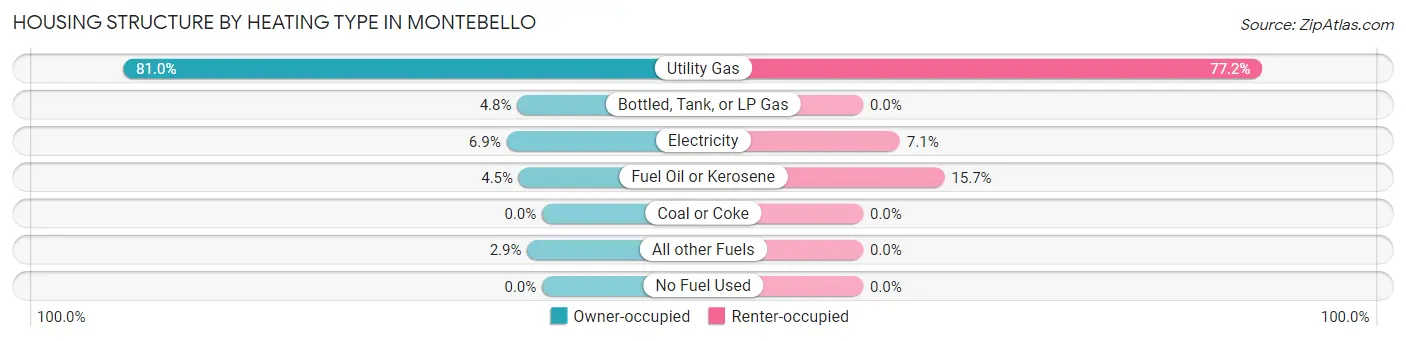
| Heating Type | Owner-occupied | Renter-occupied |
| Utility Gas | 1,047 (81.0%) | 206 (77.1%) |
| Bottled, Tank, or LP Gas | 62 (4.8%) | 0 (0.0%) |
| Electricity | 89 (6.9%) | 19 (7.1%) |
| Fuel Oil or Kerosene | 58 (4.5%) | 42 (15.7%) |
| Coal or Coke | 0 (0.0%) | 0 (0.0%) |
| All other Fuels | 37 (2.9%) | 0 (0.0%) |
| No Fuel Used | 0 (0.0%) | 0 (0.0%) |
| Total | 1,293 (100.0%) | 267 (100.0%) |
Household Vehicle Usage in Montebello
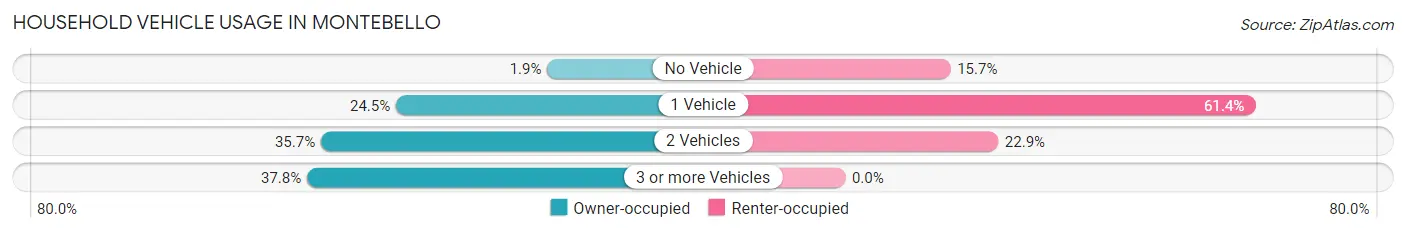
| Vehicles per Household | Owner-occupied | Renter-occupied |
| No Vehicle | 25 (1.9%) | 42 (15.7%) |
| 1 Vehicle | 317 (24.5%) | 164 (61.4%) |
| 2 Vehicles | 462 (35.7%) | 61 (22.9%) |
| 3 or more Vehicles | 489 (37.8%) | 0 (0.0%) |
| Total | 1,293 (100.0%) | 267 (100.0%) |
Real Estate & Mortgages in Montebello
Real Estate and Mortgage Overview in Montebello
| Characteristic | Without Mortgage | With Mortgage |
| Housing Units | 556 | 737 |
| Median Property Value | $656,600 | $766,900 |
| Median Household Income | $183,409 | $361 |
| Monthly Housing Costs | $1,501 | $583 |
| Real Estate Taxes | $10,001 | $0 |
Property Value by Mortgage Status in Montebello
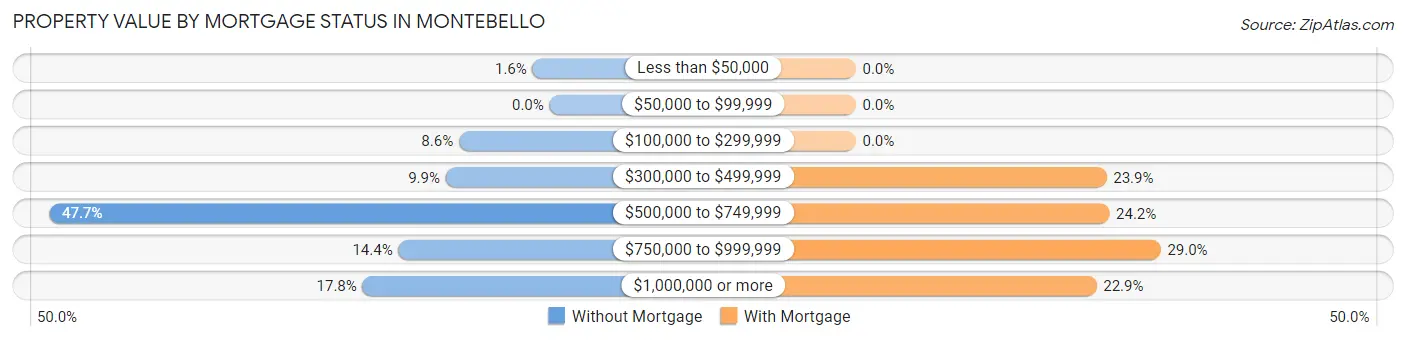
| Property Value | Without Mortgage | With Mortgage |
| Less than $50,000 | 9 (1.6%) | 0 (0.0%) |
| $50,000 to $99,999 | 0 (0.0%) | 0 (0.0%) |
| $100,000 to $299,999 | 48 (8.6%) | 0 (0.0%) |
| $300,000 to $499,999 | 55 (9.9%) | 176 (23.9%) |
| $500,000 to $749,999 | 265 (47.7%) | 178 (24.1%) |
| $750,000 to $999,999 | 80 (14.4%) | 214 (29.0%) |
| $1,000,000 or more | 99 (17.8%) | 169 (22.9%) |
| Total | 556 (100.0%) | 737 (100.0%) |
Household Income by Mortgage Status in Montebello
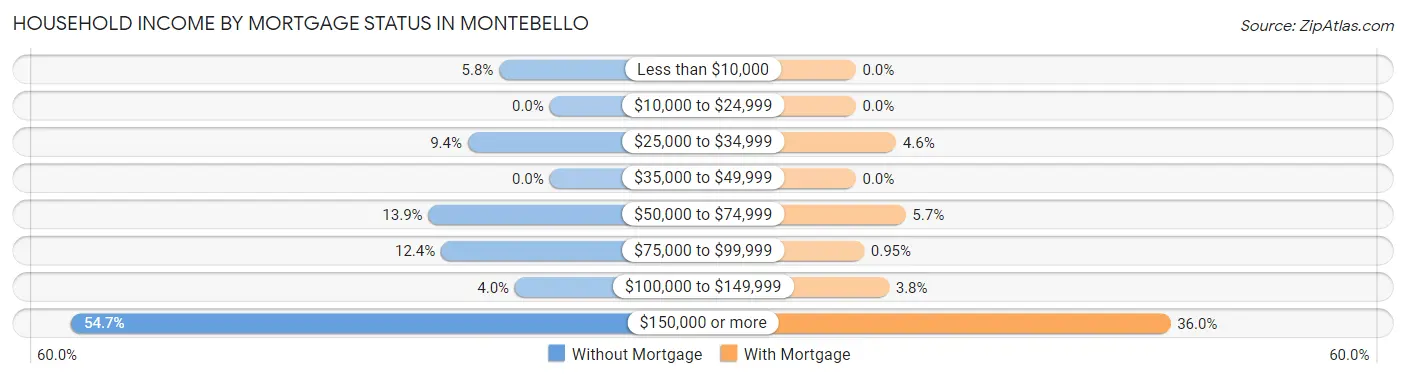
| Household Income | Without Mortgage | With Mortgage |
| Less than $10,000 | 32 (5.8%) | 0 (0.0%) |
| $10,000 to $24,999 | 0 (0.0%) | 0 (0.0%) |
| $25,000 to $34,999 | 52 (9.3%) | 34 (4.6%) |
| $35,000 to $49,999 | 0 (0.0%) | 0 (0.0%) |
| $50,000 to $74,999 | 77 (13.9%) | 42 (5.7%) |
| $75,000 to $99,999 | 69 (12.4%) | 7 (0.9%) |
| $100,000 to $149,999 | 22 (4.0%) | 28 (3.8%) |
| $150,000 or more | 304 (54.7%) | 265 (36.0%) |
| Total | 556 (100.0%) | 737 (100.0%) |
Property Value to Household Income Ratio in Montebello
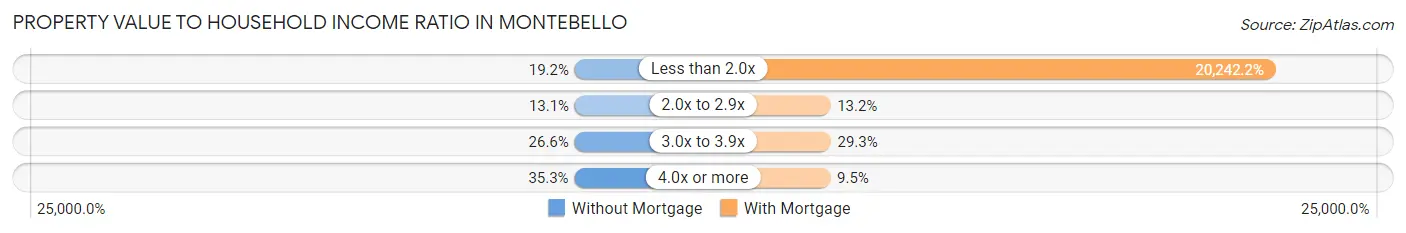
| Value-to-Income Ratio | Without Mortgage | With Mortgage |
| Less than 2.0x | 107 (19.2%) | 149,185 (20,242.2%) |
| 2.0x to 2.9x | 73 (13.1%) | 97 (13.2%) |
| 3.0x to 3.9x | 148 (26.6%) | 216 (29.3%) |
| 4.0x or more | 196 (35.2%) | 70 (9.5%) |
| Total | 556 (100.0%) | 737 (100.0%) |
Real Estate Taxes by Mortgage Status in Montebello
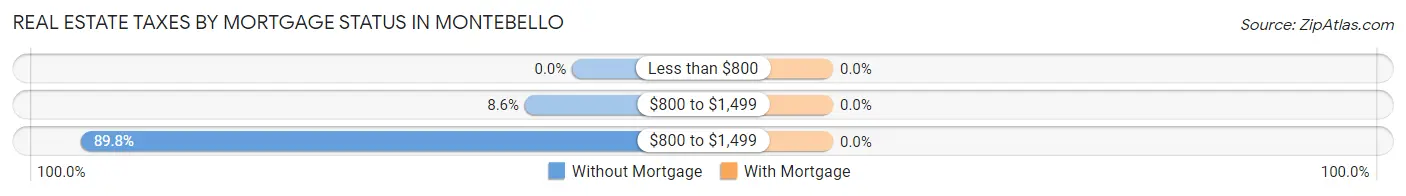
| Property Taxes | Without Mortgage | With Mortgage |
| Less than $800 | 0 (0.0%) | 0 (0.0%) |
| $800 to $1,499 | 48 (8.6%) | 0 (0.0%) |
| $800 to $1,499 | 499 (89.7%) | 0 (0.0%) |
| Total | 556 (100.0%) | 737 (100.0%) |
Health & Disability in Montebello
Health Insurance Coverage by Age in Montebello
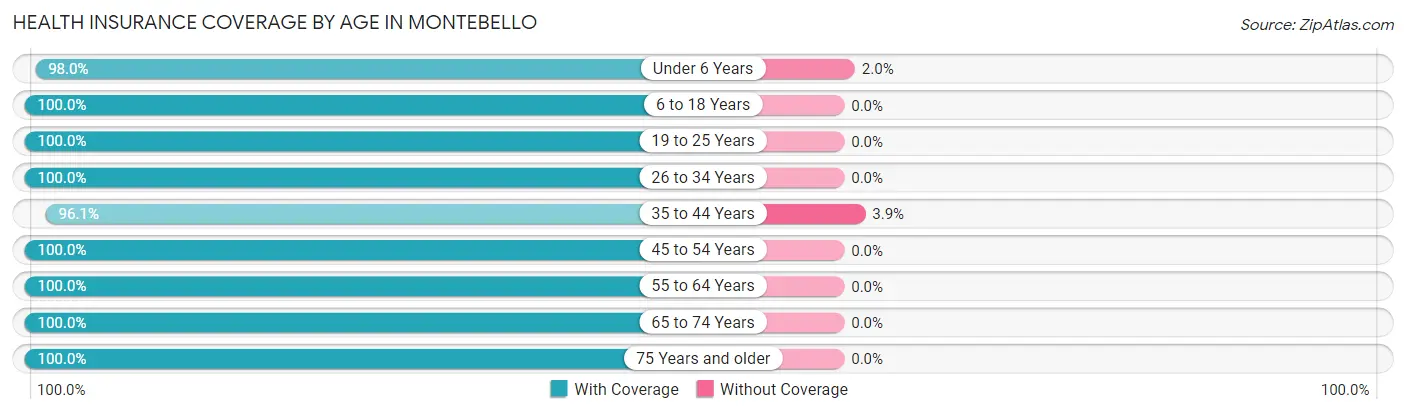
| Age Bracket | With Coverage | Without Coverage |
| Under 6 Years | 248 (98.0%) | 5 (2.0%) |
| 6 to 18 Years | 1,242 (100.0%) | 0 (0.0%) |
| 19 to 25 Years | 430 (100.0%) | 0 (0.0%) |
| 26 to 34 Years | 326 (100.0%) | 0 (0.0%) |
| 35 to 44 Years | 293 (96.1%) | 12 (3.9%) |
| 45 to 54 Years | 848 (100.0%) | 0 (0.0%) |
| 55 to 64 Years | 613 (100.0%) | 0 (0.0%) |
| 65 to 74 Years | 243 (100.0%) | 0 (0.0%) |
| 75 Years and older | 376 (100.0%) | 0 (0.0%) |
| Total | 4,619 (99.6%) | 17 (0.4%) |
Health Insurance Coverage by Citizenship Status in Montebello
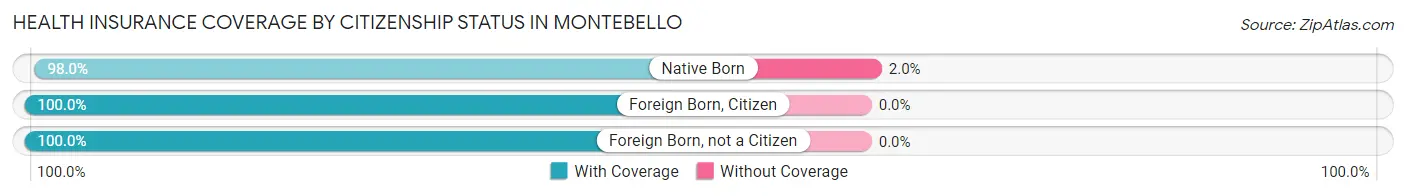
| Citizenship Status | With Coverage | Without Coverage |
| Native Born | 248 (98.0%) | 5 (2.0%) |
| Foreign Born, Citizen | 1,242 (100.0%) | 0 (0.0%) |
| Foreign Born, not a Citizen | 430 (100.0%) | 0 (0.0%) |
Health Insurance Coverage by Household Income in Montebello
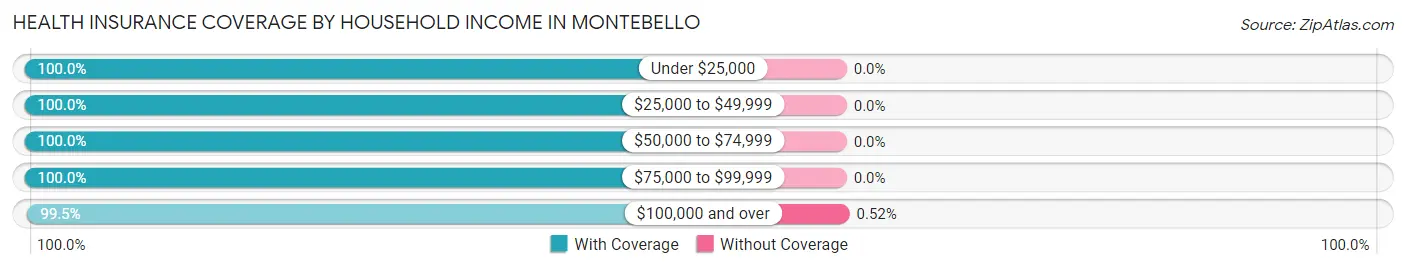
| Household Income | With Coverage | Without Coverage |
| Under $25,000 | 290 (100.0%) | 0 (0.0%) |
| $25,000 to $49,999 | 603 (100.0%) | 0 (0.0%) |
| $50,000 to $74,999 | 189 (100.0%) | 0 (0.0%) |
| $75,000 to $99,999 | 219 (100.0%) | 0 (0.0%) |
| $100,000 and over | 3,283 (99.5%) | 17 (0.5%) |
Public vs Private Health Insurance Coverage by Age in Montebello
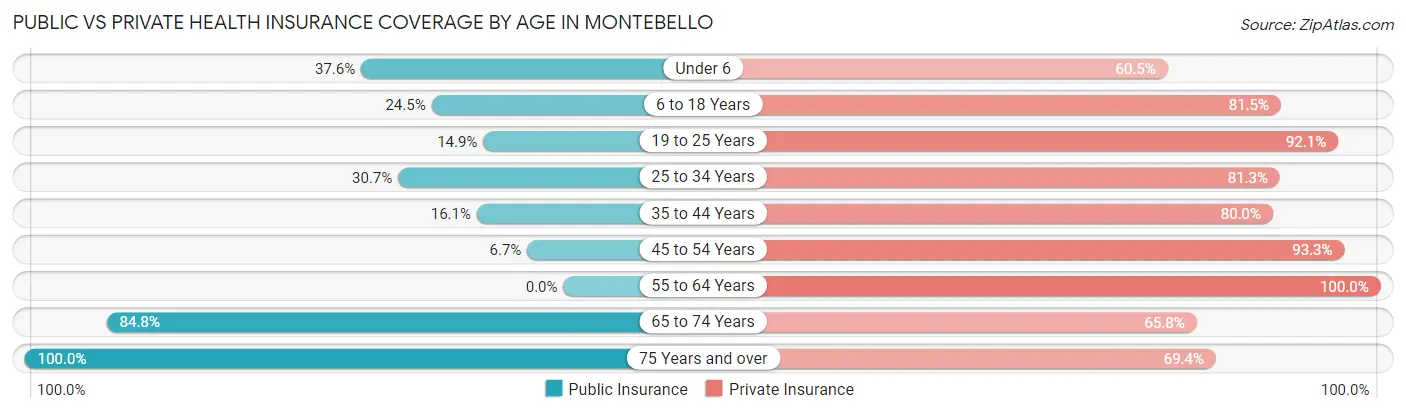
| Age Bracket | Public Insurance | Private Insurance |
| Under 6 | 95 (37.6%) | 153 (60.5%) |
| 6 to 18 Years | 304 (24.5%) | 1,012 (81.5%) |
| 19 to 25 Years | 64 (14.9%) | 396 (92.1%) |
| 25 to 34 Years | 100 (30.7%) | 265 (81.3%) |
| 35 to 44 Years | 49 (16.1%) | 244 (80.0%) |
| 45 to 54 Years | 57 (6.7%) | 791 (93.3%) |
| 55 to 64 Years | 0 (0.0%) | 613 (100.0%) |
| 65 to 74 Years | 206 (84.8%) | 160 (65.8%) |
| 75 Years and over | 376 (100.0%) | 261 (69.4%) |
| Total | 1,251 (27.0%) | 3,895 (84.0%) |
Disability Status by Sex by Age in Montebello
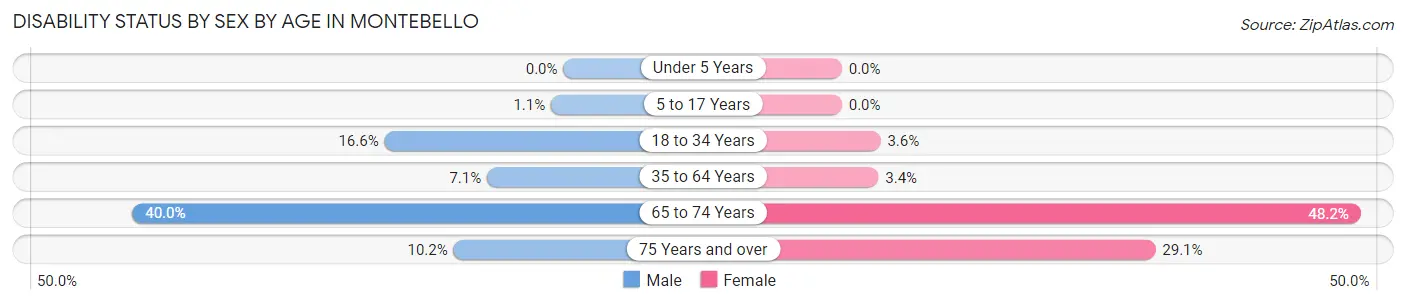
| Age Bracket | Male | Female |
| Under 5 Years | 0 (0.0%) | 0 (0.0%) |
| 5 to 17 Years | 7 (1.1%) | 0 (0.0%) |
| 18 to 34 Years | 87 (16.6%) | 12 (3.6%) |
| 35 to 64 Years | 54 (7.1%) | 34 (3.4%) |
| 65 to 74 Years | 54 (40.0%) | 52 (48.1%) |
| 75 Years and over | 11 (10.2%) | 78 (29.1%) |
Disability Class by Sex by Age in Montebello
Disability Class: Hearing Difficulty
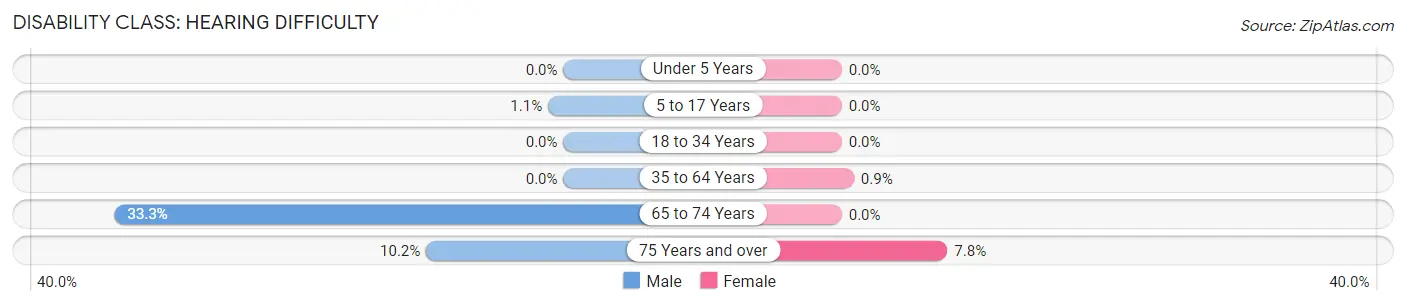
| Age Bracket | Male | Female |
| Under 5 Years | 0 (0.0%) | 0 (0.0%) |
| 5 to 17 Years | 7 (1.1%) | 0 (0.0%) |
| 18 to 34 Years | 0 (0.0%) | 0 (0.0%) |
| 35 to 64 Years | 0 (0.0%) | 9 (0.9%) |
| 65 to 74 Years | 45 (33.3%) | 0 (0.0%) |
| 75 Years and over | 11 (10.2%) | 21 (7.8%) |
Disability Class: Vision Difficulty
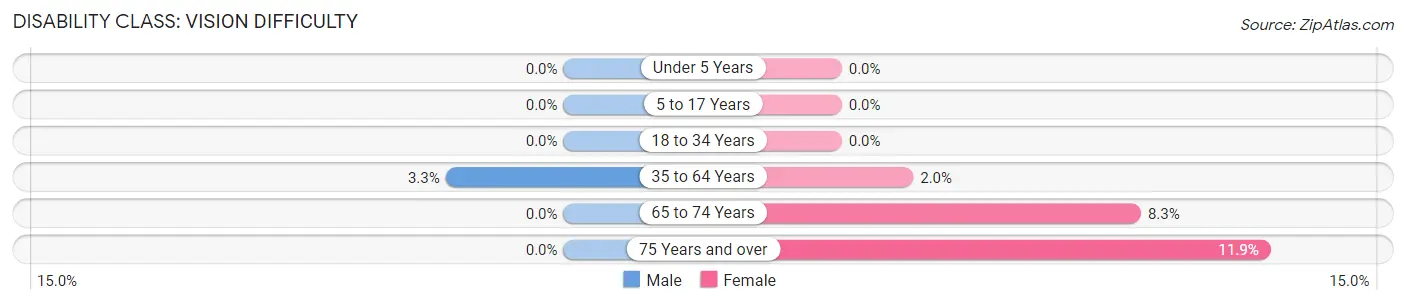
| Age Bracket | Male | Female |
| Under 5 Years | 0 (0.0%) | 0 (0.0%) |
| 5 to 17 Years | 0 (0.0%) | 0 (0.0%) |
| 18 to 34 Years | 0 (0.0%) | 0 (0.0%) |
| 35 to 64 Years | 25 (3.3%) | 20 (2.0%) |
| 65 to 74 Years | 0 (0.0%) | 9 (8.3%) |
| 75 Years and over | 0 (0.0%) | 32 (11.9%) |
Disability Class: Cognitive Difficulty
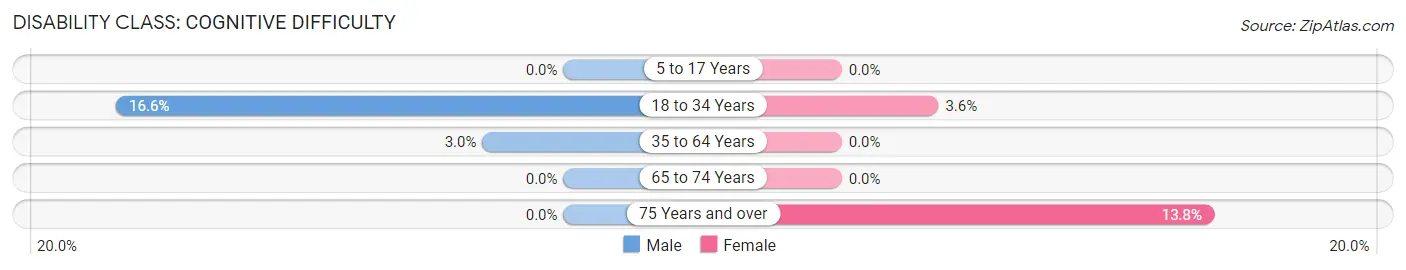
| Age Bracket | Male | Female |
| 5 to 17 Years | 0 (0.0%) | 0 (0.0%) |
| 18 to 34 Years | 87 (16.6%) | 12 (3.6%) |
| 35 to 64 Years | 23 (3.0%) | 0 (0.0%) |
| 65 to 74 Years | 0 (0.0%) | 0 (0.0%) |
| 75 Years and over | 0 (0.0%) | 37 (13.8%) |
Disability Class: Ambulatory Difficulty
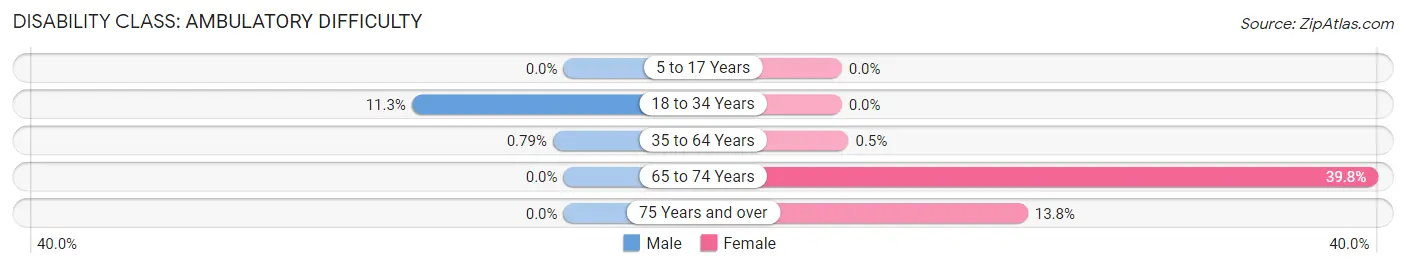
| Age Bracket | Male | Female |
| 5 to 17 Years | 0 (0.0%) | 0 (0.0%) |
| 18 to 34 Years | 59 (11.3%) | 0 (0.0%) |
| 35 to 64 Years | 6 (0.8%) | 5 (0.5%) |
| 65 to 74 Years | 0 (0.0%) | 43 (39.8%) |
| 75 Years and over | 0 (0.0%) | 37 (13.8%) |
Disability Class: Self-Care Difficulty
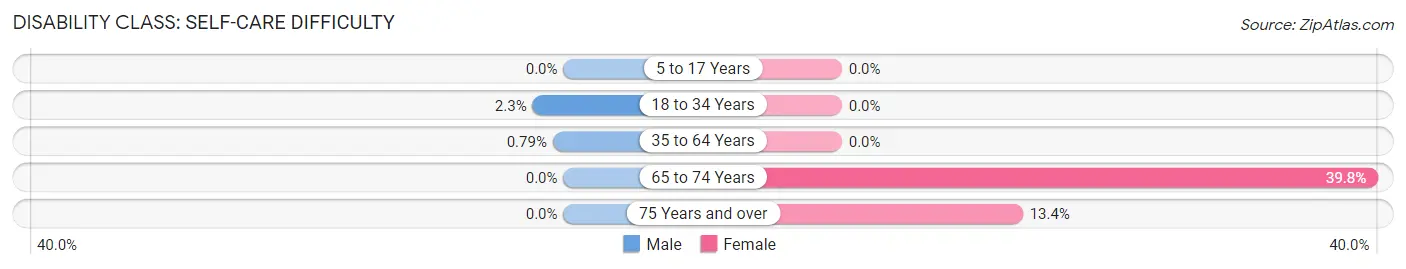
| Age Bracket | Male | Female |
| 5 to 17 Years | 0 (0.0%) | 0 (0.0%) |
| 18 to 34 Years | 12 (2.3%) | 0 (0.0%) |
| 35 to 64 Years | 6 (0.8%) | 0 (0.0%) |
| 65 to 74 Years | 0 (0.0%) | 43 (39.8%) |
| 75 Years and over | 0 (0.0%) | 36 (13.4%) |
Technology Access in Montebello
Computing Device Access in Montebello
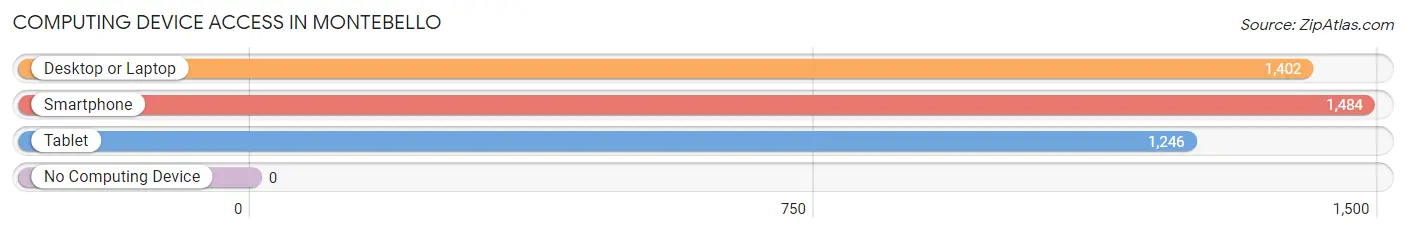
| Device Type | # Households | % Households |
| Desktop or Laptop | 1,402 | 89.9% |
| Smartphone | 1,484 | 95.1% |
| Tablet | 1,246 | 79.9% |
| No Computing Device | 0 | 0.0% |
| Total | 1,560 | 100.0% |
Internet Access in Montebello
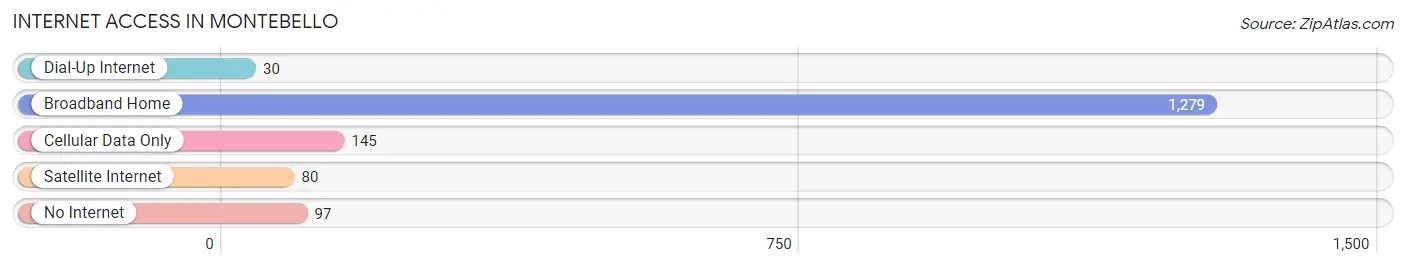
| Internet Type | # Households | % Households |
| Dial-Up Internet | 30 | 1.9% |
| Broadband Home | 1,279 | 82.0% |
| Cellular Data Only | 145 | 9.3% |
| Satellite Internet | 80 | 5.1% |
| No Internet | 97 | 6.2% |
| Total | 1,560 | 100.0% |
Montebello Summary
Montebello is a hamlet located in the Town of Ramapo in Rockland County, New York. It is situated in the foothills of the Ramapo Mountains, approximately 25 miles northwest of New York City. The hamlet is bordered by the hamlets of Hillburn to the north, Suffern to the east, Airmont to the south, and Monsey to the west.
History
Montebello was first settled in the late 1700s by Dutch and German immigrants. The hamlet was originally known as “New Hempstead” and was part of the Town of Haverstraw. In 1808, the hamlet was renamed “Montebello” after the Italian phrase for “beautiful mountain.”
In the mid-1800s, Montebello was a popular summer resort destination for wealthy New Yorkers. The hamlet was home to several grand hotels, including the Montebello House, which was built in 1845 and was the largest hotel in the area. The hotel was destroyed by fire in 1891.
In the early 1900s, Montebello began to attract a large number of Jewish immigrants from Eastern Europe. The hamlet became a center of Jewish culture and was home to several synagogues, including the Montebello Synagogue, which was founded in 1910.
In the 1950s, Montebello began to experience rapid population growth as the hamlet became a popular bedroom community for commuters to New York City. The population of Montebello has continued to grow in recent years, and the hamlet is now home to a diverse population of residents.
Geography
Montebello is located in the foothills of the Ramapo Mountains in southeastern New York. The hamlet is situated in the Ramapo Valley, which is a large valley that stretches from the Hudson River to the Delaware River. The hamlet is bordered by the hamlets of Hillburn to the north, Suffern to the east, Airmont to the south, and Monsey to the west.
The terrain of Montebello is mostly hilly and wooded, with several small streams and ponds. The highest point in the hamlet is the summit of Montebello Mountain, which has an elevation of 1,068 feet.
Economy
Montebello is primarily a residential community, and the hamlet does not have a large commercial or industrial base. The hamlet is home to several small businesses, including restaurants, retail stores, and professional services.
The hamlet is also home to several large employers, including Montebello Medical Center, a hospital that is part of the Montebello Healthcare System. The hospital is the largest employer in the hamlet, with over 1,000 employees.
Demographics
As of the 2010 census, Montebello had a population of 8,936. The population of Montebello is diverse, with a large Jewish population and a growing Hispanic population.
The median household income in Montebello is $90,845, and the median home value is $521,000. The hamlet has a high rate of homeownership, with over 80% of residents owning their homes.
Montebello is served by the East Ramapo Central School District, which includes several elementary schools, a middle school, and a high school. The hamlet is also home to several private schools, including Yeshiva of Montebello and Montebello Jewish Center.
Common Questions
What is Per Capita Income in Montebello?
Per Capita income in Montebello is $61,032.
What is the Median Family Income in Montebello?
Median Family Income in Montebello is $172,125.
What is the Median Household income in Montebello?
Median Household Income in Montebello is $144,167.
What is Income or Wage Gap in Montebello?
Income or Wage Gap in Montebello is 12.1%.
Women in Montebello earn 87.9 cents for every dollar earned by a man.
What is Inequality or Gini Index in Montebello?
Inequality or Gini Index in Montebello is 0.44.
What is the Total Population of Montebello?
Total Population of Montebello is 4,645.
What is the Total Male Population of Montebello?
Total Male Population of Montebello is 2,222.
What is the Total Female Population of Montebello?
Total Female Population of Montebello is 2,423.
What is the Ratio of Males per 100 Females in Montebello?
There are 91.70 Males per 100 Females in Montebello.
What is the Ratio of Females per 100 Males in Montebello?
There are 109.05 Females per 100 Males in Montebello.
What is the Median Population Age in Montebello?
Median Population Age in Montebello is 37.6 Years.
What is the Average Family Size in Montebello
Average Family Size in Montebello is 3.6 People.
What is the Average Household Size in Montebello
Average Household Size in Montebello is 3.0 People.
How Large is the Labor Force in Montebello?
There are 2,284 People in the Labor Forcein in Montebello.
What is the Percentage of People in the Labor Force in Montebello?
65.1% of People are in the Labor Force in Montebello.
What is the Unemployment Rate in Montebello?
Unemployment Rate in Montebello is 7.1%.