East Hills, NY Map & Demographics
East Hills Map
East Hills Overview
$124,194
PER CAPITA INCOME
$250,001
AVG FAMILY INCOME
$250,001
AVG HOUSEHOLD INCOME
57.7%
WAGE / INCOME GAP [ % ]
42.3¢/ $1
WAGE / INCOME GAP [ $ ]
0.42
INEQUALITY / GINI INDEX
7,242
TOTAL POPULATION
3,480
MALE POPULATION
3,762
FEMALE POPULATION
92.50
MALES / 100 FEMALES
108.10
FEMALES / 100 MALES
41.6
MEDIAN AGE
3.5
AVG FAMILY SIZE
3.2
AVG HOUSEHOLD SIZE
4,079
LABOR FORCE [ PEOPLE ]
72.8%
PERCENT IN LABOR FORCE
3.6%
UNEMPLOYMENT RATE
Income in East Hills
Income Overview in East Hills
Per Capita Income in East Hills is $124,194, while median incomes of families and households are $250,001 and $250,001 respectively.
| Characteristic | Number | Measure |
| Per Capita Income | 7,242 | $124,194 |
| Median Family Income | 1,955 | $250,001 |
| Mean Family Income | 1,955 | $415,683 |
| Median Household Income | 2,238 | $250,001 |
| Mean Household Income | 2,238 | $391,360 |
| Income Deficit | 1,955 | $0 |
| Wage / Income Gap (%) | 7,242 | 57.70% |
| Wage / Income Gap ($) | 7,242 | 42.30¢ per $1 |
| Gini / Inequality Index | 7,242 | 0.42 |
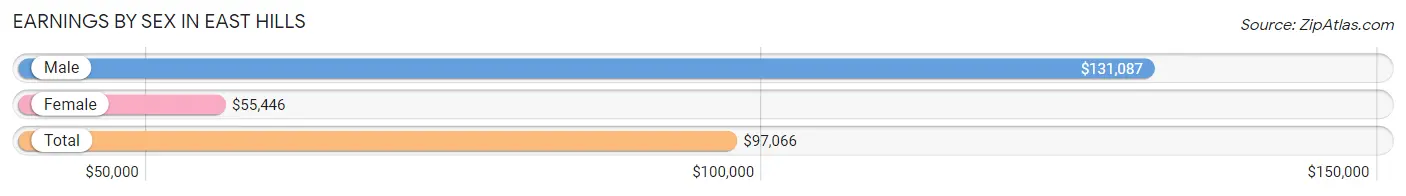
Earnings by Sex in East Hills
Average Earnings in East Hills are $97,066, $131,087 for men and $55,446 for women, a difference of 57.7%.
| Sex | Number | Average Earnings |
| Male | 2,336 (54.2%) | $131,087 |
| Female | 1,975 (45.8%) | $55,446 |
| Total | 4,311 (100.0%) | $97,066 |
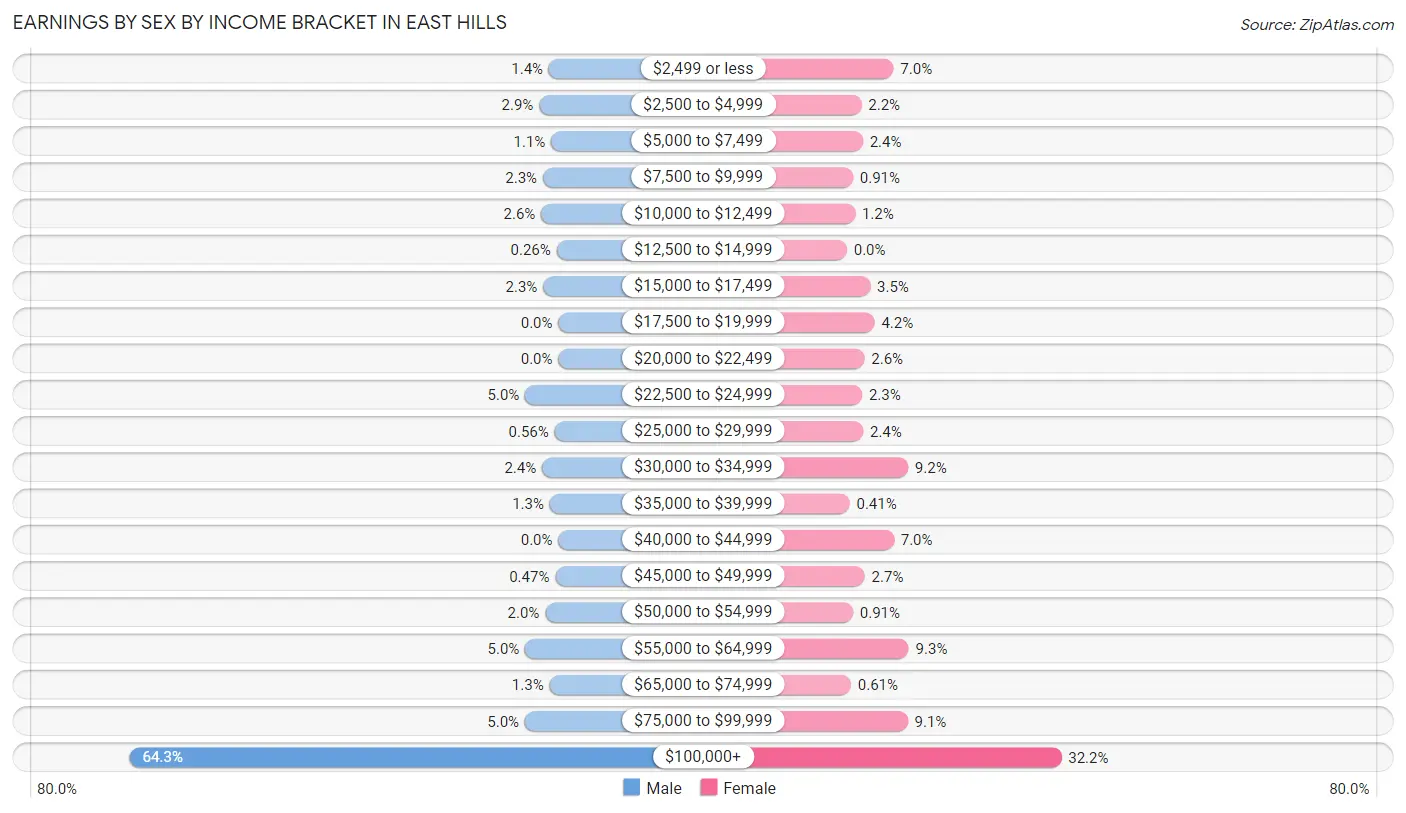
Earnings by Sex by Income Bracket in East Hills
The most common earnings brackets in East Hills are $100,000+ for men (1,501 | 64.3%) and $100,000+ for women (635 | 32.2%).
| Income | Male | Female |
| $2,499 or less | 33 (1.4%) | 138 (7.0%) |
| $2,500 to $4,999 | 67 (2.9%) | 43 (2.2%) |
| $5,000 to $7,499 | 25 (1.1%) | 47 (2.4%) |
| $7,500 to $9,999 | 54 (2.3%) | 18 (0.9%) |
| $10,000 to $12,499 | 60 (2.6%) | 24 (1.2%) |
| $12,500 to $14,999 | 6 (0.3%) | 0 (0.0%) |
| $15,000 to $17,499 | 53 (2.3%) | 69 (3.5%) |
| $17,500 to $19,999 | 0 (0.0%) | 82 (4.2%) |
| $20,000 to $22,499 | 0 (0.0%) | 52 (2.6%) |
| $22,500 to $24,999 | 116 (5.0%) | 45 (2.3%) |
| $25,000 to $29,999 | 13 (0.6%) | 48 (2.4%) |
| $30,000 to $34,999 | 57 (2.4%) | 181 (9.2%) |
| $35,000 to $39,999 | 30 (1.3%) | 8 (0.4%) |
| $40,000 to $44,999 | 0 (0.0%) | 139 (7.0%) |
| $45,000 to $49,999 | 11 (0.5%) | 53 (2.7%) |
| $50,000 to $54,999 | 46 (2.0%) | 18 (0.9%) |
| $55,000 to $64,999 | 116 (5.0%) | 183 (9.3%) |
| $65,000 to $74,999 | 31 (1.3%) | 12 (0.6%) |
| $75,000 to $99,999 | 117 (5.0%) | 180 (9.1%) |
| $100,000+ | 1,501 (64.3%) | 635 (32.2%) |
| Total | 2,336 (100.0%) | 1,975 (100.0%) |
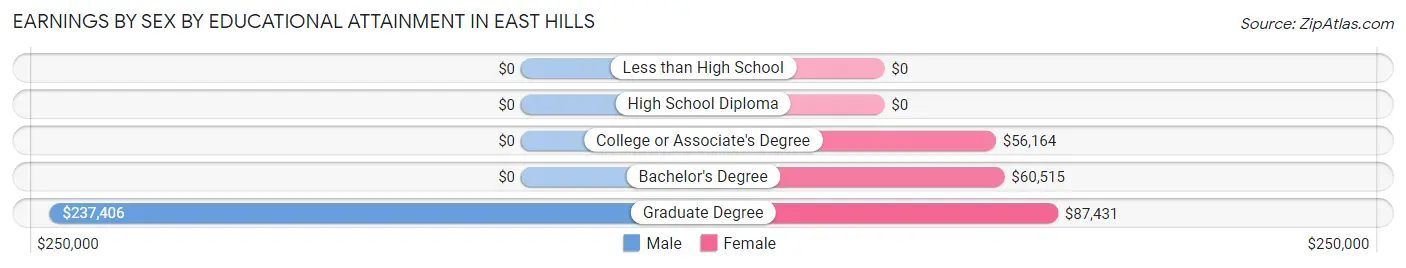
Earnings by Sex by Educational Attainment in East Hills
Average earnings in East Hills are $177,604 for men and $62,174 for women, a difference of 65.0%. Men with an educational attainment of graduate degree enjoy the highest average annual earnings of $237,406, while those with graduate degree education earn the least with $237,406. Women with an educational attainment of graduate degree earn the most with the average annual earnings of $87,431, while those with college or associate's degree education have the smallest earnings of $56,164.
| Educational Attainment | Male Income | Female Income |
| Less than High School | - | - |
| High School Diploma | - | - |
| College or Associate's Degree | - | - |
| Bachelor's Degree | - | - |
| Graduate Degree | $237,406 | $87,431 |
| Total | $177,604 | $62,174 |
Family Income in East Hills
Family Income Brackets in East Hills
According to the East Hills family income data, there are 1,388 families falling into the $200,000+ income range, which is the most common income bracket and makes up 71.0% of all families.
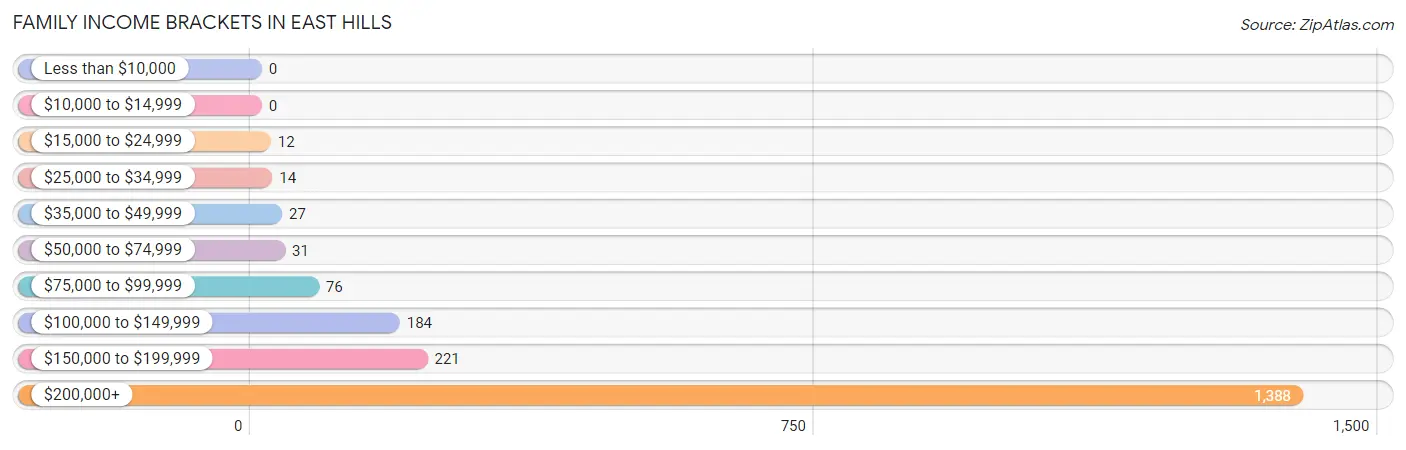
| Income Bracket | # Families | % Families |
| Less than $10,000 | 0 | 0.0% |
| $10,000 to $14,999 | 0 | 0.0% |
| $15,000 to $24,999 | 12 | 0.6% |
| $25,000 to $34,999 | 14 | 0.7% |
| $35,000 to $49,999 | 27 | 1.4% |
| $50,000 to $74,999 | 31 | 1.6% |
| $75,000 to $99,999 | 76 | 3.9% |
| $100,000 to $149,999 | 184 | 9.4% |
| $150,000 to $199,999 | 221 | 11.3% |
| $200,000+ | 1,388 | 71.0% |
Family Income by Famaliy Size in East Hills
3-person families (269 | 13.8%) account for the highest median family income in East Hills with $250,001 per family, while 2-person families (649 | 33.2%) have the highest median income of $106,394 per family member.
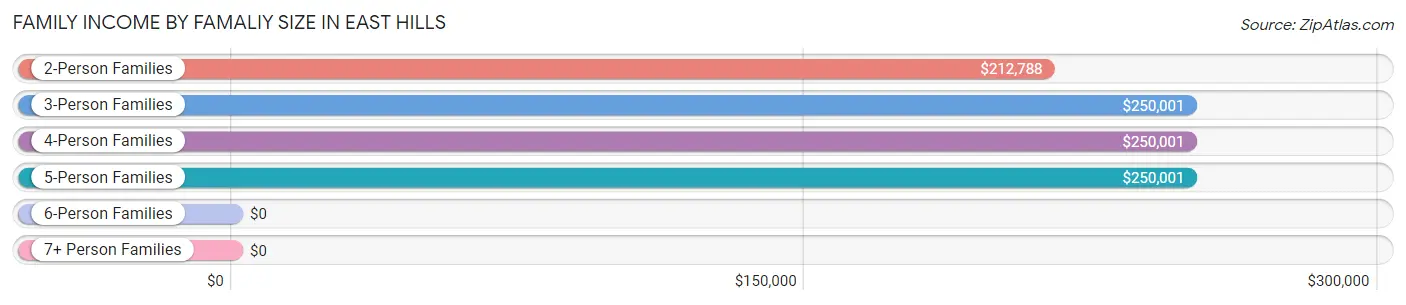
| Income Bracket | # Families | Median Income |
| 2-Person Families | 649 (33.2%) | $212,788 |
| 3-Person Families | 269 (13.8%) | $250,001 |
| 4-Person Families | 810 (41.4%) | $250,001 |
| 5-Person Families | 191 (9.8%) | $250,001 |
| 6-Person Families | 36 (1.8%) | $0 |
| 7+ Person Families | 0 (0.0%) | $0 |
| Total | 1,955 (100.0%) | $250,001 |
Family Income by Number of Earners in East Hills
The median family income in East Hills is $250,001, with families comprising 1 earner (586) having the highest median family income of $250,001, while families with no earners (111) have the lowest median family income of $110,875, accounting for 30.0% and 5.7% of families, respectively.
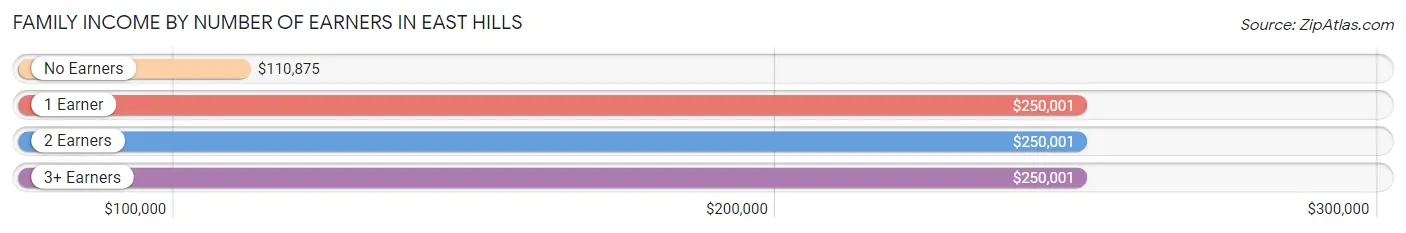
| Number of Earners | # Families | Median Income |
| No Earners | 111 (5.7%) | $110,875 |
| 1 Earner | 586 (30.0%) | $250,001 |
| 2 Earners | 771 (39.4%) | $250,001 |
| 3+ Earners | 487 (24.9%) | $250,001 |
| Total | 1,955 (100.0%) | $250,001 |
Household Income in East Hills
Household Income Brackets in East Hills
With 1,491 households falling in the category, the $200,000+ income range is the most frequent in East Hills, accounting for 66.6% of all households. In contrast, only 11 households (0.5%) fall into the $15,000 to $24,999 income bracket, making it the least populous group.
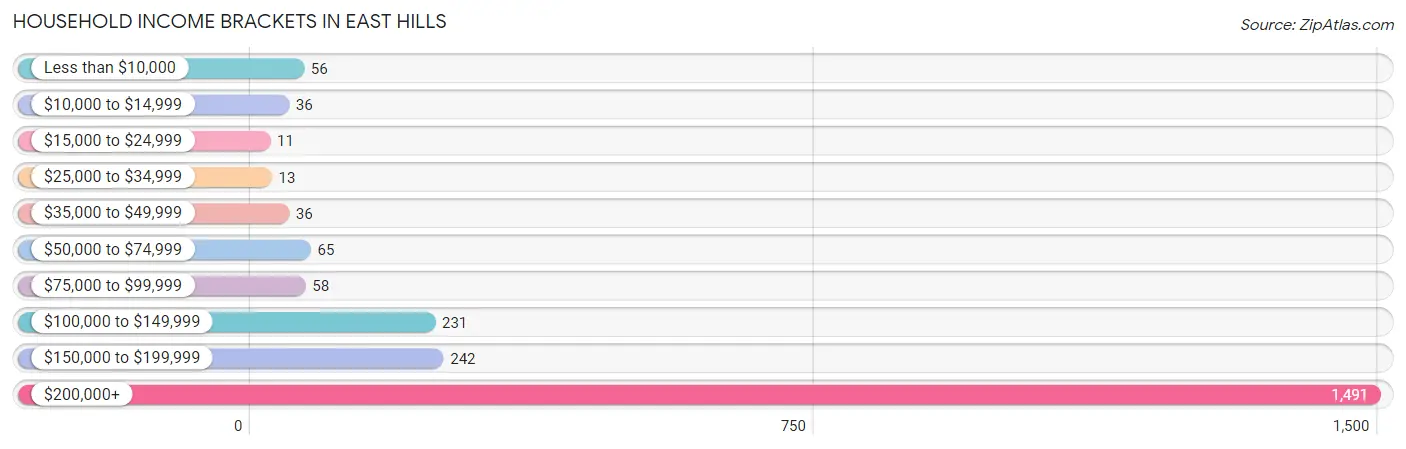
| Income Bracket | # Households | % Households |
| Less than $10,000 | 56 | 2.5% |
| $10,000 to $14,999 | 36 | 1.6% |
| $15,000 to $24,999 | 11 | 0.5% |
| $25,000 to $34,999 | 13 | 0.6% |
| $35,000 to $49,999 | 36 | 1.6% |
| $50,000 to $74,999 | 65 | 2.9% |
| $75,000 to $99,999 | 58 | 2.6% |
| $100,000 to $149,999 | 231 | 10.3% |
| $150,000 to $199,999 | 242 | 10.8% |
| $200,000+ | 1,491 | 66.6% |
Household Income by Householder Age in East Hills
The median household income in East Hills is $250,001, with the highest median household income of $250,001 found in the 25 to 44 years age bracket for the primary householder. A total of 561 households (25.1%) fall into this category. Meanwhile, the 15 to 24 years age bracket for the primary householder has the lowest median household income of $0, with 17 households (0.8%) in this group.
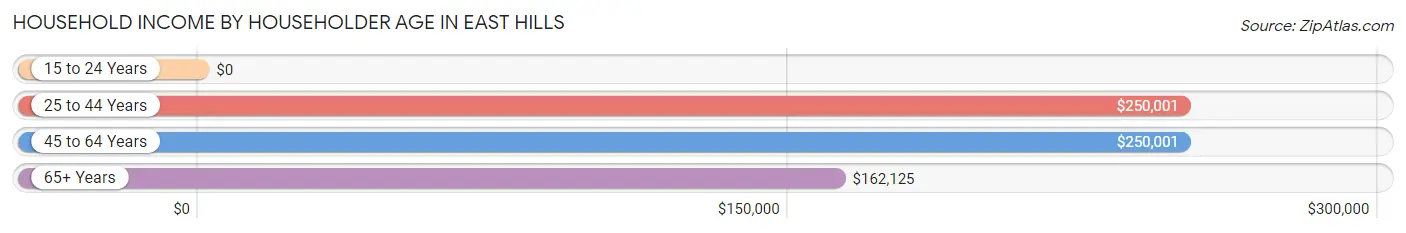
| Income Bracket | # Households | Median Income |
| 15 to 24 Years | 17 (0.8%) | $0 |
| 25 to 44 Years | 561 (25.1%) | $250,001 |
| 45 to 64 Years | 939 (42.0%) | $250,001 |
| 65+ Years | 721 (32.2%) | $162,125 |
| Total | 2,238 (100.0%) | $250,001 |
Poverty in East Hills
Income Below Poverty by Sex and Age in East Hills
With 1.4% poverty level for males and 2.0% for females among the residents of East Hills, 35 to 44 year old males and 16 and 17 year old females are the most vulnerable to poverty, with 37 males (6.6%) and 13 females (21.0%) in their respective age groups living below the poverty level.
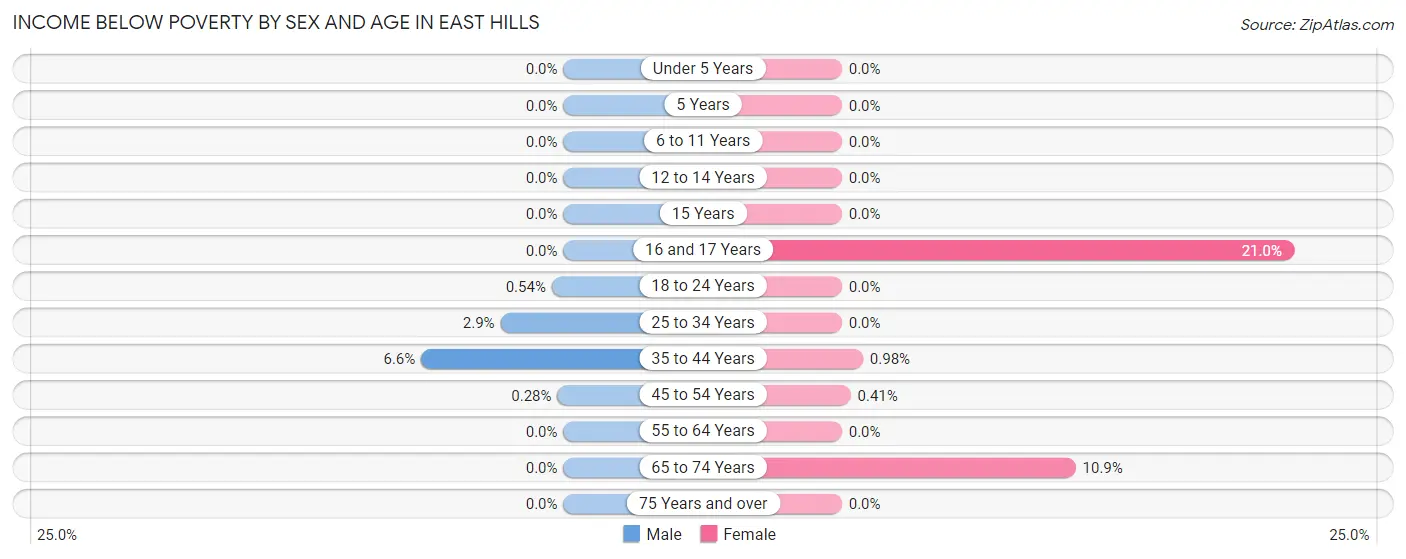
| Age Bracket | Male | Female |
| Under 5 Years | 0 (0.0%) | 0 (0.0%) |
| 5 Years | 0 (0.0%) | 0 (0.0%) |
| 6 to 11 Years | 0 (0.0%) | 0 (0.0%) |
| 12 to 14 Years | 0 (0.0%) | 0 (0.0%) |
| 15 Years | 0 (0.0%) | 0 (0.0%) |
| 16 and 17 Years | 0 (0.0%) | 13 (21.0%) |
| 18 to 24 Years | 1 (0.5%) | 0 (0.0%) |
| 25 to 34 Years | 10 (2.9%) | 0 (0.0%) |
| 35 to 44 Years | 37 (6.6%) | 5 (1.0%) |
| 45 to 54 Years | 1 (0.3%) | 2 (0.4%) |
| 55 to 64 Years | 0 (0.0%) | 0 (0.0%) |
| 65 to 74 Years | 0 (0.0%) | 56 (10.8%) |
| 75 Years and over | 0 (0.0%) | 0 (0.0%) |
| Total | 49 (1.4%) | 76 (2.0%) |
Income Above Poverty by Sex and Age in East Hills
According to the poverty statistics in East Hills, males aged under 5 years and females aged under 5 years are the age groups that are most secure financially, with 100.0% of males and 100.0% of females in these age groups living above the poverty line.
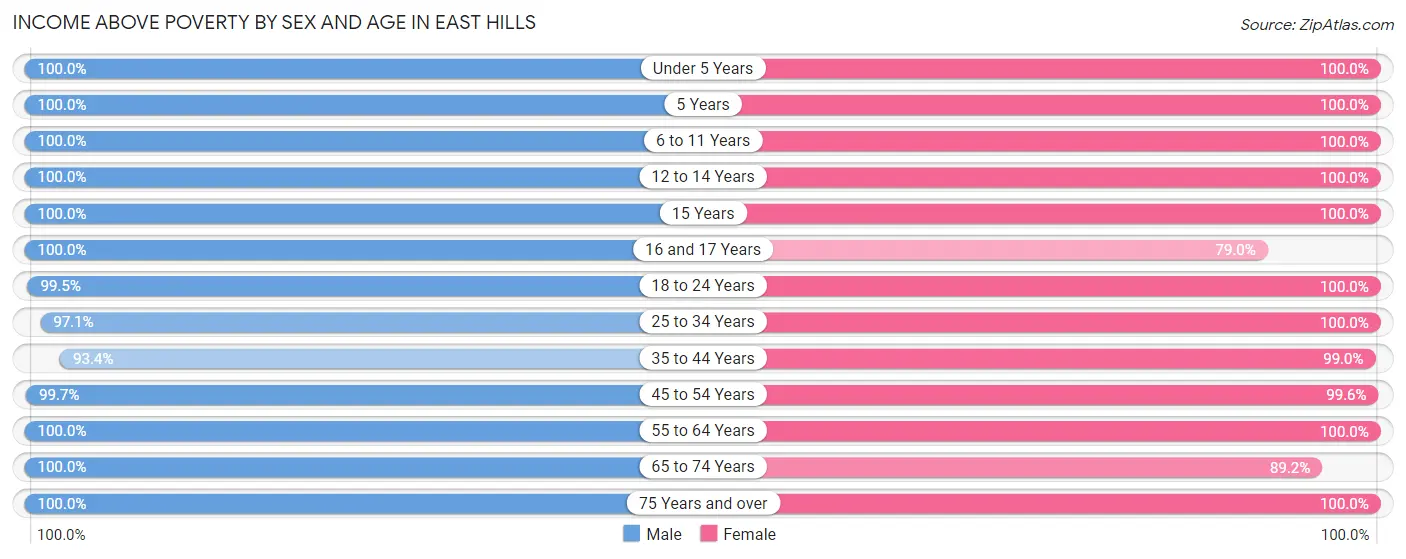
| Age Bracket | Male | Female |
| Under 5 Years | 163 (100.0%) | 138 (100.0%) |
| 5 Years | 100 (100.0%) | 86 (100.0%) |
| 6 to 11 Years | 248 (100.0%) | 391 (100.0%) |
| 12 to 14 Years | 97 (100.0%) | 246 (100.0%) |
| 15 Years | 62 (100.0%) | 72 (100.0%) |
| 16 and 17 Years | 159 (100.0%) | 49 (79.0%) |
| 18 to 24 Years | 184 (99.5%) | 366 (100.0%) |
| 25 to 34 Years | 333 (97.1%) | 184 (100.0%) |
| 35 to 44 Years | 524 (93.4%) | 505 (99.0%) |
| 45 to 54 Years | 355 (99.7%) | 487 (99.6%) |
| 55 to 64 Years | 604 (100.0%) | 471 (100.0%) |
| 65 to 74 Years | 499 (100.0%) | 460 (89.1%) |
| 75 Years and over | 103 (100.0%) | 195 (100.0%) |
| Total | 3,431 (98.6%) | 3,650 (98.0%) |
Income Below Poverty Among Married-Couple Families in East Hills
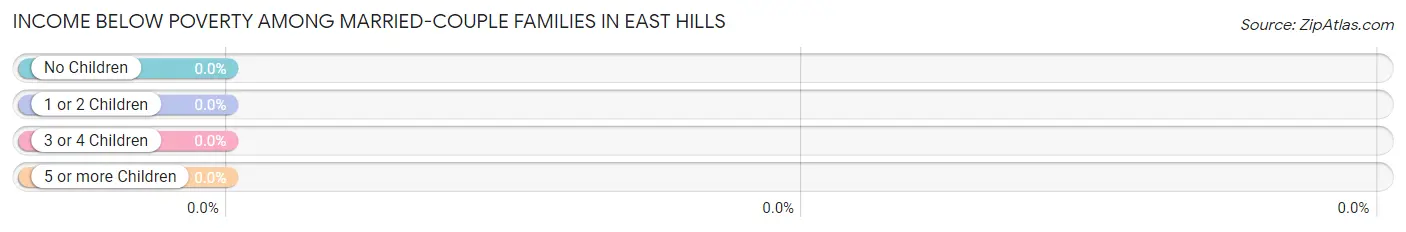
| Children | Above Poverty | Below Poverty |
| No Children | 998 (100.0%) | 0 (0.0%) |
| 1 or 2 Children | 692 (100.0%) | 0 (0.0%) |
| 3 or 4 Children | 135 (100.0%) | 0 (0.0%) |
| 5 or more Children | 0 (0.0%) | 0 (0.0%) |
| Total | 1,825 (100.0%) | 0 (0.0%) |
Income Below Poverty Among Single-Parent Households in East Hills
| Children | Single Father | Single Mother |
| No Children | 0 (0.0%) | 0 (0.0%) |
| 1 or 2 Children | 0 (0.0%) | 0 (0.0%) |
| 3 or 4 Children | 0 (0.0%) | 0 (0.0%) |
| 5 or more Children | 0 (0.0%) | 0 (0.0%) |
| Total | 0 (0.0%) | 0 (0.0%) |
Income Below Poverty Among Married-Couple vs Single-Parent Households in East Hills
| Children | Married-Couple Families | Single-Parent Households |
| No Children | 0 (0.0%) | 0 (0.0%) |
| 1 or 2 Children | 0 (0.0%) | 0 (0.0%) |
| 3 or 4 Children | 0 (0.0%) | 0 (0.0%) |
| 5 or more Children | 0 (0.0%) | 0 (0.0%) |
| Total | 0 (0.0%) | 0 (0.0%) |
Race in East Hills
The most populous races in East Hills are White / Caucasian (6,128 | 84.6%), Asian (828 | 11.4%), and Hispanic or Latino (349 | 4.8%).
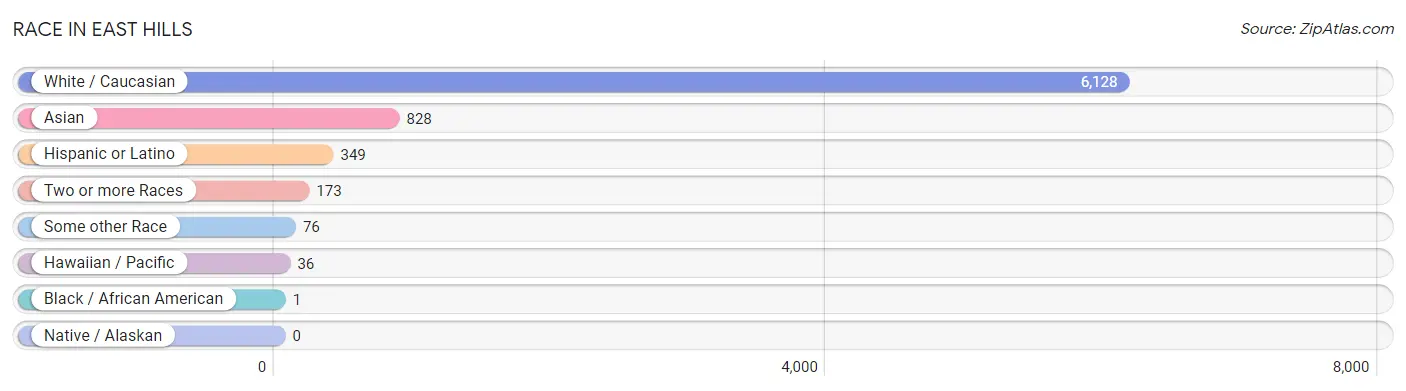
| Race | # Population | % Population |
| Asian | 828 | 11.4% |
| Black / African American | 1 | 0.0% |
| Hawaiian / Pacific | 36 | 0.5% |
| Hispanic or Latino | 349 | 4.8% |
| Native / Alaskan | 0 | 0.0% |
| White / Caucasian | 6,128 | 84.6% |
| Two or more Races | 173 | 2.4% |
| Some other Race | 76 | 1.1% |
| Total | 7,242 | 100.0% |
Ancestry in East Hills
The most populous ancestries reported in East Hills are Polish (1,242 | 17.2%), American (796 | 11.0%), Russian (751 | 10.4%), Eastern European (679 | 9.4%), and German (661 | 9.1%), together accounting for 57.0% of all East Hills residents.
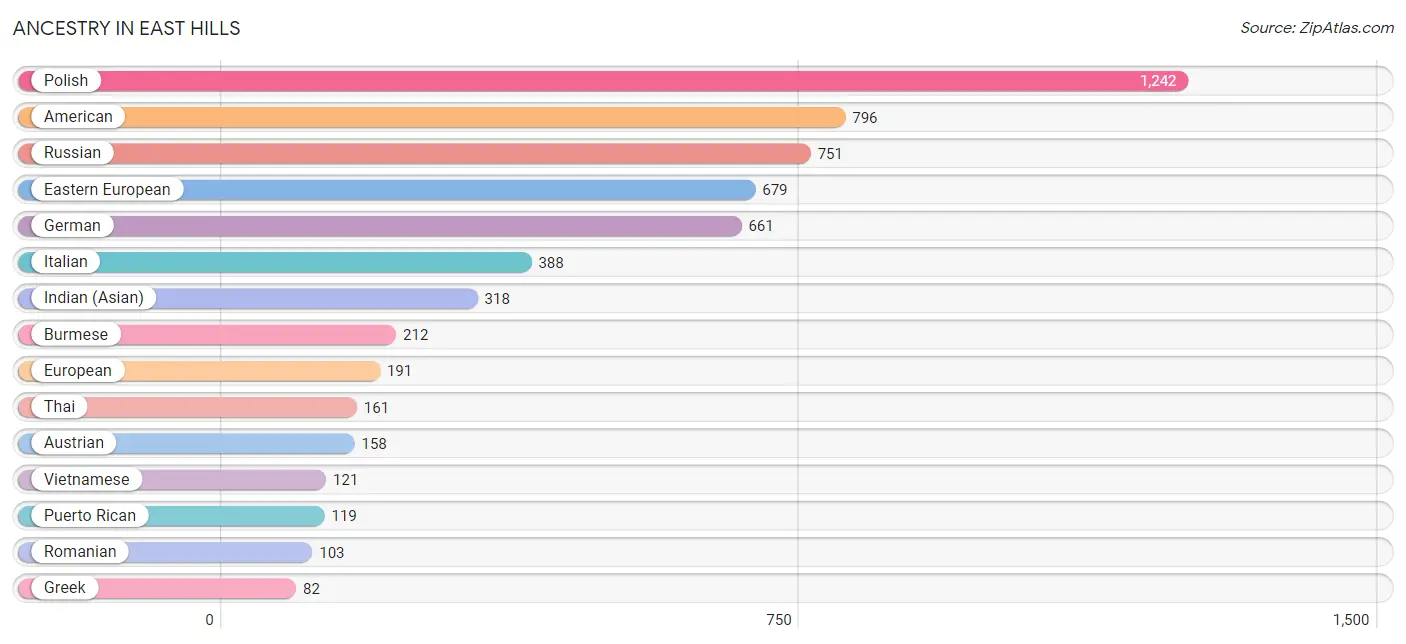
| Ancestry | # Population | % Population |
| American | 796 | 11.0% |
| Arab | 38 | 0.5% |
| Argentinean | 44 | 0.6% |
| Austrian | 158 | 2.2% |
| Belgian | 6 | 0.1% |
| British | 40 | 0.5% |
| Burmese | 212 | 2.9% |
| Central American | 36 | 0.5% |
| Colombian | 19 | 0.3% |
| Cuban | 67 | 0.9% |
| Czech | 10 | 0.1% |
| Czechoslovakian | 13 | 0.2% |
| Eastern European | 679 | 9.4% |
| Ecuadorian | 12 | 0.2% |
| English | 11 | 0.2% |
| European | 191 | 2.6% |
| French | 9 | 0.1% |
| German | 661 | 9.1% |
| Greek | 82 | 1.1% |
| Hungarian | 54 | 0.7% |
| Indian (Asian) | 318 | 4.4% |
| Iranian | 57 | 0.8% |
| Iraqi | 6 | 0.1% |
| Irish | 63 | 0.9% |
| Israeli | 67 | 0.9% |
| Italian | 388 | 5.4% |
| Korean | 16 | 0.2% |
| Lithuanian | 22 | 0.3% |
| Mexican | 52 | 0.7% |
| Panamanian | 36 | 0.5% |
| Polish | 1,242 | 17.2% |
| Puerto Rican | 119 | 1.6% |
| Romanian | 103 | 1.4% |
| Russian | 751 | 10.4% |
| Samoan | 36 | 0.5% |
| South American | 75 | 1.0% |
| Sri Lankan | 9 | 0.1% |
| Thai | 161 | 2.2% |
| Ukrainian | 18 | 0.3% |
| Vietnamese | 121 | 1.7% |
| Welsh | 18 | 0.3% | View All 41 Rows |
Immigrants in East Hills
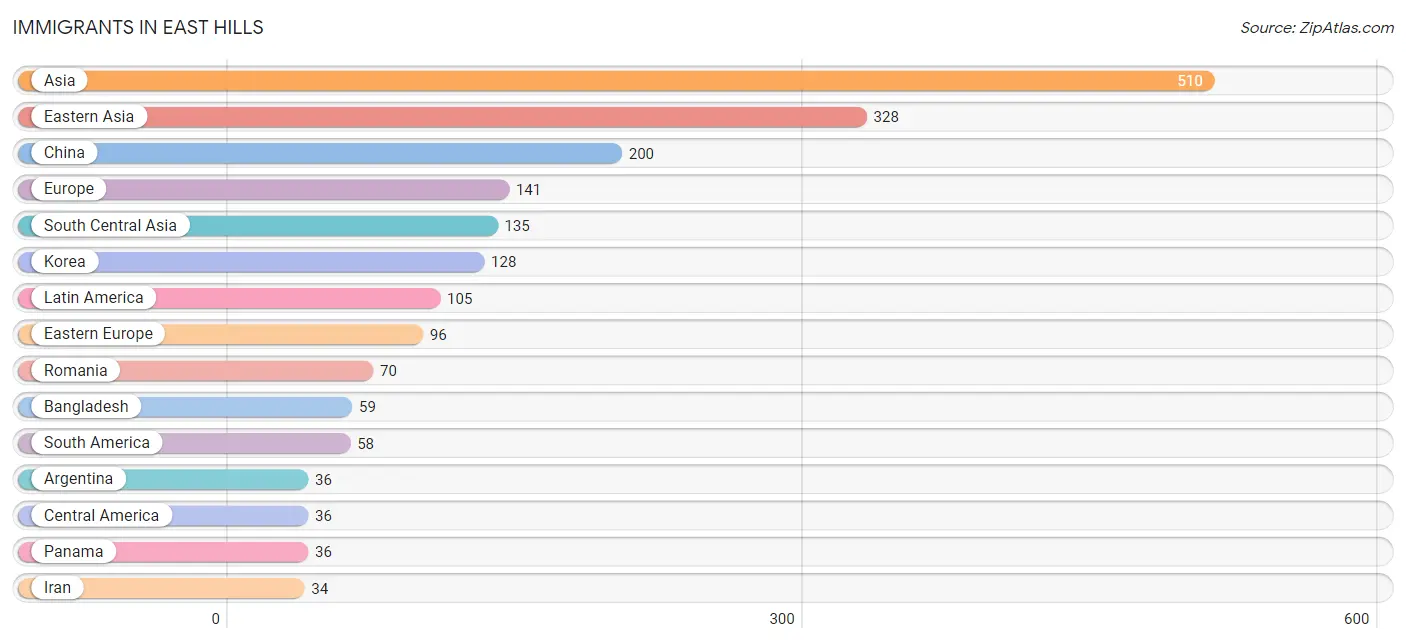
The most numerous immigrant groups reported in East Hills came from Asia (510 | 7.0%), Eastern Asia (328 | 4.5%), China (200 | 2.8%), Europe (141 | 1.9%), and South Central Asia (135 | 1.9%), together accounting for 18.1% of all East Hills residents.
| Immigration Origin | # Population | % Population |
| Afghanistan | 11 | 0.2% |
| Africa | 22 | 0.3% |
| Argentina | 36 | 0.5% |
| Asia | 510 | 7.0% |
| Bangladesh | 59 | 0.8% |
| Caribbean | 11 | 0.2% |
| Central America | 36 | 0.5% |
| China | 200 | 2.8% |
| Colombia | 10 | 0.1% |
| Cuba | 11 | 0.2% |
| Czechoslovakia | 13 | 0.2% |
| Eastern Asia | 328 | 4.5% |
| Eastern Europe | 96 | 1.3% |
| Ecuador | 12 | 0.2% |
| Europe | 141 | 1.9% |
| Germany | 20 | 0.3% |
| Greece | 11 | 0.2% |
| India | 31 | 0.4% |
| Iran | 34 | 0.5% |
| Israel | 6 | 0.1% |
| Korea | 128 | 1.8% |
| Latin America | 105 | 1.5% |
| Northern Europe | 14 | 0.2% |
| Panama | 36 | 0.5% |
| Philippines | 16 | 0.2% |
| Romania | 70 | 1.0% |
| Russia | 8 | 0.1% |
| South Africa | 22 | 0.3% |
| South America | 58 | 0.8% |
| South Central Asia | 135 | 1.9% |
| South Eastern Asia | 24 | 0.3% |
| Southern Europe | 11 | 0.2% |
| Taiwan | 23 | 0.3% |
| Ukraine | 5 | 0.1% |
| Western Asia | 23 | 0.3% |
| Western Europe | 20 | 0.3% | View All 36 Rows |
Sex and Age in East Hills
Sex and Age in East Hills
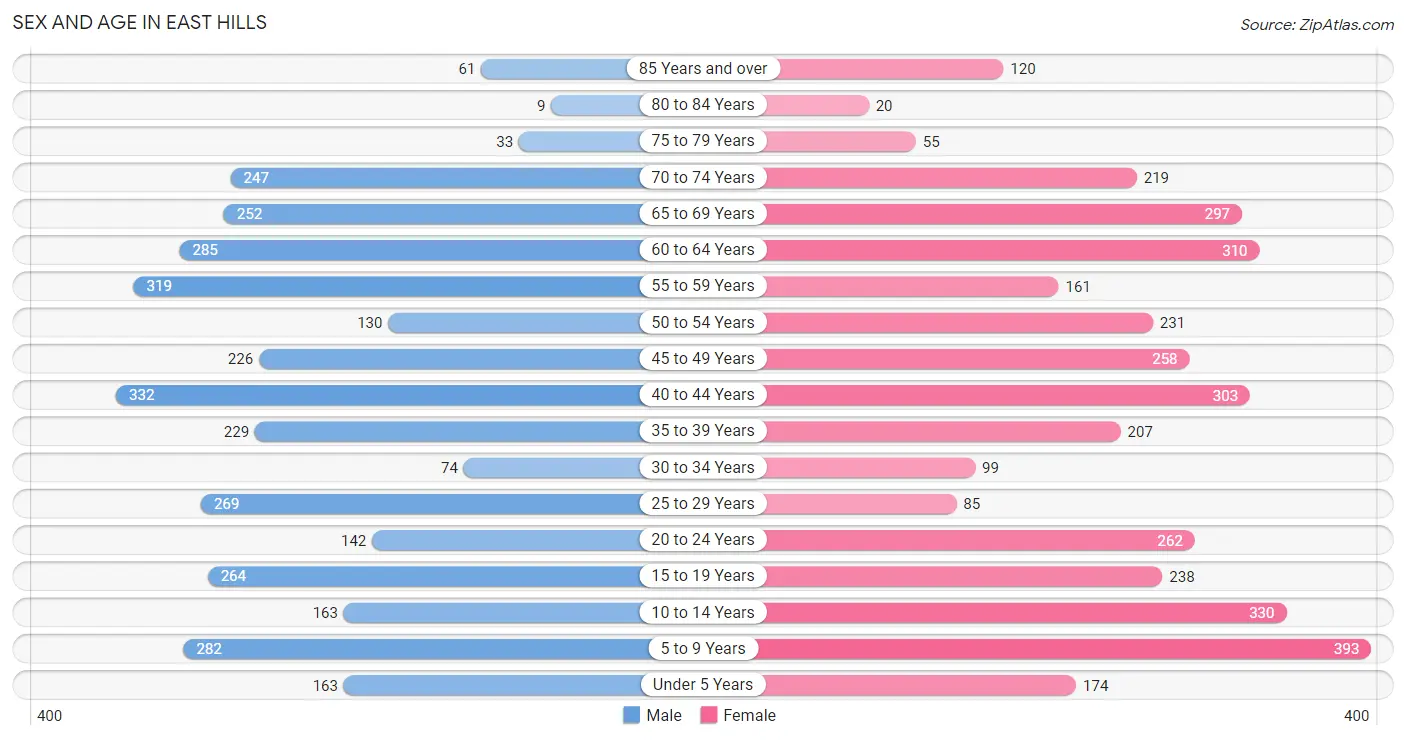
The most populous age groups in East Hills are 40 to 44 Years (332 | 9.5%) for men and 5 to 9 Years (393 | 10.4%) for women.
| Age Bracket | Male | Female |
| Under 5 Years | 163 (4.7%) | 174 (4.6%) |
| 5 to 9 Years | 282 (8.1%) | 393 (10.4%) |
| 10 to 14 Years | 163 (4.7%) | 330 (8.8%) |
| 15 to 19 Years | 264 (7.6%) | 238 (6.3%) |
| 20 to 24 Years | 142 (4.1%) | 262 (7.0%) |
| 25 to 29 Years | 269 (7.7%) | 85 (2.3%) |
| 30 to 34 Years | 74 (2.1%) | 99 (2.6%) |
| 35 to 39 Years | 229 (6.6%) | 207 (5.5%) |
| 40 to 44 Years | 332 (9.5%) | 303 (8.1%) |
| 45 to 49 Years | 226 (6.5%) | 258 (6.9%) |
| 50 to 54 Years | 130 (3.7%) | 231 (6.1%) |
| 55 to 59 Years | 319 (9.2%) | 161 (4.3%) |
| 60 to 64 Years | 285 (8.2%) | 310 (8.2%) |
| 65 to 69 Years | 252 (7.2%) | 297 (7.9%) |
| 70 to 74 Years | 247 (7.1%) | 219 (5.8%) |
| 75 to 79 Years | 33 (0.9%) | 55 (1.5%) |
| 80 to 84 Years | 9 (0.3%) | 20 (0.5%) |
| 85 Years and over | 61 (1.8%) | 120 (3.2%) |
| Total | 3,480 (100.0%) | 3,762 (100.0%) |
Families and Households in East Hills
Median Family Size in East Hills
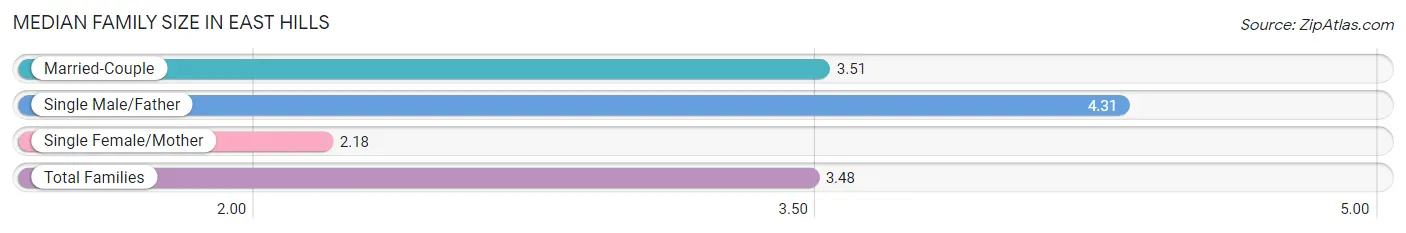
The median family size in East Hills is 3.48 persons per family, with single male/father families (59 | 3.0%) accounting for the largest median family size of 4.31 persons per family. On the other hand, single female/mother families (71 | 3.6%) represent the smallest median family size with 2.18 persons per family.
| Family Type | # Families | Family Size |
| Married-Couple | 1,825 (93.3%) | 3.51 |
| Single Male/Father | 59 (3.0%) | 4.31 |
| Single Female/Mother | 71 (3.6%) | 2.18 |
| Total Families | 1,955 (100.0%) | 3.48 |
Median Household Size in East Hills
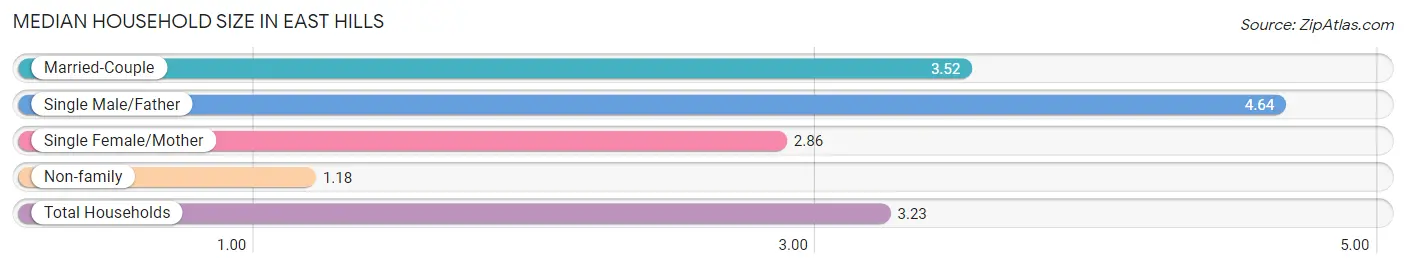
The median household size in East Hills is 3.23 persons per household, with single male/father households (59 | 2.6%) accounting for the largest median household size of 4.64 persons per household. non-family households (283 | 12.7%) represent the smallest median household size with 1.18 persons per household.
| Household Type | # Households | Household Size |
| Married-Couple | 1,825 (81.6%) | 3.52 |
| Single Male/Father | 59 (2.6%) | 4.64 |
| Single Female/Mother | 71 (3.2%) | 2.86 |
| Non-family | 283 (12.7%) | 1.18 |
| Total Households | 2,238 (100.0%) | 3.23 |
Household Size by Marriage Status in East Hills
Out of a total of 2,238 households in East Hills, 1,955 (87.4%) are family households, while 283 (12.7%) are nonfamily households. The most numerous type of family households are 4-person households, comprising 807, and the most common type of nonfamily households are 1-person households, comprising 235.
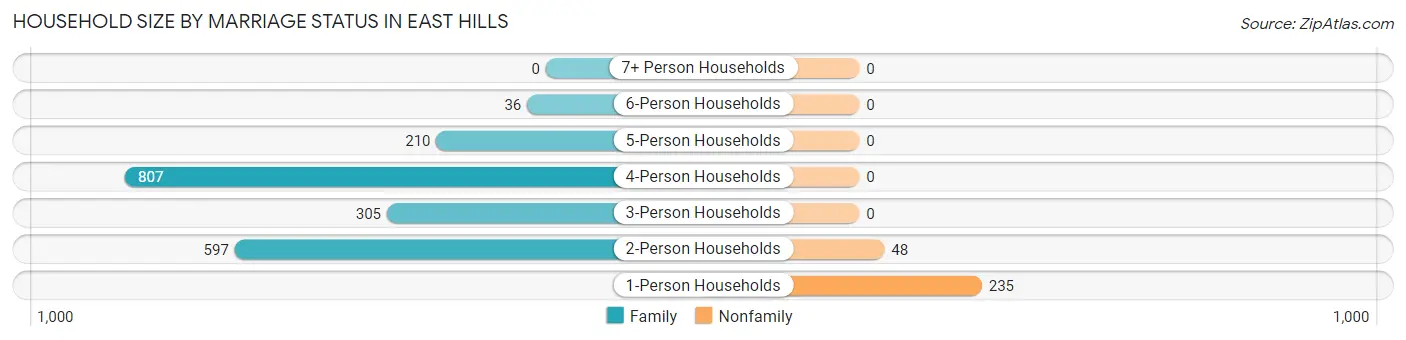
| Household Size | Family Households | Nonfamily Households |
| 1-Person Households | - | 235 (10.5%) |
| 2-Person Households | 597 (26.7%) | 48 (2.1%) |
| 3-Person Households | 305 (13.6%) | 0 (0.0%) |
| 4-Person Households | 807 (36.1%) | 0 (0.0%) |
| 5-Person Households | 210 (9.4%) | 0 (0.0%) |
| 6-Person Households | 36 (1.6%) | 0 (0.0%) |
| 7+ Person Households | 0 (0.0%) | 0 (0.0%) |
| Total | 1,955 (87.4%) | 283 (12.7%) |
Female Fertility in East Hills
Fertility by Age in East Hills
Average fertility rate in East Hills is 46.0 births per 1,000 women. Women in the age bracket of 35 to 50 years have the highest fertility rate with 67.0 births per 1,000 women. Women in the age bracket of 35 to 50 years acount for 77.9% of all women with births.
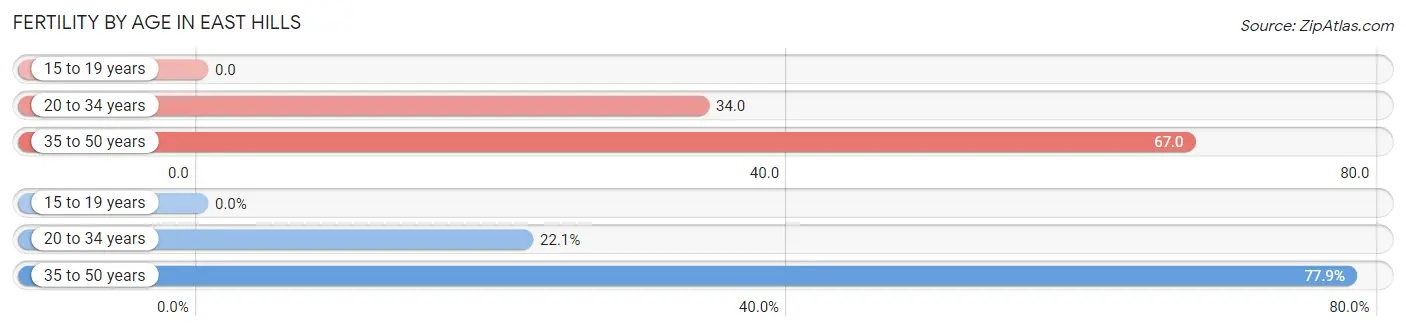
| Age Bracket | Women with Births | Births / 1,000 Women |
| 15 to 19 years | 0 (0.0%) | 0.0 |
| 20 to 34 years | 15 (22.1%) | 34.0 |
| 35 to 50 years | 53 (77.9%) | 67.0 |
| Total | 68 (100.0%) | 46.0 |
Fertility by Age by Marriage Status in East Hills
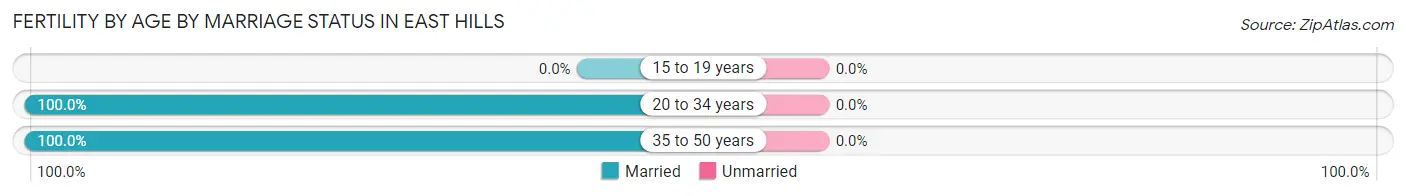
| Age Bracket | Married | Unmarried |
| 15 to 19 years | 0 (0.0%) | 0 (0.0%) |
| 20 to 34 years | 15 (100.0%) | 0 (0.0%) |
| 35 to 50 years | 53 (100.0%) | 0 (0.0%) |
| Total | 68 (100.0%) | 0 (0.0%) |
Fertility by Education in East Hills
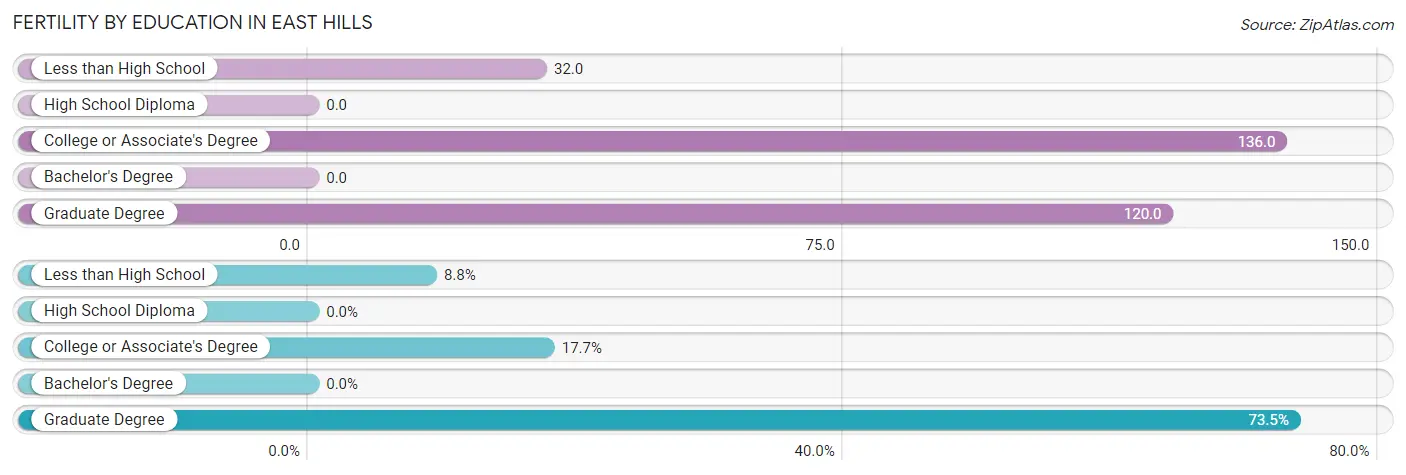
| Educational Attainment | Women with Births | Births / 1,000 Women |
| Less than High School | 6 (8.8%) | 32.0 |
| High School Diploma | 0 (0.0%) | 0.0 |
| College or Associate's Degree | 12 (17.6%) | 136.0 |
| Bachelor's Degree | 0 (0.0%) | 0.0 |
| Graduate Degree | 50 (73.5%) | 120.0 |
| Total | 68 (100.0%) | 46.0 |
Fertility by Education by Marriage Status in East Hills
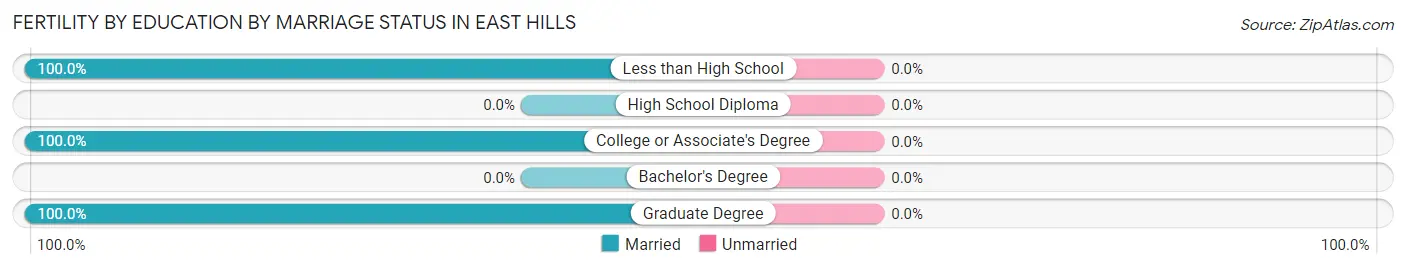
| Educational Attainment | Married | Unmarried |
| Less than High School | 6 (100.0%) | 0 (0.0%) |
| High School Diploma | 0 (0.0%) | 0 (0.0%) |
| College or Associate's Degree | 12 (100.0%) | 0 (0.0%) |
| Bachelor's Degree | 0 (0.0%) | 0 (0.0%) |
| Graduate Degree | 50 (100.0%) | 0 (0.0%) |
| Total | 68 (100.0%) | 0 (0.0%) |
Employment Characteristics in East Hills
Employment by Class of Employer in East Hills
Among the 3,897 employed individuals in East Hills, private company employees (2,528 | 64.9%), self-employed (incorporated) (475 | 12.2%), and not-for-profit organizations (302 | 7.7%) make up the most common classes of employment.
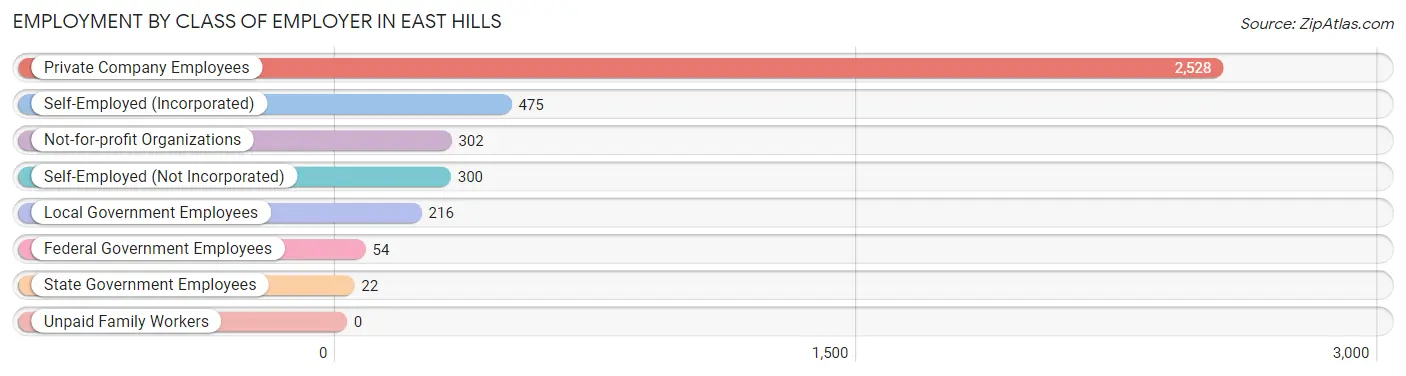
| Employer Class | # Employees | % Employees |
| Private Company Employees | 2,528 | 64.9% |
| Self-Employed (Incorporated) | 475 | 12.2% |
| Self-Employed (Not Incorporated) | 300 | 7.7% |
| Not-for-profit Organizations | 302 | 7.7% |
| Local Government Employees | 216 | 5.5% |
| State Government Employees | 22 | 0.6% |
| Federal Government Employees | 54 | 1.4% |
| Unpaid Family Workers | 0 | 0.0% |
| Total | 3,897 | 100.0% |
Employment Status by Age in East Hills
According to the labor force statistics for East Hills, out of the total population over 16 years of age (5,603), 72.8% or 4,079 individuals are in the labor force, with 3.6% or 147 of them unemployed. The age group with the highest labor force participation rate is 25 to 29 years, with 100.0% or 354 individuals in the labor force. Within the labor force, the 25 to 29 years age range has the highest percentage of unemployed individuals, with 11.3% or 40 of them being unemployed.
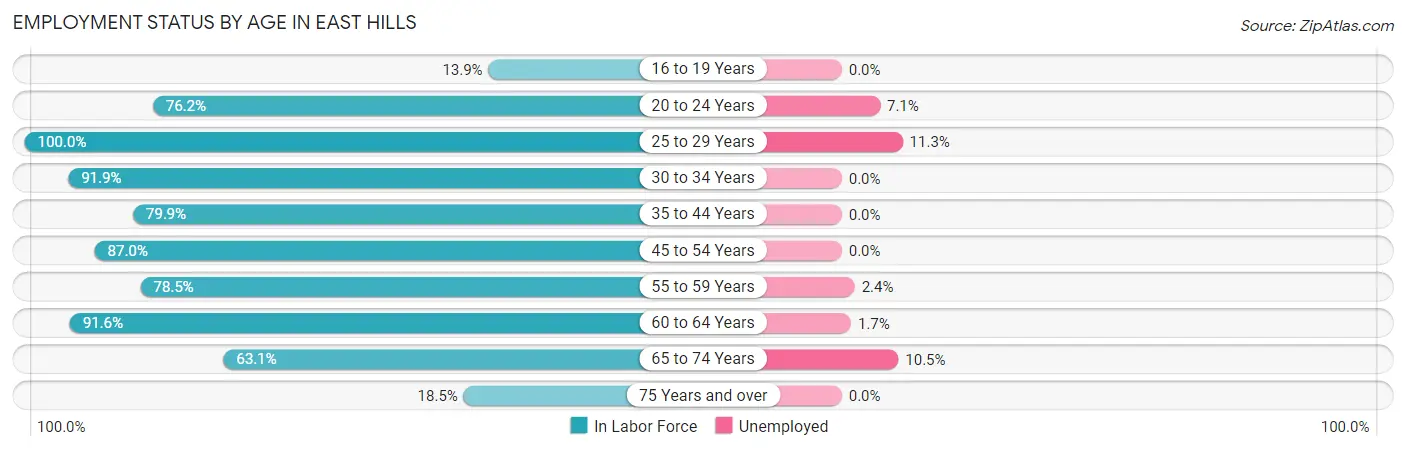
| Age Bracket | In Labor Force | Unemployed |
| 16 to 19 Years | 51 (13.9%) | 0 (0.0%) |
| 20 to 24 Years | 308 (76.2%) | 22 (7.1%) |
| 25 to 29 Years | 354 (100.0%) | 40 (11.3%) |
| 30 to 34 Years | 159 (91.9%) | 0 (0.0%) |
| 35 to 44 Years | 856 (79.9%) | 0 (0.0%) |
| 45 to 54 Years | 735 (87.0%) | 0 (0.0%) |
| 55 to 59 Years | 377 (78.5%) | 9 (2.4%) |
| 60 to 64 Years | 545 (91.6%) | 9 (1.7%) |
| 65 to 74 Years | 640 (63.1%) | 67 (10.5%) |
| 75 Years and over | 55 (18.5%) | 0 (0.0%) |
| Total | 4,079 (72.8%) | 147 (3.6%) |
Employment Status by Educational Attainment in East Hills
According to labor force statistics for East Hills, 86.0% of individuals (3,025) out of the total population between 25 and 64 years of age (3,518) are in the labor force, with 1.9% or 57 of them being unemployed. The group with the highest labor force participation rate are those with the educational attainment of high school diploma, with 92.8% or 154 individuals in the labor force. Within the labor force, individuals with bachelor's degree or higher education have the highest percentage of unemployment, with 2.4% or 58 of them being unemployed.
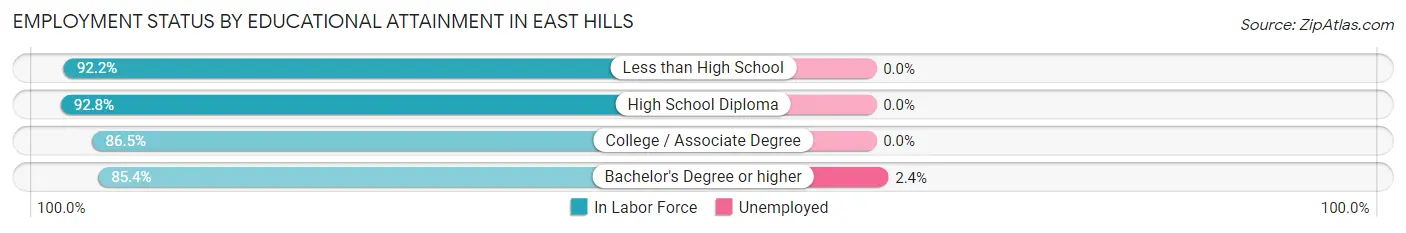
| Educational Attainment | In Labor Force | Unemployed |
| Less than High School | 47 (92.2%) | 0 (0.0%) |
| High School Diploma | 154 (92.8%) | 0 (0.0%) |
| College / Associate Degree | 397 (86.5%) | 0 (0.0%) |
| Bachelor's Degree or higher | 2,427 (85.4%) | 68 (2.4%) |
| Total | 3,025 (86.0%) | 67 (1.9%) |
Employment Occupations by Sex in East Hills
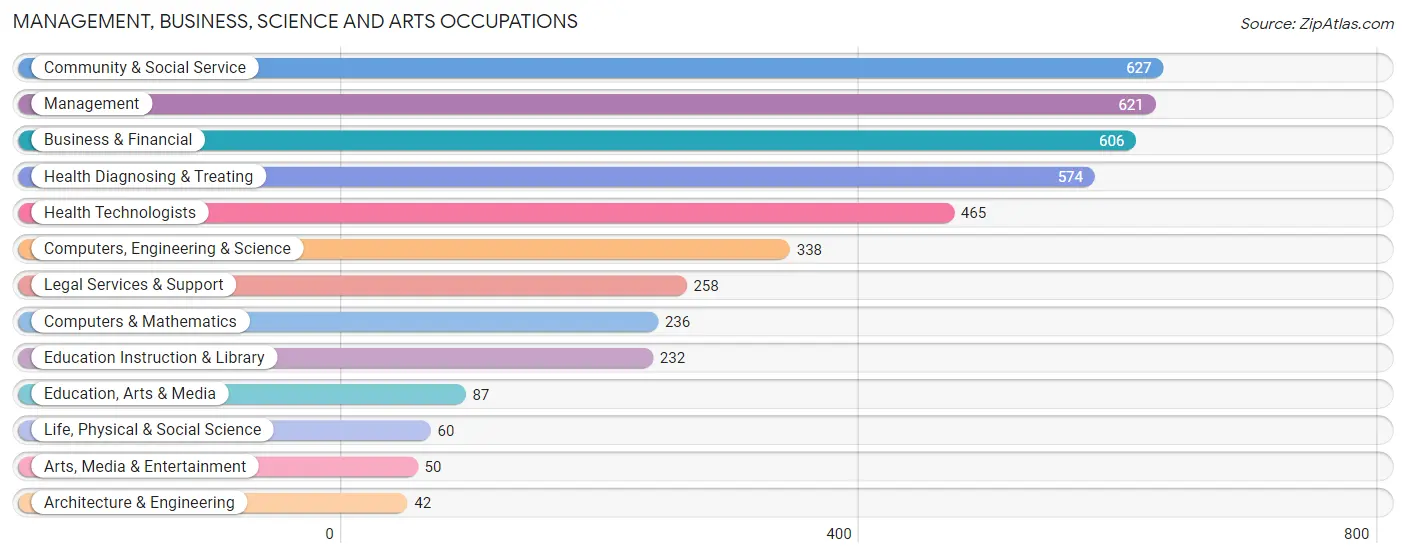
Management, Business, Science and Arts Occupations
The most common Management, Business, Science and Arts occupations in East Hills are Community & Social Service (627 | 15.9%), Management (621 | 15.8%), Business & Financial (606 | 15.4%), Health Diagnosing & Treating (574 | 14.6%), and Health Technologists (465 | 11.8%).
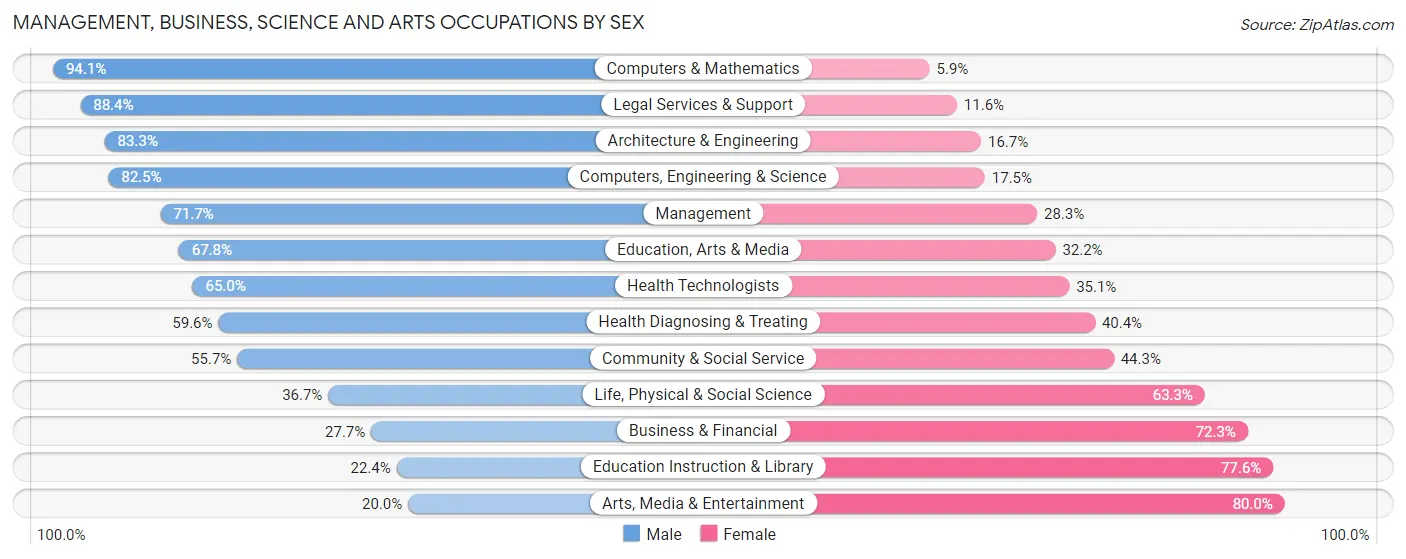
Management, Business, Science and Arts Occupations by Sex
Within the Management, Business, Science and Arts occupations in East Hills, the most male-oriented occupations are Computers & Mathematics (94.1%), Legal Services & Support (88.4%), and Architecture & Engineering (83.3%), while the most female-oriented occupations are Arts, Media & Entertainment (80.0%), Education Instruction & Library (77.6%), and Business & Financial (72.3%).
| Occupation | Male | Female |
| Management | 445 (71.7%) | 176 (28.3%) |
| Business & Financial | 168 (27.7%) | 438 (72.3%) |
| Computers, Engineering & Science | 279 (82.5%) | 59 (17.5%) |
| Computers & Mathematics | 222 (94.1%) | 14 (5.9%) |
| Architecture & Engineering | 35 (83.3%) | 7 (16.7%) |
| Life, Physical & Social Science | 22 (36.7%) | 38 (63.3%) |
| Community & Social Service | 349 (55.7%) | 278 (44.3%) |
| Education, Arts & Media | 59 (67.8%) | 28 (32.2%) |
| Legal Services & Support | 228 (88.4%) | 30 (11.6%) |
| Education Instruction & Library | 52 (22.4%) | 180 (77.6%) |
| Arts, Media & Entertainment | 10 (20.0%) | 40 (80.0%) |
| Health Diagnosing & Treating | 342 (59.6%) | 232 (40.4%) |
| Health Technologists | 302 (64.9%) | 163 (35.0%) |
| Total (Category) | 1,583 (57.2%) | 1,183 (42.8%) |
| Total (Overall) | 2,207 (56.1%) | 1,726 (43.9%) |
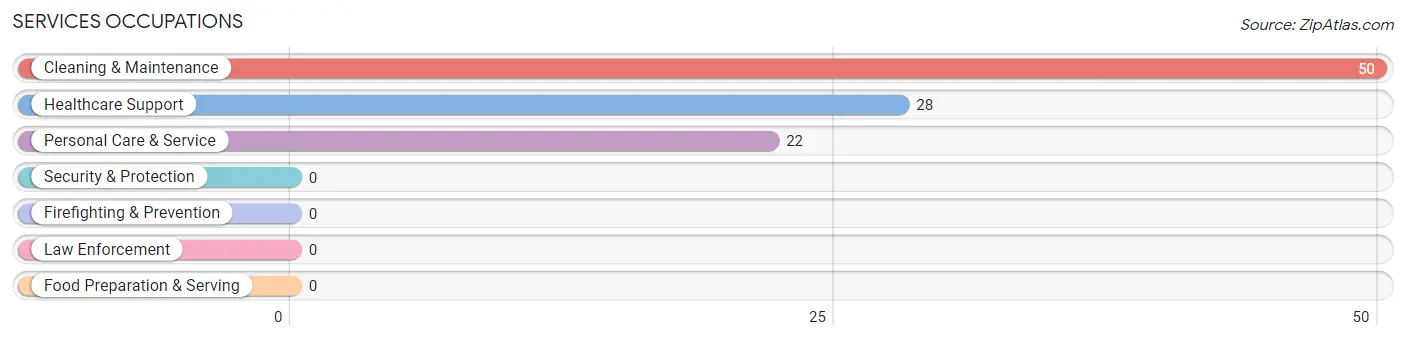
Services Occupations
The most common Services occupations in East Hills are Cleaning & Maintenance (50 | 1.3%), Healthcare Support (28 | 0.7%), and Personal Care & Service (22 | 0.6%).
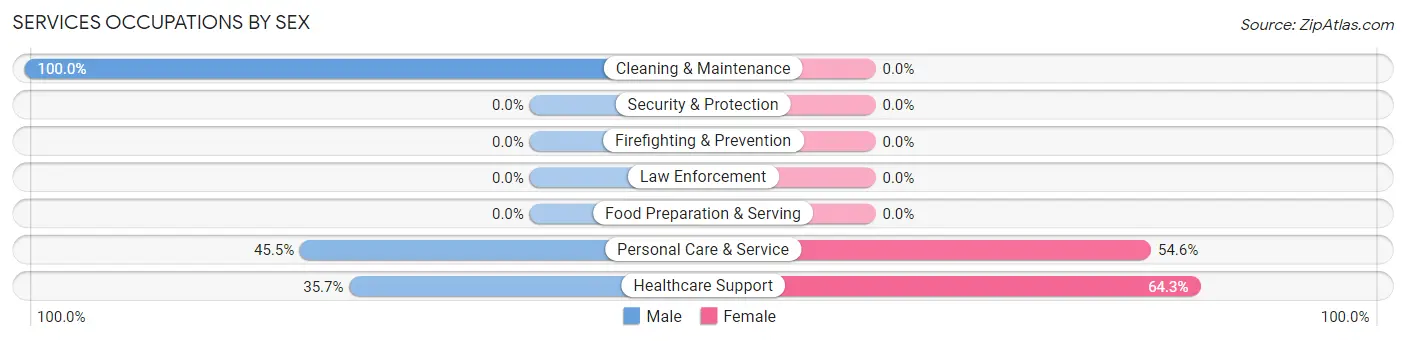
Services Occupations by Sex
Within the Services occupations in East Hills, the most male-oriented occupations are Cleaning & Maintenance (100.0%), Personal Care & Service (45.5%), and Healthcare Support (35.7%), while the most female-oriented occupations are Healthcare Support (64.3%), and Personal Care & Service (54.5%).
| Occupation | Male | Female |
| Healthcare Support | 10 (35.7%) | 18 (64.3%) |
| Security & Protection | 0 (0.0%) | 0 (0.0%) |
| Firefighting & Prevention | 0 (0.0%) | 0 (0.0%) |
| Law Enforcement | 0 (0.0%) | 0 (0.0%) |
| Food Preparation & Serving | 0 (0.0%) | 0 (0.0%) |
| Cleaning & Maintenance | 50 (100.0%) | 0 (0.0%) |
| Personal Care & Service | 10 (45.5%) | 12 (54.5%) |
| Total (Category) | 70 (70.0%) | 30 (30.0%) |
| Total (Overall) | 2,207 (56.1%) | 1,726 (43.9%) |
Sales and Office Occupations
The most common Sales and Office occupations in East Hills are Sales & Related (640 | 16.3%), and Office & Administration (241 | 6.1%).
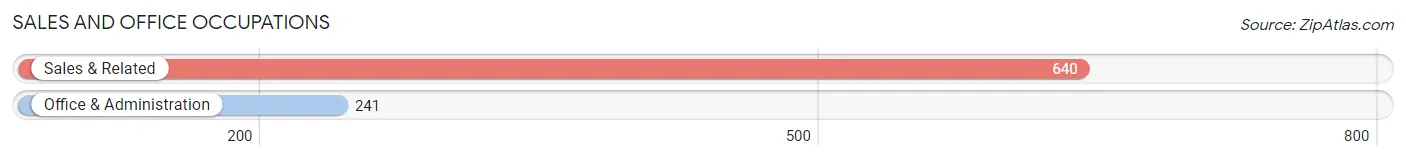
Sales and Office Occupations by Sex
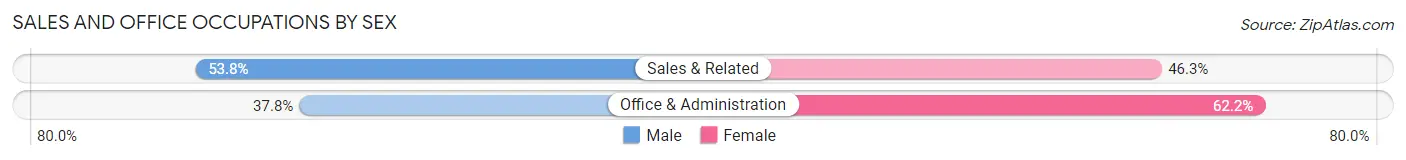
| Occupation | Male | Female |
| Sales & Related | 344 (53.7%) | 296 (46.3%) |
| Office & Administration | 91 (37.8%) | 150 (62.2%) |
| Total (Category) | 435 (49.4%) | 446 (50.6%) |
| Total (Overall) | 2,207 (56.1%) | 1,726 (43.9%) |
Natural Resources, Construction and Maintenance Occupations
The most common Natural Resources, Construction and Maintenance occupations in East Hills are Construction & Extraction (65 | 1.7%), Farming, Fishing & Forestry (14 | 0.4%), and Installation, Maintenance & Repair (14 | 0.4%).
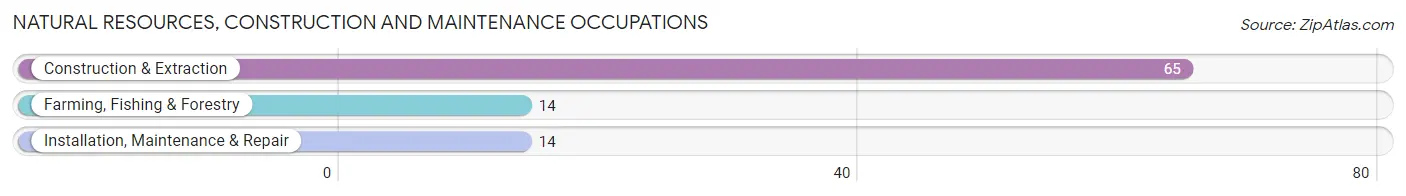
Natural Resources, Construction and Maintenance Occupations by Sex
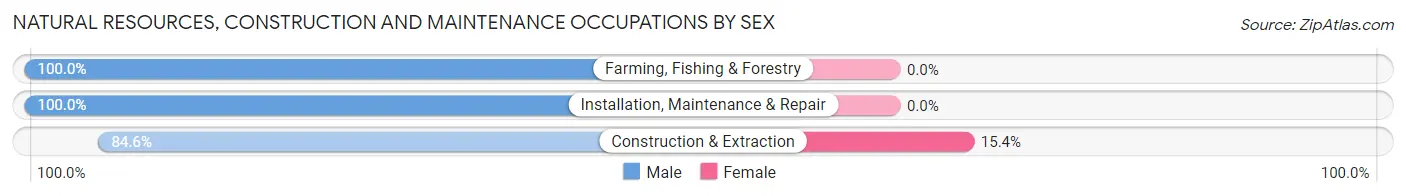
| Occupation | Male | Female |
| Farming, Fishing & Forestry | 14 (100.0%) | 0 (0.0%) |
| Construction & Extraction | 55 (84.6%) | 10 (15.4%) |
| Installation, Maintenance & Repair | 14 (100.0%) | 0 (0.0%) |
| Total (Category) | 83 (89.2%) | 10 (10.7%) |
| Total (Overall) | 2,207 (56.1%) | 1,726 (43.9%) |
Production, Transportation and Moving Occupations
The most common Production, Transportation and Moving occupations in East Hills are Production (65 | 1.7%), and Material Moving (28 | 0.7%).
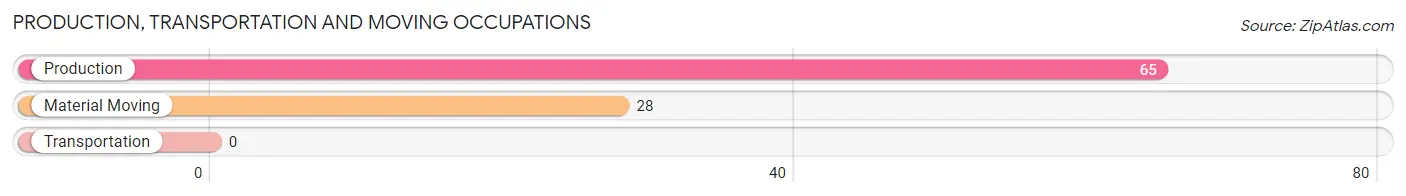
Production, Transportation and Moving Occupations by Sex
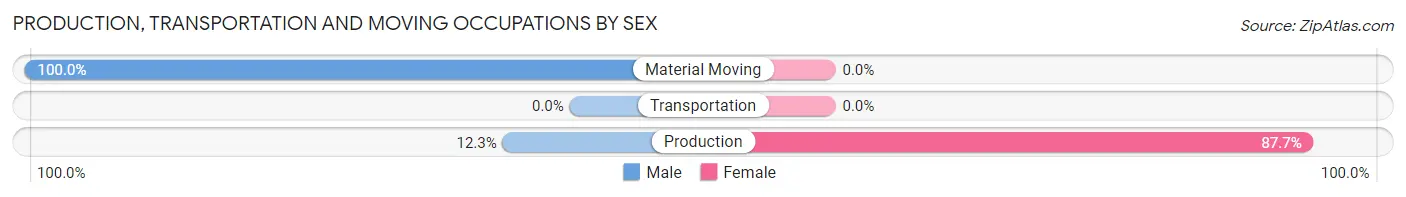
| Occupation | Male | Female |
| Production | 8 (12.3%) | 57 (87.7%) |
| Transportation | 0 (0.0%) | 0 (0.0%) |
| Material Moving | 28 (100.0%) | 0 (0.0%) |
| Total (Category) | 36 (38.7%) | 57 (61.3%) |
| Total (Overall) | 2,207 (56.1%) | 1,726 (43.9%) |
Employment Industries by Sex in East Hills
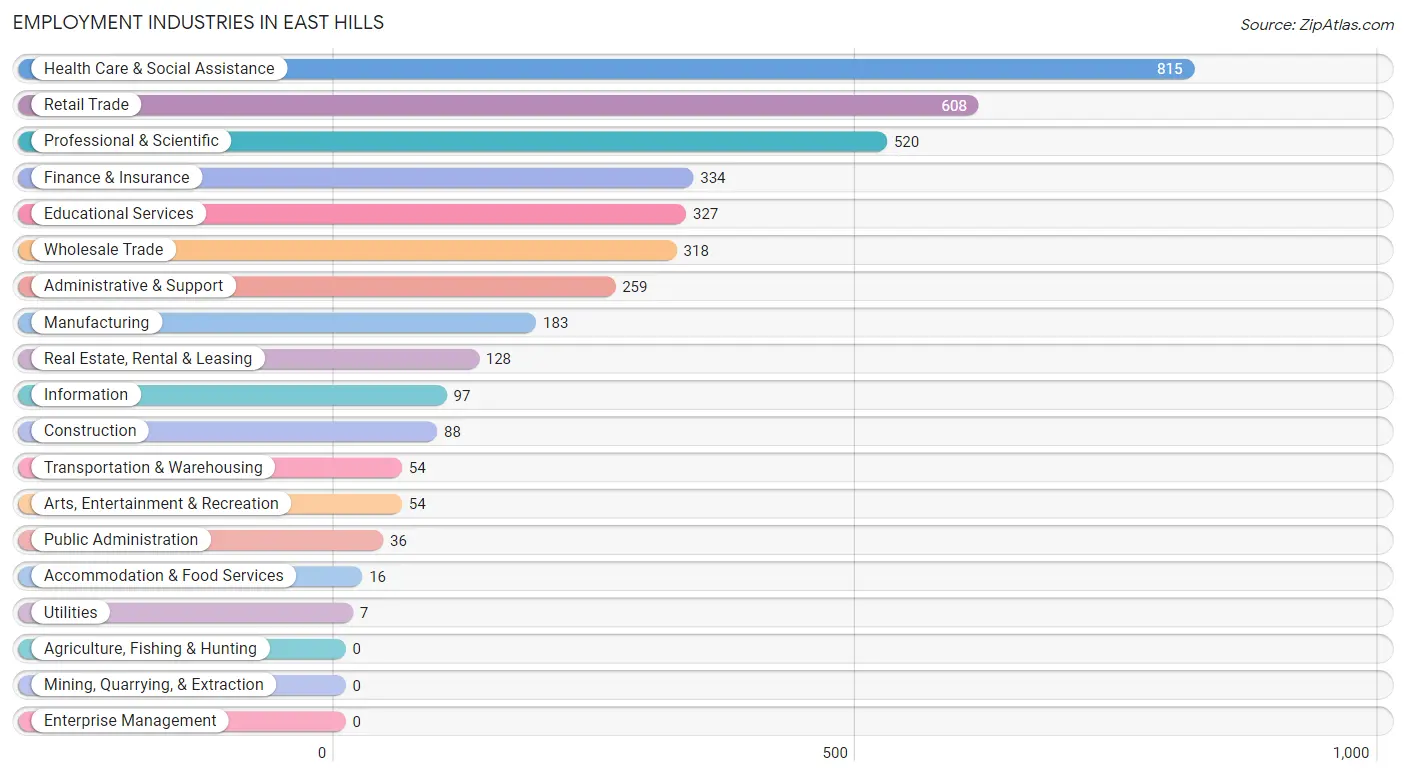
Employment Industries in East Hills
The major employment industries in East Hills include Health Care & Social Assistance (815 | 20.7%), Retail Trade (608 | 15.5%), Professional & Scientific (520 | 13.2%), Finance & Insurance (334 | 8.5%), and Educational Services (327 | 8.3%).
Employment Industries by Sex in East Hills
The East Hills industries that see more men than women are Transportation & Warehousing (100.0%), Public Administration (100.0%), and Real Estate, Rental & Leasing (79.7%), whereas the industries that tend to have a higher number of women are Utilities (100.0%), Retail Trade (73.2%), and Arts, Entertainment & Recreation (72.2%).
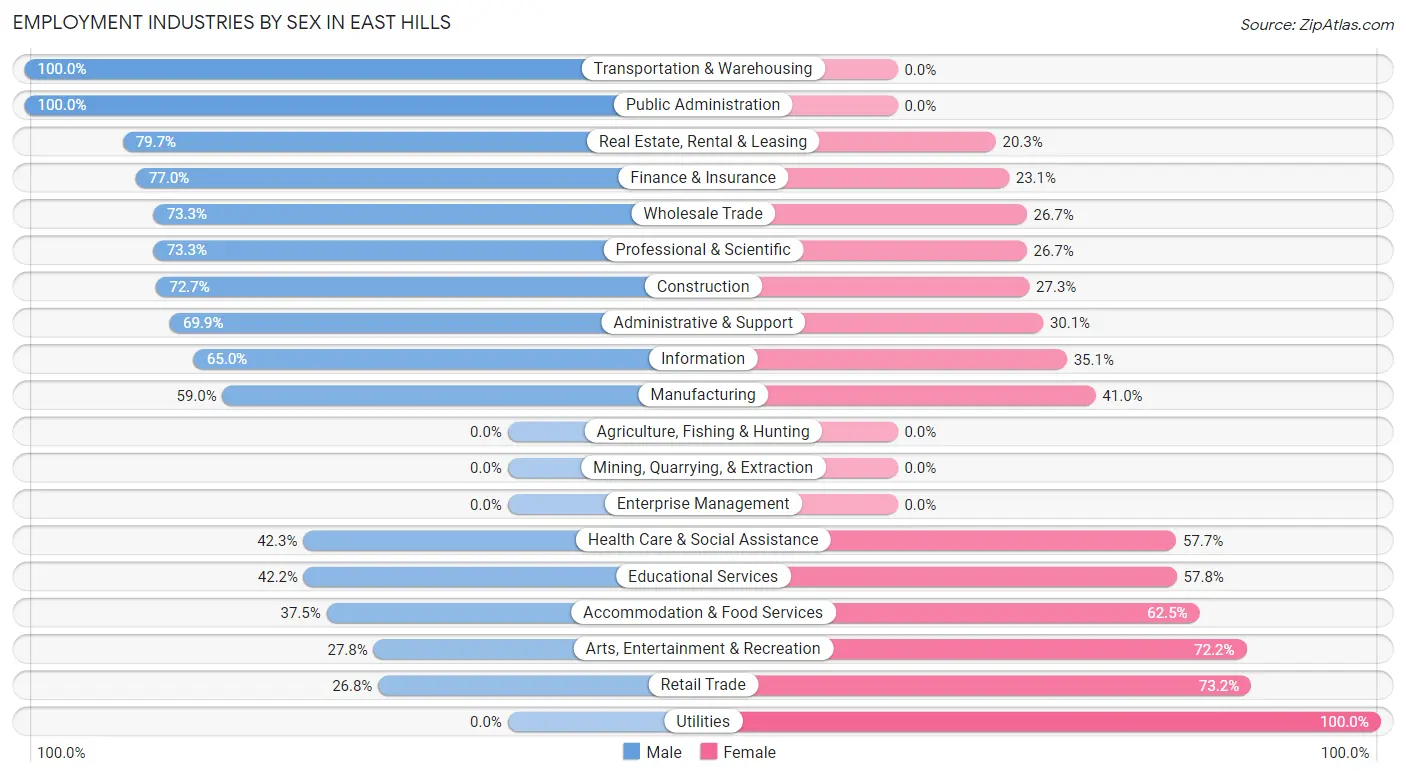
| Industry | Male | Female |
| Agriculture, Fishing & Hunting | 0 (0.0%) | 0 (0.0%) |
| Mining, Quarrying, & Extraction | 0 (0.0%) | 0 (0.0%) |
| Construction | 64 (72.7%) | 24 (27.3%) |
| Manufacturing | 108 (59.0%) | 75 (41.0%) |
| Wholesale Trade | 233 (73.3%) | 85 (26.7%) |
| Retail Trade | 163 (26.8%) | 445 (73.2%) |
| Transportation & Warehousing | 54 (100.0%) | 0 (0.0%) |
| Utilities | 0 (0.0%) | 7 (100.0%) |
| Information | 63 (64.9%) | 34 (35.0%) |
| Finance & Insurance | 257 (76.9%) | 77 (23.1%) |
| Real Estate, Rental & Leasing | 102 (79.7%) | 26 (20.3%) |
| Professional & Scientific | 381 (73.3%) | 139 (26.7%) |
| Enterprise Management | 0 (0.0%) | 0 (0.0%) |
| Administrative & Support | 181 (69.9%) | 78 (30.1%) |
| Educational Services | 138 (42.2%) | 189 (57.8%) |
| Health Care & Social Assistance | 345 (42.3%) | 470 (57.7%) |
| Arts, Entertainment & Recreation | 15 (27.8%) | 39 (72.2%) |
| Accommodation & Food Services | 6 (37.5%) | 10 (62.5%) |
| Public Administration | 36 (100.0%) | 0 (0.0%) |
| Total | 2,207 (56.1%) | 1,726 (43.9%) |
Education in East Hills
School Enrollment in East Hills
The most common levels of schooling among the 1,983 students in East Hills are high school (456 | 23.0%), middle school (419 | 21.1%), and elementary school (416 | 21.0%).
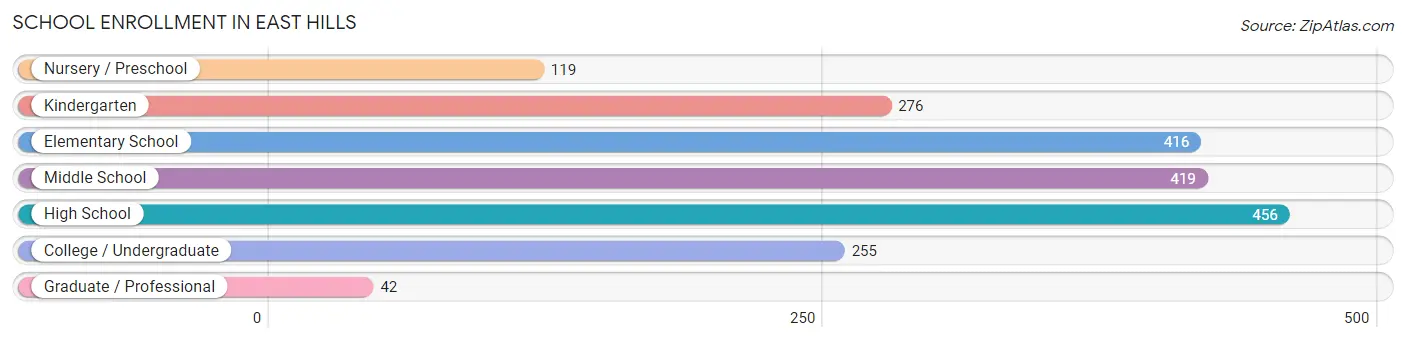
| School Level | # Students | % Students |
| Nursery / Preschool | 119 | 6.0% |
| Kindergarten | 276 | 13.9% |
| Elementary School | 416 | 21.0% |
| Middle School | 419 | 21.1% |
| High School | 456 | 23.0% |
| College / Undergraduate | 255 | 12.9% |
| Graduate / Professional | 42 | 2.1% |
| Total | 1,983 | 100.0% |
School Enrollment by Age by Funding Source in East Hills
Out of a total of 1,983 students who are enrolled in schools in East Hills, 309 (15.6%) attend a private institution, while the remaining 1,674 (84.4%) are enrolled in public schools. The age group of 3 to 4 year olds has the highest likelihood of being enrolled in private schools, with 79 (54.1% in the age bracket) enrolled. Conversely, the age group of 5 to 9 year old has the lowest likelihood of being enrolled in a private school, with 642 (97.4% in the age bracket) attending a public institution.
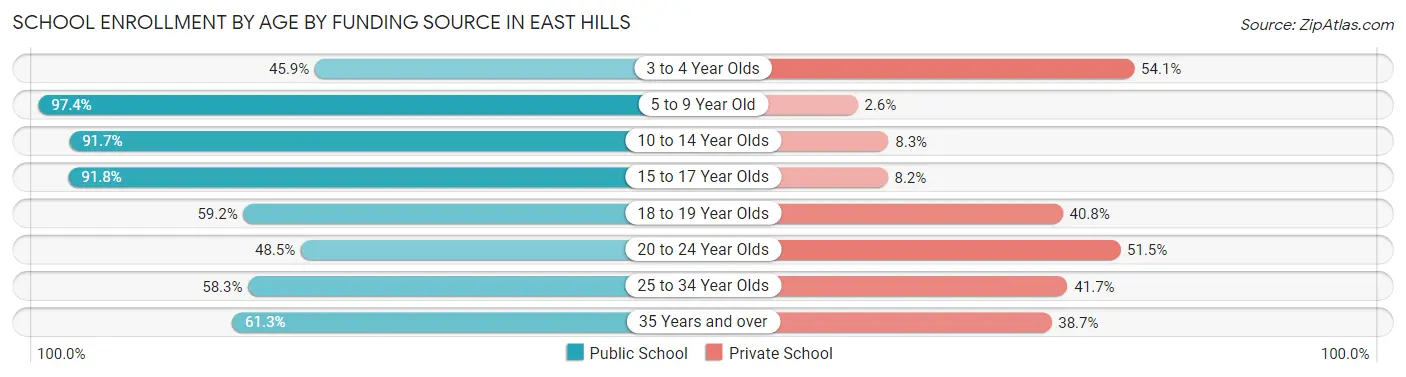
| Age Bracket | Public School | Private School |
| 3 to 4 Year Olds | 67 (45.9%) | 79 (54.1%) |
| 5 to 9 Year Old | 642 (97.4%) | 17 (2.6%) |
| 10 to 14 Year Olds | 452 (91.7%) | 41 (8.3%) |
| 15 to 17 Year Olds | 326 (91.8%) | 29 (8.2%) |
| 18 to 19 Year Olds | 77 (59.2%) | 53 (40.8%) |
| 20 to 24 Year Olds | 49 (48.5%) | 52 (51.5%) |
| 25 to 34 Year Olds | 14 (58.3%) | 10 (41.7%) |
| 35 Years and over | 46 (61.3%) | 29 (38.7%) |
| Total | 1,674 (84.4%) | 309 (15.6%) |
Educational Attainment by Field of Study in East Hills
Business (1,148 | 28.1%), bio, nature & agricultural (428 | 10.5%), education (424 | 10.4%), social sciences (357 | 8.7%), and psychology (329 | 8.1%) are the most common fields of study among 4,089 individuals in East Hills who have obtained a bachelor's degree or higher.
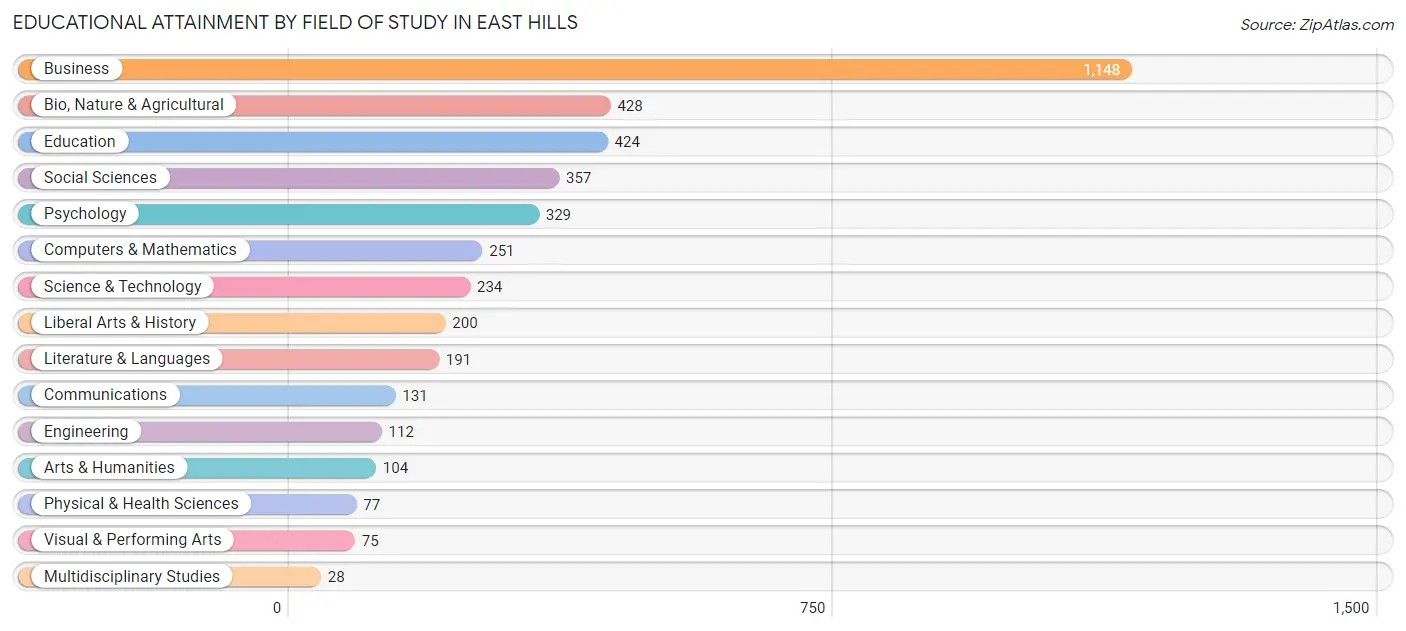
| Field of Study | # Graduates | % Graduates |
| Computers & Mathematics | 251 | 6.1% |
| Bio, Nature & Agricultural | 428 | 10.5% |
| Physical & Health Sciences | 77 | 1.9% |
| Psychology | 329 | 8.1% |
| Social Sciences | 357 | 8.7% |
| Engineering | 112 | 2.7% |
| Multidisciplinary Studies | 28 | 0.7% |
| Science & Technology | 234 | 5.7% |
| Business | 1,148 | 28.1% |
| Education | 424 | 10.4% |
| Literature & Languages | 191 | 4.7% |
| Liberal Arts & History | 200 | 4.9% |
| Visual & Performing Arts | 75 | 1.8% |
| Communications | 131 | 3.2% |
| Arts & Humanities | 104 | 2.5% |
| Total | 4,089 | 100.0% |
Transportation & Commute in East Hills
Vehicle Availability by Sex in East Hills
The most prevalent vehicle ownership categories in East Hills are males with 2 vehicles (1,006, accounting for 46.2%) and females with 2 vehicles (806, making up 58.6%).
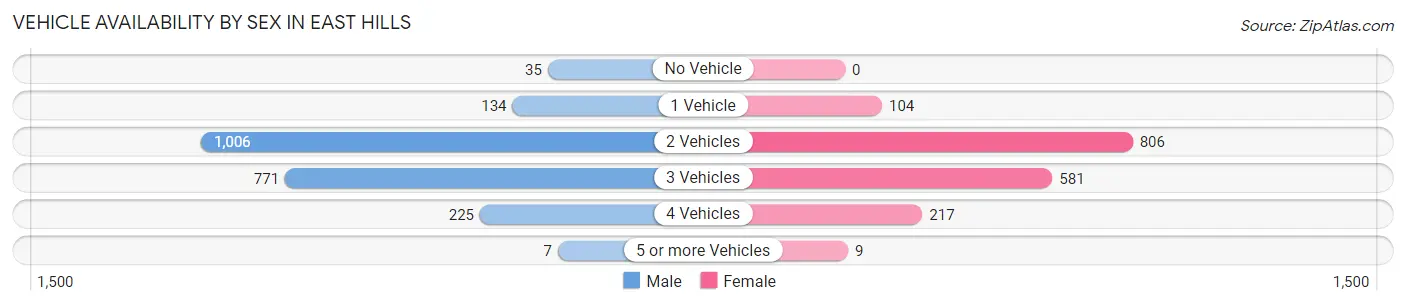
| Vehicles Available | Male | Female |
| No Vehicle | 35 (1.6%) | 0 (0.0%) |
| 1 Vehicle | 134 (6.1%) | 104 (6.1%) |
| 2 Vehicles | 1,006 (46.2%) | 806 (46.9%) |
| 3 Vehicles | 771 (35.4%) | 581 (33.8%) |
| 4 Vehicles | 225 (10.3%) | 217 (12.6%) |
| 5 or more Vehicles | 7 (0.3%) | 9 (0.5%) |
| Total | 2,178 (100.0%) | 1,717 (100.0%) |
Commute Time in East Hills
The most frequently occuring commute durations in East Hills are 60 to 89 minutes (992 commuters, 31.6%), 15 to 19 minutes (401 commuters, 12.8%), and 45 to 59 minutes (361 commuters, 11.5%).
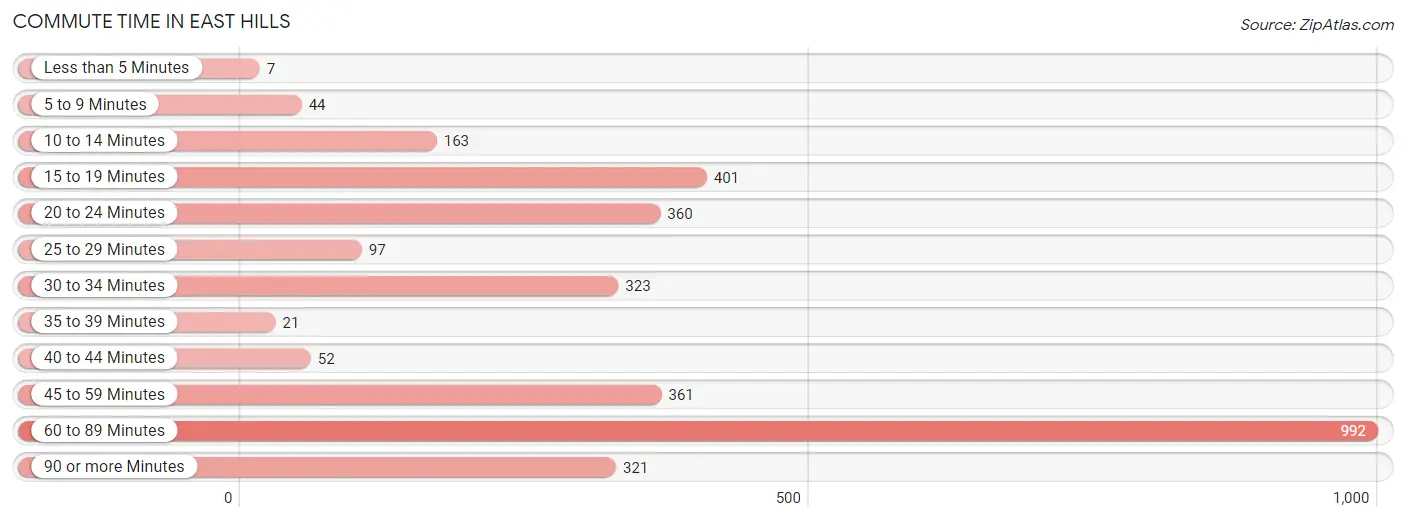
| Commute Time | # Commuters | % Commuters |
| Less than 5 Minutes | 7 | 0.2% |
| 5 to 9 Minutes | 44 | 1.4% |
| 10 to 14 Minutes | 163 | 5.2% |
| 15 to 19 Minutes | 401 | 12.8% |
| 20 to 24 Minutes | 360 | 11.5% |
| 25 to 29 Minutes | 97 | 3.1% |
| 30 to 34 Minutes | 323 | 10.3% |
| 35 to 39 Minutes | 21 | 0.7% |
| 40 to 44 Minutes | 52 | 1.7% |
| 45 to 59 Minutes | 361 | 11.5% |
| 60 to 89 Minutes | 992 | 31.6% |
| 90 or more Minutes | 321 | 10.2% |
Commute Time by Sex in East Hills
The most common commute times in East Hills are 60 to 89 minutes (756 commuters, 40.9%) for males and 90 or more minutes (271 commuters, 20.9%) for females.
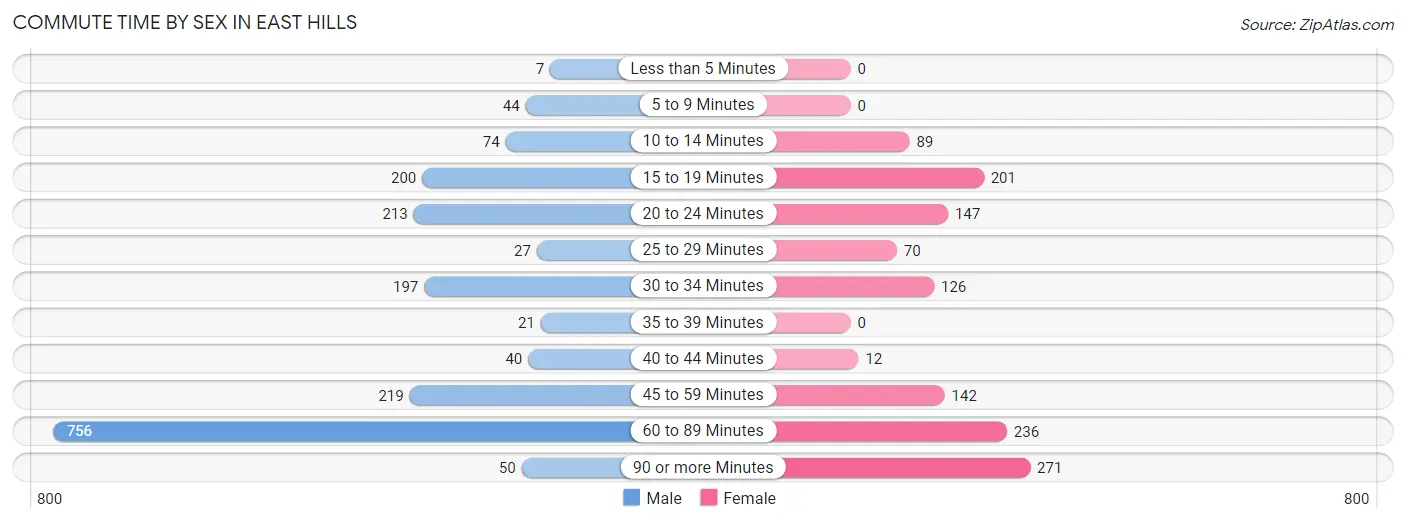
| Commute Time | Male | Female |
| Less than 5 Minutes | 7 (0.4%) | 0 (0.0%) |
| 5 to 9 Minutes | 44 (2.4%) | 0 (0.0%) |
| 10 to 14 Minutes | 74 (4.0%) | 89 (6.9%) |
| 15 to 19 Minutes | 200 (10.8%) | 201 (15.5%) |
| 20 to 24 Minutes | 213 (11.5%) | 147 (11.4%) |
| 25 to 29 Minutes | 27 (1.5%) | 70 (5.4%) |
| 30 to 34 Minutes | 197 (10.7%) | 126 (9.7%) |
| 35 to 39 Minutes | 21 (1.1%) | 0 (0.0%) |
| 40 to 44 Minutes | 40 (2.2%) | 12 (0.9%) |
| 45 to 59 Minutes | 219 (11.8%) | 142 (11.0%) |
| 60 to 89 Minutes | 756 (40.9%) | 236 (18.2%) |
| 90 or more Minutes | 50 (2.7%) | 271 (20.9%) |
Time of Departure to Work by Sex in East Hills
The most frequent times of departure to work in East Hills are 8:00 AM to 8:29 AM (484, 26.2%) for males and 7:00 AM to 7:29 AM (346, 26.7%) for females.
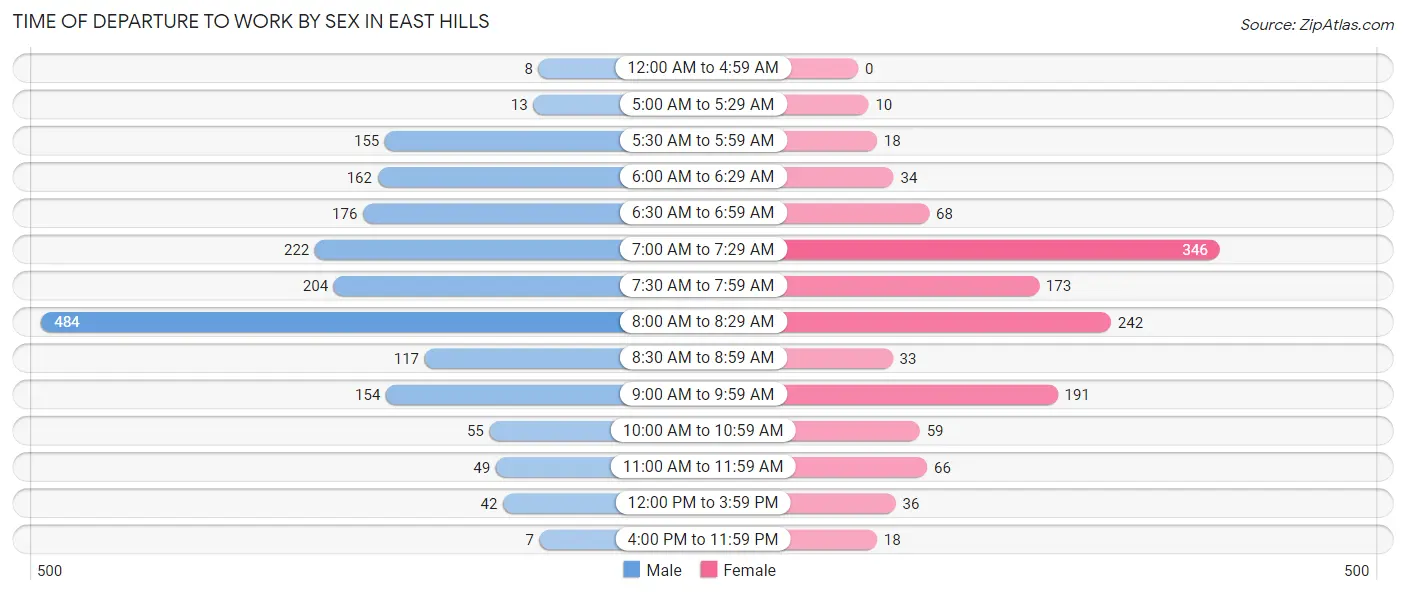
| Time of Departure | Male | Female |
| 12:00 AM to 4:59 AM | 8 (0.4%) | 0 (0.0%) |
| 5:00 AM to 5:29 AM | 13 (0.7%) | 10 (0.8%) |
| 5:30 AM to 5:59 AM | 155 (8.4%) | 18 (1.4%) |
| 6:00 AM to 6:29 AM | 162 (8.8%) | 34 (2.6%) |
| 6:30 AM to 6:59 AM | 176 (9.5%) | 68 (5.3%) |
| 7:00 AM to 7:29 AM | 222 (12.0%) | 346 (26.7%) |
| 7:30 AM to 7:59 AM | 204 (11.0%) | 173 (13.4%) |
| 8:00 AM to 8:29 AM | 484 (26.2%) | 242 (18.7%) |
| 8:30 AM to 8:59 AM | 117 (6.3%) | 33 (2.5%) |
| 9:00 AM to 9:59 AM | 154 (8.3%) | 191 (14.8%) |
| 10:00 AM to 10:59 AM | 55 (3.0%) | 59 (4.6%) |
| 11:00 AM to 11:59 AM | 49 (2.6%) | 66 (5.1%) |
| 12:00 PM to 3:59 PM | 42 (2.3%) | 36 (2.8%) |
| 4:00 PM to 11:59 PM | 7 (0.4%) | 18 (1.4%) |
| Total | 1,848 (100.0%) | 1,294 (100.0%) |
Housing Occupancy in East Hills
Occupancy by Ownership in East Hills
Of the total 2,238 dwellings in East Hills, owner-occupied units account for 2,238 (100.0%), while renter-occupied units make up 0 (0.0%).
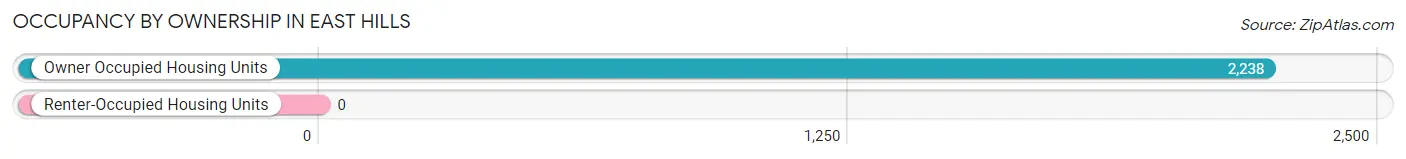
| Occupancy | # Housing Units | % Housing Units |
| Owner Occupied Housing Units | 2,238 | 100.0% |
| Renter-Occupied Housing Units | 0 | 0.0% |
| Total Occupied Housing Units | 2,238 | 100.0% |
Occupancy by Household Size in East Hills
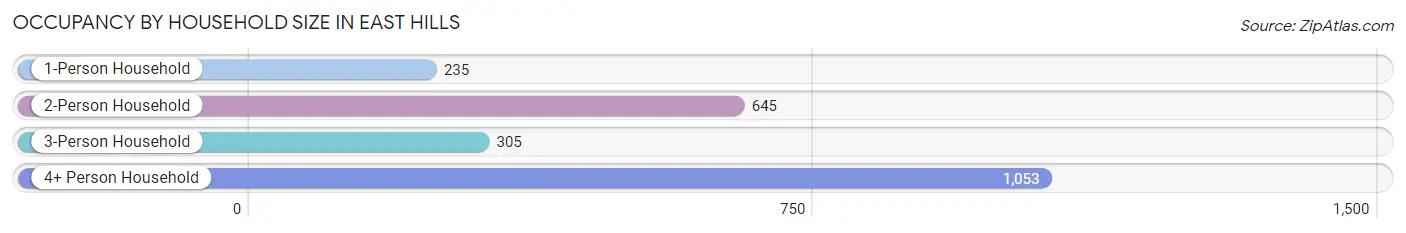
| Household Size | # Housing Units | % Housing Units |
| 1-Person Household | 235 | 10.5% |
| 2-Person Household | 645 | 28.8% |
| 3-Person Household | 305 | 13.6% |
| 4+ Person Household | 1,053 | 47.0% |
| Total Housing Units | 2,238 | 100.0% |
Occupancy by Ownership by Household Size in East Hills
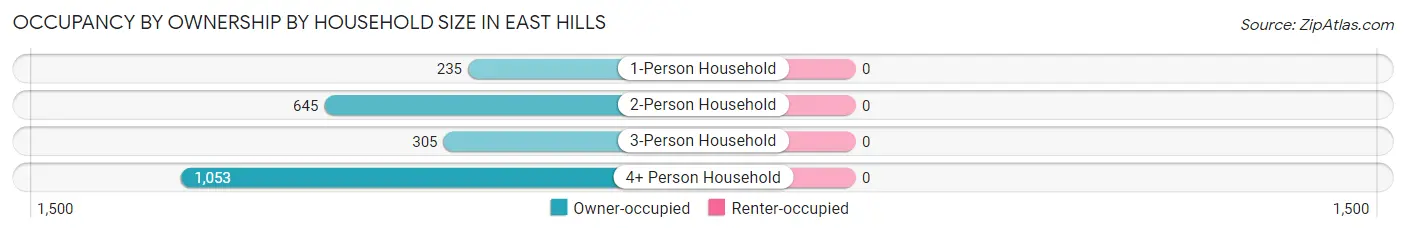
| Household Size | Owner-occupied | Renter-occupied |
| 1-Person Household | 235 (100.0%) | 0 (0.0%) |
| 2-Person Household | 645 (100.0%) | 0 (0.0%) |
| 3-Person Household | 305 (100.0%) | 0 (0.0%) |
| 4+ Person Household | 1,053 (100.0%) | 0 (0.0%) |
| Total Housing Units | 2,238 (100.0%) | 0 (0.0%) |
Occupancy by Educational Attainment in East Hills
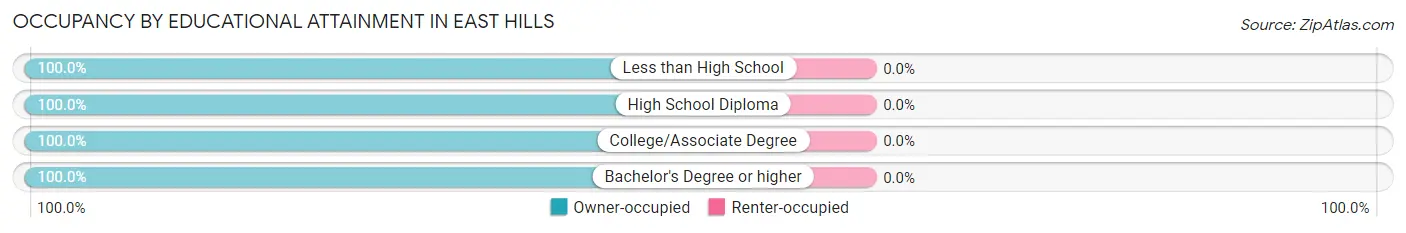
| Household Size | Owner-occupied | Renter-occupied |
| Less than High School | 41 (100.0%) | 0 (0.0%) |
| High School Diploma | 29 (100.0%) | 0 (0.0%) |
| College/Associate Degree | 306 (100.0%) | 0 (0.0%) |
| Bachelor's Degree or higher | 1,862 (100.0%) | 0 (0.0%) |
Occupancy by Age of Householder in East Hills
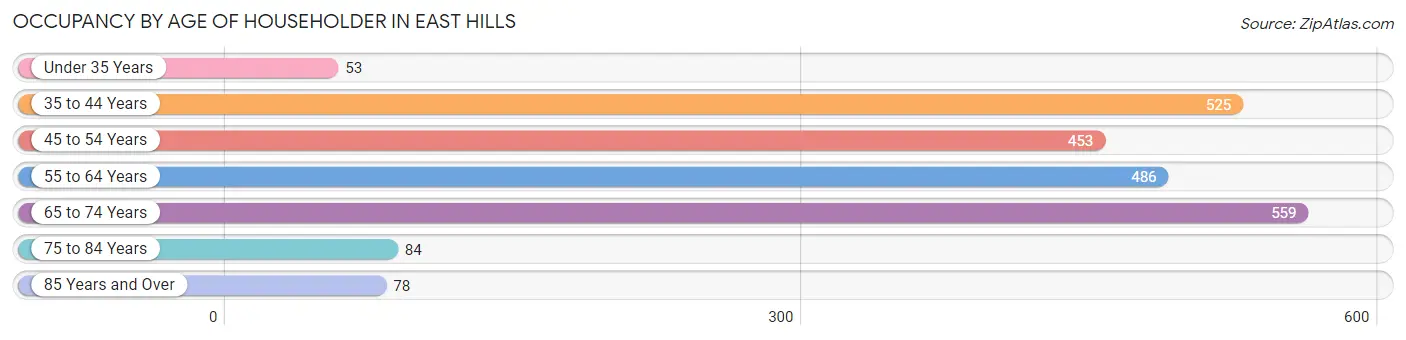
| Age Bracket | # Households | % Households |
| Under 35 Years | 53 | 2.4% |
| 35 to 44 Years | 525 | 23.5% |
| 45 to 54 Years | 453 | 20.2% |
| 55 to 64 Years | 486 | 21.7% |
| 65 to 74 Years | 559 | 25.0% |
| 75 to 84 Years | 84 | 3.7% |
| 85 Years and Over | 78 | 3.5% |
| Total | 2,238 | 100.0% |
Housing Finances in East Hills
Median Income by Occupancy in East Hills
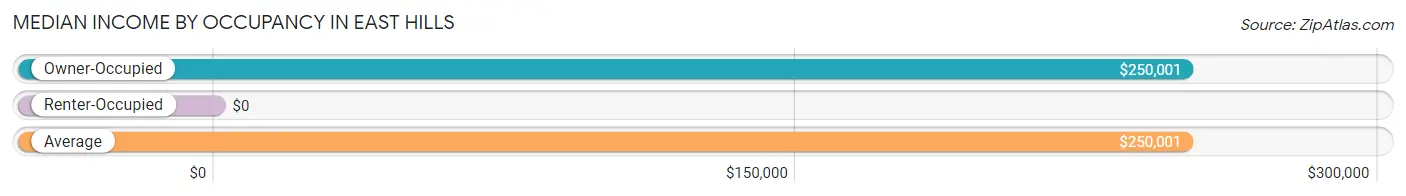
| Occupancy Type | # Households | Median Income |
| Owner-Occupied | 2,238 (100.0%) | $250,001 |
| Renter-Occupied | 0 (0.0%) | $0 |
| Average | 2,238 (100.0%) | $250,001 |
Occupancy by Householder Income Bracket in East Hills
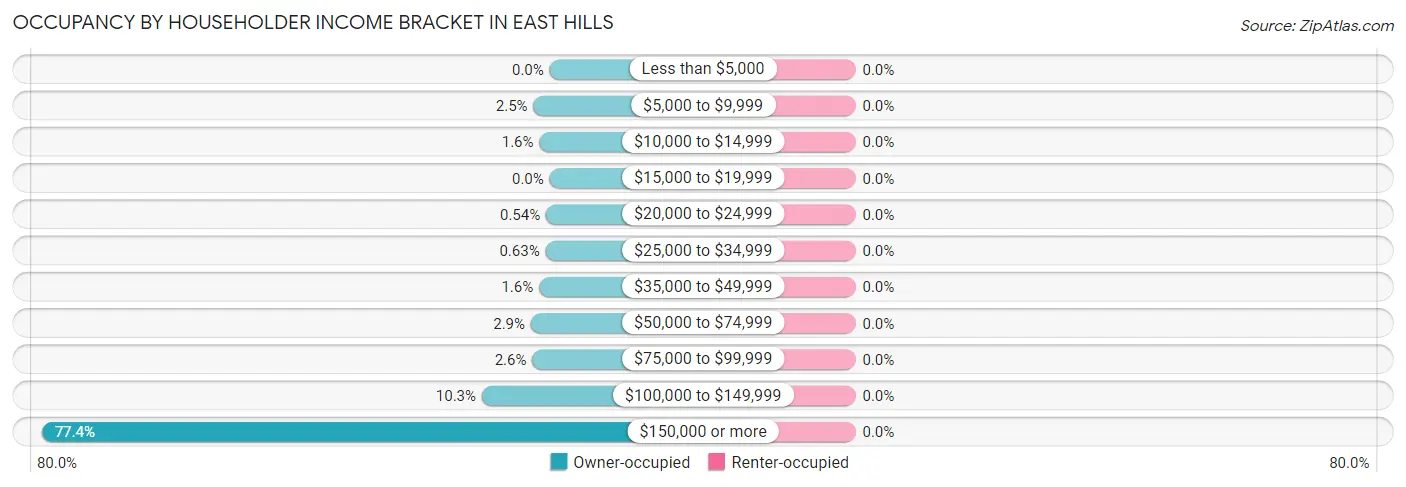
| Income Bracket | Owner-occupied | Renter-occupied |
| Less than $5,000 | 0 (0.0%) | 0 (0.0%) |
| $5,000 to $9,999 | 55 (2.5%) | 0 (0.0%) |
| $10,000 to $14,999 | 35 (1.6%) | 0 (0.0%) |
| $15,000 to $19,999 | 0 (0.0%) | 0 (0.0%) |
| $20,000 to $24,999 | 12 (0.5%) | 0 (0.0%) |
| $25,000 to $34,999 | 14 (0.6%) | 0 (0.0%) |
| $35,000 to $49,999 | 36 (1.6%) | 0 (0.0%) |
| $50,000 to $74,999 | 64 (2.9%) | 0 (0.0%) |
| $75,000 to $99,999 | 59 (2.6%) | 0 (0.0%) |
| $100,000 to $149,999 | 231 (10.3%) | 0 (0.0%) |
| $150,000 or more | 1,732 (77.4%) | 0 (0.0%) |
| Total | 2,238 (100.0%) | 0 (0.0%) |
Monthly Housing Cost Tiers in East Hills
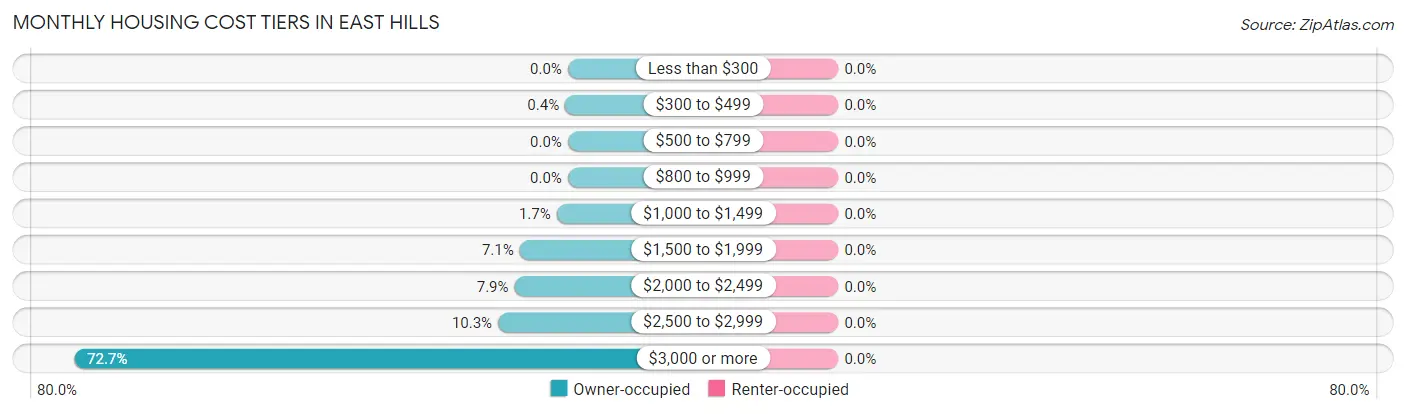
| Monthly Cost | Owner-occupied | Renter-occupied |
| Less than $300 | 0 (0.0%) | 0 (0.0%) |
| $300 to $499 | 9 (0.4%) | 0 (0.0%) |
| $500 to $799 | 0 (0.0%) | 0 (0.0%) |
| $800 to $999 | 0 (0.0%) | 0 (0.0%) |
| $1,000 to $1,499 | 37 (1.7%) | 0 (0.0%) |
| $1,500 to $1,999 | 159 (7.1%) | 0 (0.0%) |
| $2,000 to $2,499 | 176 (7.9%) | 0 (0.0%) |
| $2,500 to $2,999 | 230 (10.3%) | 0 (0.0%) |
| $3,000 or more | 1,627 (72.7%) | 0 (0.0%) |
| Total | 2,238 (100.0%) | 0 (0.0%) |
Physical Housing Characteristics in East Hills
Housing Structures in East Hills
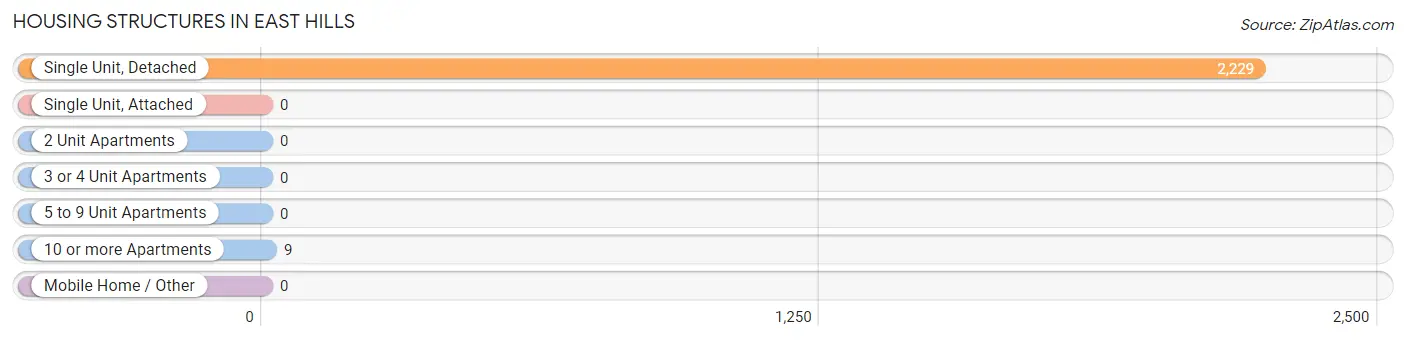
| Structure Type | # Housing Units | % Housing Units |
| Single Unit, Detached | 2,229 | 99.6% |
| Single Unit, Attached | 0 | 0.0% |
| 2 Unit Apartments | 0 | 0.0% |
| 3 or 4 Unit Apartments | 0 | 0.0% |
| 5 to 9 Unit Apartments | 0 | 0.0% |
| 10 or more Apartments | 9 | 0.4% |
| Mobile Home / Other | 0 | 0.0% |
| Total | 2,238 | 100.0% |
Housing Structures by Occupancy in East Hills
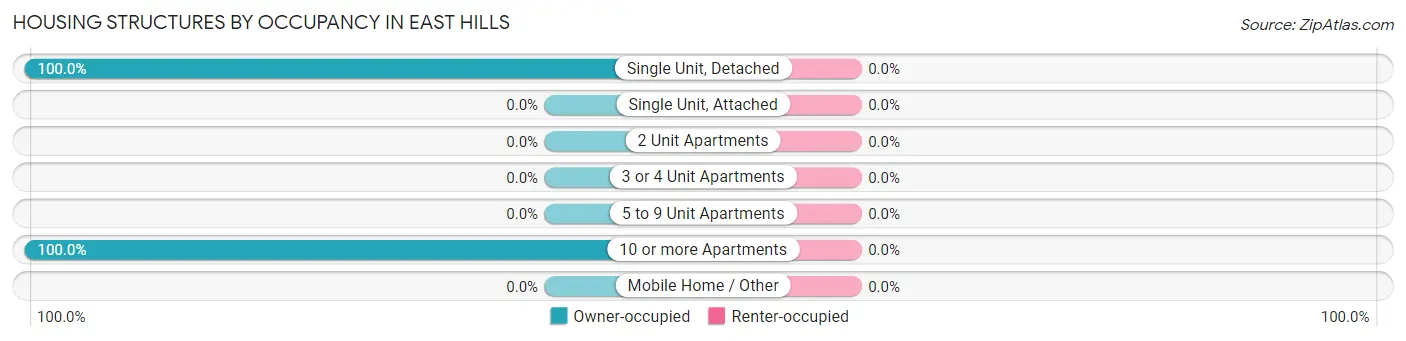
| Structure Type | Owner-occupied | Renter-occupied |
| Single Unit, Detached | 2,229 (100.0%) | 0 (0.0%) |
| Single Unit, Attached | 0 (0.0%) | 0 (0.0%) |
| 2 Unit Apartments | 0 (0.0%) | 0 (0.0%) |
| 3 or 4 Unit Apartments | 0 (0.0%) | 0 (0.0%) |
| 5 to 9 Unit Apartments | 0 (0.0%) | 0 (0.0%) |
| 10 or more Apartments | 9 (100.0%) | 0 (0.0%) |
| Mobile Home / Other | 0 (0.0%) | 0 (0.0%) |
| Total | 2,238 (100.0%) | 0 (0.0%) |
Housing Structures by Number of Rooms in East Hills
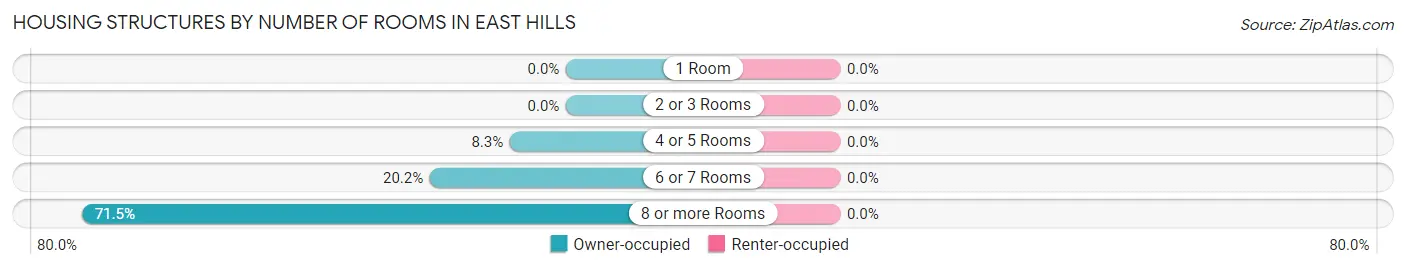
| Number of Rooms | Owner-occupied | Renter-occupied |
| 1 Room | 0 (0.0%) | 0 (0.0%) |
| 2 or 3 Rooms | 0 (0.0%) | 0 (0.0%) |
| 4 or 5 Rooms | 186 (8.3%) | 0 (0.0%) |
| 6 or 7 Rooms | 451 (20.2%) | 0 (0.0%) |
| 8 or more Rooms | 1,601 (71.5%) | 0 (0.0%) |
| Total | 2,238 (100.0%) | 0 (0.0%) |
Housing Structure by Heating Type in East Hills
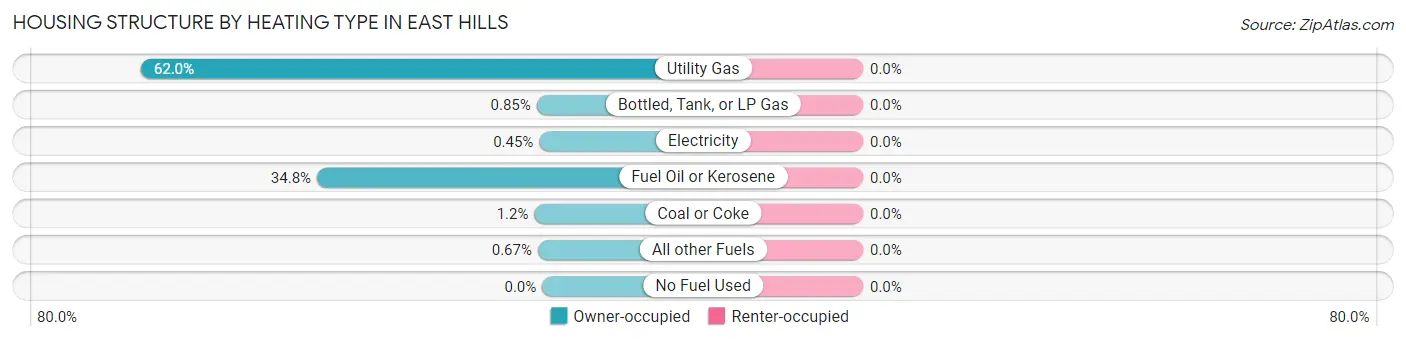
| Heating Type | Owner-occupied | Renter-occupied |
| Utility Gas | 1,388 (62.0%) | 0 (0.0%) |
| Bottled, Tank, or LP Gas | 19 (0.9%) | 0 (0.0%) |
| Electricity | 10 (0.4%) | 0 (0.0%) |
| Fuel Oil or Kerosene | 779 (34.8%) | 0 (0.0%) |
| Coal or Coke | 27 (1.2%) | 0 (0.0%) |
| All other Fuels | 15 (0.7%) | 0 (0.0%) |
| No Fuel Used | 0 (0.0%) | 0 (0.0%) |
| Total | 2,238 (100.0%) | 0 (0.0%) |
Household Vehicle Usage in East Hills
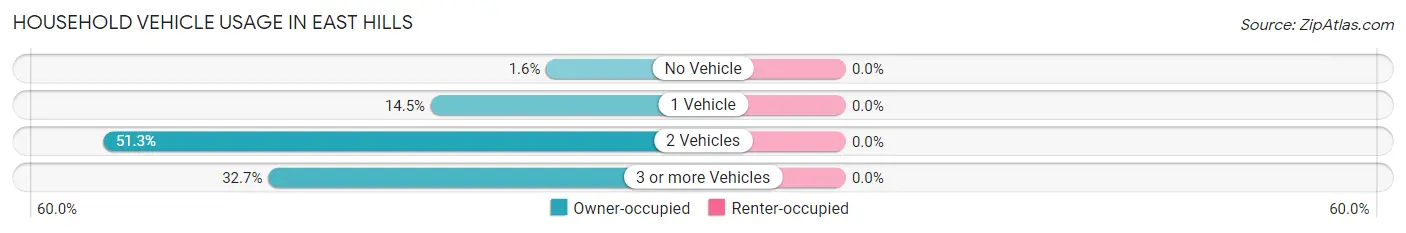
| Vehicles per Household | Owner-occupied | Renter-occupied |
| No Vehicle | 35 (1.6%) | 0 (0.0%) |
| 1 Vehicle | 324 (14.5%) | 0 (0.0%) |
| 2 Vehicles | 1,147 (51.2%) | 0 (0.0%) |
| 3 or more Vehicles | 732 (32.7%) | 0 (0.0%) |
| Total | 2,238 (100.0%) | 0 (0.0%) |
Real Estate & Mortgages in East Hills
Real Estate and Mortgage Overview in East Hills
| Characteristic | Without Mortgage | With Mortgage |
| Housing Units | 951 | 1,287 |
| Median Property Value | $1,110,000 | $1,435,600 |
| Median Household Income | $228,281 | $1,104 |
| Monthly Housing Costs | $1,501 | $1,211 |
| Real Estate Taxes | $10,001 | $9 |
Property Value by Mortgage Status in East Hills
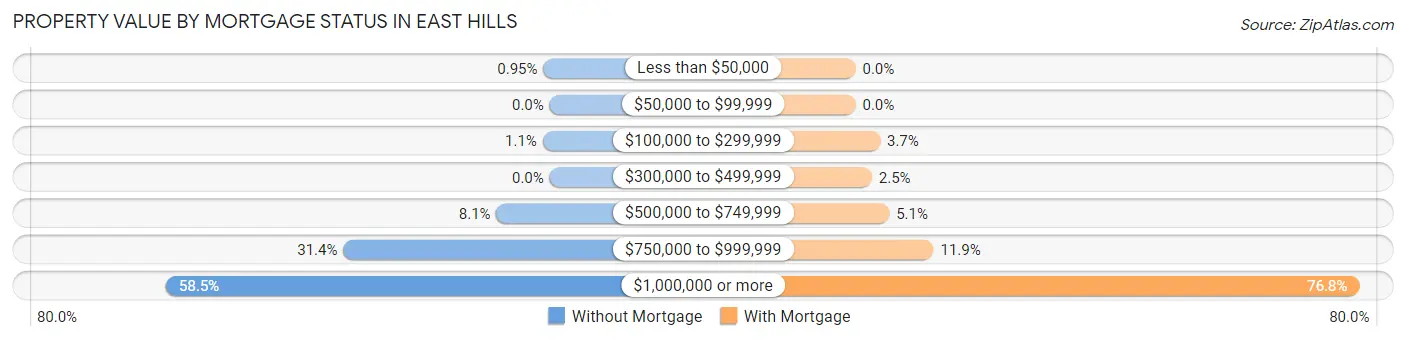
| Property Value | Without Mortgage | With Mortgage |
| Less than $50,000 | 9 (0.9%) | 0 (0.0%) |
| $50,000 to $99,999 | 0 (0.0%) | 0 (0.0%) |
| $100,000 to $299,999 | 10 (1.1%) | 48 (3.7%) |
| $300,000 to $499,999 | 0 (0.0%) | 32 (2.5%) |
| $500,000 to $749,999 | 77 (8.1%) | 66 (5.1%) |
| $750,000 to $999,999 | 299 (31.4%) | 153 (11.9%) |
| $1,000,000 or more | 556 (58.5%) | 988 (76.8%) |
| Total | 951 (100.0%) | 1,287 (100.0%) |
Household Income by Mortgage Status in East Hills
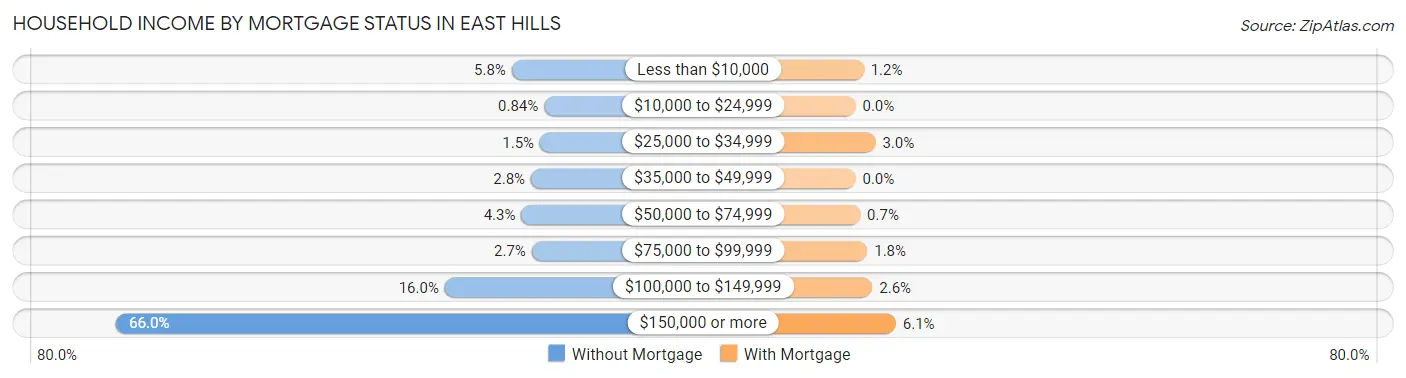
| Household Income | Without Mortgage | With Mortgage |
| Less than $10,000 | 55 (5.8%) | 16 (1.2%) |
| $10,000 to $24,999 | 8 (0.8%) | 0 (0.0%) |
| $25,000 to $34,999 | 14 (1.5%) | 39 (3.0%) |
| $35,000 to $49,999 | 27 (2.8%) | 0 (0.0%) |
| $50,000 to $74,999 | 41 (4.3%) | 9 (0.7%) |
| $75,000 to $99,999 | 26 (2.7%) | 23 (1.8%) |
| $100,000 to $149,999 | 152 (16.0%) | 33 (2.6%) |
| $150,000 or more | 628 (66.0%) | 79 (6.1%) |
| Total | 951 (100.0%) | 1,287 (100.0%) |
Property Value to Household Income Ratio in East Hills
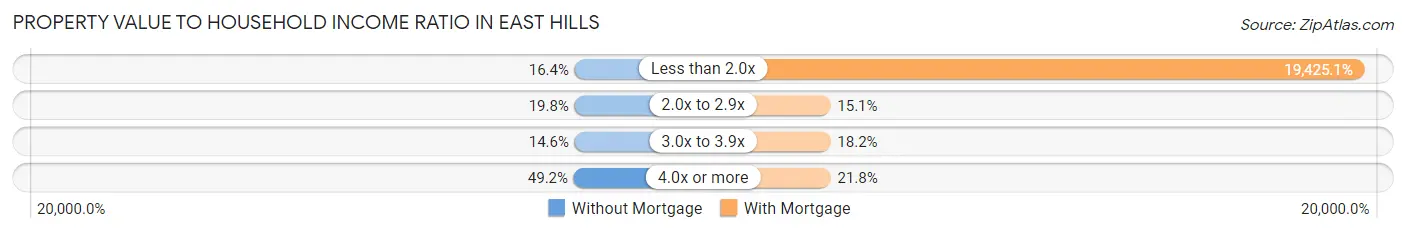
| Value-to-Income Ratio | Without Mortgage | With Mortgage |
| Less than 2.0x | 156 (16.4%) | 250,001 (19,425.1%) |
| 2.0x to 2.9x | 188 (19.8%) | 194 (15.1%) |
| 3.0x to 3.9x | 139 (14.6%) | 234 (18.2%) |
| 4.0x or more | 468 (49.2%) | 280 (21.8%) |
| Total | 951 (100.0%) | 1,287 (100.0%) |
Real Estate Taxes by Mortgage Status in East Hills
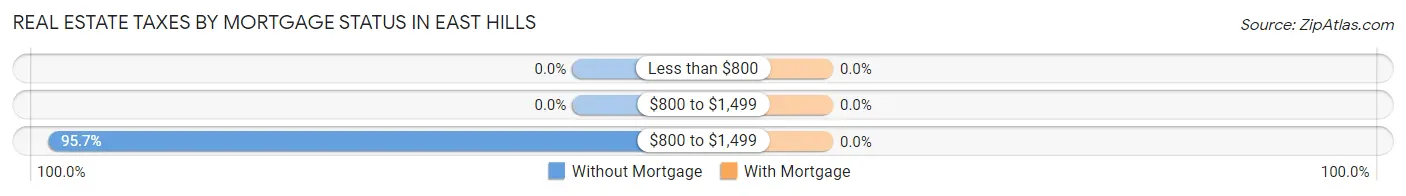
| Property Taxes | Without Mortgage | With Mortgage |
| Less than $800 | 0 (0.0%) | 0 (0.0%) |
| $800 to $1,499 | 0 (0.0%) | 0 (0.0%) |
| $800 to $1,499 | 910 (95.7%) | 0 (0.0%) |
| Total | 951 (100.0%) | 1,287 (100.0%) |
Health & Disability in East Hills
Health Insurance Coverage by Age in East Hills
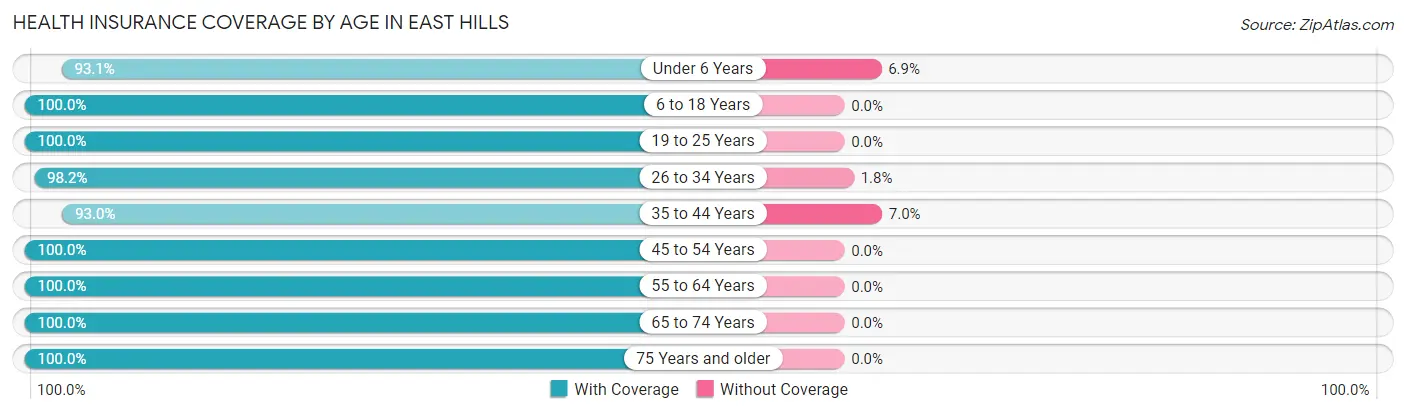
| Age Bracket | With Coverage | Without Coverage |
| Under 6 Years | 487 (93.1%) | 36 (6.9%) |
| 6 to 18 Years | 1,424 (100.0%) | 0 (0.0%) |
| 19 to 25 Years | 536 (100.0%) | 0 (0.0%) |
| 26 to 34 Years | 447 (98.2%) | 8 (1.8%) |
| 35 to 44 Years | 996 (93.0%) | 75 (7.0%) |
| 45 to 54 Years | 845 (100.0%) | 0 (0.0%) |
| 55 to 64 Years | 1,075 (100.0%) | 0 (0.0%) |
| 65 to 74 Years | 1,015 (100.0%) | 0 (0.0%) |
| 75 Years and older | 298 (100.0%) | 0 (0.0%) |
| Total | 7,123 (98.4%) | 119 (1.6%) |
Health Insurance Coverage by Citizenship Status in East Hills
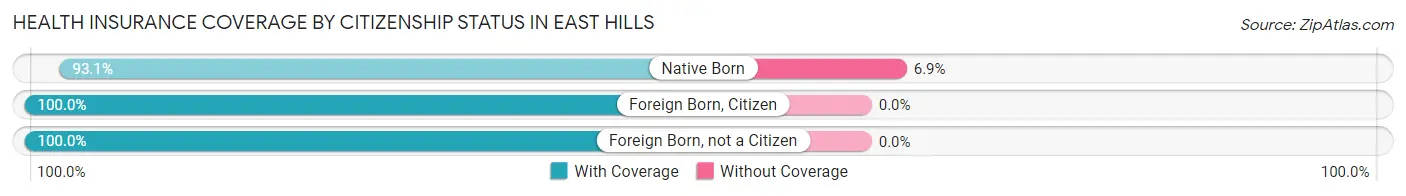
| Citizenship Status | With Coverage | Without Coverage |
| Native Born | 487 (93.1%) | 36 (6.9%) |
| Foreign Born, Citizen | 1,424 (100.0%) | 0 (0.0%) |
| Foreign Born, not a Citizen | 536 (100.0%) | 0 (0.0%) |
Health Insurance Coverage by Household Income in East Hills
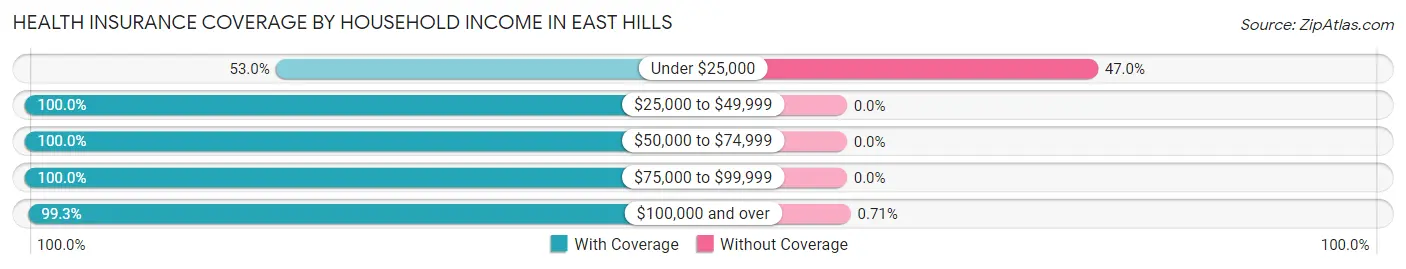
| Household Income | With Coverage | Without Coverage |
| Under $25,000 | 80 (53.0%) | 71 (47.0%) |
| $25,000 to $49,999 | 107 (100.0%) | 0 (0.0%) |
| $50,000 to $74,999 | 96 (100.0%) | 0 (0.0%) |
| $75,000 to $99,999 | 134 (100.0%) | 0 (0.0%) |
| $100,000 and over | 6,696 (99.3%) | 48 (0.7%) |
Public vs Private Health Insurance Coverage by Age in East Hills
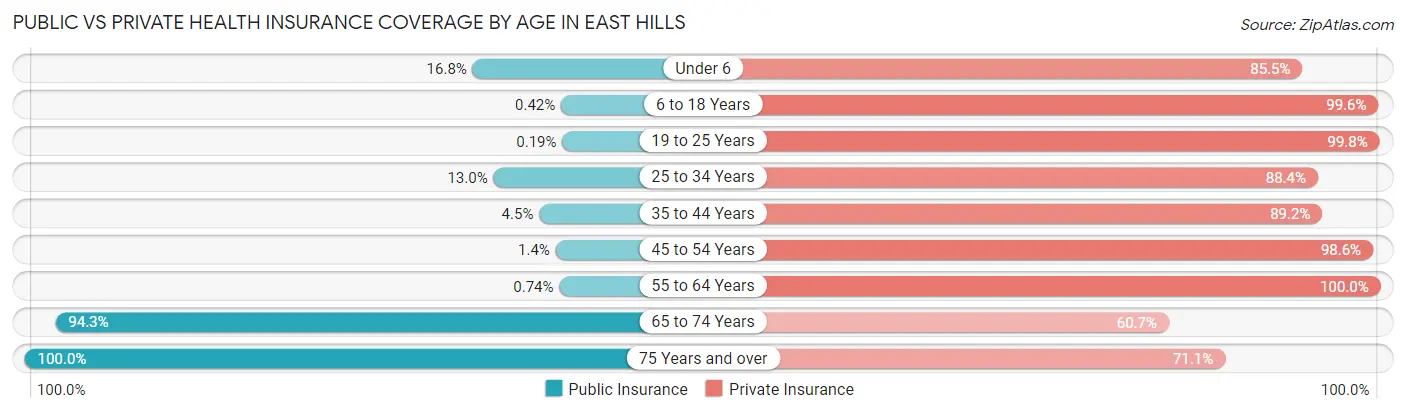
| Age Bracket | Public Insurance | Private Insurance |
| Under 6 | 88 (16.8%) | 447 (85.5%) |
| 6 to 18 Years | 6 (0.4%) | 1,418 (99.6%) |
| 19 to 25 Years | 1 (0.2%) | 535 (99.8%) |
| 25 to 34 Years | 59 (13.0%) | 402 (88.3%) |
| 35 to 44 Years | 48 (4.5%) | 955 (89.2%) |
| 45 to 54 Years | 12 (1.4%) | 833 (98.6%) |
| 55 to 64 Years | 8 (0.7%) | 1,075 (100.0%) |
| 65 to 74 Years | 957 (94.3%) | 616 (60.7%) |
| 75 Years and over | 298 (100.0%) | 212 (71.1%) |
| Total | 1,477 (20.4%) | 6,493 (89.7%) |
Disability Status by Sex by Age in East Hills
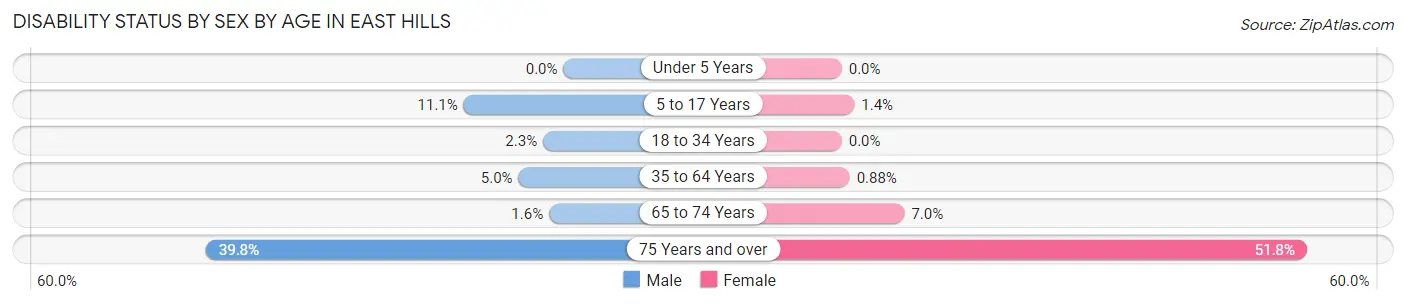
| Age Bracket | Male | Female |
| Under 5 Years | 0 (0.0%) | 0 (0.0%) |
| 5 to 17 Years | 74 (11.1%) | 12 (1.4%) |
| 18 to 34 Years | 12 (2.3%) | 0 (0.0%) |
| 35 to 64 Years | 76 (5.0%) | 13 (0.9%) |
| 65 to 74 Years | 8 (1.6%) | 36 (7.0%) |
| 75 Years and over | 41 (39.8%) | 101 (51.8%) |
Disability Class by Sex by Age in East Hills
Disability Class: Hearing Difficulty
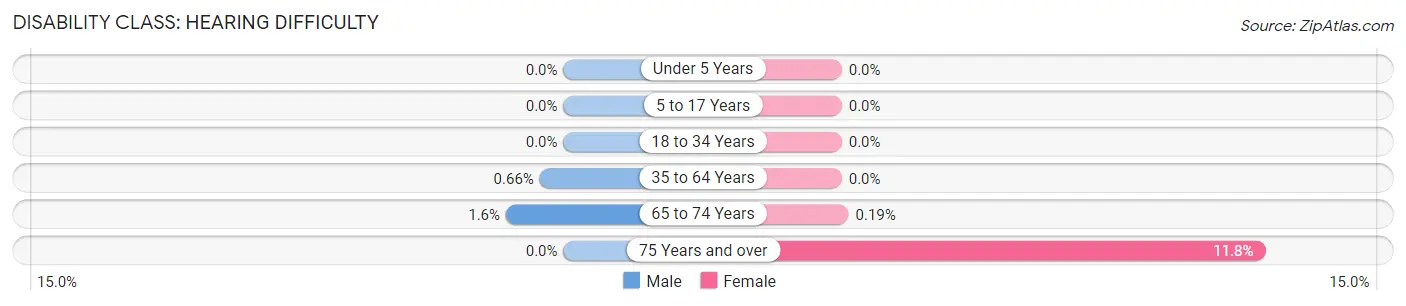
| Age Bracket | Male | Female |
| Under 5 Years | 0 (0.0%) | 0 (0.0%) |
| 5 to 17 Years | 0 (0.0%) | 0 (0.0%) |
| 18 to 34 Years | 0 (0.0%) | 0 (0.0%) |
| 35 to 64 Years | 10 (0.7%) | 0 (0.0%) |
| 65 to 74 Years | 8 (1.6%) | 1 (0.2%) |
| 75 Years and over | 0 (0.0%) | 23 (11.8%) |
Disability Class: Vision Difficulty
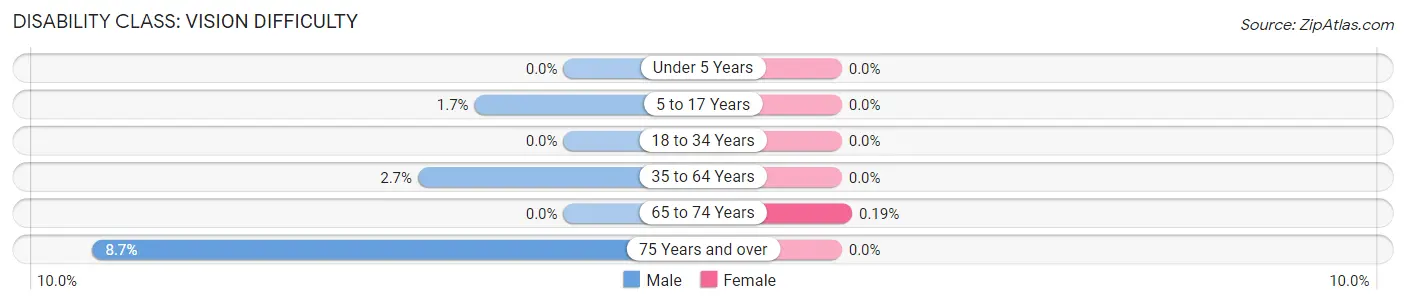
| Age Bracket | Male | Female |
| Under 5 Years | 0 (0.0%) | 0 (0.0%) |
| 5 to 17 Years | 11 (1.7%) | 0 (0.0%) |
| 18 to 34 Years | 0 (0.0%) | 0 (0.0%) |
| 35 to 64 Years | 41 (2.7%) | 0 (0.0%) |
| 65 to 74 Years | 0 (0.0%) | 1 (0.2%) |
| 75 Years and over | 9 (8.7%) | 0 (0.0%) |
Disability Class: Cognitive Difficulty
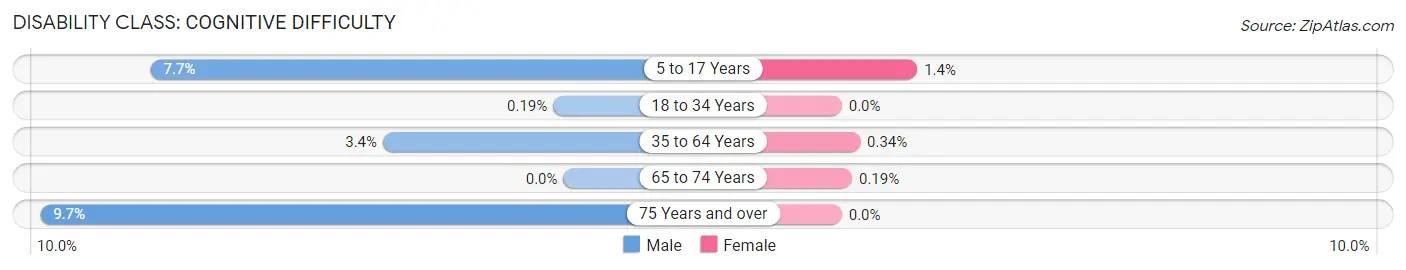
| Age Bracket | Male | Female |
| 5 to 17 Years | 51 (7.7%) | 12 (1.4%) |
| 18 to 34 Years | 1 (0.2%) | 0 (0.0%) |
| 35 to 64 Years | 51 (3.4%) | 5 (0.3%) |
| 65 to 74 Years | 0 (0.0%) | 1 (0.2%) |
| 75 Years and over | 10 (9.7%) | 0 (0.0%) |
Disability Class: Ambulatory Difficulty
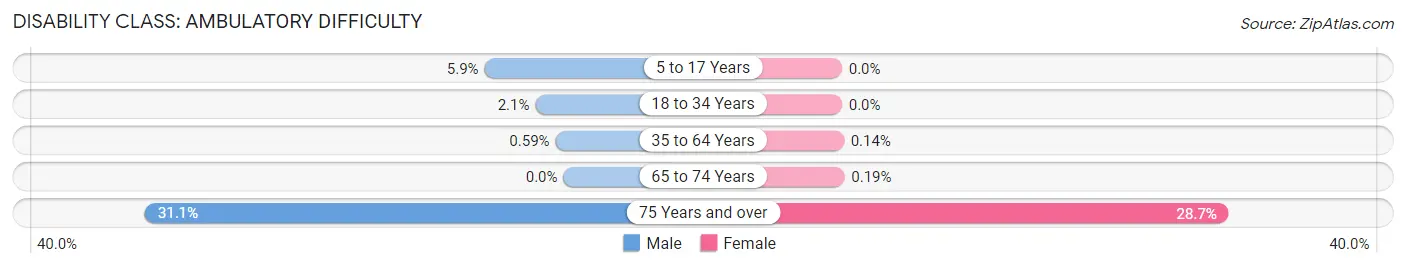
| Age Bracket | Male | Female |
| 5 to 17 Years | 39 (5.9%) | 0 (0.0%) |
| 18 to 34 Years | 11 (2.1%) | 0 (0.0%) |
| 35 to 64 Years | 9 (0.6%) | 2 (0.1%) |
| 65 to 74 Years | 0 (0.0%) | 1 (0.2%) |
| 75 Years and over | 32 (31.1%) | 56 (28.7%) |
Disability Class: Self-Care Difficulty
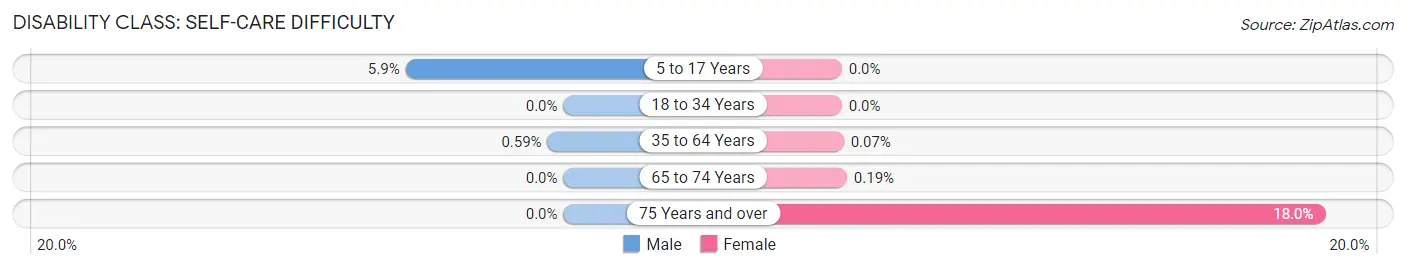
| Age Bracket | Male | Female |
| 5 to 17 Years | 39 (5.9%) | 0 (0.0%) |
| 18 to 34 Years | 0 (0.0%) | 0 (0.0%) |
| 35 to 64 Years | 9 (0.6%) | 1 (0.1%) |
| 65 to 74 Years | 0 (0.0%) | 1 (0.2%) |
| 75 Years and over | 0 (0.0%) | 35 (17.9%) |
Technology Access in East Hills
Computing Device Access in East Hills
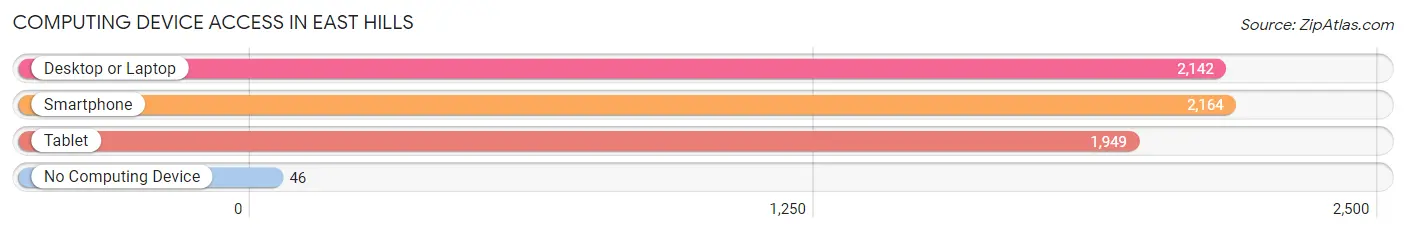
| Device Type | # Households | % Households |
| Desktop or Laptop | 2,142 | 95.7% |
| Smartphone | 2,164 | 96.7% |
| Tablet | 1,949 | 87.1% |
| No Computing Device | 46 | 2.1% |
| Total | 2,238 | 100.0% |
Internet Access in East Hills
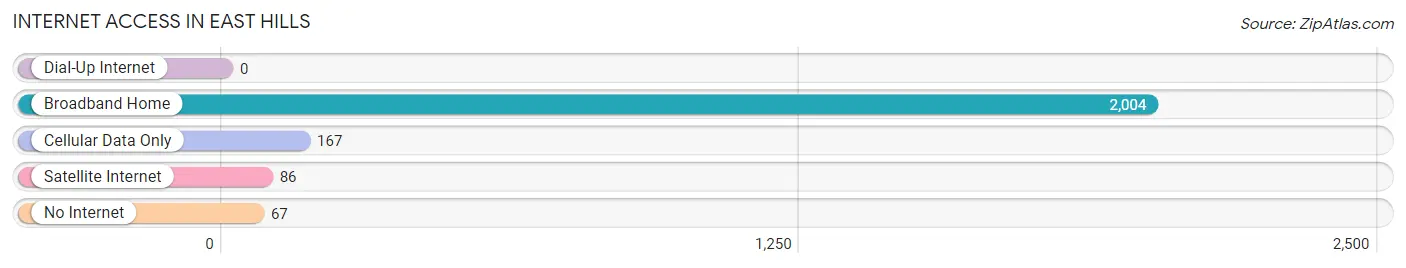
| Internet Type | # Households | % Households |
| Dial-Up Internet | 0 | 0.0% |
| Broadband Home | 2,004 | 89.5% |
| Cellular Data Only | 167 | 7.5% |
| Satellite Internet | 86 | 3.8% |
| No Internet | 67 | 3.0% |
| Total | 2,238 | 100.0% |
East Hills Summary
History
East Hills is a village located in Nassau County, New York. It is part of the Town of North Hempstead and is located on the North Shore of Long Island. The village was incorporated in 1931 and is home to approximately 3,400 residents.
The area that is now East Hills was originally inhabited by the Matinecock Native American tribe. The first European settlers arrived in the area in the late 1600s and the area was known as East Woods. The area was primarily used for farming and the first schoolhouse was built in 1790.
In the late 1800s, the area began to develop as a residential community. The village was officially incorporated in 1931 and was named after the East Hills Country Club, which was founded in the area in 1924.
Geography
East Hills is located in Nassau County, New York. It is part of the Town of North Hempstead and is located on the North Shore of Long Island. The village is bordered by Roslyn to the west, Old Westbury to the north, Jericho to the east, and Albertson to the south.
The village covers an area of 1.3 square miles and is home to approximately 3,400 residents. The village is primarily residential, with some commercial and industrial areas.
Economy
East Hills is primarily a residential community, with some commercial and industrial areas. The village is home to several businesses, including a shopping center, a golf course, and a variety of restaurants and shops.
The village is also home to several corporate headquarters, including the corporate headquarters of the North Shore-LIJ Health System, the corporate headquarters of the North Shore-LIJ Medical Group, and the corporate headquarters of the North Shore-LIJ Health System Foundation.
Demographics
As of the 2010 census, East Hills had a population of 3,400. The racial makeup of the village was 87.3% White, 5.2% African American, 0.2% Native American, 4.2% Asian, 0.1% Pacific Islander, and 2.2% from other races. Hispanic or Latino of any race were 5.7% of the population.
The median household income in East Hills was $150,000, and the median family income was $170,000. The per capita income for the village was $60,000. About 3.2% of families and 4.2% of the population were below the poverty line, including 4.7% of those under age 18 and 4.2% of those age 65 or over.
Common Questions
What is Per Capita Income in East Hills?
Per Capita income in East Hills is $124,194.
What is the Median Family Income in East Hills?
Median Family Income in East Hills is $250,001.
What is the Median Household income in East Hills?
Median Household Income in East Hills is $250,001.
What is Income or Wage Gap in East Hills?
Income or Wage Gap in East Hills is 57.7%.
Women in East Hills earn 42.3 cents for every dollar earned by a man.
What is Inequality or Gini Index in East Hills?
Inequality or Gini Index in East Hills is 0.42.
What is the Total Population of East Hills?
Total Population of East Hills is 7,242.
What is the Total Male Population of East Hills?
Total Male Population of East Hills is 3,480.
What is the Total Female Population of East Hills?
Total Female Population of East Hills is 3,762.
What is the Ratio of Males per 100 Females in East Hills?
There are 92.50 Males per 100 Females in East Hills.
What is the Ratio of Females per 100 Males in East Hills?
There are 108.10 Females per 100 Males in East Hills.
What is the Median Population Age in East Hills?
Median Population Age in East Hills is 41.6 Years.
What is the Average Family Size in East Hills
Average Family Size in East Hills is 3.5 People.
What is the Average Household Size in East Hills
Average Household Size in East Hills is 3.2 People.
How Large is the Labor Force in East Hills?
There are 4,079 People in the Labor Forcein in East Hills.
What is the Percentage of People in the Labor Force in East Hills?
72.8% of People are in the Labor Force in East Hills.
What is the Unemployment Rate in East Hills?
Unemployment Rate in East Hills is 3.6%.