Larchmont, NY Map & Demographics
Larchmont Map
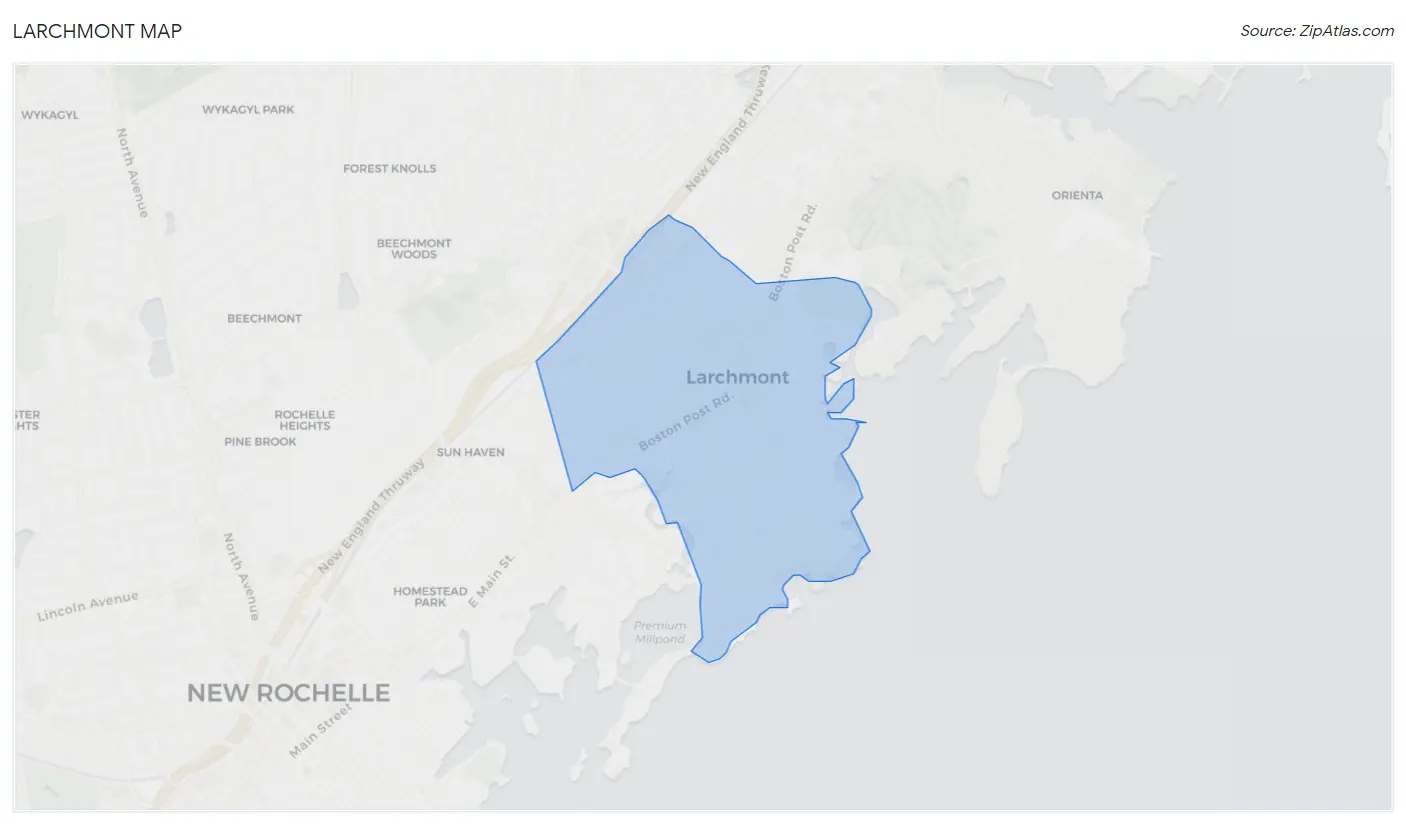
Larchmont Overview
$115,372
PER CAPITA INCOME
$250,001
AVG FAMILY INCOME
$220,714
AVG HOUSEHOLD INCOME
66.6%
WAGE / INCOME GAP [ % ]
33.4¢/ $1
WAGE / INCOME GAP [ $ ]
0.54
INEQUALITY / GINI INDEX
6,549
TOTAL POPULATION
3,289
MALE POPULATION
3,260
FEMALE POPULATION
100.89
MALES / 100 FEMALES
99.12
FEMALES / 100 MALES
37.7
MEDIAN AGE
3.6
AVG FAMILY SIZE
3.0
AVG HOUSEHOLD SIZE
3,220
LABOR FORCE [ PEOPLE ]
68.6%
PERCENT IN LABOR FORCE
10.3%
UNEMPLOYMENT RATE
Larchmont Zip Codes
Larchmont Area Codes
Income in Larchmont
Income Overview in Larchmont
Per Capita Income in Larchmont is $115,372, while median incomes of families and households are $250,001 and $220,714 respectively.
| Characteristic | Number | Measure |
| Per Capita Income | 6,549 | $115,372 |
| Median Family Income | 1,654 | $250,001 |
| Mean Family Income | 1,654 | $414,175 |
| Median Household Income | 2,208 | $220,714 |
| Mean Household Income | 2,208 | $340,698 |
| Income Deficit | 1,654 | $0 |
| Wage / Income Gap (%) | 6,549 | 66.56% |
| Wage / Income Gap ($) | 6,549 | 33.44¢ per $1 |
| Gini / Inequality Index | 6,549 | 0.54 |
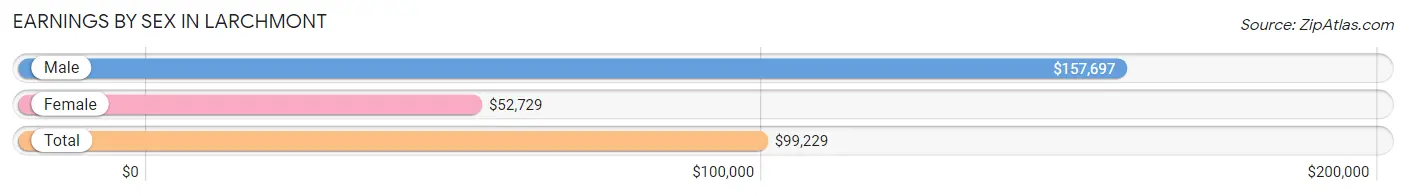
Earnings by Sex in Larchmont
Average Earnings in Larchmont are $99,229, $157,697 for men and $52,729 for women, a difference of 66.6%.
| Sex | Number | Average Earnings |
| Male | 1,768 (52.4%) | $157,697 |
| Female | 1,605 (47.6%) | $52,729 |
| Total | 3,373 (100.0%) | $99,229 |
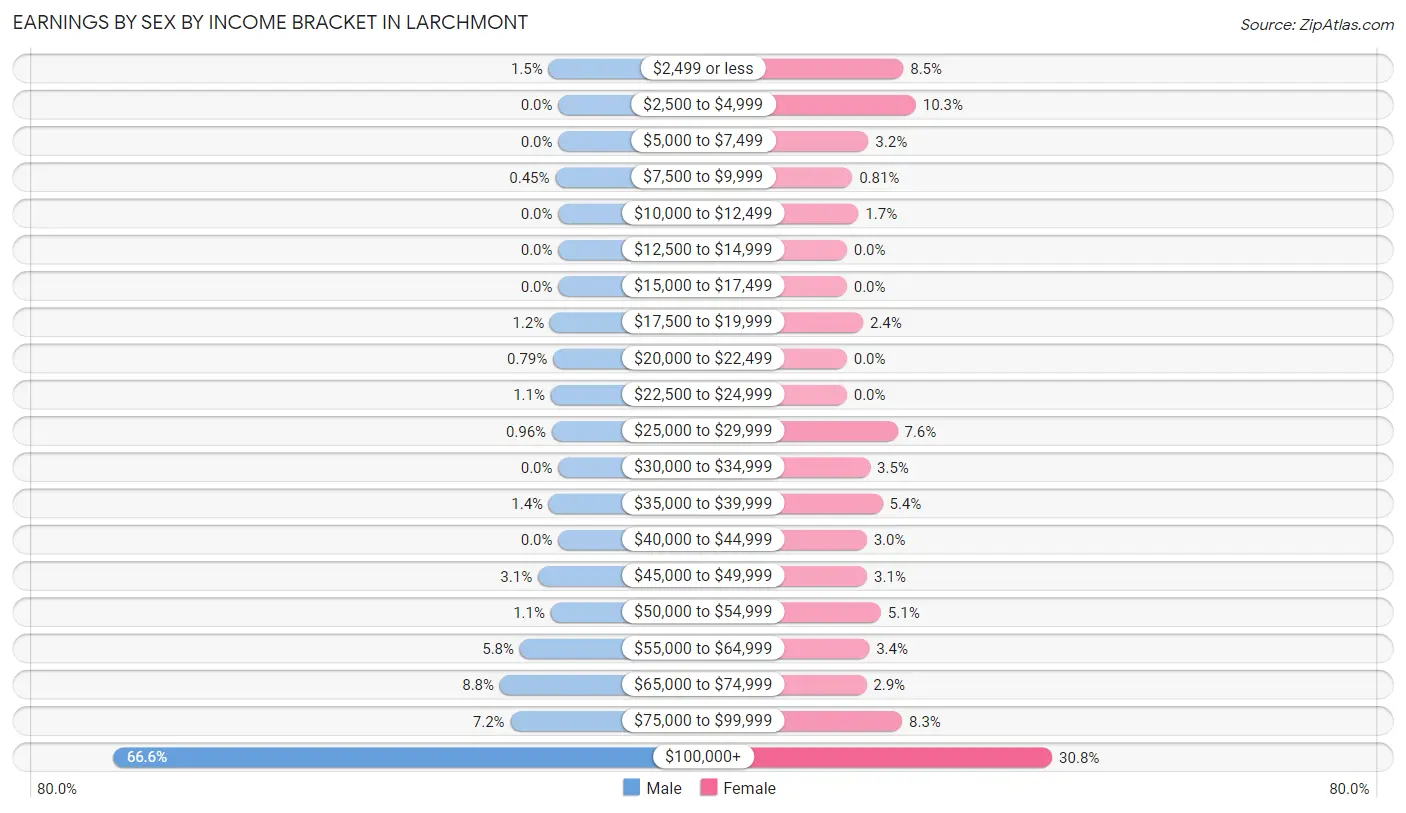
Earnings by Sex by Income Bracket in Larchmont
The most common earnings brackets in Larchmont are $100,000+ for men (1,178 | 66.6%) and $100,000+ for women (494 | 30.8%).
| Income | Male | Female |
| $2,499 or less | 26 (1.5%) | 136 (8.5%) |
| $2,500 to $4,999 | 0 (0.0%) | 166 (10.3%) |
| $5,000 to $7,499 | 0 (0.0%) | 52 (3.2%) |
| $7,500 to $9,999 | 8 (0.4%) | 13 (0.8%) |
| $10,000 to $12,499 | 0 (0.0%) | 28 (1.7%) |
| $12,500 to $14,999 | 0 (0.0%) | 0 (0.0%) |
| $15,000 to $17,499 | 0 (0.0%) | 0 (0.0%) |
| $17,500 to $19,999 | 22 (1.2%) | 39 (2.4%) |
| $20,000 to $22,499 | 14 (0.8%) | 0 (0.0%) |
| $22,500 to $24,999 | 20 (1.1%) | 0 (0.0%) |
| $25,000 to $29,999 | 17 (1.0%) | 122 (7.6%) |
| $30,000 to $34,999 | 0 (0.0%) | 56 (3.5%) |
| $35,000 to $39,999 | 25 (1.4%) | 86 (5.4%) |
| $40,000 to $44,999 | 0 (0.0%) | 48 (3.0%) |
| $45,000 to $49,999 | 54 (3.0%) | 49 (3.0%) |
| $50,000 to $54,999 | 20 (1.1%) | 82 (5.1%) |
| $55,000 to $64,999 | 102 (5.8%) | 54 (3.4%) |
| $65,000 to $74,999 | 155 (8.8%) | 47 (2.9%) |
| $75,000 to $99,999 | 127 (7.2%) | 133 (8.3%) |
| $100,000+ | 1,178 (66.6%) | 494 (30.8%) |
| Total | 1,768 (100.0%) | 1,605 (100.0%) |
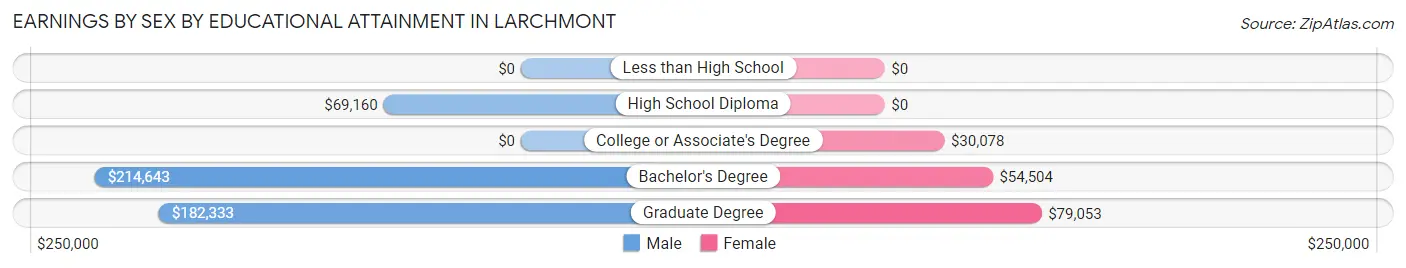
Earnings by Sex by Educational Attainment in Larchmont
Average earnings in Larchmont are $159,408 for men and $54,924 for women, a difference of 65.5%. Men with an educational attainment of bachelor's degree enjoy the highest average annual earnings of $214,643, while those with high school diploma education earn the least with $69,160. Women with an educational attainment of graduate degree earn the most with the average annual earnings of $79,053, while those with college or associate's degree education have the smallest earnings of $30,078.
| Educational Attainment | Male Income | Female Income |
| Less than High School | - | - |
| High School Diploma | $69,160 | $0 |
| College or Associate's Degree | - | - |
| Bachelor's Degree | $214,643 | $54,504 |
| Graduate Degree | $182,333 | $79,053 |
| Total | $159,408 | $54,924 |
Family Income in Larchmont
Family Income Brackets in Larchmont
According to the Larchmont family income data, there are 1,068 families falling into the $200,000+ income range, which is the most common income bracket and makes up 64.6% of all families.
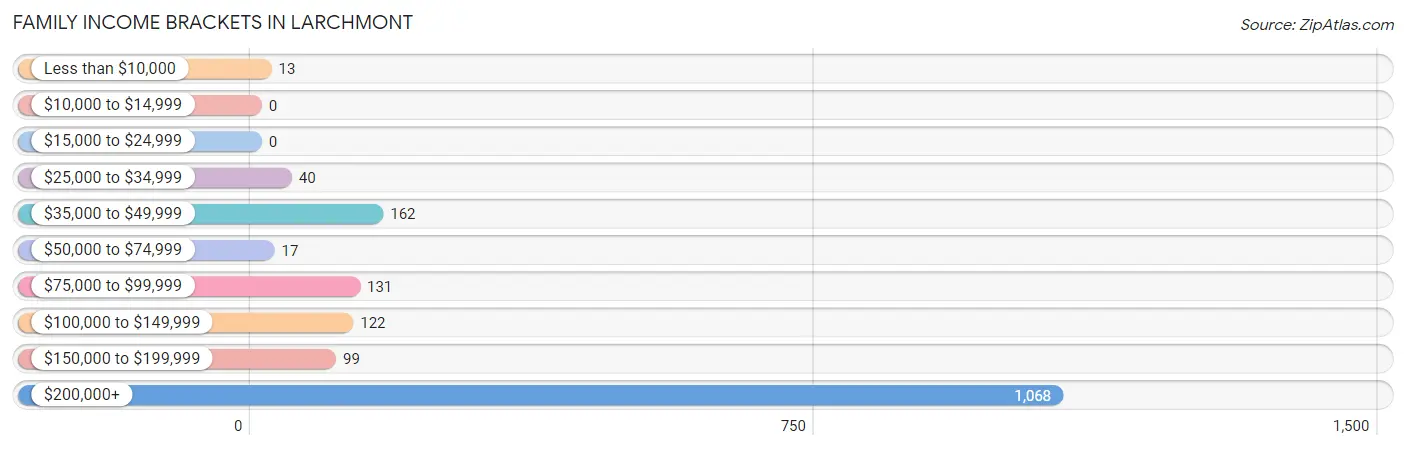
| Income Bracket | # Families | % Families |
| Less than $10,000 | 13 | 0.8% |
| $10,000 to $14,999 | 0 | 0.0% |
| $15,000 to $24,999 | 0 | 0.0% |
| $25,000 to $34,999 | 40 | 2.4% |
| $35,000 to $49,999 | 162 | 9.8% |
| $50,000 to $74,999 | 17 | 1.0% |
| $75,000 to $99,999 | 131 | 7.9% |
| $100,000 to $149,999 | 122 | 7.4% |
| $150,000 to $199,999 | 99 | 6.0% |
| $200,000+ | 1,068 | 64.6% |
Family Income by Famaliy Size in Larchmont
3-person families (385 | 23.3%) account for the highest median family income in Larchmont with $250,001 per family, while 2-person families (374 | 22.6%) have the highest median income of $97,188 per family member.
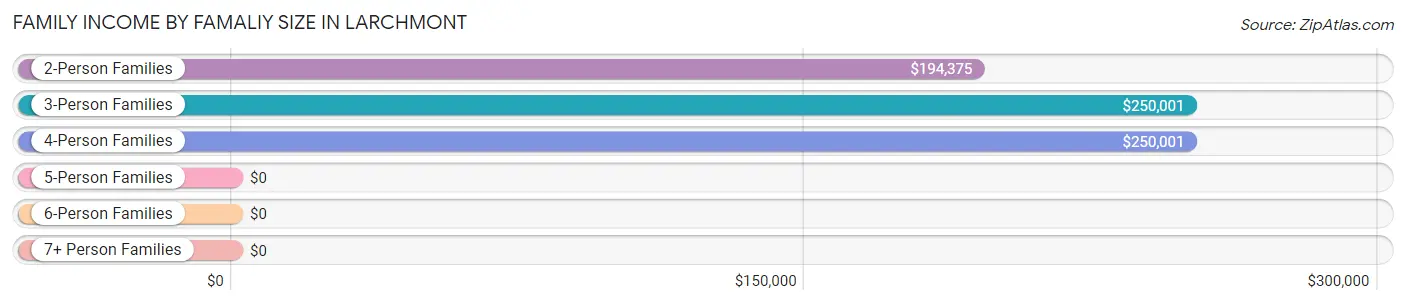
| Income Bracket | # Families | Median Income |
| 2-Person Families | 374 (22.6%) | $194,375 |
| 3-Person Families | 385 (23.3%) | $250,001 |
| 4-Person Families | 497 (30.0%) | $250,001 |
| 5-Person Families | 336 (20.3%) | $0 |
| 6-Person Families | 49 (3.0%) | $0 |
| 7+ Person Families | 13 (0.8%) | $0 |
| Total | 1,654 (100.0%) | $250,001 |
Family Income by Number of Earners in Larchmont
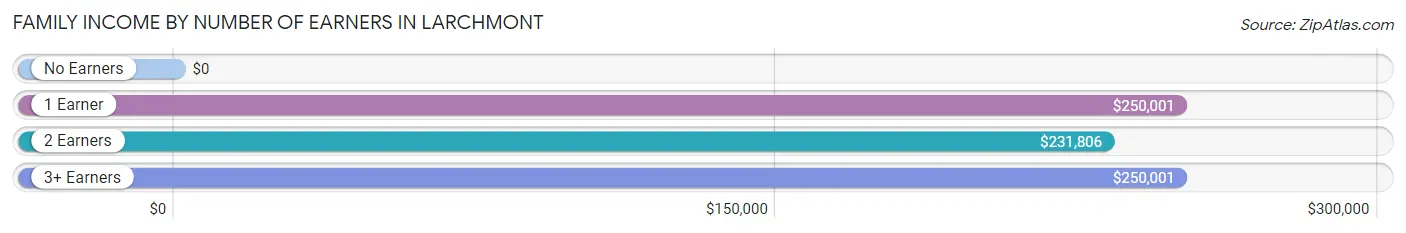
| Number of Earners | # Families | Median Income |
| No Earners | 27 (1.6%) | $0 |
| 1 Earner | 579 (35.0%) | $250,001 |
| 2 Earners | 864 (52.2%) | $231,806 |
| 3+ Earners | 184 (11.1%) | $250,001 |
| Total | 1,654 (100.0%) | $250,001 |
Household Income in Larchmont
Household Income Brackets in Larchmont
With 1,166 households falling in the category, the $200,000+ income range is the most frequent in Larchmont, accounting for 52.8% of all households.
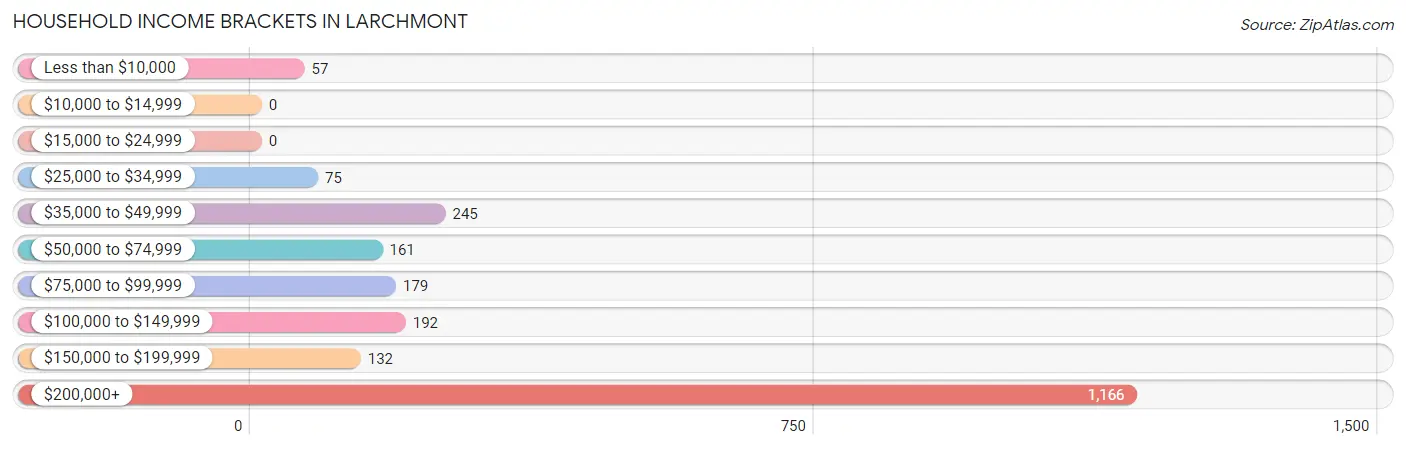
| Income Bracket | # Households | % Households |
| Less than $10,000 | 57 | 2.6% |
| $10,000 to $14,999 | 0 | 0.0% |
| $15,000 to $24,999 | 0 | 0.0% |
| $25,000 to $34,999 | 75 | 3.4% |
| $35,000 to $49,999 | 245 | 11.1% |
| $50,000 to $74,999 | 161 | 7.3% |
| $75,000 to $99,999 | 179 | 8.1% |
| $100,000 to $149,999 | 192 | 8.7% |
| $150,000 to $199,999 | 132 | 6.0% |
| $200,000+ | 1,166 | 52.8% |
Household Income by Householder Age in Larchmont
The median household income in Larchmont is $220,714, with the highest median household income of $250,001 found in the 45 to 64 years age bracket for the primary householder. A total of 934 households (42.3%) fall into this category.
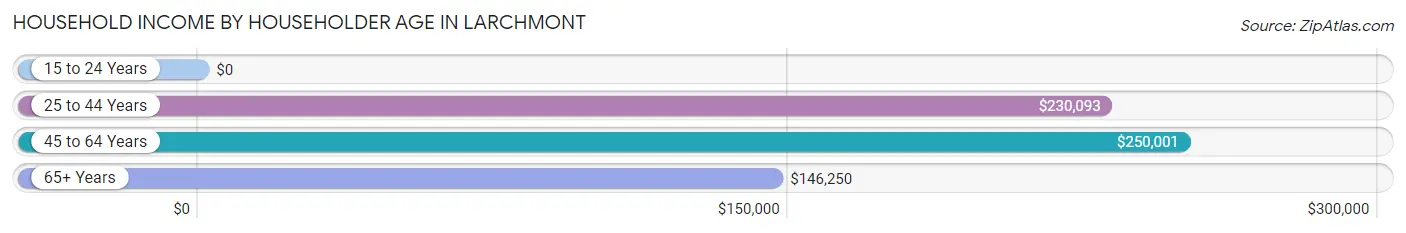
| Income Bracket | # Households | Median Income |
| 15 to 24 Years | 0 (0.0%) | $0 |
| 25 to 44 Years | 914 (41.4%) | $230,093 |
| 45 to 64 Years | 934 (42.3%) | $250,001 |
| 65+ Years | 360 (16.3%) | $146,250 |
| Total | 2,208 (100.0%) | $220,714 |
Poverty in Larchmont
Income Below Poverty by Sex and Age in Larchmont
With 1.8% poverty level for males and 1.8% for females among the residents of Larchmont, 12 to 14 year old males and 65 to 74 year old females are the most vulnerable to poverty, with 15 males (13.3%) and 15 females (23.8%) in their respective age groups living below the poverty level.
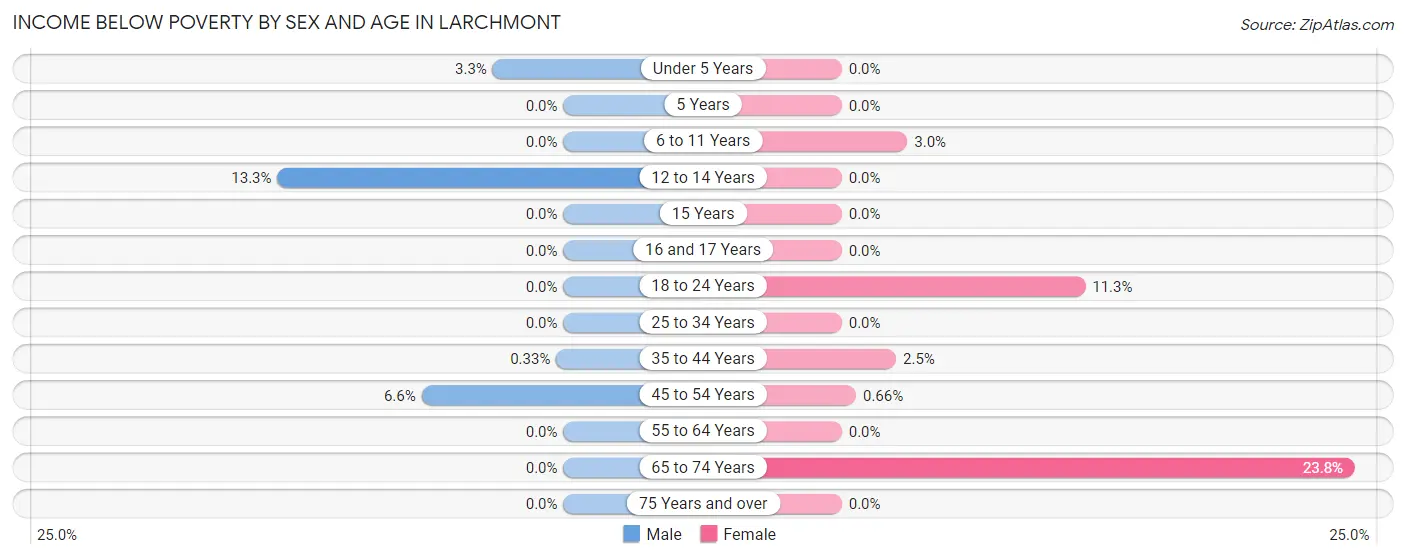
| Age Bracket | Male | Female |
| Under 5 Years | 12 (3.3%) | 0 (0.0%) |
| 5 Years | 0 (0.0%) | 0 (0.0%) |
| 6 to 11 Years | 0 (0.0%) | 14 (3.0%) |
| 12 to 14 Years | 15 (13.3%) | 0 (0.0%) |
| 15 Years | 0 (0.0%) | 0 (0.0%) |
| 16 and 17 Years | 0 (0.0%) | 0 (0.0%) |
| 18 to 24 Years | 0 (0.0%) | 13 (11.3%) |
| 25 to 34 Years | 0 (0.0%) | 0 (0.0%) |
| 35 to 44 Years | 2 (0.3%) | 13 (2.5%) |
| 45 to 54 Years | 30 (6.6%) | 3 (0.7%) |
| 55 to 64 Years | 0 (0.0%) | 0 (0.0%) |
| 65 to 74 Years | 0 (0.0%) | 15 (23.8%) |
| 75 Years and over | 0 (0.0%) | 0 (0.0%) |
| Total | 59 (1.8%) | 58 (1.8%) |
Income Above Poverty by Sex and Age in Larchmont
According to the poverty statistics in Larchmont, males aged 5 years and females aged under 5 years are the age groups that are most secure financially, with 100.0% of males and 100.0% of females in these age groups living above the poverty line.
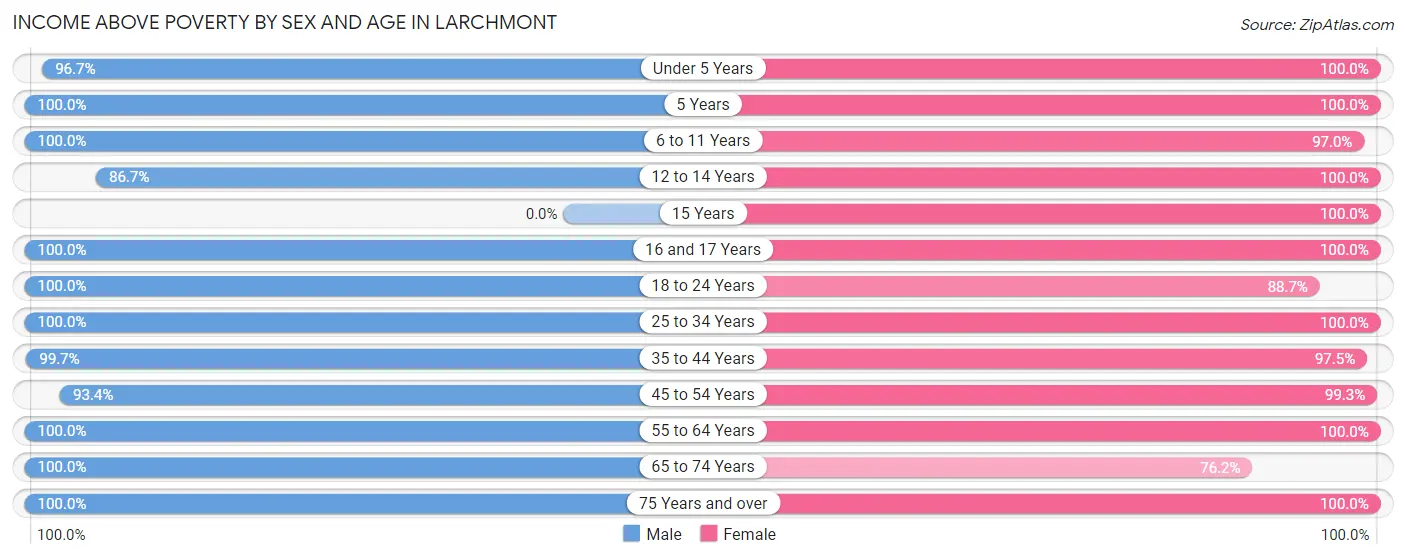
| Age Bracket | Male | Female |
| Under 5 Years | 354 (96.7%) | 140 (100.0%) |
| 5 Years | 31 (100.0%) | 112 (100.0%) |
| 6 to 11 Years | 484 (100.0%) | 446 (97.0%) |
| 12 to 14 Years | 98 (86.7%) | 121 (100.0%) |
| 15 Years | 0 (0.0%) | 28 (100.0%) |
| 16 and 17 Years | 147 (100.0%) | 70 (100.0%) |
| 18 to 24 Years | 72 (100.0%) | 102 (88.7%) |
| 25 to 34 Years | 400 (100.0%) | 474 (100.0%) |
| 35 to 44 Years | 609 (99.7%) | 502 (97.5%) |
| 45 to 54 Years | 426 (93.4%) | 451 (99.3%) |
| 55 to 64 Years | 301 (100.0%) | 546 (100.0%) |
| 65 to 74 Years | 156 (100.0%) | 48 (76.2%) |
| 75 Years and over | 152 (100.0%) | 162 (100.0%) |
| Total | 3,230 (98.2%) | 3,202 (98.2%) |
Income Below Poverty Among Married-Couple Families in Larchmont
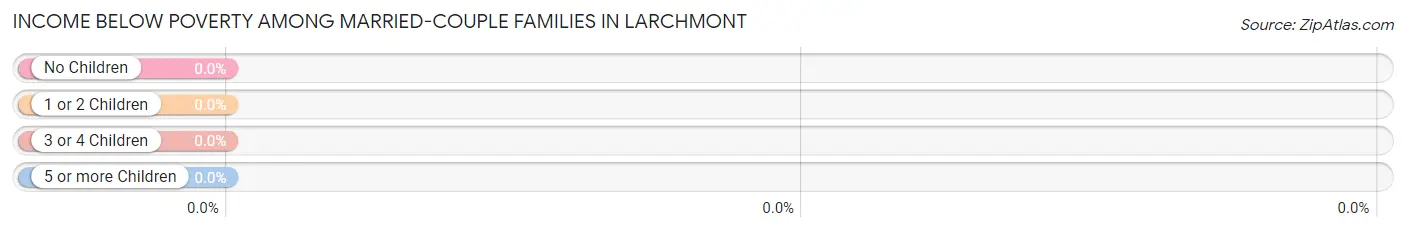
| Children | Above Poverty | Below Poverty |
| No Children | 601 (100.0%) | 0 (0.0%) |
| 1 or 2 Children | 678 (100.0%) | 0 (0.0%) |
| 3 or 4 Children | 223 (100.0%) | 0 (0.0%) |
| 5 or more Children | 0 (0.0%) | 0 (0.0%) |
| Total | 1,502 (100.0%) | 0 (0.0%) |
Income Below Poverty Among Single-Parent Households in Larchmont
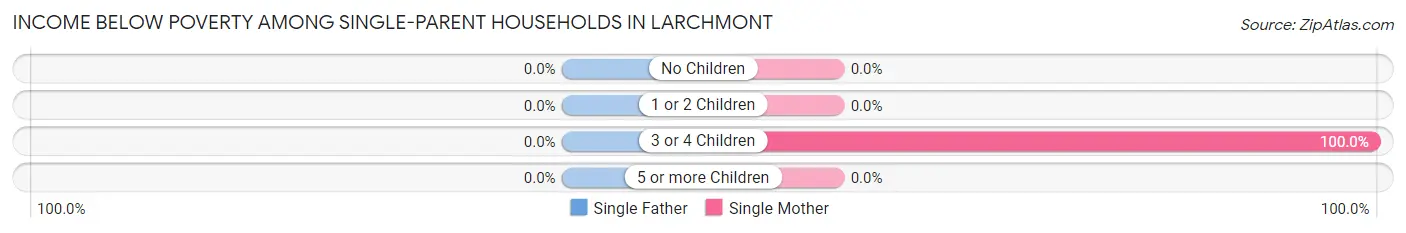
| Children | Single Father | Single Mother |
| No Children | 0 (0.0%) | 0 (0.0%) |
| 1 or 2 Children | 0 (0.0%) | 0 (0.0%) |
| 3 or 4 Children | 0 (0.0%) | 13 (100.0%) |
| 5 or more Children | 0 (0.0%) | 0 (0.0%) |
| Total | 0 (0.0%) | 13 (9.5%) |
Income Below Poverty Among Married-Couple vs Single-Parent Households in Larchmont
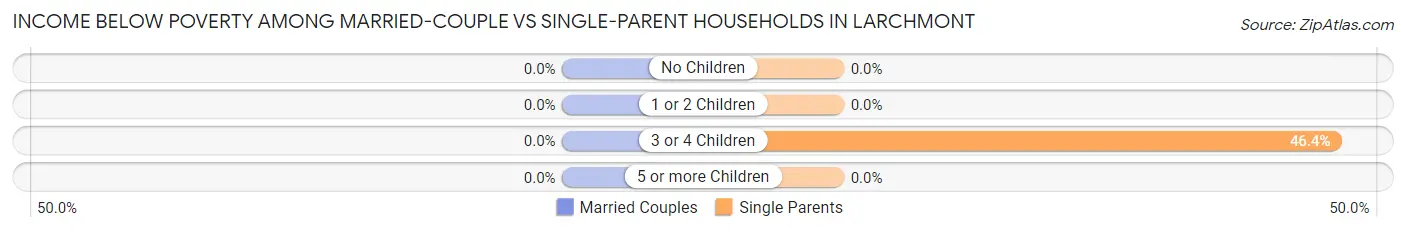
| Children | Married-Couple Families | Single-Parent Households |
| No Children | 0 (0.0%) | 0 (0.0%) |
| 1 or 2 Children | 0 (0.0%) | 0 (0.0%) |
| 3 or 4 Children | 0 (0.0%) | 13 (46.4%) |
| 5 or more Children | 0 (0.0%) | 0 (0.0%) |
| Total | 0 (0.0%) | 13 (8.6%) |
Race in Larchmont
The most populous races in Larchmont are White / Caucasian (5,709 | 87.2%), Hispanic or Latino (614 | 9.4%), and Two or more Races (402 | 6.1%).
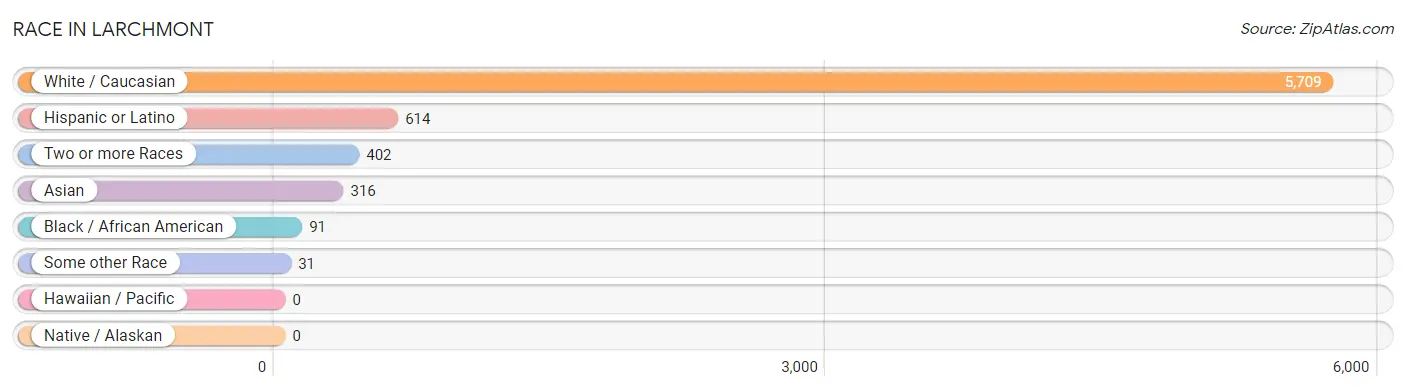
| Race | # Population | % Population |
| Asian | 316 | 4.8% |
| Black / African American | 91 | 1.4% |
| Hawaiian / Pacific | 0 | 0.0% |
| Hispanic or Latino | 614 | 9.4% |
| Native / Alaskan | 0 | 0.0% |
| White / Caucasian | 5,709 | 87.2% |
| Two or more Races | 402 | 6.1% |
| Some other Race | 31 | 0.5% |
| Total | 6,549 | 100.0% |
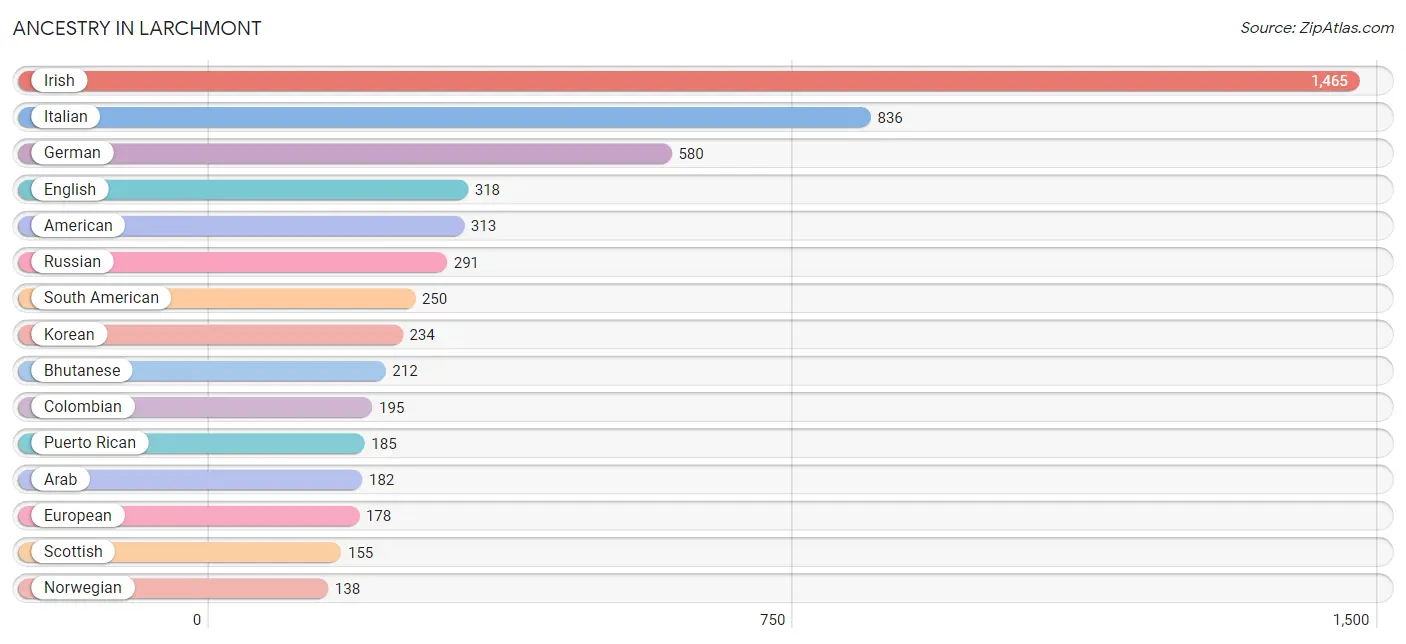
Ancestry in Larchmont
The most populous ancestries reported in Larchmont are Irish (1,465 | 22.4%), Italian (836 | 12.8%), German (580 | 8.9%), English (318 | 4.9%), and American (313 | 4.8%), together accounting for 53.6% of all Larchmont residents.
| Ancestry | # Population | % Population |
| American | 313 | 4.8% |
| Arab | 182 | 2.8% |
| Armenian | 40 | 0.6% |
| Austrian | 68 | 1.0% |
| Belgian | 51 | 0.8% |
| Bhutanese | 212 | 3.2% |
| British | 98 | 1.5% |
| Burmese | 48 | 0.7% |
| Canadian | 42 | 0.6% |
| Colombian | 195 | 3.0% |
| Cuban | 57 | 0.9% |
| Danish | 40 | 0.6% |
| Dominican | 83 | 1.3% |
| Eastern European | 113 | 1.7% |
| Ecuadorian | 34 | 0.5% |
| English | 318 | 4.9% |
| European | 178 | 2.7% |
| French | 129 | 2.0% |
| German | 580 | 8.9% |
| Greek | 111 | 1.7% |
| Hungarian | 67 | 1.0% |
| Indian (Asian) | 91 | 1.4% |
| Irish | 1,465 | 22.4% |
| Italian | 836 | 12.8% |
| Jamaican | 28 | 0.4% |
| Jordanian | 134 | 2.1% |
| Korean | 234 | 3.6% |
| Lebanese | 48 | 0.7% |
| Lithuanian | 55 | 0.8% |
| Mexican | 39 | 0.6% |
| Norwegian | 138 | 2.1% |
| Pennsylvania German | 18 | 0.3% |
| Peruvian | 21 | 0.3% |
| Polish | 87 | 1.3% |
| Puerto Rican | 185 | 2.8% |
| Romanian | 116 | 1.8% |
| Russian | 291 | 4.4% |
| Scotch-Irish | 14 | 0.2% |
| Scottish | 155 | 2.4% |
| Serbian | 8 | 0.1% |
| South African | 29 | 0.4% |
| South American | 250 | 3.8% |
| Subsaharan African | 44 | 0.7% |
| Swedish | 20 | 0.3% |
| Swiss | 28 | 0.4% |
| Thai | 13 | 0.2% |
| Welsh | 21 | 0.3% | View All 47 Rows |
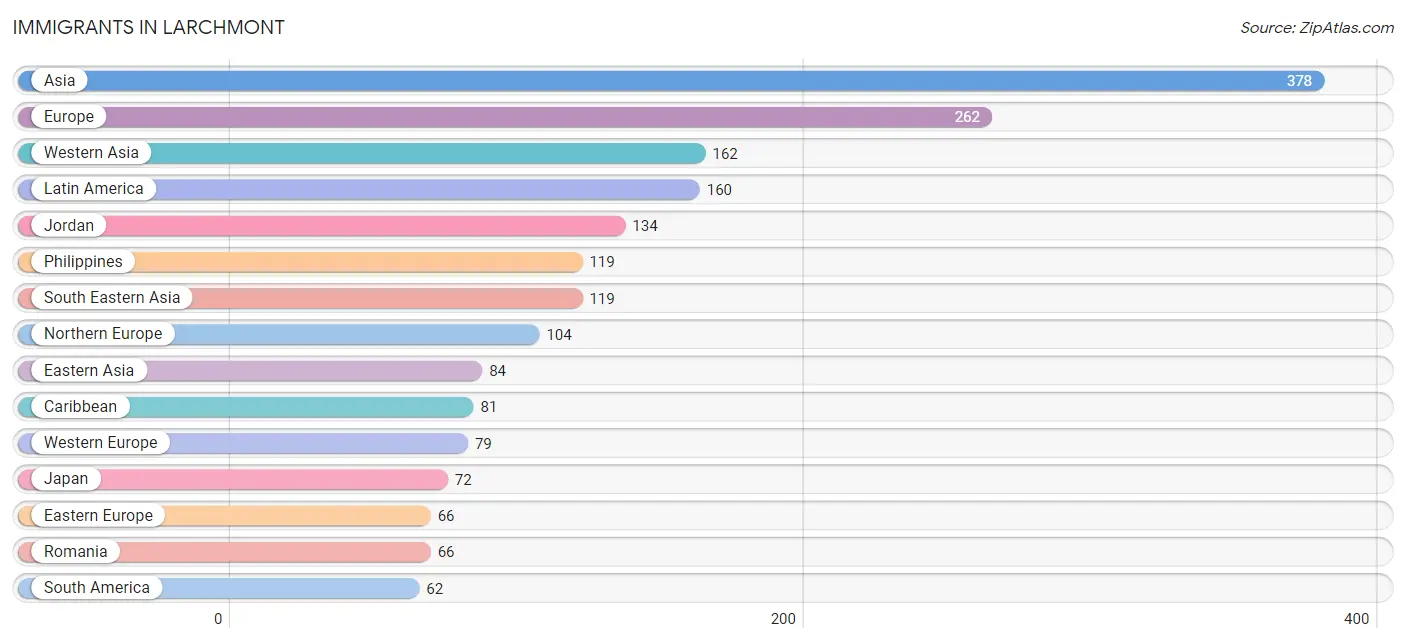
Immigrants in Larchmont
The most numerous immigrant groups reported in Larchmont came from Asia (378 | 5.8%), Europe (262 | 4.0%), Western Asia (162 | 2.5%), Latin America (160 | 2.4%), and Jordan (134 | 2.1%), together accounting for 16.7% of all Larchmont residents.
| Immigration Origin | # Population | % Population |
| Africa | 52 | 0.8% |
| Asia | 378 | 5.8% |
| Australia | 37 | 0.6% |
| Belgium | 26 | 0.4% |
| Canada | 14 | 0.2% |
| Caribbean | 81 | 1.2% |
| Central America | 17 | 0.3% |
| Colombia | 41 | 0.6% |
| Cuba | 11 | 0.2% |
| Dominican Republic | 27 | 0.4% |
| Eastern Asia | 84 | 1.3% |
| Eastern Europe | 66 | 1.0% |
| Europe | 262 | 4.0% |
| Germany | 53 | 0.8% |
| Haiti | 15 | 0.2% |
| India | 13 | 0.2% |
| Ireland | 12 | 0.2% |
| Israel | 15 | 0.2% |
| Italy | 13 | 0.2% |
| Jamaica | 28 | 0.4% |
| Japan | 72 | 1.1% |
| Jordan | 134 | 2.1% |
| Korea | 12 | 0.2% |
| Latin America | 160 | 2.4% |
| Lebanon | 13 | 0.2% |
| Mexico | 17 | 0.3% |
| Northern Europe | 104 | 1.6% |
| Oceania | 37 | 0.6% |
| Peru | 21 | 0.3% |
| Philippines | 119 | 1.8% |
| Romania | 66 | 1.0% |
| South Africa | 33 | 0.5% |
| South America | 62 | 0.9% |
| South Central Asia | 13 | 0.2% |
| South Eastern Asia | 119 | 1.8% |
| Southern Europe | 13 | 0.2% |
| Western Asia | 162 | 2.5% |
| Western Europe | 79 | 1.2% | View All 38 Rows |
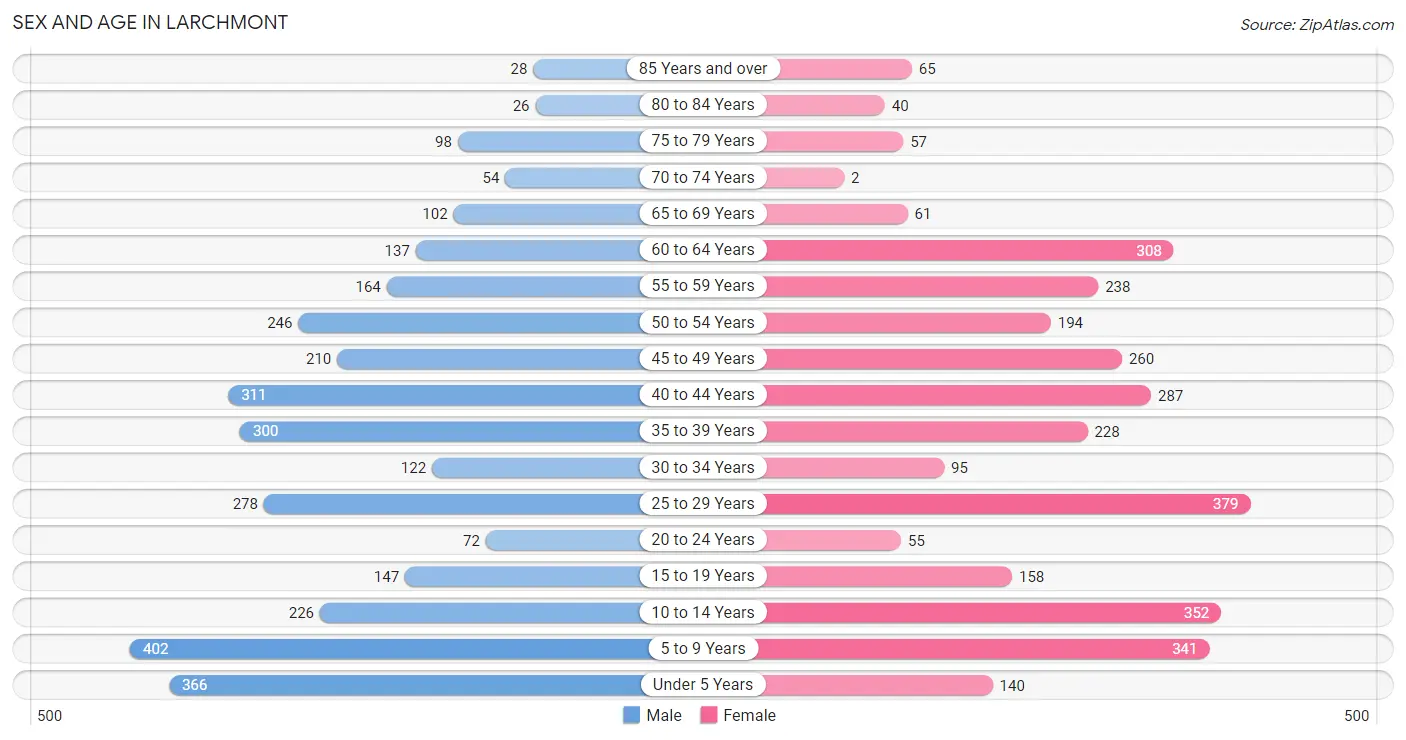
Sex and Age in Larchmont
Sex and Age in Larchmont
The most populous age groups in Larchmont are 5 to 9 Years (402 | 12.2%) for men and 25 to 29 Years (379 | 11.6%) for women.
| Age Bracket | Male | Female |
| Under 5 Years | 366 (11.1%) | 140 (4.3%) |
| 5 to 9 Years | 402 (12.2%) | 341 (10.5%) |
| 10 to 14 Years | 226 (6.9%) | 352 (10.8%) |
| 15 to 19 Years | 147 (4.5%) | 158 (4.9%) |
| 20 to 24 Years | 72 (2.2%) | 55 (1.7%) |
| 25 to 29 Years | 278 (8.5%) | 379 (11.6%) |
| 30 to 34 Years | 122 (3.7%) | 95 (2.9%) |
| 35 to 39 Years | 300 (9.1%) | 228 (7.0%) |
| 40 to 44 Years | 311 (9.5%) | 287 (8.8%) |
| 45 to 49 Years | 210 (6.4%) | 260 (8.0%) |
| 50 to 54 Years | 246 (7.5%) | 194 (5.9%) |
| 55 to 59 Years | 164 (5.0%) | 238 (7.3%) |
| 60 to 64 Years | 137 (4.2%) | 308 (9.5%) |
| 65 to 69 Years | 102 (3.1%) | 61 (1.9%) |
| 70 to 74 Years | 54 (1.6%) | 2 (0.1%) |
| 75 to 79 Years | 98 (3.0%) | 57 (1.8%) |
| 80 to 84 Years | 26 (0.8%) | 40 (1.2%) |
| 85 Years and over | 28 (0.9%) | 65 (2.0%) |
| Total | 3,289 (100.0%) | 3,260 (100.0%) |
Families and Households in Larchmont
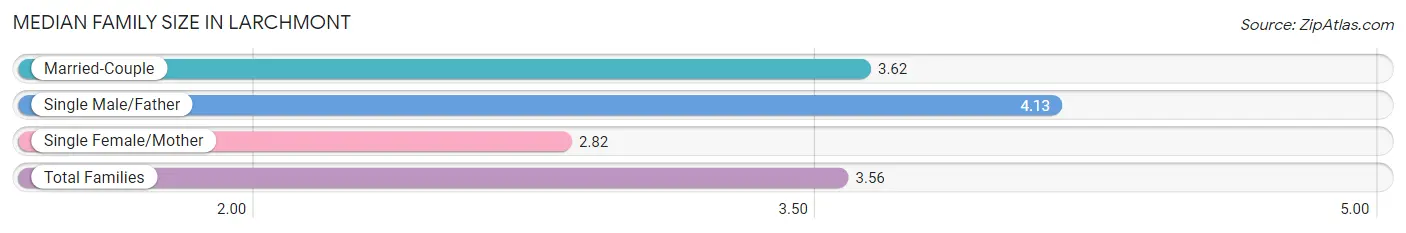
Median Family Size in Larchmont
The median family size in Larchmont is 3.56 persons per family, with single male/father families (15 | 0.9%) accounting for the largest median family size of 4.13 persons per family. On the other hand, single female/mother families (137 | 8.3%) represent the smallest median family size with 2.82 persons per family.
| Family Type | # Families | Family Size |
| Married-Couple | 1,502 (90.8%) | 3.62 |
| Single Male/Father | 15 (0.9%) | 4.13 |
| Single Female/Mother | 137 (8.3%) | 2.82 |
| Total Families | 1,654 (100.0%) | 3.56 |
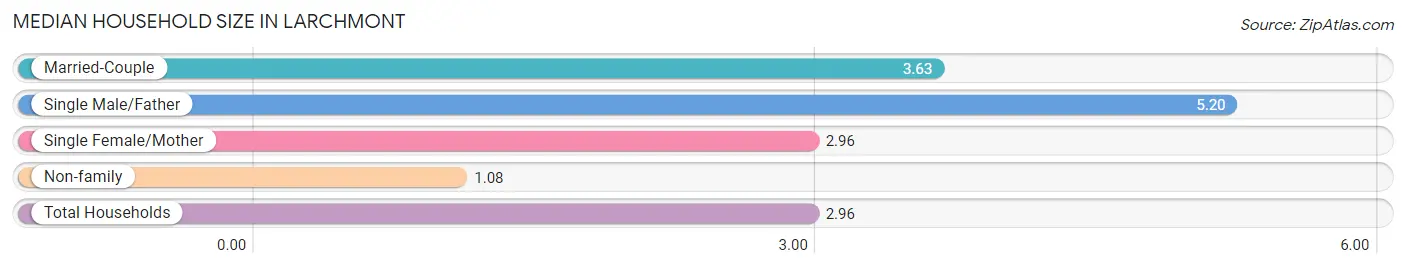
Median Household Size in Larchmont
The median household size in Larchmont is 2.96 persons per household, with single male/father households (15 | 0.7%) accounting for the largest median household size of 5.2 persons per household. non-family households (554 | 25.1%) represent the smallest median household size with 1.08 persons per household.
| Household Type | # Households | Household Size |
| Married-Couple | 1,502 (68.0%) | 3.63 |
| Single Male/Father | 15 (0.7%) | 5.20 |
| Single Female/Mother | 137 (6.2%) | 2.96 |
| Non-family | 554 (25.1%) | 1.08 |
| Total Households | 2,208 (100.0%) | 2.96 |
Household Size by Marriage Status in Larchmont
Out of a total of 2,208 households in Larchmont, 1,654 (74.9%) are family households, while 554 (25.1%) are nonfamily households. The most numerous type of family households are 4-person households, comprising 483, and the most common type of nonfamily households are 1-person households, comprising 514.
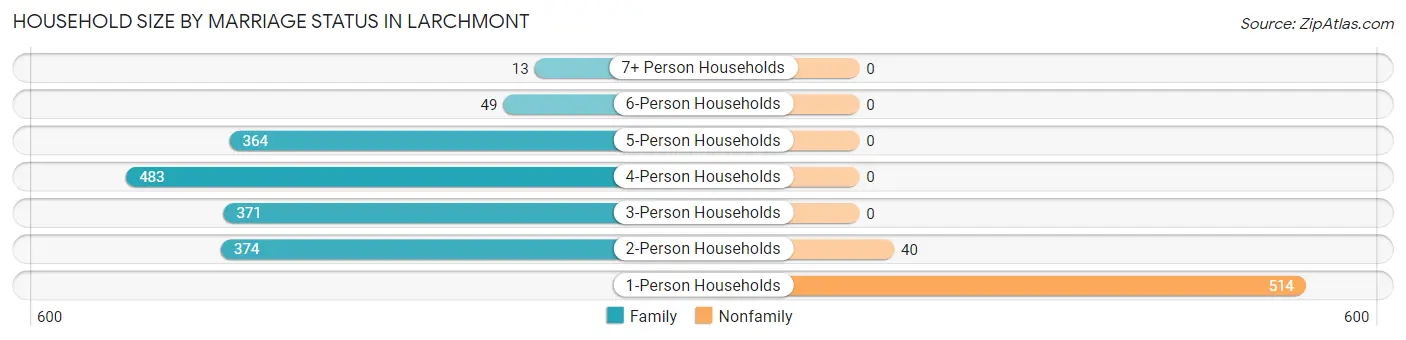
| Household Size | Family Households | Nonfamily Households |
| 1-Person Households | - | 514 (23.3%) |
| 2-Person Households | 374 (16.9%) | 40 (1.8%) |
| 3-Person Households | 371 (16.8%) | 0 (0.0%) |
| 4-Person Households | 483 (21.9%) | 0 (0.0%) |
| 5-Person Households | 364 (16.5%) | 0 (0.0%) |
| 6-Person Households | 49 (2.2%) | 0 (0.0%) |
| 7+ Person Households | 13 (0.6%) | 0 (0.0%) |
| Total | 1,654 (74.9%) | 554 (25.1%) |
Female Fertility in Larchmont
Fertility by Age in Larchmont
Average fertility rate in Larchmont is 60.0 births per 1,000 women. Women in the age bracket of 35 to 50 years have the highest fertility rate with 70.0 births per 1,000 women. Women in the age bracket of 35 to 50 years acount for 61.8% of all women with births.
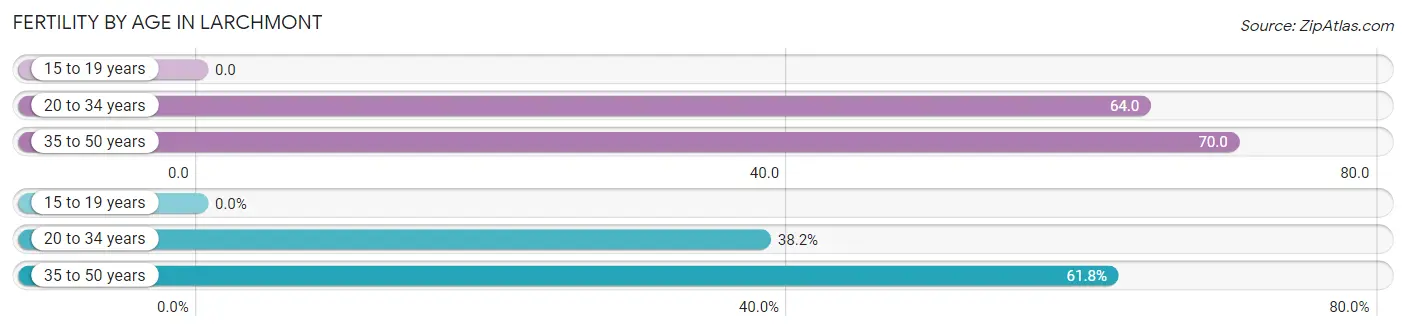
| Age Bracket | Women with Births | Births / 1,000 Women |
| 15 to 19 years | 0 (0.0%) | 0.0 |
| 20 to 34 years | 34 (38.2%) | 64.0 |
| 35 to 50 years | 55 (61.8%) | 70.0 |
| Total | 89 (100.0%) | 60.0 |
Fertility by Age by Marriage Status in Larchmont
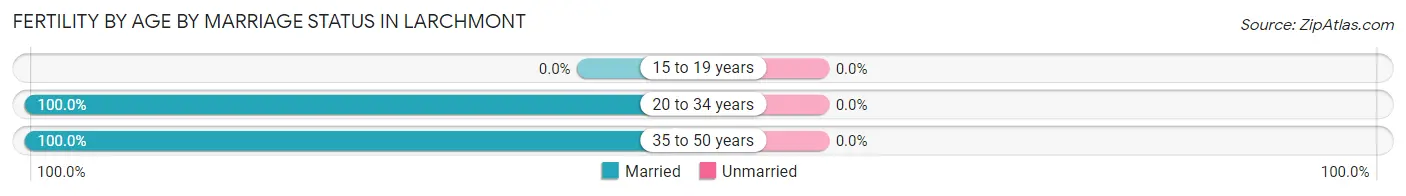
| Age Bracket | Married | Unmarried |
| 15 to 19 years | 0 (0.0%) | 0 (0.0%) |
| 20 to 34 years | 34 (100.0%) | 0 (0.0%) |
| 35 to 50 years | 55 (100.0%) | 0 (0.0%) |
| Total | 89 (100.0%) | 0 (0.0%) |
Fertility by Education in Larchmont
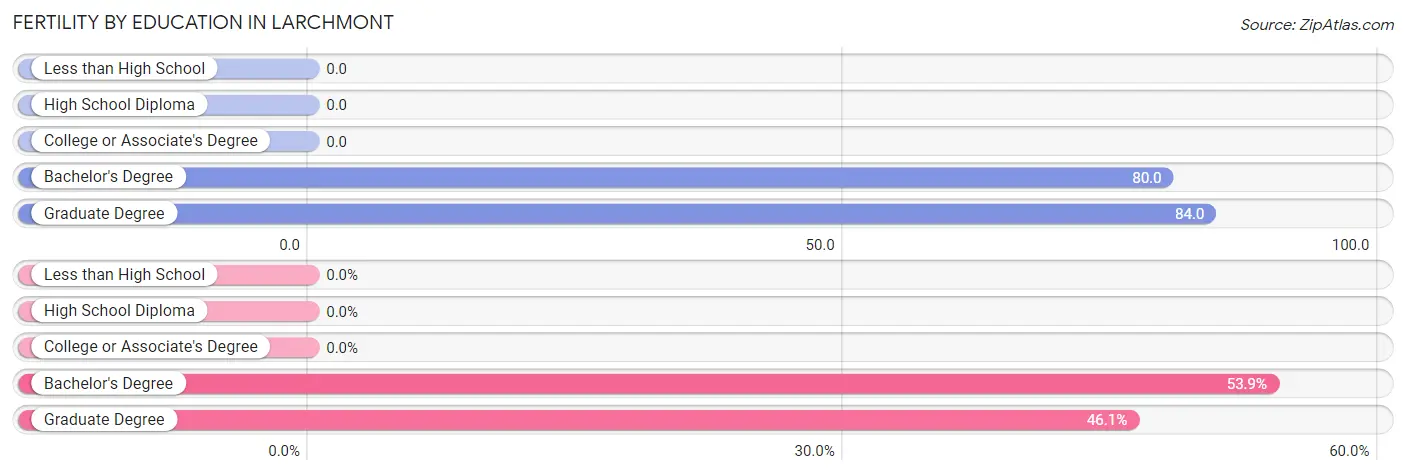
| Educational Attainment | Women with Births | Births / 1,000 Women |
| Less than High School | 0 (0.0%) | 0.0 |
| High School Diploma | 0 (0.0%) | 0.0 |
| College or Associate's Degree | 0 (0.0%) | 0.0 |
| Bachelor's Degree | 48 (53.9%) | 80.0 |
| Graduate Degree | 41 (46.1%) | 84.0 |
| Total | 89 (100.0%) | 60.0 |
Fertility by Education by Marriage Status in Larchmont
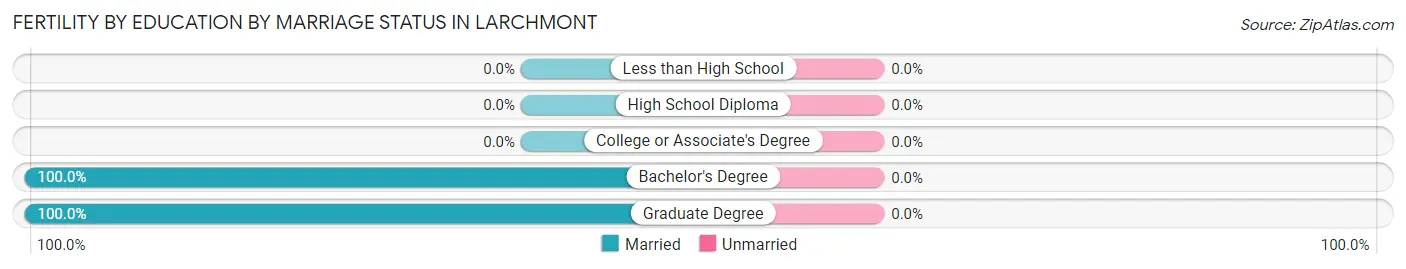
| Educational Attainment | Married | Unmarried |
| Less than High School | 0 (0.0%) | 0 (0.0%) |
| High School Diploma | 0 (0.0%) | 0 (0.0%) |
| College or Associate's Degree | 0 (0.0%) | 0 (0.0%) |
| Bachelor's Degree | 48 (100.0%) | 0 (0.0%) |
| Graduate Degree | 41 (100.0%) | 0 (0.0%) |
| Total | 89 (100.0%) | 0 (0.0%) |
Employment Characteristics in Larchmont
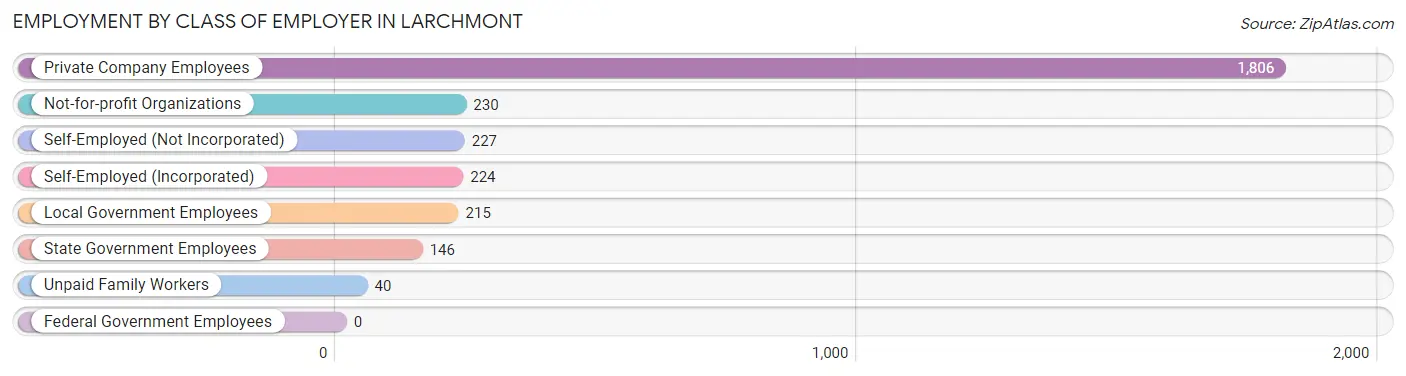
Employment by Class of Employer in Larchmont
Among the 2,888 employed individuals in Larchmont, private company employees (1,806 | 62.5%), not-for-profit organizations (230 | 8.0%), and self-employed (not incorporated) (227 | 7.9%) make up the most common classes of employment.
| Employer Class | # Employees | % Employees |
| Private Company Employees | 1,806 | 62.5% |
| Self-Employed (Incorporated) | 224 | 7.8% |
| Self-Employed (Not Incorporated) | 227 | 7.9% |
| Not-for-profit Organizations | 230 | 8.0% |
| Local Government Employees | 215 | 7.4% |
| State Government Employees | 146 | 5.1% |
| Federal Government Employees | 0 | 0.0% |
| Unpaid Family Workers | 40 | 1.4% |
| Total | 2,888 | 100.0% |
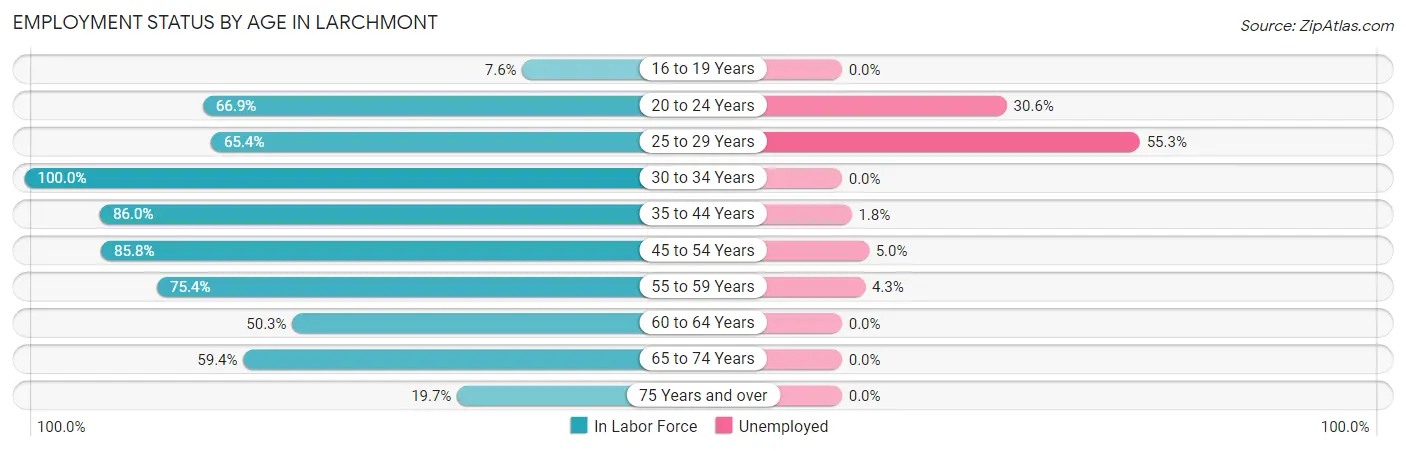
Employment Status by Age in Larchmont
According to the labor force statistics for Larchmont, out of the total population over 16 years of age (4,694), 68.6% or 3,220 individuals are in the labor force, with 10.3% or 332 of them unemployed. The age group with the highest labor force participation rate is 30 to 34 years, with 100.0% or 217 individuals in the labor force. Within the labor force, the 25 to 29 years age range has the highest percentage of unemployed individuals, with 55.3% or 238 of them being unemployed.
| Age Bracket | In Labor Force | Unemployed |
| 16 to 19 Years | 21 (7.6%) | 0 (0.0%) |
| 20 to 24 Years | 85 (66.9%) | 26 (30.6%) |
| 25 to 29 Years | 430 (65.4%) | 238 (55.3%) |
| 30 to 34 Years | 217 (100.0%) | 0 (0.0%) |
| 35 to 44 Years | 968 (86.0%) | 17 (1.8%) |
| 45 to 54 Years | 781 (85.8%) | 39 (5.0%) |
| 55 to 59 Years | 303 (75.4%) | 13 (4.3%) |
| 60 to 64 Years | 224 (50.3%) | 0 (0.0%) |
| 65 to 74 Years | 130 (59.4%) | 0 (0.0%) |
| 75 Years and over | 62 (19.7%) | 0 (0.0%) |
| Total | 3,220 (68.6%) | 332 (10.3%) |
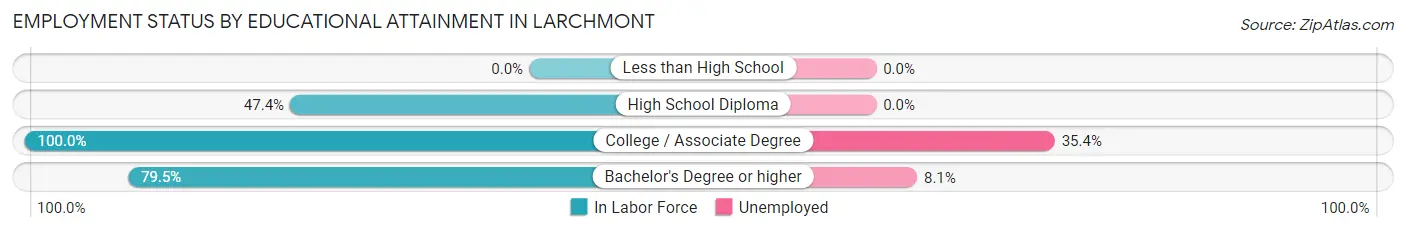
Employment Status by Educational Attainment in Larchmont
According to labor force statistics for Larchmont, 77.8% of individuals (2,923) out of the total population between 25 and 64 years of age (3,757) are in the labor force, with 10.5% or 307 of them being unemployed. The group with the highest labor force participation rate are those with the educational attainment of college / associate degree, with 100.0% or 308 individuals in the labor force. Within the labor force, individuals with college / associate degree education have the highest percentage of unemployment, with 35.4% or 109 of them being unemployed.
| Educational Attainment | In Labor Force | Unemployed |
| Less than High School | 0 (0.0%) | 0 (0.0%) |
| High School Diploma | 179 (47.4%) | 0 (0.0%) |
| College / Associate Degree | 308 (100.0%) | 109 (35.4%) |
| Bachelor's Degree or higher | 2,435 (79.5%) | 248 (8.1%) |
| Total | 2,923 (77.8%) | 394 (10.5%) |
Employment Occupations by Sex in Larchmont
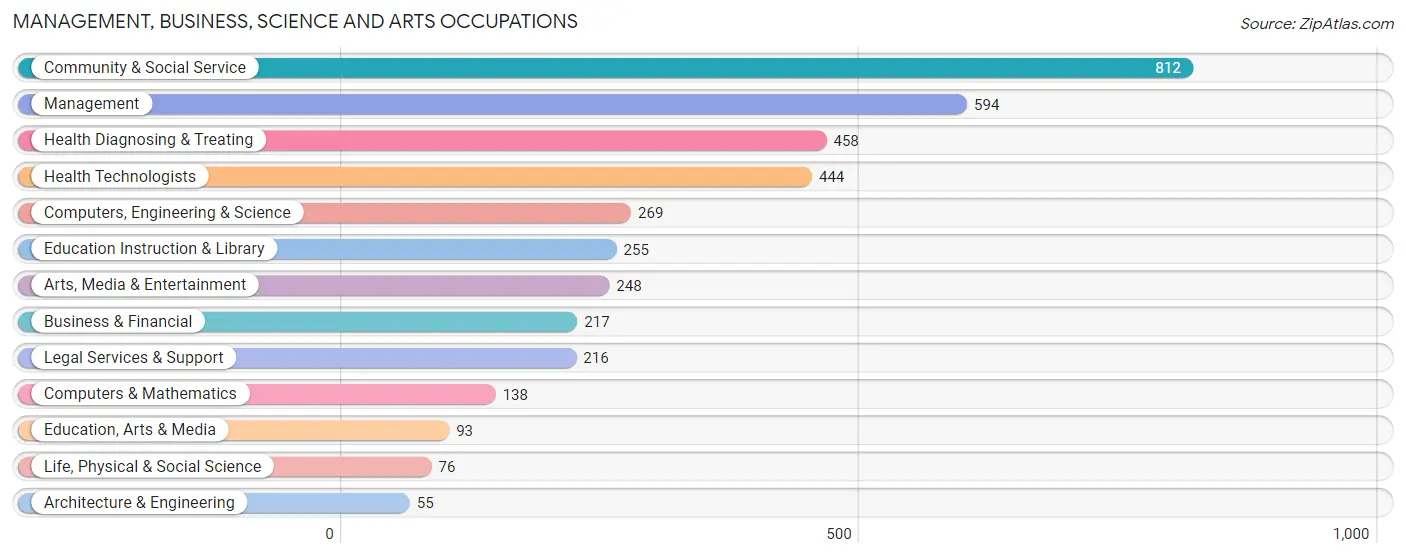
Management, Business, Science and Arts Occupations
The most common Management, Business, Science and Arts occupations in Larchmont are Community & Social Service (812 | 28.1%), Management (594 | 20.6%), Health Diagnosing & Treating (458 | 15.9%), Health Technologists (444 | 15.4%), and Computers, Engineering & Science (269 | 9.3%).
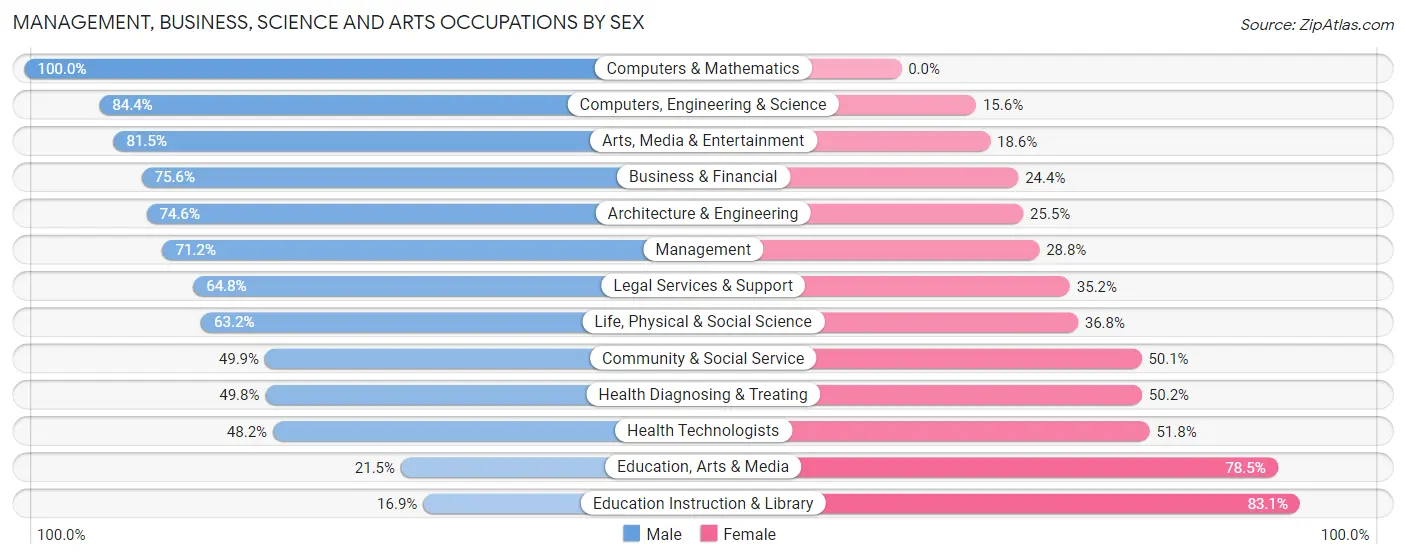
Management, Business, Science and Arts Occupations by Sex
Within the Management, Business, Science and Arts occupations in Larchmont, the most male-oriented occupations are Computers & Mathematics (100.0%), Computers, Engineering & Science (84.4%), and Arts, Media & Entertainment (81.5%), while the most female-oriented occupations are Education Instruction & Library (83.1%), Education, Arts & Media (78.5%), and Health Technologists (51.8%).
| Occupation | Male | Female |
| Management | 423 (71.2%) | 171 (28.8%) |
| Business & Financial | 164 (75.6%) | 53 (24.4%) |
| Computers, Engineering & Science | 227 (84.4%) | 42 (15.6%) |
| Computers & Mathematics | 138 (100.0%) | 0 (0.0%) |
| Architecture & Engineering | 41 (74.6%) | 14 (25.5%) |
| Life, Physical & Social Science | 48 (63.2%) | 28 (36.8%) |
| Community & Social Service | 405 (49.9%) | 407 (50.1%) |
| Education, Arts & Media | 20 (21.5%) | 73 (78.5%) |
| Legal Services & Support | 140 (64.8%) | 76 (35.2%) |
| Education Instruction & Library | 43 (16.9%) | 212 (83.1%) |
| Arts, Media & Entertainment | 202 (81.5%) | 46 (18.5%) |
| Health Diagnosing & Treating | 228 (49.8%) | 230 (50.2%) |
| Health Technologists | 214 (48.2%) | 230 (51.8%) |
| Total (Category) | 1,447 (61.6%) | 903 (38.4%) |
| Total (Overall) | 1,711 (59.3%) | 1,177 (40.7%) |
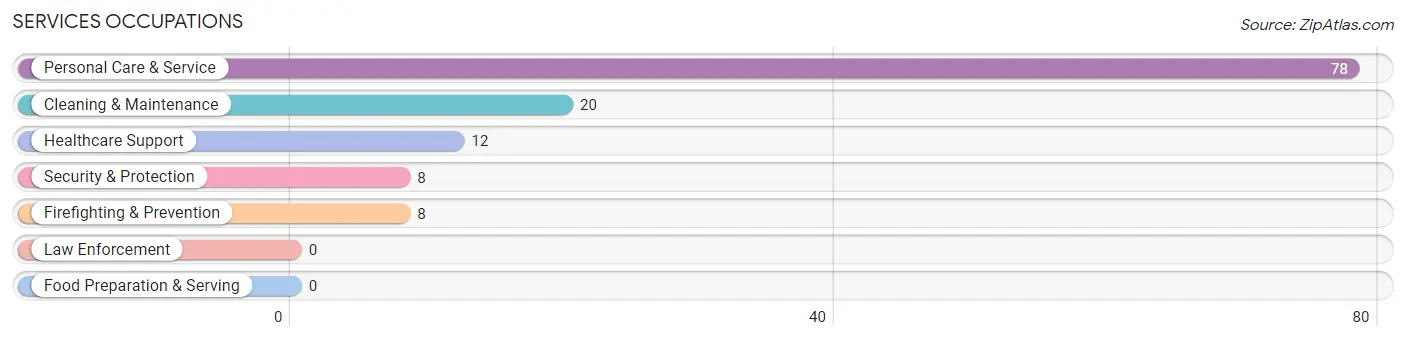
Services Occupations
The most common Services occupations in Larchmont are Personal Care & Service (78 | 2.7%), Cleaning & Maintenance (20 | 0.7%), Healthcare Support (12 | 0.4%), Security & Protection (8 | 0.3%), and Firefighting & Prevention (8 | 0.3%).
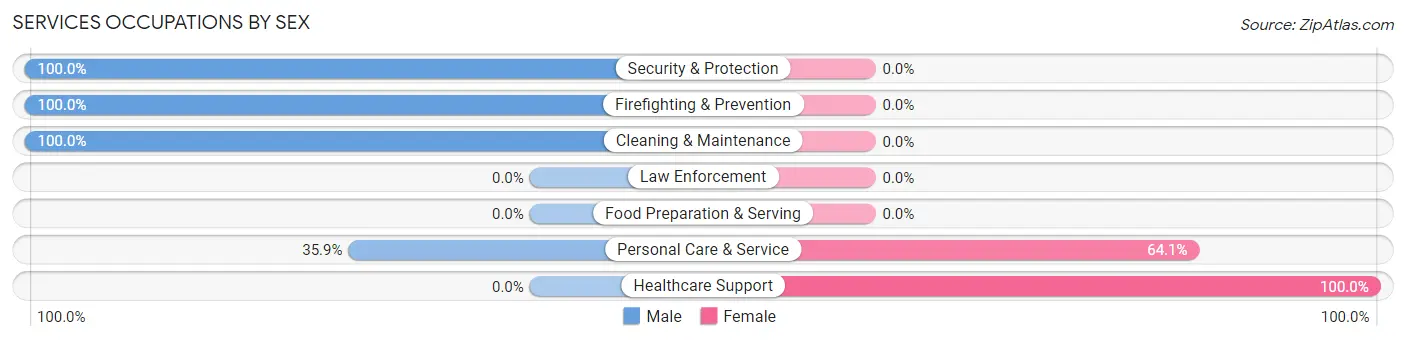
Services Occupations by Sex
Within the Services occupations in Larchmont, the most male-oriented occupations are Security & Protection (100.0%), Firefighting & Prevention (100.0%), and Cleaning & Maintenance (100.0%), while the most female-oriented occupations are Healthcare Support (100.0%), and Personal Care & Service (64.1%).
| Occupation | Male | Female |
| Healthcare Support | 0 (0.0%) | 12 (100.0%) |
| Security & Protection | 8 (100.0%) | 0 (0.0%) |
| Firefighting & Prevention | 8 (100.0%) | 0 (0.0%) |
| Law Enforcement | 0 (0.0%) | 0 (0.0%) |
| Food Preparation & Serving | 0 (0.0%) | 0 (0.0%) |
| Cleaning & Maintenance | 20 (100.0%) | 0 (0.0%) |
| Personal Care & Service | 28 (35.9%) | 50 (64.1%) |
| Total (Category) | 56 (47.5%) | 62 (52.5%) |
| Total (Overall) | 1,711 (59.3%) | 1,177 (40.7%) |
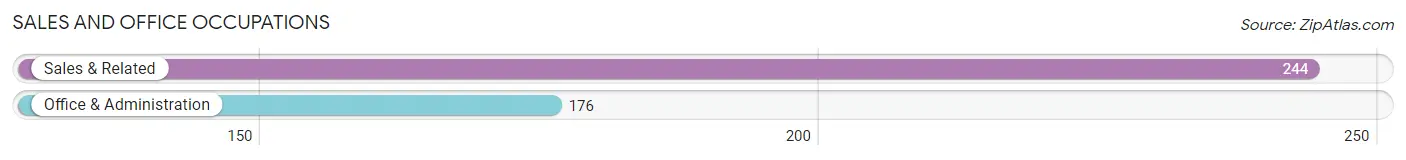
Sales and Office Occupations
The most common Sales and Office occupations in Larchmont are Sales & Related (244 | 8.5%), and Office & Administration (176 | 6.1%).
Sales and Office Occupations by Sex
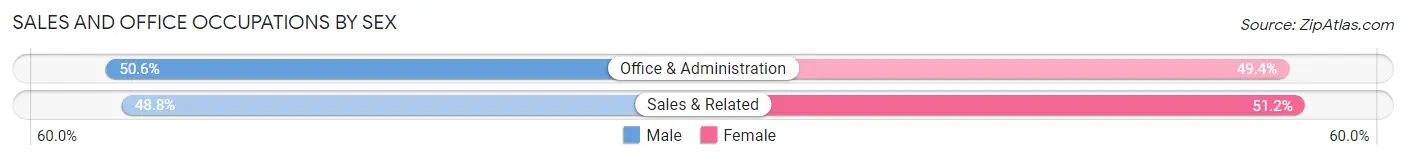
| Occupation | Male | Female |
| Sales & Related | 119 (48.8%) | 125 (51.2%) |
| Office & Administration | 89 (50.6%) | 87 (49.4%) |
| Total (Category) | 208 (49.5%) | 212 (50.5%) |
| Total (Overall) | 1,711 (59.3%) | 1,177 (40.7%) |
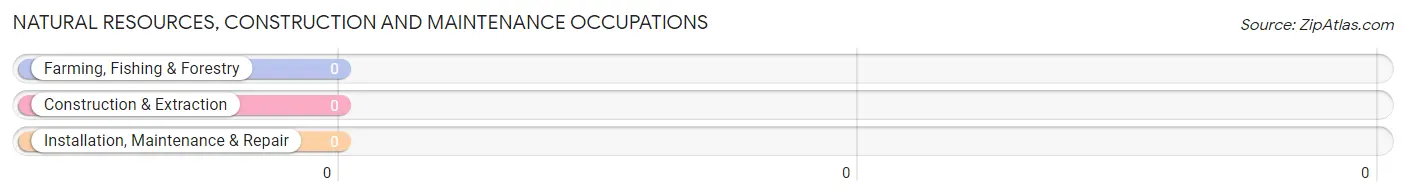
Natural Resources, Construction and Maintenance Occupations
Natural Resources, Construction and Maintenance Occupations by Sex
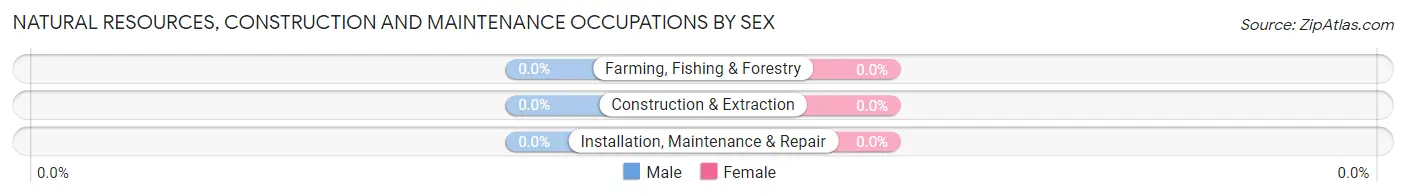
| Occupation | Male | Female |
| Farming, Fishing & Forestry | 0 (0.0%) | 0 (0.0%) |
| Construction & Extraction | 0 (0.0%) | 0 (0.0%) |
| Installation, Maintenance & Repair | 0 (0.0%) | 0 (0.0%) |
| Total (Category) | 0 (0.0%) | 0 (0.0%) |
| Total (Overall) | 1,711 (59.3%) | 1,177 (40.7%) |
Production, Transportation and Moving Occupations
Production, Transportation and Moving Occupations by Sex
| Occupation | Male | Female |
| Production | 0 (0.0%) | 0 (0.0%) |
| Transportation | 0 (0.0%) | 0 (0.0%) |
| Material Moving | 0 (0.0%) | 0 (0.0%) |
| Total (Category) | 0 (0.0%) | 0 (0.0%) |
| Total (Overall) | 1,711 (59.3%) | 1,177 (40.7%) |
Employment Industries by Sex in Larchmont
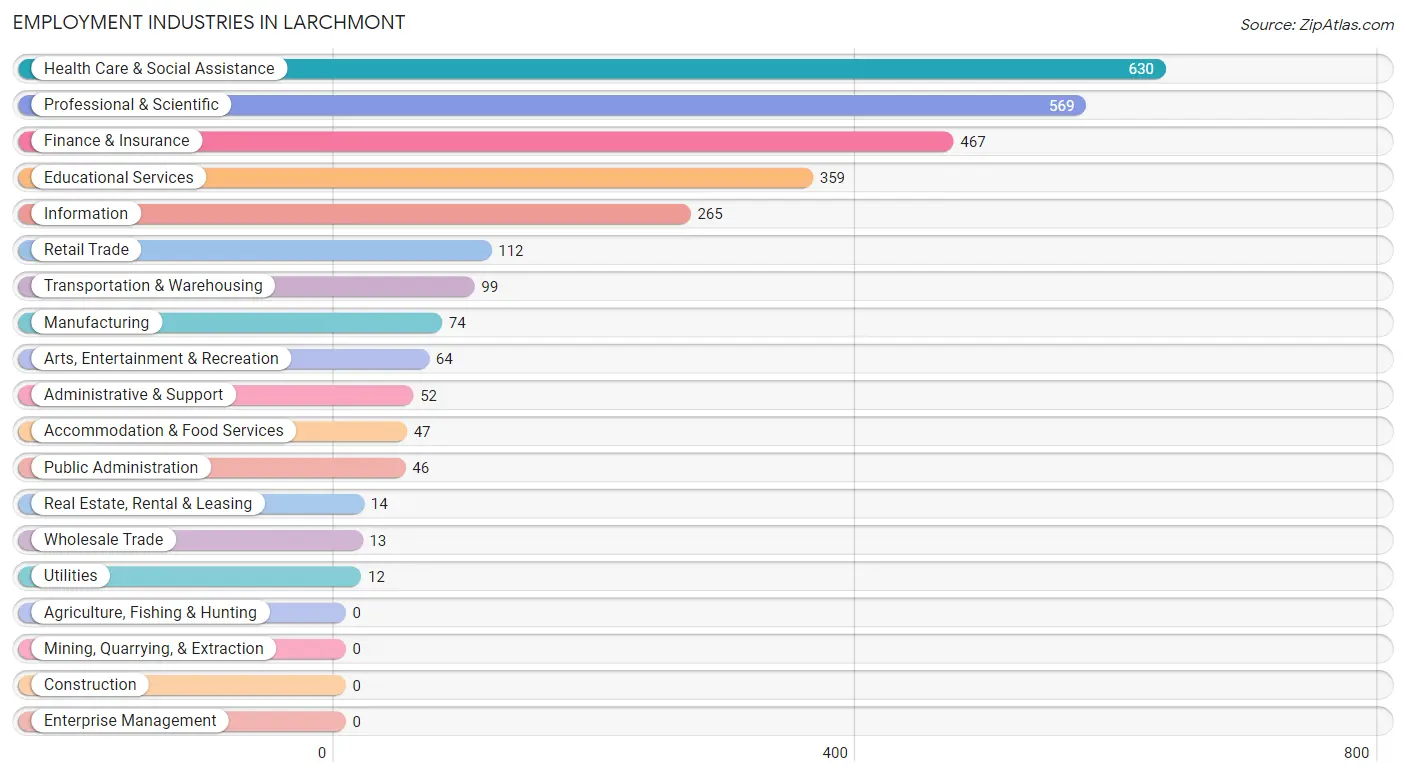
Employment Industries in Larchmont
The major employment industries in Larchmont include Health Care & Social Assistance (630 | 21.8%), Professional & Scientific (569 | 19.7%), Finance & Insurance (467 | 16.2%), Educational Services (359 | 12.4%), and Information (265 | 9.2%).
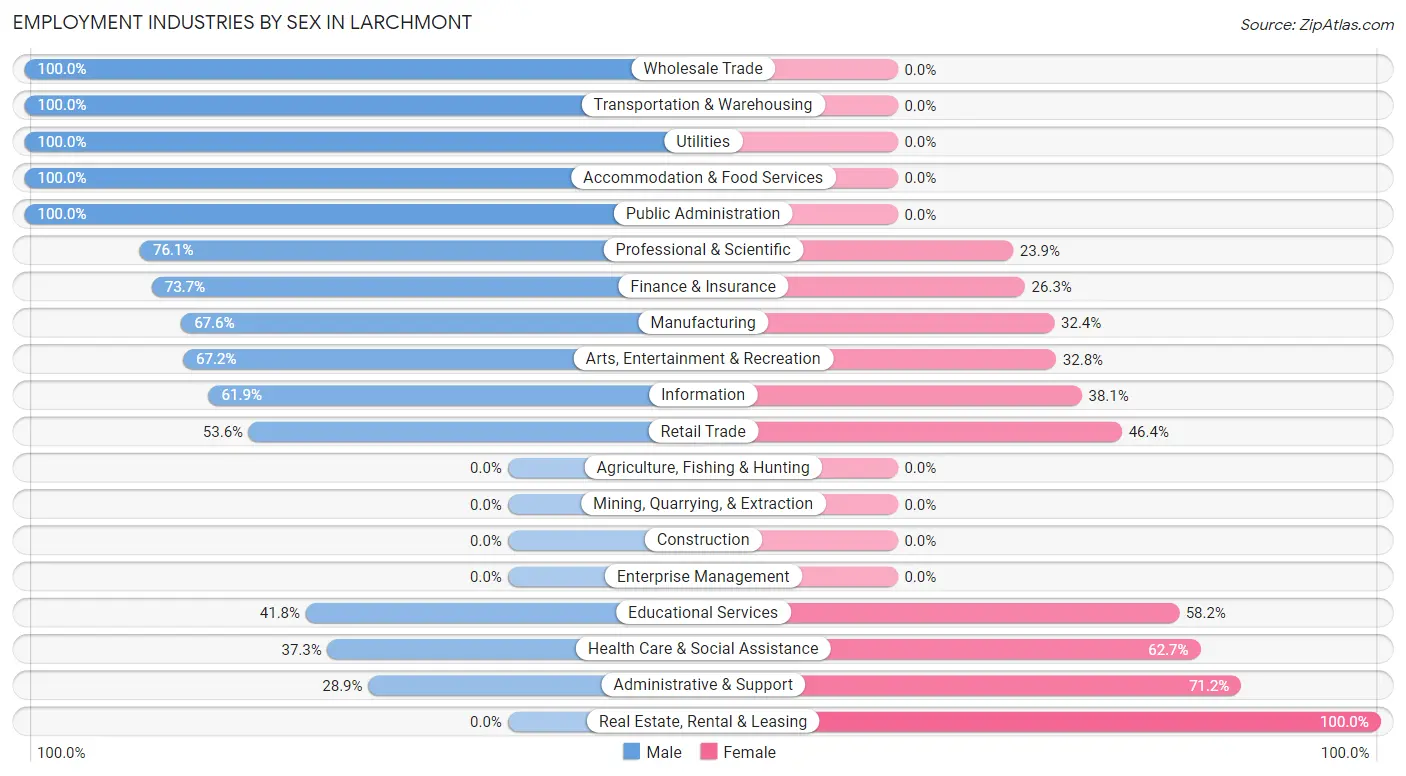
Employment Industries by Sex in Larchmont
The Larchmont industries that see more men than women are Wholesale Trade (100.0%), Transportation & Warehousing (100.0%), and Utilities (100.0%), whereas the industries that tend to have a higher number of women are Real Estate, Rental & Leasing (100.0%), Administrative & Support (71.2%), and Health Care & Social Assistance (62.7%).
| Industry | Male | Female |
| Agriculture, Fishing & Hunting | 0 (0.0%) | 0 (0.0%) |
| Mining, Quarrying, & Extraction | 0 (0.0%) | 0 (0.0%) |
| Construction | 0 (0.0%) | 0 (0.0%) |
| Manufacturing | 50 (67.6%) | 24 (32.4%) |
| Wholesale Trade | 13 (100.0%) | 0 (0.0%) |
| Retail Trade | 60 (53.6%) | 52 (46.4%) |
| Transportation & Warehousing | 99 (100.0%) | 0 (0.0%) |
| Utilities | 12 (100.0%) | 0 (0.0%) |
| Information | 164 (61.9%) | 101 (38.1%) |
| Finance & Insurance | 344 (73.7%) | 123 (26.3%) |
| Real Estate, Rental & Leasing | 0 (0.0%) | 14 (100.0%) |
| Professional & Scientific | 433 (76.1%) | 136 (23.9%) |
| Enterprise Management | 0 (0.0%) | 0 (0.0%) |
| Administrative & Support | 15 (28.8%) | 37 (71.2%) |
| Educational Services | 150 (41.8%) | 209 (58.2%) |
| Health Care & Social Assistance | 235 (37.3%) | 395 (62.7%) |
| Arts, Entertainment & Recreation | 43 (67.2%) | 21 (32.8%) |
| Accommodation & Food Services | 47 (100.0%) | 0 (0.0%) |
| Public Administration | 46 (100.0%) | 0 (0.0%) |
| Total | 1,711 (59.3%) | 1,177 (40.7%) |
Education in Larchmont
School Enrollment in Larchmont
The most common levels of schooling among the 1,925 students in Larchmont are elementary school (627 | 32.6%), middle school (414 | 21.5%), and nursery / preschool (354 | 18.4%).
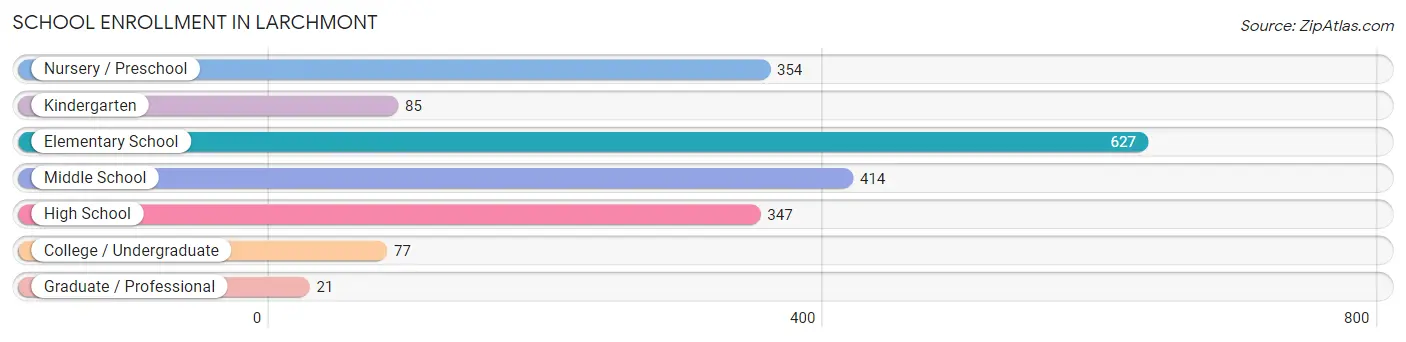
| School Level | # Students | % Students |
| Nursery / Preschool | 354 | 18.4% |
| Kindergarten | 85 | 4.4% |
| Elementary School | 627 | 32.6% |
| Middle School | 414 | 21.5% |
| High School | 347 | 18.0% |
| College / Undergraduate | 77 | 4.0% |
| Graduate / Professional | 21 | 1.1% |
| Total | 1,925 | 100.0% |
School Enrollment by Age by Funding Source in Larchmont
Out of a total of 1,925 students who are enrolled in schools in Larchmont, 491 (25.5%) attend a private institution, while the remaining 1,434 (74.5%) are enrolled in public schools. The age group of 18 to 19 year olds has the highest likelihood of being enrolled in private schools, with 21 (100.0% in the age bracket) enrolled. Conversely, the age group of 25 to 34 year olds has the lowest likelihood of being enrolled in a private school, with 22 (100.0% in the age bracket) attending a public institution.
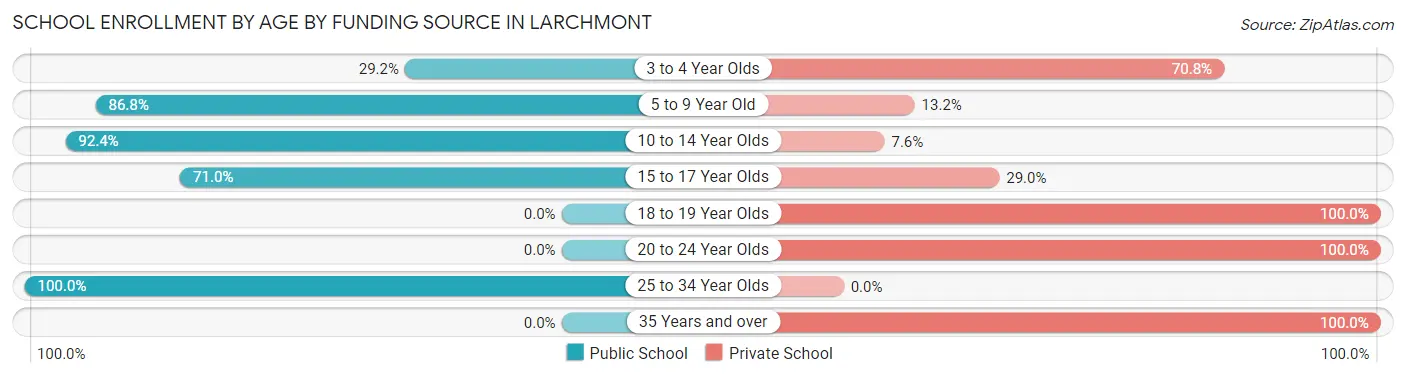
| Age Bracket | Public School | Private School |
| 3 to 4 Year Olds | 75 (29.2%) | 182 (70.8%) |
| 5 to 9 Year Old | 630 (86.8%) | 96 (13.2%) |
| 10 to 14 Year Olds | 534 (92.4%) | 44 (7.6%) |
| 15 to 17 Year Olds | 174 (71.0%) | 71 (29.0%) |
| 18 to 19 Year Olds | 0 (0.0%) | 21 (100.0%) |
| 20 to 24 Year Olds | 0 (0.0%) | 55 (100.0%) |
| 25 to 34 Year Olds | 22 (100.0%) | 0 (0.0%) |
| 35 Years and over | 0 (0.0%) | 21 (100.0%) |
| Total | 1,434 (74.5%) | 491 (25.5%) |
Educational Attainment by Field of Study in Larchmont
Business (646 | 17.4%), liberal arts & history (464 | 12.5%), social sciences (408 | 11.0%), education (382 | 10.3%), and science & technology (343 | 9.2%) are the most common fields of study among 3,707 individuals in Larchmont who have obtained a bachelor's degree or higher.
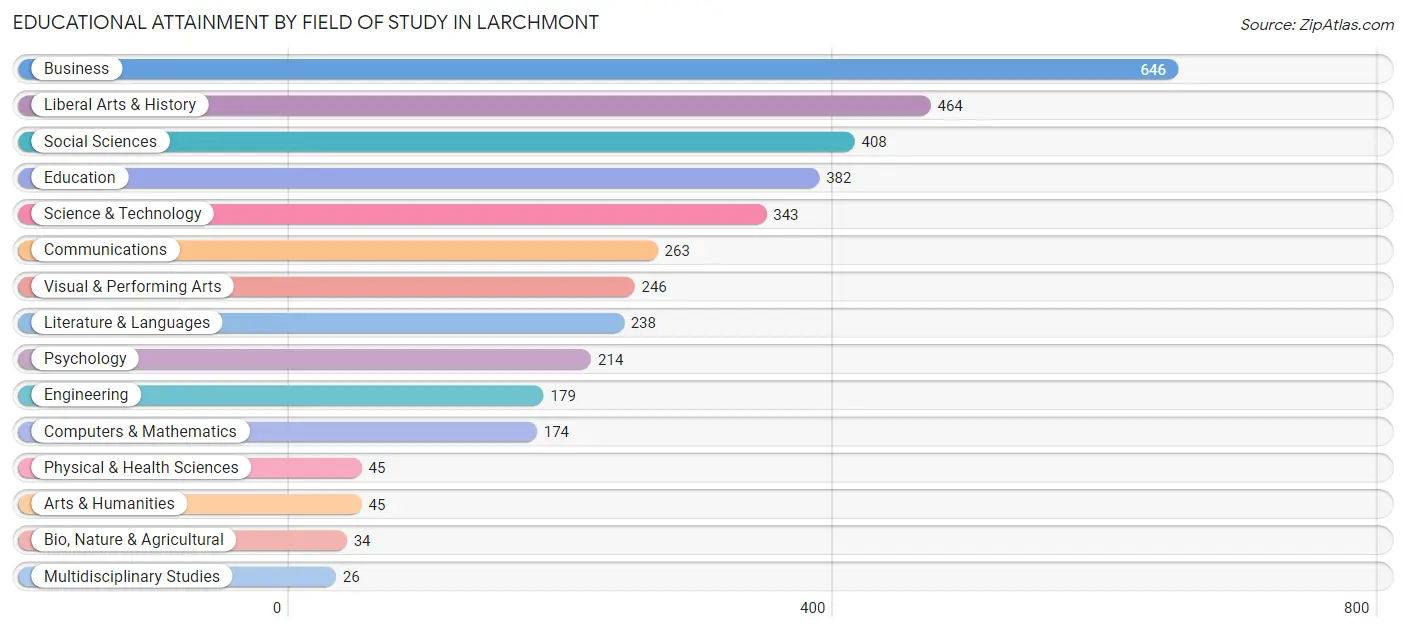
| Field of Study | # Graduates | % Graduates |
| Computers & Mathematics | 174 | 4.7% |
| Bio, Nature & Agricultural | 34 | 0.9% |
| Physical & Health Sciences | 45 | 1.2% |
| Psychology | 214 | 5.8% |
| Social Sciences | 408 | 11.0% |
| Engineering | 179 | 4.8% |
| Multidisciplinary Studies | 26 | 0.7% |
| Science & Technology | 343 | 9.2% |
| Business | 646 | 17.4% |
| Education | 382 | 10.3% |
| Literature & Languages | 238 | 6.4% |
| Liberal Arts & History | 464 | 12.5% |
| Visual & Performing Arts | 246 | 6.6% |
| Communications | 263 | 7.1% |
| Arts & Humanities | 45 | 1.2% |
| Total | 3,707 | 100.0% |
Transportation & Commute in Larchmont
Vehicle Availability by Sex in Larchmont
The most prevalent vehicle ownership categories in Larchmont are males with 2 vehicles (655, accounting for 38.3%) and females with 2 vehicles (543, making up 55.6%).
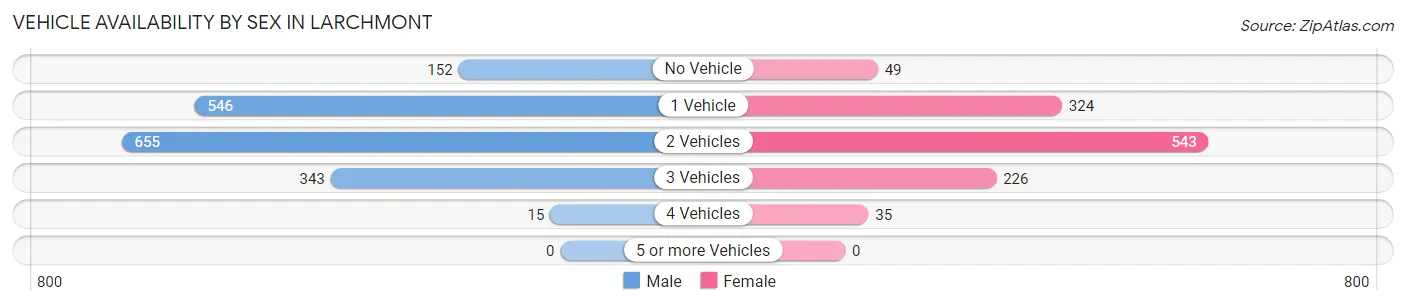
| Vehicles Available | Male | Female |
| No Vehicle | 152 (8.9%) | 49 (4.2%) |
| 1 Vehicle | 546 (31.9%) | 324 (27.5%) |
| 2 Vehicles | 655 (38.3%) | 543 (46.1%) |
| 3 Vehicles | 343 (20.1%) | 226 (19.2%) |
| 4 Vehicles | 15 (0.9%) | 35 (3.0%) |
| 5 or more Vehicles | 0 (0.0%) | 0 (0.0%) |
| Total | 1,711 (100.0%) | 1,177 (100.0%) |
Commute Time in Larchmont
The most frequently occuring commute durations in Larchmont are 60 to 89 minutes (572 commuters, 26.5%), 45 to 59 minutes (414 commuters, 19.2%), and 30 to 34 minutes (226 commuters, 10.4%).
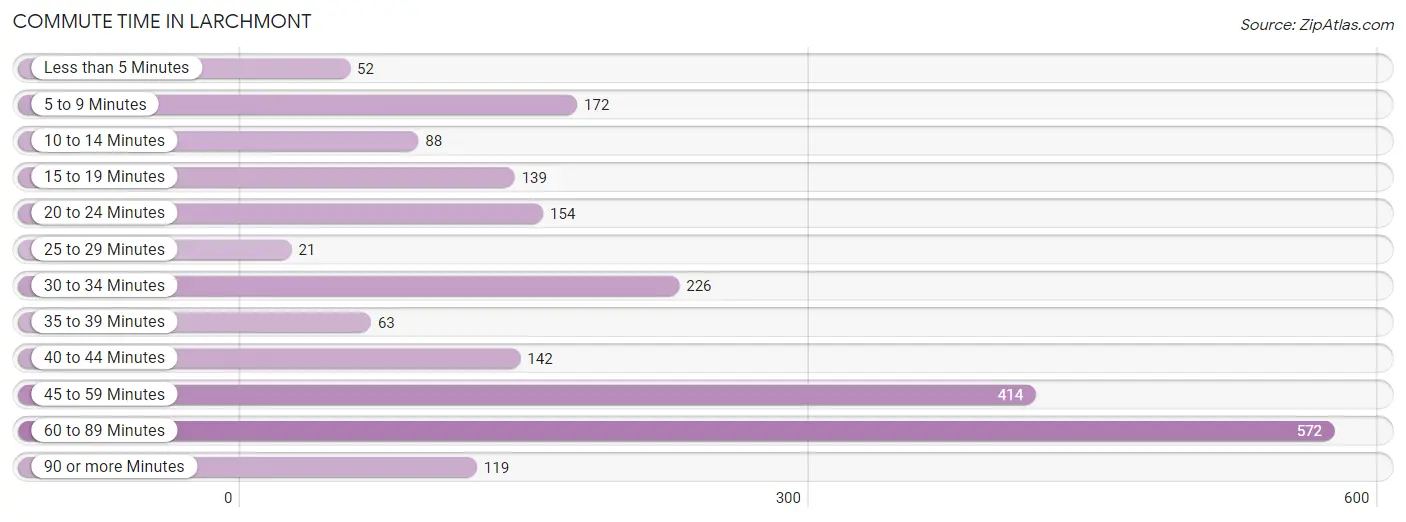
| Commute Time | # Commuters | % Commuters |
| Less than 5 Minutes | 52 | 2.4% |
| 5 to 9 Minutes | 172 | 8.0% |
| 10 to 14 Minutes | 88 | 4.1% |
| 15 to 19 Minutes | 139 | 6.4% |
| 20 to 24 Minutes | 154 | 7.1% |
| 25 to 29 Minutes | 21 | 1.0% |
| 30 to 34 Minutes | 226 | 10.4% |
| 35 to 39 Minutes | 63 | 2.9% |
| 40 to 44 Minutes | 142 | 6.6% |
| 45 to 59 Minutes | 414 | 19.2% |
| 60 to 89 Minutes | 572 | 26.5% |
| 90 or more Minutes | 119 | 5.5% |
Commute Time by Sex in Larchmont
The most common commute times in Larchmont are 60 to 89 minutes (350 commuters, 28.1%) for males and 60 to 89 minutes (222 commuters, 24.2%) for females.
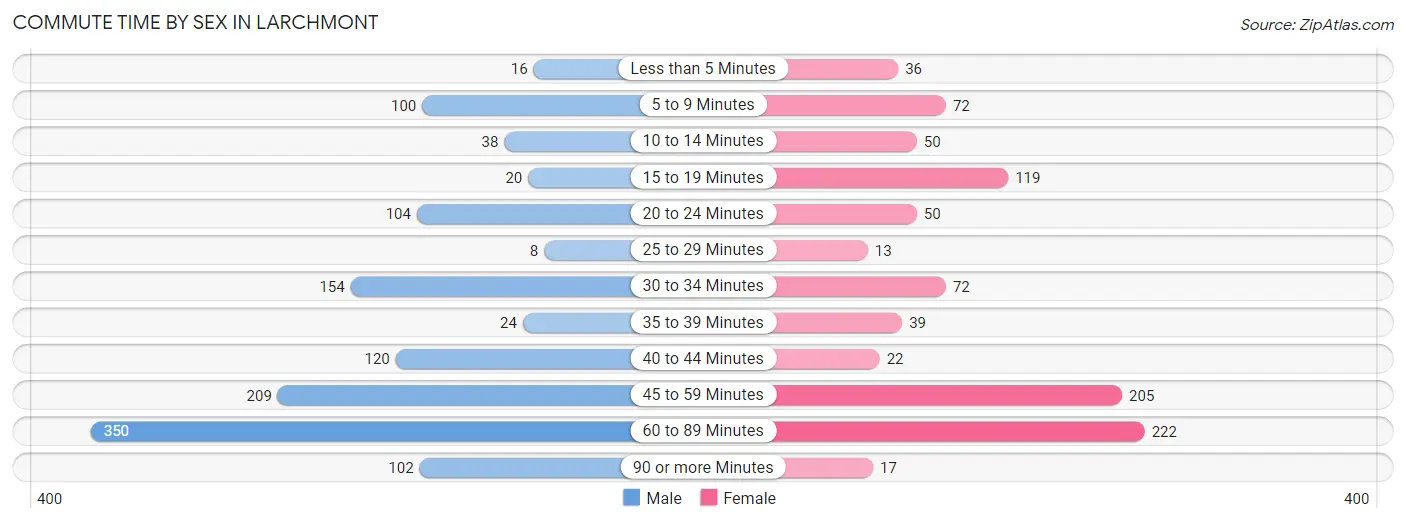
| Commute Time | Male | Female |
| Less than 5 Minutes | 16 (1.3%) | 36 (3.9%) |
| 5 to 9 Minutes | 100 (8.0%) | 72 (7.9%) |
| 10 to 14 Minutes | 38 (3.0%) | 50 (5.4%) |
| 15 to 19 Minutes | 20 (1.6%) | 119 (13.0%) |
| 20 to 24 Minutes | 104 (8.4%) | 50 (5.4%) |
| 25 to 29 Minutes | 8 (0.6%) | 13 (1.4%) |
| 30 to 34 Minutes | 154 (12.4%) | 72 (7.9%) |
| 35 to 39 Minutes | 24 (1.9%) | 39 (4.3%) |
| 40 to 44 Minutes | 120 (9.6%) | 22 (2.4%) |
| 45 to 59 Minutes | 209 (16.8%) | 205 (22.4%) |
| 60 to 89 Minutes | 350 (28.1%) | 222 (24.2%) |
| 90 or more Minutes | 102 (8.2%) | 17 (1.8%) |
Time of Departure to Work by Sex in Larchmont
The most frequent times of departure to work in Larchmont are 7:30 AM to 7:59 AM (265, 21.3%) for males and 7:30 AM to 7:59 AM (177, 19.3%) for females.
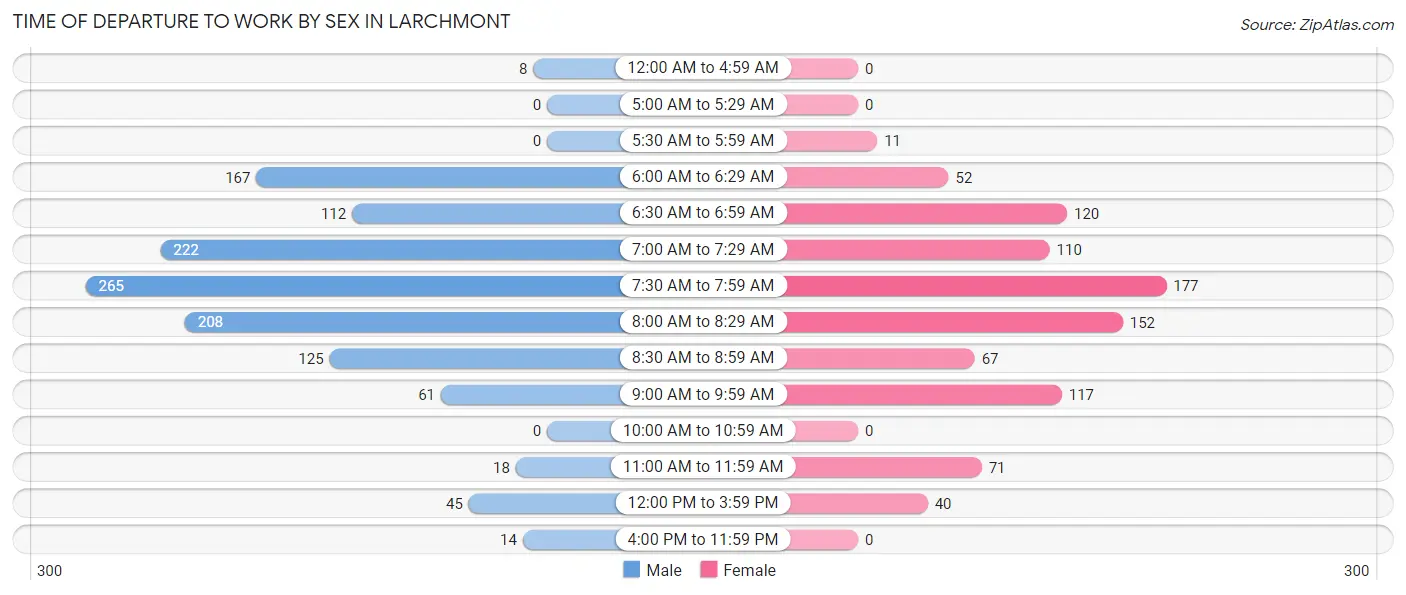
| Time of Departure | Male | Female |
| 12:00 AM to 4:59 AM | 8 (0.6%) | 0 (0.0%) |
| 5:00 AM to 5:29 AM | 0 (0.0%) | 0 (0.0%) |
| 5:30 AM to 5:59 AM | 0 (0.0%) | 11 (1.2%) |
| 6:00 AM to 6:29 AM | 167 (13.4%) | 52 (5.7%) |
| 6:30 AM to 6:59 AM | 112 (9.0%) | 120 (13.1%) |
| 7:00 AM to 7:29 AM | 222 (17.8%) | 110 (12.0%) |
| 7:30 AM to 7:59 AM | 265 (21.3%) | 177 (19.3%) |
| 8:00 AM to 8:29 AM | 208 (16.7%) | 152 (16.6%) |
| 8:30 AM to 8:59 AM | 125 (10.0%) | 67 (7.3%) |
| 9:00 AM to 9:59 AM | 61 (4.9%) | 117 (12.8%) |
| 10:00 AM to 10:59 AM | 0 (0.0%) | 0 (0.0%) |
| 11:00 AM to 11:59 AM | 18 (1.5%) | 71 (7.7%) |
| 12:00 PM to 3:59 PM | 45 (3.6%) | 40 (4.4%) |
| 4:00 PM to 11:59 PM | 14 (1.1%) | 0 (0.0%) |
| Total | 1,245 (100.0%) | 917 (100.0%) |
Housing Occupancy in Larchmont
Occupancy by Ownership in Larchmont
Of the total 2,208 dwellings in Larchmont, owner-occupied units account for 1,619 (73.3%), while renter-occupied units make up 589 (26.7%).
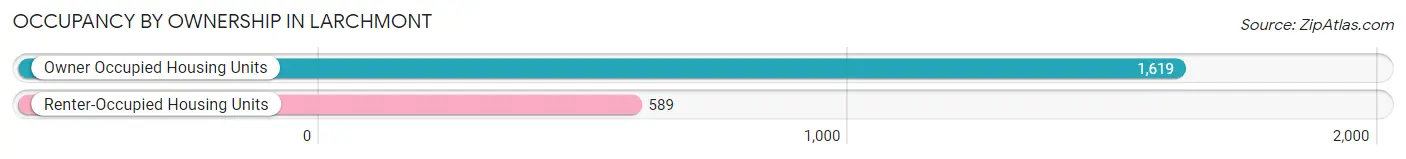
| Occupancy | # Housing Units | % Housing Units |
| Owner Occupied Housing Units | 1,619 | 73.3% |
| Renter-Occupied Housing Units | 589 | 26.7% |
| Total Occupied Housing Units | 2,208 | 100.0% |
Occupancy by Household Size in Larchmont
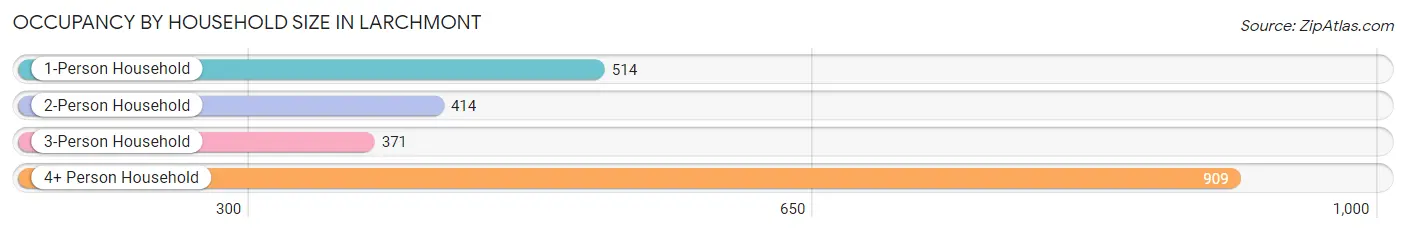
| Household Size | # Housing Units | % Housing Units |
| 1-Person Household | 514 | 23.3% |
| 2-Person Household | 414 | 18.8% |
| 3-Person Household | 371 | 16.8% |
| 4+ Person Household | 909 | 41.2% |
| Total Housing Units | 2,208 | 100.0% |
Occupancy by Ownership by Household Size in Larchmont
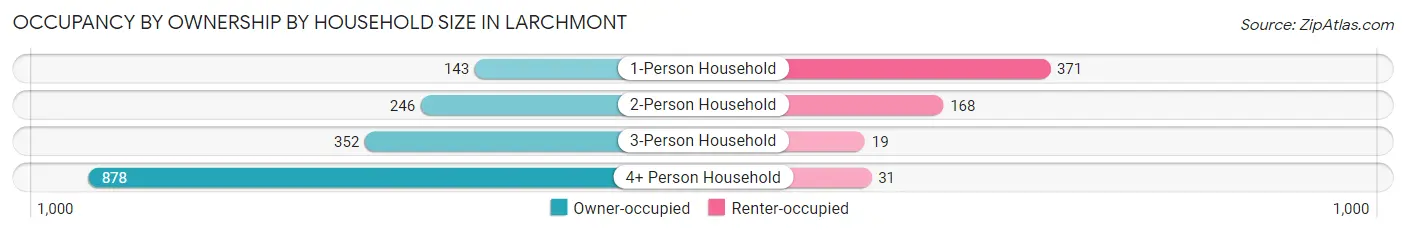
| Household Size | Owner-occupied | Renter-occupied |
| 1-Person Household | 143 (27.8%) | 371 (72.2%) |
| 2-Person Household | 246 (59.4%) | 168 (40.6%) |
| 3-Person Household | 352 (94.9%) | 19 (5.1%) |
| 4+ Person Household | 878 (96.6%) | 31 (3.4%) |
| Total Housing Units | 1,619 (73.3%) | 589 (26.7%) |
Occupancy by Educational Attainment in Larchmont
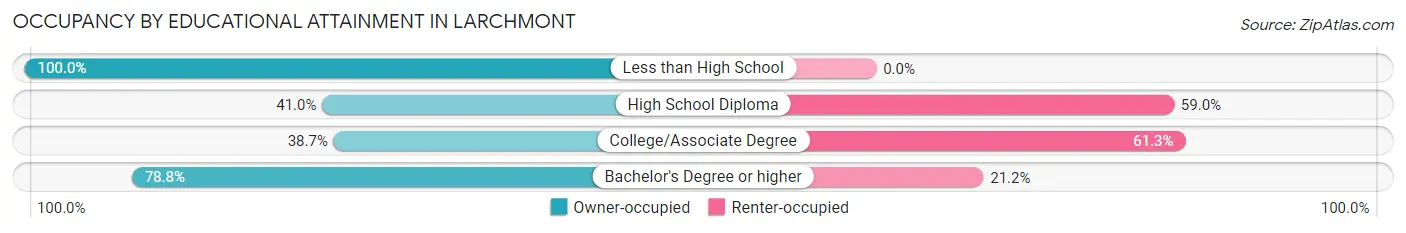
| Household Size | Owner-occupied | Renter-occupied |
| Less than High School | 14 (100.0%) | 0 (0.0%) |
| High School Diploma | 93 (41.0%) | 134 (59.0%) |
| College/Associate Degree | 36 (38.7%) | 57 (61.3%) |
| Bachelor's Degree or higher | 1,476 (78.8%) | 398 (21.2%) |
Occupancy by Age of Householder in Larchmont
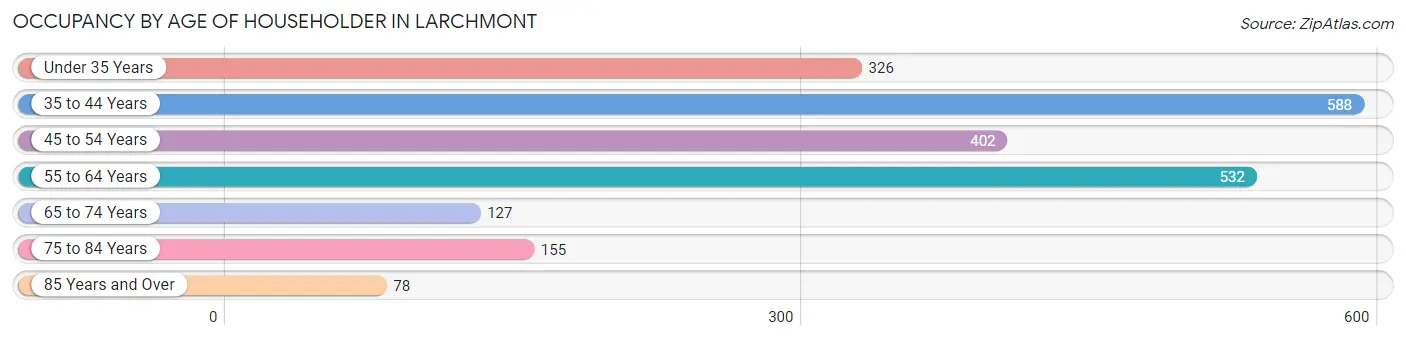
| Age Bracket | # Households | % Households |
| Under 35 Years | 326 | 14.8% |
| 35 to 44 Years | 588 | 26.6% |
| 45 to 54 Years | 402 | 18.2% |
| 55 to 64 Years | 532 | 24.1% |
| 65 to 74 Years | 127 | 5.8% |
| 75 to 84 Years | 155 | 7.0% |
| 85 Years and Over | 78 | 3.5% |
| Total | 2,208 | 100.0% |
Housing Finances in Larchmont
Median Income by Occupancy in Larchmont
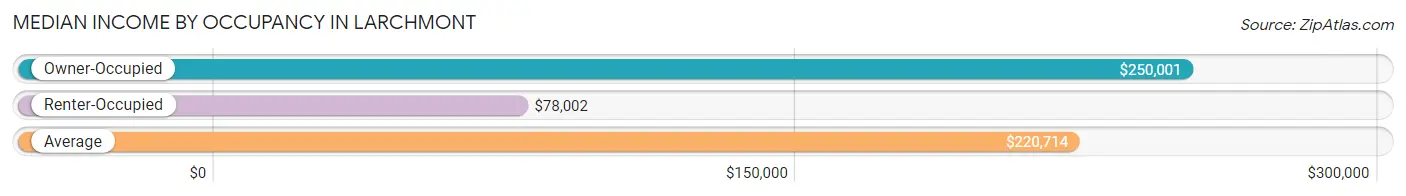
| Occupancy Type | # Households | Median Income |
| Owner-Occupied | 1,619 (73.3%) | $250,001 |
| Renter-Occupied | 589 (26.7%) | $78,002 |
| Average | 2,208 (100.0%) | $220,714 |
Occupancy by Householder Income Bracket in Larchmont
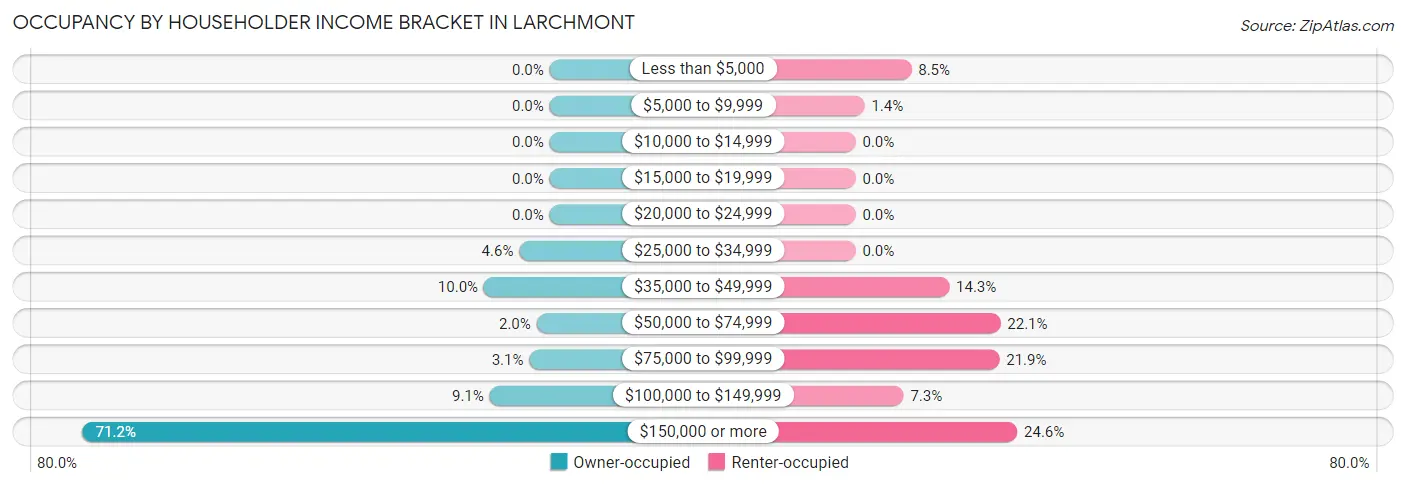
| Income Bracket | Owner-occupied | Renter-occupied |
| Less than $5,000 | 0 (0.0%) | 50 (8.5%) |
| $5,000 to $9,999 | 0 (0.0%) | 8 (1.4%) |
| $10,000 to $14,999 | 0 (0.0%) | 0 (0.0%) |
| $15,000 to $19,999 | 0 (0.0%) | 0 (0.0%) |
| $20,000 to $24,999 | 0 (0.0%) | 0 (0.0%) |
| $25,000 to $34,999 | 75 (4.6%) | 0 (0.0%) |
| $35,000 to $49,999 | 162 (10.0%) | 84 (14.3%) |
| $50,000 to $74,999 | 32 (2.0%) | 130 (22.1%) |
| $75,000 to $99,999 | 50 (3.1%) | 129 (21.9%) |
| $100,000 to $149,999 | 148 (9.1%) | 43 (7.3%) |
| $150,000 or more | 1,152 (71.2%) | 145 (24.6%) |
| Total | 1,619 (100.0%) | 589 (100.0%) |
Monthly Housing Cost Tiers in Larchmont
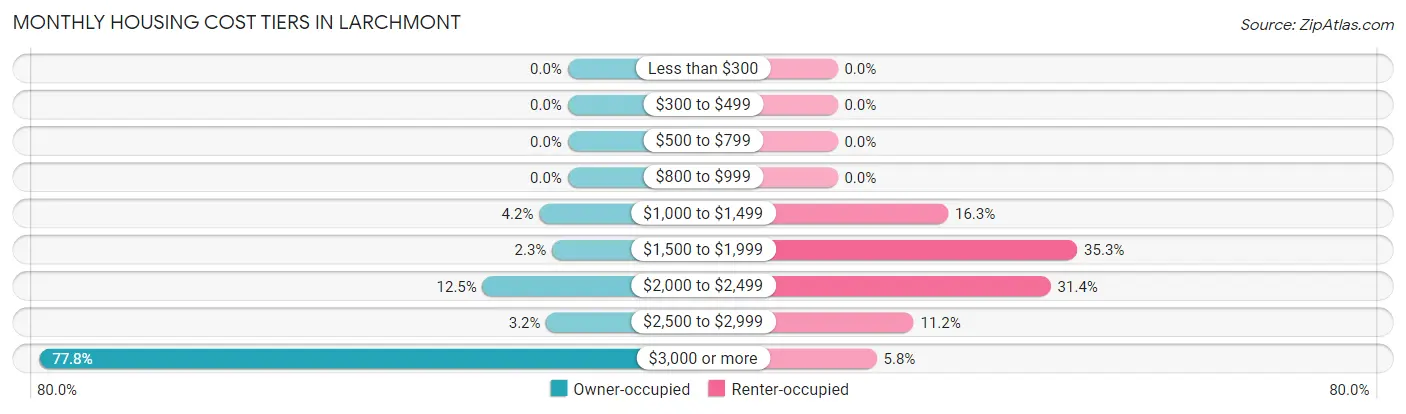
| Monthly Cost | Owner-occupied | Renter-occupied |
| Less than $300 | 0 (0.0%) | 0 (0.0%) |
| $300 to $499 | 0 (0.0%) | 0 (0.0%) |
| $500 to $799 | 0 (0.0%) | 0 (0.0%) |
| $800 to $999 | 0 (0.0%) | 0 (0.0%) |
| $1,000 to $1,499 | 68 (4.2%) | 96 (16.3%) |
| $1,500 to $1,999 | 37 (2.3%) | 208 (35.3%) |
| $2,000 to $2,499 | 203 (12.5%) | 185 (31.4%) |
| $2,500 to $2,999 | 51 (3.2%) | 66 (11.2%) |
| $3,000 or more | 1,260 (77.8%) | 34 (5.8%) |
| Total | 1,619 (100.0%) | 589 (100.0%) |
Physical Housing Characteristics in Larchmont
Housing Structures in Larchmont
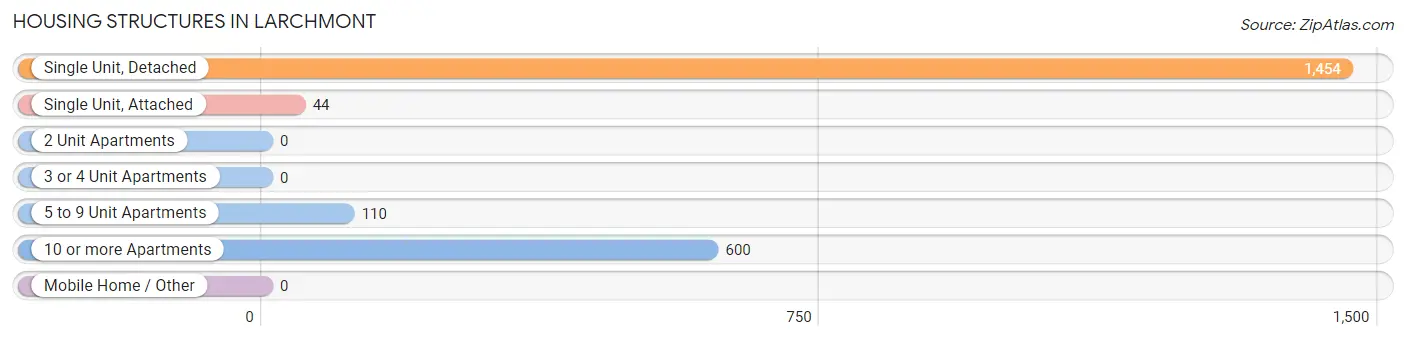
| Structure Type | # Housing Units | % Housing Units |
| Single Unit, Detached | 1,454 | 65.8% |
| Single Unit, Attached | 44 | 2.0% |
| 2 Unit Apartments | 0 | 0.0% |
| 3 or 4 Unit Apartments | 0 | 0.0% |
| 5 to 9 Unit Apartments | 110 | 5.0% |
| 10 or more Apartments | 600 | 27.2% |
| Mobile Home / Other | 0 | 0.0% |
| Total | 2,208 | 100.0% |
Housing Structures by Occupancy in Larchmont
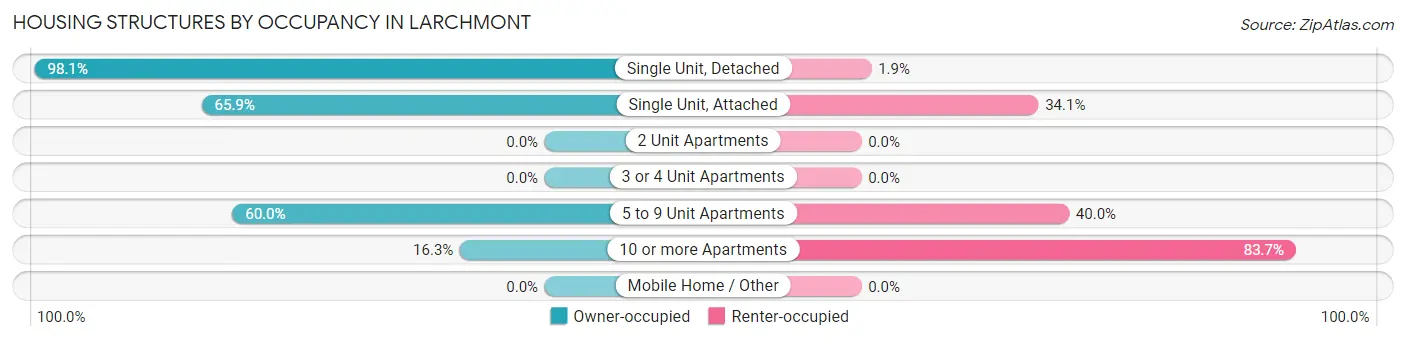
| Structure Type | Owner-occupied | Renter-occupied |
| Single Unit, Detached | 1,426 (98.1%) | 28 (1.9%) |
| Single Unit, Attached | 29 (65.9%) | 15 (34.1%) |
| 2 Unit Apartments | 0 (0.0%) | 0 (0.0%) |
| 3 or 4 Unit Apartments | 0 (0.0%) | 0 (0.0%) |
| 5 to 9 Unit Apartments | 66 (60.0%) | 44 (40.0%) |
| 10 or more Apartments | 98 (16.3%) | 502 (83.7%) |
| Mobile Home / Other | 0 (0.0%) | 0 (0.0%) |
| Total | 1,619 (73.3%) | 589 (26.7%) |
Housing Structures by Number of Rooms in Larchmont
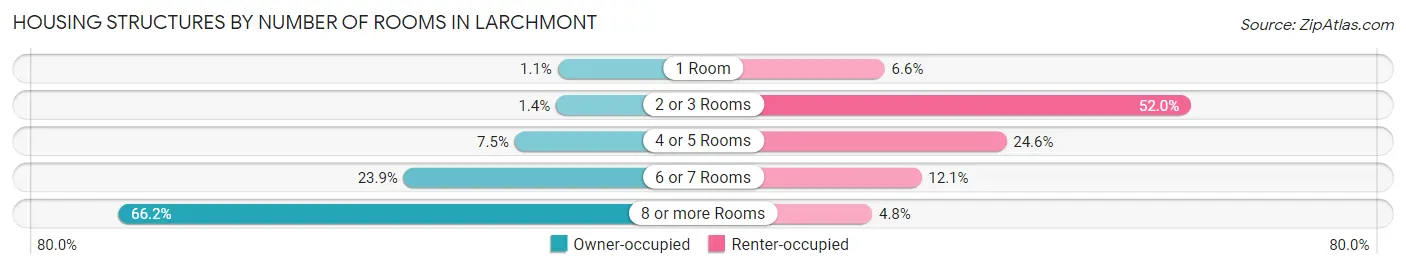
| Number of Rooms | Owner-occupied | Renter-occupied |
| 1 Room | 18 (1.1%) | 39 (6.6%) |
| 2 or 3 Rooms | 22 (1.4%) | 306 (51.9%) |
| 4 or 5 Rooms | 121 (7.5%) | 145 (24.6%) |
| 6 or 7 Rooms | 387 (23.9%) | 71 (12.0%) |
| 8 or more Rooms | 1,071 (66.1%) | 28 (4.8%) |
| Total | 1,619 (100.0%) | 589 (100.0%) |
Housing Structure by Heating Type in Larchmont
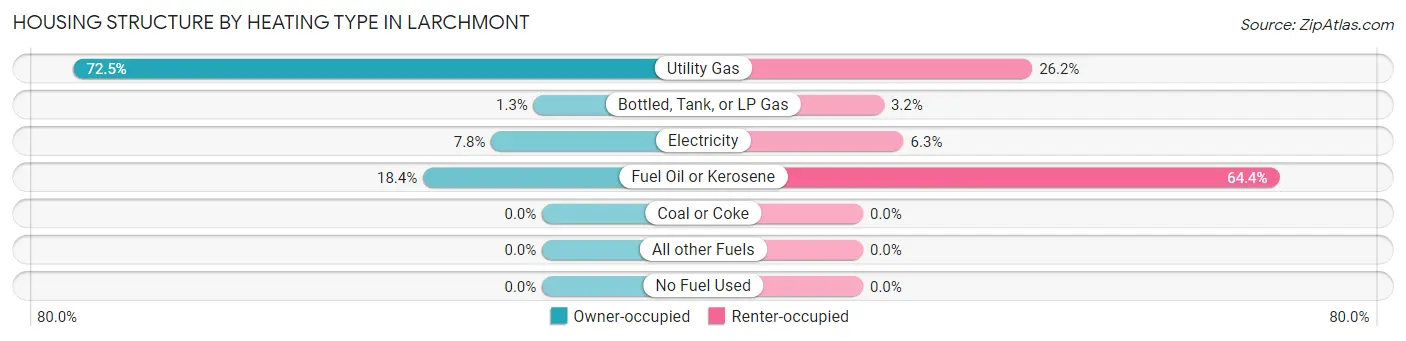
| Heating Type | Owner-occupied | Renter-occupied |
| Utility Gas | 1,173 (72.5%) | 154 (26.2%) |
| Bottled, Tank, or LP Gas | 21 (1.3%) | 19 (3.2%) |
| Electricity | 127 (7.8%) | 37 (6.3%) |
| Fuel Oil or Kerosene | 298 (18.4%) | 379 (64.3%) |
| Coal or Coke | 0 (0.0%) | 0 (0.0%) |
| All other Fuels | 0 (0.0%) | 0 (0.0%) |
| No Fuel Used | 0 (0.0%) | 0 (0.0%) |
| Total | 1,619 (100.0%) | 589 (100.0%) |
Household Vehicle Usage in Larchmont
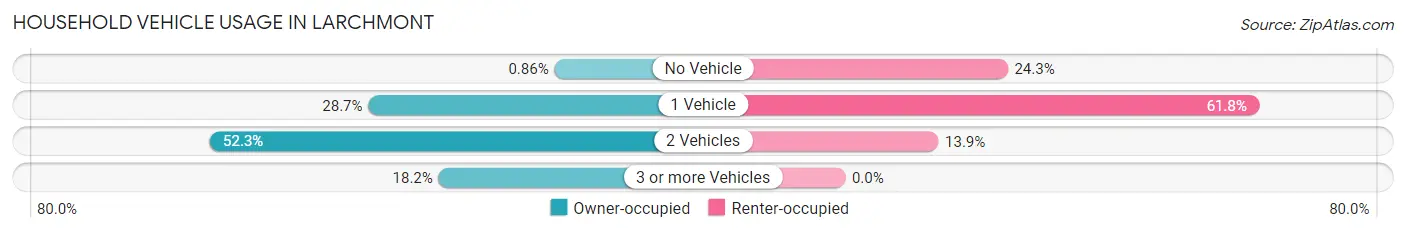
| Vehicles per Household | Owner-occupied | Renter-occupied |
| No Vehicle | 14 (0.9%) | 143 (24.3%) |
| 1 Vehicle | 464 (28.7%) | 364 (61.8%) |
| 2 Vehicles | 847 (52.3%) | 82 (13.9%) |
| 3 or more Vehicles | 294 (18.2%) | 0 (0.0%) |
| Total | 1,619 (100.0%) | 589 (100.0%) |
Real Estate & Mortgages in Larchmont
Real Estate and Mortgage Overview in Larchmont
| Characteristic | Without Mortgage | With Mortgage |
| Housing Units | 571 | 1,048 |
| Median Property Value | $1,523,800 | $1,260,100 |
| Median Household Income | - | - |
| Monthly Housing Costs | $1,501 | $858 |
| Real Estate Taxes | $10,001 | $0 |
Property Value by Mortgage Status in Larchmont
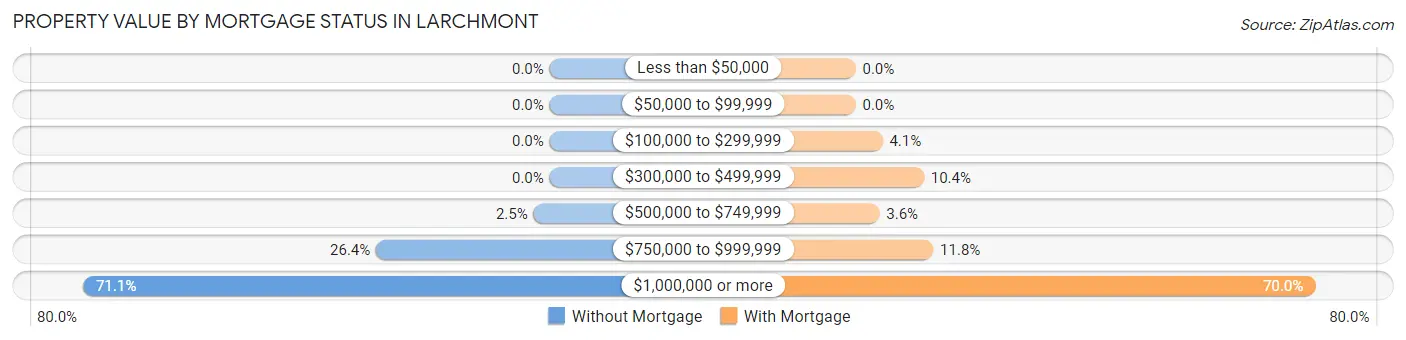
| Property Value | Without Mortgage | With Mortgage |
| Less than $50,000 | 0 (0.0%) | 0 (0.0%) |
| $50,000 to $99,999 | 0 (0.0%) | 0 (0.0%) |
| $100,000 to $299,999 | 0 (0.0%) | 43 (4.1%) |
| $300,000 to $499,999 | 0 (0.0%) | 109 (10.4%) |
| $500,000 to $749,999 | 14 (2.5%) | 38 (3.6%) |
| $750,000 to $999,999 | 151 (26.4%) | 124 (11.8%) |
| $1,000,000 or more | 406 (71.1%) | 734 (70.0%) |
| Total | 571 (100.0%) | 1,048 (100.0%) |
Household Income by Mortgage Status in Larchmont
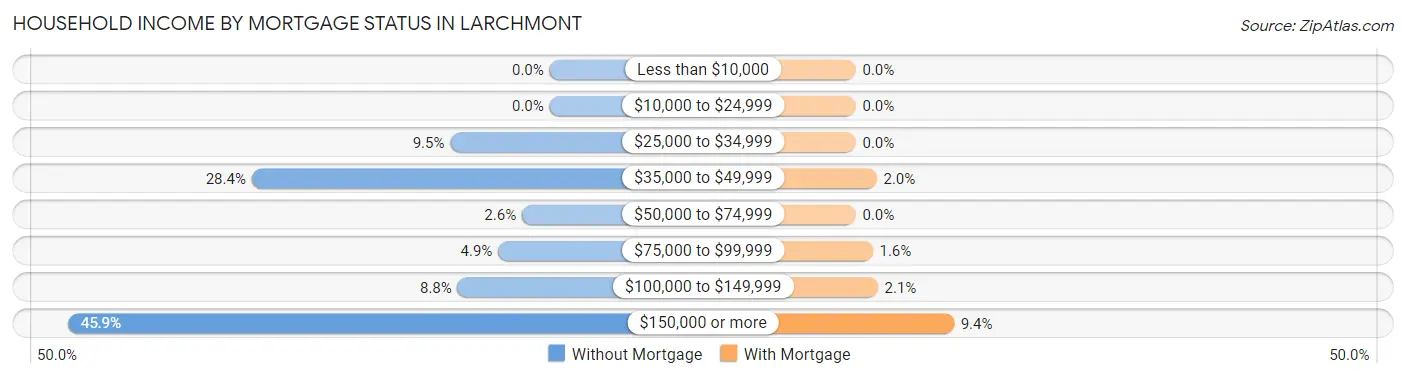
| Household Income | Without Mortgage | With Mortgage |
| Less than $10,000 | 0 (0.0%) | 0 (0.0%) |
| $10,000 to $24,999 | 0 (0.0%) | 0 (0.0%) |
| $25,000 to $34,999 | 54 (9.5%) | 0 (0.0%) |
| $35,000 to $49,999 | 162 (28.4%) | 21 (2.0%) |
| $50,000 to $74,999 | 15 (2.6%) | 0 (0.0%) |
| $75,000 to $99,999 | 28 (4.9%) | 17 (1.6%) |
| $100,000 to $149,999 | 50 (8.8%) | 22 (2.1%) |
| $150,000 or more | 262 (45.9%) | 98 (9.3%) |
| Total | 571 (100.0%) | 1,048 (100.0%) |
Property Value to Household Income Ratio in Larchmont
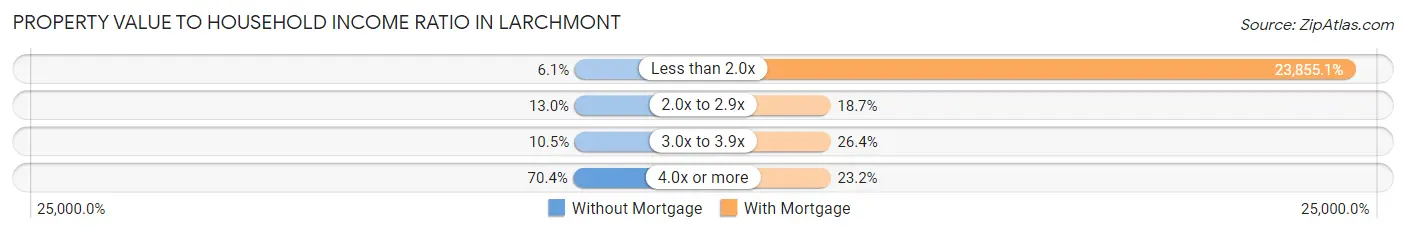
| Value-to-Income Ratio | Without Mortgage | With Mortgage |
| Less than 2.0x | 35 (6.1%) | 250,001 (23,855.1%) |
| 2.0x to 2.9x | 74 (13.0%) | 196 (18.7%) |
| 3.0x to 3.9x | 60 (10.5%) | 277 (26.4%) |
| 4.0x or more | 402 (70.4%) | 243 (23.2%) |
| Total | 571 (100.0%) | 1,048 (100.0%) |
Real Estate Taxes by Mortgage Status in Larchmont
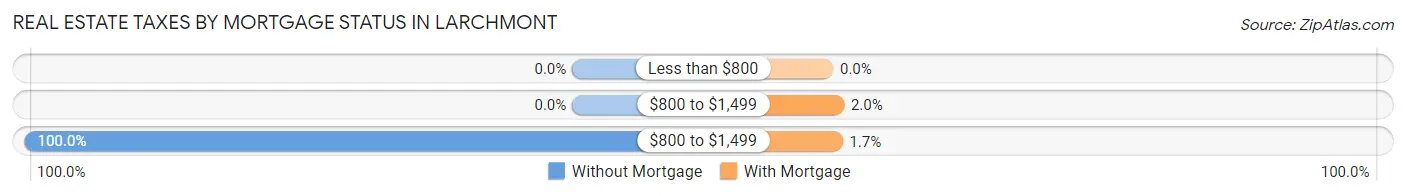
| Property Taxes | Without Mortgage | With Mortgage |
| Less than $800 | 0 (0.0%) | 0 (0.0%) |
| $800 to $1,499 | 0 (0.0%) | 21 (2.0%) |
| $800 to $1,499 | 571 (100.0%) | 18 (1.7%) |
| Total | 571 (100.0%) | 1,048 (100.0%) |
Health & Disability in Larchmont
Health Insurance Coverage by Age in Larchmont
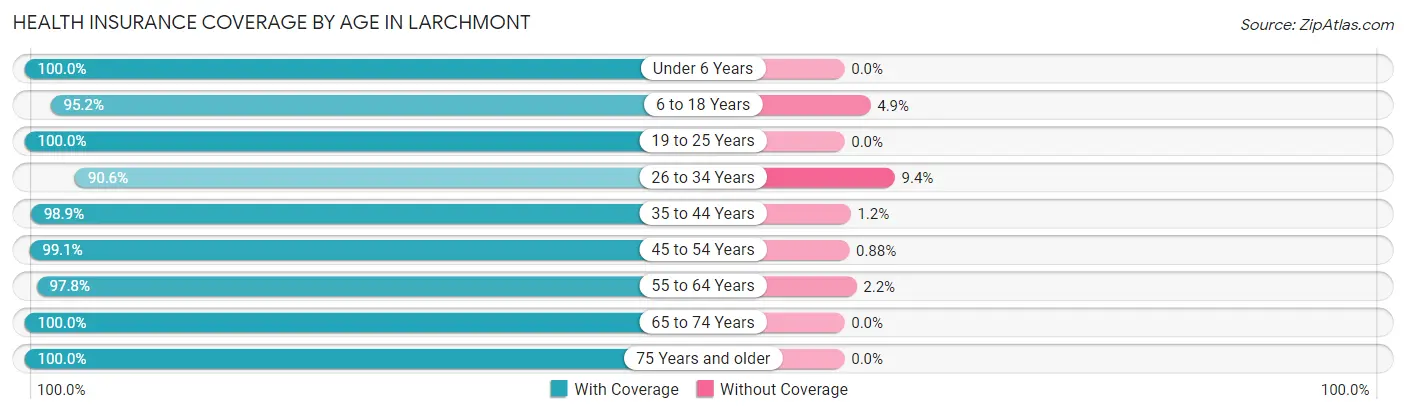
| Age Bracket | With Coverage | Without Coverage |
| Under 6 Years | 649 (100.0%) | 0 (0.0%) |
| 6 to 18 Years | 1,374 (95.2%) | 70 (4.9%) |
| 19 to 25 Years | 230 (100.0%) | 0 (0.0%) |
| 26 to 34 Years | 734 (90.6%) | 76 (9.4%) |
| 35 to 44 Years | 1,113 (98.9%) | 13 (1.1%) |
| 45 to 54 Years | 902 (99.1%) | 8 (0.9%) |
| 55 to 64 Years | 828 (97.8%) | 19 (2.2%) |
| 65 to 74 Years | 219 (100.0%) | 0 (0.0%) |
| 75 Years and older | 314 (100.0%) | 0 (0.0%) |
| Total | 6,363 (97.2%) | 186 (2.8%) |
Health Insurance Coverage by Citizenship Status in Larchmont
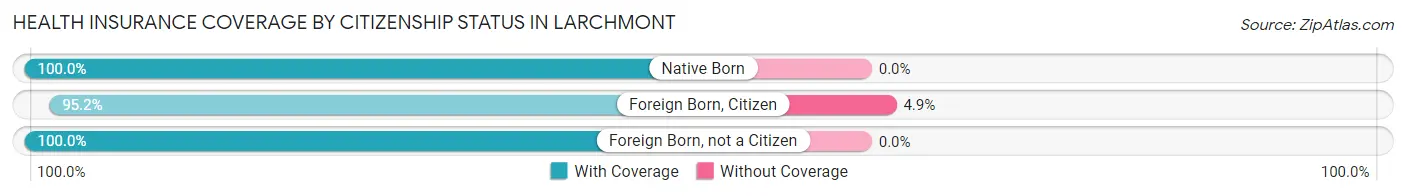
| Citizenship Status | With Coverage | Without Coverage |
| Native Born | 649 (100.0%) | 0 (0.0%) |
| Foreign Born, Citizen | 1,374 (95.2%) | 70 (4.9%) |
| Foreign Born, not a Citizen | 230 (100.0%) | 0 (0.0%) |
Health Insurance Coverage by Household Income in Larchmont
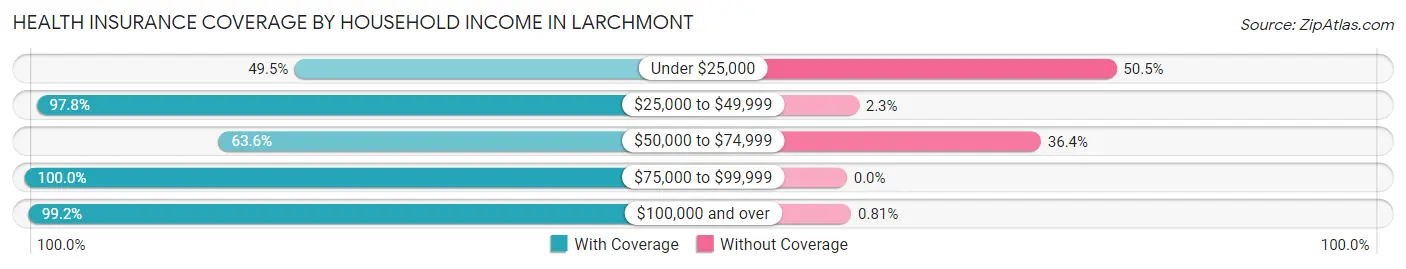
| Household Income | With Coverage | Without Coverage |
| Under $25,000 | 49 (49.5%) | 50 (50.5%) |
| $25,000 to $49,999 | 827 (97.8%) | 19 (2.2%) |
| $50,000 to $74,999 | 133 (63.6%) | 76 (36.4%) |
| $75,000 to $99,999 | 320 (100.0%) | 0 (0.0%) |
| $100,000 and over | 5,018 (99.2%) | 41 (0.8%) |
Public vs Private Health Insurance Coverage by Age in Larchmont
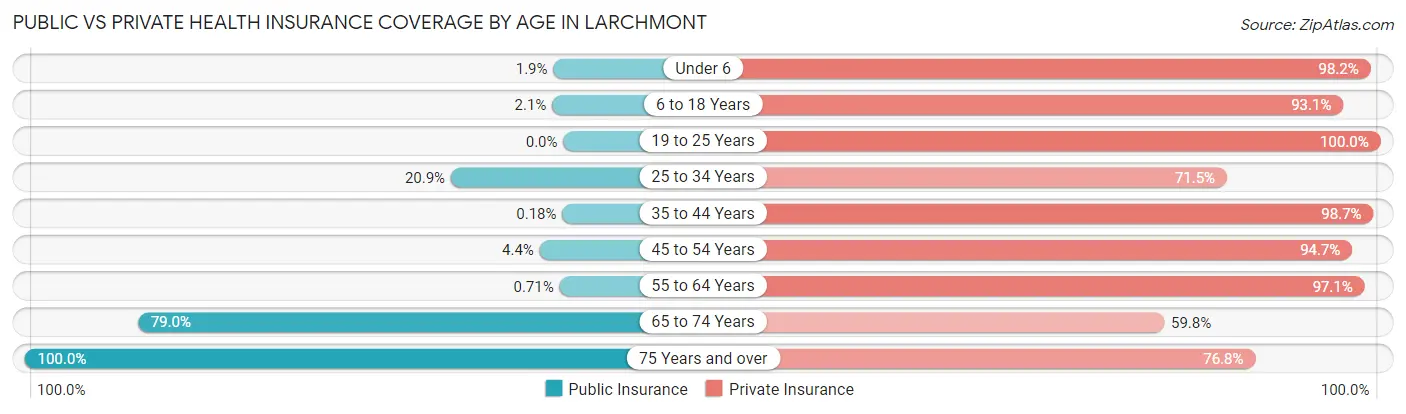
| Age Bracket | Public Insurance | Private Insurance |
| Under 6 | 12 (1.8%) | 637 (98.2%) |
| 6 to 18 Years | 30 (2.1%) | 1,344 (93.1%) |
| 19 to 25 Years | 0 (0.0%) | 230 (100.0%) |
| 25 to 34 Years | 169 (20.9%) | 579 (71.5%) |
| 35 to 44 Years | 2 (0.2%) | 1,111 (98.7%) |
| 45 to 54 Years | 40 (4.4%) | 862 (94.7%) |
| 55 to 64 Years | 6 (0.7%) | 822 (97.1%) |
| 65 to 74 Years | 173 (79.0%) | 131 (59.8%) |
| 75 Years and over | 314 (100.0%) | 241 (76.7%) |
| Total | 746 (11.4%) | 5,957 (91.0%) |
Disability Status by Sex by Age in Larchmont
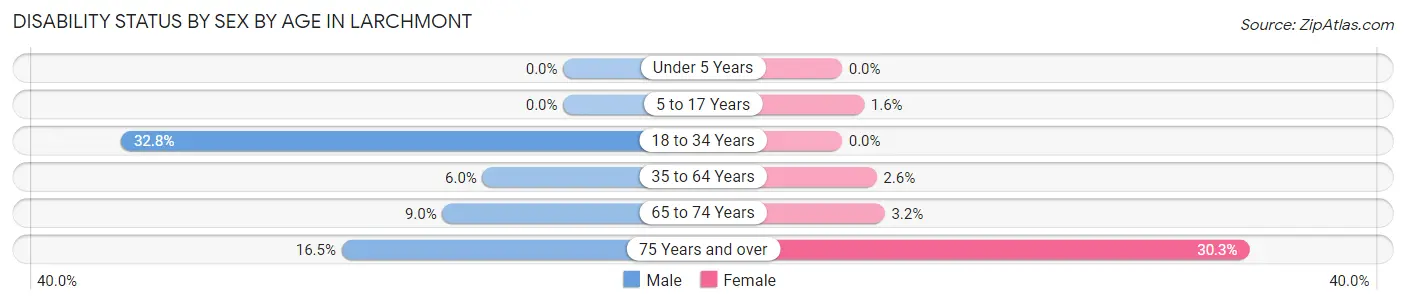
| Age Bracket | Male | Female |
| Under 5 Years | 0 (0.0%) | 0 (0.0%) |
| 5 to 17 Years | 0 (0.0%) | 13 (1.6%) |
| 18 to 34 Years | 155 (32.8%) | 0 (0.0%) |
| 35 to 64 Years | 82 (6.0%) | 39 (2.6%) |
| 65 to 74 Years | 14 (9.0%) | 2 (3.2%) |
| 75 Years and over | 25 (16.5%) | 49 (30.2%) |
Disability Class by Sex by Age in Larchmont
Disability Class: Hearing Difficulty
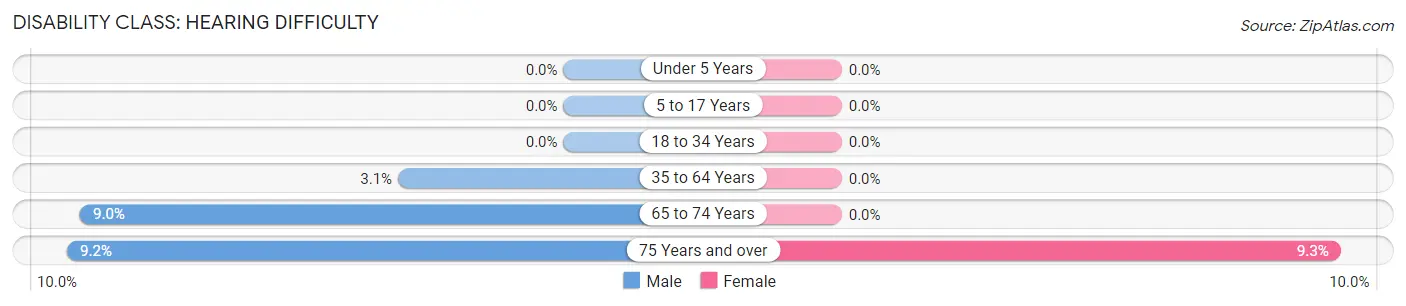
| Age Bracket | Male | Female |
| Under 5 Years | 0 (0.0%) | 0 (0.0%) |
| 5 to 17 Years | 0 (0.0%) | 0 (0.0%) |
| 18 to 34 Years | 0 (0.0%) | 0 (0.0%) |
| 35 to 64 Years | 42 (3.1%) | 0 (0.0%) |
| 65 to 74 Years | 14 (9.0%) | 0 (0.0%) |
| 75 Years and over | 14 (9.2%) | 15 (9.3%) |
Disability Class: Vision Difficulty
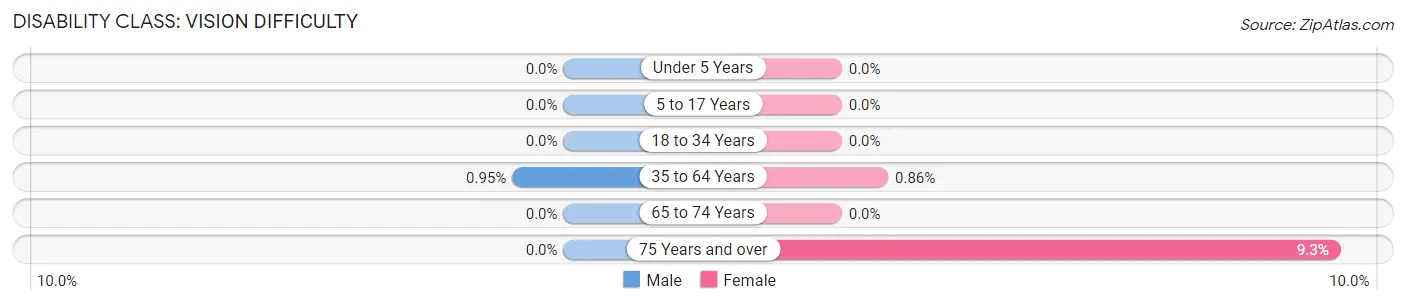
| Age Bracket | Male | Female |
| Under 5 Years | 0 (0.0%) | 0 (0.0%) |
| 5 to 17 Years | 0 (0.0%) | 0 (0.0%) |
| 18 to 34 Years | 0 (0.0%) | 0 (0.0%) |
| 35 to 64 Years | 13 (0.9%) | 13 (0.9%) |
| 65 to 74 Years | 0 (0.0%) | 0 (0.0%) |
| 75 Years and over | 0 (0.0%) | 15 (9.3%) |
Disability Class: Cognitive Difficulty
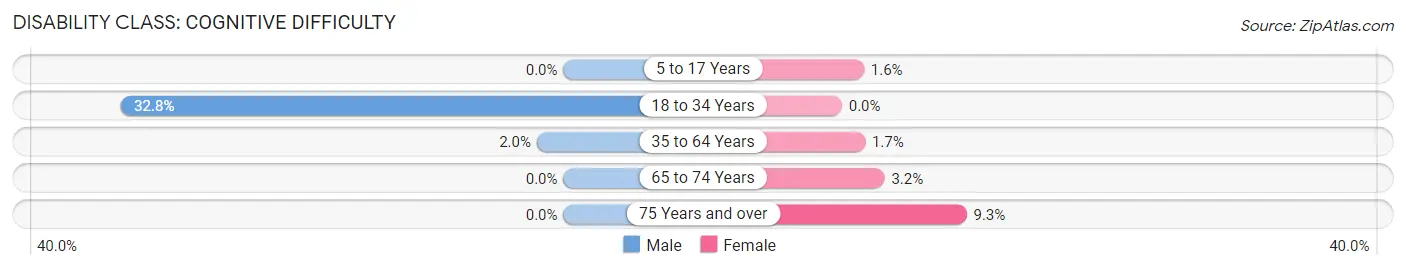
| Age Bracket | Male | Female |
| 5 to 17 Years | 0 (0.0%) | 13 (1.6%) |
| 18 to 34 Years | 155 (32.8%) | 0 (0.0%) |
| 35 to 64 Years | 27 (2.0%) | 26 (1.7%) |
| 65 to 74 Years | 0 (0.0%) | 2 (3.2%) |
| 75 Years and over | 0 (0.0%) | 15 (9.3%) |
Disability Class: Ambulatory Difficulty
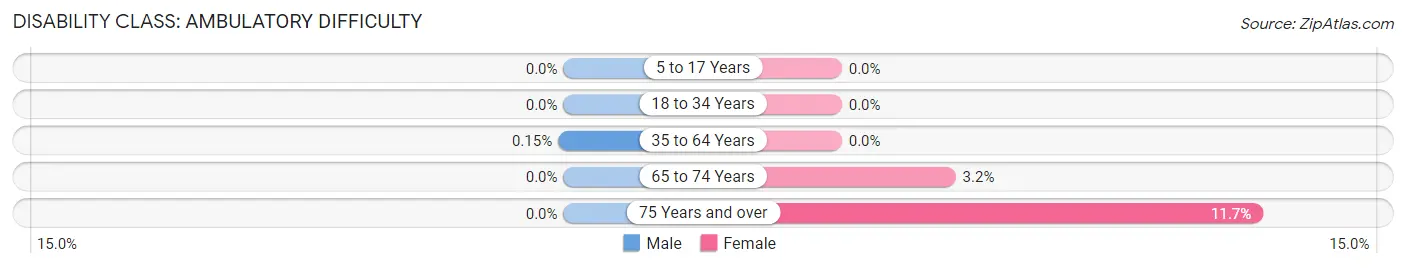
| Age Bracket | Male | Female |
| 5 to 17 Years | 0 (0.0%) | 0 (0.0%) |
| 18 to 34 Years | 0 (0.0%) | 0 (0.0%) |
| 35 to 64 Years | 2 (0.2%) | 0 (0.0%) |
| 65 to 74 Years | 0 (0.0%) | 2 (3.2%) |
| 75 Years and over | 0 (0.0%) | 19 (11.7%) |
Disability Class: Self-Care Difficulty
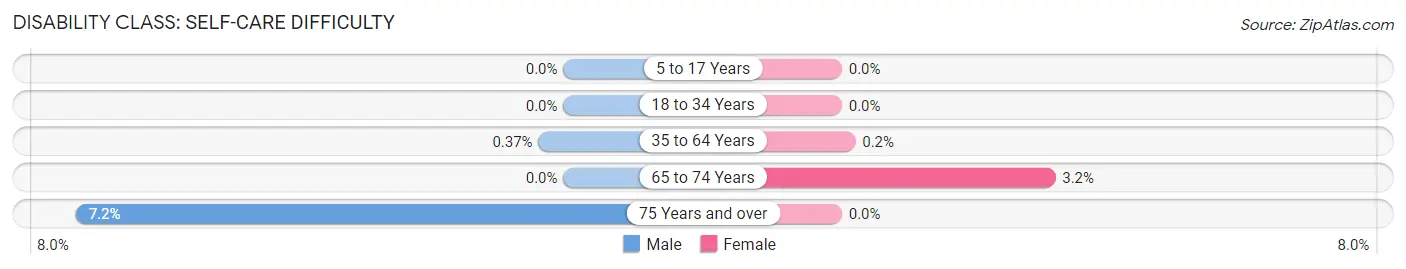
| Age Bracket | Male | Female |
| 5 to 17 Years | 0 (0.0%) | 0 (0.0%) |
| 18 to 34 Years | 0 (0.0%) | 0 (0.0%) |
| 35 to 64 Years | 5 (0.4%) | 3 (0.2%) |
| 65 to 74 Years | 0 (0.0%) | 2 (3.2%) |
| 75 Years and over | 11 (7.2%) | 0 (0.0%) |
Technology Access in Larchmont
Computing Device Access in Larchmont
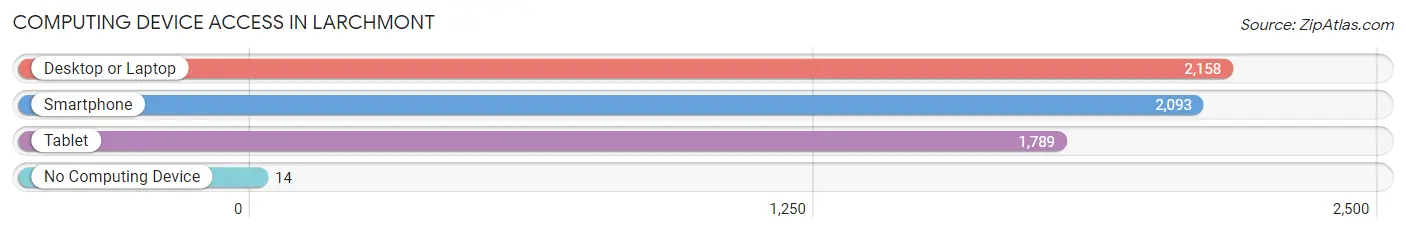
| Device Type | # Households | % Households |
| Desktop or Laptop | 2,158 | 97.7% |
| Smartphone | 2,093 | 94.8% |
| Tablet | 1,789 | 81.0% |
| No Computing Device | 14 | 0.6% |
| Total | 2,208 | 100.0% |
Internet Access in Larchmont
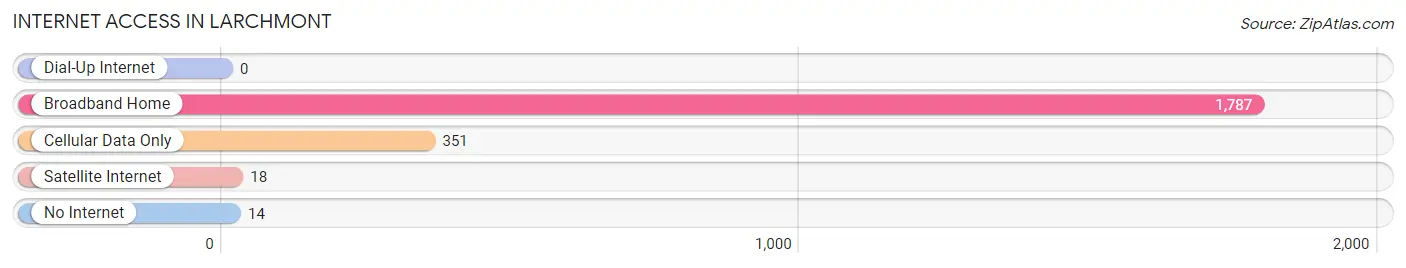
| Internet Type | # Households | % Households |
| Dial-Up Internet | 0 | 0.0% |
| Broadband Home | 1,787 | 80.9% |
| Cellular Data Only | 351 | 15.9% |
| Satellite Internet | 18 | 0.8% |
| No Internet | 14 | 0.6% |
| Total | 2,208 | 100.0% |
Larchmont Summary
Larchmont is a village located in Westchester County, New York, United States. It is situated on the Long Island Sound, about 18 miles northeast of Manhattan. The village has a population of 6,485 as of the 2010 census.
History
Larchmont was first settled in 1614 by the Dutch, who named it Mamaroneck. The name was changed to Larchmont in 1891, after the larch trees that grew in the area. The village was incorporated in 1891.
In the late 19th century, Larchmont became a popular summer resort for wealthy New Yorkers. The village was home to many grand estates, including the estate of William K. Vanderbilt, which is now the Larchmont Yacht Club.
Geography
Larchmont is located at 40°57'N 73°45'W (40.95, -73.75). According to the United States Census Bureau, the village has a total area of 1.2 square miles (3.1 km2), all of it land.
The village is bordered by the city of New Rochelle to the north, the village of Mamaroneck to the east, and the Long Island Sound to the south and west.
Economy
Larchmont is a primarily residential community, with a small commercial district along Larchmont Avenue. The village is home to several small businesses, including restaurants, boutiques, and professional services.
The village is also home to the Larchmont Yacht Club, which was founded in 1891. The club hosts several sailing regattas each year, and is a popular destination for sailing enthusiasts.
Demographics
As of the 2010 census, there were 6,485 people, 2,541 households, and 1,817 families residing in the village. The population density was 5,400 people per square mile (2,093/km2). There were 2,717 housing units at an average density of 2,250 per square mile (871/km2). The racial makeup of the village was 87.2% White, 4.2% African American, 0.1% Native American, 5.3% Asian, 0.0% Pacific Islander, 1.2% from other races, and 2.0% from two or more races. Hispanic or Latino of any race were 5.7% of the population.
There were 2,541 households, out of which 33.2% had children under the age of 18 living with them, 59.2% were married couples living together, 8.7% had a female householder with no husband present, and 29.2% were non-families. 24.3% of all households were made up of individuals, and 11.7% had someone living alone who was 65 years of age or older. The average household size was 2.55 and the average family size was 3.08.
In the village, the population was spread out, with 24.2% under the age of 18, 4.2% from 18 to 24, 24.2% from 25 to 44, 29.2% from 45 to 64, and 18.2% who were 65 years of age or older. The median age was 43 years. For every 100 females, there were 91.2 males. For every 100 females age 18 and over, there were 87.2 males.
The median income for a household in the village was $117,837, and the median income for a family was $150,917. Males had a median income of $100,000 versus $60,000 for females. The per capita income for the village was $68,945. About 2.2% of families and 3.7% of the population were below the poverty line, including 3.3% of those under age 18 and 4.2% of those age 65 or over.
Common Questions
What is Per Capita Income in Larchmont?
Per Capita income in Larchmont is $115,372.
What is the Median Family Income in Larchmont?
Median Family Income in Larchmont is $250,001.
What is the Median Household income in Larchmont?
Median Household Income in Larchmont is $220,714.
What is Income or Wage Gap in Larchmont?
Income or Wage Gap in Larchmont is 66.6%.
Women in Larchmont earn 33.4 cents for every dollar earned by a man.
What is Inequality or Gini Index in Larchmont?
Inequality or Gini Index in Larchmont is 0.54.
What is the Total Population of Larchmont?
Total Population of Larchmont is 6,549.
What is the Total Male Population of Larchmont?
Total Male Population of Larchmont is 3,289.
What is the Total Female Population of Larchmont?
Total Female Population of Larchmont is 3,260.
What is the Ratio of Males per 100 Females in Larchmont?
There are 100.89 Males per 100 Females in Larchmont.
What is the Ratio of Females per 100 Males in Larchmont?
There are 99.12 Females per 100 Males in Larchmont.
What is the Median Population Age in Larchmont?
Median Population Age in Larchmont is 37.7 Years.
What is the Average Family Size in Larchmont
Average Family Size in Larchmont is 3.6 People.
What is the Average Household Size in Larchmont
Average Household Size in Larchmont is 3.0 People.
How Large is the Labor Force in Larchmont?
There are 3,220 People in the Labor Forcein in Larchmont.
What is the Percentage of People in the Labor Force in Larchmont?
68.6% of People are in the Labor Force in Larchmont.
What is the Unemployment Rate in Larchmont?
Unemployment Rate in Larchmont is 10.3%.