Old Brookville, NY Map & Demographics
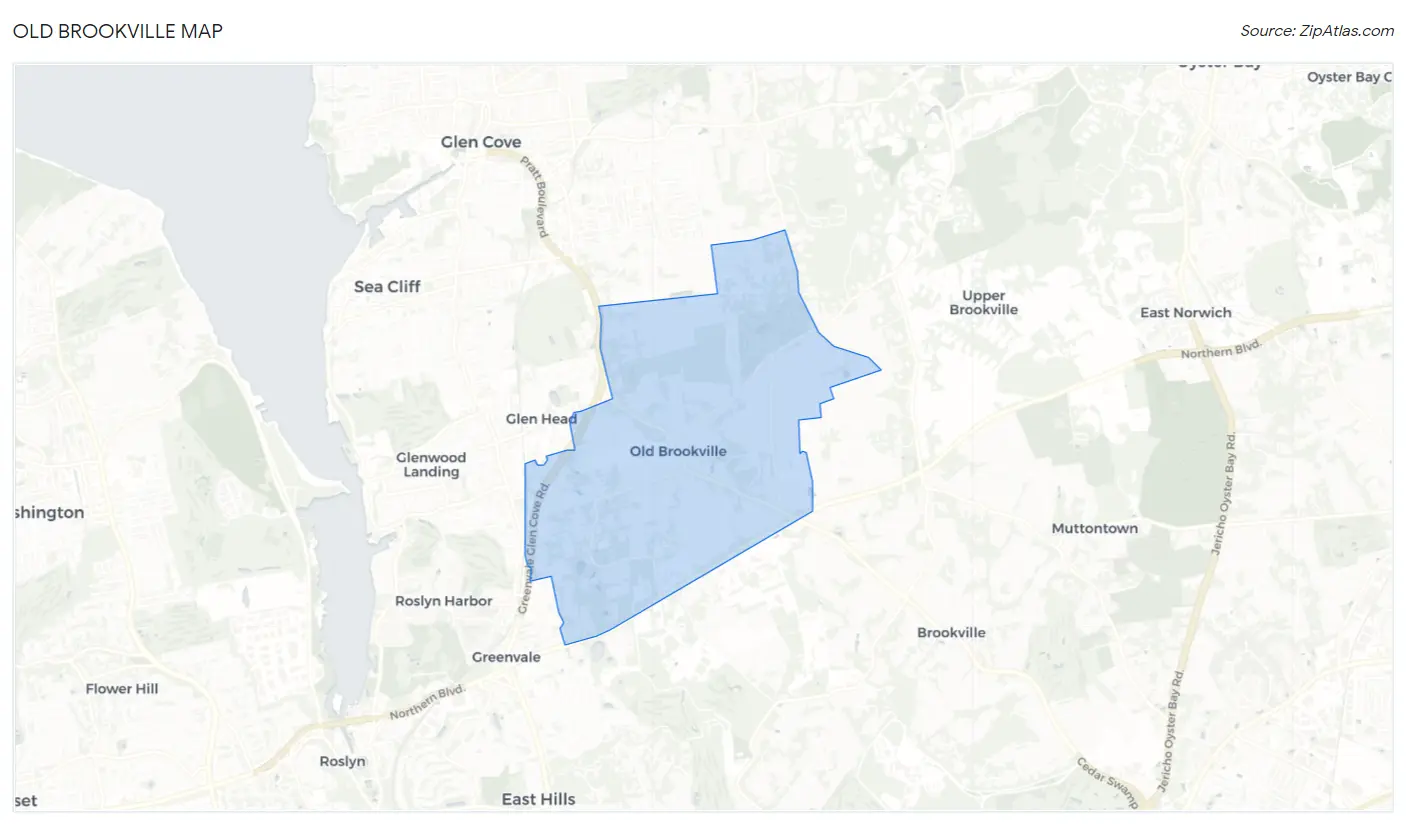
Old Brookville Map
Old Brookville Overview
$133,486
PER CAPITA INCOME
$189,833
AVG FAMILY INCOME
$188,092
AVG HOUSEHOLD INCOME
43.7%
WAGE / INCOME GAP [ % ]
56.3¢/ $1
WAGE / INCOME GAP [ $ ]
0.55
INEQUALITY / GINI INDEX
1,834
TOTAL POPULATION
949
MALE POPULATION
885
FEMALE POPULATION
107.23
MALES / 100 FEMALES
93.26
FEMALES / 100 MALES
48.3
MEDIAN AGE
3.2
AVG FAMILY SIZE
3.0
AVG HOUSEHOLD SIZE
872
LABOR FORCE [ PEOPLE ]
60.2%
PERCENT IN LABOR FORCE
3.2%
UNEMPLOYMENT RATE
Income in Old Brookville
Income Overview in Old Brookville
Per Capita Income in Old Brookville is $133,486, while median incomes of families and households are $189,833 and $188,092 respectively.
| Characteristic | Number | Measure |
| Per Capita Income | 1,834 | $133,486 |
| Median Family Income | 550 | $189,833 |
| Mean Family Income | 550 | $415,524 |
| Median Household Income | 605 | $188,092 |
| Mean Household Income | 605 | $391,138 |
| Income Deficit | 550 | $0 |
| Wage / Income Gap (%) | 1,834 | 43.75% |
| Wage / Income Gap ($) | 1,834 | 56.25¢ per $1 |
| Gini / Inequality Index | 1,834 | 0.55 |
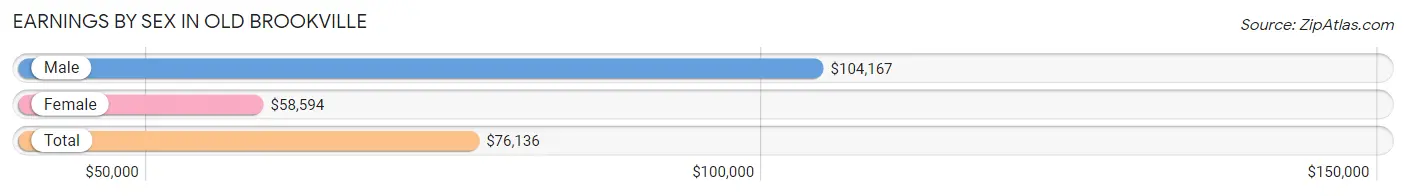
Earnings by Sex in Old Brookville
Average Earnings in Old Brookville are $76,136, $104,167 for men and $58,594 for women, a difference of 43.8%.
| Sex | Number | Average Earnings |
| Male | 488 (53.3%) | $104,167 |
| Female | 428 (46.7%) | $58,594 |
| Total | 916 (100.0%) | $76,136 |
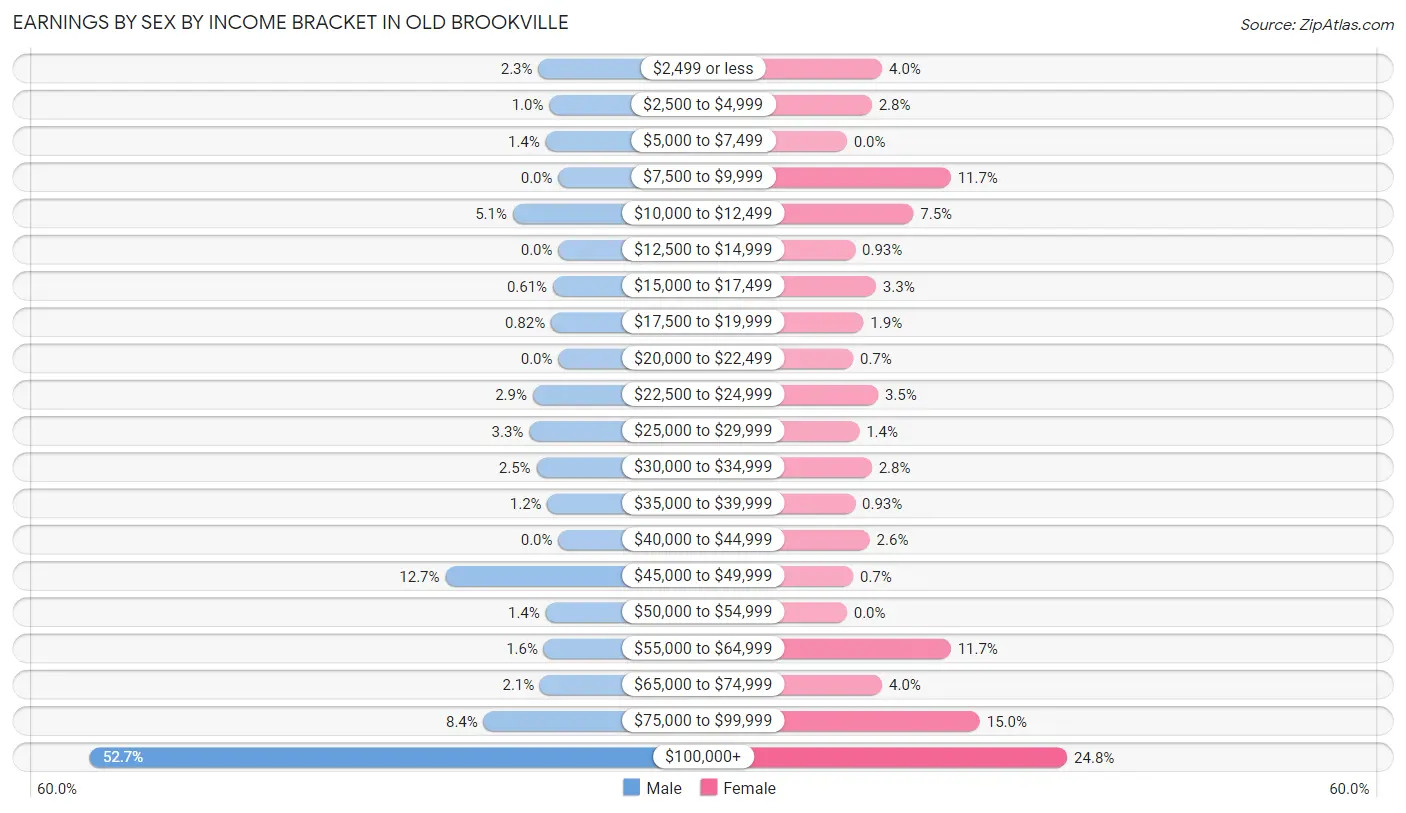
Earnings by Sex by Income Bracket in Old Brookville
The most common earnings brackets in Old Brookville are $100,000+ for men (257 | 52.7%) and $100,000+ for women (106 | 24.8%).
| Income | Male | Female |
| $2,499 or less | 11 (2.2%) | 17 (4.0%) |
| $2,500 to $4,999 | 5 (1.0%) | 12 (2.8%) |
| $5,000 to $7,499 | 7 (1.4%) | 0 (0.0%) |
| $7,500 to $9,999 | 0 (0.0%) | 50 (11.7%) |
| $10,000 to $12,499 | 25 (5.1%) | 32 (7.5%) |
| $12,500 to $14,999 | 0 (0.0%) | 4 (0.9%) |
| $15,000 to $17,499 | 3 (0.6%) | 14 (3.3%) |
| $17,500 to $19,999 | 4 (0.8%) | 8 (1.9%) |
| $20,000 to $22,499 | 0 (0.0%) | 3 (0.7%) |
| $22,500 to $24,999 | 14 (2.9%) | 15 (3.5%) |
| $25,000 to $29,999 | 16 (3.3%) | 6 (1.4%) |
| $30,000 to $34,999 | 12 (2.5%) | 12 (2.8%) |
| $35,000 to $39,999 | 6 (1.2%) | 4 (0.9%) |
| $40,000 to $44,999 | 0 (0.0%) | 11 (2.6%) |
| $45,000 to $49,999 | 62 (12.7%) | 3 (0.7%) |
| $50,000 to $54,999 | 7 (1.4%) | 0 (0.0%) |
| $55,000 to $64,999 | 8 (1.6%) | 50 (11.7%) |
| $65,000 to $74,999 | 10 (2.1%) | 17 (4.0%) |
| $75,000 to $99,999 | 41 (8.4%) | 64 (14.9%) |
| $100,000+ | 257 (52.7%) | 106 (24.8%) |
| Total | 488 (100.0%) | 428 (100.0%) |
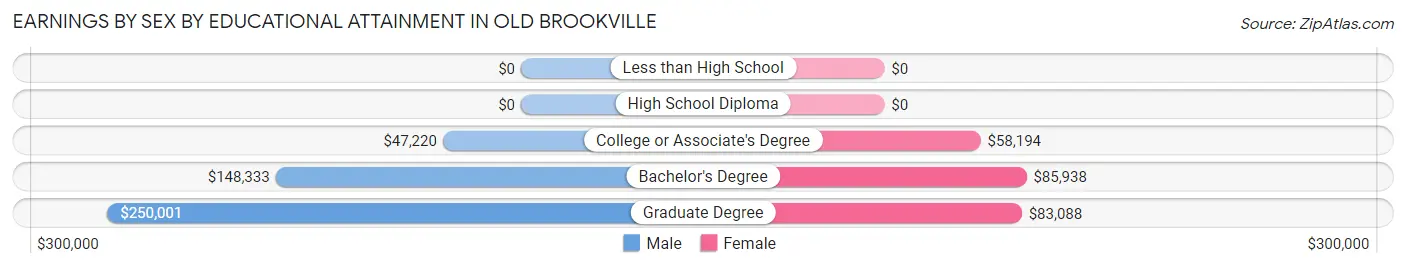
Earnings by Sex by Educational Attainment in Old Brookville
Average earnings in Old Brookville are $136,250 for men and $67,778 for women, a difference of 50.2%. Men with an educational attainment of graduate degree enjoy the highest average annual earnings of $250,001, while those with college or associate's degree education earn the least with $47,220. Women with an educational attainment of bachelor's degree earn the most with the average annual earnings of $85,938, while those with college or associate's degree education have the smallest earnings of $58,194.
| Educational Attainment | Male Income | Female Income |
| Less than High School | - | - |
| High School Diploma | - | - |
| College or Associate's Degree | $47,220 | $58,194 |
| Bachelor's Degree | $148,333 | $85,938 |
| Graduate Degree | $250,001 | $83,088 |
| Total | $136,250 | $67,778 |
Family Income in Old Brookville
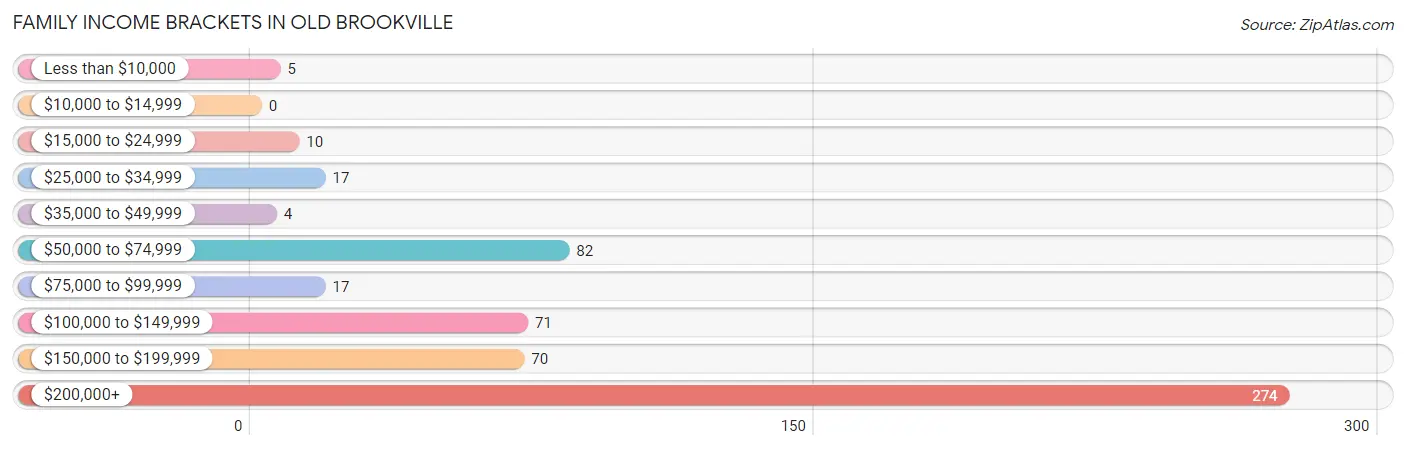
Family Income Brackets in Old Brookville
According to the Old Brookville family income data, there are 274 families falling into the $200,000+ income range, which is the most common income bracket and makes up 49.8% of all families.
| Income Bracket | # Families | % Families |
| Less than $10,000 | 5 | 0.9% |
| $10,000 to $14,999 | 0 | 0.0% |
| $15,000 to $24,999 | 10 | 1.8% |
| $25,000 to $34,999 | 17 | 3.1% |
| $35,000 to $49,999 | 4 | 0.7% |
| $50,000 to $74,999 | 82 | 14.9% |
| $75,000 to $99,999 | 17 | 3.1% |
| $100,000 to $149,999 | 71 | 12.9% |
| $150,000 to $199,999 | 70 | 12.7% |
| $200,000+ | 274 | 49.8% |
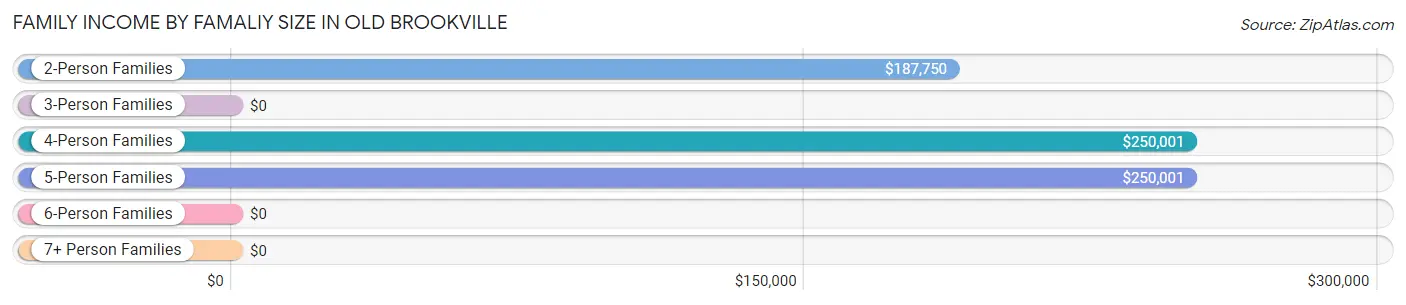
Family Income by Famaliy Size in Old Brookville
4-person families (103 | 18.7%) account for the highest median family income in Old Brookville with $250,001 per family, while 2-person families (199 | 36.2%) have the highest median income of $93,875 per family member.
| Income Bracket | # Families | Median Income |
| 2-Person Families | 199 (36.2%) | $187,750 |
| 3-Person Families | 174 (31.6%) | $0 |
| 4-Person Families | 103 (18.7%) | $250,001 |
| 5-Person Families | 65 (11.8%) | $250,001 |
| 6-Person Families | 9 (1.6%) | $0 |
| 7+ Person Families | 0 (0.0%) | $0 |
| Total | 550 (100.0%) | $189,833 |
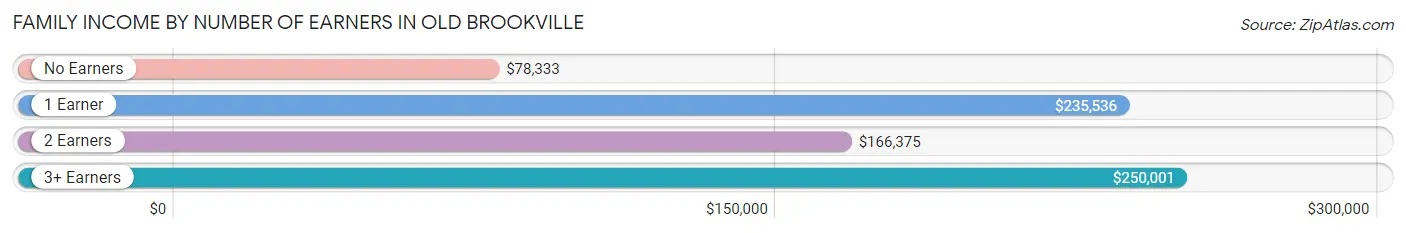
Family Income by Number of Earners in Old Brookville
The median family income in Old Brookville is $189,833, with families comprising 3+ earners (44) having the highest median family income of $250,001, while families with no earners (40) have the lowest median family income of $78,333, accounting for 8.0% and 7.3% of families, respectively.
| Number of Earners | # Families | Median Income |
| No Earners | 40 (7.3%) | $78,333 |
| 1 Earner | 203 (36.9%) | $235,536 |
| 2 Earners | 263 (47.8%) | $166,375 |
| 3+ Earners | 44 (8.0%) | $250,001 |
| Total | 550 (100.0%) | $189,833 |
Household Income in Old Brookville
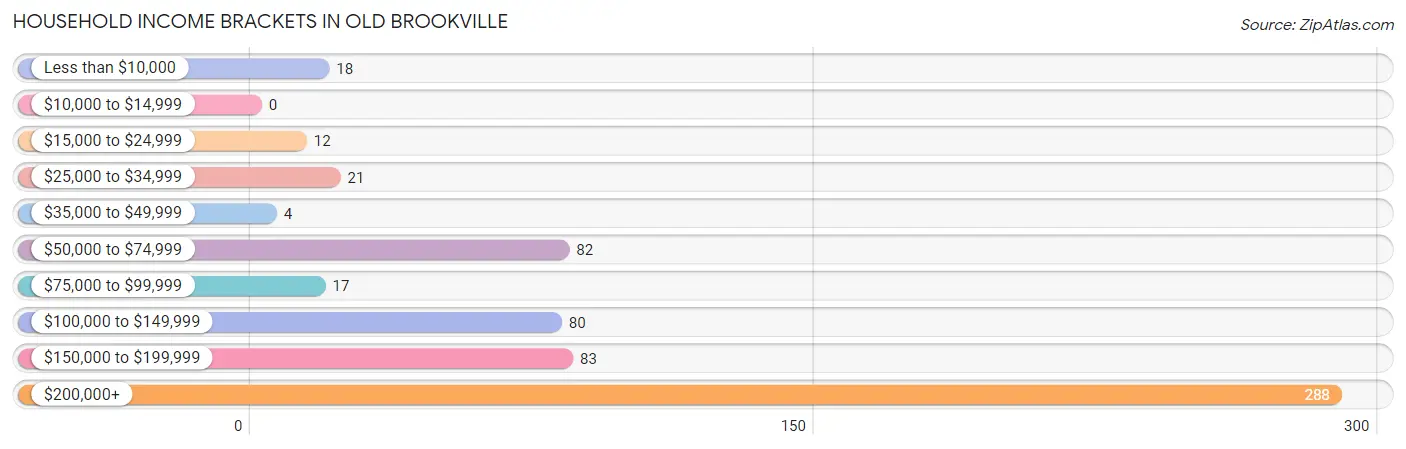
Household Income Brackets in Old Brookville
With 288 households falling in the category, the $200,000+ income range is the most frequent in Old Brookville, accounting for 47.6% of all households.
| Income Bracket | # Households | % Households |
| Less than $10,000 | 18 | 3.0% |
| $10,000 to $14,999 | 0 | 0.0% |
| $15,000 to $24,999 | 12 | 2.0% |
| $25,000 to $34,999 | 21 | 3.5% |
| $35,000 to $49,999 | 4 | 0.7% |
| $50,000 to $74,999 | 82 | 13.6% |
| $75,000 to $99,999 | 17 | 2.8% |
| $100,000 to $149,999 | 80 | 13.2% |
| $150,000 to $199,999 | 83 | 13.7% |
| $200,000+ | 288 | 47.6% |
Household Income by Householder Age in Old Brookville
The median household income in Old Brookville is $188,092, with the highest median household income of $250,001 found in the 25 to 44 years age bracket for the primary householder. A total of 63 households (10.4%) fall into this category.
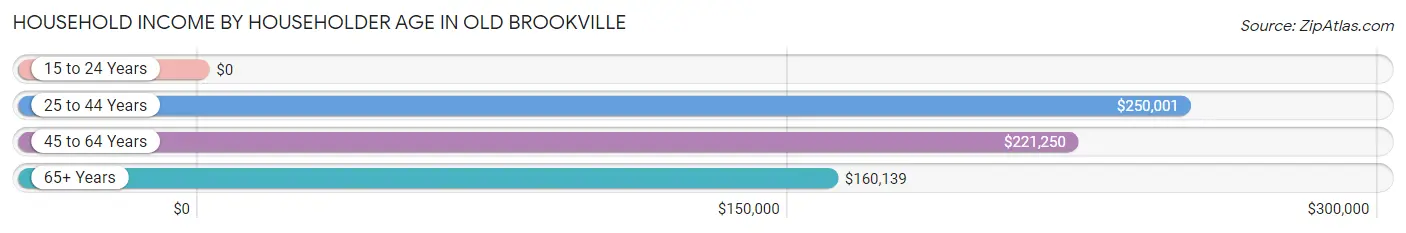
| Income Bracket | # Households | Median Income |
| 15 to 24 Years | 0 (0.0%) | $0 |
| 25 to 44 Years | 63 (10.4%) | $250,001 |
| 45 to 64 Years | 301 (49.7%) | $221,250 |
| 65+ Years | 241 (39.8%) | $160,139 |
| Total | 605 (100.0%) | $188,092 |
Poverty in Old Brookville
Income Below Poverty by Sex and Age in Old Brookville
With 3.5% poverty level for males and 1.0% for females among the residents of Old Brookville, 12 to 14 year old males and 45 to 54 year old females are the most vulnerable to poverty, with 6 males (14.6%) and 4 females (4.0%) in their respective age groups living below the poverty level.
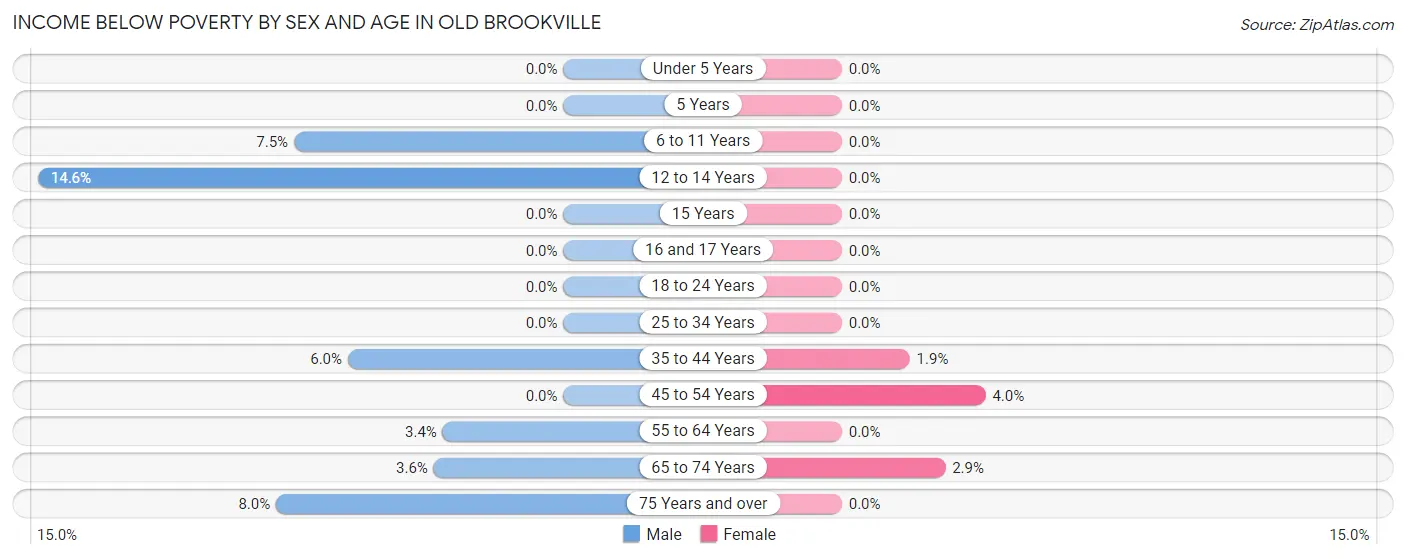
| Age Bracket | Male | Female |
| Under 5 Years | 0 (0.0%) | 0 (0.0%) |
| 5 Years | 0 (0.0%) | 0 (0.0%) |
| 6 to 11 Years | 6 (7.5%) | 0 (0.0%) |
| 12 to 14 Years | 6 (14.6%) | 0 (0.0%) |
| 15 Years | 0 (0.0%) | 0 (0.0%) |
| 16 and 17 Years | 0 (0.0%) | 0 (0.0%) |
| 18 to 24 Years | 0 (0.0%) | 0 (0.0%) |
| 25 to 34 Years | 0 (0.0%) | 0 (0.0%) |
| 35 to 44 Years | 3 (6.0%) | 2 (1.9%) |
| 45 to 54 Years | 0 (0.0%) | 4 (4.0%) |
| 55 to 64 Years | 5 (3.4%) | 0 (0.0%) |
| 65 to 74 Years | 3 (3.6%) | 3 (2.9%) |
| 75 Years and over | 10 (8.0%) | 0 (0.0%) |
| Total | 33 (3.5%) | 9 (1.0%) |
Income Above Poverty by Sex and Age in Old Brookville
According to the poverty statistics in Old Brookville, males aged under 5 years and females aged under 5 years are the age groups that are most secure financially, with 100.0% of males and 100.0% of females in these age groups living above the poverty line.
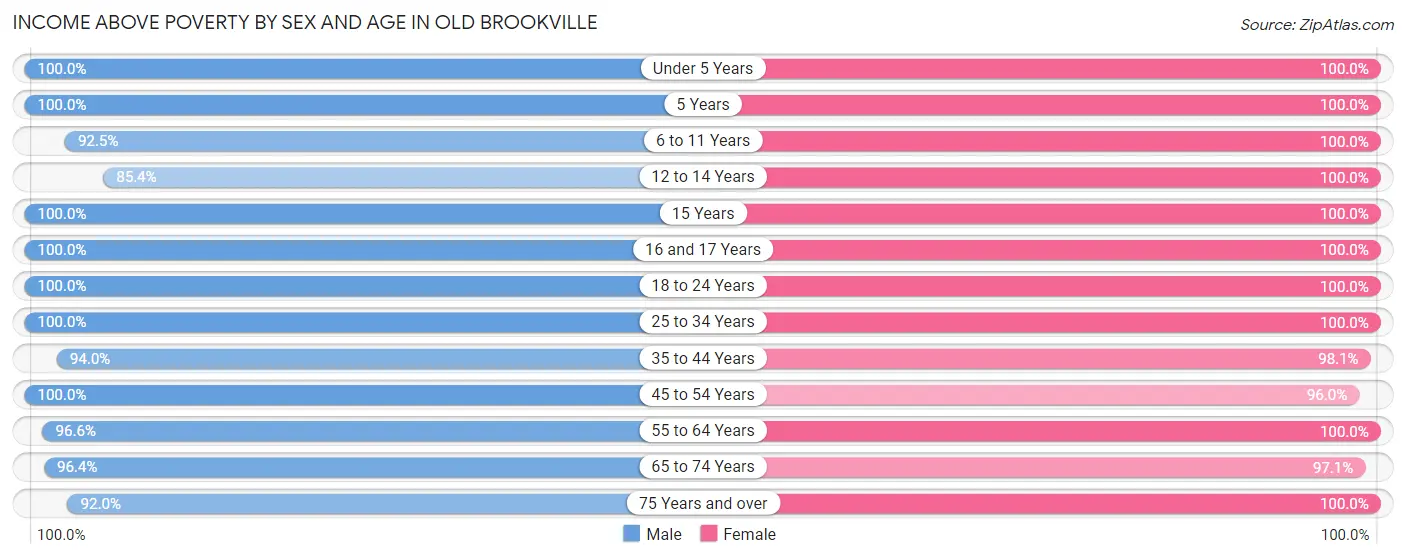
| Age Bracket | Male | Female |
| Under 5 Years | 77 (100.0%) | 27 (100.0%) |
| 5 Years | 4 (100.0%) | 4 (100.0%) |
| 6 to 11 Years | 74 (92.5%) | 55 (100.0%) |
| 12 to 14 Years | 35 (85.4%) | 51 (100.0%) |
| 15 Years | 18 (100.0%) | 12 (100.0%) |
| 16 and 17 Years | 28 (100.0%) | 27 (100.0%) |
| 18 to 24 Years | 57 (100.0%) | 49 (100.0%) |
| 25 to 34 Years | 48 (100.0%) | 75 (100.0%) |
| 35 to 44 Years | 47 (94.0%) | 104 (98.1%) |
| 45 to 54 Years | 184 (100.0%) | 96 (96.0%) |
| 55 to 64 Years | 144 (96.6%) | 192 (100.0%) |
| 65 to 74 Years | 80 (96.4%) | 101 (97.1%) |
| 75 Years and over | 115 (92.0%) | 71 (100.0%) |
| Total | 911 (96.5%) | 864 (99.0%) |
Income Below Poverty Among Married-Couple Families in Old Brookville
The poverty statistics for married-couple families in Old Brookville show that 1.0% or 5 of the total 491 families live below the poverty line. Families with 1 or 2 children have the highest poverty rate of 3.9%, comprising of 5 families. On the other hand, families with no children have the lowest poverty rate of 0.0%, which includes 0 families.
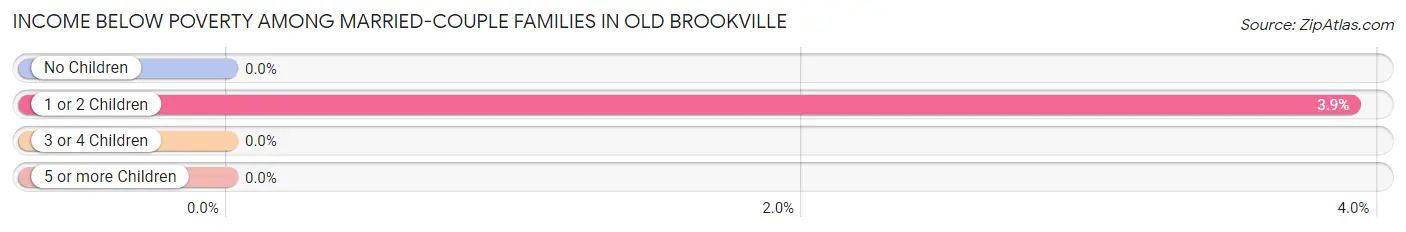
| Children | Above Poverty | Below Poverty |
| No Children | 303 (100.0%) | 0 (0.0%) |
| 1 or 2 Children | 123 (96.1%) | 5 (3.9%) |
| 3 or 4 Children | 60 (100.0%) | 0 (0.0%) |
| 5 or more Children | 0 (0.0%) | 0 (0.0%) |
| Total | 486 (99.0%) | 5 (1.0%) |
Income Below Poverty Among Single-Parent Households in Old Brookville
| Children | Single Father | Single Mother |
| No Children | 0 (0.0%) | 0 (0.0%) |
| 1 or 2 Children | 0 (0.0%) | 0 (0.0%) |
| 3 or 4 Children | 0 (0.0%) | 0 (0.0%) |
| 5 or more Children | 0 (0.0%) | 0 (0.0%) |
| Total | 0 (0.0%) | 0 (0.0%) |
Income Below Poverty Among Married-Couple vs Single-Parent Households in Old Brookville
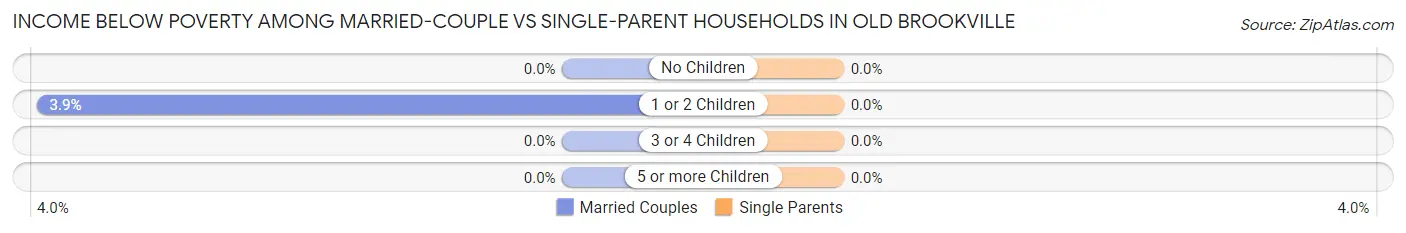
| Children | Married-Couple Families | Single-Parent Households |
| No Children | 0 (0.0%) | 0 (0.0%) |
| 1 or 2 Children | 5 (3.9%) | 0 (0.0%) |
| 3 or 4 Children | 0 (0.0%) | 0 (0.0%) |
| 5 or more Children | 0 (0.0%) | 0 (0.0%) |
| Total | 5 (1.0%) | 0 (0.0%) |
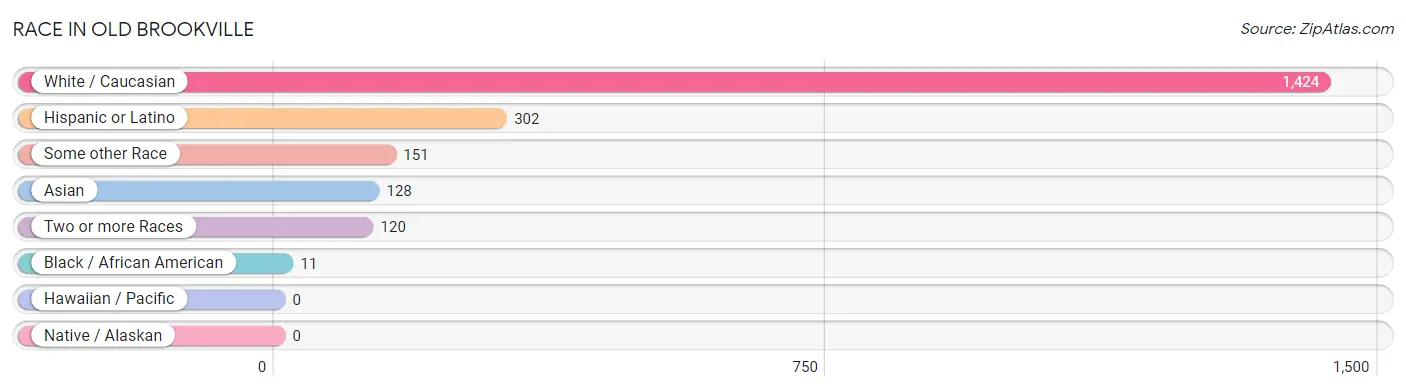
Race in Old Brookville
The most populous races in Old Brookville are White / Caucasian (1,424 | 77.6%), Hispanic or Latino (302 | 16.5%), and Some other Race (151 | 8.2%).
| Race | # Population | % Population |
| Asian | 128 | 7.0% |
| Black / African American | 11 | 0.6% |
| Hawaiian / Pacific | 0 | 0.0% |
| Hispanic or Latino | 302 | 16.5% |
| Native / Alaskan | 0 | 0.0% |
| White / Caucasian | 1,424 | 77.6% |
| Two or more Races | 120 | 6.5% |
| Some other Race | 151 | 8.2% |
| Total | 1,834 | 100.0% |
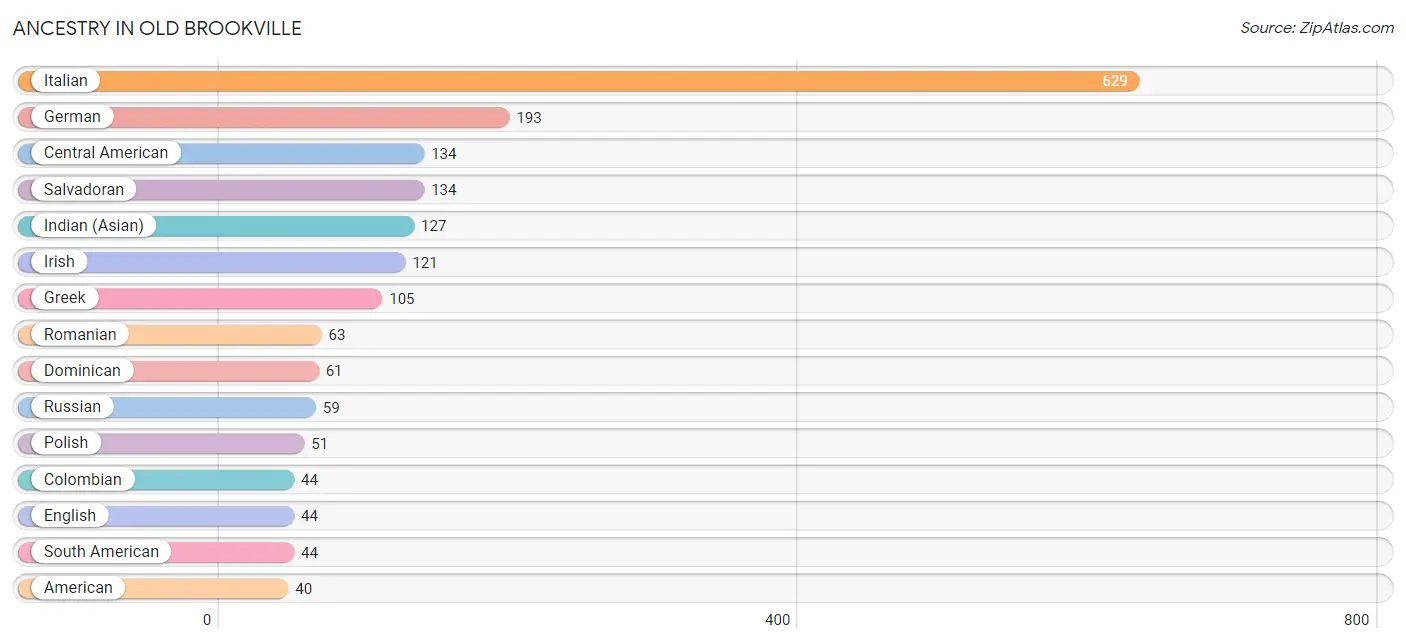
Ancestry in Old Brookville
The most populous ancestries reported in Old Brookville are Italian (629 | 34.3%), German (193 | 10.5%), Central American (134 | 7.3%), Salvadoran (134 | 7.3%), and Indian (Asian) (127 | 6.9%), together accounting for 66.4% of all Old Brookville residents.
| Ancestry | # Population | % Population |
| American | 40 | 2.2% |
| Arab | 2 | 0.1% |
| Armenian | 20 | 1.1% |
| Austrian | 22 | 1.2% |
| Brazilian | 10 | 0.5% |
| Central American | 134 | 7.3% |
| Cherokee | 23 | 1.3% |
| Colombian | 44 | 2.4% |
| Cuban | 12 | 0.6% |
| Czech | 2 | 0.1% |
| Danish | 6 | 0.3% |
| Dominican | 61 | 3.3% |
| Dutch | 3 | 0.2% |
| Eastern European | 14 | 0.8% |
| English | 44 | 2.4% |
| European | 22 | 1.2% |
| French | 14 | 0.8% |
| French Canadian | 3 | 0.2% |
| German | 193 | 10.5% |
| Greek | 105 | 5.7% |
| Hungarian | 3 | 0.2% |
| Indian (Asian) | 127 | 6.9% |
| Iranian | 21 | 1.1% |
| Irish | 121 | 6.6% |
| Italian | 629 | 34.3% |
| Jamaican | 6 | 0.3% |
| Lebanese | 2 | 0.1% |
| Lithuanian | 3 | 0.2% |
| Mexican | 21 | 1.1% |
| Norwegian | 16 | 0.9% |
| Polish | 51 | 2.8% |
| Portuguese | 18 | 1.0% |
| Puerto Rican | 30 | 1.6% |
| Romanian | 63 | 3.4% |
| Russian | 59 | 3.2% |
| Salvadoran | 134 | 7.3% |
| Scotch-Irish | 4 | 0.2% |
| Scottish | 25 | 1.4% |
| South American | 44 | 2.4% |
| Swedish | 37 | 2.0% |
| Swiss | 13 | 0.7% |
| Thai | 13 | 0.7% |
| Ukrainian | 40 | 2.2% | View All 43 Rows |
Immigrants in Old Brookville
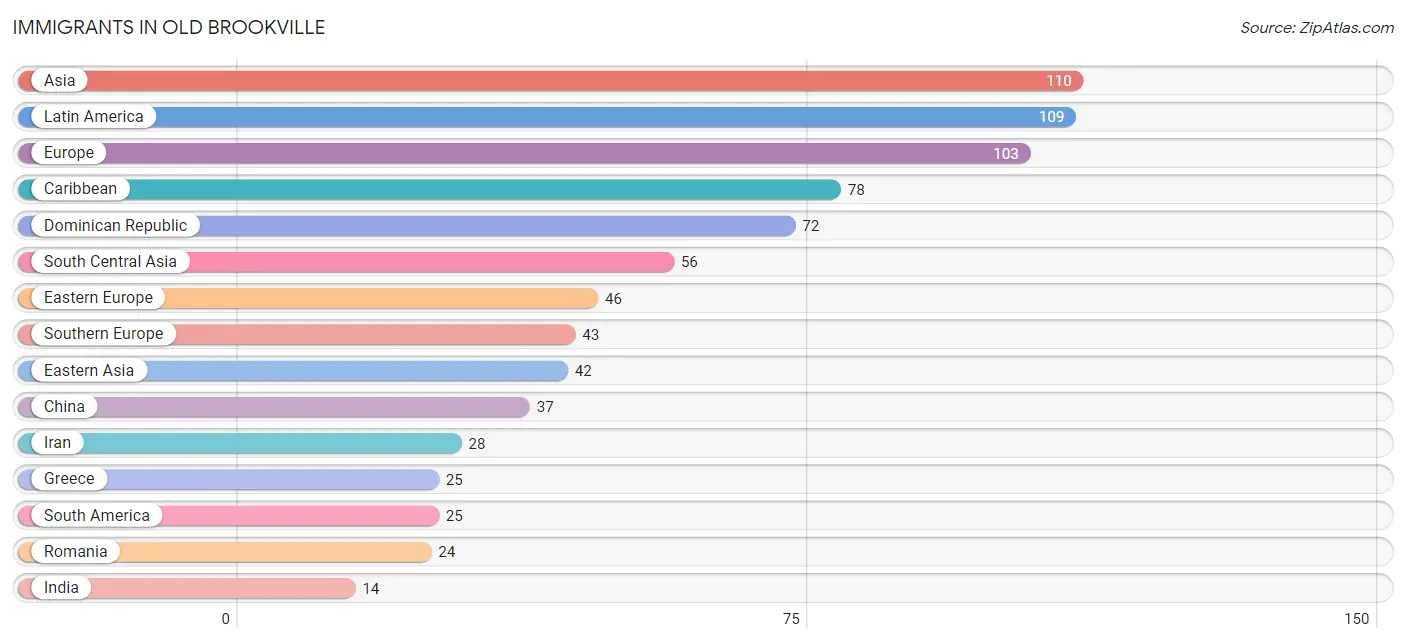
The most numerous immigrant groups reported in Old Brookville came from Asia (110 | 6.0%), Latin America (109 | 5.9%), Europe (103 | 5.6%), Caribbean (78 | 4.3%), and Dominican Republic (72 | 3.9%), together accounting for 25.7% of all Old Brookville residents.
| Immigration Origin | # Population | % Population |
| Africa | 3 | 0.2% |
| Asia | 110 | 6.0% |
| Brazil | 10 | 0.5% |
| Caribbean | 78 | 4.3% |
| Central America | 6 | 0.3% |
| China | 37 | 2.0% |
| Colombia | 11 | 0.6% |
| Dominican Republic | 72 | 3.9% |
| Eastern Africa | 3 | 0.2% |
| Eastern Asia | 42 | 2.3% |
| Eastern Europe | 46 | 2.5% |
| England | 4 | 0.2% |
| Eritrea | 3 | 0.2% |
| Europe | 103 | 5.6% |
| Greece | 25 | 1.4% |
| Hong Kong | 9 | 0.5% |
| India | 14 | 0.8% |
| Iran | 28 | 1.5% |
| Italy | 13 | 0.7% |
| Jamaica | 6 | 0.3% |
| Korea | 5 | 0.3% |
| Latin America | 109 | 5.9% |
| Lebanon | 2 | 0.1% |
| Mexico | 6 | 0.3% |
| Northern Europe | 4 | 0.2% |
| Pakistan | 14 | 0.8% |
| Peru | 4 | 0.2% |
| Portugal | 5 | 0.3% |
| Romania | 24 | 1.3% |
| Russia | 8 | 0.4% |
| South America | 25 | 1.4% |
| South Central Asia | 56 | 3.0% |
| Southern Europe | 43 | 2.3% |
| Switzerland | 10 | 0.5% |
| Syria | 5 | 0.3% |
| Taiwan | 1 | 0.1% |
| Ukraine | 14 | 0.8% |
| Western Asia | 12 | 0.6% |
| Western Europe | 10 | 0.5% | View All 39 Rows |
Sex and Age in Old Brookville
Sex and Age in Old Brookville
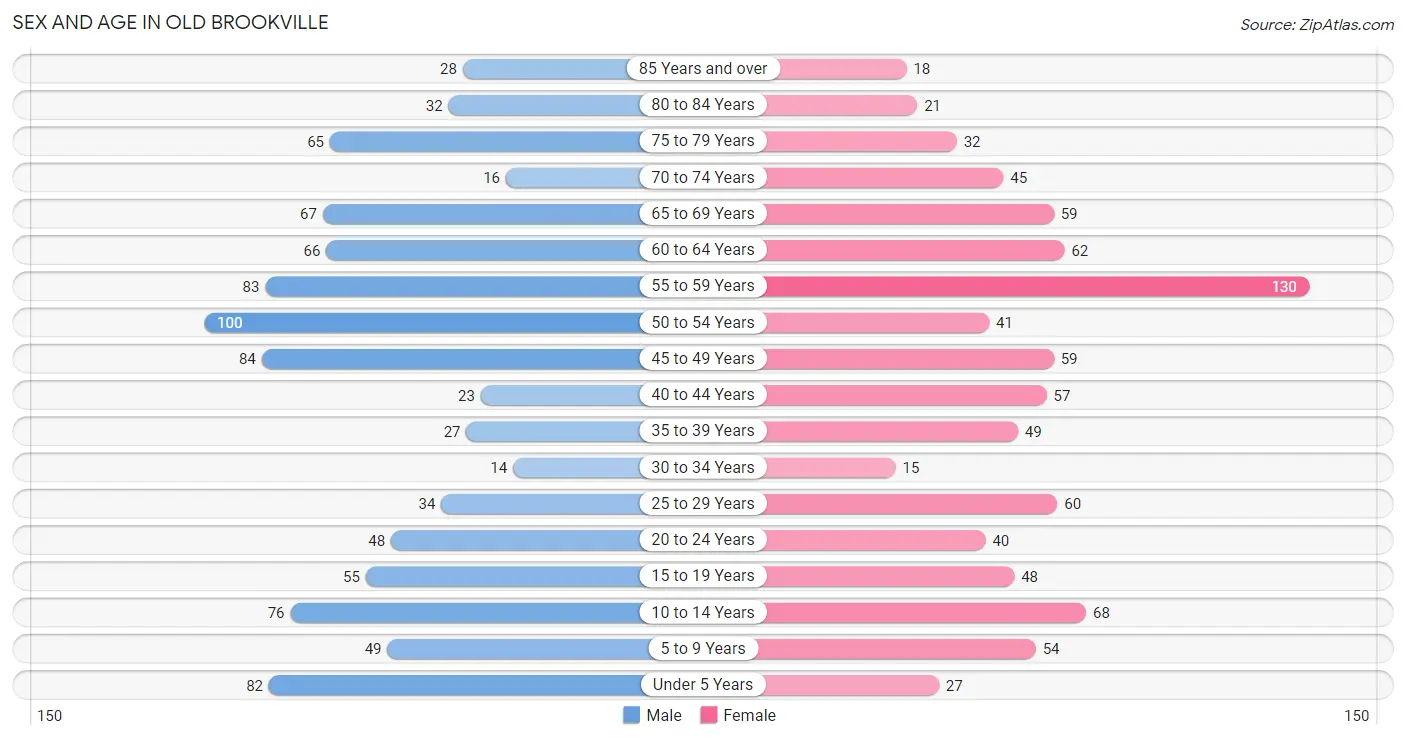
The most populous age groups in Old Brookville are 50 to 54 Years (100 | 10.5%) for men and 55 to 59 Years (130 | 14.7%) for women.
| Age Bracket | Male | Female |
| Under 5 Years | 82 (8.6%) | 27 (3.0%) |
| 5 to 9 Years | 49 (5.2%) | 54 (6.1%) |
| 10 to 14 Years | 76 (8.0%) | 68 (7.7%) |
| 15 to 19 Years | 55 (5.8%) | 48 (5.4%) |
| 20 to 24 Years | 48 (5.1%) | 40 (4.5%) |
| 25 to 29 Years | 34 (3.6%) | 60 (6.8%) |
| 30 to 34 Years | 14 (1.5%) | 15 (1.7%) |
| 35 to 39 Years | 27 (2.9%) | 49 (5.5%) |
| 40 to 44 Years | 23 (2.4%) | 57 (6.4%) |
| 45 to 49 Years | 84 (8.8%) | 59 (6.7%) |
| 50 to 54 Years | 100 (10.5%) | 41 (4.6%) |
| 55 to 59 Years | 83 (8.7%) | 130 (14.7%) |
| 60 to 64 Years | 66 (7.0%) | 62 (7.0%) |
| 65 to 69 Years | 67 (7.1%) | 59 (6.7%) |
| 70 to 74 Years | 16 (1.7%) | 45 (5.1%) |
| 75 to 79 Years | 65 (6.9%) | 32 (3.6%) |
| 80 to 84 Years | 32 (3.4%) | 21 (2.4%) |
| 85 Years and over | 28 (2.9%) | 18 (2.0%) |
| Total | 949 (100.0%) | 885 (100.0%) |
Families and Households in Old Brookville
Median Family Size in Old Brookville
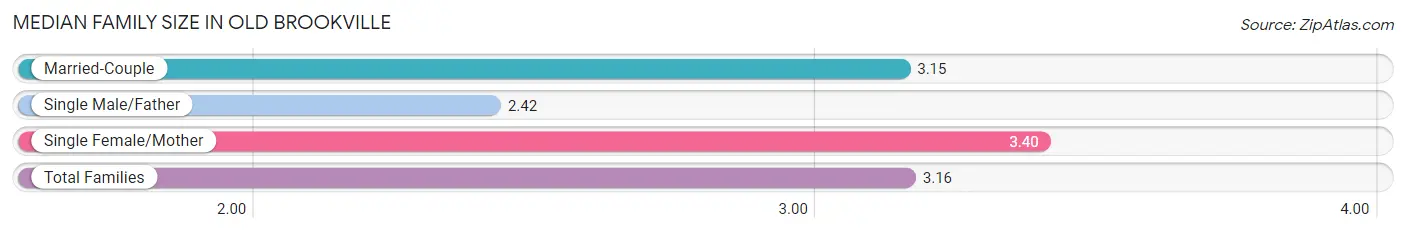
The median family size in Old Brookville is 3.16 persons per family, with single female/mother families (47 | 8.6%) accounting for the largest median family size of 3.4 persons per family. On the other hand, single male/father families (12 | 2.2%) represent the smallest median family size with 2.42 persons per family.
| Family Type | # Families | Family Size |
| Married-Couple | 491 (89.3%) | 3.15 |
| Single Male/Father | 12 (2.2%) | 2.42 |
| Single Female/Mother | 47 (8.6%) | 3.40 |
| Total Families | 550 (100.0%) | 3.16 |
Median Household Size in Old Brookville
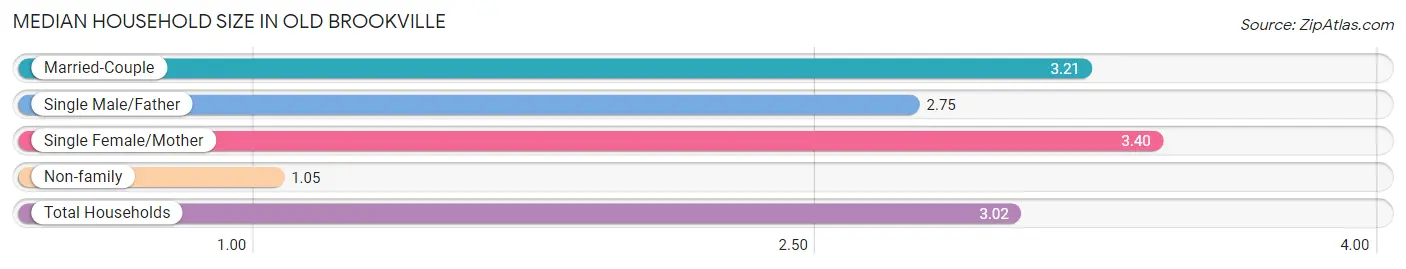
The median household size in Old Brookville is 3.02 persons per household, with single female/mother households (47 | 7.8%) accounting for the largest median household size of 3.4 persons per household. non-family households (55 | 9.1%) represent the smallest median household size with 1.05 persons per household.
| Household Type | # Households | Household Size |
| Married-Couple | 491 (81.2%) | 3.21 |
| Single Male/Father | 12 (2.0%) | 2.75 |
| Single Female/Mother | 47 (7.8%) | 3.40 |
| Non-family | 55 (9.1%) | 1.05 |
| Total Households | 605 (100.0%) | 3.02 |
Household Size by Marriage Status in Old Brookville
Out of a total of 605 households in Old Brookville, 550 (90.9%) are family households, while 55 (9.1%) are nonfamily households. The most numerous type of family households are 2-person households, comprising 191, and the most common type of nonfamily households are 1-person households, comprising 52.
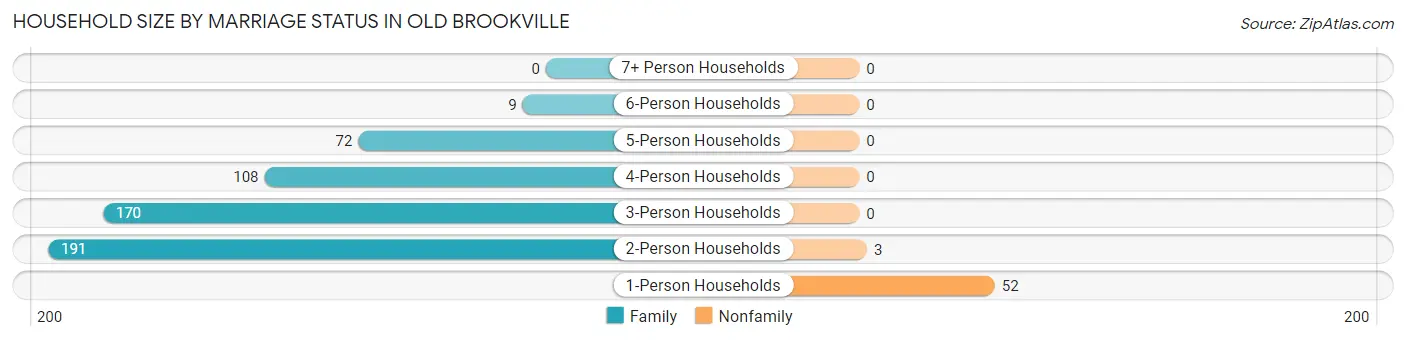
| Household Size | Family Households | Nonfamily Households |
| 1-Person Households | - | 52 (8.6%) |
| 2-Person Households | 191 (31.6%) | 3 (0.5%) |
| 3-Person Households | 170 (28.1%) | 0 (0.0%) |
| 4-Person Households | 108 (17.8%) | 0 (0.0%) |
| 5-Person Households | 72 (11.9%) | 0 (0.0%) |
| 6-Person Households | 9 (1.5%) | 0 (0.0%) |
| 7+ Person Households | 0 (0.0%) | 0 (0.0%) |
| Total | 550 (90.9%) | 55 (9.1%) |
Female Fertility in Old Brookville
Fertility by Age in Old Brookville
Average fertility rate in Old Brookville is 9.0 births per 1,000 women. Women in the age bracket of 35 to 50 years have the highest fertility rate with 18.0 births per 1,000 women. Women in the age bracket of 35 to 50 years acount for 100.0% of all women with births.
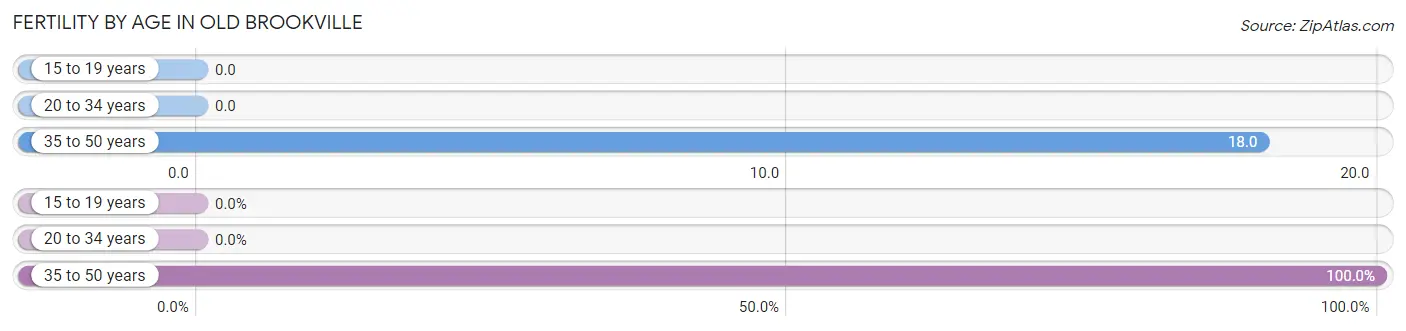
| Age Bracket | Women with Births | Births / 1,000 Women |
| 15 to 19 years | 0 (0.0%) | 0.0 |
| 20 to 34 years | 0 (0.0%) | 0.0 |
| 35 to 50 years | 3 (100.0%) | 18.0 |
| Total | 3 (100.0%) | 9.0 |
Fertility by Age by Marriage Status in Old Brookville
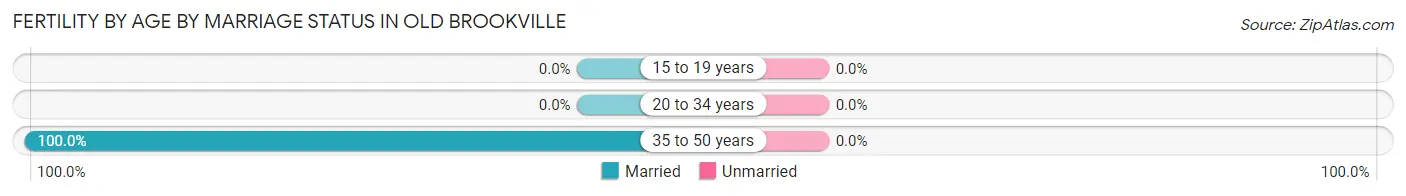
| Age Bracket | Married | Unmarried |
| 15 to 19 years | 0 (0.0%) | 0 (0.0%) |
| 20 to 34 years | 0 (0.0%) | 0 (0.0%) |
| 35 to 50 years | 3 (100.0%) | 0 (0.0%) |
| Total | 3 (100.0%) | 0 (0.0%) |
Fertility by Education in Old Brookville
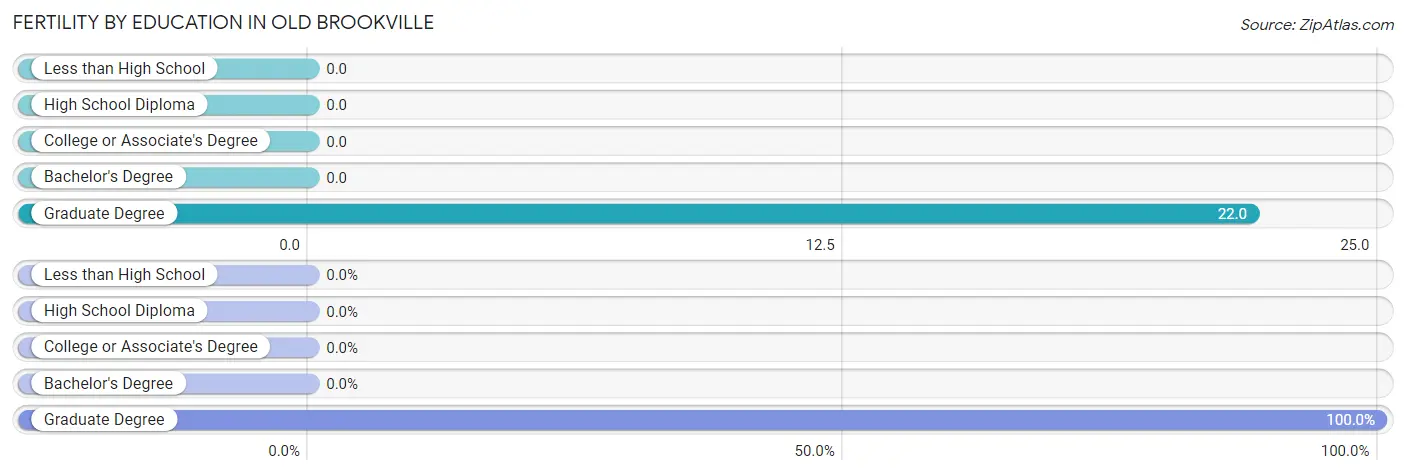
| Educational Attainment | Women with Births | Births / 1,000 Women |
| Less than High School | 0 (0.0%) | 0.0 |
| High School Diploma | 0 (0.0%) | 0.0 |
| College or Associate's Degree | 0 (0.0%) | 0.0 |
| Bachelor's Degree | 0 (0.0%) | 0.0 |
| Graduate Degree | 3 (100.0%) | 22.0 |
| Total | 3 (100.0%) | 9.0 |
Fertility by Education by Marriage Status in Old Brookville
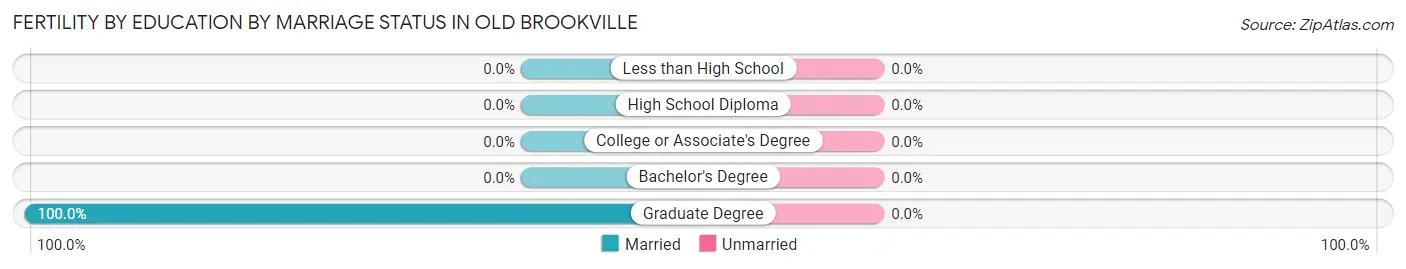
| Educational Attainment | Married | Unmarried |
| Less than High School | 0 (0.0%) | 0 (0.0%) |
| High School Diploma | 0 (0.0%) | 0 (0.0%) |
| College or Associate's Degree | 0 (0.0%) | 0 (0.0%) |
| Bachelor's Degree | 0 (0.0%) | 0 (0.0%) |
| Graduate Degree | 3 (100.0%) | 0 (0.0%) |
| Total | 3 (100.0%) | 0 (0.0%) |
Employment Characteristics in Old Brookville
Employment by Class of Employer in Old Brookville
Among the 805 employed individuals in Old Brookville, private company employees (499 | 62.0%), self-employed (incorporated) (165 | 20.5%), and not-for-profit organizations (50 | 6.2%) make up the most common classes of employment.
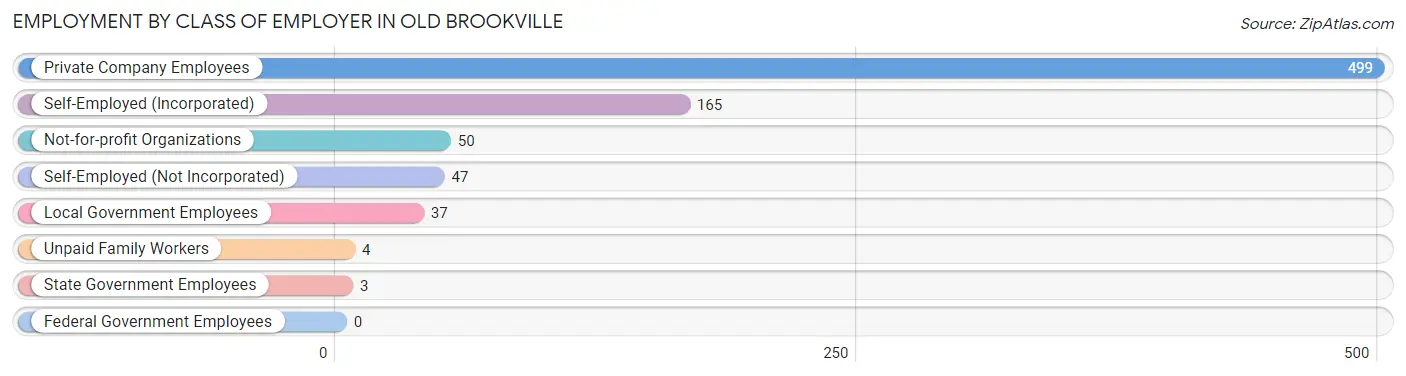
| Employer Class | # Employees | % Employees |
| Private Company Employees | 499 | 62.0% |
| Self-Employed (Incorporated) | 165 | 20.5% |
| Self-Employed (Not Incorporated) | 47 | 5.8% |
| Not-for-profit Organizations | 50 | 6.2% |
| Local Government Employees | 37 | 4.6% |
| State Government Employees | 3 | 0.4% |
| Federal Government Employees | 0 | 0.0% |
| Unpaid Family Workers | 4 | 0.5% |
| Total | 805 | 100.0% |
Employment Status by Age in Old Brookville
According to the labor force statistics for Old Brookville, out of the total population over 16 years of age (1,448), 60.2% or 872 individuals are in the labor force, with 3.2% or 28 of them unemployed. The age group with the highest labor force participation rate is 25 to 29 years, with 100.0% or 94 individuals in the labor force. Within the labor force, the 25 to 29 years age range has the highest percentage of unemployed individuals, with 22.3% or 21 of them being unemployed.
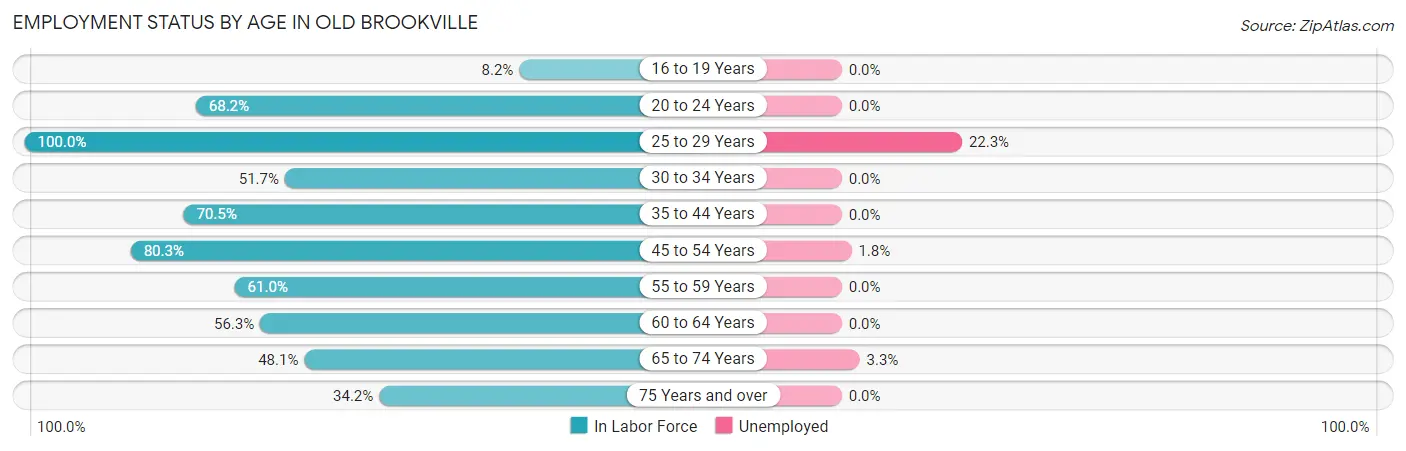
| Age Bracket | In Labor Force | Unemployed |
| 16 to 19 Years | 6 (8.2%) | 0 (0.0%) |
| 20 to 24 Years | 60 (68.2%) | 0 (0.0%) |
| 25 to 29 Years | 94 (100.0%) | 21 (22.3%) |
| 30 to 34 Years | 15 (51.7%) | 0 (0.0%) |
| 35 to 44 Years | 110 (70.5%) | 0 (0.0%) |
| 45 to 54 Years | 228 (80.3%) | 4 (1.8%) |
| 55 to 59 Years | 130 (61.0%) | 0 (0.0%) |
| 60 to 64 Years | 72 (56.3%) | 0 (0.0%) |
| 65 to 74 Years | 90 (48.1%) | 3 (3.3%) |
| 75 Years and over | 67 (34.2%) | 0 (0.0%) |
| Total | 872 (60.2%) | 28 (3.2%) |
Employment Status by Educational Attainment in Old Brookville
According to labor force statistics for Old Brookville, 71.8% of individuals (649) out of the total population between 25 and 64 years of age (904) are in the labor force, with 3.9% or 25 of them being unemployed. The group with the highest labor force participation rate are those with the educational attainment of college / associate degree, with 85.4% or 158 individuals in the labor force. Within the labor force, individuals with college / associate degree education have the highest percentage of unemployment, with 8.2% or 13 of them being unemployed.
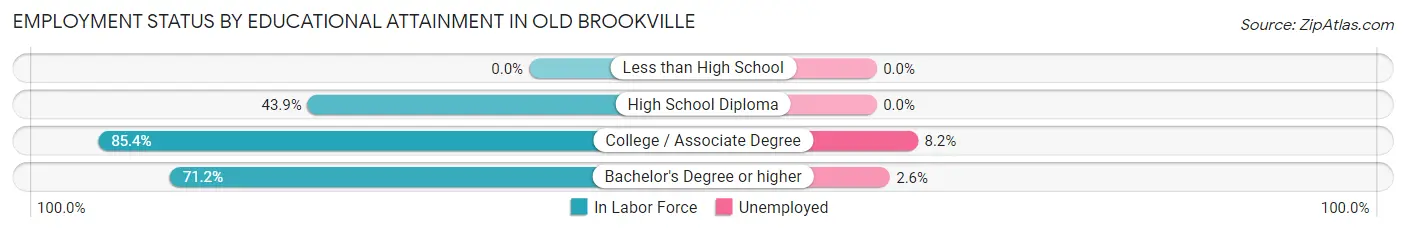
| Educational Attainment | In Labor Force | Unemployed |
| Less than High School | 0 (0.0%) | 0 (0.0%) |
| High School Diploma | 29 (43.9%) | 0 (0.0%) |
| College / Associate Degree | 158 (85.4%) | 15 (8.2%) |
| Bachelor's Degree or higher | 462 (71.2%) | 17 (2.6%) |
| Total | 649 (71.8%) | 35 (3.9%) |
Employment Occupations by Sex in Old Brookville
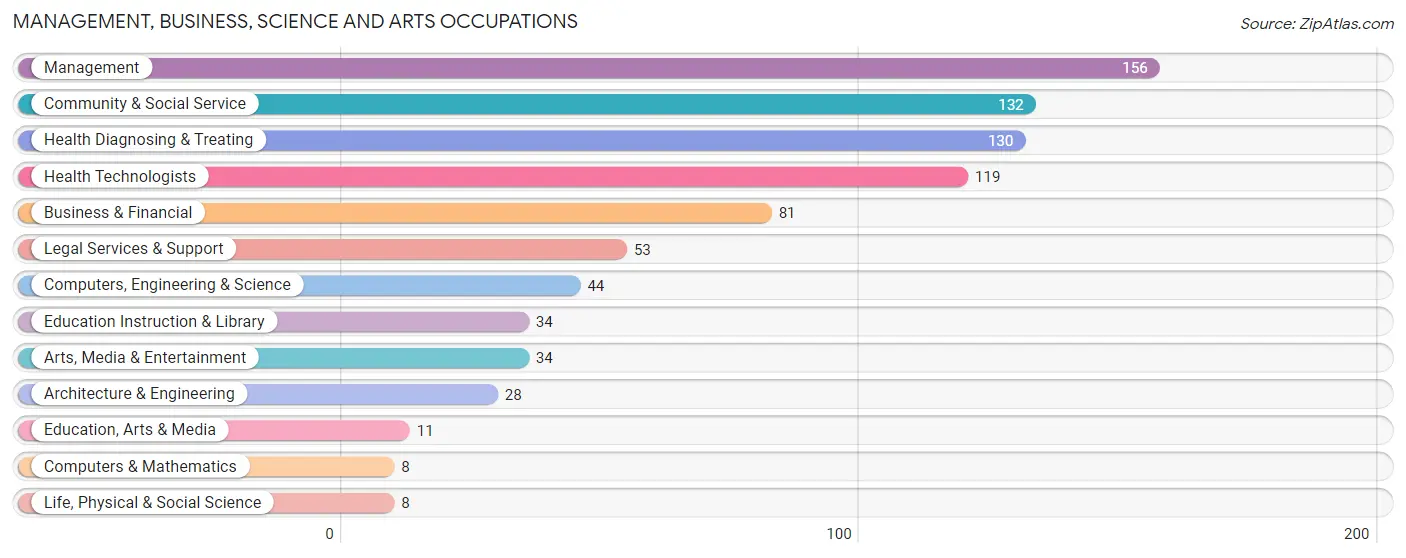
Management, Business, Science and Arts Occupations
The most common Management, Business, Science and Arts occupations in Old Brookville are Management (156 | 18.5%), Community & Social Service (132 | 15.6%), Health Diagnosing & Treating (130 | 15.4%), Health Technologists (119 | 14.1%), and Business & Financial (81 | 9.6%).
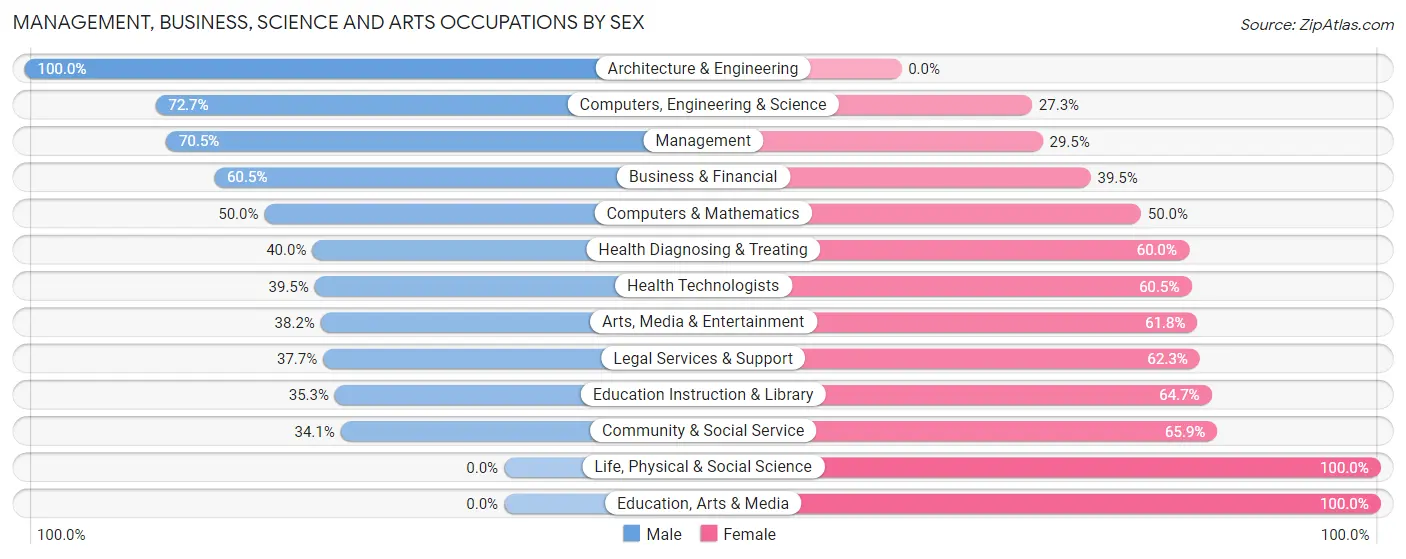
Management, Business, Science and Arts Occupations by Sex
Within the Management, Business, Science and Arts occupations in Old Brookville, the most male-oriented occupations are Architecture & Engineering (100.0%), Computers, Engineering & Science (72.7%), and Management (70.5%), while the most female-oriented occupations are Life, Physical & Social Science (100.0%), Education, Arts & Media (100.0%), and Community & Social Service (65.9%).
| Occupation | Male | Female |
| Management | 110 (70.5%) | 46 (29.5%) |
| Business & Financial | 49 (60.5%) | 32 (39.5%) |
| Computers, Engineering & Science | 32 (72.7%) | 12 (27.3%) |
| Computers & Mathematics | 4 (50.0%) | 4 (50.0%) |
| Architecture & Engineering | 28 (100.0%) | 0 (0.0%) |
| Life, Physical & Social Science | 0 (0.0%) | 8 (100.0%) |
| Community & Social Service | 45 (34.1%) | 87 (65.9%) |
| Education, Arts & Media | 0 (0.0%) | 11 (100.0%) |
| Legal Services & Support | 20 (37.7%) | 33 (62.3%) |
| Education Instruction & Library | 12 (35.3%) | 22 (64.7%) |
| Arts, Media & Entertainment | 13 (38.2%) | 21 (61.8%) |
| Health Diagnosing & Treating | 52 (40.0%) | 78 (60.0%) |
| Health Technologists | 47 (39.5%) | 72 (60.5%) |
| Total (Category) | 288 (53.0%) | 255 (47.0%) |
| Total (Overall) | 468 (55.4%) | 376 (44.6%) |
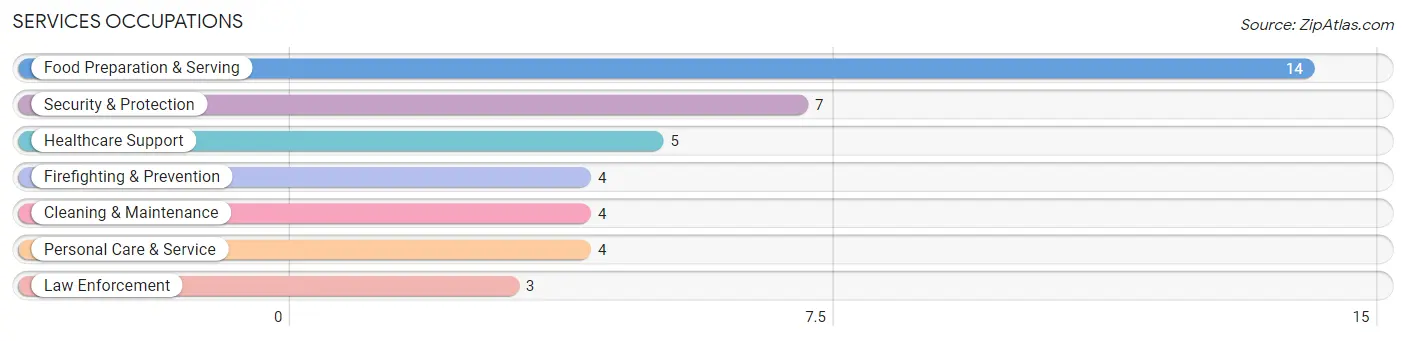
Services Occupations
The most common Services occupations in Old Brookville are Food Preparation & Serving (14 | 1.7%), Security & Protection (7 | 0.8%), Healthcare Support (5 | 0.6%), Firefighting & Prevention (4 | 0.5%), and Cleaning & Maintenance (4 | 0.5%).
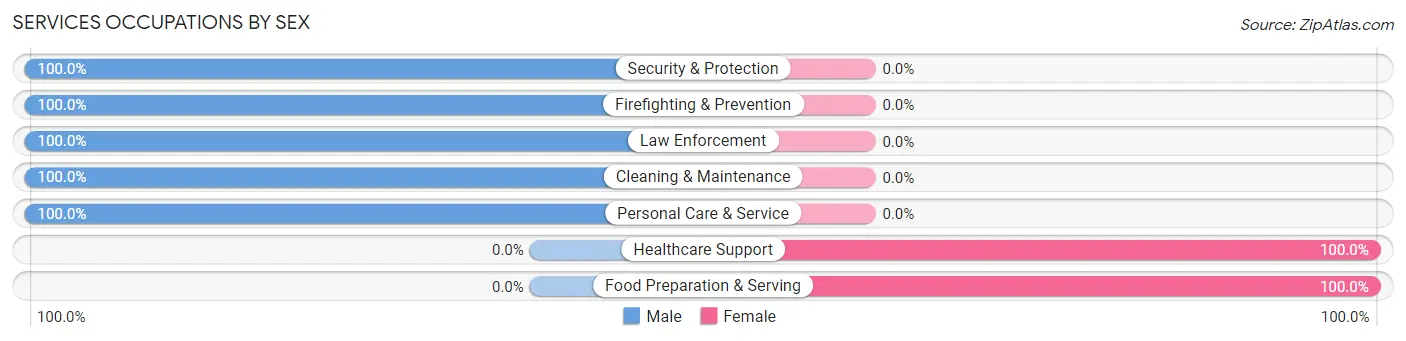
Services Occupations by Sex
Within the Services occupations in Old Brookville, the most male-oriented occupations are Security & Protection (100.0%), Firefighting & Prevention (100.0%), and Law Enforcement (100.0%), while the most female-oriented occupations are Healthcare Support (100.0%), and Food Preparation & Serving (100.0%).
| Occupation | Male | Female |
| Healthcare Support | 0 (0.0%) | 5 (100.0%) |
| Security & Protection | 7 (100.0%) | 0 (0.0%) |
| Firefighting & Prevention | 4 (100.0%) | 0 (0.0%) |
| Law Enforcement | 3 (100.0%) | 0 (0.0%) |
| Food Preparation & Serving | 0 (0.0%) | 14 (100.0%) |
| Cleaning & Maintenance | 4 (100.0%) | 0 (0.0%) |
| Personal Care & Service | 4 (100.0%) | 0 (0.0%) |
| Total (Category) | 15 (44.1%) | 19 (55.9%) |
| Total (Overall) | 468 (55.4%) | 376 (44.6%) |
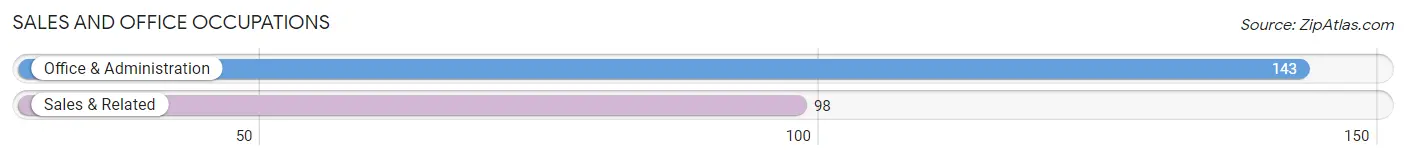
Sales and Office Occupations
The most common Sales and Office occupations in Old Brookville are Office & Administration (143 | 16.9%), and Sales & Related (98 | 11.6%).
Sales and Office Occupations by Sex
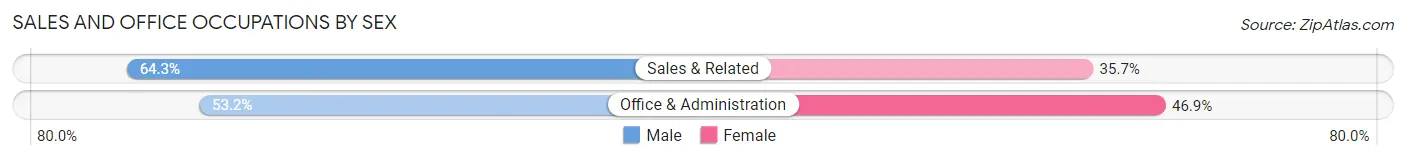
| Occupation | Male | Female |
| Sales & Related | 63 (64.3%) | 35 (35.7%) |
| Office & Administration | 76 (53.1%) | 67 (46.9%) |
| Total (Category) | 139 (57.7%) | 102 (42.3%) |
| Total (Overall) | 468 (55.4%) | 376 (44.6%) |
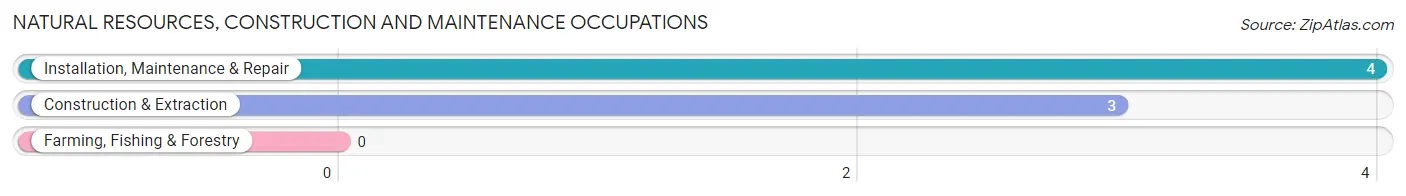
Natural Resources, Construction and Maintenance Occupations
The most common Natural Resources, Construction and Maintenance occupations in Old Brookville are Installation, Maintenance & Repair (4 | 0.5%), and Construction & Extraction (3 | 0.4%).
Natural Resources, Construction and Maintenance Occupations by Sex
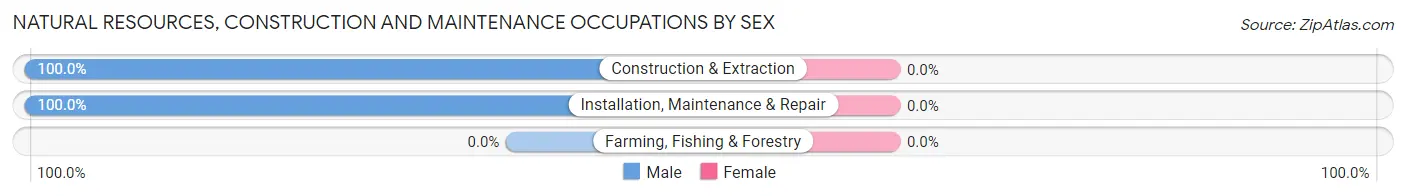
| Occupation | Male | Female |
| Farming, Fishing & Forestry | 0 (0.0%) | 0 (0.0%) |
| Construction & Extraction | 3 (100.0%) | 0 (0.0%) |
| Installation, Maintenance & Repair | 4 (100.0%) | 0 (0.0%) |
| Total (Category) | 7 (100.0%) | 0 (0.0%) |
| Total (Overall) | 468 (55.4%) | 376 (44.6%) |
Production, Transportation and Moving Occupations
The most common Production, Transportation and Moving occupations in Old Brookville are Transportation (13 | 1.5%), and Material Moving (6 | 0.7%).
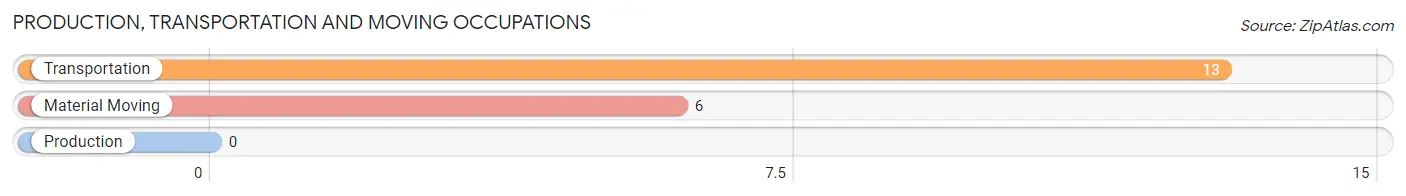
Production, Transportation and Moving Occupations by Sex
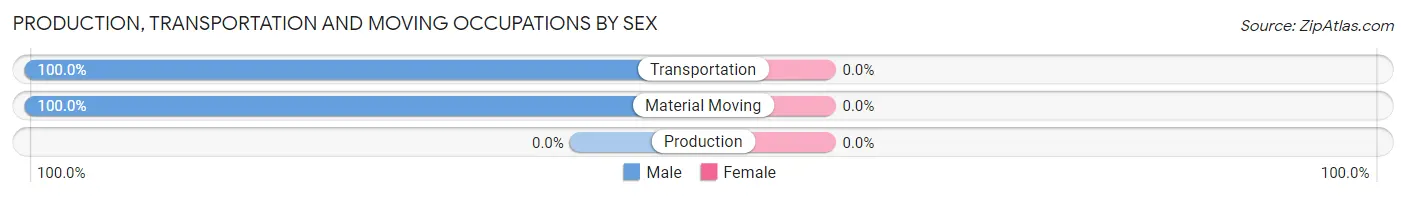
| Occupation | Male | Female |
| Production | 0 (0.0%) | 0 (0.0%) |
| Transportation | 13 (100.0%) | 0 (0.0%) |
| Material Moving | 6 (100.0%) | 0 (0.0%) |
| Total (Category) | 19 (100.0%) | 0 (0.0%) |
| Total (Overall) | 468 (55.4%) | 376 (44.6%) |
Employment Industries by Sex in Old Brookville
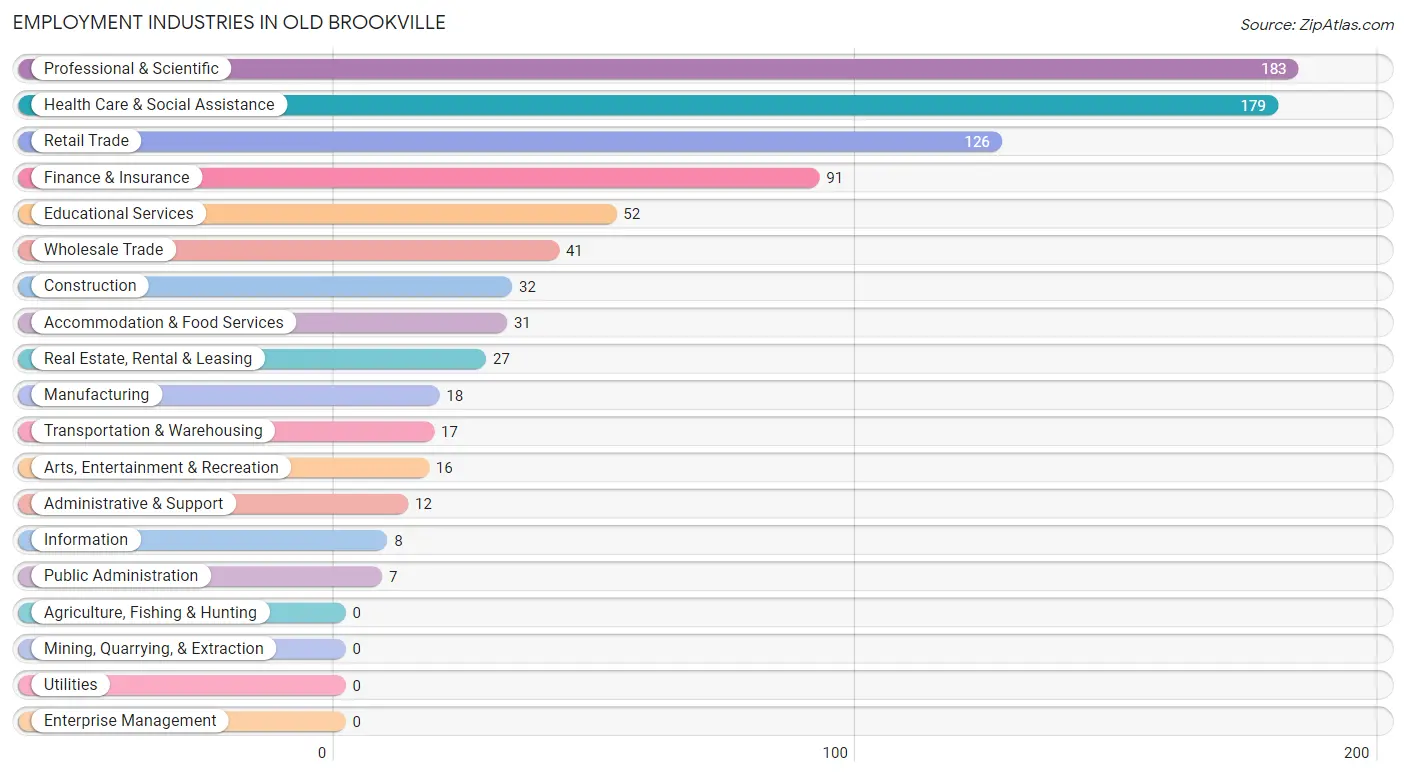
Employment Industries in Old Brookville
The major employment industries in Old Brookville include Professional & Scientific (183 | 21.7%), Health Care & Social Assistance (179 | 21.2%), Retail Trade (126 | 14.9%), Finance & Insurance (91 | 10.8%), and Educational Services (52 | 6.2%).
Employment Industries by Sex in Old Brookville
The Old Brookville industries that see more men than women are Manufacturing (100.0%), Administrative & Support (100.0%), and Public Administration (100.0%), whereas the industries that tend to have a higher number of women are Information (100.0%), Construction (78.1%), and Educational Services (69.2%).
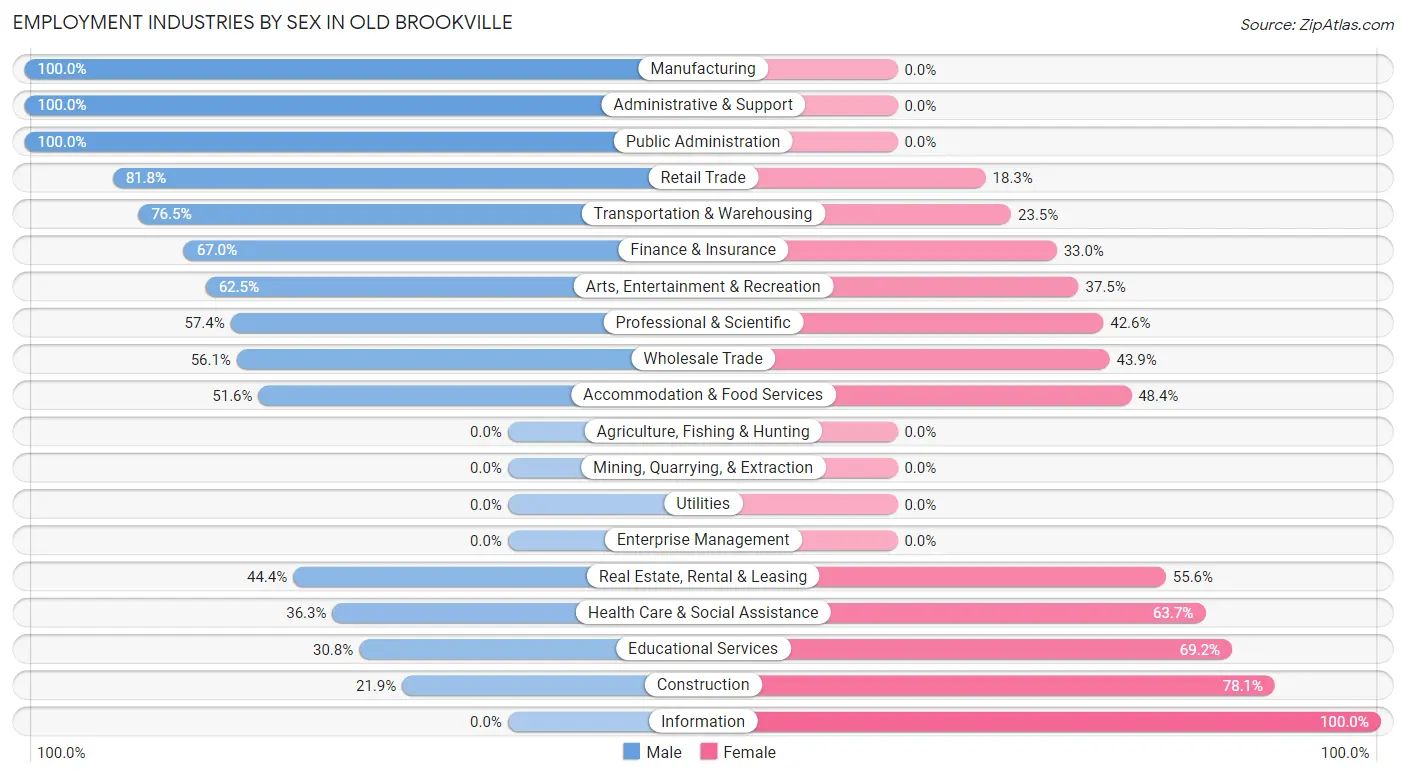
| Industry | Male | Female |
| Agriculture, Fishing & Hunting | 0 (0.0%) | 0 (0.0%) |
| Mining, Quarrying, & Extraction | 0 (0.0%) | 0 (0.0%) |
| Construction | 7 (21.9%) | 25 (78.1%) |
| Manufacturing | 18 (100.0%) | 0 (0.0%) |
| Wholesale Trade | 23 (56.1%) | 18 (43.9%) |
| Retail Trade | 103 (81.8%) | 23 (18.2%) |
| Transportation & Warehousing | 13 (76.5%) | 4 (23.5%) |
| Utilities | 0 (0.0%) | 0 (0.0%) |
| Information | 0 (0.0%) | 8 (100.0%) |
| Finance & Insurance | 61 (67.0%) | 30 (33.0%) |
| Real Estate, Rental & Leasing | 12 (44.4%) | 15 (55.6%) |
| Professional & Scientific | 105 (57.4%) | 78 (42.6%) |
| Enterprise Management | 0 (0.0%) | 0 (0.0%) |
| Administrative & Support | 12 (100.0%) | 0 (0.0%) |
| Educational Services | 16 (30.8%) | 36 (69.2%) |
| Health Care & Social Assistance | 65 (36.3%) | 114 (63.7%) |
| Arts, Entertainment & Recreation | 10 (62.5%) | 6 (37.5%) |
| Accommodation & Food Services | 16 (51.6%) | 15 (48.4%) |
| Public Administration | 7 (100.0%) | 0 (0.0%) |
| Total | 468 (55.4%) | 376 (44.6%) |
Education in Old Brookville
School Enrollment in Old Brookville
The most common levels of schooling among the 463 students in Old Brookville are high school (117 | 25.3%), elementary school (101 | 21.8%), and middle school (96 | 20.7%).
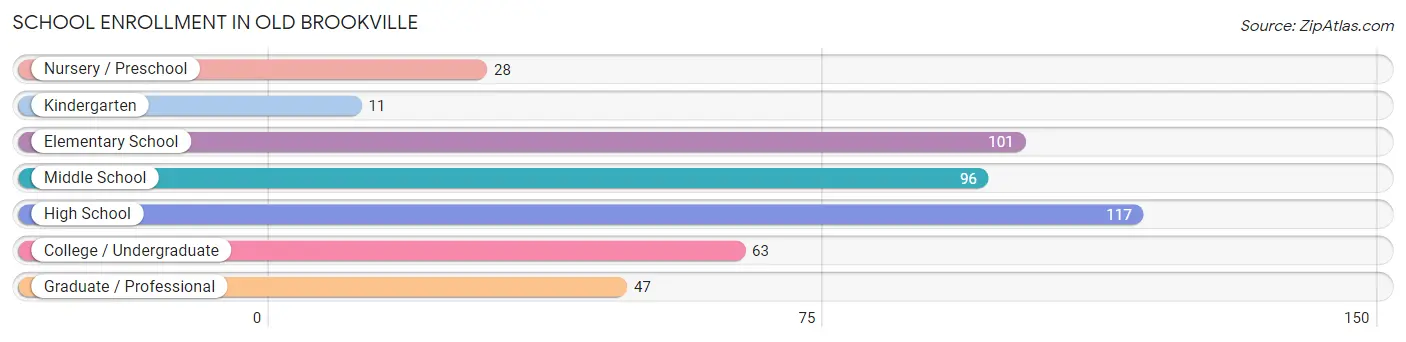
| School Level | # Students | % Students |
| Nursery / Preschool | 28 | 6.0% |
| Kindergarten | 11 | 2.4% |
| Elementary School | 101 | 21.8% |
| Middle School | 96 | 20.7% |
| High School | 117 | 25.3% |
| College / Undergraduate | 63 | 13.6% |
| Graduate / Professional | 47 | 10.2% |
| Total | 463 | 100.0% |
School Enrollment by Age by Funding Source in Old Brookville
Out of a total of 463 students who are enrolled in schools in Old Brookville, 200 (43.2%) attend a private institution, while the remaining 263 (56.8%) are enrolled in public schools. The age group of 20 to 24 year olds has the highest likelihood of being enrolled in private schools, with 52 (89.7% in the age bracket) enrolled. Conversely, the age group of 5 to 9 year old has the lowest likelihood of being enrolled in a private school, with 78 (83.9% in the age bracket) attending a public institution.
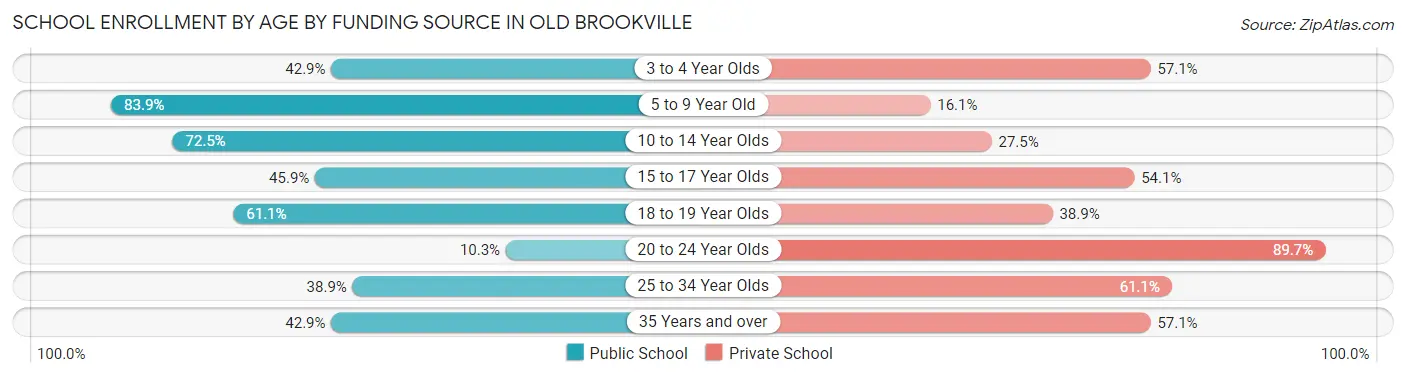
| Age Bracket | Public School | Private School |
| 3 to 4 Year Olds | 12 (42.9%) | 16 (57.1%) |
| 5 to 9 Year Old | 78 (83.9%) | 15 (16.1%) |
| 10 to 14 Year Olds | 100 (72.5%) | 38 (27.5%) |
| 15 to 17 Year Olds | 39 (45.9%) | 46 (54.1%) |
| 18 to 19 Year Olds | 11 (61.1%) | 7 (38.9%) |
| 20 to 24 Year Olds | 6 (10.3%) | 52 (89.7%) |
| 25 to 34 Year Olds | 14 (38.9%) | 22 (61.1%) |
| 35 Years and over | 3 (42.9%) | 4 (57.1%) |
| Total | 263 (56.8%) | 200 (43.2%) |
Educational Attainment by Field of Study in Old Brookville
Business (277 | 30.6%), social sciences (88 | 9.7%), psychology (79 | 8.7%), literature & languages (74 | 8.2%), and science & technology (70 | 7.7%) are the most common fields of study among 904 individuals in Old Brookville who have obtained a bachelor's degree or higher.
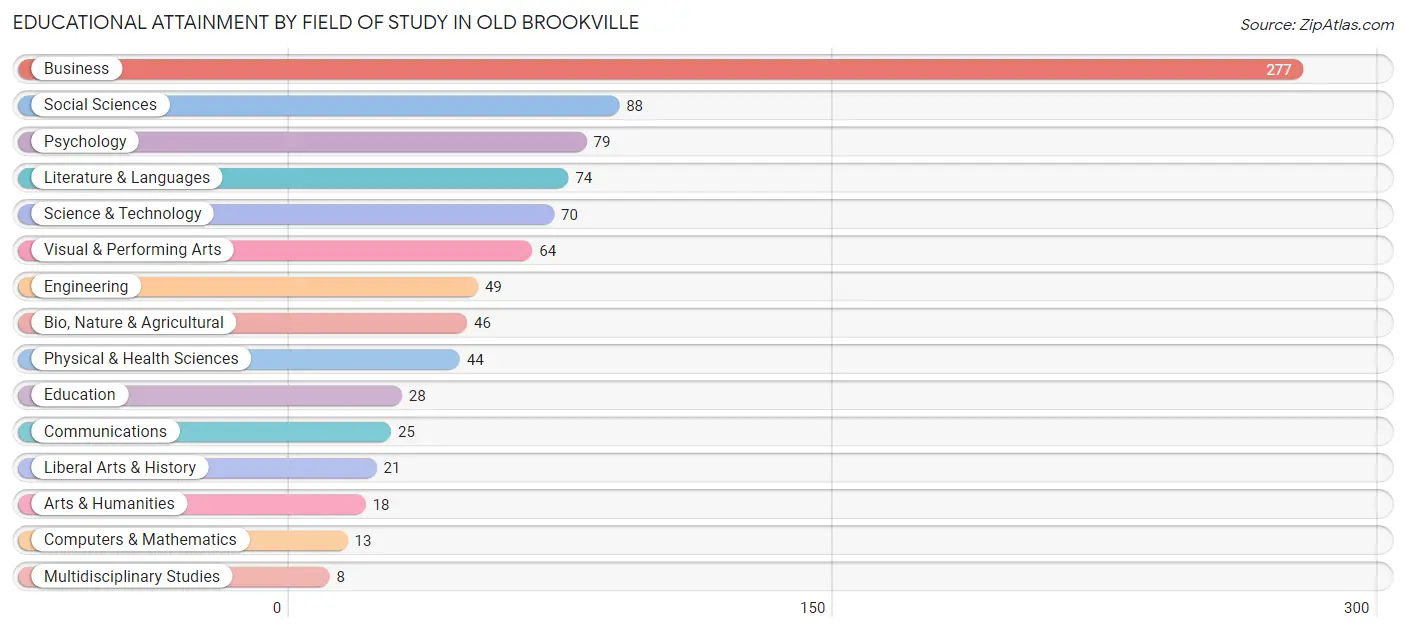
| Field of Study | # Graduates | % Graduates |
| Computers & Mathematics | 13 | 1.4% |
| Bio, Nature & Agricultural | 46 | 5.1% |
| Physical & Health Sciences | 44 | 4.9% |
| Psychology | 79 | 8.7% |
| Social Sciences | 88 | 9.7% |
| Engineering | 49 | 5.4% |
| Multidisciplinary Studies | 8 | 0.9% |
| Science & Technology | 70 | 7.7% |
| Business | 277 | 30.6% |
| Education | 28 | 3.1% |
| Literature & Languages | 74 | 8.2% |
| Liberal Arts & History | 21 | 2.3% |
| Visual & Performing Arts | 64 | 7.1% |
| Communications | 25 | 2.8% |
| Arts & Humanities | 18 | 2.0% |
| Total | 904 | 100.0% |
Transportation & Commute in Old Brookville
Vehicle Availability by Sex in Old Brookville
The most prevalent vehicle ownership categories in Old Brookville are males with 3 vehicles (186, accounting for 40.4%) and females with 3 vehicles (99, making up 54.4%).
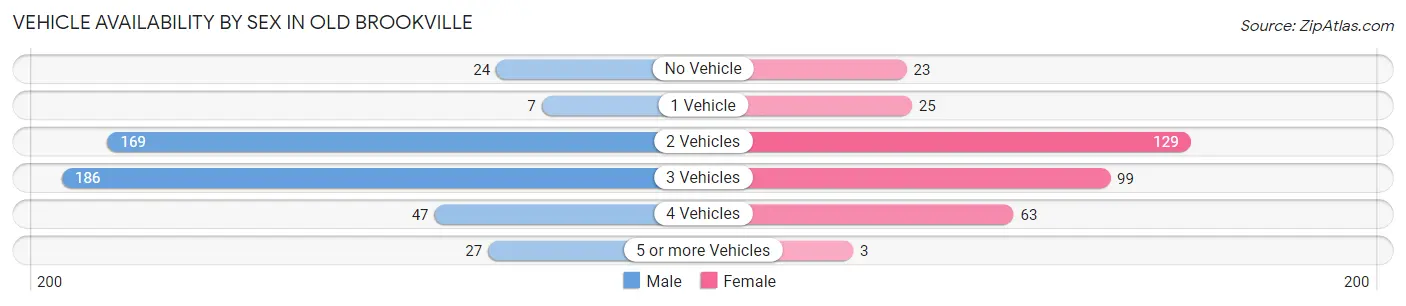
| Vehicles Available | Male | Female |
| No Vehicle | 24 (5.2%) | 23 (6.7%) |
| 1 Vehicle | 7 (1.5%) | 25 (7.3%) |
| 2 Vehicles | 169 (36.7%) | 129 (37.7%) |
| 3 Vehicles | 186 (40.4%) | 99 (28.9%) |
| 4 Vehicles | 47 (10.2%) | 63 (18.4%) |
| 5 or more Vehicles | 27 (5.9%) | 3 (0.9%) |
| Total | 460 (100.0%) | 342 (100.0%) |
Commute Time in Old Brookville
The most frequently occuring commute durations in Old Brookville are 60 to 89 minutes (120 commuters, 18.4%), 25 to 29 minutes (93 commuters, 14.3%), and 30 to 34 minutes (78 commuters, 12.0%).
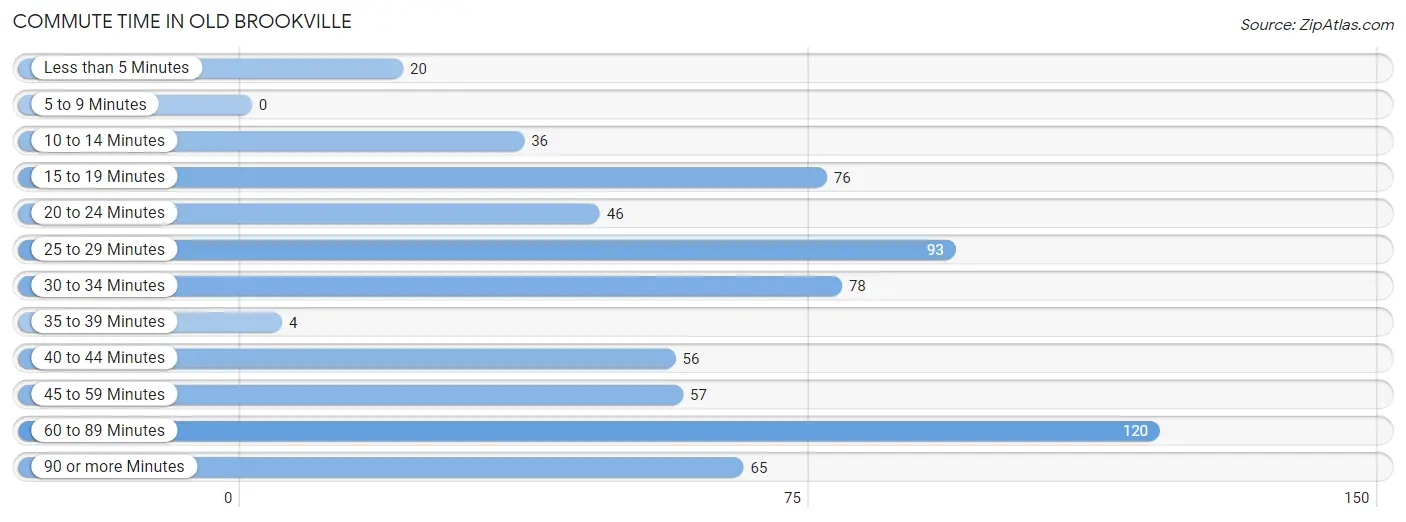
| Commute Time | # Commuters | % Commuters |
| Less than 5 Minutes | 20 | 3.1% |
| 5 to 9 Minutes | 0 | 0.0% |
| 10 to 14 Minutes | 36 | 5.5% |
| 15 to 19 Minutes | 76 | 11.7% |
| 20 to 24 Minutes | 46 | 7.1% |
| 25 to 29 Minutes | 93 | 14.3% |
| 30 to 34 Minutes | 78 | 12.0% |
| 35 to 39 Minutes | 4 | 0.6% |
| 40 to 44 Minutes | 56 | 8.6% |
| 45 to 59 Minutes | 57 | 8.8% |
| 60 to 89 Minutes | 120 | 18.4% |
| 90 or more Minutes | 65 | 10.0% |
Commute Time by Sex in Old Brookville
The most common commute times in Old Brookville are 25 to 29 minutes (74 commuters, 18.6%) for males and 60 to 89 minutes (55 commuters, 21.6%) for females.
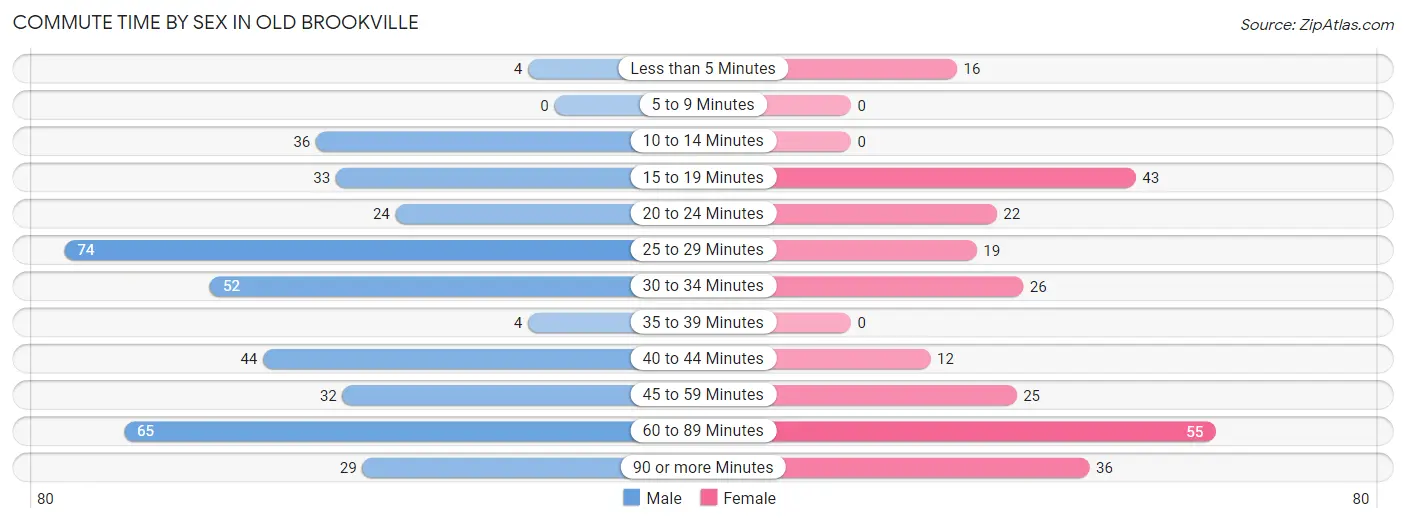
| Commute Time | Male | Female |
| Less than 5 Minutes | 4 (1.0%) | 16 (6.3%) |
| 5 to 9 Minutes | 0 (0.0%) | 0 (0.0%) |
| 10 to 14 Minutes | 36 (9.1%) | 0 (0.0%) |
| 15 to 19 Minutes | 33 (8.3%) | 43 (16.9%) |
| 20 to 24 Minutes | 24 (6.0%) | 22 (8.7%) |
| 25 to 29 Minutes | 74 (18.6%) | 19 (7.5%) |
| 30 to 34 Minutes | 52 (13.1%) | 26 (10.2%) |
| 35 to 39 Minutes | 4 (1.0%) | 0 (0.0%) |
| 40 to 44 Minutes | 44 (11.1%) | 12 (4.7%) |
| 45 to 59 Minutes | 32 (8.1%) | 25 (9.8%) |
| 60 to 89 Minutes | 65 (16.4%) | 55 (21.6%) |
| 90 or more Minutes | 29 (7.3%) | 36 (14.2%) |
Time of Departure to Work by Sex in Old Brookville
The most frequent times of departure to work in Old Brookville are 8:30 AM to 8:59 AM (126, 31.7%) for males and 7:30 AM to 7:59 AM (60, 23.6%) for females.
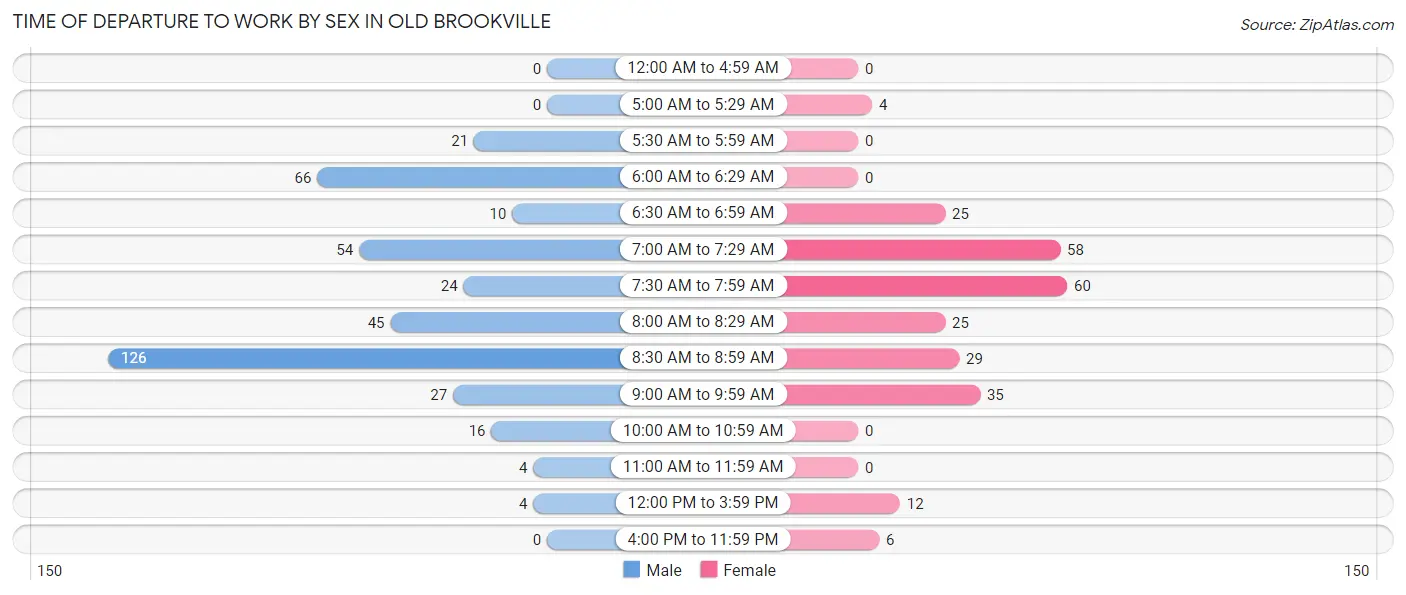
| Time of Departure | Male | Female |
| 12:00 AM to 4:59 AM | 0 (0.0%) | 0 (0.0%) |
| 5:00 AM to 5:29 AM | 0 (0.0%) | 4 (1.6%) |
| 5:30 AM to 5:59 AM | 21 (5.3%) | 0 (0.0%) |
| 6:00 AM to 6:29 AM | 66 (16.6%) | 0 (0.0%) |
| 6:30 AM to 6:59 AM | 10 (2.5%) | 25 (9.8%) |
| 7:00 AM to 7:29 AM | 54 (13.6%) | 58 (22.8%) |
| 7:30 AM to 7:59 AM | 24 (6.0%) | 60 (23.6%) |
| 8:00 AM to 8:29 AM | 45 (11.3%) | 25 (9.8%) |
| 8:30 AM to 8:59 AM | 126 (31.7%) | 29 (11.4%) |
| 9:00 AM to 9:59 AM | 27 (6.8%) | 35 (13.8%) |
| 10:00 AM to 10:59 AM | 16 (4.0%) | 0 (0.0%) |
| 11:00 AM to 11:59 AM | 4 (1.0%) | 0 (0.0%) |
| 12:00 PM to 3:59 PM | 4 (1.0%) | 12 (4.7%) |
| 4:00 PM to 11:59 PM | 0 (0.0%) | 6 (2.4%) |
| Total | 397 (100.0%) | 254 (100.0%) |
Housing Occupancy in Old Brookville
Occupancy by Ownership in Old Brookville
Of the total 605 dwellings in Old Brookville, owner-occupied units account for 495 (81.8%), while renter-occupied units make up 110 (18.2%).
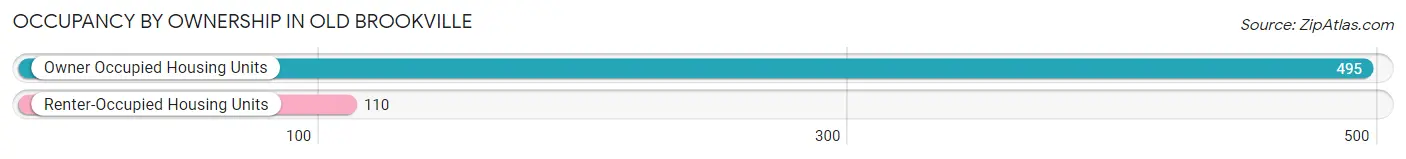
| Occupancy | # Housing Units | % Housing Units |
| Owner Occupied Housing Units | 495 | 81.8% |
| Renter-Occupied Housing Units | 110 | 18.2% |
| Total Occupied Housing Units | 605 | 100.0% |
Occupancy by Household Size in Old Brookville
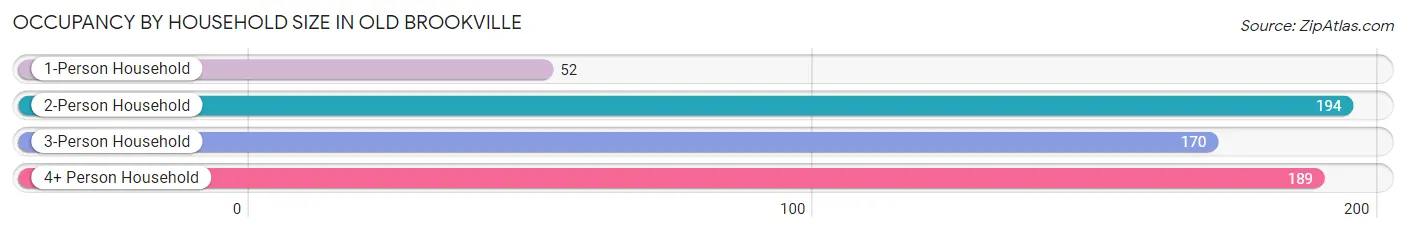
| Household Size | # Housing Units | % Housing Units |
| 1-Person Household | 52 | 8.6% |
| 2-Person Household | 194 | 32.1% |
| 3-Person Household | 170 | 28.1% |
| 4+ Person Household | 189 | 31.2% |
| Total Housing Units | 605 | 100.0% |
Occupancy by Ownership by Household Size in Old Brookville
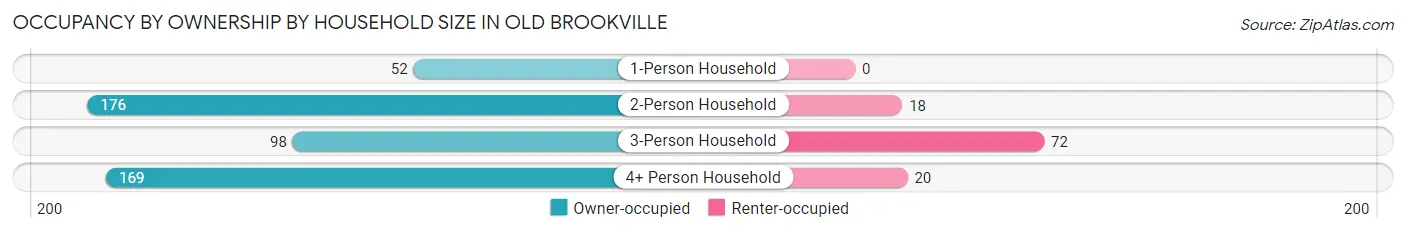
| Household Size | Owner-occupied | Renter-occupied |
| 1-Person Household | 52 (100.0%) | 0 (0.0%) |
| 2-Person Household | 176 (90.7%) | 18 (9.3%) |
| 3-Person Household | 98 (57.7%) | 72 (42.3%) |
| 4+ Person Household | 169 (89.4%) | 20 (10.6%) |
| Total Housing Units | 495 (81.8%) | 110 (18.2%) |
Occupancy by Educational Attainment in Old Brookville
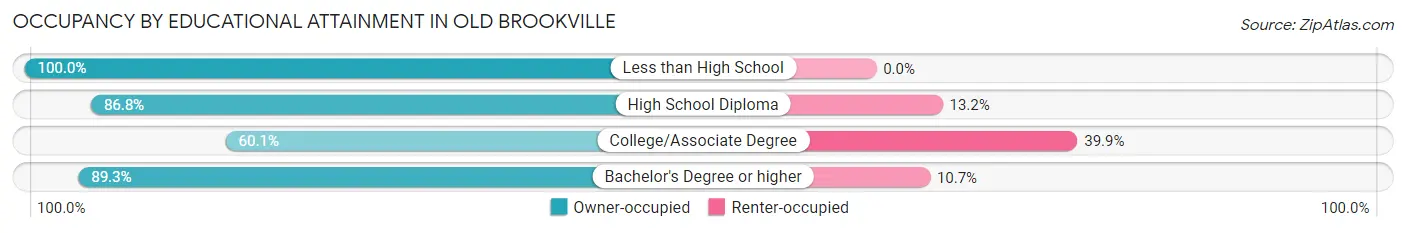
| Household Size | Owner-occupied | Renter-occupied |
| Less than High School | 24 (100.0%) | 0 (0.0%) |
| High School Diploma | 66 (86.8%) | 10 (13.2%) |
| College/Associate Degree | 95 (60.1%) | 63 (39.9%) |
| Bachelor's Degree or higher | 310 (89.3%) | 37 (10.7%) |
Occupancy by Age of Householder in Old Brookville
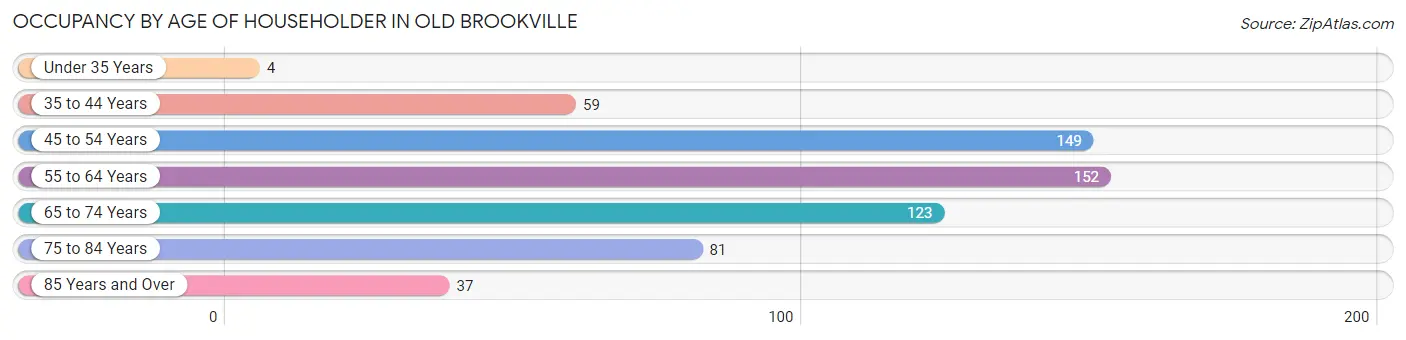
| Age Bracket | # Households | % Households |
| Under 35 Years | 4 | 0.7% |
| 35 to 44 Years | 59 | 9.8% |
| 45 to 54 Years | 149 | 24.6% |
| 55 to 64 Years | 152 | 25.1% |
| 65 to 74 Years | 123 | 20.3% |
| 75 to 84 Years | 81 | 13.4% |
| 85 Years and Over | 37 | 6.1% |
| Total | 605 | 100.0% |
Housing Finances in Old Brookville
Median Income by Occupancy in Old Brookville
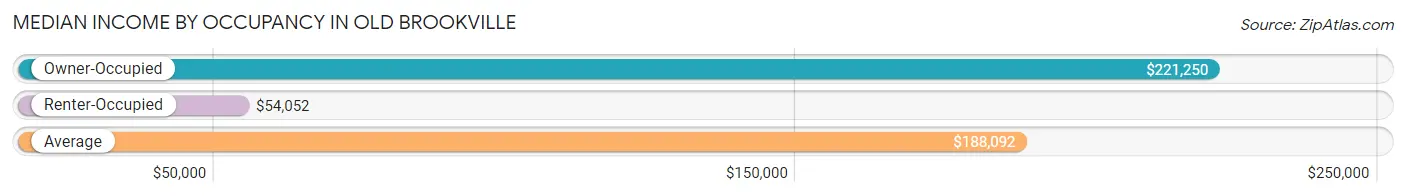
| Occupancy Type | # Households | Median Income |
| Owner-Occupied | 495 (81.8%) | $221,250 |
| Renter-Occupied | 110 (18.2%) | $54,052 |
| Average | 605 (100.0%) | $188,092 |
Occupancy by Householder Income Bracket in Old Brookville
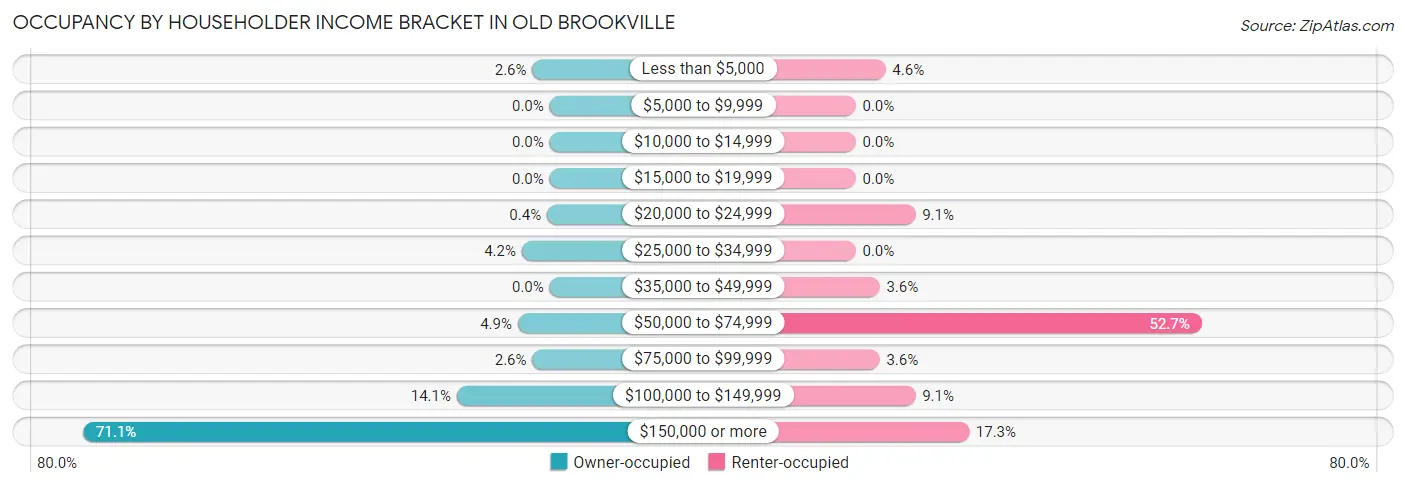
| Income Bracket | Owner-occupied | Renter-occupied |
| Less than $5,000 | 13 (2.6%) | 5 (4.5%) |
| $5,000 to $9,999 | 0 (0.0%) | 0 (0.0%) |
| $10,000 to $14,999 | 0 (0.0%) | 0 (0.0%) |
| $15,000 to $19,999 | 0 (0.0%) | 0 (0.0%) |
| $20,000 to $24,999 | 2 (0.4%) | 10 (9.1%) |
| $25,000 to $34,999 | 21 (4.2%) | 0 (0.0%) |
| $35,000 to $49,999 | 0 (0.0%) | 4 (3.6%) |
| $50,000 to $74,999 | 24 (4.9%) | 58 (52.7%) |
| $75,000 to $99,999 | 13 (2.6%) | 4 (3.6%) |
| $100,000 to $149,999 | 70 (14.1%) | 10 (9.1%) |
| $150,000 or more | 352 (71.1%) | 19 (17.3%) |
| Total | 495 (100.0%) | 110 (100.0%) |
Monthly Housing Cost Tiers in Old Brookville
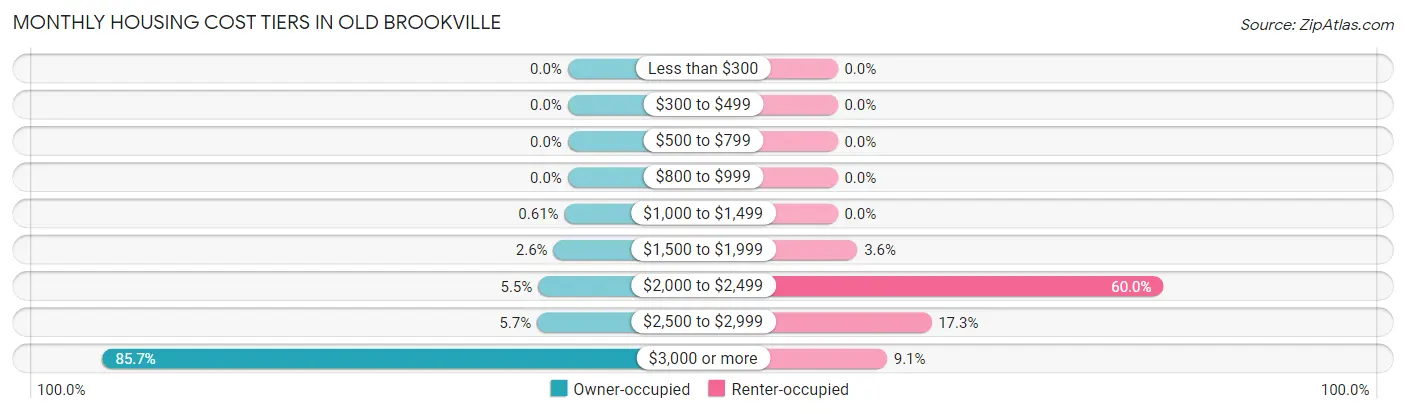
| Monthly Cost | Owner-occupied | Renter-occupied |
| Less than $300 | 0 (0.0%) | 0 (0.0%) |
| $300 to $499 | 0 (0.0%) | 0 (0.0%) |
| $500 to $799 | 0 (0.0%) | 0 (0.0%) |
| $800 to $999 | 0 (0.0%) | 0 (0.0%) |
| $1,000 to $1,499 | 3 (0.6%) | 0 (0.0%) |
| $1,500 to $1,999 | 13 (2.6%) | 4 (3.6%) |
| $2,000 to $2,499 | 27 (5.4%) | 66 (60.0%) |
| $2,500 to $2,999 | 28 (5.7%) | 19 (17.3%) |
| $3,000 or more | 424 (85.7%) | 10 (9.1%) |
| Total | 495 (100.0%) | 110 (100.0%) |
Physical Housing Characteristics in Old Brookville
Housing Structures in Old Brookville
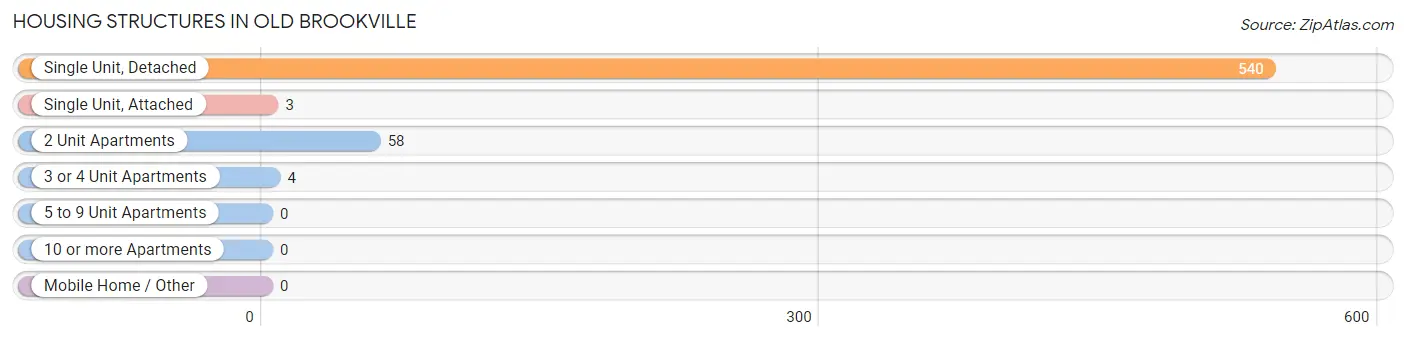
| Structure Type | # Housing Units | % Housing Units |
| Single Unit, Detached | 540 | 89.3% |
| Single Unit, Attached | 3 | 0.5% |
| 2 Unit Apartments | 58 | 9.6% |
| 3 or 4 Unit Apartments | 4 | 0.7% |
| 5 to 9 Unit Apartments | 0 | 0.0% |
| 10 or more Apartments | 0 | 0.0% |
| Mobile Home / Other | 0 | 0.0% |
| Total | 605 | 100.0% |
Housing Structures by Occupancy in Old Brookville
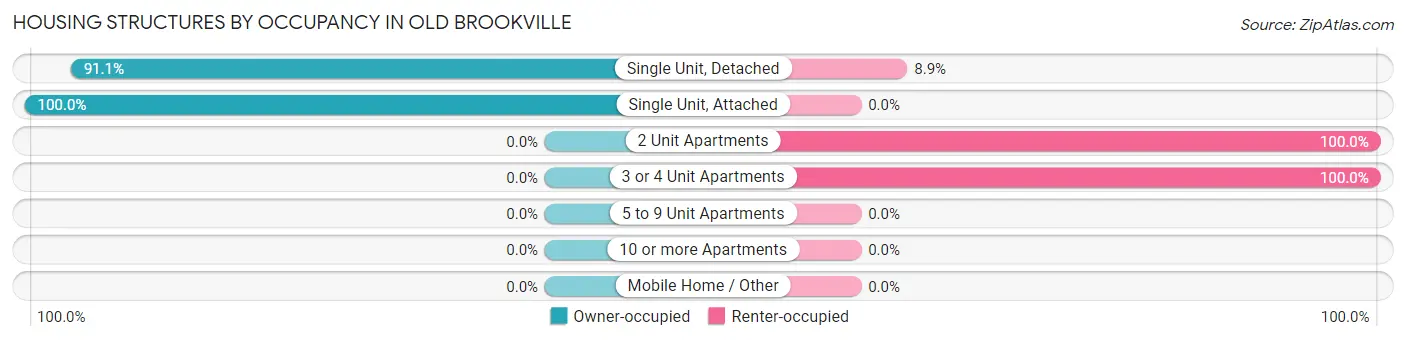
| Structure Type | Owner-occupied | Renter-occupied |
| Single Unit, Detached | 492 (91.1%) | 48 (8.9%) |
| Single Unit, Attached | 3 (100.0%) | 0 (0.0%) |
| 2 Unit Apartments | 0 (0.0%) | 58 (100.0%) |
| 3 or 4 Unit Apartments | 0 (0.0%) | 4 (100.0%) |
| 5 to 9 Unit Apartments | 0 (0.0%) | 0 (0.0%) |
| 10 or more Apartments | 0 (0.0%) | 0 (0.0%) |
| Mobile Home / Other | 0 (0.0%) | 0 (0.0%) |
| Total | 495 (81.8%) | 110 (18.2%) |
Housing Structures by Number of Rooms in Old Brookville
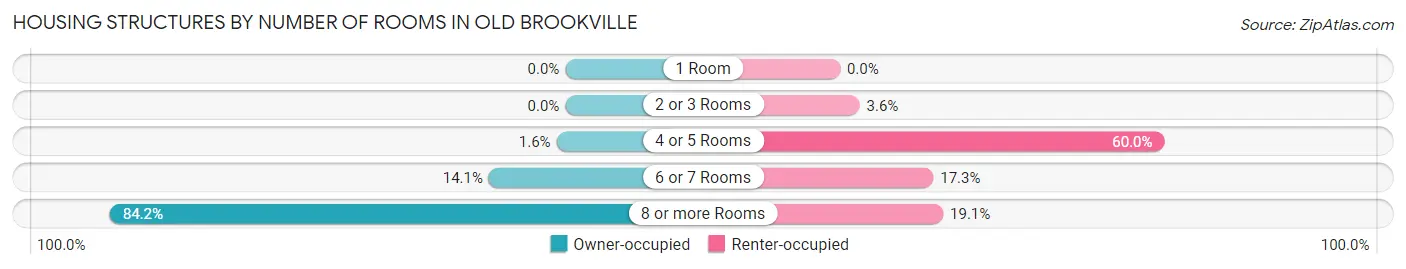
| Number of Rooms | Owner-occupied | Renter-occupied |
| 1 Room | 0 (0.0%) | 0 (0.0%) |
| 2 or 3 Rooms | 0 (0.0%) | 4 (3.6%) |
| 4 or 5 Rooms | 8 (1.6%) | 66 (60.0%) |
| 6 or 7 Rooms | 70 (14.1%) | 19 (17.3%) |
| 8 or more Rooms | 417 (84.2%) | 21 (19.1%) |
| Total | 495 (100.0%) | 110 (100.0%) |
Housing Structure by Heating Type in Old Brookville
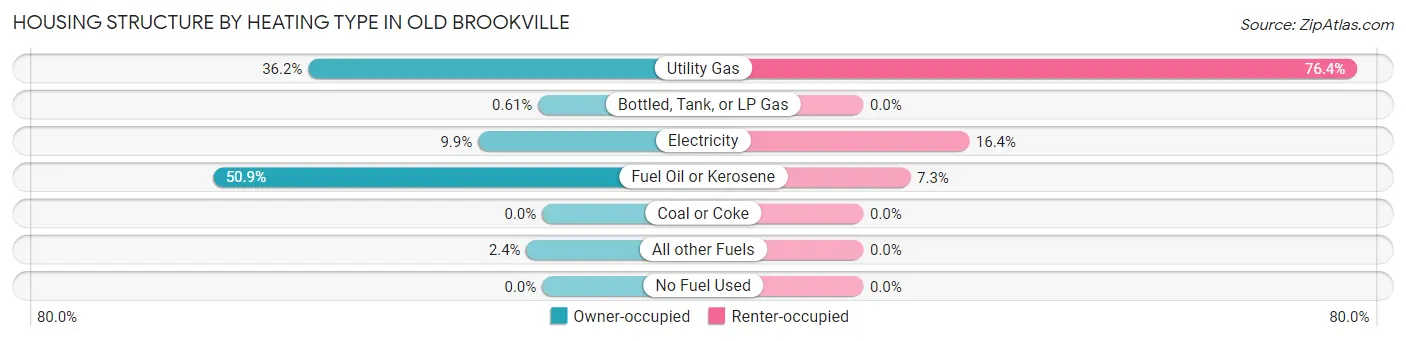
| Heating Type | Owner-occupied | Renter-occupied |
| Utility Gas | 179 (36.2%) | 84 (76.4%) |
| Bottled, Tank, or LP Gas | 3 (0.6%) | 0 (0.0%) |
| Electricity | 49 (9.9%) | 18 (16.4%) |
| Fuel Oil or Kerosene | 252 (50.9%) | 8 (7.3%) |
| Coal or Coke | 0 (0.0%) | 0 (0.0%) |
| All other Fuels | 12 (2.4%) | 0 (0.0%) |
| No Fuel Used | 0 (0.0%) | 0 (0.0%) |
| Total | 495 (100.0%) | 110 (100.0%) |
Household Vehicle Usage in Old Brookville
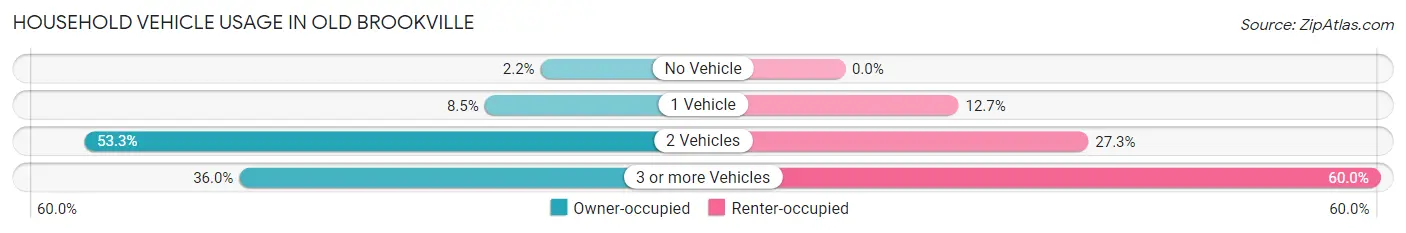
| Vehicles per Household | Owner-occupied | Renter-occupied |
| No Vehicle | 11 (2.2%) | 0 (0.0%) |
| 1 Vehicle | 42 (8.5%) | 14 (12.7%) |
| 2 Vehicles | 264 (53.3%) | 30 (27.3%) |
| 3 or more Vehicles | 178 (36.0%) | 66 (60.0%) |
| Total | 495 (100.0%) | 110 (100.0%) |
Real Estate & Mortgages in Old Brookville
Real Estate and Mortgage Overview in Old Brookville
| Characteristic | Without Mortgage | With Mortgage |
| Housing Units | 188 | 307 |
| Median Property Value | $1,781,300 | $2,000,001 |
| Median Household Income | $160,833 | $246 |
| Monthly Housing Costs | $1,501 | $303 |
| Real Estate Taxes | $10,001 | $0 |
Property Value by Mortgage Status in Old Brookville
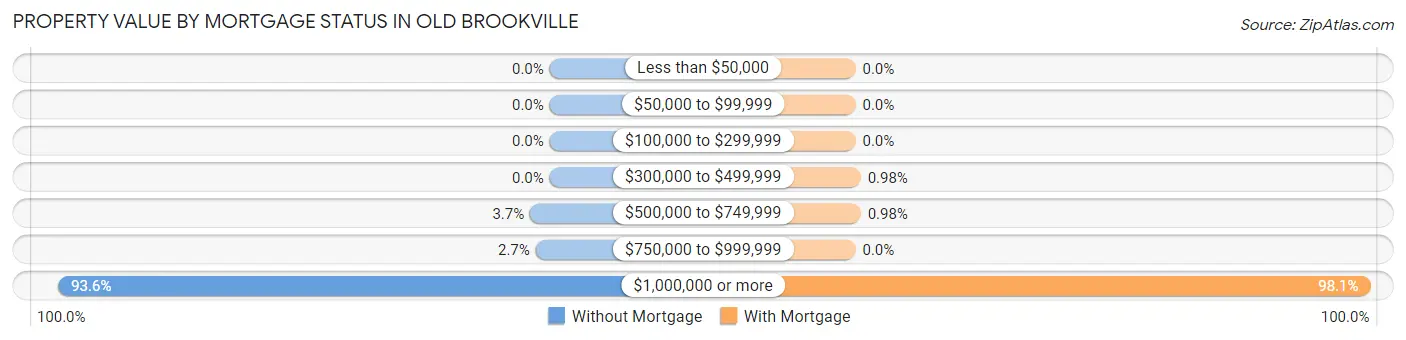
| Property Value | Without Mortgage | With Mortgage |
| Less than $50,000 | 0 (0.0%) | 0 (0.0%) |
| $50,000 to $99,999 | 0 (0.0%) | 0 (0.0%) |
| $100,000 to $299,999 | 0 (0.0%) | 0 (0.0%) |
| $300,000 to $499,999 | 0 (0.0%) | 3 (1.0%) |
| $500,000 to $749,999 | 7 (3.7%) | 3 (1.0%) |
| $750,000 to $999,999 | 5 (2.7%) | 0 (0.0%) |
| $1,000,000 or more | 176 (93.6%) | 301 (98.1%) |
| Total | 188 (100.0%) | 307 (100.0%) |
Household Income by Mortgage Status in Old Brookville
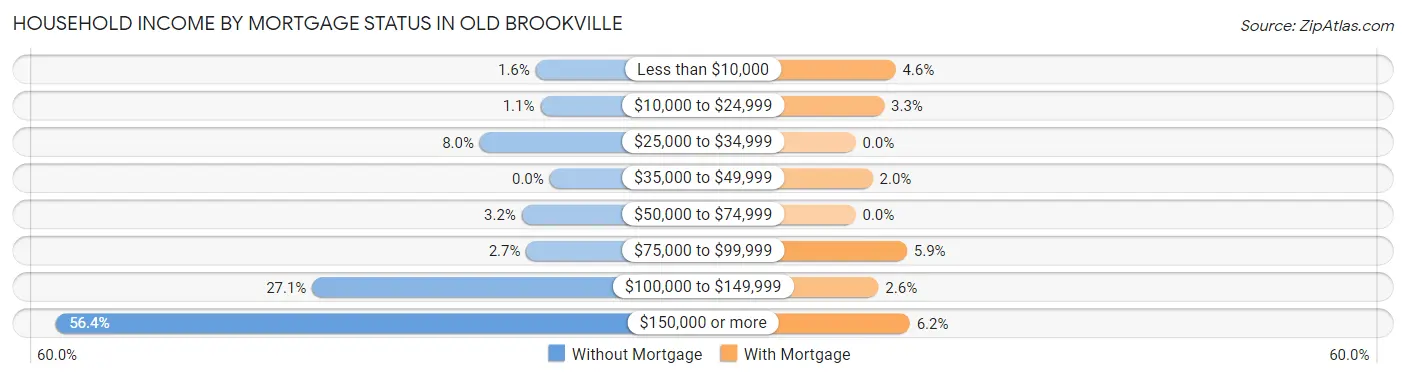
| Household Income | Without Mortgage | With Mortgage |
| Less than $10,000 | 3 (1.6%) | 14 (4.6%) |
| $10,000 to $24,999 | 2 (1.1%) | 10 (3.3%) |
| $25,000 to $34,999 | 15 (8.0%) | 0 (0.0%) |
| $35,000 to $49,999 | 0 (0.0%) | 6 (1.9%) |
| $50,000 to $74,999 | 6 (3.2%) | 0 (0.0%) |
| $75,000 to $99,999 | 5 (2.7%) | 18 (5.9%) |
| $100,000 to $149,999 | 51 (27.1%) | 8 (2.6%) |
| $150,000 or more | 106 (56.4%) | 19 (6.2%) |
| Total | 188 (100.0%) | 307 (100.0%) |
Property Value to Household Income Ratio in Old Brookville
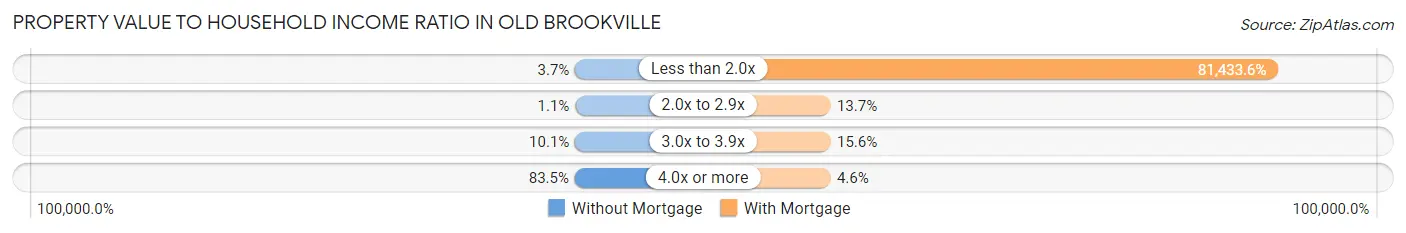
| Value-to-Income Ratio | Without Mortgage | With Mortgage |
| Less than 2.0x | 7 (3.7%) | 250,001 (81,433.6%) |
| 2.0x to 2.9x | 2 (1.1%) | 42 (13.7%) |
| 3.0x to 3.9x | 19 (10.1%) | 48 (15.6%) |
| 4.0x or more | 157 (83.5%) | 14 (4.6%) |
| Total | 188 (100.0%) | 307 (100.0%) |
Real Estate Taxes by Mortgage Status in Old Brookville
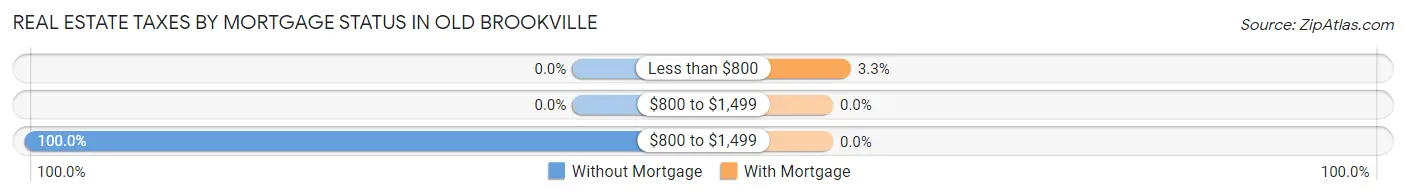
| Property Taxes | Without Mortgage | With Mortgage |
| Less than $800 | 0 (0.0%) | 10 (3.3%) |
| $800 to $1,499 | 0 (0.0%) | 0 (0.0%) |
| $800 to $1,499 | 188 (100.0%) | 0 (0.0%) |
| Total | 188 (100.0%) | 307 (100.0%) |
Health & Disability in Old Brookville
Health Insurance Coverage by Age in Old Brookville
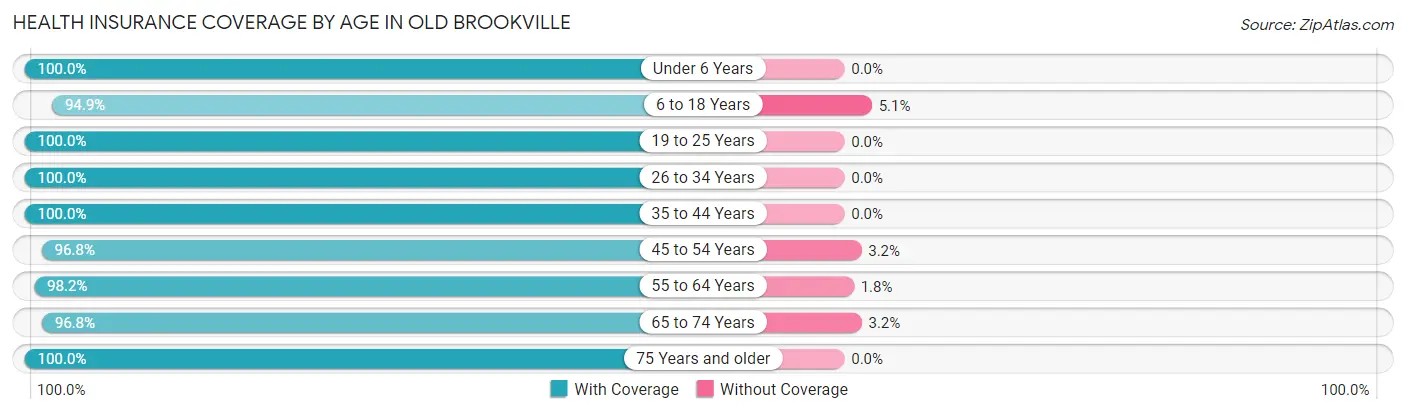
| Age Bracket | With Coverage | Without Coverage |
| Under 6 Years | 117 (100.0%) | 0 (0.0%) |
| 6 to 18 Years | 316 (94.9%) | 17 (5.1%) |
| 19 to 25 Years | 133 (100.0%) | 0 (0.0%) |
| 26 to 34 Years | 87 (100.0%) | 0 (0.0%) |
| 35 to 44 Years | 156 (100.0%) | 0 (0.0%) |
| 45 to 54 Years | 275 (96.8%) | 9 (3.2%) |
| 55 to 64 Years | 335 (98.2%) | 6 (1.8%) |
| 65 to 74 Years | 181 (96.8%) | 6 (3.2%) |
| 75 Years and older | 196 (100.0%) | 0 (0.0%) |
| Total | 1,796 (97.9%) | 38 (2.1%) |
Health Insurance Coverage by Citizenship Status in Old Brookville
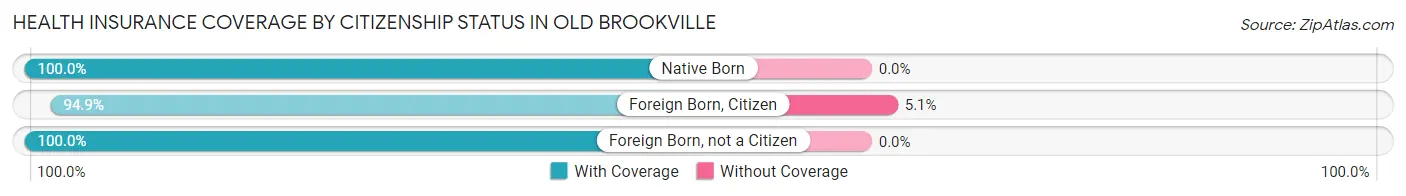
| Citizenship Status | With Coverage | Without Coverage |
| Native Born | 117 (100.0%) | 0 (0.0%) |
| Foreign Born, Citizen | 316 (94.9%) | 17 (5.1%) |
| Foreign Born, not a Citizen | 133 (100.0%) | 0 (0.0%) |
Health Insurance Coverage by Household Income in Old Brookville
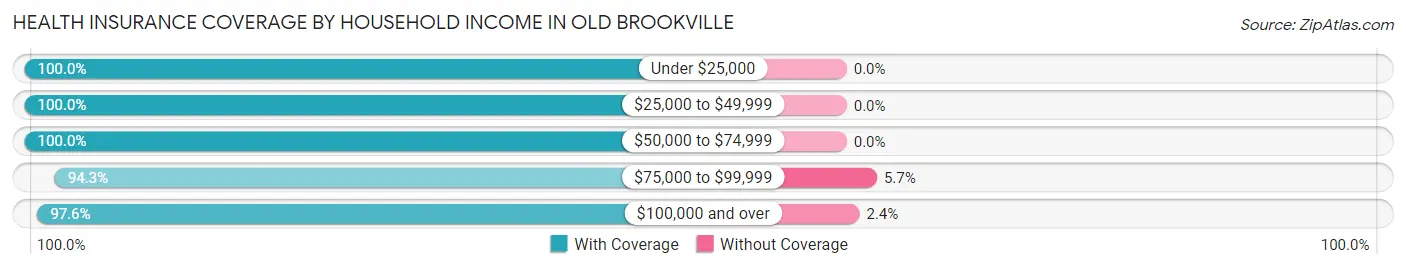
| Household Income | With Coverage | Without Coverage |
| Under $25,000 | 56 (100.0%) | 0 (0.0%) |
| $25,000 to $49,999 | 61 (100.0%) | 0 (0.0%) |
| $50,000 to $74,999 | 189 (100.0%) | 0 (0.0%) |
| $75,000 to $99,999 | 50 (94.3%) | 3 (5.7%) |
| $100,000 and over | 1,432 (97.6%) | 35 (2.4%) |
Public vs Private Health Insurance Coverage by Age in Old Brookville
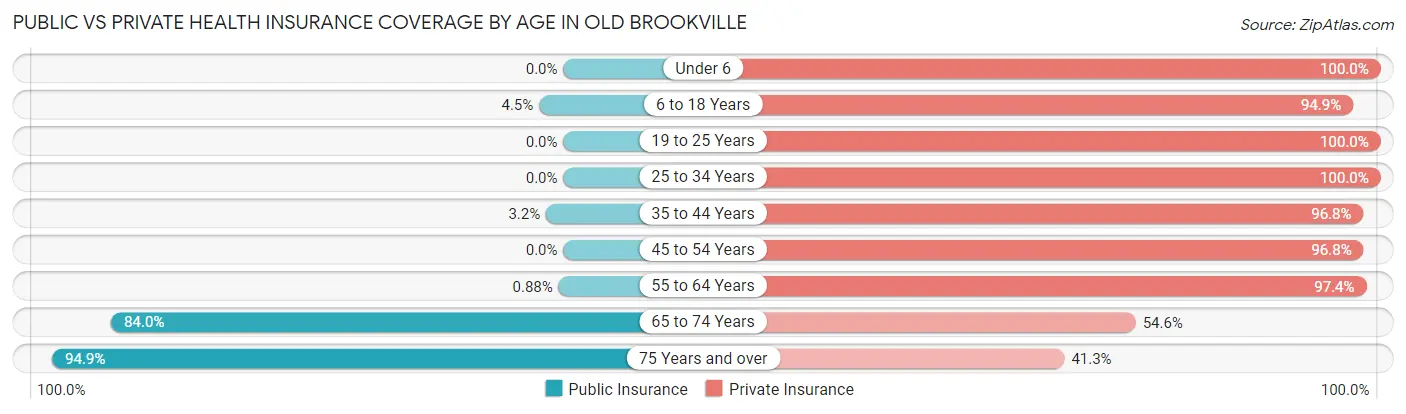
| Age Bracket | Public Insurance | Private Insurance |
| Under 6 | 0 (0.0%) | 117 (100.0%) |
| 6 to 18 Years | 15 (4.5%) | 316 (94.9%) |
| 19 to 25 Years | 0 (0.0%) | 133 (100.0%) |
| 25 to 34 Years | 0 (0.0%) | 87 (100.0%) |
| 35 to 44 Years | 5 (3.2%) | 151 (96.8%) |
| 45 to 54 Years | 0 (0.0%) | 275 (96.8%) |
| 55 to 64 Years | 3 (0.9%) | 332 (97.4%) |
| 65 to 74 Years | 157 (84.0%) | 102 (54.5%) |
| 75 Years and over | 186 (94.9%) | 81 (41.3%) |
| Total | 366 (20.0%) | 1,594 (86.9%) |
Disability Status by Sex by Age in Old Brookville
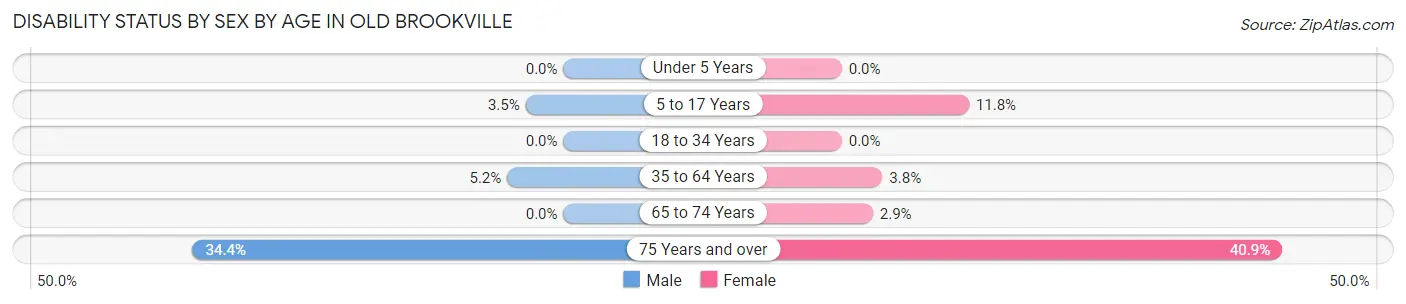
| Age Bracket | Male | Female |
| Under 5 Years | 0 (0.0%) | 0 (0.0%) |
| 5 to 17 Years | 6 (3.5%) | 19 (11.8%) |
| 18 to 34 Years | 0 (0.0%) | 0 (0.0%) |
| 35 to 64 Years | 20 (5.2%) | 15 (3.8%) |
| 65 to 74 Years | 0 (0.0%) | 3 (2.9%) |
| 75 Years and over | 43 (34.4%) | 29 (40.8%) |
Disability Class by Sex by Age in Old Brookville
Disability Class: Hearing Difficulty
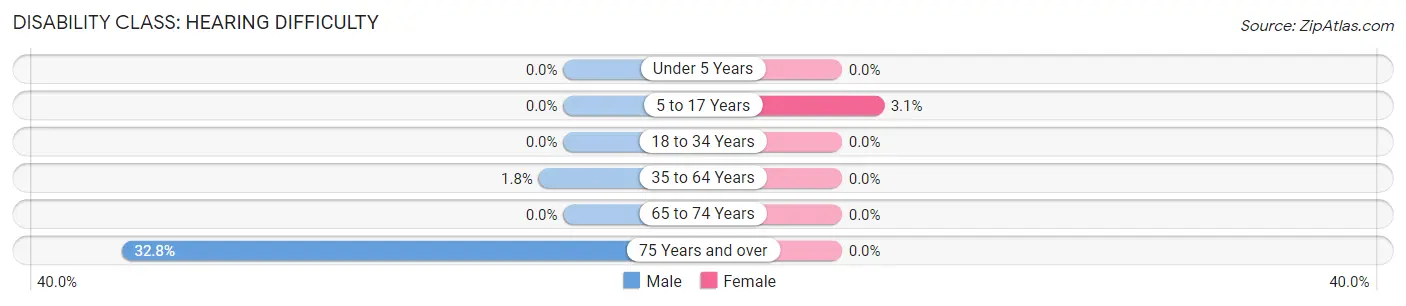
| Age Bracket | Male | Female |
| Under 5 Years | 0 (0.0%) | 0 (0.0%) |
| 5 to 17 Years | 0 (0.0%) | 5 (3.1%) |
| 18 to 34 Years | 0 (0.0%) | 0 (0.0%) |
| 35 to 64 Years | 7 (1.8%) | 0 (0.0%) |
| 65 to 74 Years | 0 (0.0%) | 0 (0.0%) |
| 75 Years and over | 41 (32.8%) | 0 (0.0%) |
Disability Class: Vision Difficulty
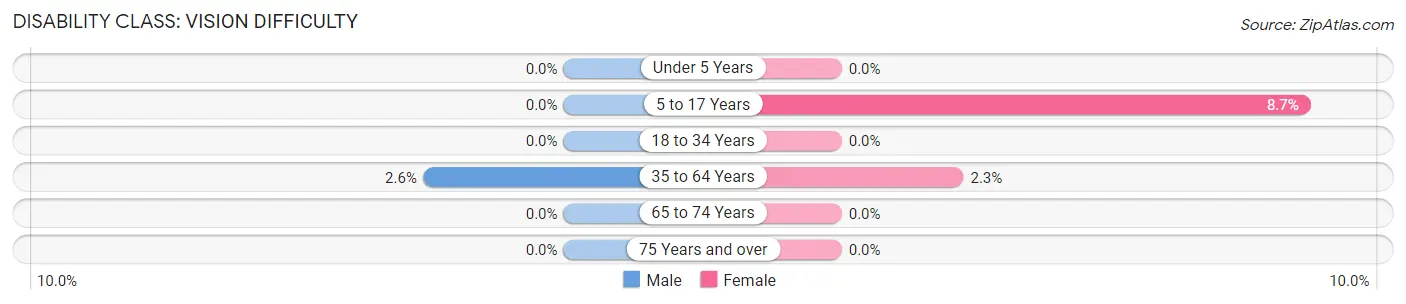
| Age Bracket | Male | Female |
| Under 5 Years | 0 (0.0%) | 0 (0.0%) |
| 5 to 17 Years | 0 (0.0%) | 14 (8.7%) |
| 18 to 34 Years | 0 (0.0%) | 0 (0.0%) |
| 35 to 64 Years | 10 (2.6%) | 9 (2.3%) |
| 65 to 74 Years | 0 (0.0%) | 0 (0.0%) |
| 75 Years and over | 0 (0.0%) | 0 (0.0%) |
Disability Class: Cognitive Difficulty
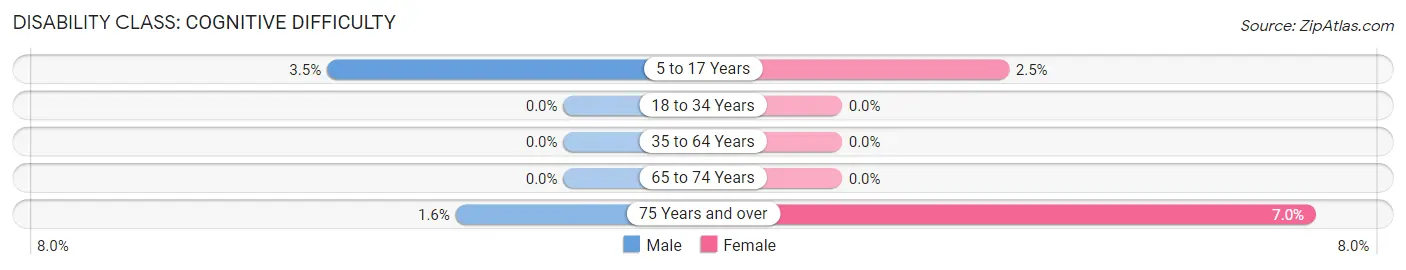
| Age Bracket | Male | Female |
| 5 to 17 Years | 6 (3.5%) | 4 (2.5%) |
| 18 to 34 Years | 0 (0.0%) | 0 (0.0%) |
| 35 to 64 Years | 0 (0.0%) | 0 (0.0%) |
| 65 to 74 Years | 0 (0.0%) | 0 (0.0%) |
| 75 Years and over | 2 (1.6%) | 5 (7.0%) |
Disability Class: Ambulatory Difficulty
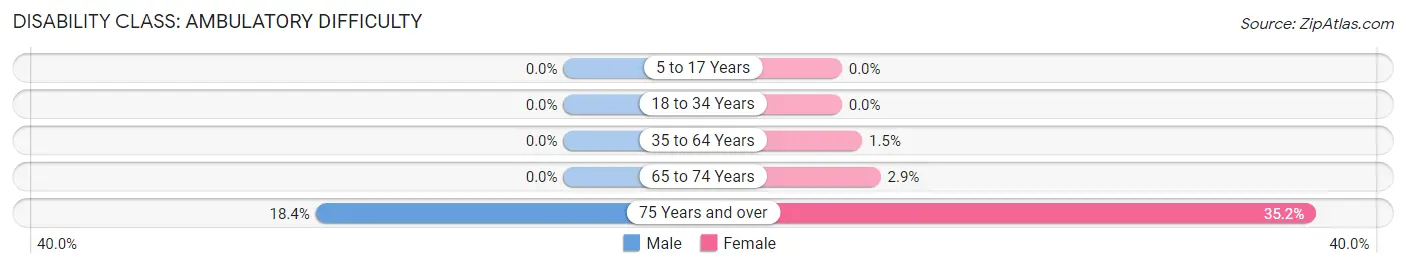
| Age Bracket | Male | Female |
| 5 to 17 Years | 0 (0.0%) | 0 (0.0%) |
| 18 to 34 Years | 0 (0.0%) | 0 (0.0%) |
| 35 to 64 Years | 0 (0.0%) | 6 (1.5%) |
| 65 to 74 Years | 0 (0.0%) | 3 (2.9%) |
| 75 Years and over | 23 (18.4%) | 25 (35.2%) |
Disability Class: Self-Care Difficulty
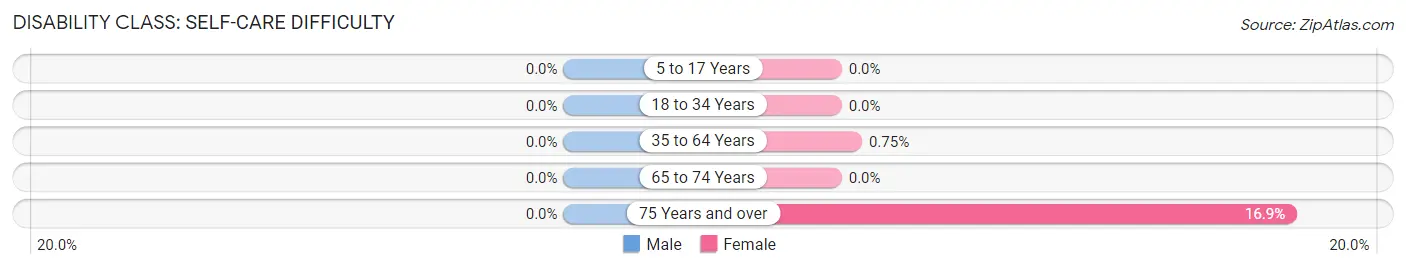
| Age Bracket | Male | Female |
| 5 to 17 Years | 0 (0.0%) | 0 (0.0%) |
| 18 to 34 Years | 0 (0.0%) | 0 (0.0%) |
| 35 to 64 Years | 0 (0.0%) | 3 (0.7%) |
| 65 to 74 Years | 0 (0.0%) | 0 (0.0%) |
| 75 Years and over | 0 (0.0%) | 12 (16.9%) |
Technology Access in Old Brookville
Computing Device Access in Old Brookville
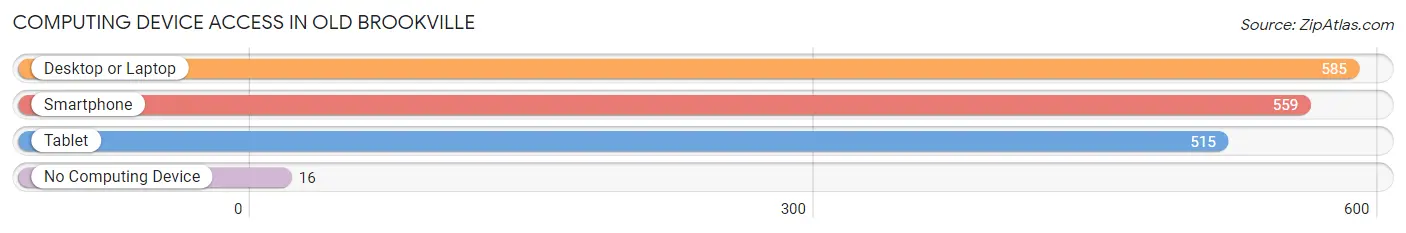
| Device Type | # Households | % Households |
| Desktop or Laptop | 585 | 96.7% |
| Smartphone | 559 | 92.4% |
| Tablet | 515 | 85.1% |
| No Computing Device | 16 | 2.6% |
| Total | 605 | 100.0% |
Internet Access in Old Brookville
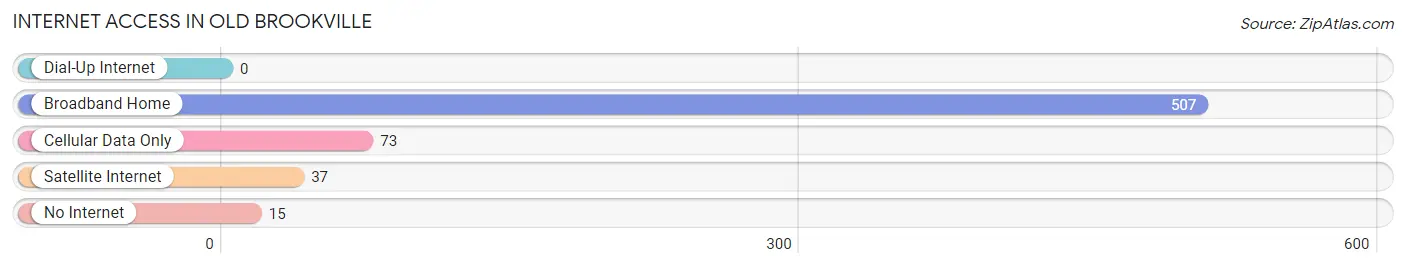
| Internet Type | # Households | % Households |
| Dial-Up Internet | 0 | 0.0% |
| Broadband Home | 507 | 83.8% |
| Cellular Data Only | 73 | 12.1% |
| Satellite Internet | 37 | 6.1% |
| No Internet | 15 | 2.5% |
| Total | 605 | 100.0% |
Old Brookville Summary
Brookville, New York is a small village located in the Town of Oyster Bay in Nassau County, New York. It is situated on the north shore of Long Island, approximately 25 miles east of Manhattan. The village is known for its affluent population and its picturesque setting, with many large estates and historic homes.
History
The area that is now Brookville was originally inhabited by the Matinecock Native American tribe. The first European settlers arrived in the area in the late 1600s, and the village was officially established in 1787. The village was originally known as “Old Mill”, and was renamed “Brookville” in 1845.
The village was a popular summer destination for wealthy New Yorkers in the late 19th and early 20th centuries. Many of the grand estates that were built during this period still stand today. The village was also home to the first golf course in Nassau County, which opened in 1895.
Geography
Brookville is located in the Town of Oyster Bay in Nassau County, New York. It is situated on the north shore of Long Island, approximately 25 miles east of Manhattan. The village is bordered by the villages of Muttontown to the east, Upper Brookville to the south, and Old Westbury to the west.
The village covers an area of 2.2 square miles, and is home to a population of approximately 2,500 people. The terrain is mostly flat, with some rolling hills. The village is located in the Peconic Bay watershed, and is home to several small streams and ponds.
Economy
The economy of Brookville is largely based on the service industry. Many of the village’s residents are employed in the financial services, legal, and medical fields. The village is also home to several small businesses, including restaurants, retail stores, and professional services.
The village is also home to several large estates, which are often used for corporate events and private functions. These estates are also popular tourist attractions, and attract visitors from all over the world.
Demographics
As of the 2010 census, the population of Brookville was 2,521. The racial makeup of the village was 94.3% White, 1.2% African American, 0.2% Native American, 2.2% Asian, 0.1% Pacific Islander, 0.7% from other races, and 1.5% from two or more races. Hispanic or Latino of any race were 3.2% of the population.
The median household income in Brookville was $150,000, and the median family income was $170,000. The per capita income for the village was $80,000. About 4.2% of families and 5.3% of the population were below the poverty line, including 6.2% of those under age 18 and 4.2% of those age 65 or over.
Brookville is a small village with a rich history and a vibrant economy. It is home to many affluent residents, and is a popular destination for tourists from all over the world. The village is known for its picturesque setting and its many historic homes and estates.
Common Questions
What is Per Capita Income in Old Brookville?
Per Capita income in Old Brookville is $133,486.
What is the Median Family Income in Old Brookville?
Median Family Income in Old Brookville is $189,833.
What is the Median Household income in Old Brookville?
Median Household Income in Old Brookville is $188,092.
What is Income or Wage Gap in Old Brookville?
Income or Wage Gap in Old Brookville is 43.7%.
Women in Old Brookville earn 56.3 cents for every dollar earned by a man.
What is Inequality or Gini Index in Old Brookville?
Inequality or Gini Index in Old Brookville is 0.55.
What is the Total Population of Old Brookville?
Total Population of Old Brookville is 1,834.
What is the Total Male Population of Old Brookville?
Total Male Population of Old Brookville is 949.
What is the Total Female Population of Old Brookville?
Total Female Population of Old Brookville is 885.
What is the Ratio of Males per 100 Females in Old Brookville?
There are 107.23 Males per 100 Females in Old Brookville.
What is the Ratio of Females per 100 Males in Old Brookville?
There are 93.26 Females per 100 Males in Old Brookville.
What is the Median Population Age in Old Brookville?
Median Population Age in Old Brookville is 48.3 Years.
What is the Average Family Size in Old Brookville
Average Family Size in Old Brookville is 3.2 People.
What is the Average Household Size in Old Brookville
Average Household Size in Old Brookville is 3.0 People.
How Large is the Labor Force in Old Brookville?
There are 872 People in the Labor Forcein in Old Brookville.
What is the Percentage of People in the Labor Force in Old Brookville?
60.2% of People are in the Labor Force in Old Brookville.
What is the Unemployment Rate in Old Brookville?
Unemployment Rate in Old Brookville is 3.2%.