Amagansett, NY Map & Demographics
Amagansett Map
Amagansett Overview
$125,357
PER CAPITA INCOME
$171,250
AVG FAMILY INCOME
$169,000
AVG HOUSEHOLD INCOME
26.8%
WAGE / INCOME GAP [ % ]
73.2¢/ $1
WAGE / INCOME GAP [ $ ]
0.45
INEQUALITY / GINI INDEX
678
TOTAL POPULATION
288
MALE POPULATION
390
FEMALE POPULATION
73.85
MALES / 100 FEMALES
135.42
FEMALES / 100 MALES
63.3
MEDIAN AGE
2.5
AVG FAMILY SIZE
2.0
AVG HOUSEHOLD SIZE
321
LABOR FORCE [ PEOPLE ]
49.5%
PERCENT IN LABOR FORCE
Amagansett Zip Codes
Amagansett Area Codes
Income in Amagansett
Income Overview in Amagansett
Per Capita Income in Amagansett is $125,357, while median incomes of families and households are $171,250 and $169,000 respectively.
| Characteristic | Number | Measure |
| Per Capita Income | 678 | $125,357 |
| Median Family Income | 218 | $171,250 |
| Mean Family Income | 218 | $233,886 |
| Median Household Income | 326 | $169,000 |
| Mean Household Income | 326 | $255,160 |
| Income Deficit | 218 | $0 |
| Wage / Income Gap (%) | 678 | 26.78% |
| Wage / Income Gap ($) | 678 | 73.22¢ per $1 |
| Gini / Inequality Index | 678 | 0.45 |
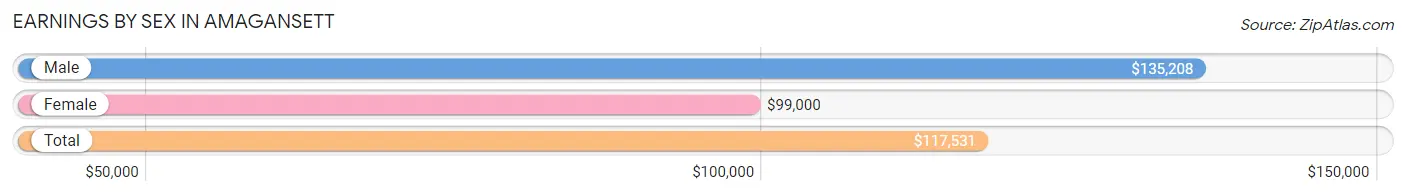
Earnings by Sex in Amagansett
Average Earnings in Amagansett are $117,531, $135,208 for men and $99,000 for women, a difference of 26.8%.
| Sex | Number | Average Earnings |
| Male | 197 (55.5%) | $135,208 |
| Female | 158 (44.5%) | $99,000 |
| Total | 355 (100.0%) | $117,531 |
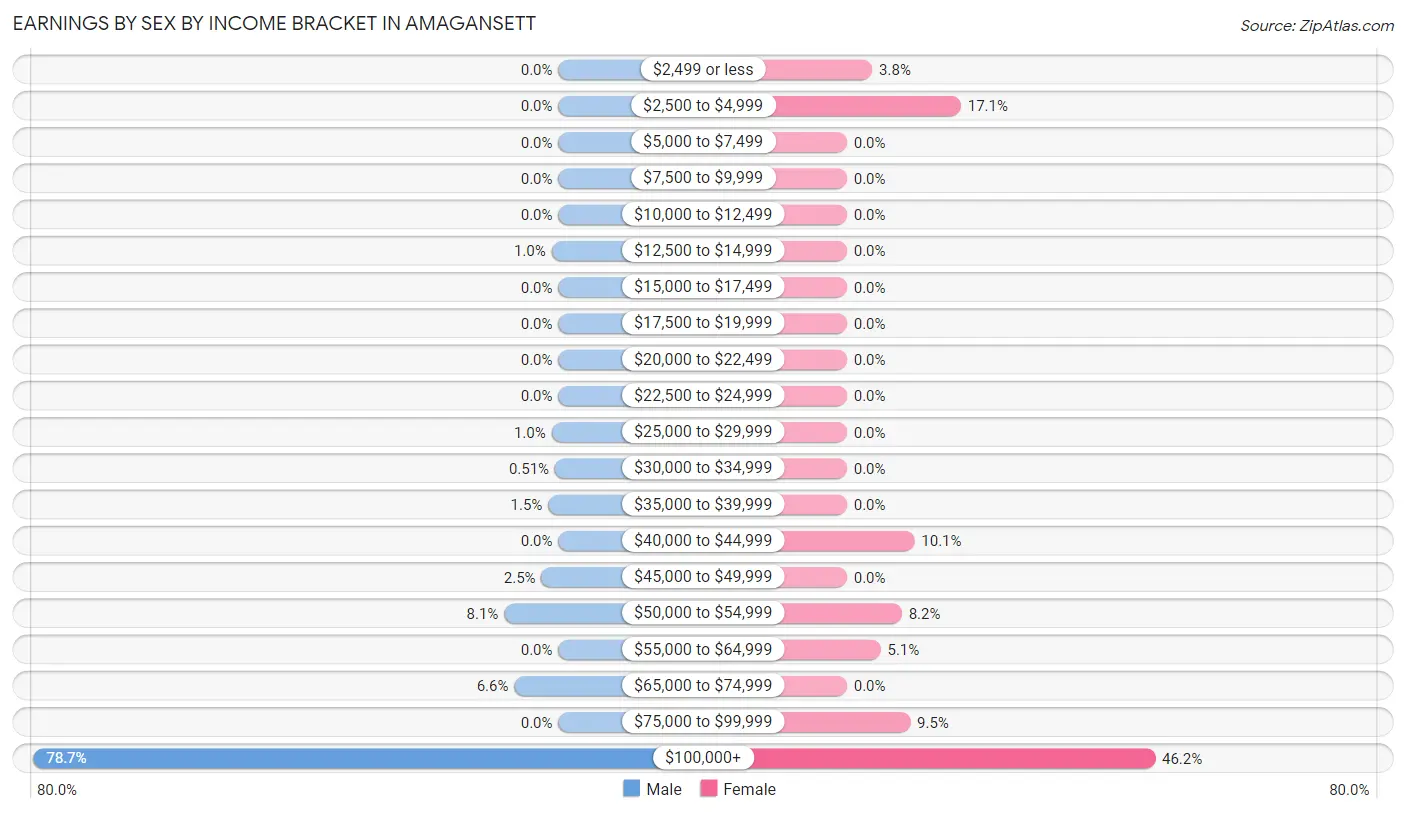
Earnings by Sex by Income Bracket in Amagansett
The most common earnings brackets in Amagansett are $100,000+ for men (155 | 78.7%) and $100,000+ for women (73 | 46.2%).
| Income | Male | Female |
| $2,499 or less | 0 (0.0%) | 6 (3.8%) |
| $2,500 to $4,999 | 0 (0.0%) | 27 (17.1%) |
| $5,000 to $7,499 | 0 (0.0%) | 0 (0.0%) |
| $7,500 to $9,999 | 0 (0.0%) | 0 (0.0%) |
| $10,000 to $12,499 | 0 (0.0%) | 0 (0.0%) |
| $12,500 to $14,999 | 2 (1.0%) | 0 (0.0%) |
| $15,000 to $17,499 | 0 (0.0%) | 0 (0.0%) |
| $17,500 to $19,999 | 0 (0.0%) | 0 (0.0%) |
| $20,000 to $22,499 | 0 (0.0%) | 0 (0.0%) |
| $22,500 to $24,999 | 0 (0.0%) | 0 (0.0%) |
| $25,000 to $29,999 | 2 (1.0%) | 0 (0.0%) |
| $30,000 to $34,999 | 1 (0.5%) | 0 (0.0%) |
| $35,000 to $39,999 | 3 (1.5%) | 0 (0.0%) |
| $40,000 to $44,999 | 0 (0.0%) | 16 (10.1%) |
| $45,000 to $49,999 | 5 (2.5%) | 0 (0.0%) |
| $50,000 to $54,999 | 16 (8.1%) | 13 (8.2%) |
| $55,000 to $64,999 | 0 (0.0%) | 8 (5.1%) |
| $65,000 to $74,999 | 13 (6.6%) | 0 (0.0%) |
| $75,000 to $99,999 | 0 (0.0%) | 15 (9.5%) |
| $100,000+ | 155 (78.7%) | 73 (46.2%) |
| Total | 197 (100.0%) | 158 (100.0%) |
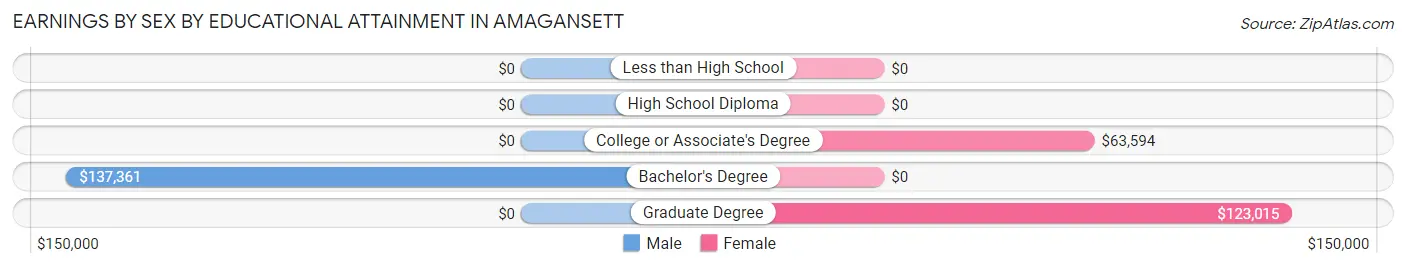
Earnings by Sex by Educational Attainment in Amagansett
Average earnings in Amagansett are $135,347 for men and $116,029 for women, a difference of 14.3%. Men with an educational attainment of bachelor's degree enjoy the highest average annual earnings of $137,361, while those with bachelor's degree education earn the least with $137,361. Women with an educational attainment of graduate degree earn the most with the average annual earnings of $123,015, while those with college or associate's degree education have the smallest earnings of $63,594.
| Educational Attainment | Male Income | Female Income |
| Less than High School | - | - |
| High School Diploma | - | - |
| College or Associate's Degree | - | - |
| Bachelor's Degree | $137,361 | $0 |
| Graduate Degree | - | - |
| Total | $135,347 | $116,029 |
Family Income in Amagansett
Family Income Brackets in Amagansett
According to the Amagansett family income data, there are 100 families falling into the $200,000+ income range, which is the most common income bracket and makes up 45.9% of all families.
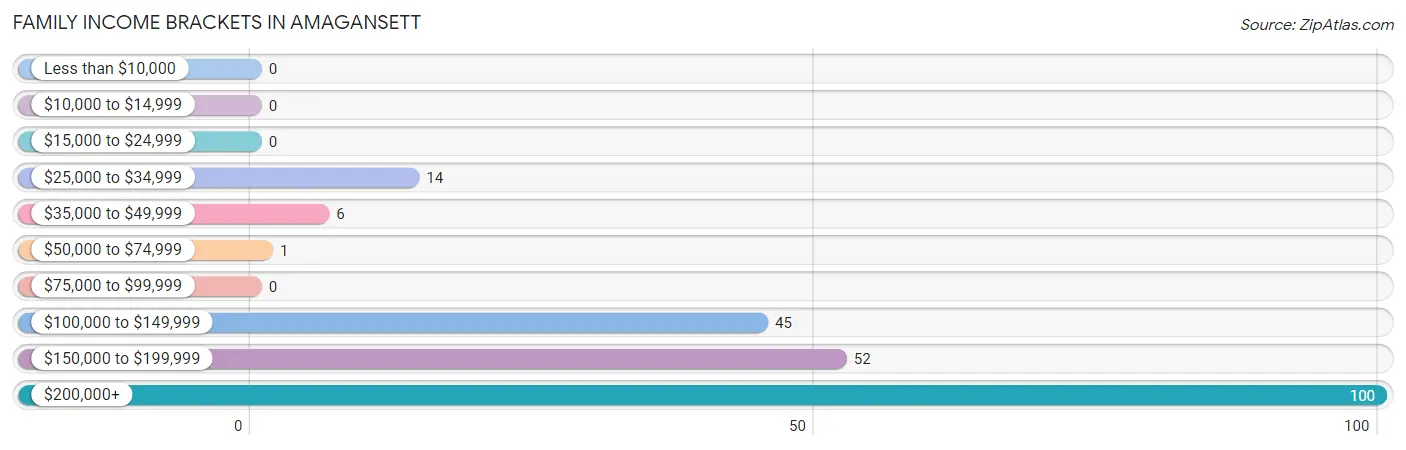
| Income Bracket | # Families | % Families |
| Less than $10,000 | 0 | 0.0% |
| $10,000 to $14,999 | 0 | 0.0% |
| $15,000 to $24,999 | 0 | 0.0% |
| $25,000 to $34,999 | 14 | 6.4% |
| $35,000 to $49,999 | 6 | 2.8% |
| $50,000 to $74,999 | 1 | 0.5% |
| $75,000 to $99,999 | 0 | 0.0% |
| $100,000 to $149,999 | 45 | 20.6% |
| $150,000 to $199,999 | 52 | 23.9% |
| $200,000+ | 100 | 45.9% |
Family Income by Famaliy Size in Amagansett
2-person families (158 | 72.5%) account for the highest median family income in Amagansett with $213,000 per family, while 2-person families (158 | 72.5%) have the highest median income of $106,500 per family member.
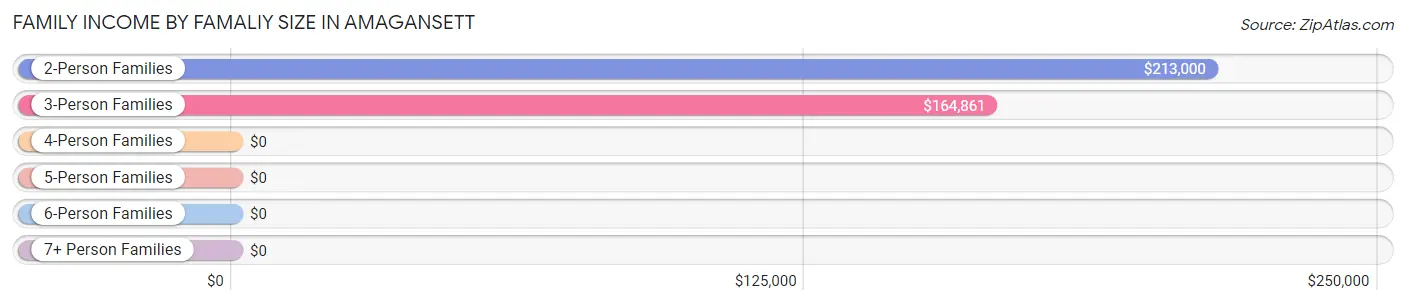
| Income Bracket | # Families | Median Income |
| 2-Person Families | 158 (72.5%) | $213,000 |
| 3-Person Families | 46 (21.1%) | $164,861 |
| 4-Person Families | 14 (6.4%) | $0 |
| 5-Person Families | 0 (0.0%) | $0 |
| 6-Person Families | 0 (0.0%) | $0 |
| 7+ Person Families | 0 (0.0%) | $0 |
| Total | 218 (100.0%) | $171,250 |
Family Income by Number of Earners in Amagansett
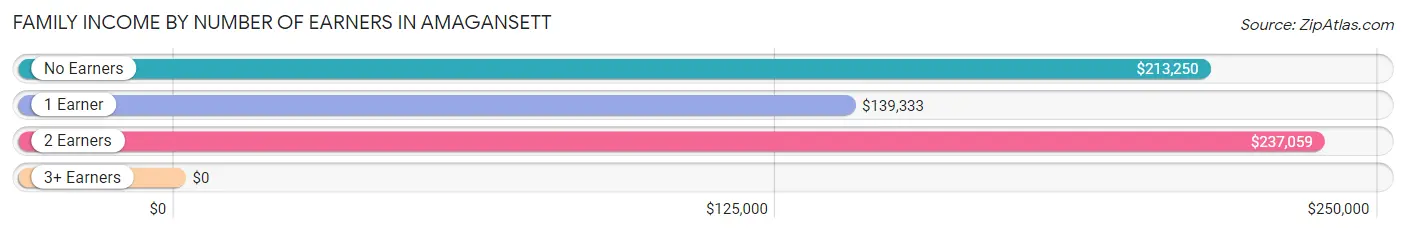
| Number of Earners | # Families | Median Income |
| No Earners | 45 (20.6%) | $213,250 |
| 1 Earner | 78 (35.8%) | $139,333 |
| 2 Earners | 82 (37.6%) | $237,059 |
| 3+ Earners | 13 (6.0%) | $0 |
| Total | 218 (100.0%) | $171,250 |
Household Income in Amagansett
Household Income Brackets in Amagansett
With 144 households falling in the category, the $200,000+ income range is the most frequent in Amagansett, accounting for 44.2% of all households.
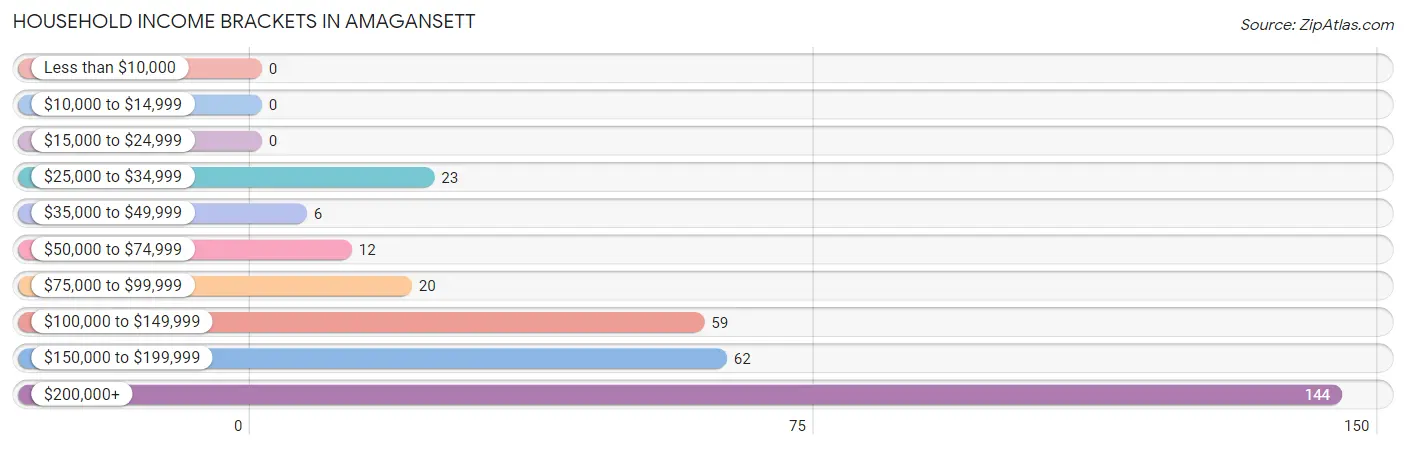
| Income Bracket | # Households | % Households |
| Less than $10,000 | 0 | 0.0% |
| $10,000 to $14,999 | 0 | 0.0% |
| $15,000 to $24,999 | 0 | 0.0% |
| $25,000 to $34,999 | 23 | 7.1% |
| $35,000 to $49,999 | 6 | 1.8% |
| $50,000 to $74,999 | 12 | 3.7% |
| $75,000 to $99,999 | 20 | 6.1% |
| $100,000 to $149,999 | 59 | 18.1% |
| $150,000 to $199,999 | 62 | 19.0% |
| $200,000+ | 144 | 44.2% |
Household Income by Householder Age in Amagansett
The median household income in Amagansett is $169,000, with the highest median household income of $172,917 found in the 45 to 64 years age bracket for the primary householder. A total of 119 households (36.5%) fall into this category.
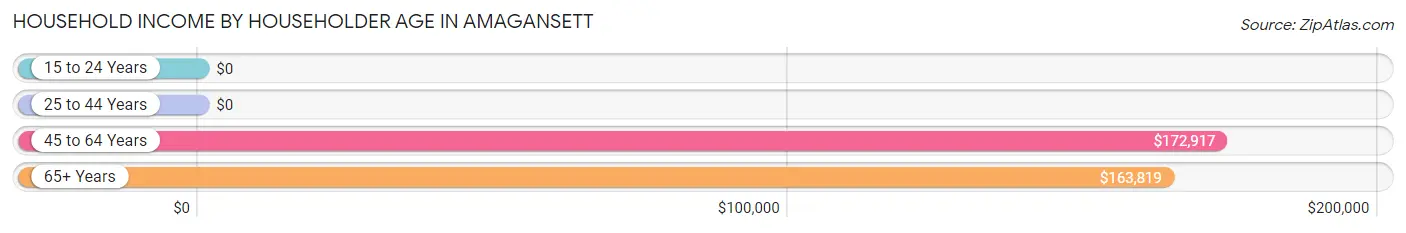
| Income Bracket | # Households | Median Income |
| 15 to 24 Years | 0 (0.0%) | $0 |
| 25 to 44 Years | 6 (1.8%) | $0 |
| 45 to 64 Years | 119 (36.5%) | $172,917 |
| 65+ Years | 201 (61.7%) | $163,819 |
| Total | 326 (100.0%) | $169,000 |
Poverty in Amagansett
Income Below Poverty by Sex and Age in Amagansett
With 1.7% poverty level for males and 0.5% for females among the residents of Amagansett, 25 to 34 year old males and 35 to 44 year old females are the most vulnerable to poverty, with 3 males (100.0%) and 2 females (25.0%) in their respective age groups living below the poverty level.
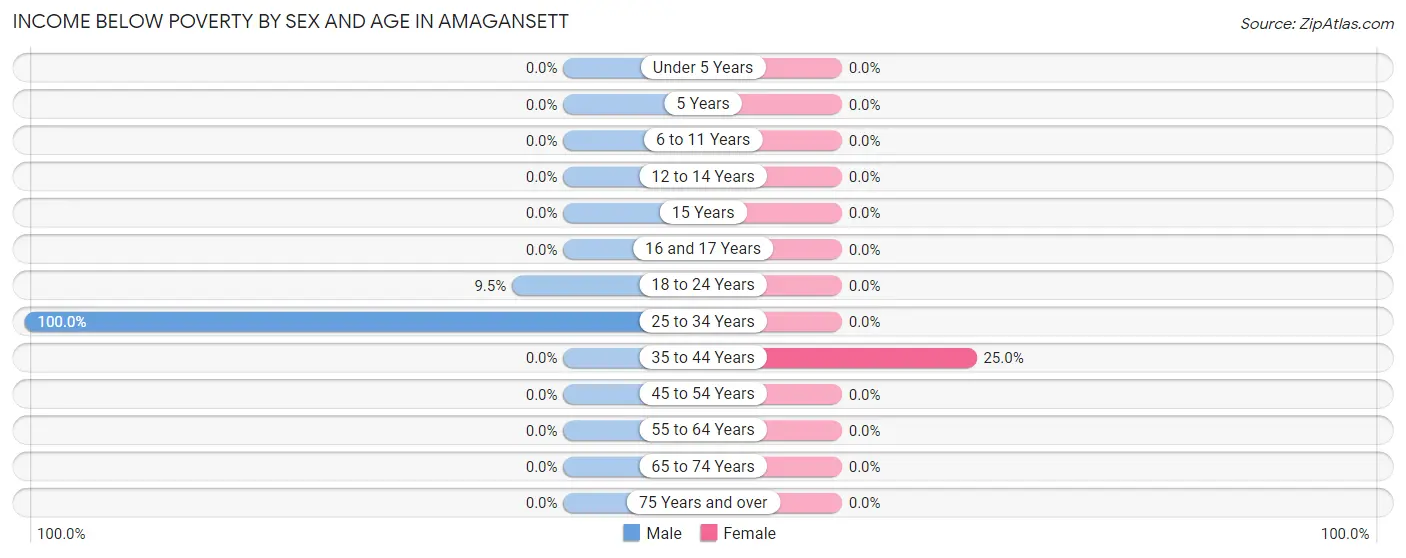
| Age Bracket | Male | Female |
| Under 5 Years | 0 (0.0%) | 0 (0.0%) |
| 5 Years | 0 (0.0%) | 0 (0.0%) |
| 6 to 11 Years | 0 (0.0%) | 0 (0.0%) |
| 12 to 14 Years | 0 (0.0%) | 0 (0.0%) |
| 15 Years | 0 (0.0%) | 0 (0.0%) |
| 16 and 17 Years | 0 (0.0%) | 0 (0.0%) |
| 18 to 24 Years | 2 (9.5%) | 0 (0.0%) |
| 25 to 34 Years | 3 (100.0%) | 0 (0.0%) |
| 35 to 44 Years | 0 (0.0%) | 2 (25.0%) |
| 45 to 54 Years | 0 (0.0%) | 0 (0.0%) |
| 55 to 64 Years | 0 (0.0%) | 0 (0.0%) |
| 65 to 74 Years | 0 (0.0%) | 0 (0.0%) |
| 75 Years and over | 0 (0.0%) | 0 (0.0%) |
| Total | 5 (1.7%) | 2 (0.5%) |
Income Above Poverty by Sex and Age in Amagansett
According to the poverty statistics in Amagansett, males aged under 5 years and females aged under 5 years are the age groups that are most secure financially, with 100.0% of males and 100.0% of females in these age groups living above the poverty line.
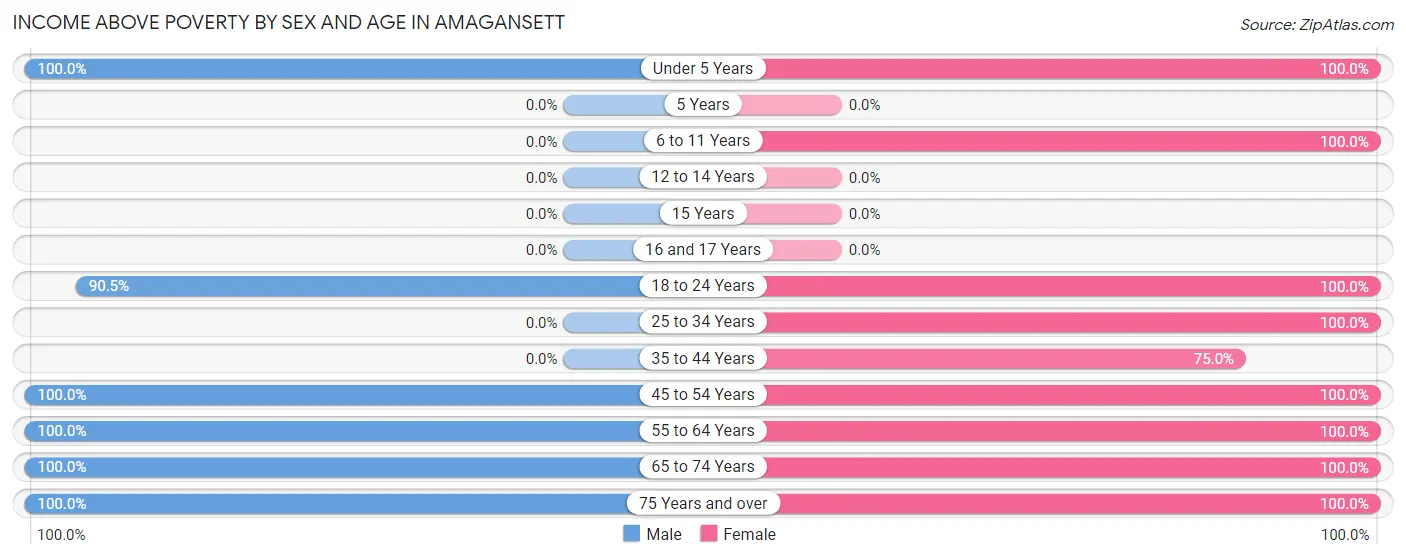
| Age Bracket | Male | Female |
| Under 5 Years | 9 (100.0%) | 9 (100.0%) |
| 5 Years | 0 (0.0%) | 0 (0.0%) |
| 6 to 11 Years | 0 (0.0%) | 12 (100.0%) |
| 12 to 14 Years | 0 (0.0%) | 0 (0.0%) |
| 15 Years | 0 (0.0%) | 0 (0.0%) |
| 16 and 17 Years | 0 (0.0%) | 0 (0.0%) |
| 18 to 24 Years | 19 (90.5%) | 46 (100.0%) |
| 25 to 34 Years | 0 (0.0%) | 16 (100.0%) |
| 35 to 44 Years | 0 (0.0%) | 6 (75.0%) |
| 45 to 54 Years | 26 (100.0%) | 59 (100.0%) |
| 55 to 64 Years | 51 (100.0%) | 114 (100.0%) |
| 65 to 74 Years | 115 (100.0%) | 70 (100.0%) |
| 75 Years and over | 63 (100.0%) | 56 (100.0%) |
| Total | 283 (98.3%) | 388 (99.5%) |
Income Below Poverty Among Married-Couple Families in Amagansett
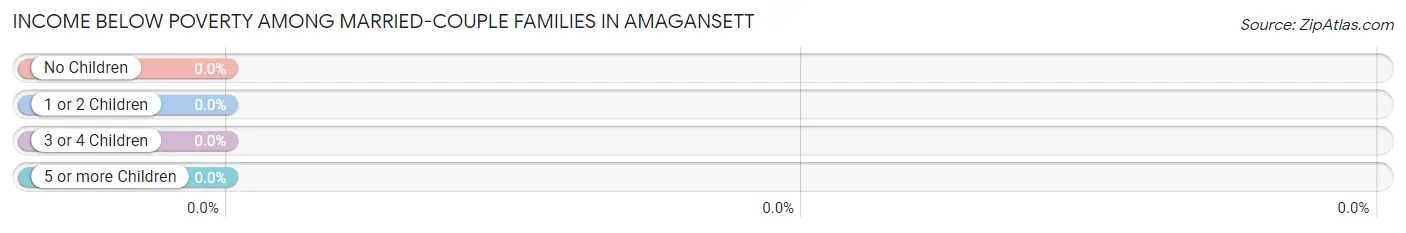
| Children | Above Poverty | Below Poverty |
| No Children | 171 (100.0%) | 0 (0.0%) |
| 1 or 2 Children | 9 (100.0%) | 0 (0.0%) |
| 3 or 4 Children | 0 (0.0%) | 0 (0.0%) |
| 5 or more Children | 0 (0.0%) | 0 (0.0%) |
| Total | 180 (100.0%) | 0 (0.0%) |
Income Below Poverty Among Single-Parent Households in Amagansett
| Children | Single Father | Single Mother |
| No Children | 0 (0.0%) | 0 (0.0%) |
| 1 or 2 Children | 0 (0.0%) | 0 (0.0%) |
| 3 or 4 Children | 0 (0.0%) | 0 (0.0%) |
| 5 or more Children | 0 (0.0%) | 0 (0.0%) |
| Total | 0 (0.0%) | 0 (0.0%) |
Income Below Poverty Among Married-Couple vs Single-Parent Households in Amagansett
| Children | Married-Couple Families | Single-Parent Households |
| No Children | 0 (0.0%) | 0 (0.0%) |
| 1 or 2 Children | 0 (0.0%) | 0 (0.0%) |
| 3 or 4 Children | 0 (0.0%) | 0 (0.0%) |
| 5 or more Children | 0 (0.0%) | 0 (0.0%) |
| Total | 0 (0.0%) | 0 (0.0%) |
Race in Amagansett
The most populous races in Amagansett are White / Caucasian (644 | 95.0%), Some other Race (31 | 4.6%), and Hispanic or Latino (29 | 4.3%).
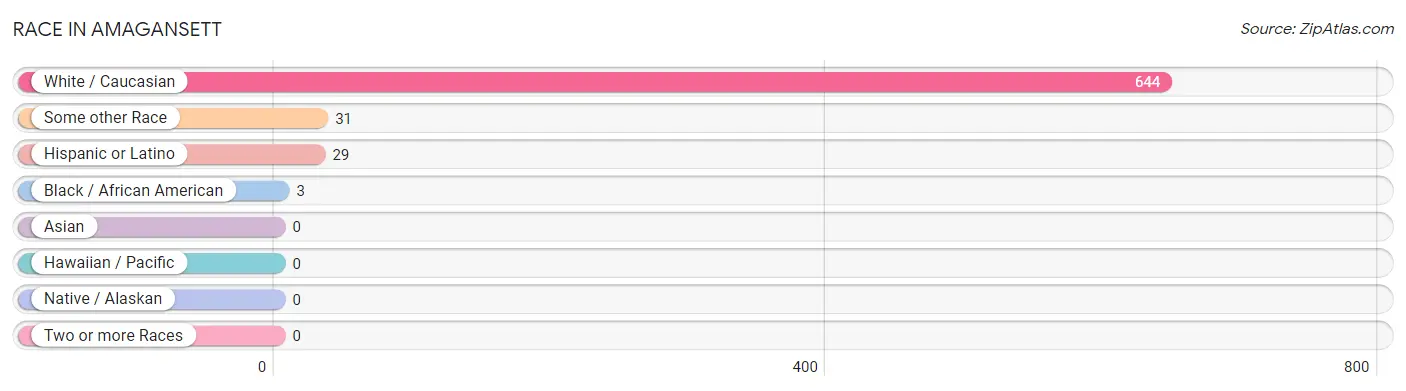
| Race | # Population | % Population |
| Asian | 0 | 0.0% |
| Black / African American | 3 | 0.4% |
| Hawaiian / Pacific | 0 | 0.0% |
| Hispanic or Latino | 29 | 4.3% |
| Native / Alaskan | 0 | 0.0% |
| White / Caucasian | 644 | 95.0% |
| Two or more Races | 0 | 0.0% |
| Some other Race | 31 | 4.6% |
| Total | 678 | 100.0% |
Ancestry in Amagansett
The most populous ancestries reported in Amagansett are English (99 | 14.6%), German (70 | 10.3%), American (67 | 9.9%), European (40 | 5.9%), and Italian (35 | 5.2%), together accounting for 45.9% of all Amagansett residents.
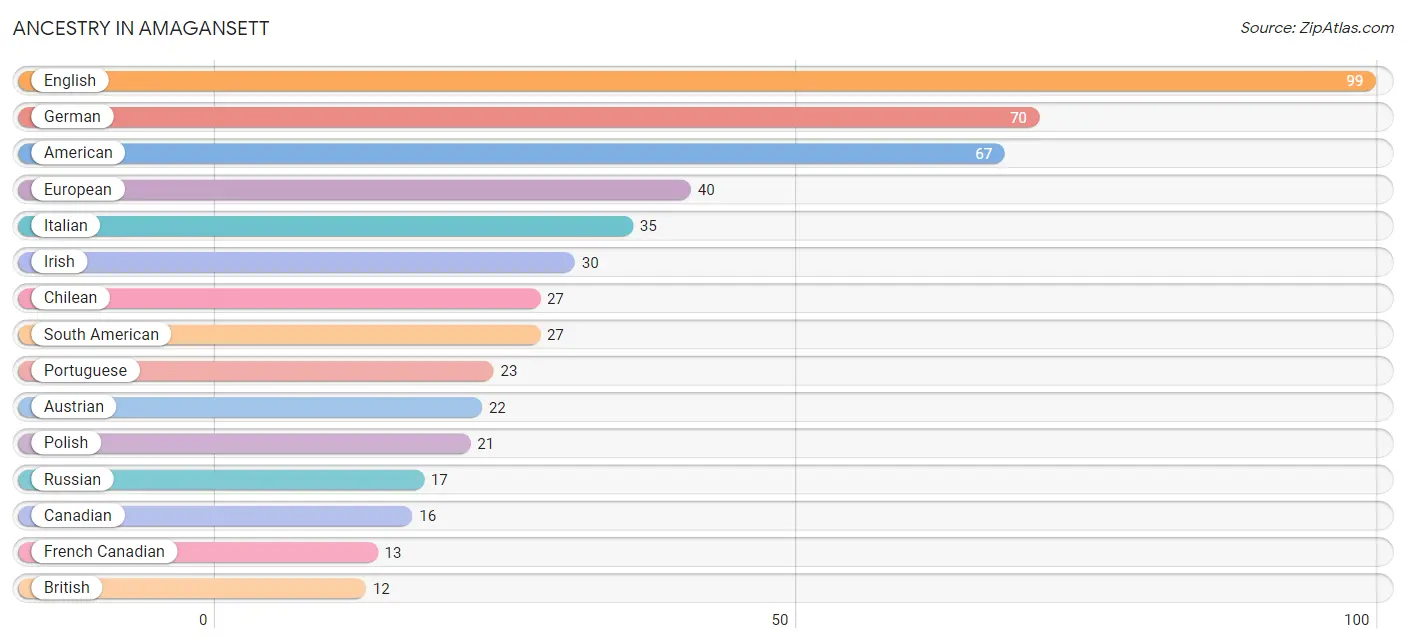
| Ancestry | # Population | % Population |
| American | 67 | 9.9% |
| Austrian | 22 | 3.2% |
| British | 12 | 1.8% |
| Canadian | 16 | 2.4% |
| Central American | 2 | 0.3% |
| Chilean | 27 | 4.0% |
| English | 99 | 14.6% |
| European | 40 | 5.9% |
| French Canadian | 13 | 1.9% |
| German | 70 | 10.3% |
| Irish | 30 | 4.4% |
| Italian | 35 | 5.2% |
| Lithuanian | 3 | 0.4% |
| Polish | 21 | 3.1% |
| Portuguese | 23 | 3.4% |
| Russian | 17 | 2.5% |
| Salvadoran | 2 | 0.3% |
| Scottish | 7 | 1.0% |
| South American | 27 | 4.0% |
| Ukrainian | 1 | 0.2% | View All 20 Rows |
Immigrants in Amagansett
The most numerous immigrant groups reported in Amagansett came from Latin America (20 | 2.9%), Chile (18 | 2.6%), South America (18 | 2.6%), Europe (11 | 1.6%), and Ireland (11 | 1.6%), together accounting for 11.5% of all Amagansett residents.
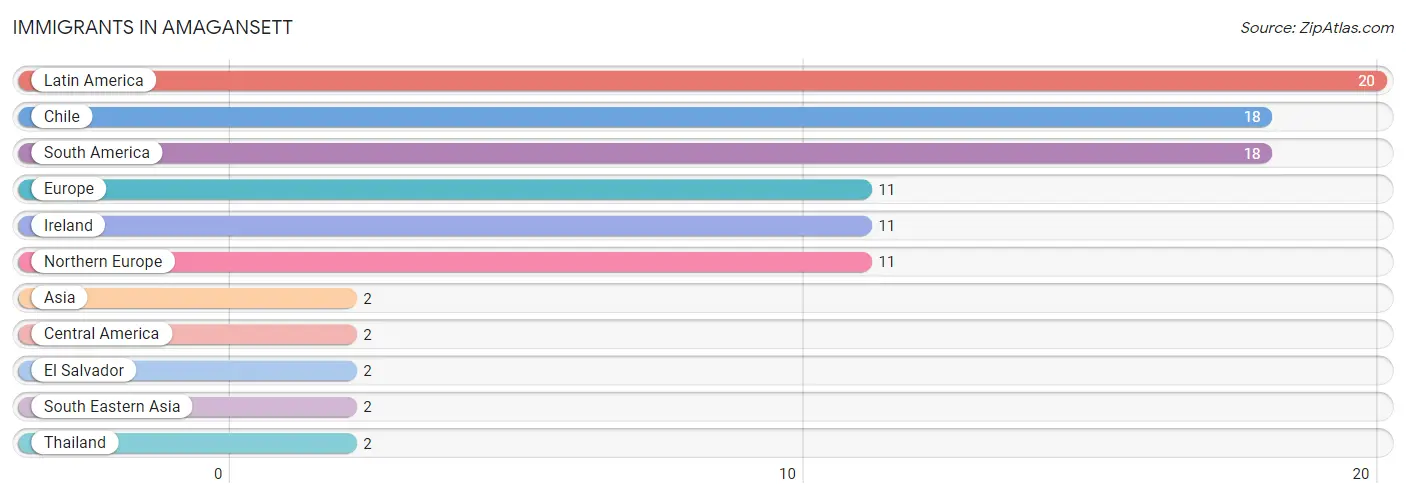
| Immigration Origin | # Population | % Population |
| Asia | 2 | 0.3% |
| Central America | 2 | 0.3% |
| Chile | 18 | 2.6% |
| El Salvador | 2 | 0.3% |
| Europe | 11 | 1.6% |
| Ireland | 11 | 1.6% |
| Latin America | 20 | 2.9% |
| Northern Europe | 11 | 1.6% |
| South America | 18 | 2.6% |
| South Eastern Asia | 2 | 0.3% |
| Thailand | 2 | 0.3% | View All 11 Rows |
Sex and Age in Amagansett
Sex and Age in Amagansett
The most populous age groups in Amagansett are 65 to 69 Years (79 | 27.4%) for men and 60 to 64 Years (83 | 21.3%) for women.
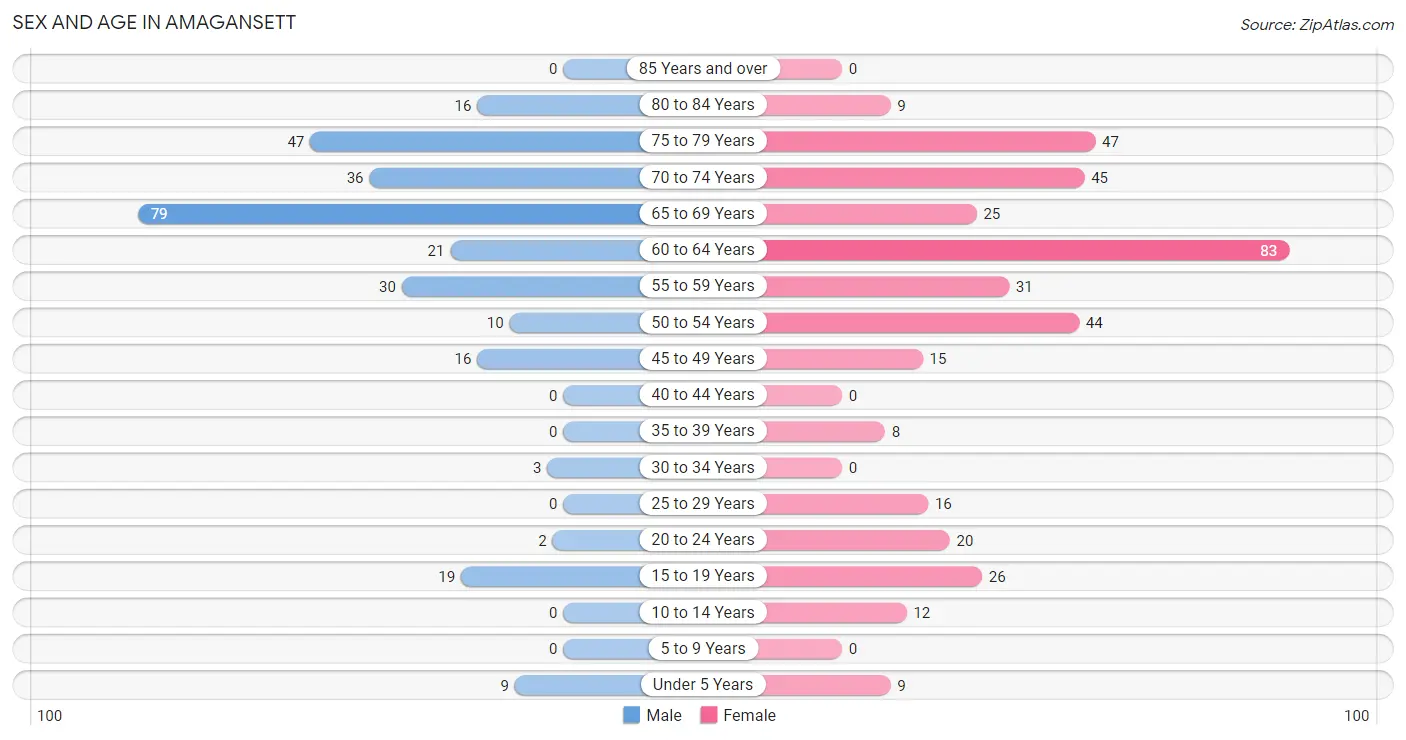
| Age Bracket | Male | Female |
| Under 5 Years | 9 (3.1%) | 9 (2.3%) |
| 5 to 9 Years | 0 (0.0%) | 0 (0.0%) |
| 10 to 14 Years | 0 (0.0%) | 12 (3.1%) |
| 15 to 19 Years | 19 (6.6%) | 26 (6.7%) |
| 20 to 24 Years | 2 (0.7%) | 20 (5.1%) |
| 25 to 29 Years | 0 (0.0%) | 16 (4.1%) |
| 30 to 34 Years | 3 (1.0%) | 0 (0.0%) |
| 35 to 39 Years | 0 (0.0%) | 8 (2.1%) |
| 40 to 44 Years | 0 (0.0%) | 0 (0.0%) |
| 45 to 49 Years | 16 (5.6%) | 15 (3.8%) |
| 50 to 54 Years | 10 (3.5%) | 44 (11.3%) |
| 55 to 59 Years | 30 (10.4%) | 31 (8.0%) |
| 60 to 64 Years | 21 (7.3%) | 83 (21.3%) |
| 65 to 69 Years | 79 (27.4%) | 25 (6.4%) |
| 70 to 74 Years | 36 (12.5%) | 45 (11.5%) |
| 75 to 79 Years | 47 (16.3%) | 47 (12.0%) |
| 80 to 84 Years | 16 (5.6%) | 9 (2.3%) |
| 85 Years and over | 0 (0.0%) | 0 (0.0%) |
| Total | 288 (100.0%) | 390 (100.0%) |
Families and Households in Amagansett
Median Family Size in Amagansett
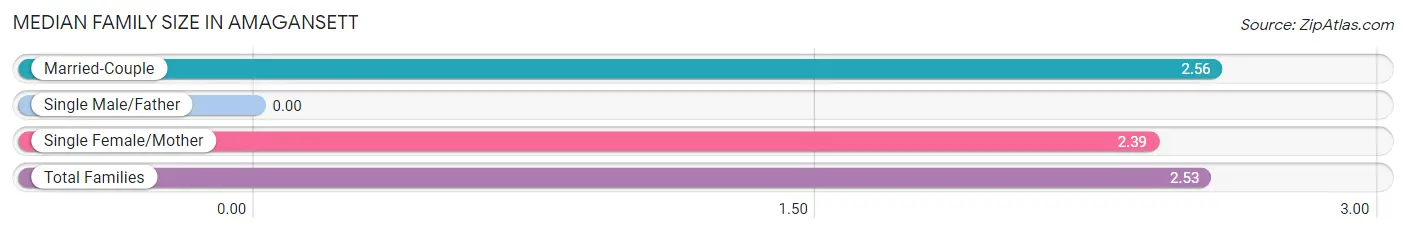
| Family Type | # Families | Family Size |
| Married-Couple | 180 (82.6%) | 2.56 |
| Single Male/Father | 0 (0.0%) | - |
| Single Female/Mother | 38 (17.4%) | 2.39 |
| Total Families | 218 (100.0%) | 2.53 |
Median Household Size in Amagansett
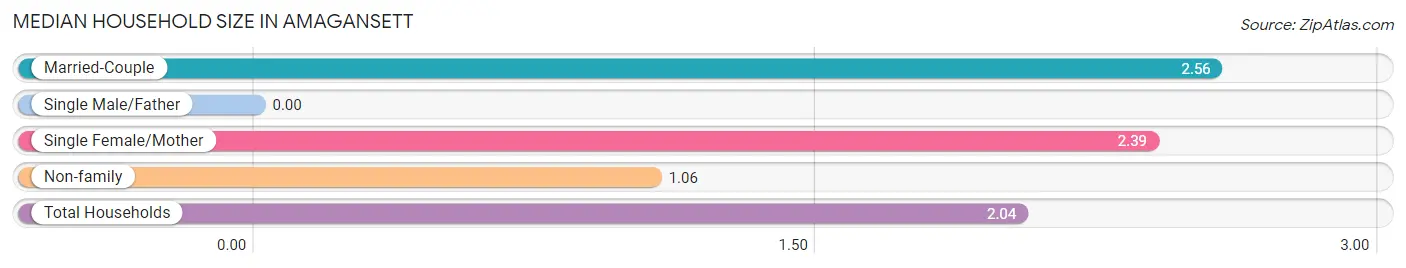
| Household Type | # Households | Household Size |
| Married-Couple | 180 (55.2%) | 2.56 |
| Single Male/Father | 0 (0.0%) | - |
| Single Female/Mother | 38 (11.7%) | 2.39 |
| Non-family | 108 (33.1%) | 1.06 |
| Total Households | 326 (100.0%) | 2.04 |
Household Size by Marriage Status in Amagansett
Out of a total of 326 households in Amagansett, 218 (66.9%) are family households, while 108 (33.1%) are nonfamily households. The most numerous type of family households are 2-person households, comprising 158, and the most common type of nonfamily households are 1-person households, comprising 98.
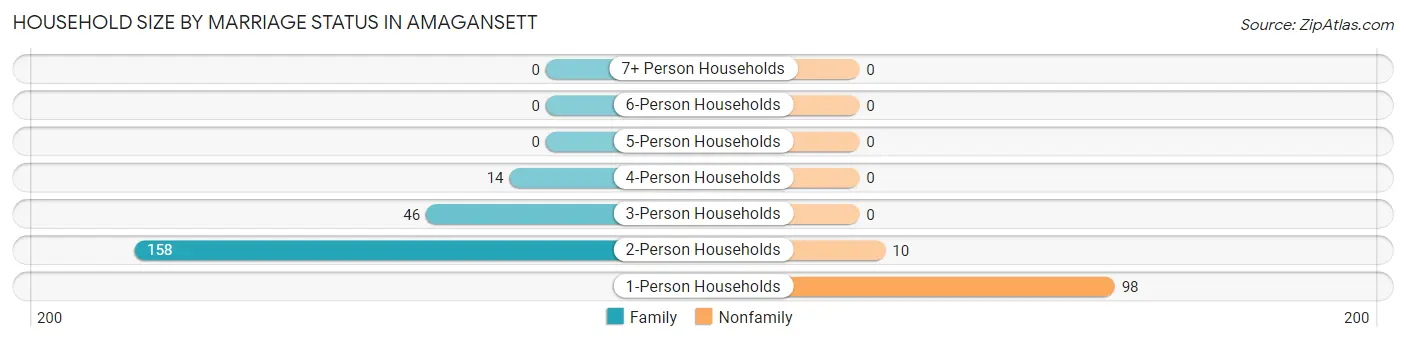
| Household Size | Family Households | Nonfamily Households |
| 1-Person Households | - | 98 (30.1%) |
| 2-Person Households | 158 (48.5%) | 10 (3.1%) |
| 3-Person Households | 46 (14.1%) | 0 (0.0%) |
| 4-Person Households | 14 (4.3%) | 0 (0.0%) |
| 5-Person Households | 0 (0.0%) | 0 (0.0%) |
| 6-Person Households | 0 (0.0%) | 0 (0.0%) |
| 7+ Person Households | 0 (0.0%) | 0 (0.0%) |
| Total | 218 (66.9%) | 108 (33.1%) |
Female Fertility in Amagansett
Fertility by Age in Amagansett
| Age Bracket | Women with Births | Births / 1,000 Women |
| 15 to 19 years | 0 (0.0%) | 0.0 |
| 20 to 34 years | 0 (0.0%) | 0.0 |
| 35 to 50 years | 0 (0.0%) | 0.0 |
| Total | 0 (0.0%) | 0.0 |
Fertility by Age by Marriage Status in Amagansett
| Age Bracket | Married | Unmarried |
| 15 to 19 years | 0 (0.0%) | 0 (0.0%) |
| 20 to 34 years | 0 (0.0%) | 0 (0.0%) |
| 35 to 50 years | 0 (0.0%) | 0 (0.0%) |
| Total | 0 (0.0%) | 0 (0.0%) |
Fertility by Education in Amagansett
| Educational Attainment | Women with Births | Births / 1,000 Women |
| Less than High School | 0 (0.0%) | 0.0 |
| High School Diploma | 0 (0.0%) | 0.0 |
| College or Associate's Degree | 0 (0.0%) | 0.0 |
| Bachelor's Degree | 0 (0.0%) | 0.0 |
| Graduate Degree | 0 (0.0%) | 0.0 |
| Total | 0 (0.0%) | 0.0 |
Fertility by Education by Marriage Status in Amagansett
| Educational Attainment | Married | Unmarried |
| Less than High School | 0 (0.0%) | 0 (0.0%) |
| High School Diploma | 0 (0.0%) | 0 (0.0%) |
| College or Associate's Degree | 0 (0.0%) | 0 (0.0%) |
| Bachelor's Degree | 0 (0.0%) | 0 (0.0%) |
| Graduate Degree | 0 (0.0%) | 0 (0.0%) |
| Total | 0 (0.0%) | 0 (0.0%) |
Employment Characteristics in Amagansett
Employment by Class of Employer in Amagansett
Among the 321 employed individuals in Amagansett, private company employees (113 | 35.2%), self-employed (incorporated) (94 | 29.3%), and state government employees (50 | 15.6%) make up the most common classes of employment.
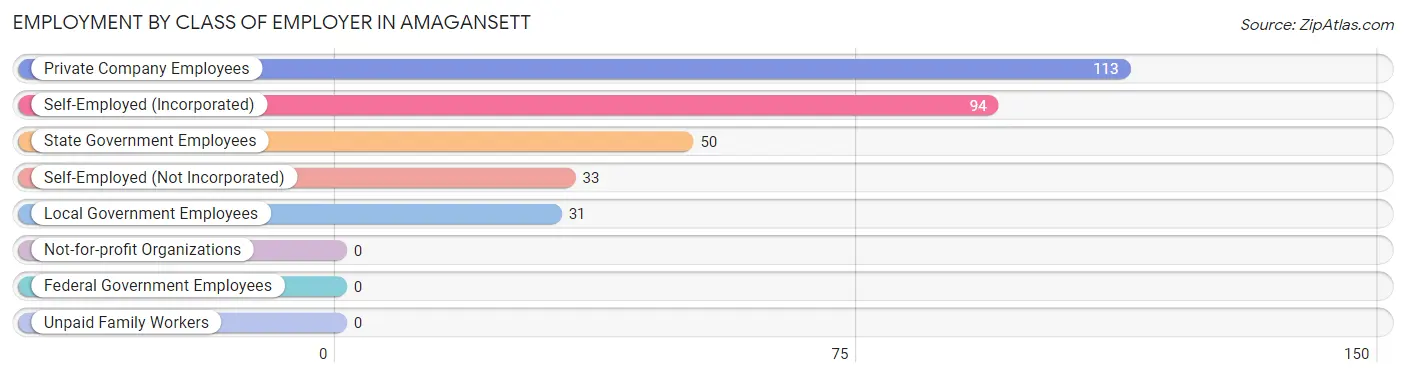
| Employer Class | # Employees | % Employees |
| Private Company Employees | 113 | 35.2% |
| Self-Employed (Incorporated) | 94 | 29.3% |
| Self-Employed (Not Incorporated) | 33 | 10.3% |
| Not-for-profit Organizations | 0 | 0.0% |
| Local Government Employees | 31 | 9.7% |
| State Government Employees | 50 | 15.6% |
| Federal Government Employees | 0 | 0.0% |
| Unpaid Family Workers | 0 | 0.0% |
| Total | 321 | 100.0% |
Employment Status by Age in Amagansett
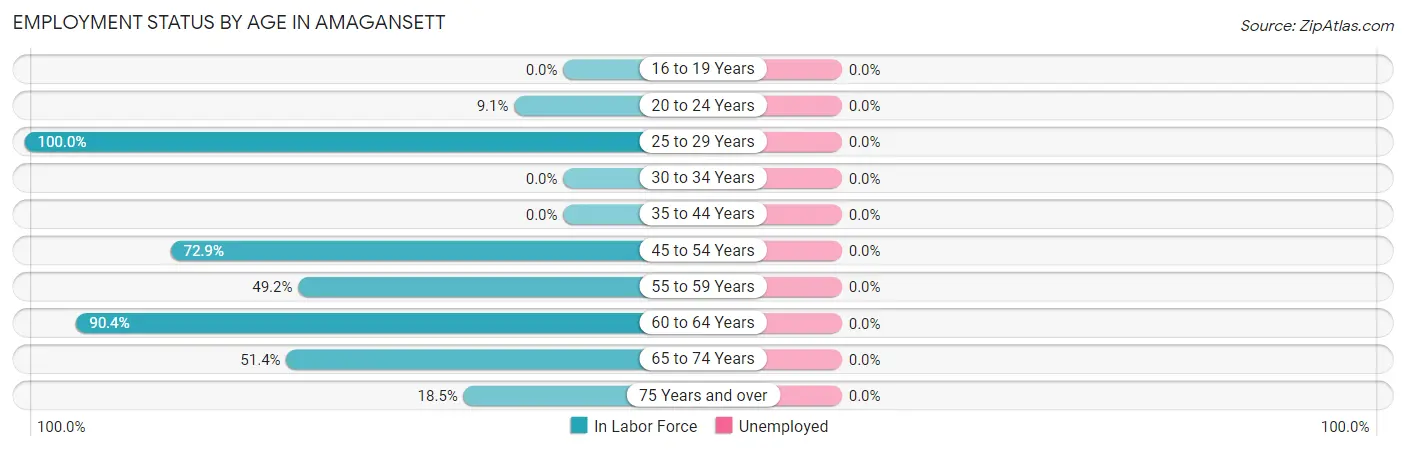
| Age Bracket | In Labor Force | Unemployed |
| 16 to 19 Years | 0 (0.0%) | 0 (0.0%) |
| 20 to 24 Years | 2 (9.1%) | 0 (0.0%) |
| 25 to 29 Years | 16 (100.0%) | 0 (0.0%) |
| 30 to 34 Years | 0 (0.0%) | 0 (0.0%) |
| 35 to 44 Years | 0 (0.0%) | 0 (0.0%) |
| 45 to 54 Years | 62 (72.9%) | 0 (0.0%) |
| 55 to 59 Years | 30 (49.2%) | 0 (0.0%) |
| 60 to 64 Years | 94 (90.4%) | 0 (0.0%) |
| 65 to 74 Years | 95 (51.4%) | 0 (0.0%) |
| 75 Years and over | 22 (18.5%) | 0 (0.0%) |
| Total | 321 (49.5%) | 0 (0.0%) |
Employment Status by Educational Attainment in Amagansett
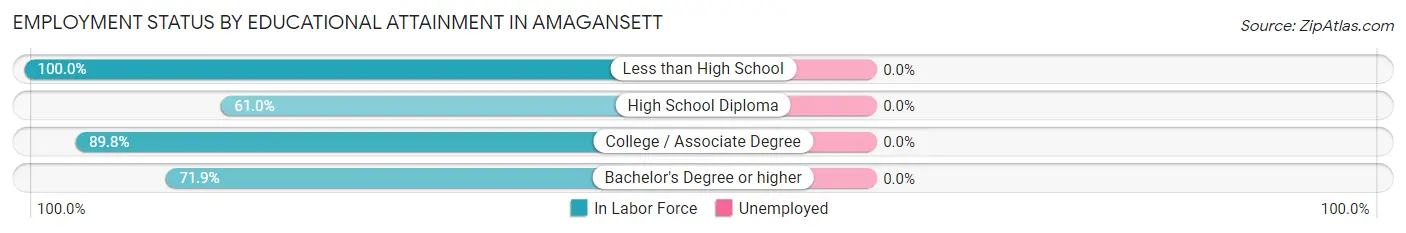
| Educational Attainment | In Labor Force | Unemployed |
| Less than High School | 2 (100.0%) | 0 (0.0%) |
| High School Diploma | 36 (61.0%) | 0 (0.0%) |
| College / Associate Degree | 44 (89.8%) | 0 (0.0%) |
| Bachelor's Degree or higher | 120 (71.9%) | 0 (0.0%) |
| Total | 202 (72.9%) | 0 (0.0%) |
Employment Occupations by Sex in Amagansett
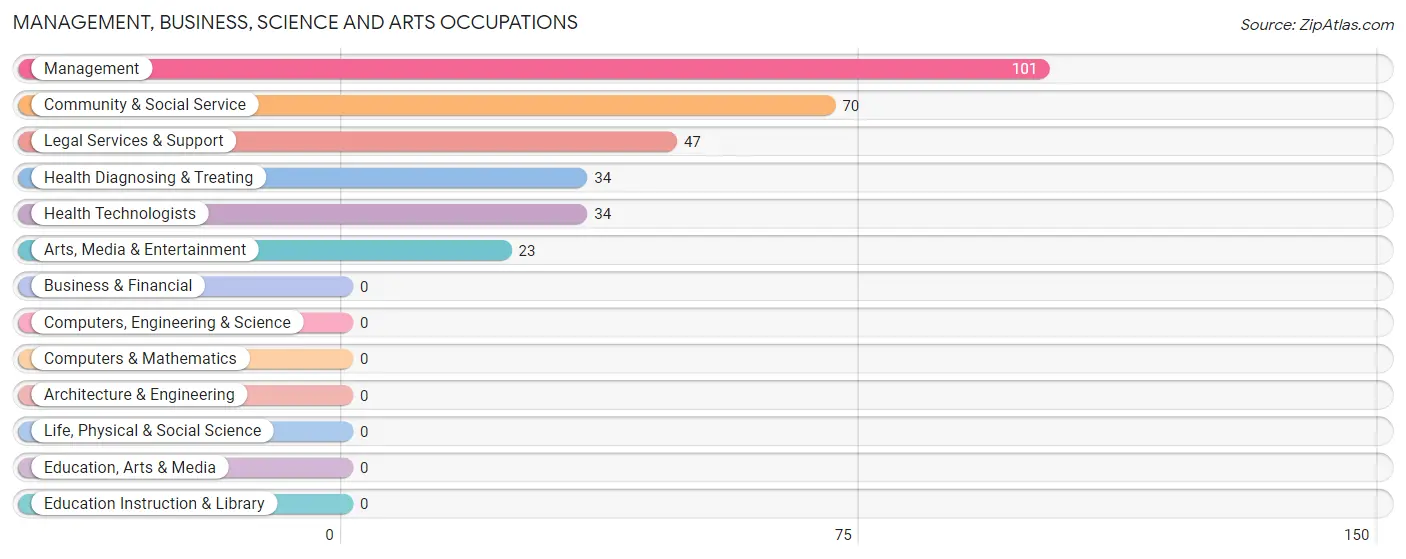
Management, Business, Science and Arts Occupations
The most common Management, Business, Science and Arts occupations in Amagansett are Management (101 | 31.5%), Community & Social Service (70 | 21.8%), Legal Services & Support (47 | 14.6%), Health Diagnosing & Treating (34 | 10.6%), and Health Technologists (34 | 10.6%).
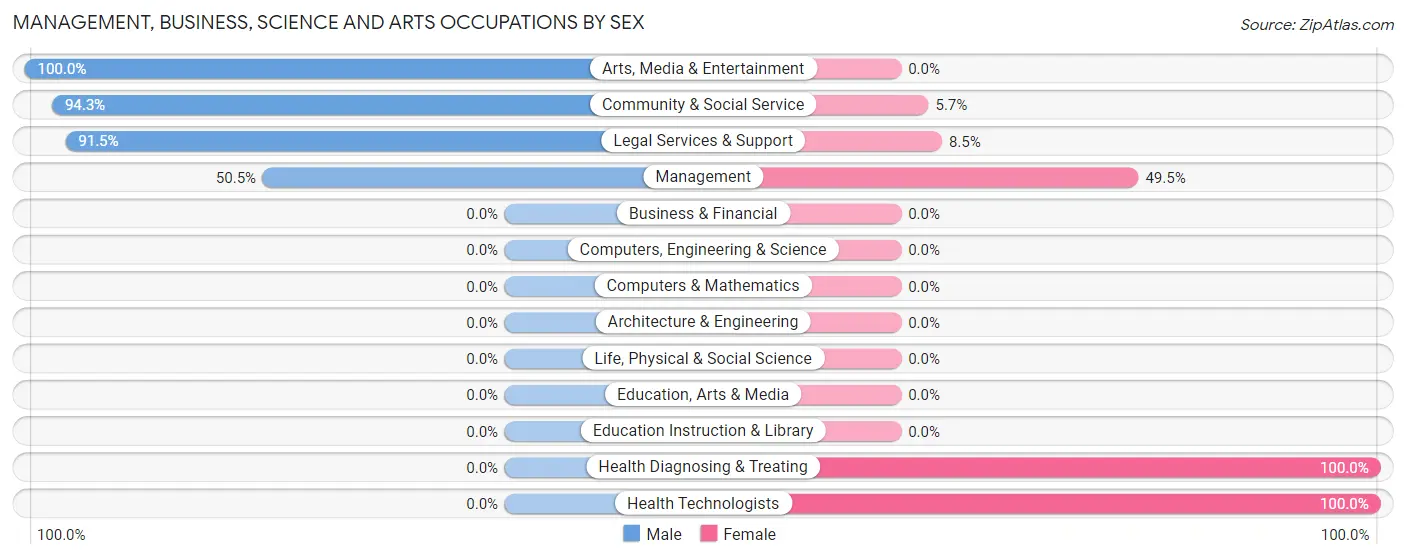
Management, Business, Science and Arts Occupations by Sex
Within the Management, Business, Science and Arts occupations in Amagansett, the most male-oriented occupations are Arts, Media & Entertainment (100.0%), Community & Social Service (94.3%), and Legal Services & Support (91.5%), while the most female-oriented occupations are Health Diagnosing & Treating (100.0%), Health Technologists (100.0%), and Management (49.5%).
| Occupation | Male | Female |
| Management | 51 (50.5%) | 50 (49.5%) |
| Business & Financial | 0 (0.0%) | 0 (0.0%) |
| Computers, Engineering & Science | 0 (0.0%) | 0 (0.0%) |
| Computers & Mathematics | 0 (0.0%) | 0 (0.0%) |
| Architecture & Engineering | 0 (0.0%) | 0 (0.0%) |
| Life, Physical & Social Science | 0 (0.0%) | 0 (0.0%) |
| Community & Social Service | 66 (94.3%) | 4 (5.7%) |
| Education, Arts & Media | 0 (0.0%) | 0 (0.0%) |
| Legal Services & Support | 43 (91.5%) | 4 (8.5%) |
| Education Instruction & Library | 0 (0.0%) | 0 (0.0%) |
| Arts, Media & Entertainment | 23 (100.0%) | 0 (0.0%) |
| Health Diagnosing & Treating | 0 (0.0%) | 34 (100.0%) |
| Health Technologists | 0 (0.0%) | 34 (100.0%) |
| Total (Category) | 117 (57.1%) | 88 (42.9%) |
| Total (Overall) | 196 (61.1%) | 125 (38.9%) |
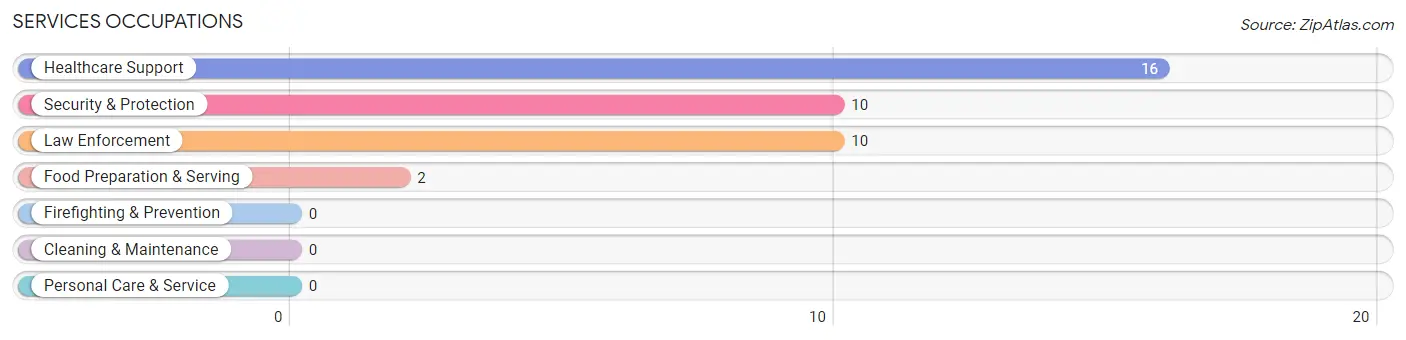
Services Occupations
The most common Services occupations in Amagansett are Healthcare Support (16 | 5.0%), Security & Protection (10 | 3.1%), Law Enforcement (10 | 3.1%), and Food Preparation & Serving (2 | 0.6%).
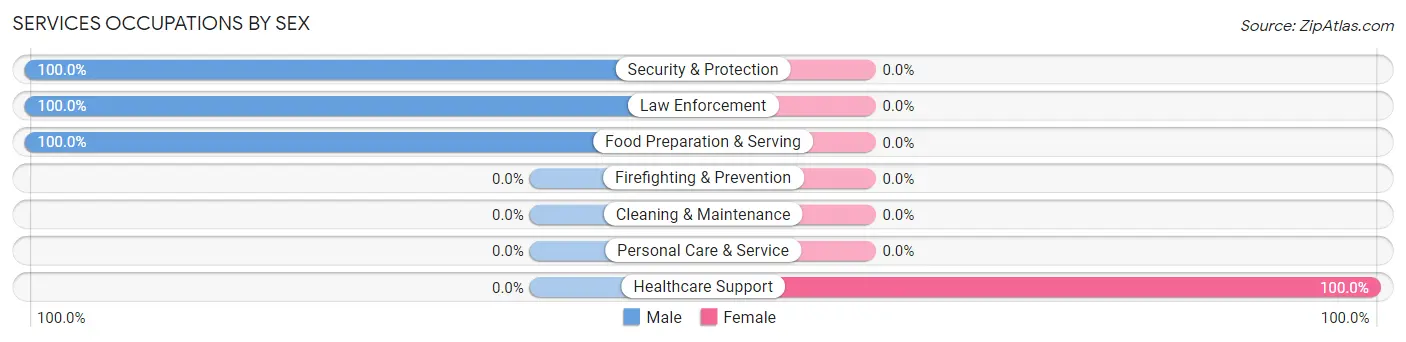
Services Occupations by Sex
| Occupation | Male | Female |
| Healthcare Support | 0 (0.0%) | 16 (100.0%) |
| Security & Protection | 10 (100.0%) | 0 (0.0%) |
| Firefighting & Prevention | 0 (0.0%) | 0 (0.0%) |
| Law Enforcement | 10 (100.0%) | 0 (0.0%) |
| Food Preparation & Serving | 2 (100.0%) | 0 (0.0%) |
| Cleaning & Maintenance | 0 (0.0%) | 0 (0.0%) |
| Personal Care & Service | 0 (0.0%) | 0 (0.0%) |
| Total (Category) | 12 (42.9%) | 16 (57.1%) |
| Total (Overall) | 196 (61.1%) | 125 (38.9%) |
Sales and Office Occupations
The most common Sales and Office occupations in Amagansett are , and Office & Administration (28 | 8.7%).
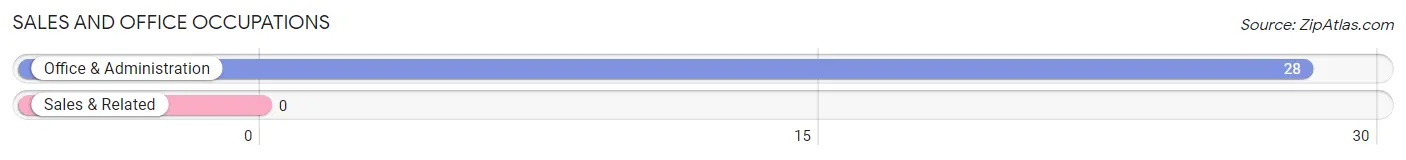
Sales and Office Occupations by Sex
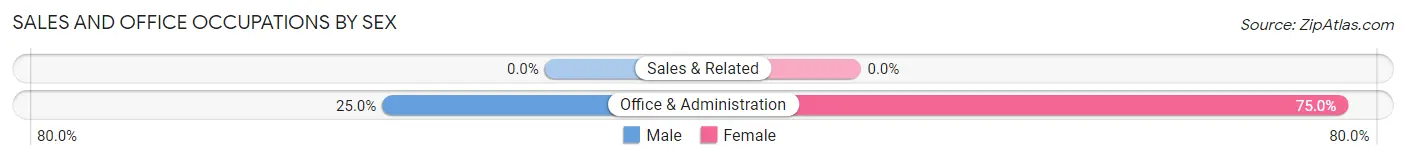
| Occupation | Male | Female |
| Sales & Related | 0 (0.0%) | 0 (0.0%) |
| Office & Administration | 7 (25.0%) | 21 (75.0%) |
| Total (Category) | 7 (25.0%) | 21 (75.0%) |
| Total (Overall) | 196 (61.1%) | 125 (38.9%) |
Natural Resources, Construction and Maintenance Occupations
The most common Natural Resources, Construction and Maintenance occupations in Amagansett are Farming, Fishing & Forestry (33 | 10.3%), Construction & Extraction (13 | 4.1%), and Installation, Maintenance & Repair (9 | 2.8%).
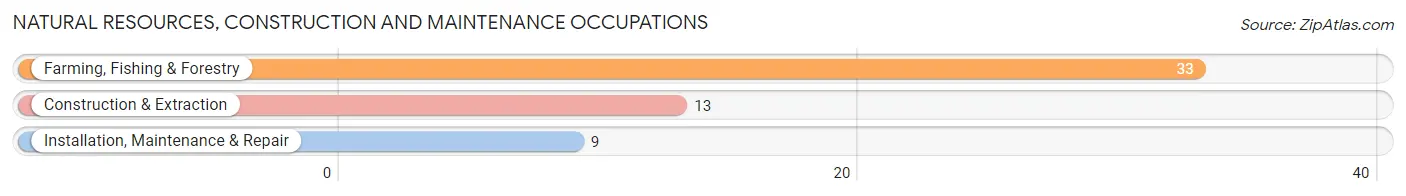
Natural Resources, Construction and Maintenance Occupations by Sex
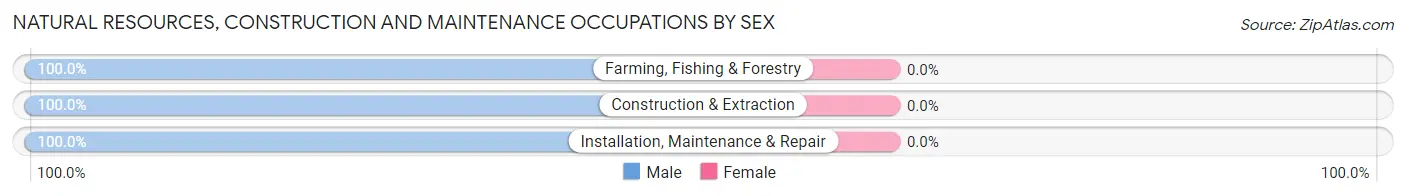
| Occupation | Male | Female |
| Farming, Fishing & Forestry | 33 (100.0%) | 0 (0.0%) |
| Construction & Extraction | 13 (100.0%) | 0 (0.0%) |
| Installation, Maintenance & Repair | 9 (100.0%) | 0 (0.0%) |
| Total (Category) | 55 (100.0%) | 0 (0.0%) |
| Total (Overall) | 196 (61.1%) | 125 (38.9%) |
Production, Transportation and Moving Occupations
The most common Production, Transportation and Moving occupations in Amagansett are Production (3 | 0.9%), and Material Moving (2 | 0.6%).
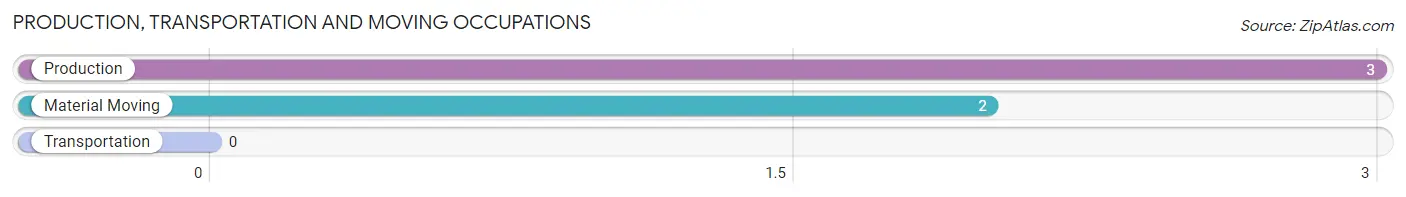
Production, Transportation and Moving Occupations by Sex
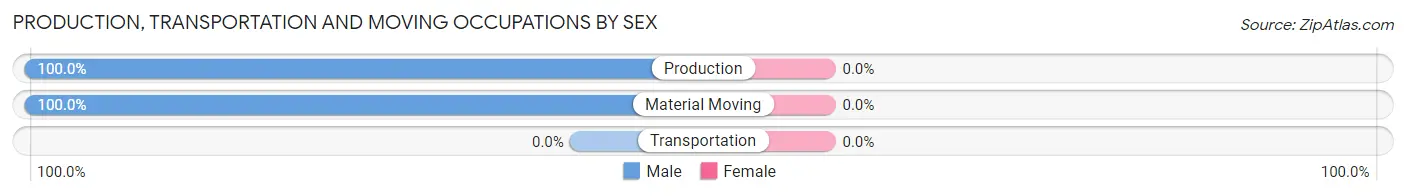
| Occupation | Male | Female |
| Production | 3 (100.0%) | 0 (0.0%) |
| Transportation | 0 (0.0%) | 0 (0.0%) |
| Material Moving | 2 (100.0%) | 0 (0.0%) |
| Total (Category) | 5 (100.0%) | 0 (0.0%) |
| Total (Overall) | 196 (61.1%) | 125 (38.9%) |
Employment Industries by Sex in Amagansett
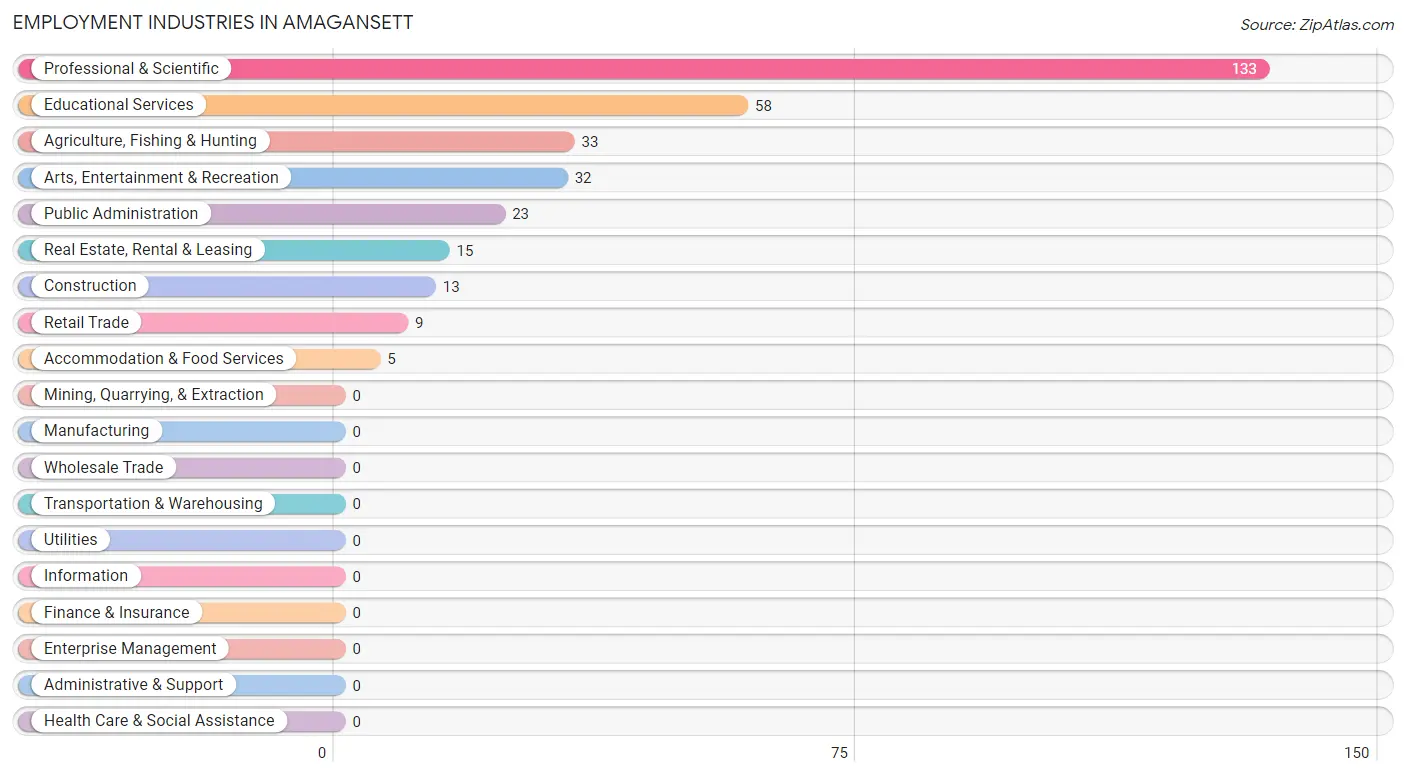
Employment Industries in Amagansett
The major employment industries in Amagansett include Professional & Scientific (133 | 41.4%), Educational Services (58 | 18.1%), Agriculture, Fishing & Hunting (33 | 10.3%), Arts, Entertainment & Recreation (32 | 10.0%), and Public Administration (23 | 7.2%).
Employment Industries by Sex in Amagansett
The Amagansett industries that see more men than women are Agriculture, Fishing & Hunting (100.0%), Construction (100.0%), and Retail Trade (100.0%), whereas the industries that tend to have a higher number of women are Real Estate, Rental & Leasing (100.0%), Educational Services (72.4%), and Public Administration (56.5%).
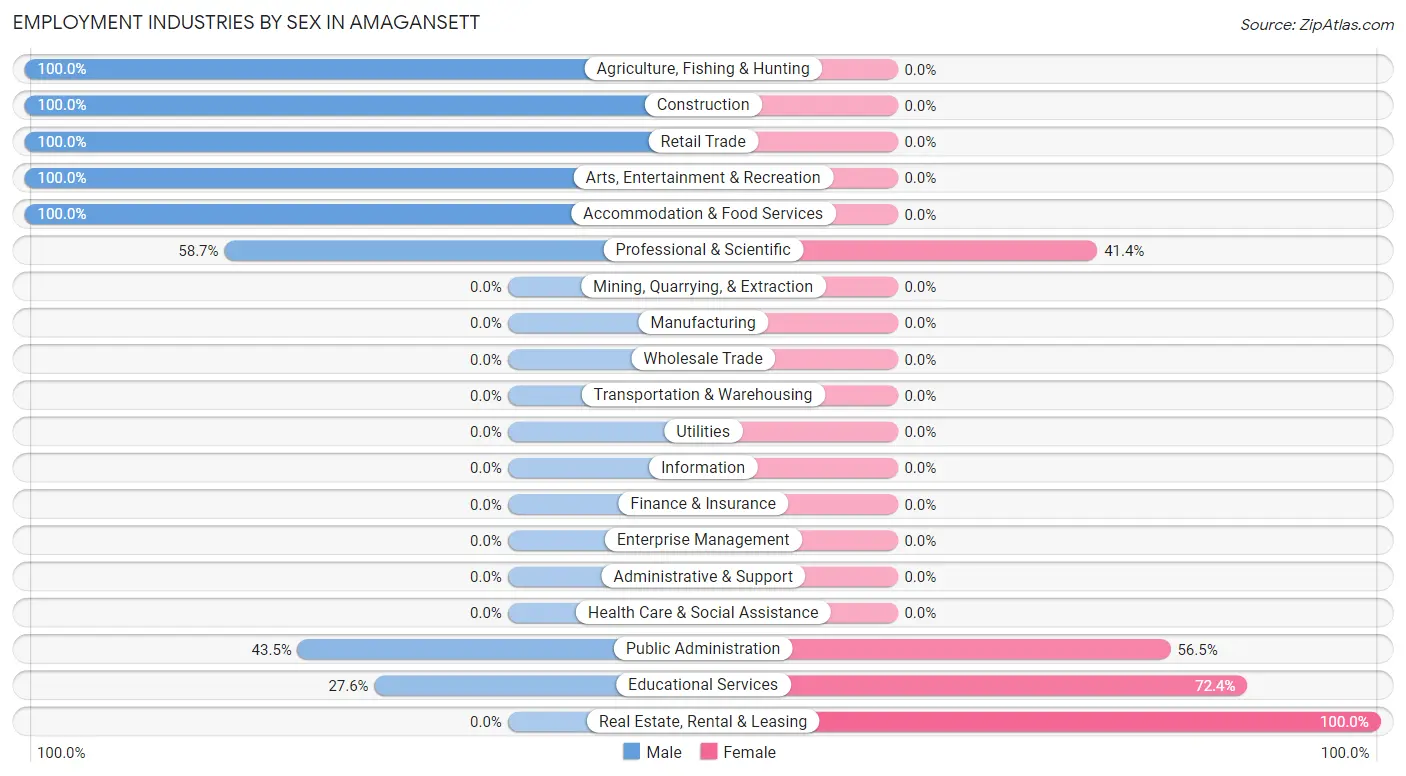
| Industry | Male | Female |
| Agriculture, Fishing & Hunting | 33 (100.0%) | 0 (0.0%) |
| Mining, Quarrying, & Extraction | 0 (0.0%) | 0 (0.0%) |
| Construction | 13 (100.0%) | 0 (0.0%) |
| Manufacturing | 0 (0.0%) | 0 (0.0%) |
| Wholesale Trade | 0 (0.0%) | 0 (0.0%) |
| Retail Trade | 9 (100.0%) | 0 (0.0%) |
| Transportation & Warehousing | 0 (0.0%) | 0 (0.0%) |
| Utilities | 0 (0.0%) | 0 (0.0%) |
| Information | 0 (0.0%) | 0 (0.0%) |
| Finance & Insurance | 0 (0.0%) | 0 (0.0%) |
| Real Estate, Rental & Leasing | 0 (0.0%) | 15 (100.0%) |
| Professional & Scientific | 78 (58.7%) | 55 (41.3%) |
| Enterprise Management | 0 (0.0%) | 0 (0.0%) |
| Administrative & Support | 0 (0.0%) | 0 (0.0%) |
| Educational Services | 16 (27.6%) | 42 (72.4%) |
| Health Care & Social Assistance | 0 (0.0%) | 0 (0.0%) |
| Arts, Entertainment & Recreation | 32 (100.0%) | 0 (0.0%) |
| Accommodation & Food Services | 5 (100.0%) | 0 (0.0%) |
| Public Administration | 10 (43.5%) | 13 (56.5%) |
| Total | 196 (61.1%) | 125 (38.9%) |
Education in Amagansett
School Enrollment in Amagansett
The most common levels of schooling among the 67 students in Amagansett are college / undergraduate (46 | 68.7%), elementary school (12 | 17.9%), and kindergarten (9 | 13.4%).
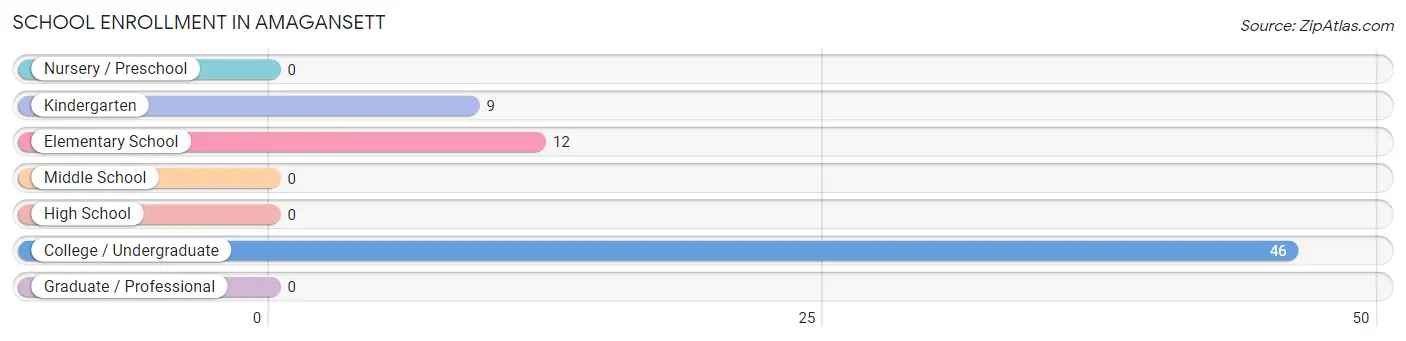
| School Level | # Students | % Students |
| Nursery / Preschool | 0 | 0.0% |
| Kindergarten | 9 | 13.4% |
| Elementary School | 12 | 17.9% |
| Middle School | 0 | 0.0% |
| High School | 0 | 0.0% |
| College / Undergraduate | 46 | 68.7% |
| Graduate / Professional | 0 | 0.0% |
| Total | 67 | 100.0% |
School Enrollment by Age by Funding Source in Amagansett
Out of a total of 67 students who are enrolled in schools in Amagansett, 26 (38.8%) attend a private institution, while the remaining 41 (61.2%) are enrolled in public schools. The age group of 18 to 19 year olds has the highest likelihood of being enrolled in private schools, with 26 (100.0% in the age bracket) enrolled. Conversely, the age group of 3 to 4 year olds has the lowest likelihood of being enrolled in a private school, with 9 (100.0% in the age bracket) attending a public institution.
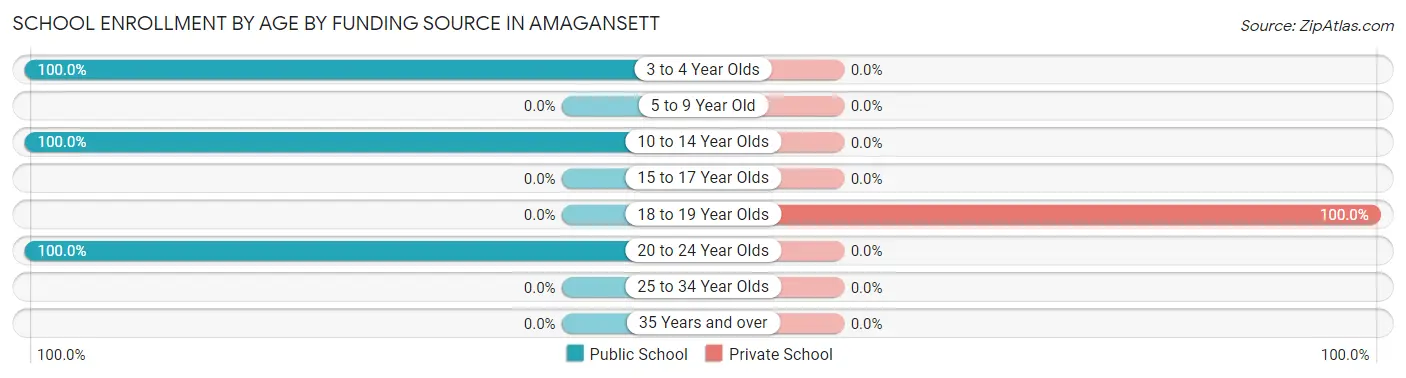
| Age Bracket | Public School | Private School |
| 3 to 4 Year Olds | 9 (100.0%) | 0 (0.0%) |
| 5 to 9 Year Old | 0 (0.0%) | 0 (0.0%) |
| 10 to 14 Year Olds | 12 (100.0%) | 0 (0.0%) |
| 15 to 17 Year Olds | 0 (0.0%) | 0 (0.0%) |
| 18 to 19 Year Olds | 0 (0.0%) | 26 (100.0%) |
| 20 to 24 Year Olds | 20 (100.0%) | 0 (0.0%) |
| 25 to 34 Year Olds | 0 (0.0%) | 0 (0.0%) |
| 35 Years and over | 0 (0.0%) | 0 (0.0%) |
| Total | 41 (61.2%) | 26 (38.8%) |
Educational Attainment by Field of Study in Amagansett
Education (94 | 23.7%), business (67 | 16.9%), science & technology (48 | 12.1%), psychology (44 | 11.1%), and literature & languages (33 | 8.3%) are the most common fields of study among 396 individuals in Amagansett who have obtained a bachelor's degree or higher.
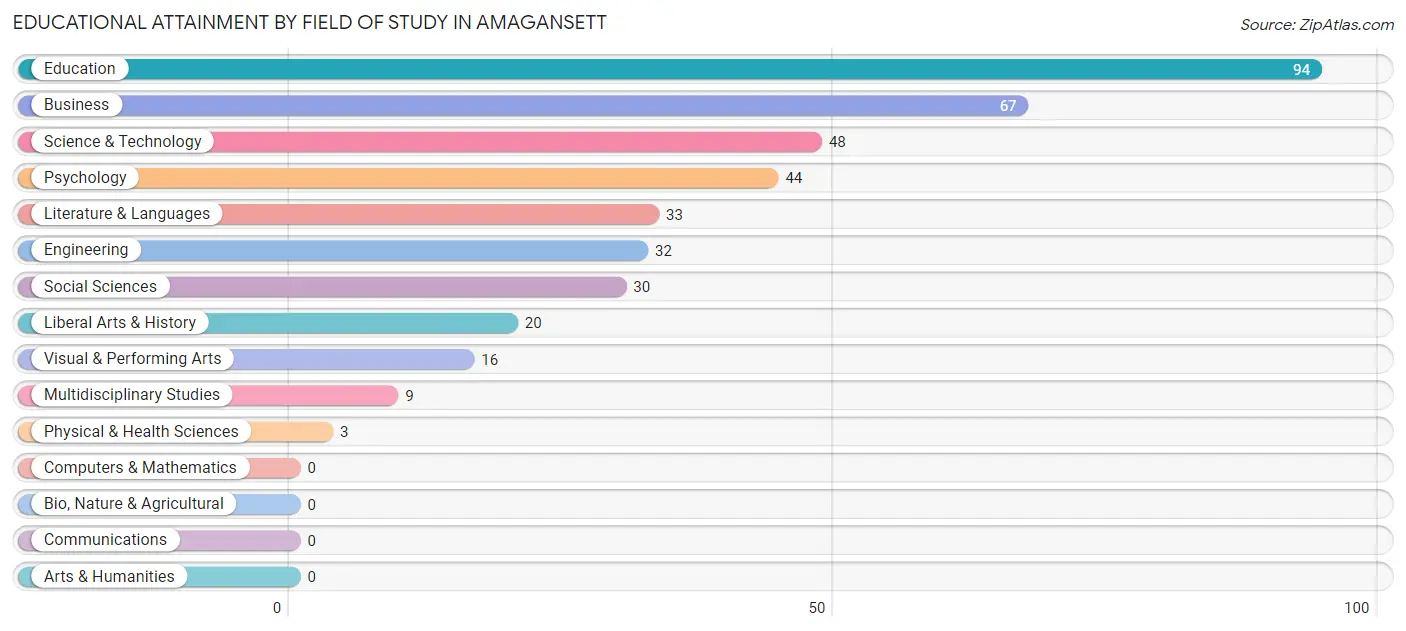
| Field of Study | # Graduates | % Graduates |
| Computers & Mathematics | 0 | 0.0% |
| Bio, Nature & Agricultural | 0 | 0.0% |
| Physical & Health Sciences | 3 | 0.8% |
| Psychology | 44 | 11.1% |
| Social Sciences | 30 | 7.6% |
| Engineering | 32 | 8.1% |
| Multidisciplinary Studies | 9 | 2.3% |
| Science & Technology | 48 | 12.1% |
| Business | 67 | 16.9% |
| Education | 94 | 23.7% |
| Literature & Languages | 33 | 8.3% |
| Liberal Arts & History | 20 | 5.1% |
| Visual & Performing Arts | 16 | 4.0% |
| Communications | 0 | 0.0% |
| Arts & Humanities | 0 | 0.0% |
| Total | 396 | 100.0% |
Transportation & Commute in Amagansett
Vehicle Availability by Sex in Amagansett
The most prevalent vehicle ownership categories in Amagansett are males with 2 vehicles (100, accounting for 52.9%) and females with 2 vehicles (61, making up 80.0%).
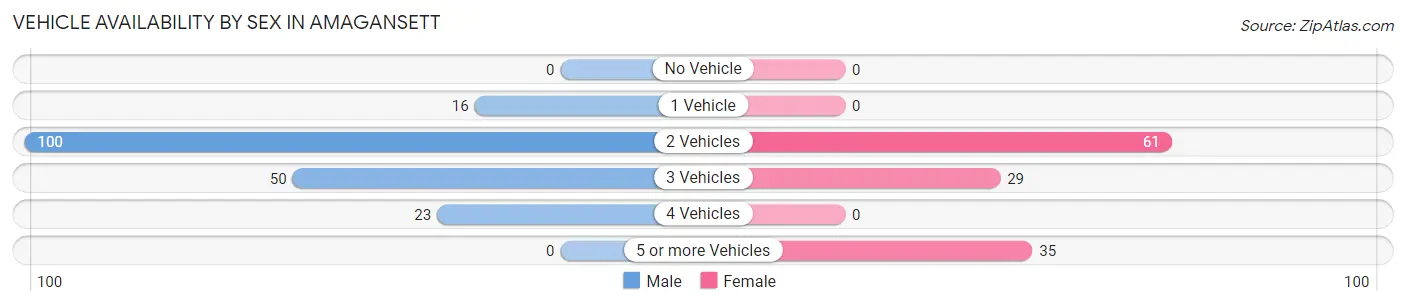
| Vehicles Available | Male | Female |
| No Vehicle | 0 (0.0%) | 0 (0.0%) |
| 1 Vehicle | 16 (8.5%) | 0 (0.0%) |
| 2 Vehicles | 100 (52.9%) | 61 (48.8%) |
| 3 Vehicles | 50 (26.5%) | 29 (23.2%) |
| 4 Vehicles | 23 (12.2%) | 0 (0.0%) |
| 5 or more Vehicles | 0 (0.0%) | 35 (28.0%) |
| Total | 189 (100.0%) | 125 (100.0%) |
Commute Time in Amagansett
The most frequently occuring commute durations in Amagansett are 90 or more minutes (84 commuters, 27.6%), 20 to 24 minutes (53 commuters, 17.4%), and 15 to 19 minutes (45 commuters, 14.8%).
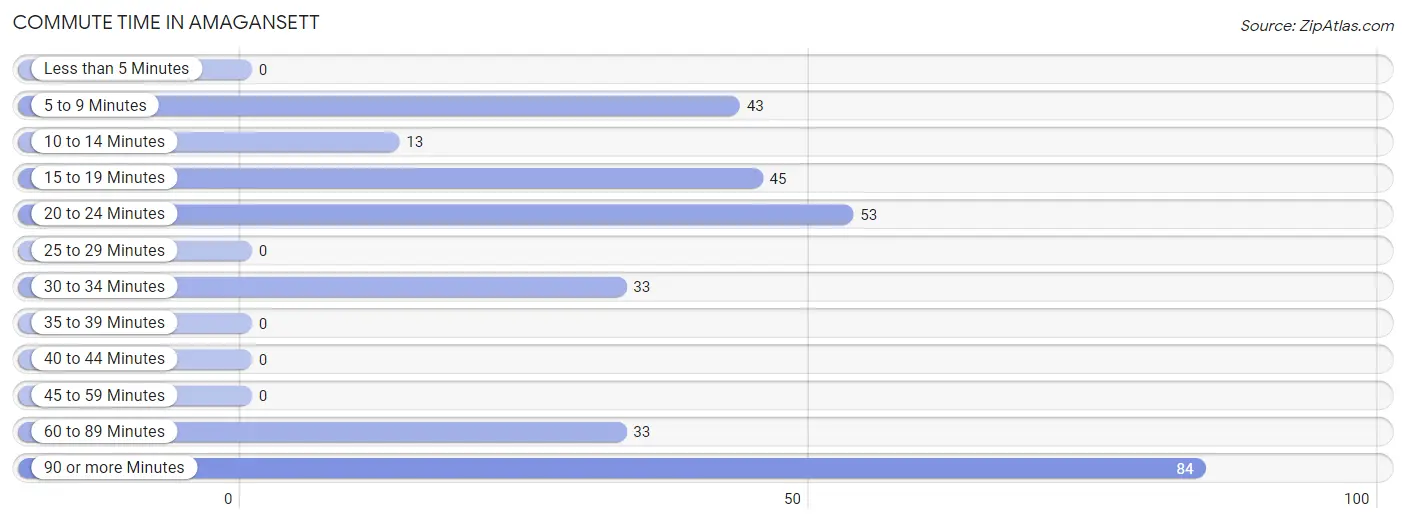
| Commute Time | # Commuters | % Commuters |
| Less than 5 Minutes | 0 | 0.0% |
| 5 to 9 Minutes | 43 | 14.1% |
| 10 to 14 Minutes | 13 | 4.3% |
| 15 to 19 Minutes | 45 | 14.8% |
| 20 to 24 Minutes | 53 | 17.4% |
| 25 to 29 Minutes | 0 | 0.0% |
| 30 to 34 Minutes | 33 | 10.9% |
| 35 to 39 Minutes | 0 | 0.0% |
| 40 to 44 Minutes | 0 | 0.0% |
| 45 to 59 Minutes | 0 | 0.0% |
| 60 to 89 Minutes | 33 | 10.9% |
| 90 or more Minutes | 84 | 27.6% |
Commute Time by Sex in Amagansett
The most common commute times in Amagansett are 20 to 24 minutes (53 commuters, 29.6%) for males and 90 or more minutes (77 commuters, 61.6%) for females.
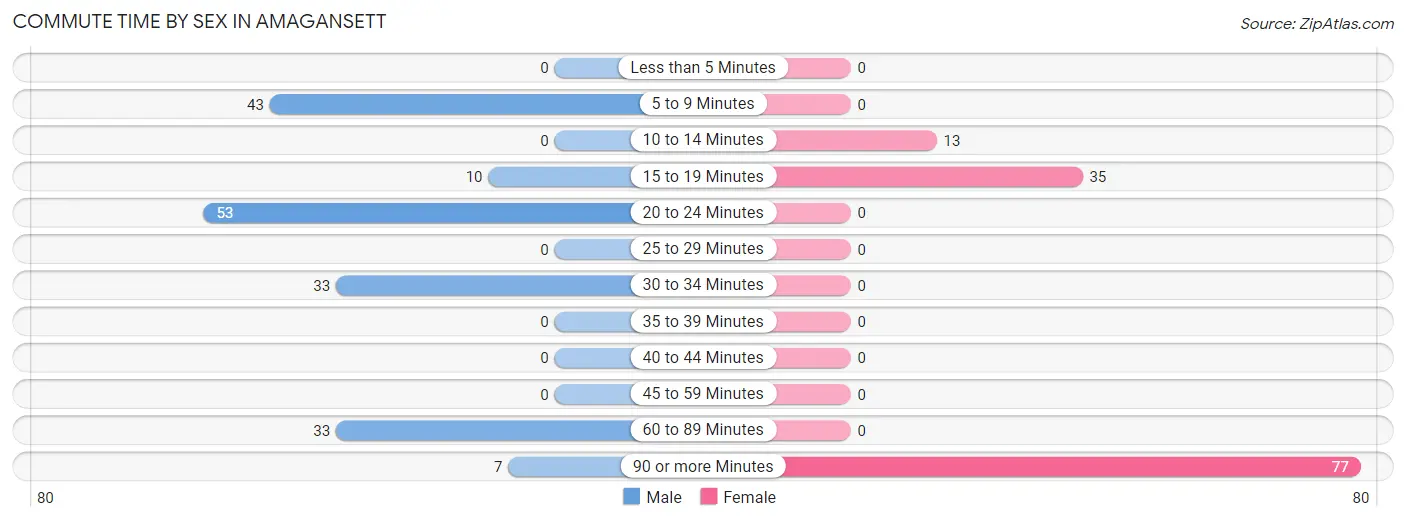
| Commute Time | Male | Female |
| Less than 5 Minutes | 0 (0.0%) | 0 (0.0%) |
| 5 to 9 Minutes | 43 (24.0%) | 0 (0.0%) |
| 10 to 14 Minutes | 0 (0.0%) | 13 (10.4%) |
| 15 to 19 Minutes | 10 (5.6%) | 35 (28.0%) |
| 20 to 24 Minutes | 53 (29.6%) | 0 (0.0%) |
| 25 to 29 Minutes | 0 (0.0%) | 0 (0.0%) |
| 30 to 34 Minutes | 33 (18.4%) | 0 (0.0%) |
| 35 to 39 Minutes | 0 (0.0%) | 0 (0.0%) |
| 40 to 44 Minutes | 0 (0.0%) | 0 (0.0%) |
| 45 to 59 Minutes | 0 (0.0%) | 0 (0.0%) |
| 60 to 89 Minutes | 33 (18.4%) | 0 (0.0%) |
| 90 or more Minutes | 7 (3.9%) | 77 (61.6%) |
Time of Departure to Work by Sex in Amagansett
The most frequent times of departure to work in Amagansett are 8:00 AM to 8:29 AM (46, 25.7%) for males and 10:00 AM to 10:59 AM (58, 46.4%) for females.
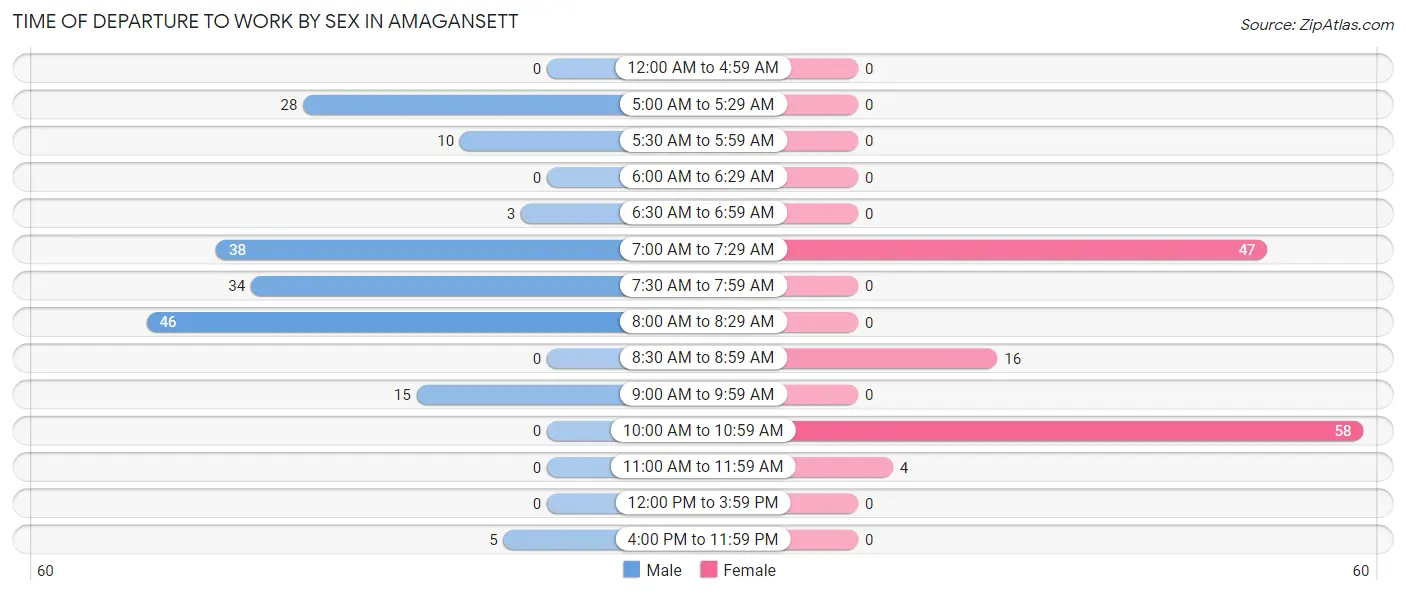
| Time of Departure | Male | Female |
| 12:00 AM to 4:59 AM | 0 (0.0%) | 0 (0.0%) |
| 5:00 AM to 5:29 AM | 28 (15.6%) | 0 (0.0%) |
| 5:30 AM to 5:59 AM | 10 (5.6%) | 0 (0.0%) |
| 6:00 AM to 6:29 AM | 0 (0.0%) | 0 (0.0%) |
| 6:30 AM to 6:59 AM | 3 (1.7%) | 0 (0.0%) |
| 7:00 AM to 7:29 AM | 38 (21.2%) | 47 (37.6%) |
| 7:30 AM to 7:59 AM | 34 (19.0%) | 0 (0.0%) |
| 8:00 AM to 8:29 AM | 46 (25.7%) | 0 (0.0%) |
| 8:30 AM to 8:59 AM | 0 (0.0%) | 16 (12.8%) |
| 9:00 AM to 9:59 AM | 15 (8.4%) | 0 (0.0%) |
| 10:00 AM to 10:59 AM | 0 (0.0%) | 58 (46.4%) |
| 11:00 AM to 11:59 AM | 0 (0.0%) | 4 (3.2%) |
| 12:00 PM to 3:59 PM | 0 (0.0%) | 0 (0.0%) |
| 4:00 PM to 11:59 PM | 5 (2.8%) | 0 (0.0%) |
| Total | 179 (100.0%) | 125 (100.0%) |
Housing Occupancy in Amagansett
Occupancy by Ownership in Amagansett
Of the total 326 dwellings in Amagansett, owner-occupied units account for 326 (100.0%), while renter-occupied units make up 0 (0.0%).
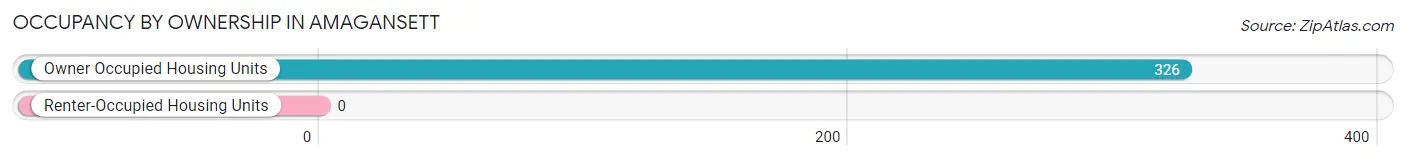
| Occupancy | # Housing Units | % Housing Units |
| Owner Occupied Housing Units | 326 | 100.0% |
| Renter-Occupied Housing Units | 0 | 0.0% |
| Total Occupied Housing Units | 326 | 100.0% |
Occupancy by Household Size in Amagansett
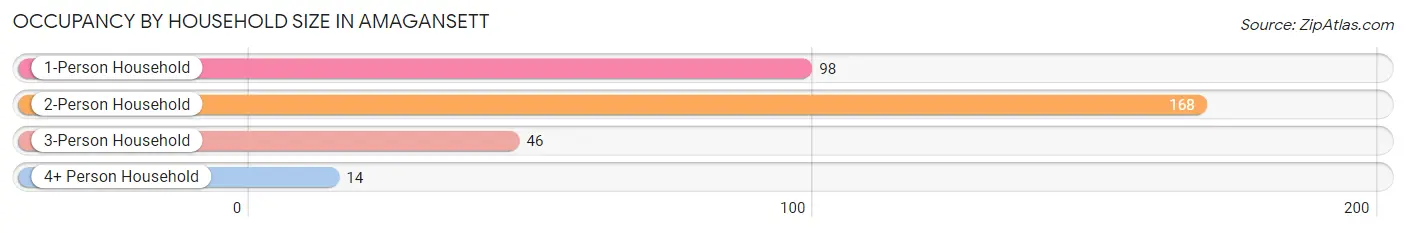
| Household Size | # Housing Units | % Housing Units |
| 1-Person Household | 98 | 30.1% |
| 2-Person Household | 168 | 51.5% |
| 3-Person Household | 46 | 14.1% |
| 4+ Person Household | 14 | 4.3% |
| Total Housing Units | 326 | 100.0% |
Occupancy by Ownership by Household Size in Amagansett
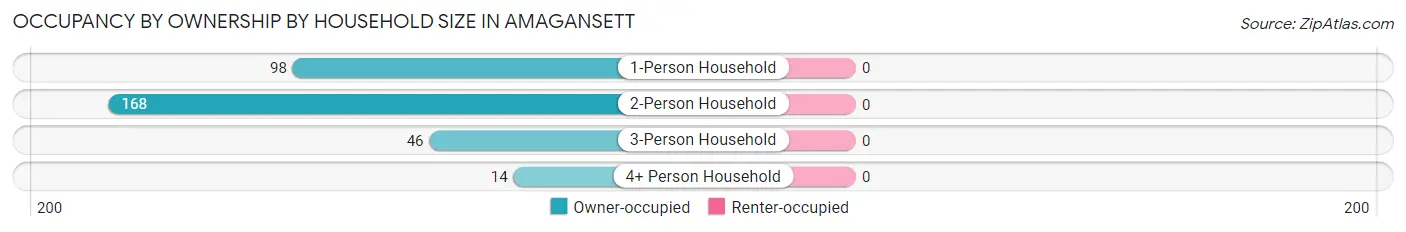
| Household Size | Owner-occupied | Renter-occupied |
| 1-Person Household | 98 (100.0%) | 0 (0.0%) |
| 2-Person Household | 168 (100.0%) | 0 (0.0%) |
| 3-Person Household | 46 (100.0%) | 0 (0.0%) |
| 4+ Person Household | 14 (100.0%) | 0 (0.0%) |
| Total Housing Units | 326 (100.0%) | 0 (0.0%) |
Occupancy by Educational Attainment in Amagansett
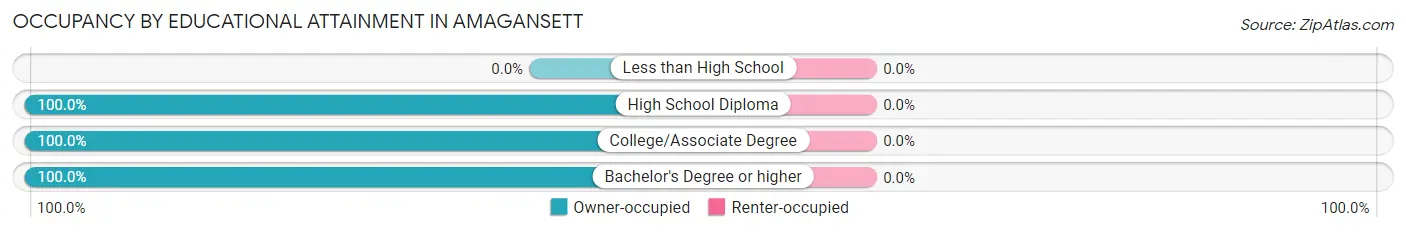
| Household Size | Owner-occupied | Renter-occupied |
| Less than High School | 0 (0.0%) | 0 (0.0%) |
| High School Diploma | 50 (100.0%) | 0 (0.0%) |
| College/Associate Degree | 50 (100.0%) | 0 (0.0%) |
| Bachelor's Degree or higher | 226 (100.0%) | 0 (0.0%) |
Occupancy by Age of Householder in Amagansett
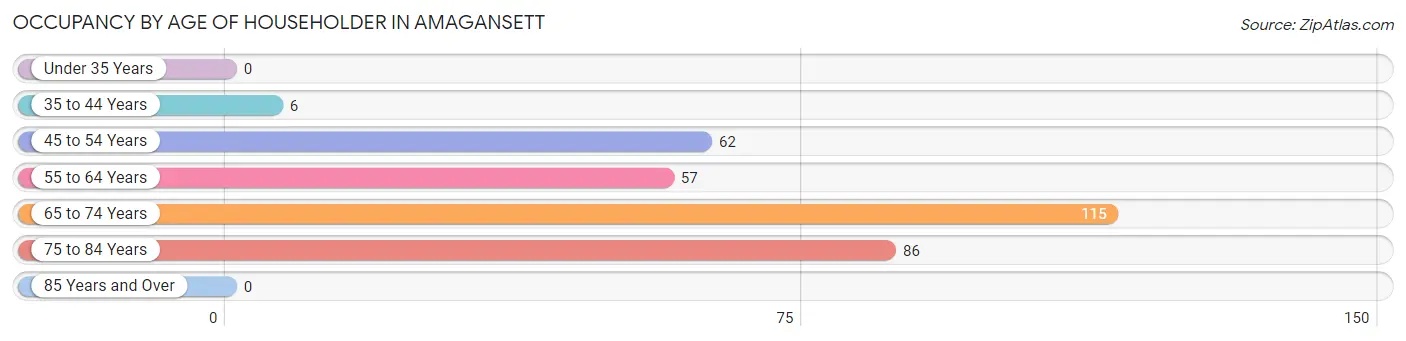
| Age Bracket | # Households | % Households |
| Under 35 Years | 0 | 0.0% |
| 35 to 44 Years | 6 | 1.8% |
| 45 to 54 Years | 62 | 19.0% |
| 55 to 64 Years | 57 | 17.5% |
| 65 to 74 Years | 115 | 35.3% |
| 75 to 84 Years | 86 | 26.4% |
| 85 Years and Over | 0 | 0.0% |
| Total | 326 | 100.0% |
Housing Finances in Amagansett
Median Income by Occupancy in Amagansett
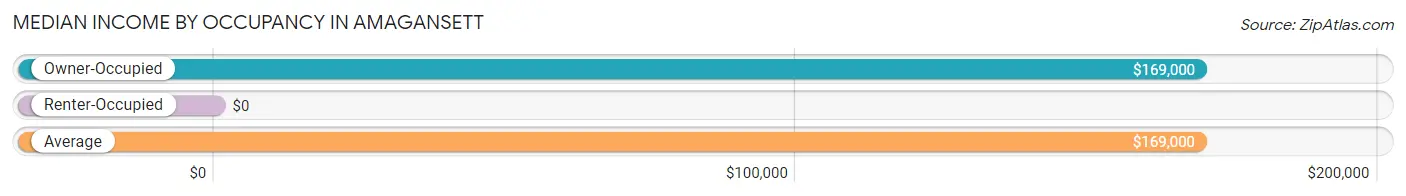
| Occupancy Type | # Households | Median Income |
| Owner-Occupied | 326 (100.0%) | $169,000 |
| Renter-Occupied | 0 (0.0%) | $0 |
| Average | 326 (100.0%) | $169,000 |
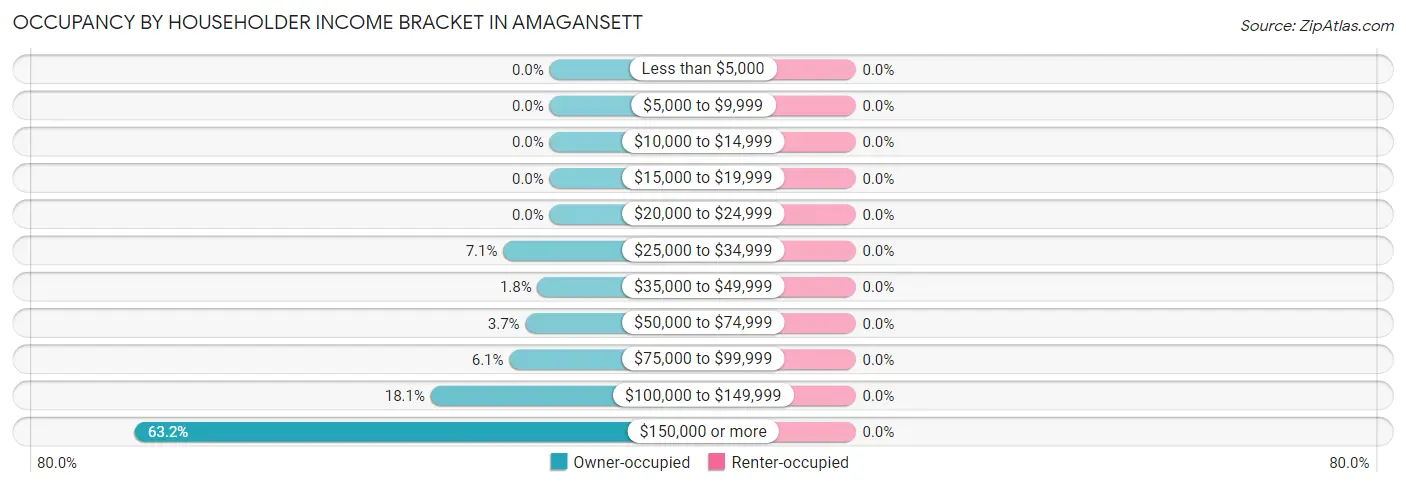
Occupancy by Householder Income Bracket in Amagansett
| Income Bracket | Owner-occupied | Renter-occupied |
| Less than $5,000 | 0 (0.0%) | 0 (0.0%) |
| $5,000 to $9,999 | 0 (0.0%) | 0 (0.0%) |
| $10,000 to $14,999 | 0 (0.0%) | 0 (0.0%) |
| $15,000 to $19,999 | 0 (0.0%) | 0 (0.0%) |
| $20,000 to $24,999 | 0 (0.0%) | 0 (0.0%) |
| $25,000 to $34,999 | 23 (7.1%) | 0 (0.0%) |
| $35,000 to $49,999 | 6 (1.8%) | 0 (0.0%) |
| $50,000 to $74,999 | 12 (3.7%) | 0 (0.0%) |
| $75,000 to $99,999 | 20 (6.1%) | 0 (0.0%) |
| $100,000 to $149,999 | 59 (18.1%) | 0 (0.0%) |
| $150,000 or more | 206 (63.2%) | 0 (0.0%) |
| Total | 326 (100.0%) | 0 (0.0%) |
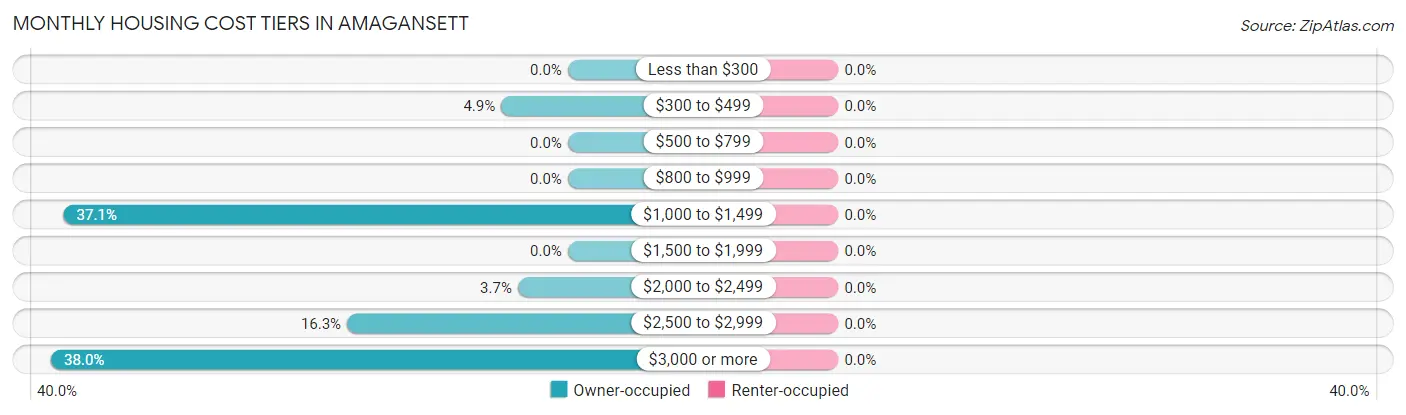
Monthly Housing Cost Tiers in Amagansett
| Monthly Cost | Owner-occupied | Renter-occupied |
| Less than $300 | 0 (0.0%) | 0 (0.0%) |
| $300 to $499 | 16 (4.9%) | 0 (0.0%) |
| $500 to $799 | 0 (0.0%) | 0 (0.0%) |
| $800 to $999 | 0 (0.0%) | 0 (0.0%) |
| $1,000 to $1,499 | 121 (37.1%) | 0 (0.0%) |
| $1,500 to $1,999 | 0 (0.0%) | 0 (0.0%) |
| $2,000 to $2,499 | 12 (3.7%) | 0 (0.0%) |
| $2,500 to $2,999 | 53 (16.3%) | 0 (0.0%) |
| $3,000 or more | 124 (38.0%) | 0 (0.0%) |
| Total | 326 (100.0%) | 0 (0.0%) |
Physical Housing Characteristics in Amagansett
Housing Structures in Amagansett
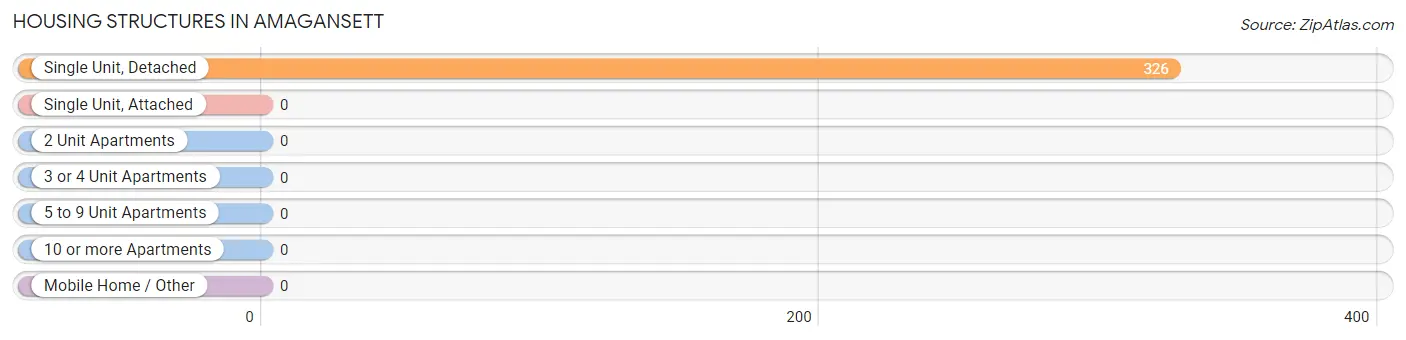
| Structure Type | # Housing Units | % Housing Units |
| Single Unit, Detached | 326 | 100.0% |
| Single Unit, Attached | 0 | 0.0% |
| 2 Unit Apartments | 0 | 0.0% |
| 3 or 4 Unit Apartments | 0 | 0.0% |
| 5 to 9 Unit Apartments | 0 | 0.0% |
| 10 or more Apartments | 0 | 0.0% |
| Mobile Home / Other | 0 | 0.0% |
| Total | 326 | 100.0% |
Housing Structures by Occupancy in Amagansett
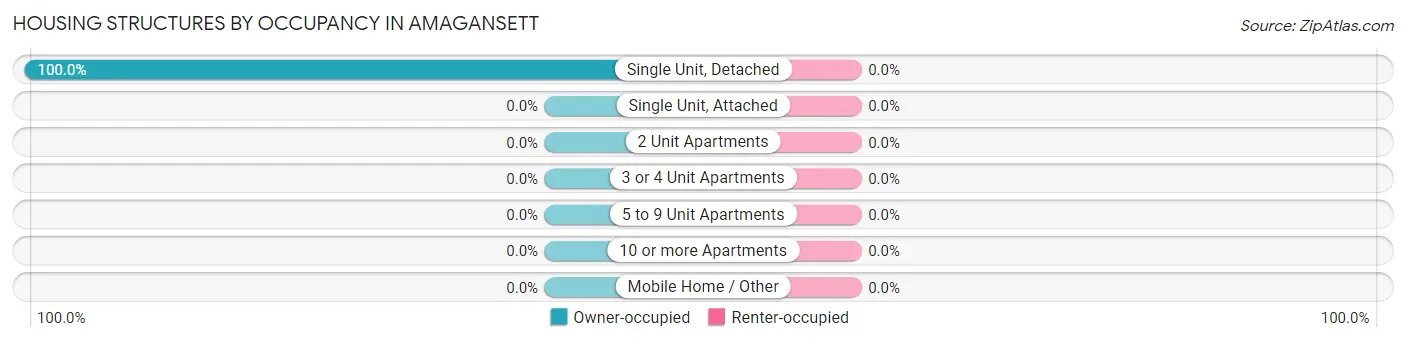
| Structure Type | Owner-occupied | Renter-occupied |
| Single Unit, Detached | 326 (100.0%) | 0 (0.0%) |
| Single Unit, Attached | 0 (0.0%) | 0 (0.0%) |
| 2 Unit Apartments | 0 (0.0%) | 0 (0.0%) |
| 3 or 4 Unit Apartments | 0 (0.0%) | 0 (0.0%) |
| 5 to 9 Unit Apartments | 0 (0.0%) | 0 (0.0%) |
| 10 or more Apartments | 0 (0.0%) | 0 (0.0%) |
| Mobile Home / Other | 0 (0.0%) | 0 (0.0%) |
| Total | 326 (100.0%) | 0 (0.0%) |
Housing Structures by Number of Rooms in Amagansett
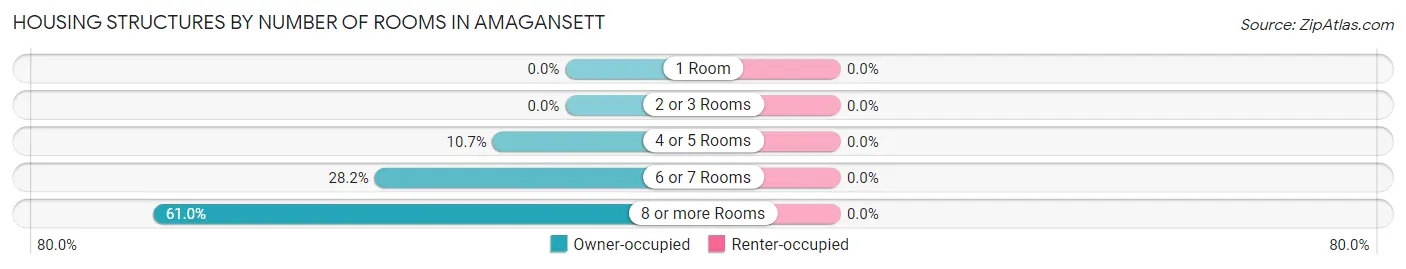
| Number of Rooms | Owner-occupied | Renter-occupied |
| 1 Room | 0 (0.0%) | 0 (0.0%) |
| 2 or 3 Rooms | 0 (0.0%) | 0 (0.0%) |
| 4 or 5 Rooms | 35 (10.7%) | 0 (0.0%) |
| 6 or 7 Rooms | 92 (28.2%) | 0 (0.0%) |
| 8 or more Rooms | 199 (61.0%) | 0 (0.0%) |
| Total | 326 (100.0%) | 0 (0.0%) |
Housing Structure by Heating Type in Amagansett
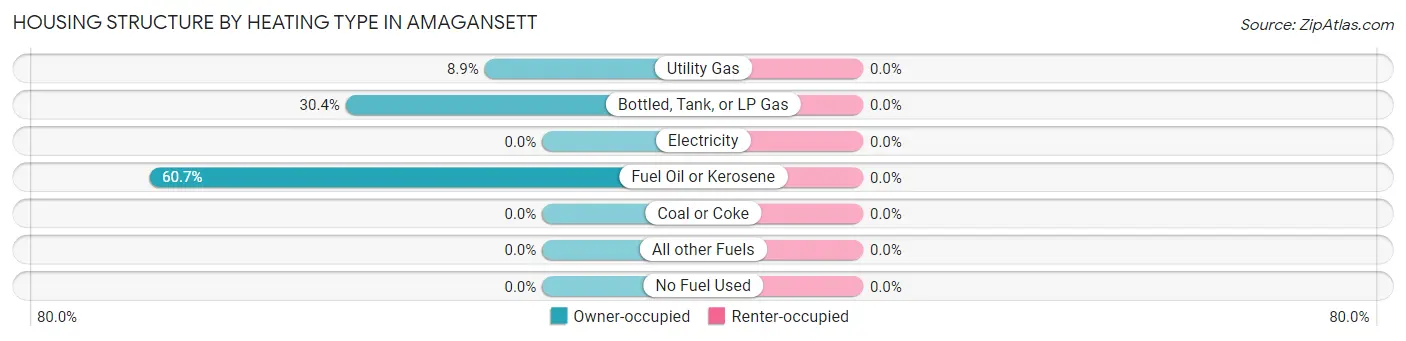
| Heating Type | Owner-occupied | Renter-occupied |
| Utility Gas | 29 (8.9%) | 0 (0.0%) |
| Bottled, Tank, or LP Gas | 99 (30.4%) | 0 (0.0%) |
| Electricity | 0 (0.0%) | 0 (0.0%) |
| Fuel Oil or Kerosene | 198 (60.7%) | 0 (0.0%) |
| Coal or Coke | 0 (0.0%) | 0 (0.0%) |
| All other Fuels | 0 (0.0%) | 0 (0.0%) |
| No Fuel Used | 0 (0.0%) | 0 (0.0%) |
| Total | 326 (100.0%) | 0 (0.0%) |
Household Vehicle Usage in Amagansett
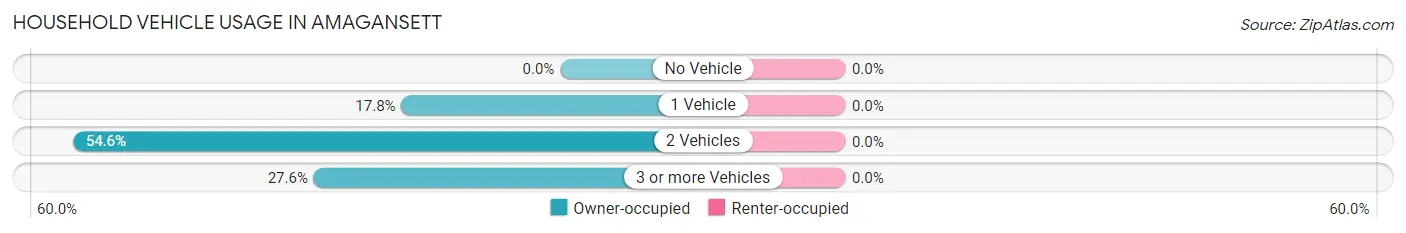
| Vehicles per Household | Owner-occupied | Renter-occupied |
| No Vehicle | 0 (0.0%) | 0 (0.0%) |
| 1 Vehicle | 58 (17.8%) | 0 (0.0%) |
| 2 Vehicles | 178 (54.6%) | 0 (0.0%) |
| 3 or more Vehicles | 90 (27.6%) | 0 (0.0%) |
| Total | 326 (100.0%) | 0 (0.0%) |
Real Estate & Mortgages in Amagansett
Real Estate and Mortgage Overview in Amagansett
| Characteristic | Without Mortgage | With Mortgage |
| Housing Units | 195 | 131 |
| Median Property Value | $1,195,600 | $2,000,001 |
| Median Household Income | $163,819 | $99 |
| Monthly Housing Costs | $1,309 | $113 |
| Real Estate Taxes | $6,440 | $0 |
Property Value by Mortgage Status in Amagansett
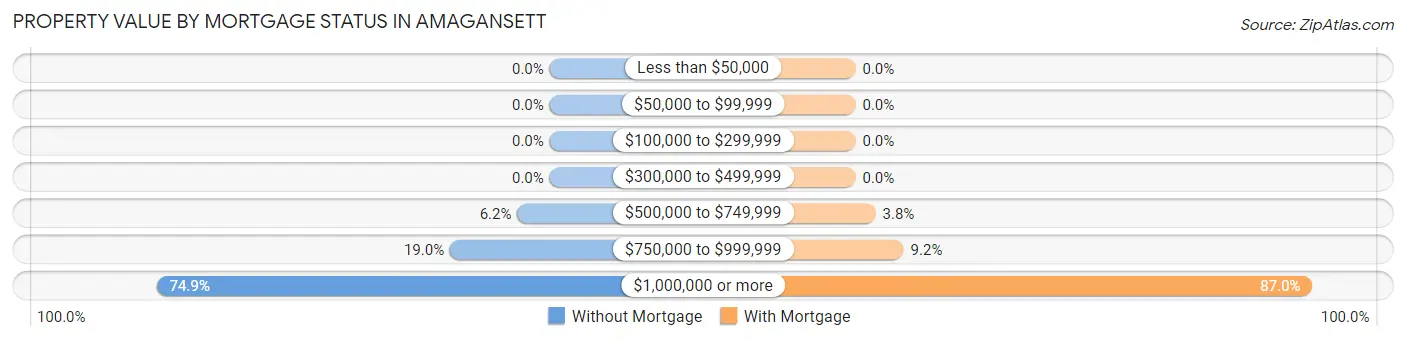
| Property Value | Without Mortgage | With Mortgage |
| Less than $50,000 | 0 (0.0%) | 0 (0.0%) |
| $50,000 to $99,999 | 0 (0.0%) | 0 (0.0%) |
| $100,000 to $299,999 | 0 (0.0%) | 0 (0.0%) |
| $300,000 to $499,999 | 0 (0.0%) | 0 (0.0%) |
| $500,000 to $749,999 | 12 (6.1%) | 5 (3.8%) |
| $750,000 to $999,999 | 37 (19.0%) | 12 (9.2%) |
| $1,000,000 or more | 146 (74.9%) | 114 (87.0%) |
| Total | 195 (100.0%) | 131 (100.0%) |
Household Income by Mortgage Status in Amagansett
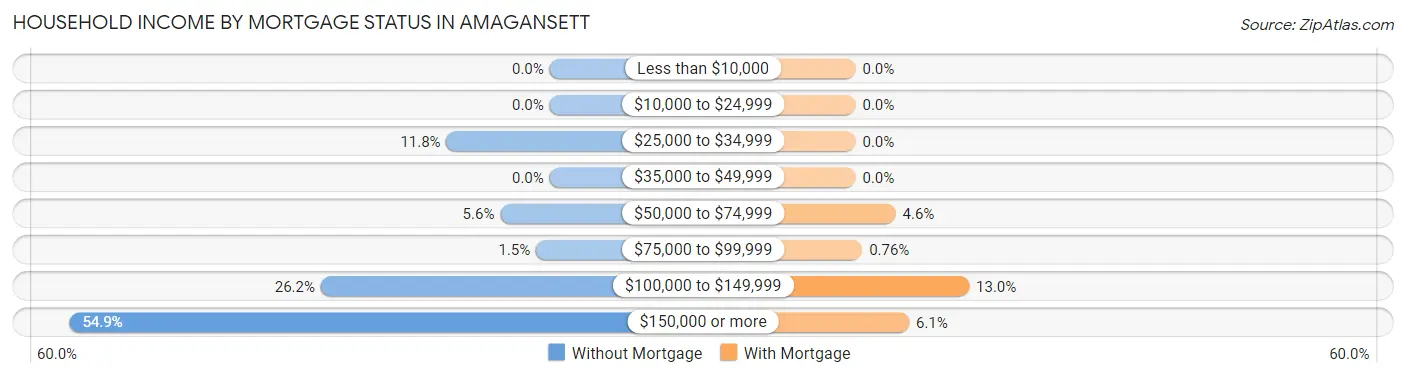
| Household Income | Without Mortgage | With Mortgage |
| Less than $10,000 | 0 (0.0%) | 0 (0.0%) |
| $10,000 to $24,999 | 0 (0.0%) | 0 (0.0%) |
| $25,000 to $34,999 | 23 (11.8%) | 0 (0.0%) |
| $35,000 to $49,999 | 0 (0.0%) | 0 (0.0%) |
| $50,000 to $74,999 | 11 (5.6%) | 6 (4.6%) |
| $75,000 to $99,999 | 3 (1.5%) | 1 (0.8%) |
| $100,000 to $149,999 | 51 (26.2%) | 17 (13.0%) |
| $150,000 or more | 107 (54.9%) | 8 (6.1%) |
| Total | 195 (100.0%) | 131 (100.0%) |
Property Value to Household Income Ratio in Amagansett
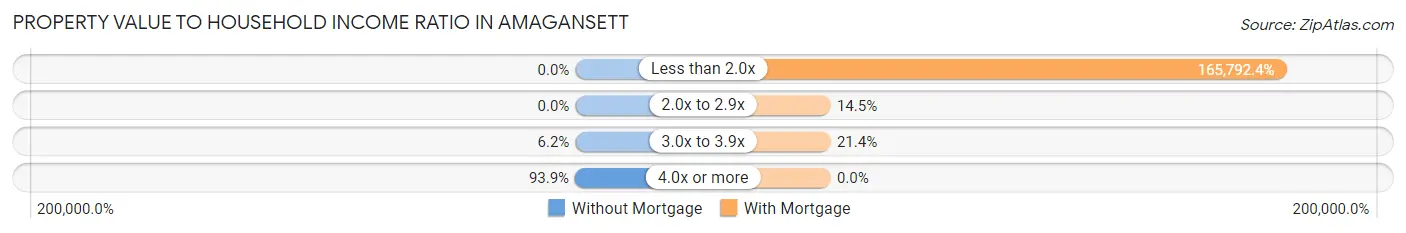
| Value-to-Income Ratio | Without Mortgage | With Mortgage |
| Less than 2.0x | 0 (0.0%) | 217,188 (165,792.4%) |
| 2.0x to 2.9x | 0 (0.0%) | 19 (14.5%) |
| 3.0x to 3.9x | 12 (6.1%) | 28 (21.4%) |
| 4.0x or more | 183 (93.9%) | 0 (0.0%) |
| Total | 195 (100.0%) | 131 (100.0%) |
Real Estate Taxes by Mortgage Status in Amagansett
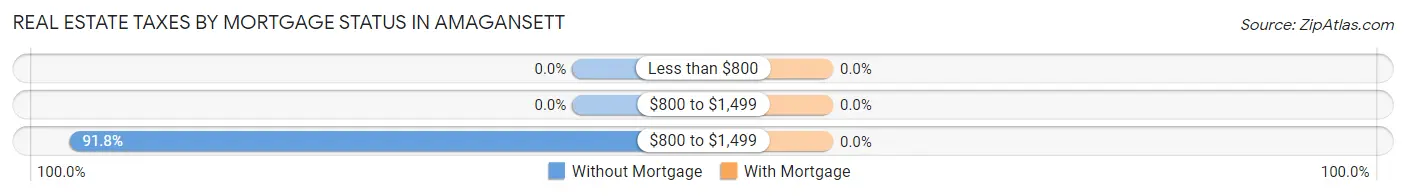
| Property Taxes | Without Mortgage | With Mortgage |
| Less than $800 | 0 (0.0%) | 0 (0.0%) |
| $800 to $1,499 | 0 (0.0%) | 0 (0.0%) |
| $800 to $1,499 | 179 (91.8%) | 0 (0.0%) |
| Total | 195 (100.0%) | 131 (100.0%) |
Health & Disability in Amagansett
Health Insurance Coverage by Age in Amagansett
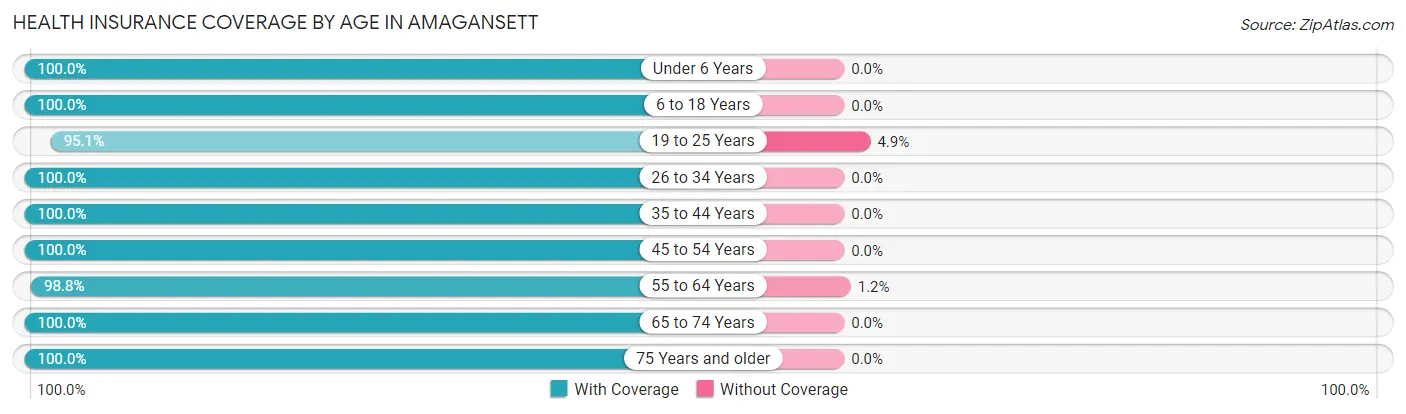
| Age Bracket | With Coverage | Without Coverage |
| Under 6 Years | 18 (100.0%) | 0 (0.0%) |
| 6 to 18 Years | 38 (100.0%) | 0 (0.0%) |
| 19 to 25 Years | 39 (95.1%) | 2 (4.9%) |
| 26 to 34 Years | 19 (100.0%) | 0 (0.0%) |
| 35 to 44 Years | 8 (100.0%) | 0 (0.0%) |
| 45 to 54 Years | 85 (100.0%) | 0 (0.0%) |
| 55 to 64 Years | 163 (98.8%) | 2 (1.2%) |
| 65 to 74 Years | 185 (100.0%) | 0 (0.0%) |
| 75 Years and older | 119 (100.0%) | 0 (0.0%) |
| Total | 674 (99.4%) | 4 (0.6%) |
Health Insurance Coverage by Citizenship Status in Amagansett
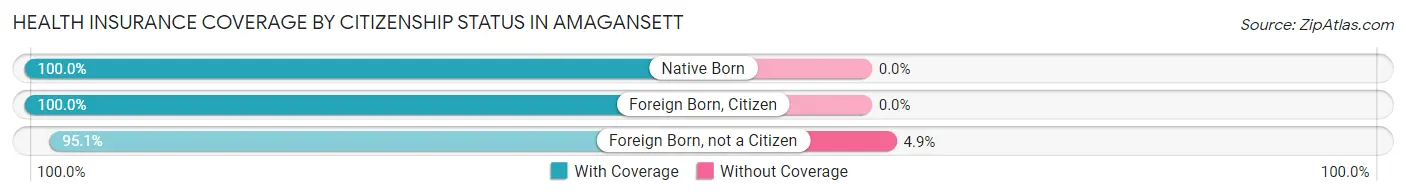
| Citizenship Status | With Coverage | Without Coverage |
| Native Born | 18 (100.0%) | 0 (0.0%) |
| Foreign Born, Citizen | 38 (100.0%) | 0 (0.0%) |
| Foreign Born, not a Citizen | 39 (95.1%) | 2 (4.9%) |
Health Insurance Coverage by Household Income in Amagansett
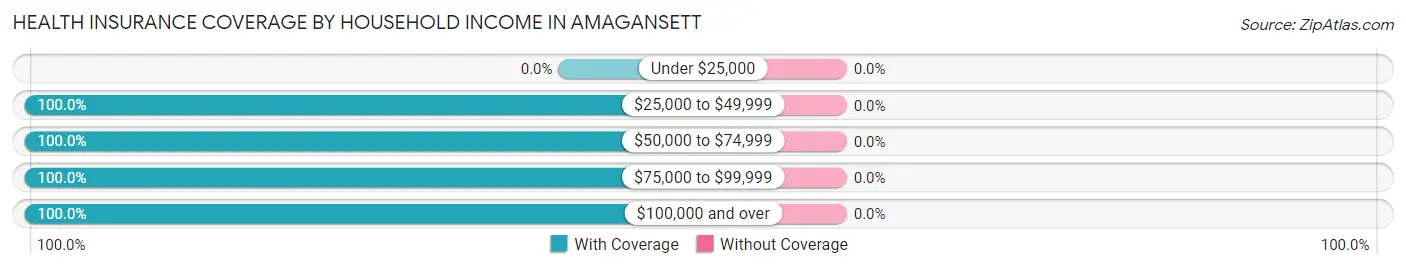
| Household Income | With Coverage | Without Coverage |
| Under $25,000 | 0 (0.0%) | 0 (0.0%) |
| $25,000 to $49,999 | 66 (100.0%) | 0 (0.0%) |
| $50,000 to $74,999 | 13 (100.0%) | 0 (0.0%) |
| $75,000 to $99,999 | 20 (100.0%) | 0 (0.0%) |
| $100,000 and over | 567 (100.0%) | 0 (0.0%) |
Public vs Private Health Insurance Coverage by Age in Amagansett
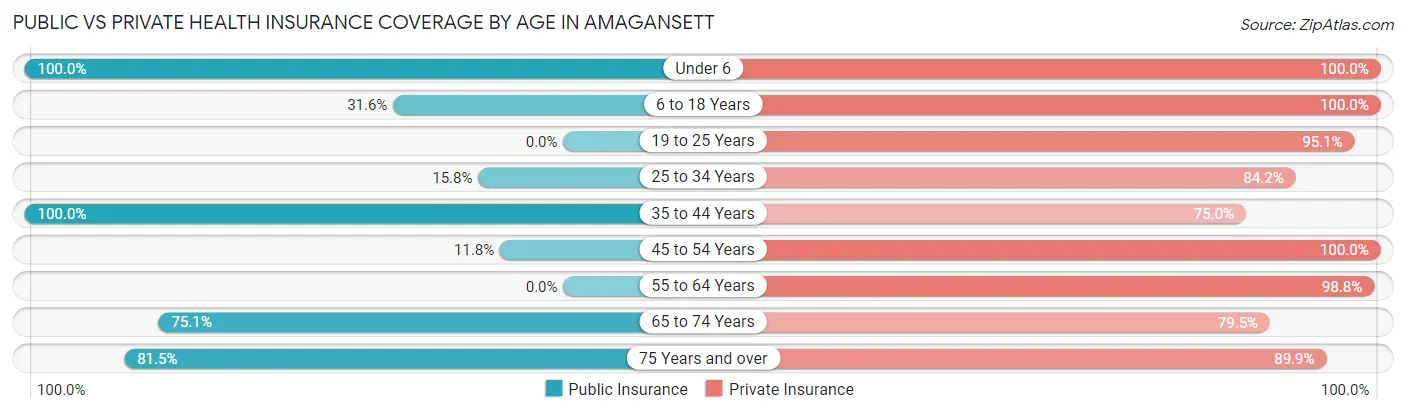
| Age Bracket | Public Insurance | Private Insurance |
| Under 6 | 18 (100.0%) | 18 (100.0%) |
| 6 to 18 Years | 12 (31.6%) | 38 (100.0%) |
| 19 to 25 Years | 0 (0.0%) | 39 (95.1%) |
| 25 to 34 Years | 3 (15.8%) | 16 (84.2%) |
| 35 to 44 Years | 8 (100.0%) | 6 (75.0%) |
| 45 to 54 Years | 10 (11.8%) | 85 (100.0%) |
| 55 to 64 Years | 0 (0.0%) | 163 (98.8%) |
| 65 to 74 Years | 139 (75.1%) | 147 (79.5%) |
| 75 Years and over | 97 (81.5%) | 107 (89.9%) |
| Total | 287 (42.3%) | 619 (91.3%) |
Disability Status by Sex by Age in Amagansett
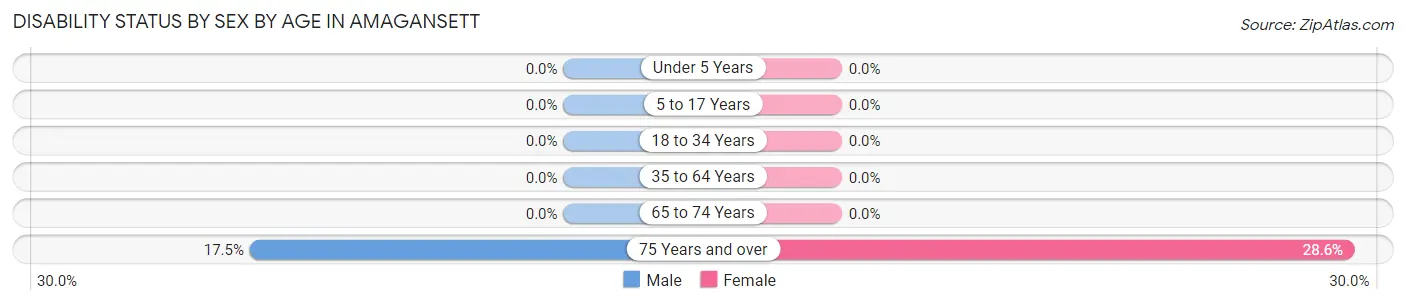
| Age Bracket | Male | Female |
| Under 5 Years | 0 (0.0%) | 0 (0.0%) |
| 5 to 17 Years | 0 (0.0%) | 0 (0.0%) |
| 18 to 34 Years | 0 (0.0%) | 0 (0.0%) |
| 35 to 64 Years | 0 (0.0%) | 0 (0.0%) |
| 65 to 74 Years | 0 (0.0%) | 0 (0.0%) |
| 75 Years and over | 11 (17.5%) | 16 (28.6%) |
Disability Class by Sex by Age in Amagansett
Disability Class: Hearing Difficulty
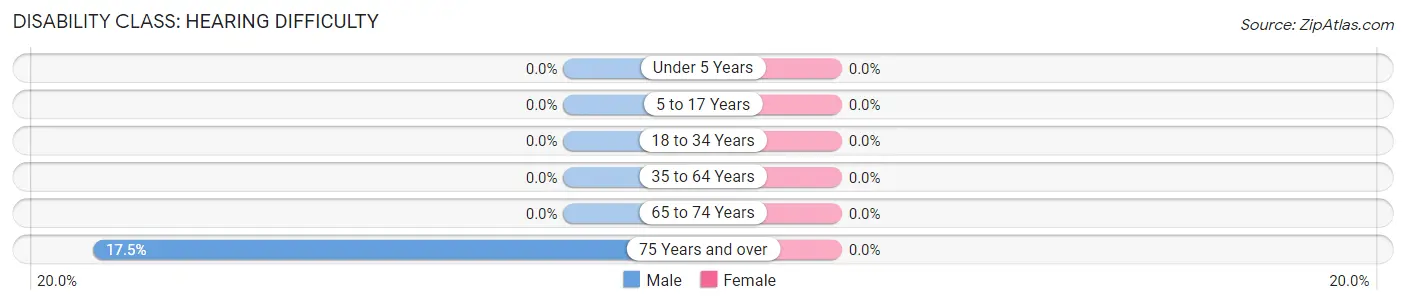
| Age Bracket | Male | Female |
| Under 5 Years | 0 (0.0%) | 0 (0.0%) |
| 5 to 17 Years | 0 (0.0%) | 0 (0.0%) |
| 18 to 34 Years | 0 (0.0%) | 0 (0.0%) |
| 35 to 64 Years | 0 (0.0%) | 0 (0.0%) |
| 65 to 74 Years | 0 (0.0%) | 0 (0.0%) |
| 75 Years and over | 11 (17.5%) | 0 (0.0%) |
Disability Class: Vision Difficulty
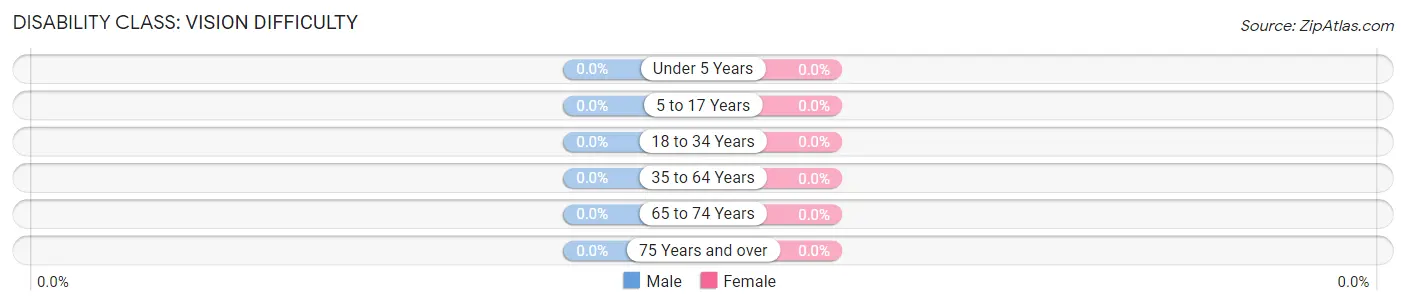
| Age Bracket | Male | Female |
| Under 5 Years | 0 (0.0%) | 0 (0.0%) |
| 5 to 17 Years | 0 (0.0%) | 0 (0.0%) |
| 18 to 34 Years | 0 (0.0%) | 0 (0.0%) |
| 35 to 64 Years | 0 (0.0%) | 0 (0.0%) |
| 65 to 74 Years | 0 (0.0%) | 0 (0.0%) |
| 75 Years and over | 0 (0.0%) | 0 (0.0%) |
Disability Class: Cognitive Difficulty
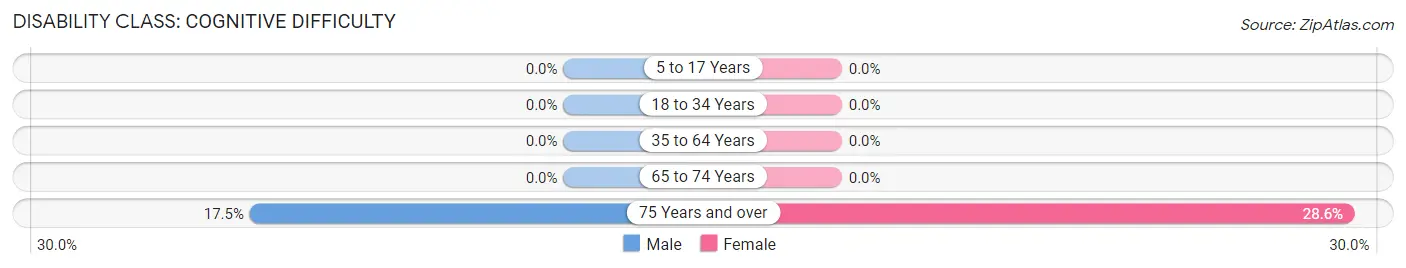
| Age Bracket | Male | Female |
| 5 to 17 Years | 0 (0.0%) | 0 (0.0%) |
| 18 to 34 Years | 0 (0.0%) | 0 (0.0%) |
| 35 to 64 Years | 0 (0.0%) | 0 (0.0%) |
| 65 to 74 Years | 0 (0.0%) | 0 (0.0%) |
| 75 Years and over | 11 (17.5%) | 16 (28.6%) |
Disability Class: Ambulatory Difficulty
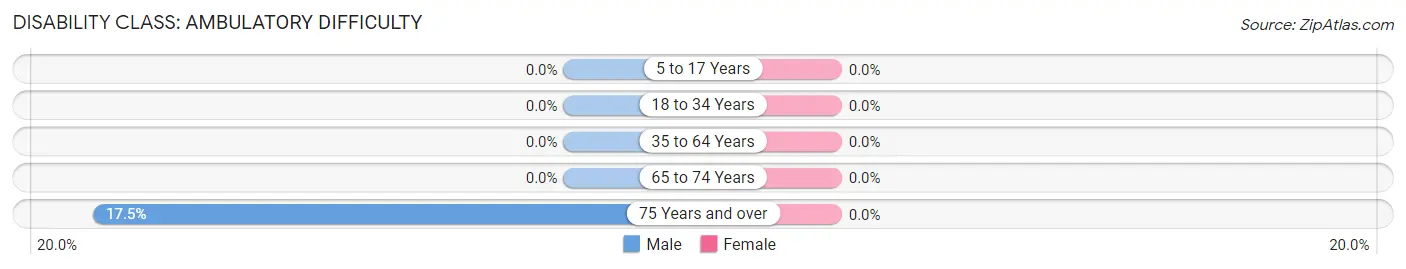
| Age Bracket | Male | Female |
| 5 to 17 Years | 0 (0.0%) | 0 (0.0%) |
| 18 to 34 Years | 0 (0.0%) | 0 (0.0%) |
| 35 to 64 Years | 0 (0.0%) | 0 (0.0%) |
| 65 to 74 Years | 0 (0.0%) | 0 (0.0%) |
| 75 Years and over | 11 (17.5%) | 0 (0.0%) |
Disability Class: Self-Care Difficulty
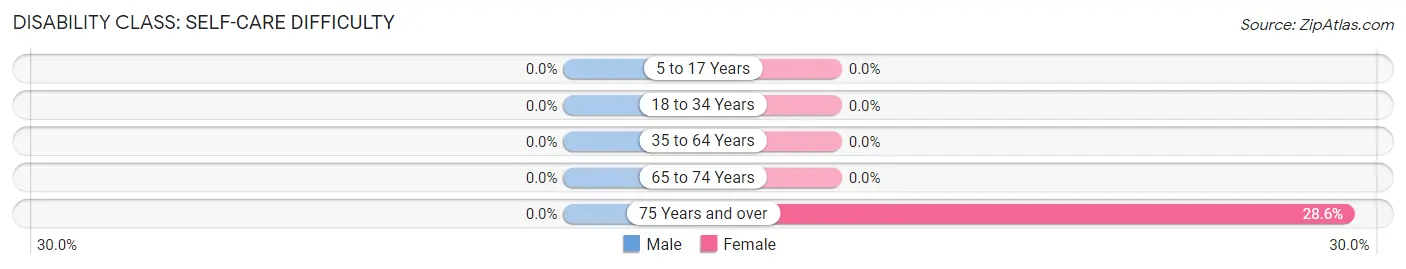
| Age Bracket | Male | Female |
| 5 to 17 Years | 0 (0.0%) | 0 (0.0%) |
| 18 to 34 Years | 0 (0.0%) | 0 (0.0%) |
| 35 to 64 Years | 0 (0.0%) | 0 (0.0%) |
| 65 to 74 Years | 0 (0.0%) | 0 (0.0%) |
| 75 Years and over | 0 (0.0%) | 16 (28.6%) |
Technology Access in Amagansett
Computing Device Access in Amagansett
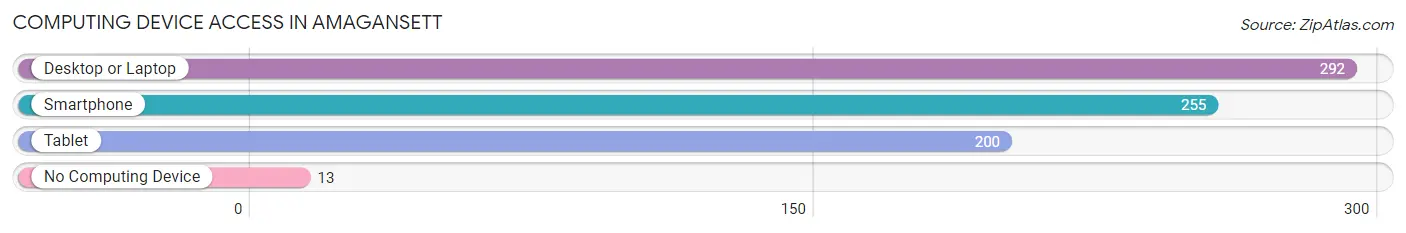
| Device Type | # Households | % Households |
| Desktop or Laptop | 292 | 89.6% |
| Smartphone | 255 | 78.2% |
| Tablet | 200 | 61.4% |
| No Computing Device | 13 | 4.0% |
| Total | 326 | 100.0% |
Internet Access in Amagansett
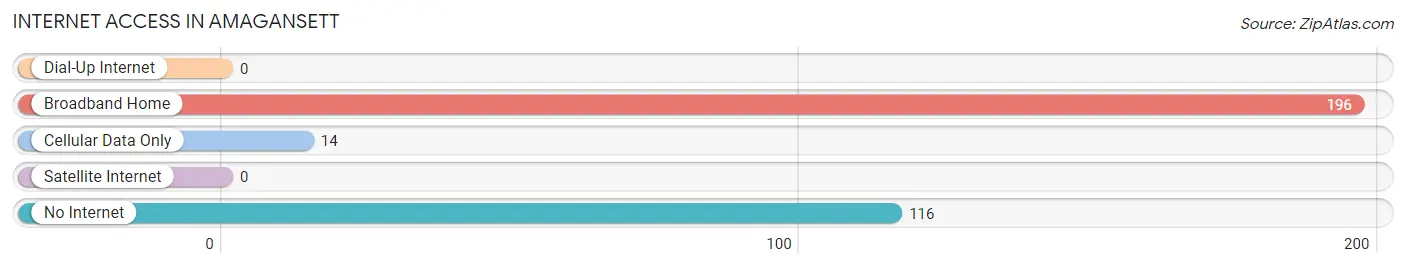
| Internet Type | # Households | % Households |
| Dial-Up Internet | 0 | 0.0% |
| Broadband Home | 196 | 60.1% |
| Cellular Data Only | 14 | 4.3% |
| Satellite Internet | 0 | 0.0% |
| No Internet | 116 | 35.6% |
| Total | 326 | 100.0% |
Amagansett Summary
Amagansett is a hamlet located in the Town of East Hampton in Suffolk County, New York. It is located on the South Shore of Long Island, approximately 90 miles east of New York City. The hamlet is known for its beautiful beaches, quaint shops, and historic homes.
History
The area now known as Amagansett was originally inhabited by the Montaukett Native American tribe. The first European settlers arrived in the area in 1648, and the hamlet was officially established in 1680. The name “Amagansett” is derived from the Montaukett word “omaganset”, which means “place of good water”.
In the late 19th century, Amagansett became a popular summer destination for wealthy New Yorkers. The area was home to several grand estates, including the former home of President Theodore Roosevelt. The hamlet was also home to a thriving fishing industry, which provided a livelihood for many of the local residents.
Geography
Amagansett is located on the South Shore of Long Island, approximately 90 miles east of New York City. The hamlet is bordered by the Atlantic Ocean to the south, Napeague Bay to the west, and the Town of East Hampton to the north and east. The hamlet is located within the Town of East Hampton, which is part of Suffolk County.
The hamlet is divided into two distinct sections: the “village” and the “beach”. The village is located on the western side of the hamlet and is home to many of the local businesses and shops. The beach is located on the eastern side of the hamlet and is home to several popular beaches, including Indian Wells Beach, Atlantic Avenue Beach, and Main Beach.
Economy
The economy of Amagansett is largely driven by tourism. The hamlet is home to several popular beaches, which attract visitors from all over the world. The area is also home to several restaurants, shops, and galleries, which cater to both locals and visitors.
In addition to tourism, Amagansett is home to a thriving fishing industry. The hamlet is home to several commercial fishing boats, which provide a livelihood for many of the local residents. The hamlet is also home to several farms, which produce a variety of fruits and vegetables.
Demographics
As of the 2010 census, the population of Amagansett was 1,092. The population is largely white (90.2%), with a small percentage of African Americans (2.2%) and Hispanics (3.2%). The median household income is $87,500, and the median home value is $1,072,000.
Conclusion
Amagansett is a beautiful hamlet located on the South Shore of Long Island. The hamlet is known for its beautiful beaches, quaint shops, and historic homes. The economy of Amagansett is largely driven by tourism, and the hamlet is home to a thriving fishing industry. The population of Amagansett is largely white, with a small percentage of African Americans and Hispanics.
Common Questions
What is Per Capita Income in Amagansett?
Per Capita income in Amagansett is $125,357.
What is the Median Family Income in Amagansett?
Median Family Income in Amagansett is $171,250.
What is the Median Household income in Amagansett?
Median Household Income in Amagansett is $169,000.
What is Income or Wage Gap in Amagansett?
Income or Wage Gap in Amagansett is 26.8%.
Women in Amagansett earn 73.2 cents for every dollar earned by a man.
What is Inequality or Gini Index in Amagansett?
Inequality or Gini Index in Amagansett is 0.45.
What is the Total Population of Amagansett?
Total Population of Amagansett is 678.
What is the Total Male Population of Amagansett?
Total Male Population of Amagansett is 288.
What is the Total Female Population of Amagansett?
Total Female Population of Amagansett is 390.
What is the Ratio of Males per 100 Females in Amagansett?
There are 73.85 Males per 100 Females in Amagansett.
What is the Ratio of Females per 100 Males in Amagansett?
There are 135.42 Females per 100 Males in Amagansett.
What is the Median Population Age in Amagansett?
Median Population Age in Amagansett is 63.3 Years.
What is the Average Family Size in Amagansett
Average Family Size in Amagansett is 2.5 People.
What is the Average Household Size in Amagansett
Average Household Size in Amagansett is 2.0 People.
How Large is the Labor Force in Amagansett?
There are 321 People in the Labor Forcein in Amagansett.
What is the Percentage of People in the Labor Force in Amagansett?
49.5% of People are in the Labor Force in Amagansett.