North Sea, NY Map & Demographics
North Sea Map
North Sea Overview
$103,883
PER CAPITA INCOME
$204,277
AVG FAMILY INCOME
$150,833
AVG HOUSEHOLD INCOME
0.53
INEQUALITY / GINI INDEX
6,054
TOTAL POPULATION
3,241
MALE POPULATION
2,813
FEMALE POPULATION
115.22
MALES / 100 FEMALES
86.79
FEMALES / 100 MALES
47.5
MEDIAN AGE
3.5
AVG FAMILY SIZE
2.8
AVG HOUSEHOLD SIZE
3,557
LABOR FORCE [ PEOPLE ]
69.8%
PERCENT IN LABOR FORCE
0.9%
UNEMPLOYMENT RATE
Income in North Sea
Income Overview in North Sea
Per Capita Income in North Sea is $103,883, while median incomes of families and households are $204,277 and $150,833 respectively.
| Characteristic | Number | Measure |
| Per Capita Income | 6,054 | $103,883 |
| Median Family Income | 1,463 | $204,277 |
| Mean Family Income | 1,463 | $346,233 |
| Median Household Income | 2,186 | $150,833 |
| Mean Household Income | 2,186 | $277,893 |
| Income Deficit | 1,463 | $0 |
| Wage / Income Gap (%) | 6,054 | 0.00% |
| Wage / Income Gap ($) | 6,054 | 100.00¢ per $1 |
| Gini / Inequality Index | 6,054 | 0.53 |
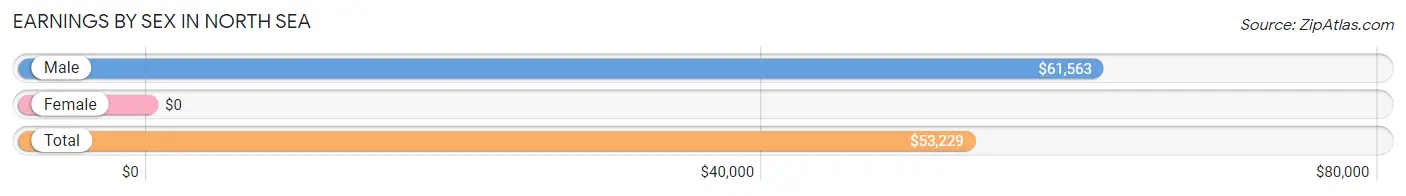
Earnings by Sex in North Sea
| Sex | Number | Average Earnings |
| Male | 2,120 (57.3%) | $61,563 |
| Female | 1,581 (42.7%) | $0 |
| Total | 3,701 (100.0%) | $53,229 |
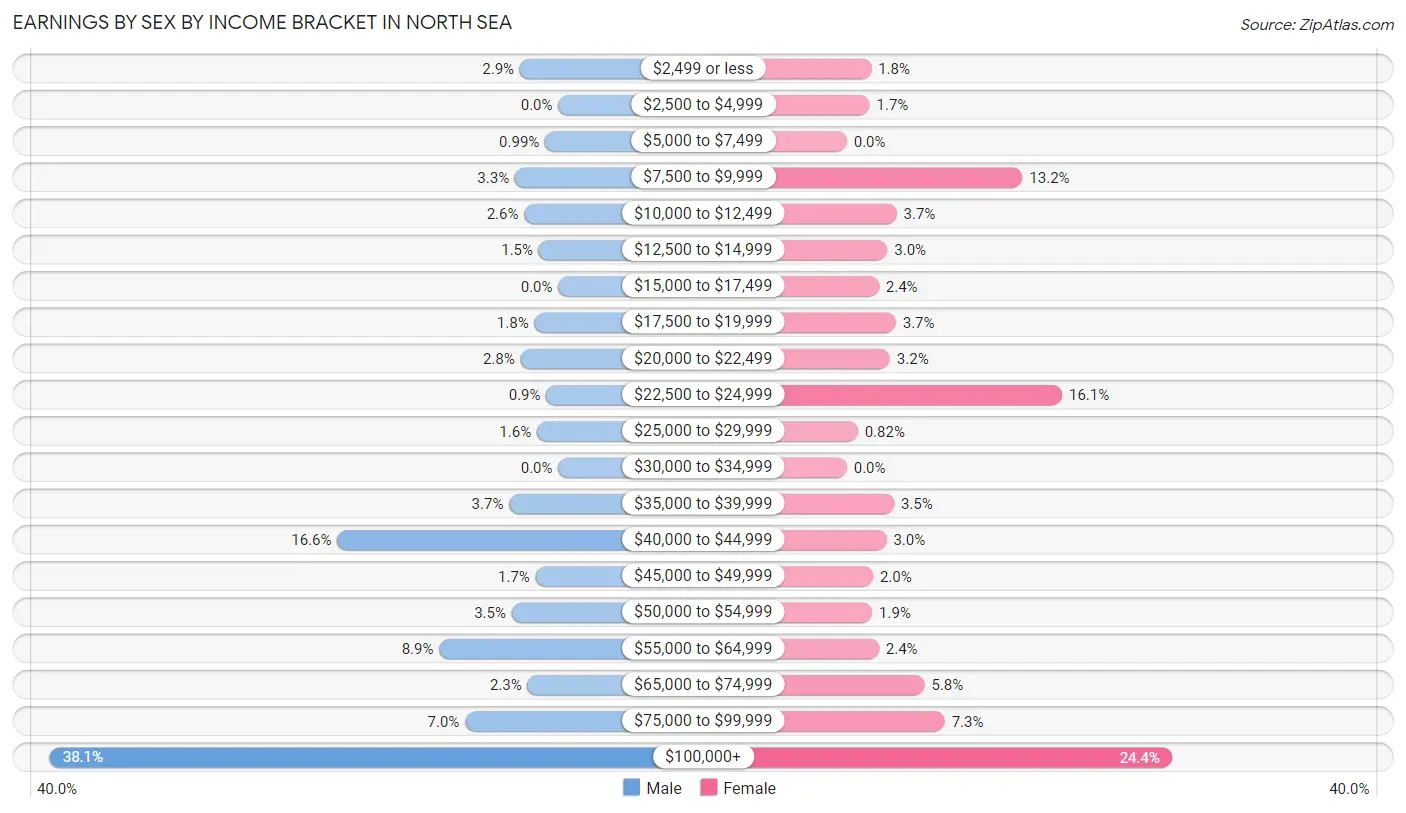
Earnings by Sex by Income Bracket in North Sea
The most common earnings brackets in North Sea are $100,000+ for men (808 | 38.1%) and $100,000+ for women (385 | 24.3%).
| Income | Male | Female |
| $2,499 or less | 61 (2.9%) | 29 (1.8%) |
| $2,500 to $4,999 | 0 (0.0%) | 27 (1.7%) |
| $5,000 to $7,499 | 21 (1.0%) | 0 (0.0%) |
| $7,500 to $9,999 | 69 (3.3%) | 208 (13.2%) |
| $10,000 to $12,499 | 54 (2.5%) | 59 (3.7%) |
| $12,500 to $14,999 | 31 (1.5%) | 48 (3.0%) |
| $15,000 to $17,499 | 0 (0.0%) | 38 (2.4%) |
| $17,500 to $19,999 | 38 (1.8%) | 58 (3.7%) |
| $20,000 to $22,499 | 60 (2.8%) | 51 (3.2%) |
| $22,500 to $24,999 | 19 (0.9%) | 255 (16.1%) |
| $25,000 to $29,999 | 34 (1.6%) | 13 (0.8%) |
| $30,000 to $34,999 | 0 (0.0%) | 0 (0.0%) |
| $35,000 to $39,999 | 78 (3.7%) | 56 (3.5%) |
| $40,000 to $44,999 | 351 (16.6%) | 47 (3.0%) |
| $45,000 to $49,999 | 36 (1.7%) | 31 (2.0%) |
| $50,000 to $54,999 | 74 (3.5%) | 30 (1.9%) |
| $55,000 to $64,999 | 189 (8.9%) | 38 (2.4%) |
| $65,000 to $74,999 | 49 (2.3%) | 92 (5.8%) |
| $75,000 to $99,999 | 148 (7.0%) | 116 (7.3%) |
| $100,000+ | 808 (38.1%) | 385 (24.3%) |
| Total | 2,120 (100.0%) | 1,581 (100.0%) |
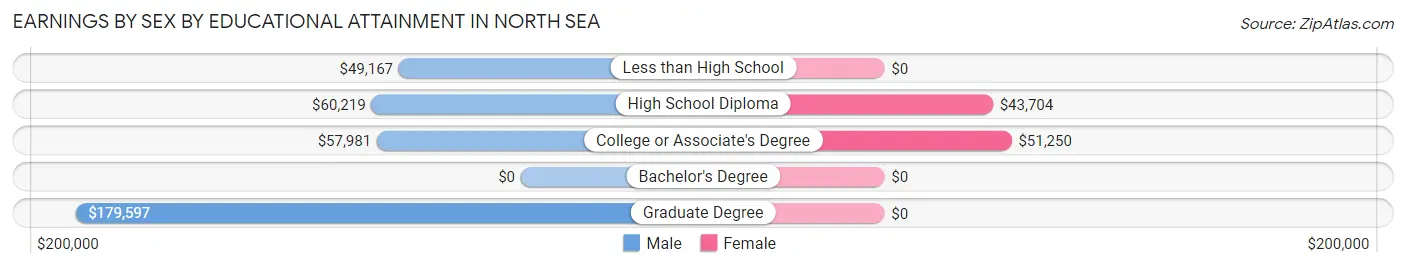
Earnings by Sex by Educational Attainment in North Sea
Average earnings in North Sea are $73,702 for men and $48,182 for women, a difference of 34.6%. Men with an educational attainment of graduate degree enjoy the highest average annual earnings of $179,597, while those with less than high school education earn the least with $49,167. Women with an educational attainment of college or associate's degree earn the most with the average annual earnings of $51,250, while those with high school diploma education have the smallest earnings of $43,704.
| Educational Attainment | Male Income | Female Income |
| Less than High School | $49,167 | $0 |
| High School Diploma | $60,219 | $43,704 |
| College or Associate's Degree | $57,981 | $51,250 |
| Bachelor's Degree | - | - |
| Graduate Degree | $179,597 | $0 |
| Total | $73,702 | $48,182 |
Family Income in North Sea
Family Income Brackets in North Sea
According to the North Sea family income data, there are 805 families falling into the $200,000+ income range, which is the most common income bracket and makes up 55.0% of all families.
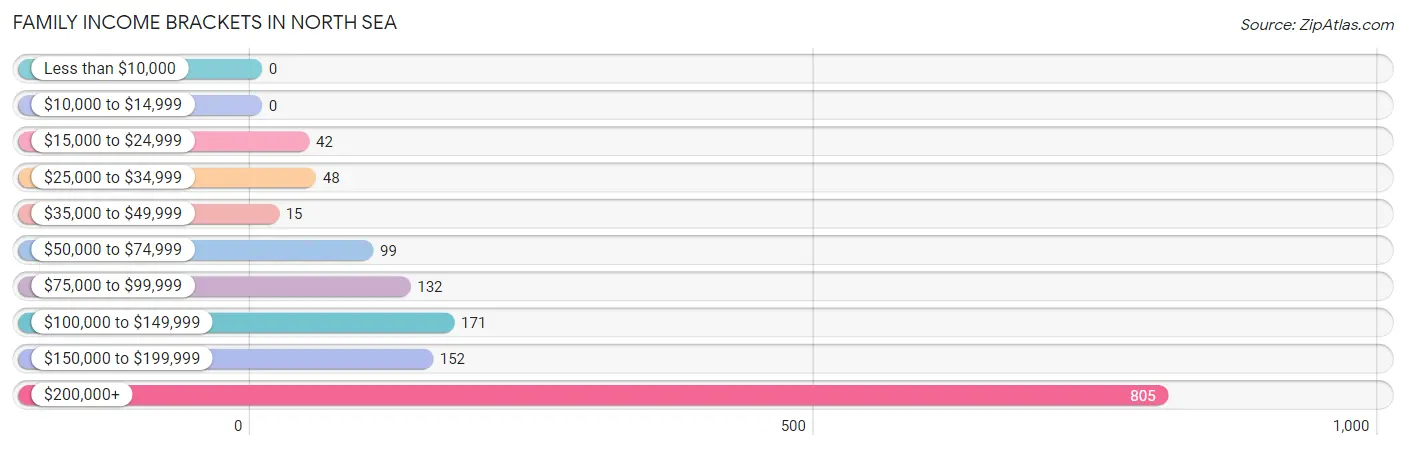
| Income Bracket | # Families | % Families |
| Less than $10,000 | 0 | 0.0% |
| $10,000 to $14,999 | 0 | 0.0% |
| $15,000 to $24,999 | 42 | 2.9% |
| $25,000 to $34,999 | 48 | 3.3% |
| $35,000 to $49,999 | 15 | 1.0% |
| $50,000 to $74,999 | 99 | 6.8% |
| $75,000 to $99,999 | 132 | 9.0% |
| $100,000 to $149,999 | 171 | 11.7% |
| $150,000 to $199,999 | 152 | 10.4% |
| $200,000+ | 805 | 55.0% |
Family Income by Famaliy Size in North Sea
5-person families (136 | 9.3%) account for the highest median family income in North Sea with $250,001 per family, while 2-person families (678 | 46.3%) have the highest median income of $101,581 per family member.
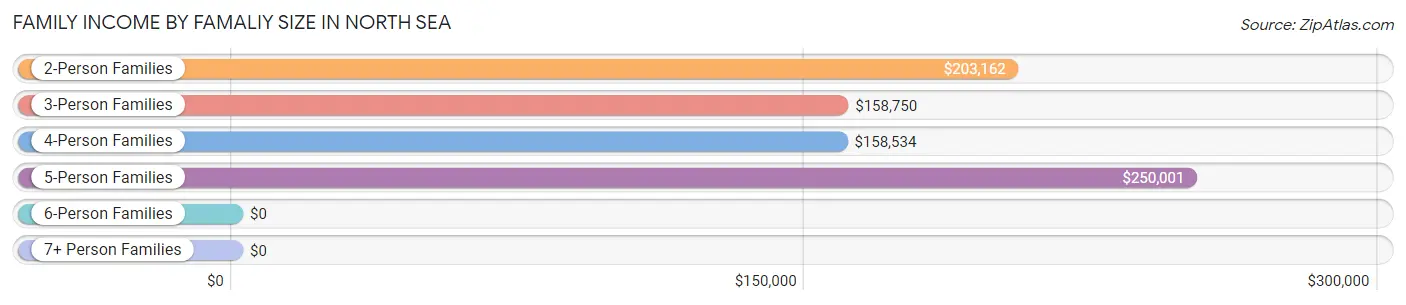
| Income Bracket | # Families | Median Income |
| 2-Person Families | 678 (46.3%) | $203,162 |
| 3-Person Families | 350 (23.9%) | $158,750 |
| 4-Person Families | 216 (14.8%) | $158,534 |
| 5-Person Families | 136 (9.3%) | $250,001 |
| 6-Person Families | 0 (0.0%) | $0 |
| 7+ Person Families | 83 (5.7%) | $0 |
| Total | 1,463 (100.0%) | $204,277 |
Family Income by Number of Earners in North Sea
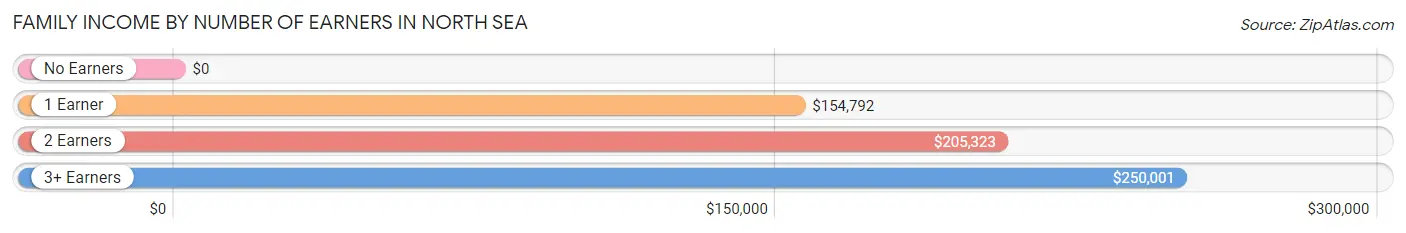
| Number of Earners | # Families | Median Income |
| No Earners | 129 (8.8%) | $0 |
| 1 Earner | 446 (30.5%) | $154,792 |
| 2 Earners | 616 (42.1%) | $205,323 |
| 3+ Earners | 272 (18.6%) | $250,001 |
| Total | 1,463 (100.0%) | $204,277 |
Household Income in North Sea
Household Income Brackets in North Sea
With 905 households falling in the category, the $200,000+ income range is the most frequent in North Sea, accounting for 41.4% of all households. In contrast, only 26 households (1.2%) fall into the $10,000 to $14,999 income bracket, making it the least populous group.
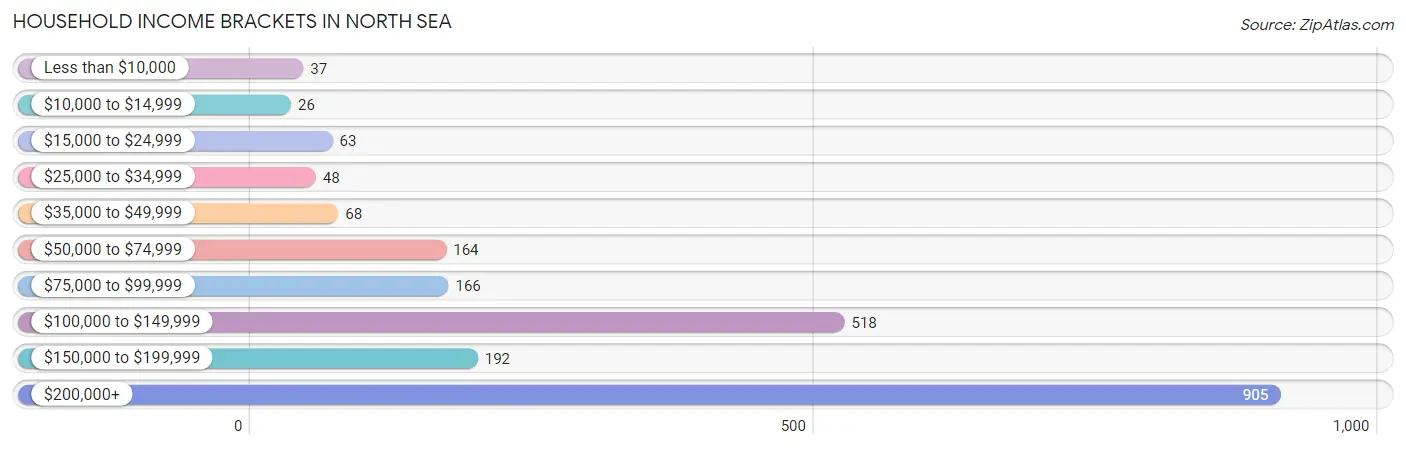
| Income Bracket | # Households | % Households |
| Less than $10,000 | 37 | 1.7% |
| $10,000 to $14,999 | 26 | 1.2% |
| $15,000 to $24,999 | 63 | 2.9% |
| $25,000 to $34,999 | 48 | 2.2% |
| $35,000 to $49,999 | 68 | 3.1% |
| $50,000 to $74,999 | 164 | 7.5% |
| $75,000 to $99,999 | 166 | 7.6% |
| $100,000 to $149,999 | 518 | 23.7% |
| $150,000 to $199,999 | 192 | 8.8% |
| $200,000+ | 905 | 41.4% |
Household Income by Householder Age in North Sea
The median household income in North Sea is $150,833, with the highest median household income of $250,001 found in the 45 to 64 years age bracket for the primary householder. A total of 857 households (39.2%) fall into this category.
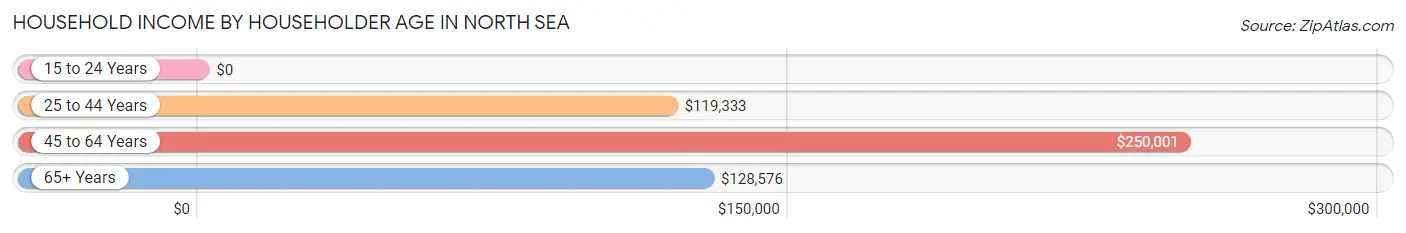
| Income Bracket | # Households | Median Income |
| 15 to 24 Years | 0 (0.0%) | $0 |
| 25 to 44 Years | 330 (15.1%) | $119,333 |
| 45 to 64 Years | 857 (39.2%) | $250,001 |
| 65+ Years | 999 (45.7%) | $128,576 |
| Total | 2,186 (100.0%) | $150,833 |
Poverty in North Sea
Income Below Poverty by Sex and Age in North Sea
With 4.2% poverty level for males and 1.7% for females among the residents of North Sea, 55 to 64 year old males and 18 to 24 year old females are the most vulnerable to poverty, with 52 males (13.0%) and 8 females (3.3%) in their respective age groups living below the poverty level.
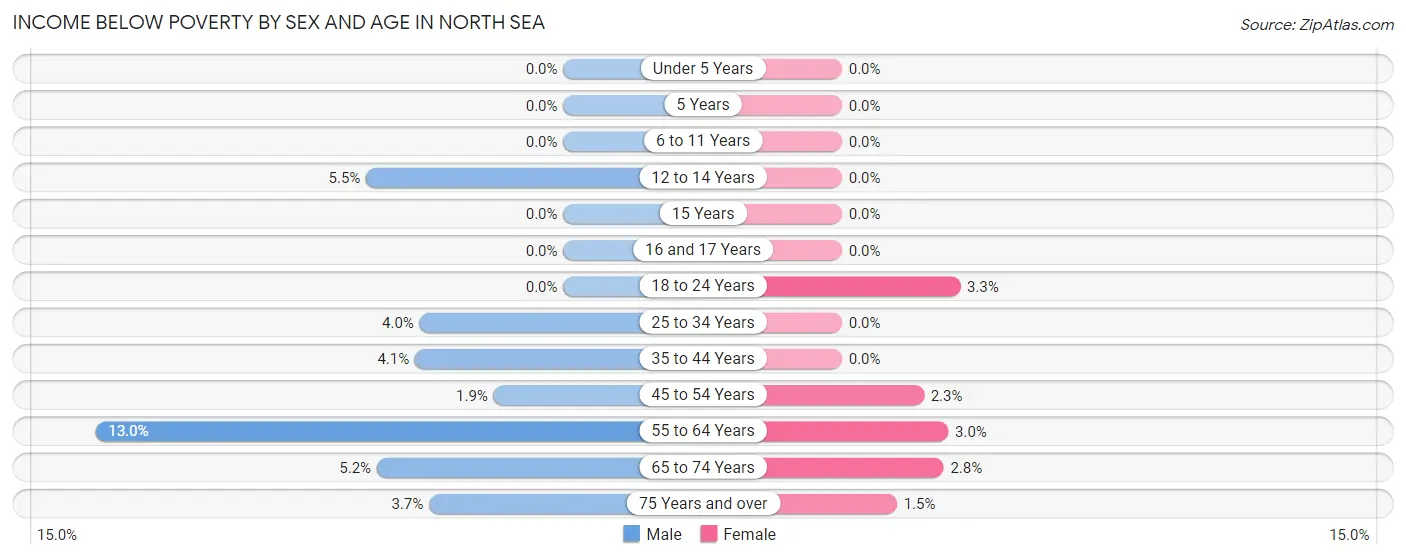
| Age Bracket | Male | Female |
| Under 5 Years | 0 (0.0%) | 0 (0.0%) |
| 5 Years | 0 (0.0%) | 0 (0.0%) |
| 6 to 11 Years | 0 (0.0%) | 0 (0.0%) |
| 12 to 14 Years | 10 (5.5%) | 0 (0.0%) |
| 15 Years | 0 (0.0%) | 0 (0.0%) |
| 16 and 17 Years | 0 (0.0%) | 0 (0.0%) |
| 18 to 24 Years | 0 (0.0%) | 8 (3.3%) |
| 25 to 34 Years | 13 (4.0%) | 0 (0.0%) |
| 35 to 44 Years | 17 (4.1%) | 0 (0.0%) |
| 45 to 54 Years | 12 (1.9%) | 10 (2.3%) |
| 55 to 64 Years | 52 (13.0%) | 9 (3.0%) |
| 65 to 74 Years | 23 (5.2%) | 18 (2.8%) |
| 75 Years and over | 8 (3.7%) | 4 (1.5%) |
| Total | 135 (4.2%) | 49 (1.7%) |
Income Above Poverty by Sex and Age in North Sea
According to the poverty statistics in North Sea, males aged under 5 years and females aged under 5 years are the age groups that are most secure financially, with 100.0% of males and 100.0% of females in these age groups living above the poverty line.
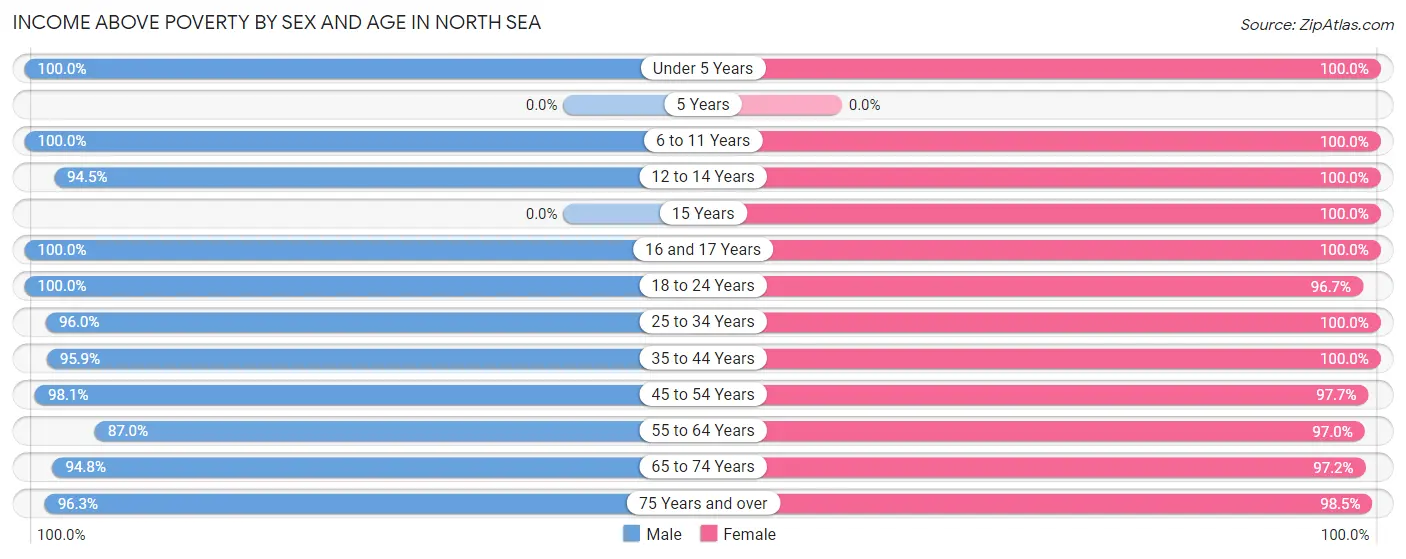
| Age Bracket | Male | Female |
| Under 5 Years | 184 (100.0%) | 105 (100.0%) |
| 5 Years | 0 (0.0%) | 0 (0.0%) |
| 6 to 11 Years | 245 (100.0%) | 148 (100.0%) |
| 12 to 14 Years | 172 (94.5%) | 38 (100.0%) |
| 15 Years | 0 (0.0%) | 56 (100.0%) |
| 16 and 17 Years | 40 (100.0%) | 11 (100.0%) |
| 18 to 24 Years | 179 (100.0%) | 235 (96.7%) |
| 25 to 34 Years | 312 (96.0%) | 239 (100.0%) |
| 35 to 44 Years | 395 (95.9%) | 334 (100.0%) |
| 45 to 54 Years | 606 (98.1%) | 429 (97.7%) |
| 55 to 64 Years | 347 (87.0%) | 295 (97.0%) |
| 65 to 74 Years | 420 (94.8%) | 617 (97.2%) |
| 75 Years and over | 206 (96.3%) | 257 (98.5%) |
| Total | 3,106 (95.8%) | 2,764 (98.3%) |
Income Below Poverty Among Married-Couple Families in North Sea
The poverty statistics for married-couple families in North Sea show that 0.7% or 8 of the total 1,154 families live below the poverty line. Families with no children have the highest poverty rate of 1.2%, comprising of 8 families. On the other hand, families with 1 or 2 children have the lowest poverty rate of 0.0%, which includes 0 families.
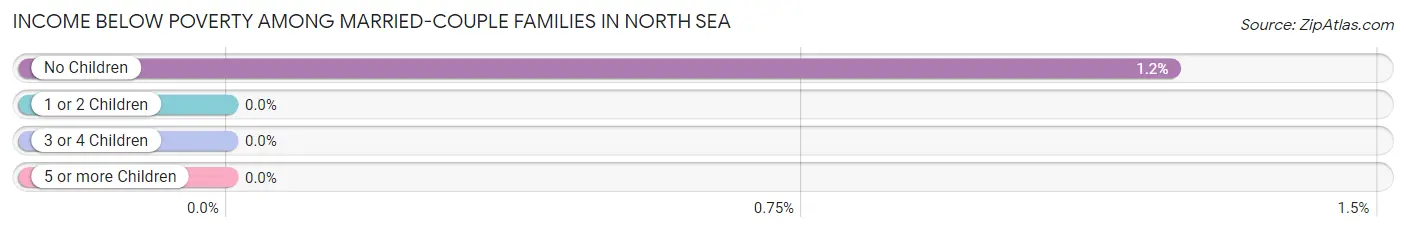
| Children | Above Poverty | Below Poverty |
| No Children | 640 (98.8%) | 8 (1.2%) |
| 1 or 2 Children | 464 (100.0%) | 0 (0.0%) |
| 3 or 4 Children | 42 (100.0%) | 0 (0.0%) |
| 5 or more Children | 0 (0.0%) | 0 (0.0%) |
| Total | 1,146 (99.3%) | 8 (0.7%) |
Income Below Poverty Among Single-Parent Households in North Sea
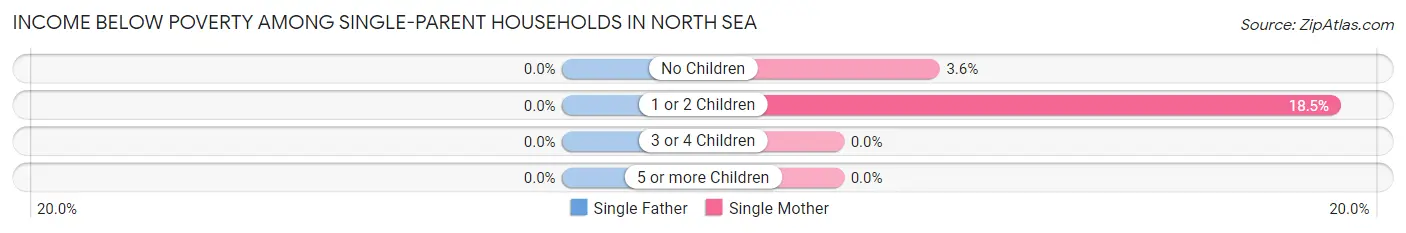
| Children | Single Father | Single Mother |
| No Children | 0 (0.0%) | 5 (3.6%) |
| 1 or 2 Children | 0 (0.0%) | 10 (18.5%) |
| 3 or 4 Children | 0 (0.0%) | 0 (0.0%) |
| 5 or more Children | 0 (0.0%) | 0 (0.0%) |
| Total | 0 (0.0%) | 15 (7.4%) |
Income Below Poverty Among Married-Couple vs Single-Parent Households in North Sea
The poverty data for North Sea shows that 8 of the married-couple family households (0.7%) and 15 of the single-parent households (4.9%) are living below the poverty level. Within the married-couple family households, those with no children have the highest poverty rate, with 8 households (1.2%) falling below the poverty line. Among the single-parent households, those with 1 or 2 children have the highest poverty rate, with 10 household (14.5%) living below poverty.
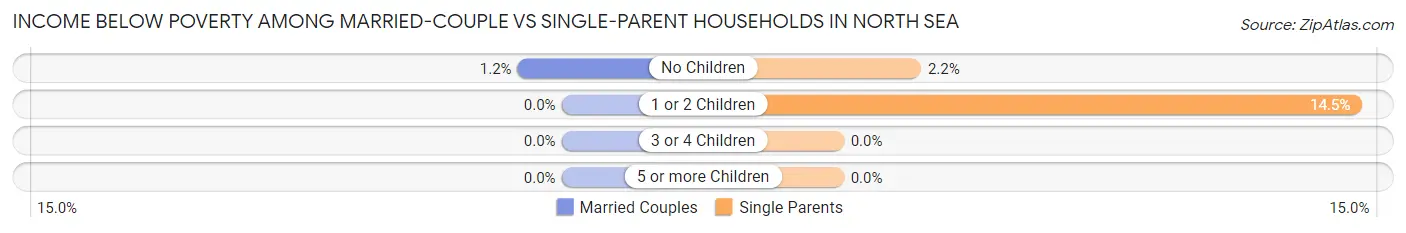
| Children | Married-Couple Families | Single-Parent Households |
| No Children | 8 (1.2%) | 5 (2.2%) |
| 1 or 2 Children | 0 (0.0%) | 10 (14.5%) |
| 3 or 4 Children | 0 (0.0%) | 0 (0.0%) |
| 5 or more Children | 0 (0.0%) | 0 (0.0%) |
| Total | 8 (0.7%) | 15 (4.9%) |
Race in North Sea
The most populous races in North Sea are White / Caucasian (4,119 | 68.0%), Hispanic or Latino (1,007 | 16.6%), and Black / African American (898 | 14.8%).
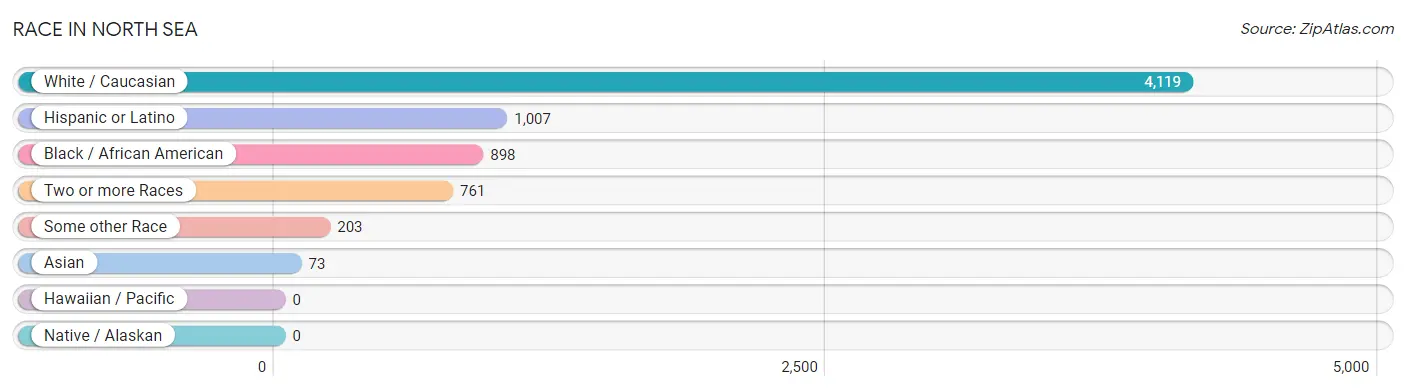
| Race | # Population | % Population |
| Asian | 73 | 1.2% |
| Black / African American | 898 | 14.8% |
| Hawaiian / Pacific | 0 | 0.0% |
| Hispanic or Latino | 1,007 | 16.6% |
| Native / Alaskan | 0 | 0.0% |
| White / Caucasian | 4,119 | 68.0% |
| Two or more Races | 761 | 12.6% |
| Some other Race | 203 | 3.4% |
| Total | 6,054 | 100.0% |
Ancestry in North Sea
The most populous ancestries reported in North Sea are Irish (1,065 | 17.6%), Italian (621 | 10.3%), English (483 | 8.0%), Mexican (338 | 5.6%), and German (323 | 5.3%), together accounting for 46.7% of all North Sea residents.
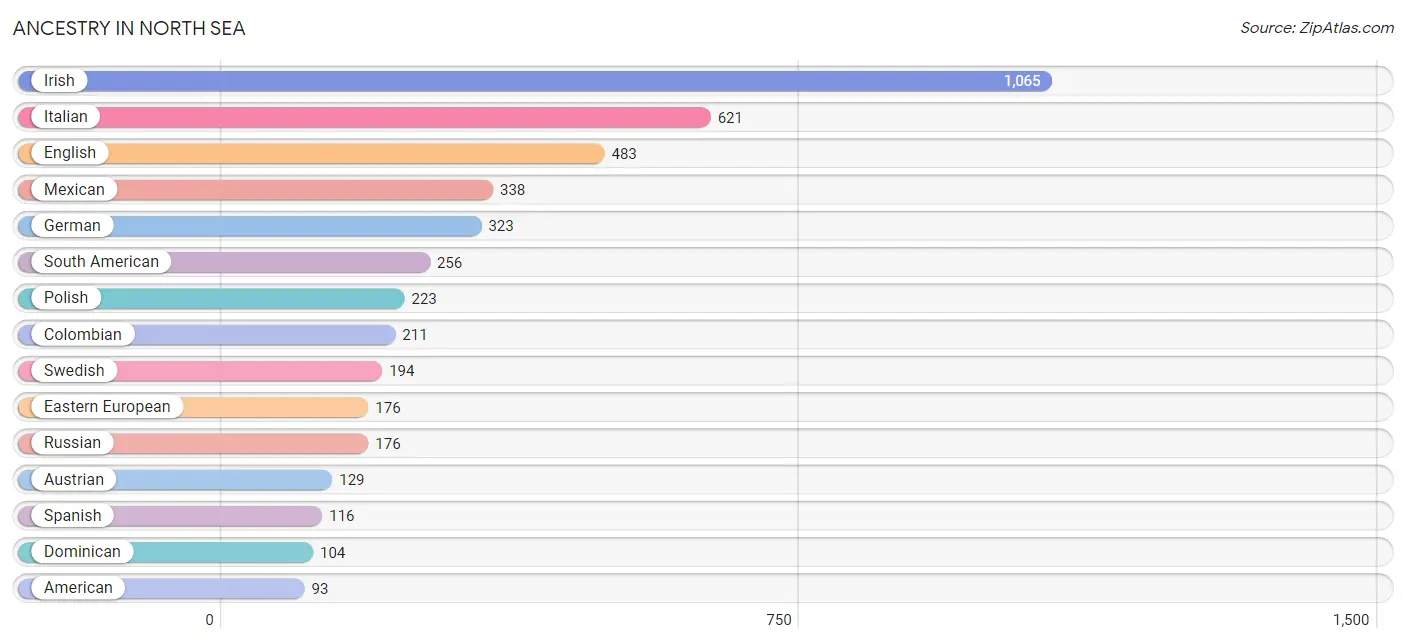
| Ancestry | # Population | % Population |
| American | 93 | 1.5% |
| Arab | 45 | 0.7% |
| Armenian | 22 | 0.4% |
| Austrian | 129 | 2.1% |
| Basque | 26 | 0.4% |
| Belgian | 9 | 0.2% |
| Brazilian | 37 | 0.6% |
| British | 22 | 0.4% |
| Canadian | 10 | 0.2% |
| Central American | 58 | 1.0% |
| Colombian | 211 | 3.5% |
| Croatian | 9 | 0.2% |
| Cuban | 53 | 0.9% |
| Danish | 24 | 0.4% |
| Dominican | 104 | 1.7% |
| Dutch | 13 | 0.2% |
| Eastern European | 176 | 2.9% |
| English | 483 | 8.0% |
| European | 37 | 0.6% |
| French | 56 | 0.9% |
| French American Indian | 57 | 0.9% |
| French Canadian | 23 | 0.4% |
| German | 323 | 5.3% |
| Greek | 4 | 0.1% |
| Guatemalan | 45 | 0.7% |
| Haitian | 17 | 0.3% |
| Honduran | 13 | 0.2% |
| Hungarian | 26 | 0.4% |
| Irish | 1,065 | 17.6% |
| Italian | 621 | 10.3% |
| Korean | 21 | 0.4% |
| Lithuanian | 15 | 0.3% |
| Mexican | 338 | 5.6% |
| Moroccan | 45 | 0.7% |
| Norwegian | 10 | 0.2% |
| Polish | 223 | 3.7% |
| Portuguese | 6 | 0.1% |
| Puerto Rican | 82 | 1.3% |
| Romanian | 19 | 0.3% |
| Russian | 176 | 2.9% |
| Samoan | 14 | 0.2% |
| Scotch-Irish | 9 | 0.2% |
| South American | 256 | 4.2% |
| Spanish | 116 | 1.9% |
| Sri Lankan | 52 | 0.9% |
| Swedish | 194 | 3.2% |
| Venezuelan | 45 | 0.7% |
| Welsh | 10 | 0.2% |
| Yugoslavian | 12 | 0.2% | View All 49 Rows |
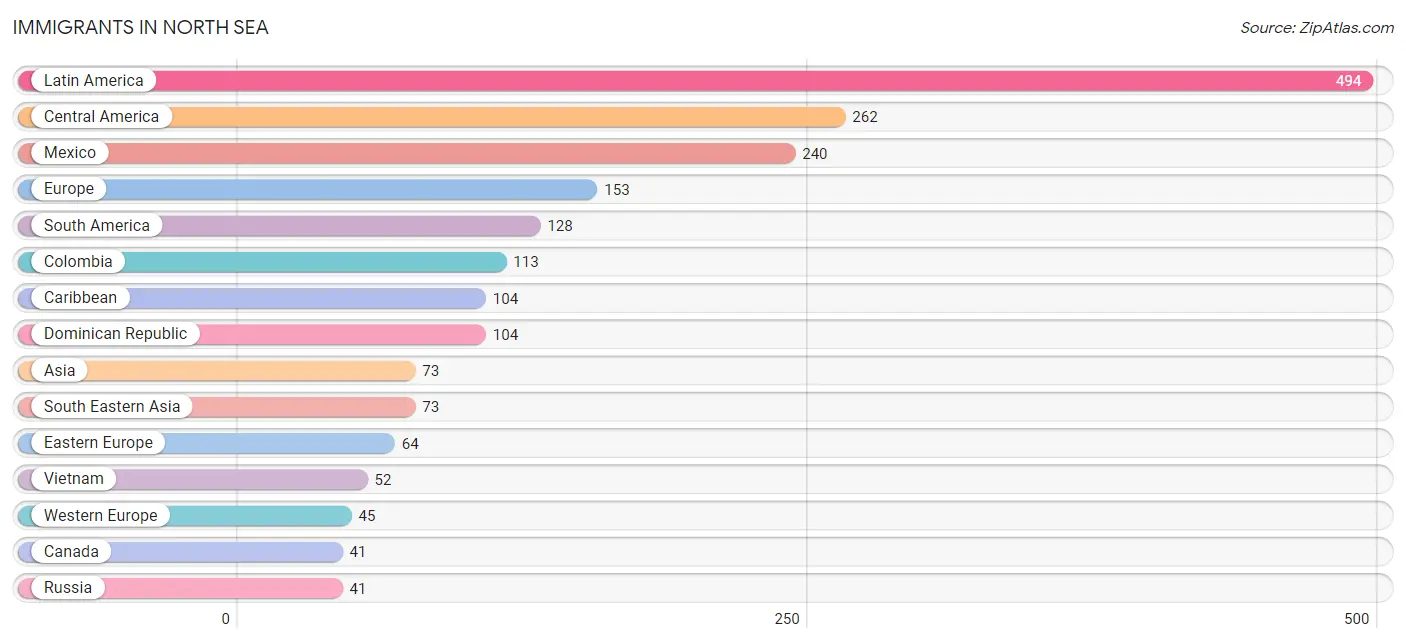
Immigrants in North Sea
The most numerous immigrant groups reported in North Sea came from Latin America (494 | 8.2%), Central America (262 | 4.3%), Mexico (240 | 4.0%), Europe (153 | 2.5%), and South America (128 | 2.1%), together accounting for 21.1% of all North Sea residents.
| Immigration Origin | # Population | % Population |
| Africa | 26 | 0.4% |
| Asia | 73 | 1.2% |
| Austria | 22 | 0.4% |
| Brazil | 15 | 0.3% |
| Canada | 41 | 0.7% |
| Caribbean | 104 | 1.7% |
| Central America | 262 | 4.3% |
| Colombia | 113 | 1.9% |
| Dominican Republic | 104 | 1.7% |
| Eastern Europe | 64 | 1.1% |
| Europe | 153 | 2.5% |
| France | 12 | 0.2% |
| Germany | 11 | 0.2% |
| Guatemala | 22 | 0.4% |
| Ireland | 22 | 0.4% |
| Italy | 11 | 0.2% |
| Latin America | 494 | 8.2% |
| Mexico | 240 | 4.0% |
| Morocco | 26 | 0.4% |
| Northern Africa | 26 | 0.4% |
| Northern Europe | 33 | 0.5% |
| Philippines | 21 | 0.4% |
| Russia | 41 | 0.7% |
| South America | 128 | 2.1% |
| South Eastern Asia | 73 | 1.2% |
| Southern Europe | 11 | 0.2% |
| Sweden | 11 | 0.2% |
| Vietnam | 52 | 0.9% |
| Western Europe | 45 | 0.7% | View All 29 Rows |
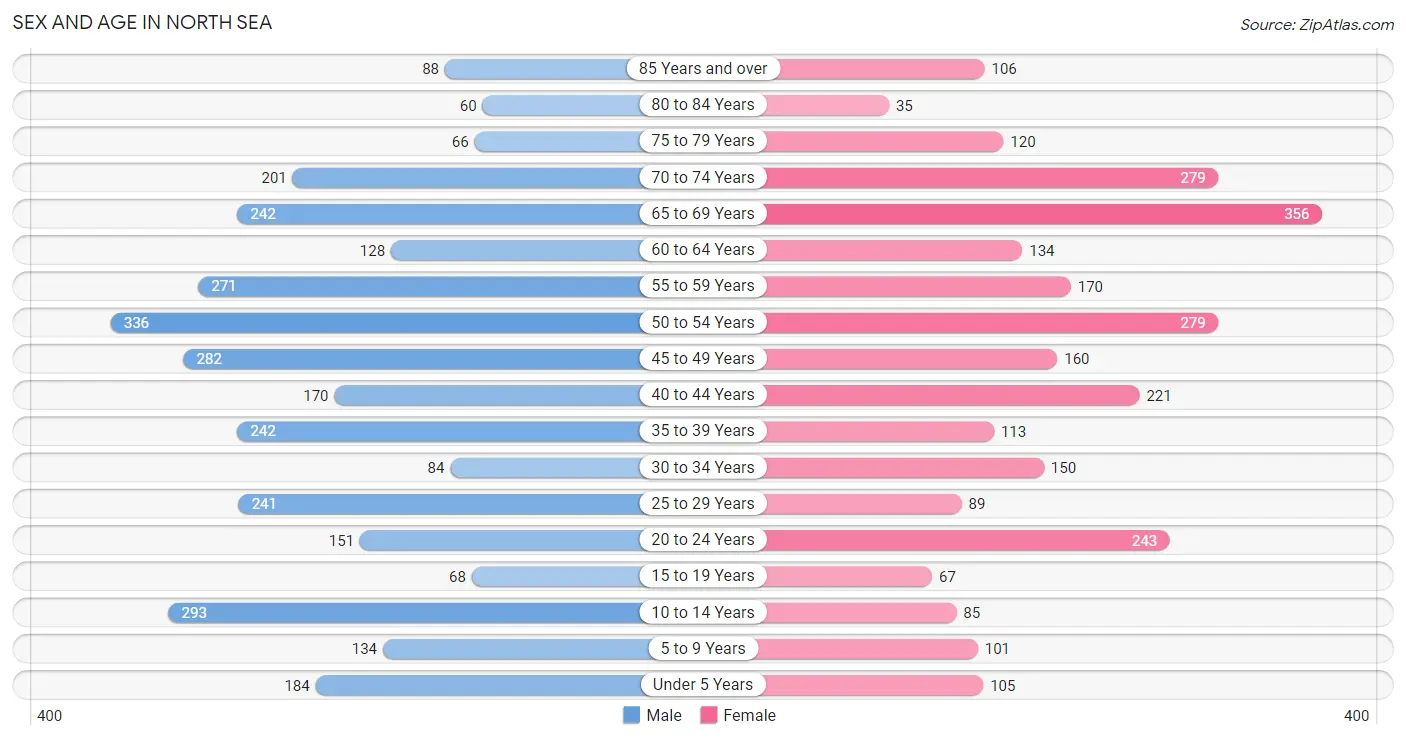
Sex and Age in North Sea
Sex and Age in North Sea
The most populous age groups in North Sea are 50 to 54 Years (336 | 10.4%) for men and 65 to 69 Years (356 | 12.7%) for women.
| Age Bracket | Male | Female |
| Under 5 Years | 184 (5.7%) | 105 (3.7%) |
| 5 to 9 Years | 134 (4.1%) | 101 (3.6%) |
| 10 to 14 Years | 293 (9.0%) | 85 (3.0%) |
| 15 to 19 Years | 68 (2.1%) | 67 (2.4%) |
| 20 to 24 Years | 151 (4.7%) | 243 (8.6%) |
| 25 to 29 Years | 241 (7.4%) | 89 (3.2%) |
| 30 to 34 Years | 84 (2.6%) | 150 (5.3%) |
| 35 to 39 Years | 242 (7.5%) | 113 (4.0%) |
| 40 to 44 Years | 170 (5.2%) | 221 (7.9%) |
| 45 to 49 Years | 282 (8.7%) | 160 (5.7%) |
| 50 to 54 Years | 336 (10.4%) | 279 (9.9%) |
| 55 to 59 Years | 271 (8.4%) | 170 (6.0%) |
| 60 to 64 Years | 128 (4.0%) | 134 (4.8%) |
| 65 to 69 Years | 242 (7.5%) | 356 (12.7%) |
| 70 to 74 Years | 201 (6.2%) | 279 (9.9%) |
| 75 to 79 Years | 66 (2.0%) | 120 (4.3%) |
| 80 to 84 Years | 60 (1.8%) | 35 (1.2%) |
| 85 Years and over | 88 (2.7%) | 106 (3.8%) |
| Total | 3,241 (100.0%) | 2,813 (100.0%) |
Families and Households in North Sea
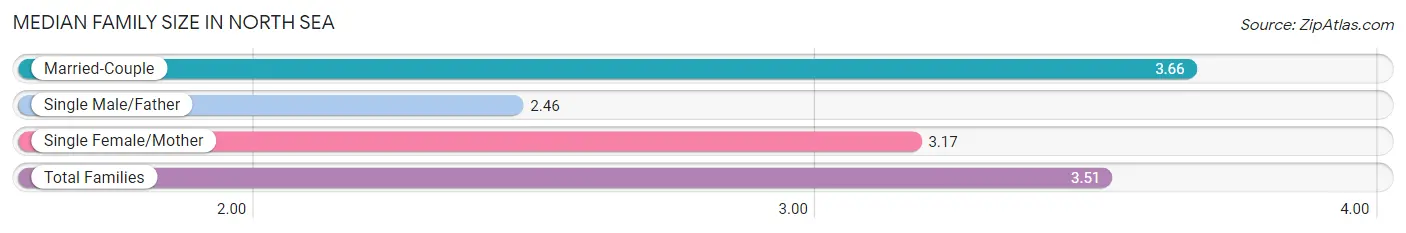
Median Family Size in North Sea
The median family size in North Sea is 3.51 persons per family, with married-couple families (1,154 | 78.9%) accounting for the largest median family size of 3.66 persons per family. On the other hand, single male/father families (106 | 7.2%) represent the smallest median family size with 2.46 persons per family.
| Family Type | # Families | Family Size |
| Married-Couple | 1,154 (78.9%) | 3.66 |
| Single Male/Father | 106 (7.2%) | 2.46 |
| Single Female/Mother | 203 (13.9%) | 3.17 |
| Total Families | 1,463 (100.0%) | 3.51 |
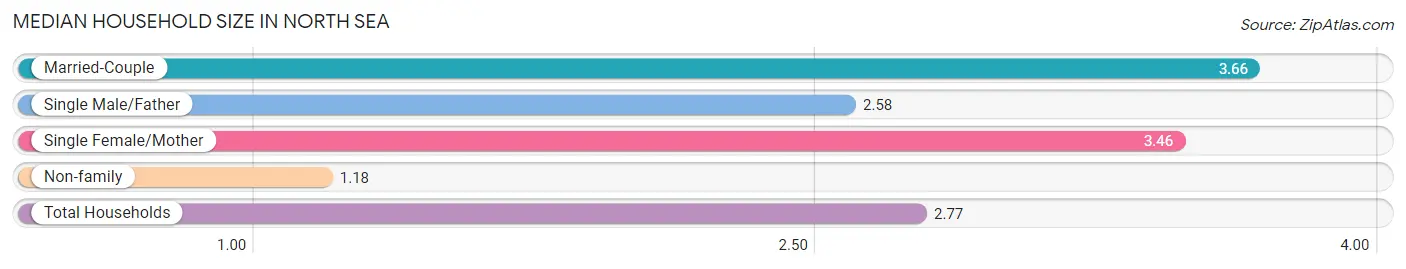
Median Household Size in North Sea
The median household size in North Sea is 2.77 persons per household, with married-couple households (1,154 | 52.8%) accounting for the largest median household size of 3.66 persons per household. non-family households (723 | 33.1%) represent the smallest median household size with 1.18 persons per household.
| Household Type | # Households | Household Size |
| Married-Couple | 1,154 (52.8%) | 3.66 |
| Single Male/Father | 106 (4.9%) | 2.58 |
| Single Female/Mother | 203 (9.3%) | 3.46 |
| Non-family | 723 (33.1%) | 1.18 |
| Total Households | 2,186 (100.0%) | 2.77 |
Household Size by Marriage Status in North Sea
Out of a total of 2,186 households in North Sea, 1,463 (66.9%) are family households, while 723 (33.1%) are nonfamily households. The most numerous type of family households are 2-person households, comprising 663, and the most common type of nonfamily households are 1-person households, comprising 623.
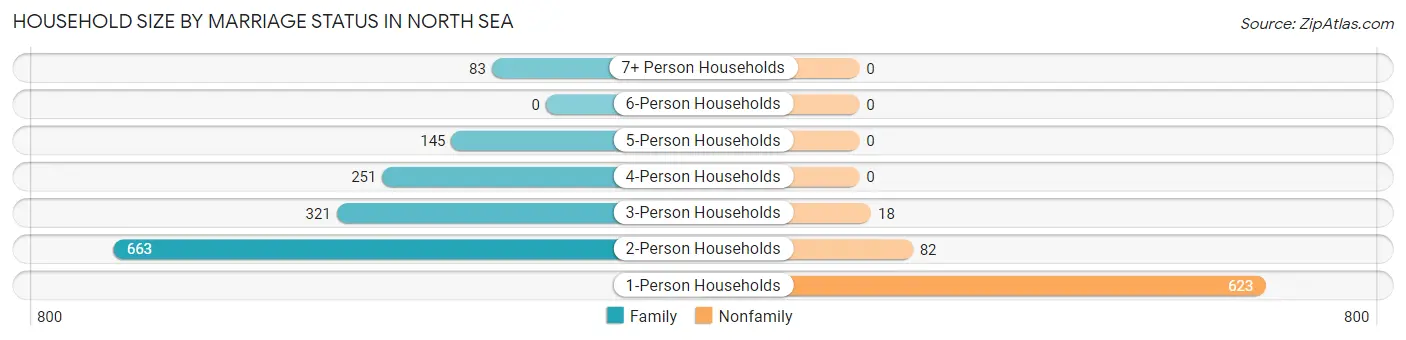
| Household Size | Family Households | Nonfamily Households |
| 1-Person Households | - | 623 (28.5%) |
| 2-Person Households | 663 (30.3%) | 82 (3.7%) |
| 3-Person Households | 321 (14.7%) | 18 (0.8%) |
| 4-Person Households | 251 (11.5%) | 0 (0.0%) |
| 5-Person Households | 145 (6.6%) | 0 (0.0%) |
| 6-Person Households | 0 (0.0%) | 0 (0.0%) |
| 7+ Person Households | 83 (3.8%) | 0 (0.0%) |
| Total | 1,463 (66.9%) | 723 (33.1%) |
Female Fertility in North Sea
Fertility by Age in North Sea
Average fertility rate in North Sea is 194.0 births per 1,000 women. Women in the age bracket of 20 to 34 years have the highest fertility rate with 409.0 births per 1,000 women. Women in the age bracket of 20 to 34 years acount for 94.7% of all women with births.
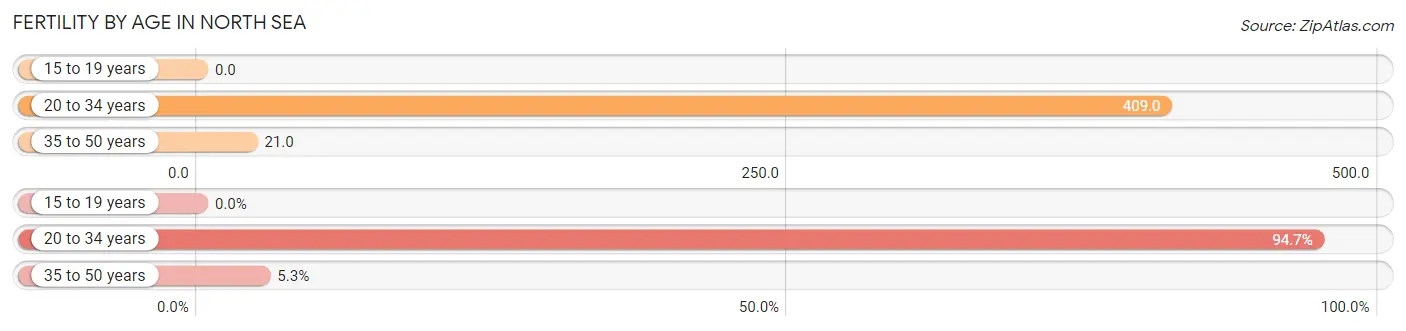
| Age Bracket | Women with Births | Births / 1,000 Women |
| 15 to 19 years | 0 (0.0%) | 0.0 |
| 20 to 34 years | 197 (94.7%) | 409.0 |
| 35 to 50 years | 11 (5.3%) | 21.0 |
| Total | 208 (100.0%) | 194.0 |
Fertility by Age by Marriage Status in North Sea
10.6% of women with births (208) in North Sea are married. The highest percentage of unmarried women with births falls into 20 to 34 years age bracket with 94.4% of them unmarried at the time of birth, while the lowest percentage of unmarried women with births belong to 35 to 50 years age bracket with 0.0% of them unmarried.
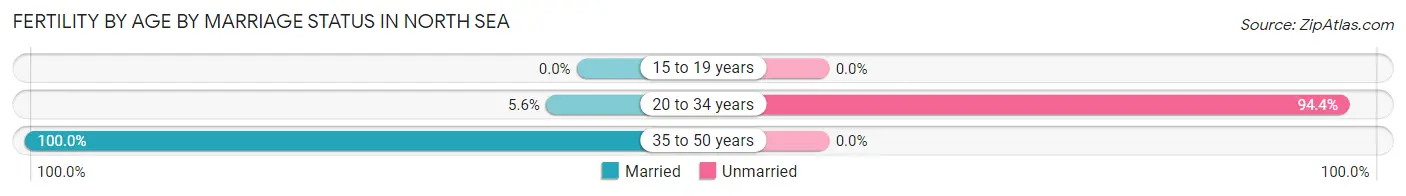
| Age Bracket | Married | Unmarried |
| 15 to 19 years | 0 (0.0%) | 0 (0.0%) |
| 20 to 34 years | 11 (5.6%) | 186 (94.4%) |
| 35 to 50 years | 11 (100.0%) | 0 (0.0%) |
| Total | 22 (10.6%) | 186 (89.4%) |
Fertility by Education in North Sea
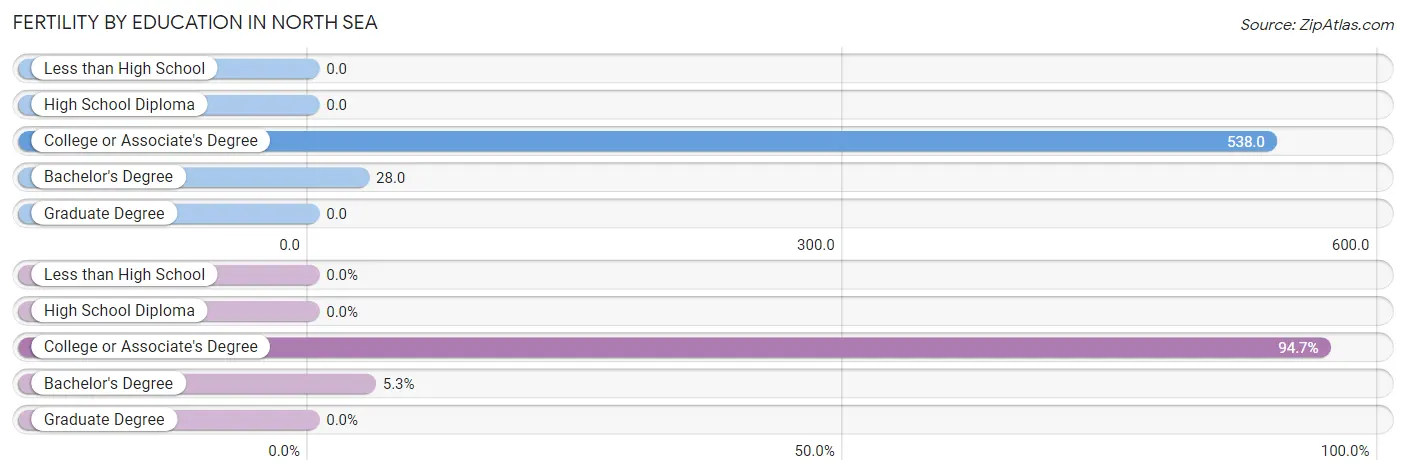
| Educational Attainment | Women with Births | Births / 1,000 Women |
| Less than High School | 0 (0.0%) | 0.0 |
| High School Diploma | 0 (0.0%) | 0.0 |
| College or Associate's Degree | 197 (94.7%) | 538.0 |
| Bachelor's Degree | 11 (5.3%) | 28.0 |
| Graduate Degree | 0 (0.0%) | 0.0 |
| Total | 208 (100.0%) | 194.0 |
Fertility by Education by Marriage Status in North Sea
89.4% of women with births in North Sea are unmarried. Women with the educational attainment of bachelor's degree are most likely to be married with 100.0% of them married at childbirth, while women with the educational attainment of college or associate's degree are least likely to be married with 94.4% of them unmarried at childbirth.
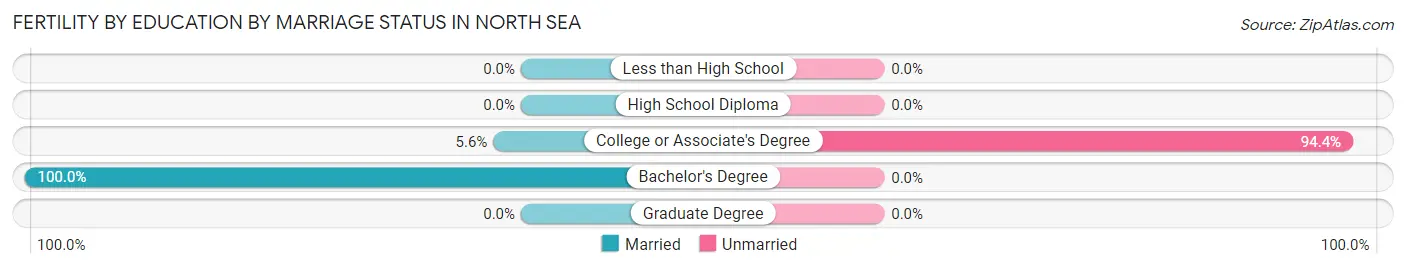
| Educational Attainment | Married | Unmarried |
| Less than High School | 0 (0.0%) | 0 (0.0%) |
| High School Diploma | 0 (0.0%) | 0 (0.0%) |
| College or Associate's Degree | 11 (5.6%) | 186 (94.4%) |
| Bachelor's Degree | 11 (100.0%) | 0 (0.0%) |
| Graduate Degree | 0 (0.0%) | 0 (0.0%) |
| Total | 22 (10.6%) | 186 (89.4%) |
Employment Characteristics in North Sea
Employment by Class of Employer in North Sea
Among the 3,467 employed individuals in North Sea, private company employees (1,874 | 54.0%), local government employees (657 | 19.0%), and self-employed (not incorporated) (387 | 11.2%) make up the most common classes of employment.
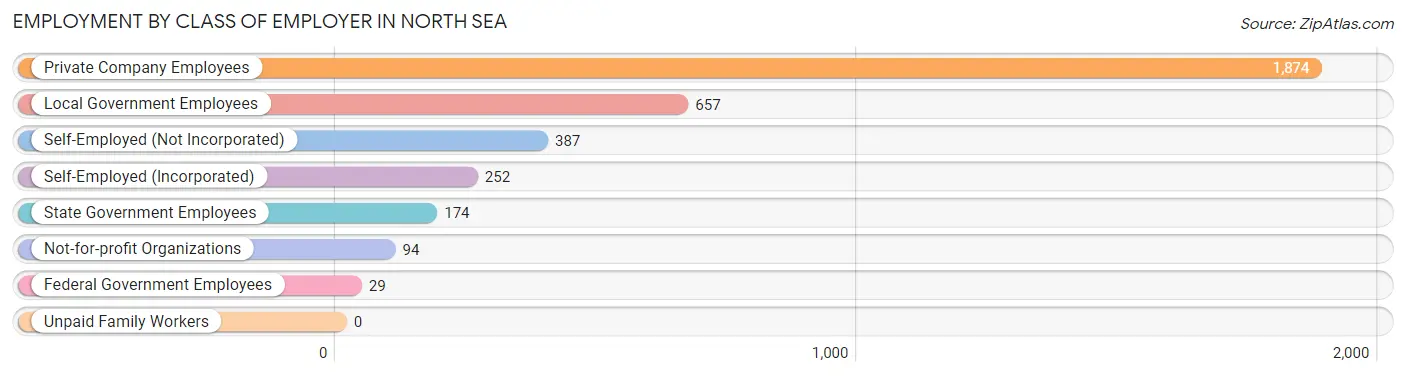
| Employer Class | # Employees | % Employees |
| Private Company Employees | 1,874 | 54.0% |
| Self-Employed (Incorporated) | 252 | 7.3% |
| Self-Employed (Not Incorporated) | 387 | 11.2% |
| Not-for-profit Organizations | 94 | 2.7% |
| Local Government Employees | 657 | 19.0% |
| State Government Employees | 174 | 5.0% |
| Federal Government Employees | 29 | 0.8% |
| Unpaid Family Workers | 0 | 0.0% |
| Total | 3,467 | 100.0% |
Employment Status by Age in North Sea
According to the labor force statistics for North Sea, out of the total population over 16 years of age (5,096), 69.8% or 3,557 individuals are in the labor force, with 0.9% or 32 of them unemployed. The age group with the highest labor force participation rate is 20 to 24 years, with 93.1% or 367 individuals in the labor force. Within the labor force, the 60 to 64 years age range has the highest percentage of unemployed individuals, with 5.4% or 10 of them being unemployed.
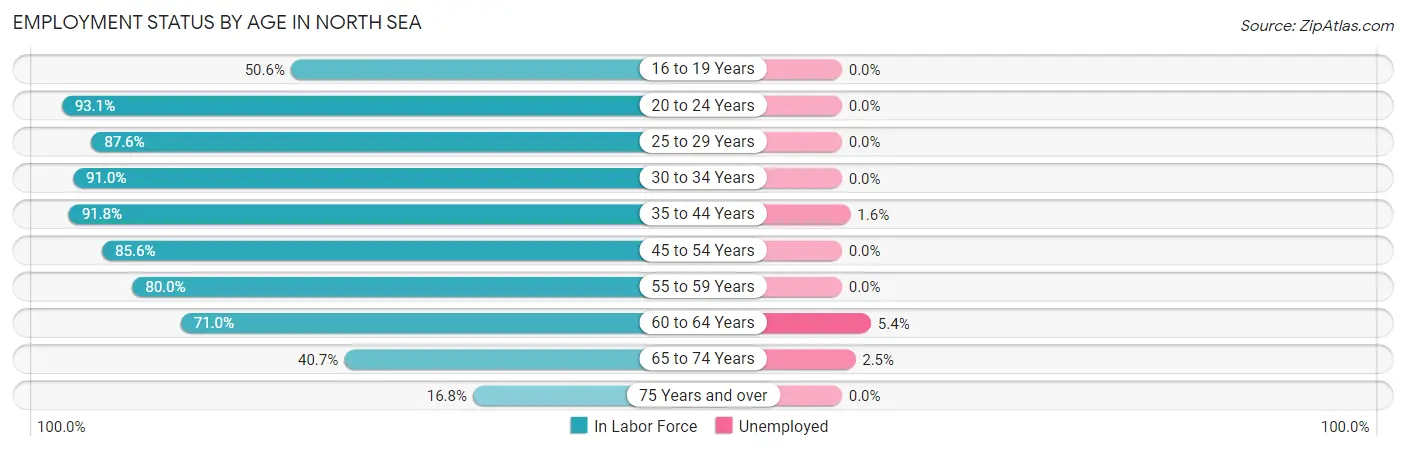
| Age Bracket | In Labor Force | Unemployed |
| 16 to 19 Years | 40 (50.6%) | 0 (0.0%) |
| 20 to 24 Years | 367 (93.1%) | 0 (0.0%) |
| 25 to 29 Years | 289 (87.6%) | 0 (0.0%) |
| 30 to 34 Years | 213 (91.0%) | 0 (0.0%) |
| 35 to 44 Years | 685 (91.8%) | 11 (1.6%) |
| 45 to 54 Years | 905 (85.6%) | 0 (0.0%) |
| 55 to 59 Years | 353 (80.0%) | 0 (0.0%) |
| 60 to 64 Years | 186 (71.0%) | 10 (5.4%) |
| 65 to 74 Years | 439 (40.7%) | 11 (2.5%) |
| 75 Years and over | 80 (16.8%) | 0 (0.0%) |
| Total | 3,557 (69.8%) | 32 (0.9%) |
Employment Status by Educational Attainment in North Sea
According to labor force statistics for North Sea, 85.7% of individuals (2,631) out of the total population between 25 and 64 years of age (3,070) are in the labor force, with 0.8% or 21 of them being unemployed. The group with the highest labor force participation rate are those with the educational attainment of less than high school, with 100.0% or 46 individuals in the labor force. Within the labor force, individuals with less than high school education have the highest percentage of unemployment, with 21.7% or 10 of them being unemployed.
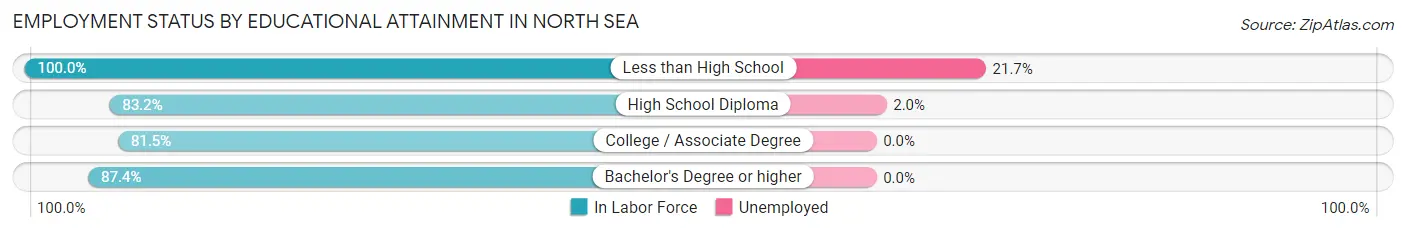
| Educational Attainment | In Labor Force | Unemployed |
| Less than High School | 46 (100.0%) | 10 (21.7%) |
| High School Diploma | 539 (83.2%) | 13 (2.0%) |
| College / Associate Degree | 423 (81.5%) | 0 (0.0%) |
| Bachelor's Degree or higher | 1,623 (87.4%) | 0 (0.0%) |
| Total | 2,631 (85.7%) | 25 (0.8%) |
Employment Occupations by Sex in North Sea
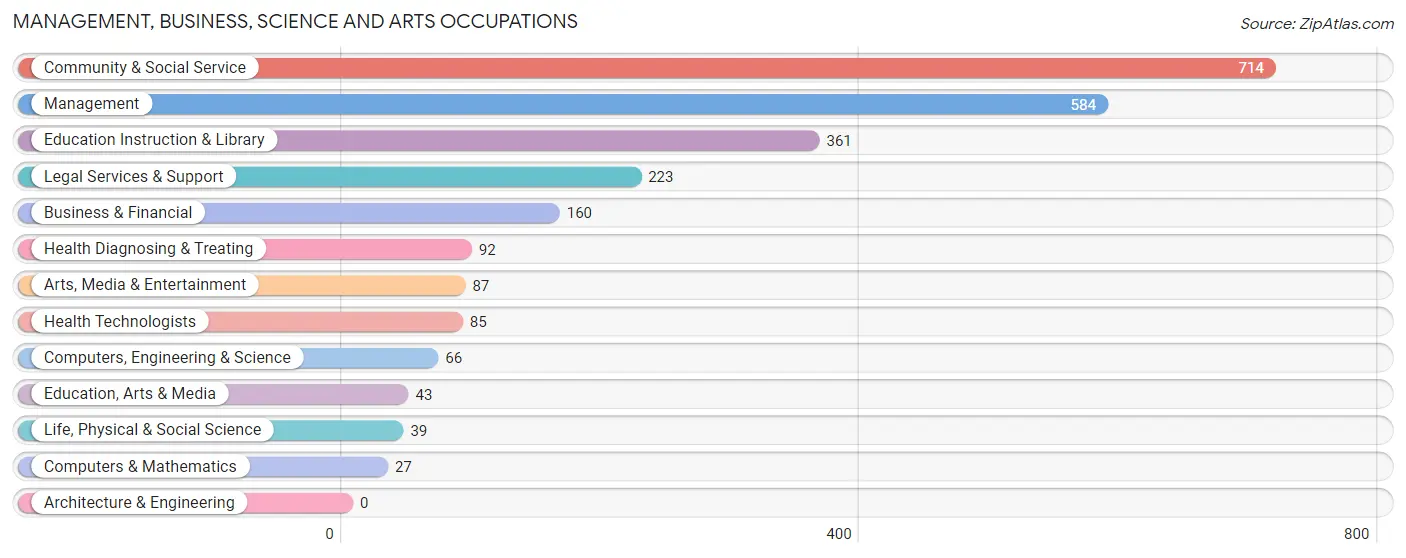
Management, Business, Science and Arts Occupations
The most common Management, Business, Science and Arts occupations in North Sea are Community & Social Service (714 | 20.3%), Management (584 | 16.6%), Education Instruction & Library (361 | 10.2%), Legal Services & Support (223 | 6.3%), and Business & Financial (160 | 4.5%).
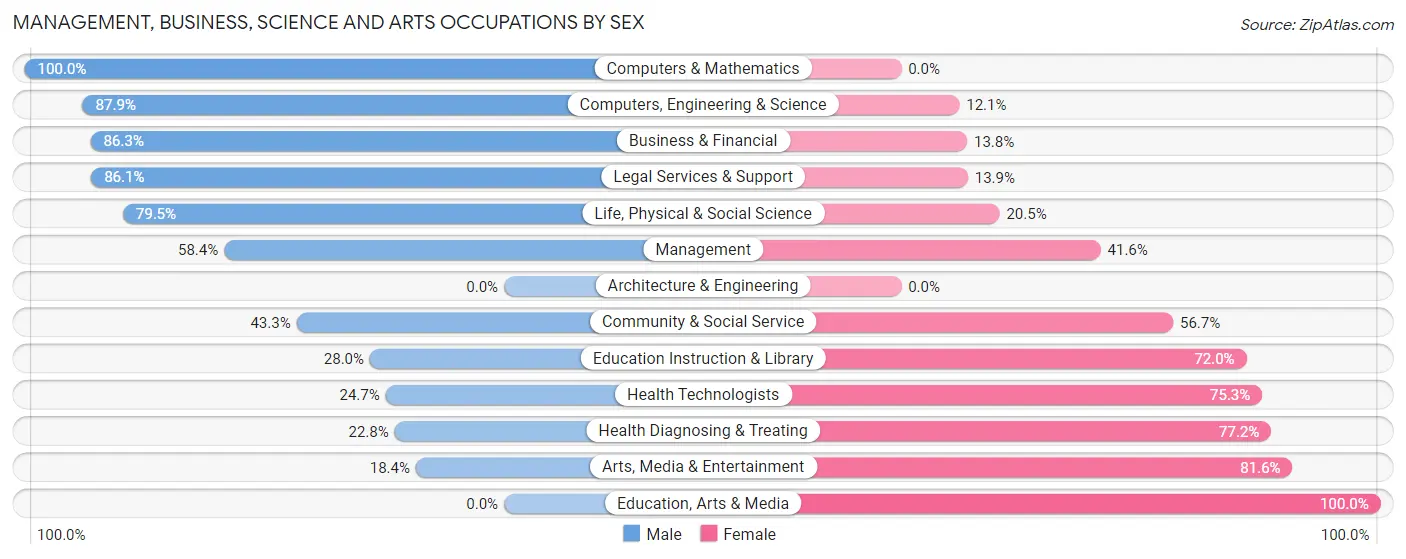
Management, Business, Science and Arts Occupations by Sex
Within the Management, Business, Science and Arts occupations in North Sea, the most male-oriented occupations are Computers & Mathematics (100.0%), Computers, Engineering & Science (87.9%), and Business & Financial (86.3%), while the most female-oriented occupations are Education, Arts & Media (100.0%), Arts, Media & Entertainment (81.6%), and Health Diagnosing & Treating (77.2%).
| Occupation | Male | Female |
| Management | 341 (58.4%) | 243 (41.6%) |
| Business & Financial | 138 (86.3%) | 22 (13.8%) |
| Computers, Engineering & Science | 58 (87.9%) | 8 (12.1%) |
| Computers & Mathematics | 27 (100.0%) | 0 (0.0%) |
| Architecture & Engineering | 0 (0.0%) | 0 (0.0%) |
| Life, Physical & Social Science | 31 (79.5%) | 8 (20.5%) |
| Community & Social Service | 309 (43.3%) | 405 (56.7%) |
| Education, Arts & Media | 0 (0.0%) | 43 (100.0%) |
| Legal Services & Support | 192 (86.1%) | 31 (13.9%) |
| Education Instruction & Library | 101 (28.0%) | 260 (72.0%) |
| Arts, Media & Entertainment | 16 (18.4%) | 71 (81.6%) |
| Health Diagnosing & Treating | 21 (22.8%) | 71 (77.2%) |
| Health Technologists | 21 (24.7%) | 64 (75.3%) |
| Total (Category) | 867 (53.6%) | 749 (46.4%) |
| Total (Overall) | 2,049 (58.1%) | 1,476 (41.9%) |
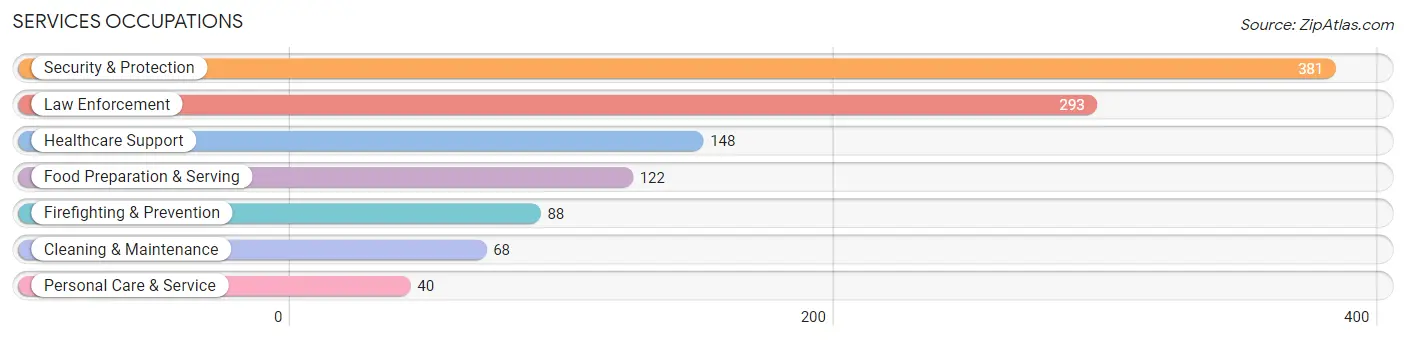
Services Occupations
The most common Services occupations in North Sea are Security & Protection (381 | 10.8%), Law Enforcement (293 | 8.3%), Healthcare Support (148 | 4.2%), Food Preparation & Serving (122 | 3.5%), and Firefighting & Prevention (88 | 2.5%).
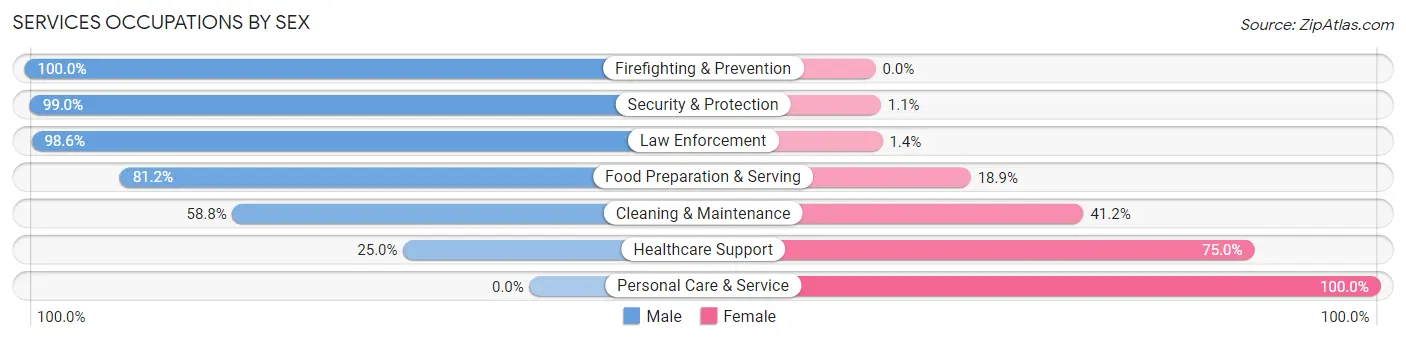
Services Occupations by Sex
Within the Services occupations in North Sea, the most male-oriented occupations are Firefighting & Prevention (100.0%), Security & Protection (99.0%), and Law Enforcement (98.6%), while the most female-oriented occupations are Personal Care & Service (100.0%), Healthcare Support (75.0%), and Cleaning & Maintenance (41.2%).
| Occupation | Male | Female |
| Healthcare Support | 37 (25.0%) | 111 (75.0%) |
| Security & Protection | 377 (99.0%) | 4 (1.1%) |
| Firefighting & Prevention | 88 (100.0%) | 0 (0.0%) |
| Law Enforcement | 289 (98.6%) | 4 (1.4%) |
| Food Preparation & Serving | 99 (81.1%) | 23 (18.9%) |
| Cleaning & Maintenance | 40 (58.8%) | 28 (41.2%) |
| Personal Care & Service | 0 (0.0%) | 40 (100.0%) |
| Total (Category) | 553 (72.9%) | 206 (27.1%) |
| Total (Overall) | 2,049 (58.1%) | 1,476 (41.9%) |
Sales and Office Occupations
The most common Sales and Office occupations in North Sea are Office & Administration (341 | 9.7%), and Sales & Related (284 | 8.1%).

Sales and Office Occupations by Sex
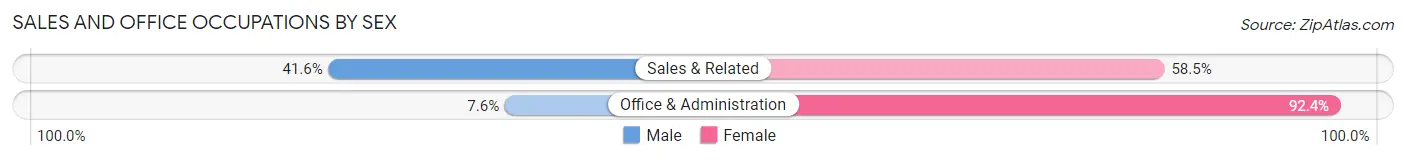
| Occupation | Male | Female |
| Sales & Related | 118 (41.5%) | 166 (58.5%) |
| Office & Administration | 26 (7.6%) | 315 (92.4%) |
| Total (Category) | 144 (23.0%) | 481 (77.0%) |
| Total (Overall) | 2,049 (58.1%) | 1,476 (41.9%) |
Natural Resources, Construction and Maintenance Occupations
The most common Natural Resources, Construction and Maintenance occupations in North Sea are Construction & Extraction (254 | 7.2%), and Installation, Maintenance & Repair (150 | 4.3%).
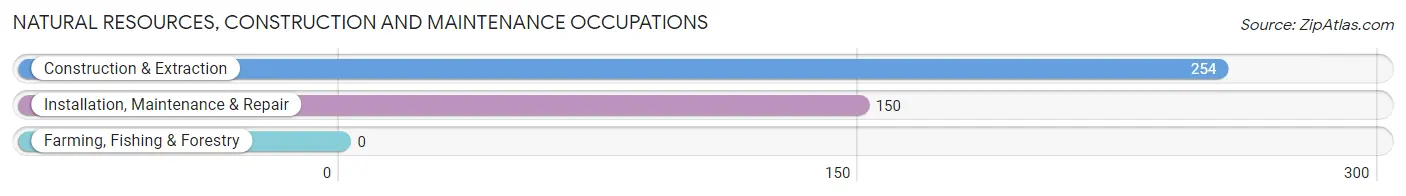
Natural Resources, Construction and Maintenance Occupations by Sex
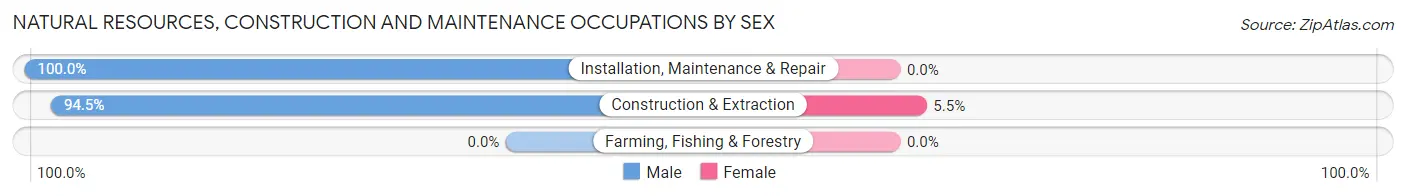
| Occupation | Male | Female |
| Farming, Fishing & Forestry | 0 (0.0%) | 0 (0.0%) |
| Construction & Extraction | 240 (94.5%) | 14 (5.5%) |
| Installation, Maintenance & Repair | 150 (100.0%) | 0 (0.0%) |
| Total (Category) | 390 (96.5%) | 14 (3.5%) |
| Total (Overall) | 2,049 (58.1%) | 1,476 (41.9%) |
Production, Transportation and Moving Occupations
The most common Production, Transportation and Moving occupations in North Sea are Transportation (88 | 2.5%), and Material Moving (33 | 0.9%).
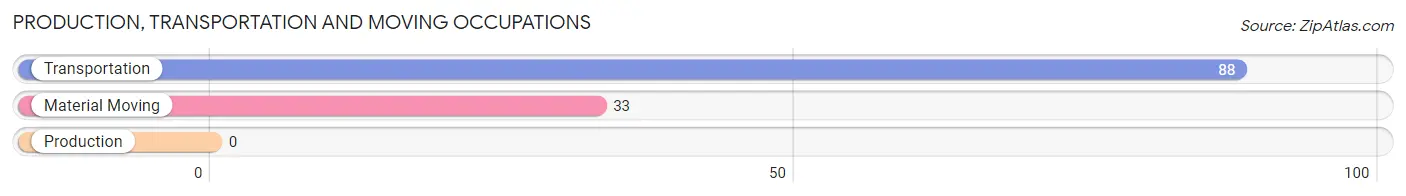
Production, Transportation and Moving Occupations by Sex
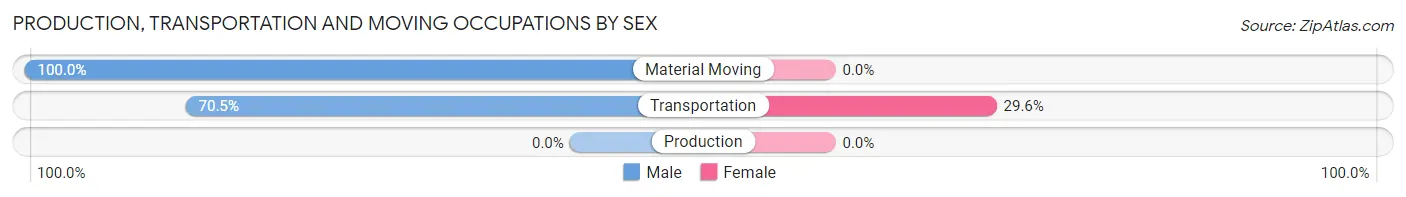
| Occupation | Male | Female |
| Production | 0 (0.0%) | 0 (0.0%) |
| Transportation | 62 (70.5%) | 26 (29.5%) |
| Material Moving | 33 (100.0%) | 0 (0.0%) |
| Total (Category) | 95 (78.5%) | 26 (21.5%) |
| Total (Overall) | 2,049 (58.1%) | 1,476 (41.9%) |
Employment Industries by Sex in North Sea
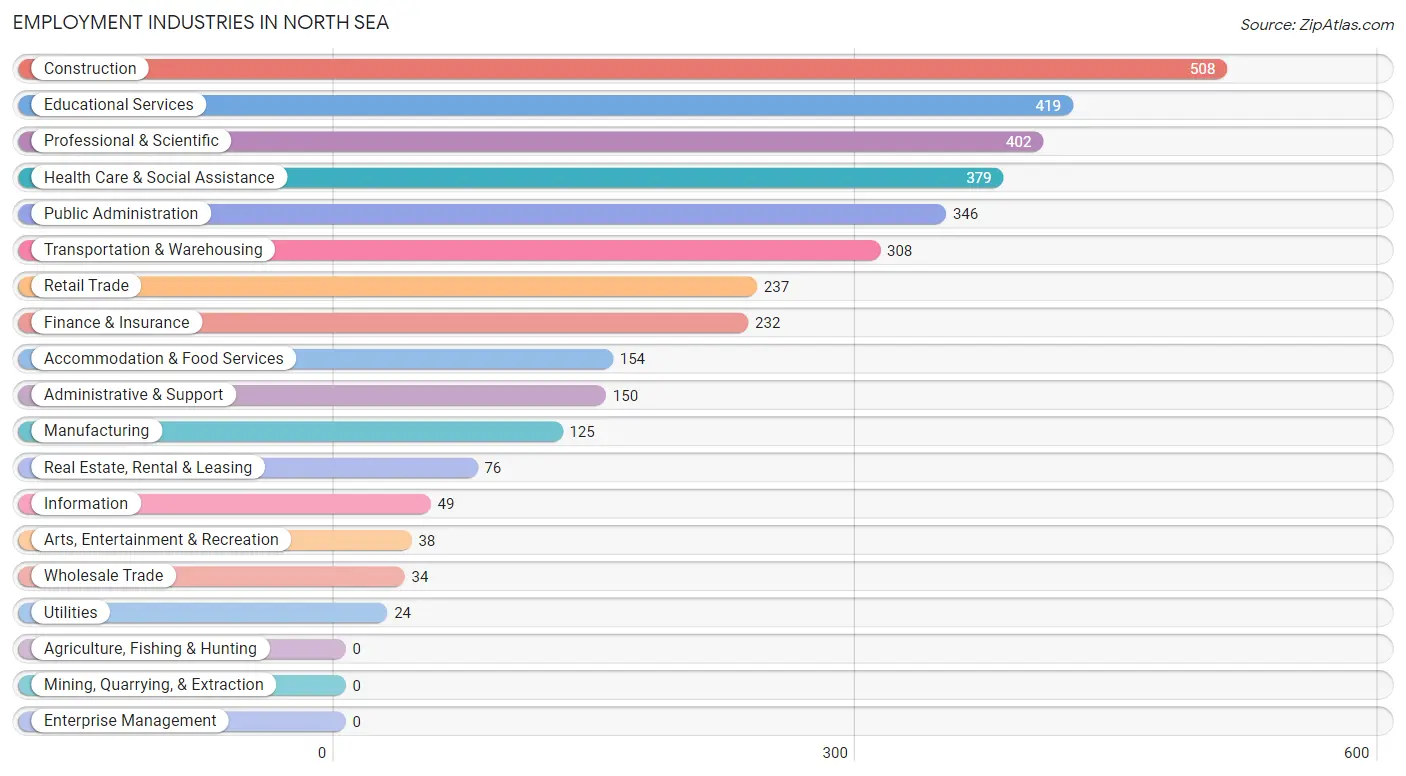
Employment Industries in North Sea
The major employment industries in North Sea include Construction (508 | 14.4%), Educational Services (419 | 11.9%), Professional & Scientific (402 | 11.4%), Health Care & Social Assistance (379 | 10.7%), and Public Administration (346 | 9.8%).
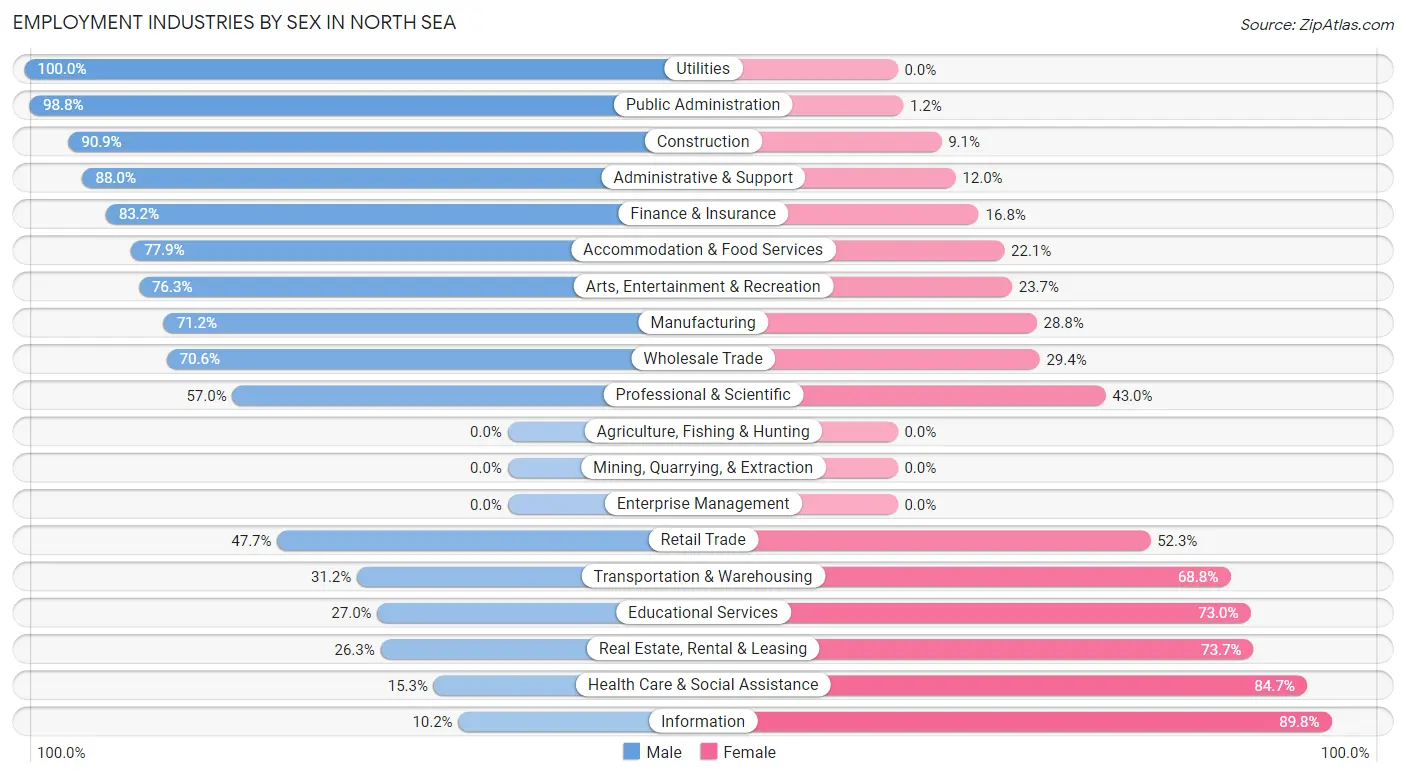
Employment Industries by Sex in North Sea
The North Sea industries that see more men than women are Utilities (100.0%), Public Administration (98.8%), and Construction (90.9%), whereas the industries that tend to have a higher number of women are Information (89.8%), Health Care & Social Assistance (84.7%), and Real Estate, Rental & Leasing (73.7%).
| Industry | Male | Female |
| Agriculture, Fishing & Hunting | 0 (0.0%) | 0 (0.0%) |
| Mining, Quarrying, & Extraction | 0 (0.0%) | 0 (0.0%) |
| Construction | 462 (90.9%) | 46 (9.1%) |
| Manufacturing | 89 (71.2%) | 36 (28.8%) |
| Wholesale Trade | 24 (70.6%) | 10 (29.4%) |
| Retail Trade | 113 (47.7%) | 124 (52.3%) |
| Transportation & Warehousing | 96 (31.2%) | 212 (68.8%) |
| Utilities | 24 (100.0%) | 0 (0.0%) |
| Information | 5 (10.2%) | 44 (89.8%) |
| Finance & Insurance | 193 (83.2%) | 39 (16.8%) |
| Real Estate, Rental & Leasing | 20 (26.3%) | 56 (73.7%) |
| Professional & Scientific | 229 (57.0%) | 173 (43.0%) |
| Enterprise Management | 0 (0.0%) | 0 (0.0%) |
| Administrative & Support | 132 (88.0%) | 18 (12.0%) |
| Educational Services | 113 (27.0%) | 306 (73.0%) |
| Health Care & Social Assistance | 58 (15.3%) | 321 (84.7%) |
| Arts, Entertainment & Recreation | 29 (76.3%) | 9 (23.7%) |
| Accommodation & Food Services | 120 (77.9%) | 34 (22.1%) |
| Public Administration | 342 (98.8%) | 4 (1.2%) |
| Total | 2,049 (58.1%) | 1,476 (41.9%) |
Education in North Sea
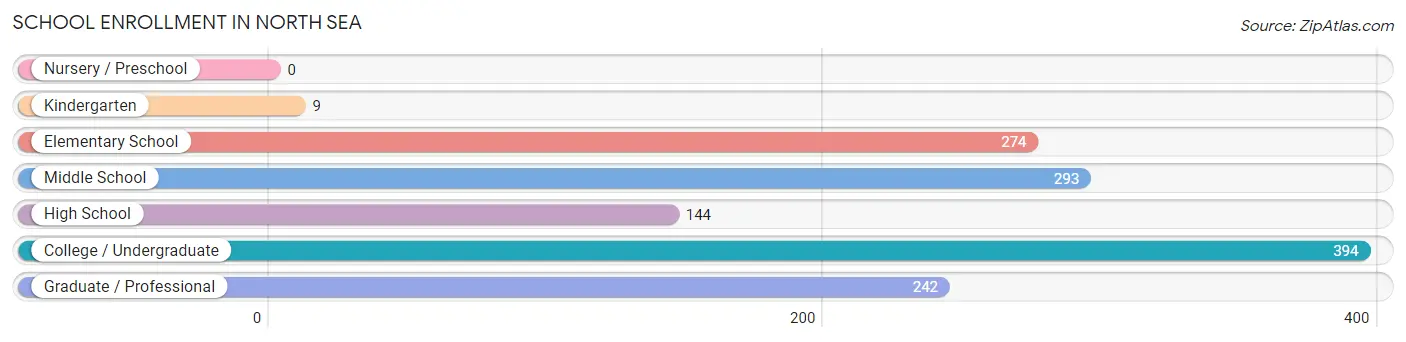
School Enrollment in North Sea
The most common levels of schooling among the 1,356 students in North Sea are college / undergraduate (394 | 29.1%), middle school (293 | 21.6%), and elementary school (274 | 20.2%).
| School Level | # Students | % Students |
| Nursery / Preschool | 0 | 0.0% |
| Kindergarten | 9 | 0.7% |
| Elementary School | 274 | 20.2% |
| Middle School | 293 | 21.6% |
| High School | 144 | 10.6% |
| College / Undergraduate | 394 | 29.1% |
| Graduate / Professional | 242 | 17.8% |
| Total | 1,356 | 100.0% |
School Enrollment by Age by Funding Source in North Sea
Out of a total of 1,356 students who are enrolled in schools in North Sea, 296 (21.8%) attend a private institution, while the remaining 1,060 (78.2%) are enrolled in public schools. The age group of 18 to 19 year olds has the highest likelihood of being enrolled in private schools, with 9 (100.0% in the age bracket) enrolled. Conversely, the age group of 25 to 34 year olds has the lowest likelihood of being enrolled in a private school, with 207 (100.0% in the age bracket) attending a public institution.
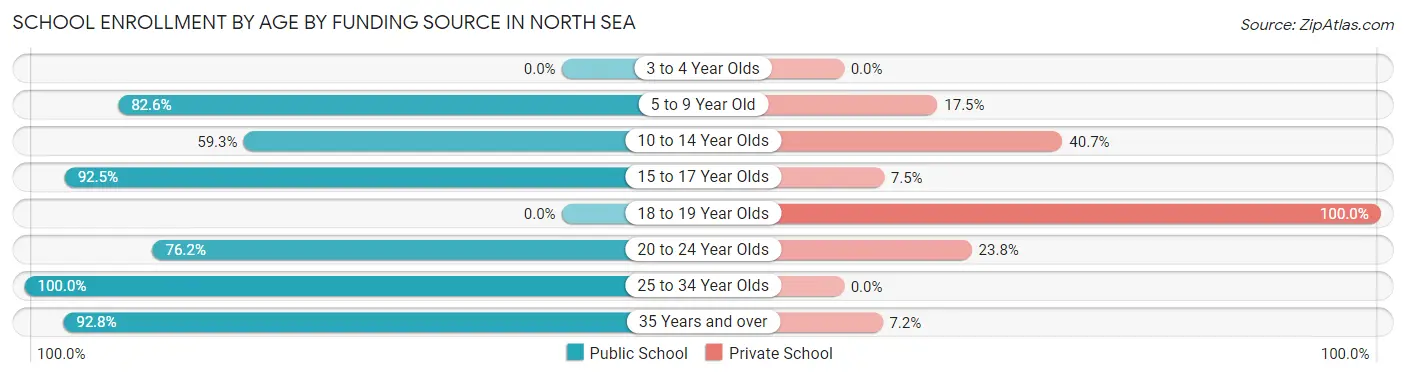
| Age Bracket | Public School | Private School |
| 3 to 4 Year Olds | 0 (0.0%) | 0 (0.0%) |
| 5 to 9 Year Old | 194 (82.6%) | 41 (17.4%) |
| 10 to 14 Year Olds | 224 (59.3%) | 154 (40.7%) |
| 15 to 17 Year Olds | 99 (92.5%) | 8 (7.5%) |
| 18 to 19 Year Olds | 0 (0.0%) | 9 (100.0%) |
| 20 to 24 Year Olds | 246 (76.2%) | 77 (23.8%) |
| 25 to 34 Year Olds | 207 (100.0%) | 0 (0.0%) |
| 35 Years and over | 90 (92.8%) | 7 (7.2%) |
| Total | 1,060 (78.2%) | 296 (21.8%) |
Educational Attainment by Field of Study in North Sea
Business (580 | 18.6%), science & technology (402 | 12.9%), education (373 | 12.0%), social sciences (368 | 11.8%), and psychology (314 | 10.1%) are the most common fields of study among 3,116 individuals in North Sea who have obtained a bachelor's degree or higher.
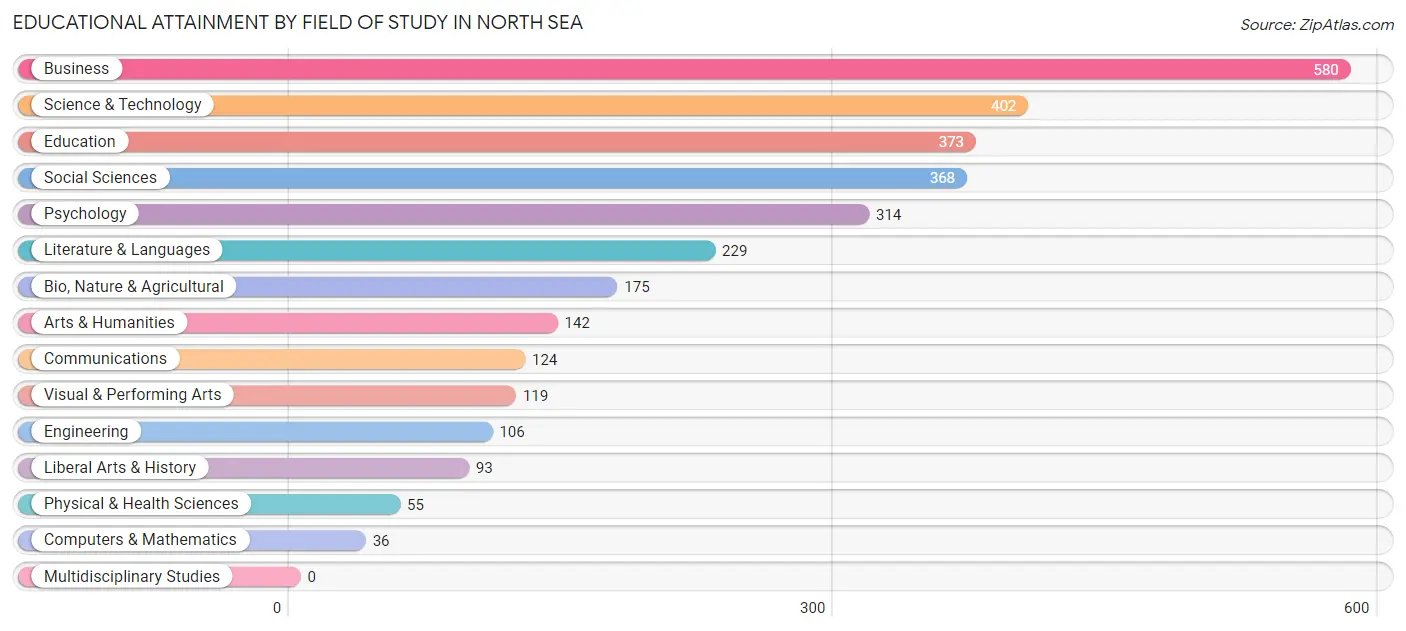
| Field of Study | # Graduates | % Graduates |
| Computers & Mathematics | 36 | 1.2% |
| Bio, Nature & Agricultural | 175 | 5.6% |
| Physical & Health Sciences | 55 | 1.8% |
| Psychology | 314 | 10.1% |
| Social Sciences | 368 | 11.8% |
| Engineering | 106 | 3.4% |
| Multidisciplinary Studies | 0 | 0.0% |
| Science & Technology | 402 | 12.9% |
| Business | 580 | 18.6% |
| Education | 373 | 12.0% |
| Literature & Languages | 229 | 7.3% |
| Liberal Arts & History | 93 | 3.0% |
| Visual & Performing Arts | 119 | 3.8% |
| Communications | 124 | 4.0% |
| Arts & Humanities | 142 | 4.6% |
| Total | 3,116 | 100.0% |
Transportation & Commute in North Sea
Vehicle Availability by Sex in North Sea
The most prevalent vehicle ownership categories in North Sea are males with 2 vehicles (950, accounting for 46.7%) and females with 2 vehicles (733, making up 66.3%).
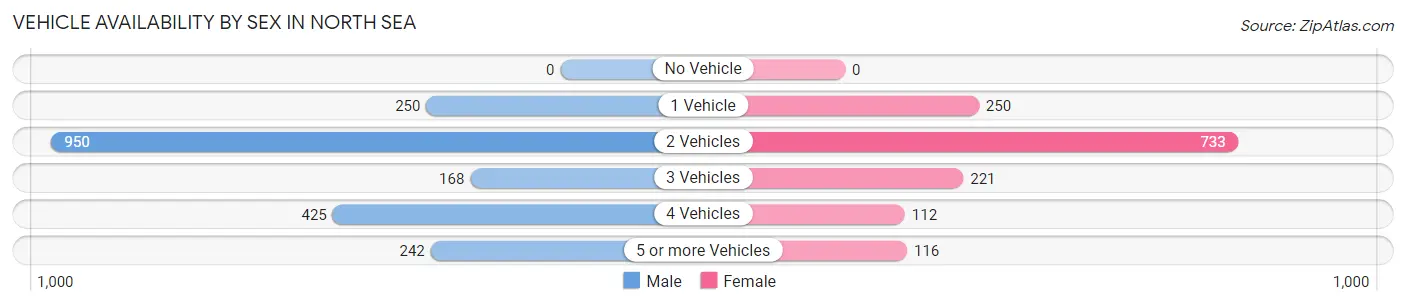
| Vehicles Available | Male | Female |
| No Vehicle | 0 (0.0%) | 0 (0.0%) |
| 1 Vehicle | 250 (12.3%) | 250 (17.5%) |
| 2 Vehicles | 950 (46.7%) | 733 (51.2%) |
| 3 Vehicles | 168 (8.3%) | 221 (15.4%) |
| 4 Vehicles | 425 (20.9%) | 112 (7.8%) |
| 5 or more Vehicles | 242 (11.9%) | 116 (8.1%) |
| Total | 2,035 (100.0%) | 1,432 (100.0%) |
Commute Time in North Sea
The most frequently occuring commute durations in North Sea are 30 to 34 minutes (649 commuters, 23.2%), 45 to 59 minutes (367 commuters, 13.1%), and 15 to 19 minutes (296 commuters, 10.6%).
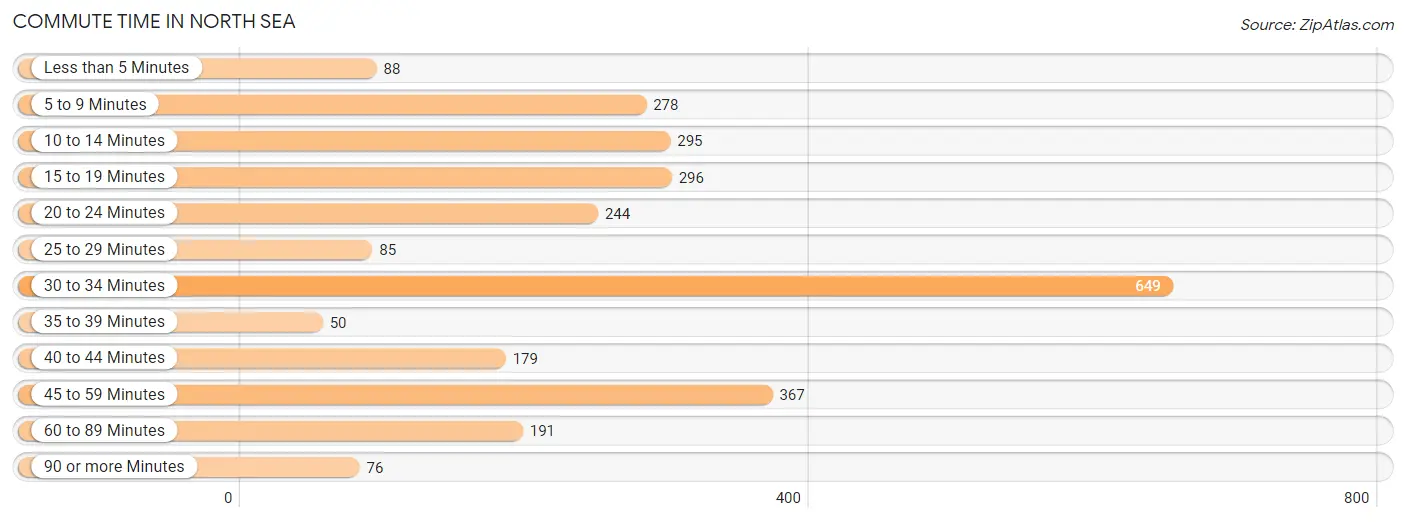
| Commute Time | # Commuters | % Commuters |
| Less than 5 Minutes | 88 | 3.2% |
| 5 to 9 Minutes | 278 | 9.9% |
| 10 to 14 Minutes | 295 | 10.5% |
| 15 to 19 Minutes | 296 | 10.6% |
| 20 to 24 Minutes | 244 | 8.7% |
| 25 to 29 Minutes | 85 | 3.0% |
| 30 to 34 Minutes | 649 | 23.2% |
| 35 to 39 Minutes | 50 | 1.8% |
| 40 to 44 Minutes | 179 | 6.4% |
| 45 to 59 Minutes | 367 | 13.1% |
| 60 to 89 Minutes | 191 | 6.8% |
| 90 or more Minutes | 76 | 2.7% |
Commute Time by Sex in North Sea
The most common commute times in North Sea are 45 to 59 minutes (326 commuters, 19.5%) for males and 30 to 34 minutes (362 commuters, 32.3%) for females.
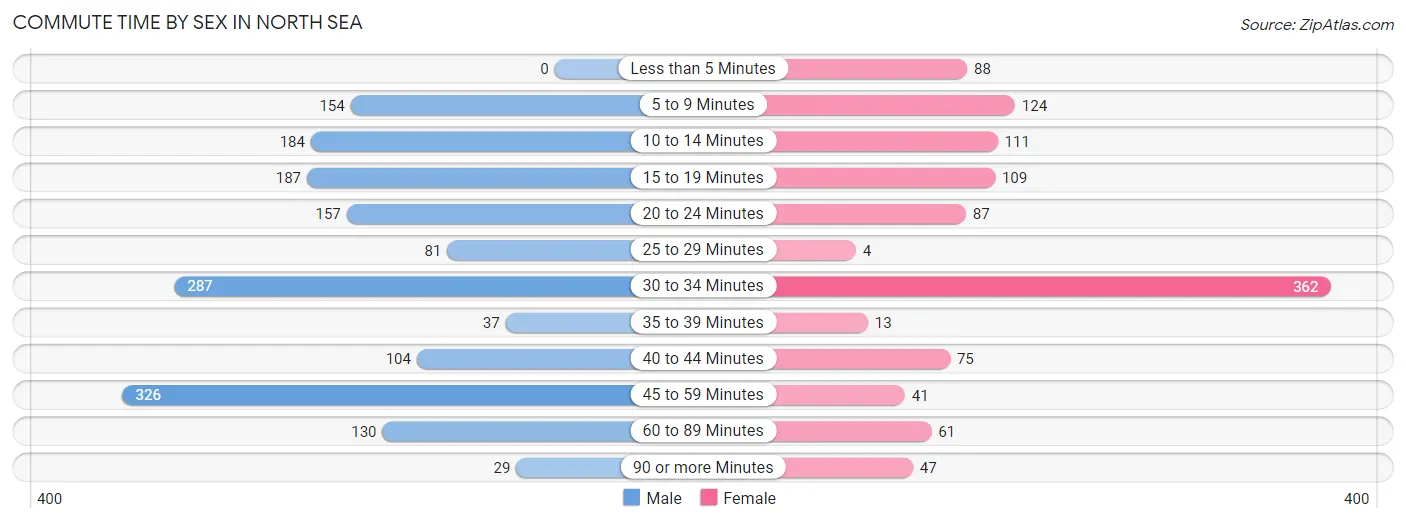
| Commute Time | Male | Female |
| Less than 5 Minutes | 0 (0.0%) | 88 (7.8%) |
| 5 to 9 Minutes | 154 (9.2%) | 124 (11.1%) |
| 10 to 14 Minutes | 184 (11.0%) | 111 (9.9%) |
| 15 to 19 Minutes | 187 (11.2%) | 109 (9.7%) |
| 20 to 24 Minutes | 157 (9.4%) | 87 (7.7%) |
| 25 to 29 Minutes | 81 (4.8%) | 4 (0.4%) |
| 30 to 34 Minutes | 287 (17.1%) | 362 (32.3%) |
| 35 to 39 Minutes | 37 (2.2%) | 13 (1.2%) |
| 40 to 44 Minutes | 104 (6.2%) | 75 (6.7%) |
| 45 to 59 Minutes | 326 (19.5%) | 41 (3.6%) |
| 60 to 89 Minutes | 130 (7.8%) | 61 (5.4%) |
| 90 or more Minutes | 29 (1.7%) | 47 (4.2%) |
Time of Departure to Work by Sex in North Sea
The most frequent times of departure to work in North Sea are 7:30 AM to 7:59 AM (415, 24.8%) for males and 9:00 AM to 9:59 AM (315, 28.1%) for females.
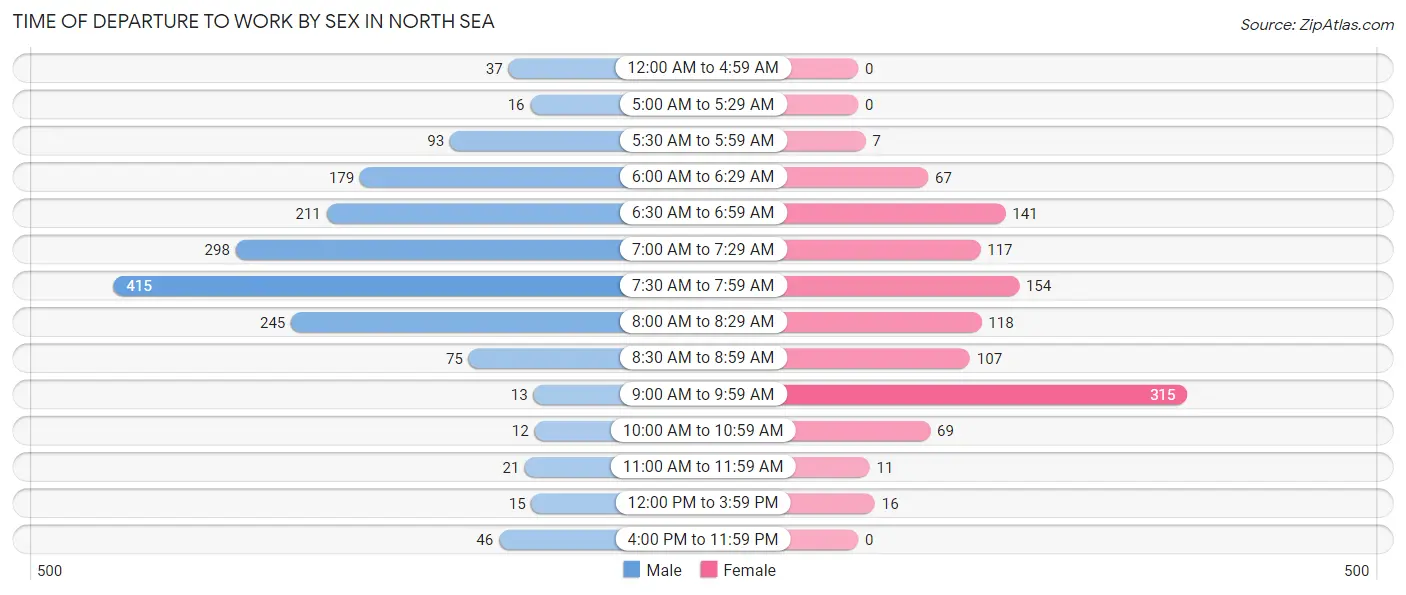
| Time of Departure | Male | Female |
| 12:00 AM to 4:59 AM | 37 (2.2%) | 0 (0.0%) |
| 5:00 AM to 5:29 AM | 16 (0.9%) | 0 (0.0%) |
| 5:30 AM to 5:59 AM | 93 (5.6%) | 7 (0.6%) |
| 6:00 AM to 6:29 AM | 179 (10.7%) | 67 (6.0%) |
| 6:30 AM to 6:59 AM | 211 (12.6%) | 141 (12.6%) |
| 7:00 AM to 7:29 AM | 298 (17.8%) | 117 (10.4%) |
| 7:30 AM to 7:59 AM | 415 (24.8%) | 154 (13.7%) |
| 8:00 AM to 8:29 AM | 245 (14.6%) | 118 (10.5%) |
| 8:30 AM to 8:59 AM | 75 (4.5%) | 107 (9.5%) |
| 9:00 AM to 9:59 AM | 13 (0.8%) | 315 (28.1%) |
| 10:00 AM to 10:59 AM | 12 (0.7%) | 69 (6.1%) |
| 11:00 AM to 11:59 AM | 21 (1.3%) | 11 (1.0%) |
| 12:00 PM to 3:59 PM | 15 (0.9%) | 16 (1.4%) |
| 4:00 PM to 11:59 PM | 46 (2.7%) | 0 (0.0%) |
| Total | 1,676 (100.0%) | 1,122 (100.0%) |
Housing Occupancy in North Sea
Occupancy by Ownership in North Sea
Of the total 2,186 dwellings in North Sea, owner-occupied units account for 1,925 (88.1%), while renter-occupied units make up 261 (11.9%).
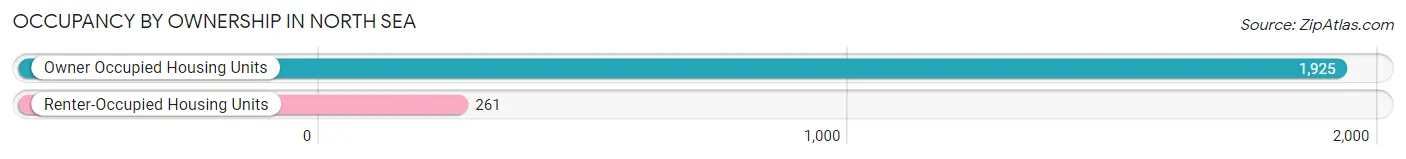
| Occupancy | # Housing Units | % Housing Units |
| Owner Occupied Housing Units | 1,925 | 88.1% |
| Renter-Occupied Housing Units | 261 | 11.9% |
| Total Occupied Housing Units | 2,186 | 100.0% |
Occupancy by Household Size in North Sea
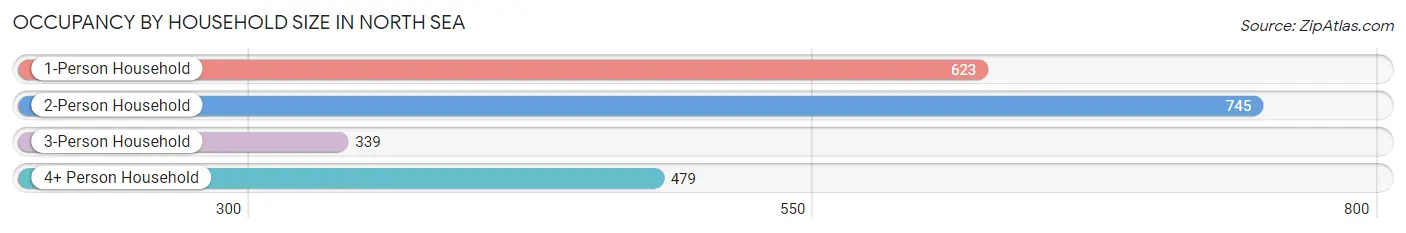
| Household Size | # Housing Units | % Housing Units |
| 1-Person Household | 623 | 28.5% |
| 2-Person Household | 745 | 34.1% |
| 3-Person Household | 339 | 15.5% |
| 4+ Person Household | 479 | 21.9% |
| Total Housing Units | 2,186 | 100.0% |
Occupancy by Ownership by Household Size in North Sea
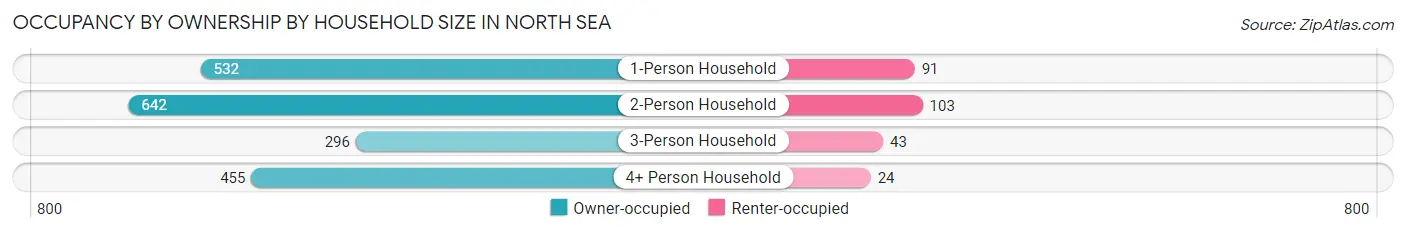
| Household Size | Owner-occupied | Renter-occupied |
| 1-Person Household | 532 (85.4%) | 91 (14.6%) |
| 2-Person Household | 642 (86.2%) | 103 (13.8%) |
| 3-Person Household | 296 (87.3%) | 43 (12.7%) |
| 4+ Person Household | 455 (95.0%) | 24 (5.0%) |
| Total Housing Units | 1,925 (88.1%) | 261 (11.9%) |
Occupancy by Educational Attainment in North Sea
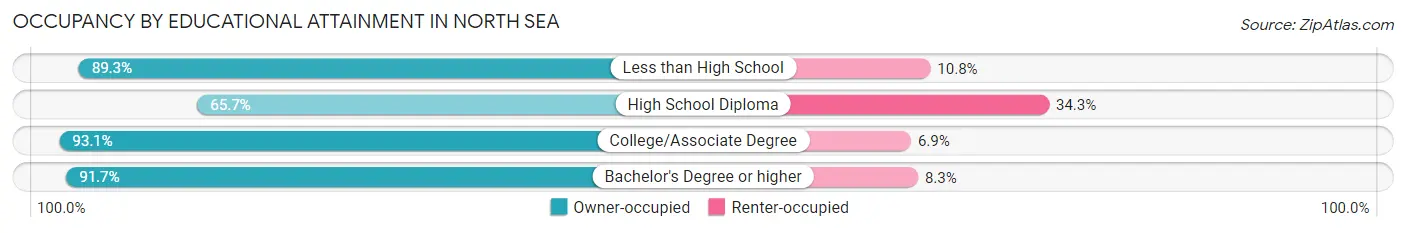
| Household Size | Owner-occupied | Renter-occupied |
| Less than High School | 83 (89.2%) | 10 (10.7%) |
| High School Diploma | 211 (65.7%) | 110 (34.3%) |
| College/Associate Degree | 391 (93.1%) | 29 (6.9%) |
| Bachelor's Degree or higher | 1,240 (91.7%) | 112 (8.3%) |
Occupancy by Age of Householder in North Sea
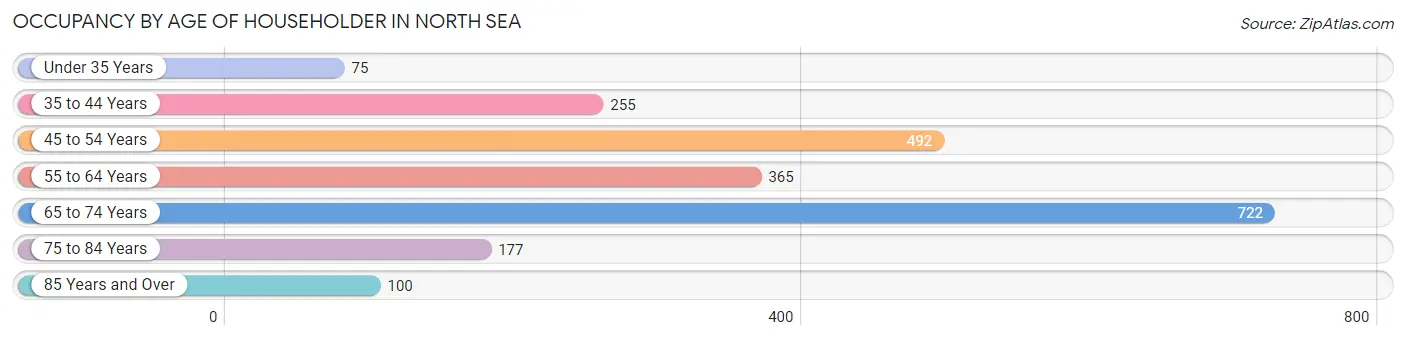
| Age Bracket | # Households | % Households |
| Under 35 Years | 75 | 3.4% |
| 35 to 44 Years | 255 | 11.7% |
| 45 to 54 Years | 492 | 22.5% |
| 55 to 64 Years | 365 | 16.7% |
| 65 to 74 Years | 722 | 33.0% |
| 75 to 84 Years | 177 | 8.1% |
| 85 Years and Over | 100 | 4.6% |
| Total | 2,186 | 100.0% |
Housing Finances in North Sea
Median Income by Occupancy in North Sea
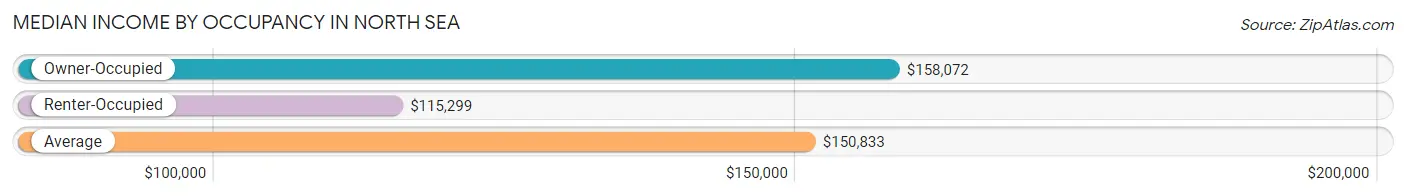
| Occupancy Type | # Households | Median Income |
| Owner-Occupied | 1,925 (88.1%) | $158,072 |
| Renter-Occupied | 261 (11.9%) | $115,299 |
| Average | 2,186 (100.0%) | $150,833 |
Occupancy by Householder Income Bracket in North Sea
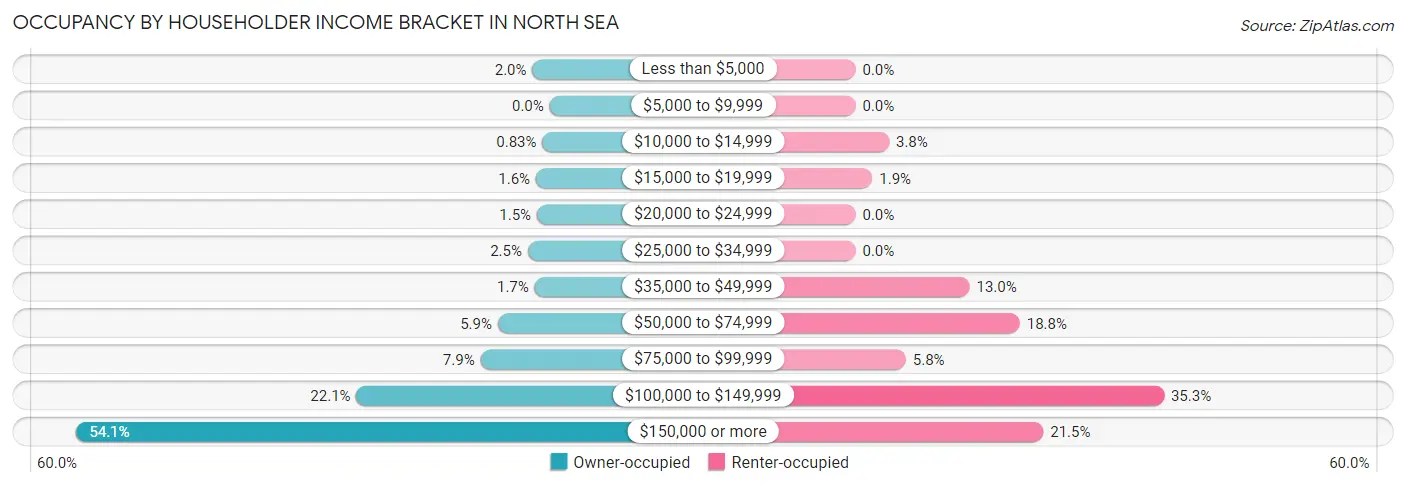
| Income Bracket | Owner-occupied | Renter-occupied |
| Less than $5,000 | 38 (2.0%) | 0 (0.0%) |
| $5,000 to $9,999 | 0 (0.0%) | 0 (0.0%) |
| $10,000 to $14,999 | 16 (0.8%) | 10 (3.8%) |
| $15,000 to $19,999 | 30 (1.6%) | 5 (1.9%) |
| $20,000 to $24,999 | 28 (1.5%) | 0 (0.0%) |
| $25,000 to $34,999 | 48 (2.5%) | 0 (0.0%) |
| $35,000 to $49,999 | 33 (1.7%) | 34 (13.0%) |
| $50,000 to $74,999 | 114 (5.9%) | 49 (18.8%) |
| $75,000 to $99,999 | 152 (7.9%) | 15 (5.8%) |
| $100,000 to $149,999 | 425 (22.1%) | 92 (35.2%) |
| $150,000 or more | 1,041 (54.1%) | 56 (21.5%) |
| Total | 1,925 (100.0%) | 261 (100.0%) |
Monthly Housing Cost Tiers in North Sea
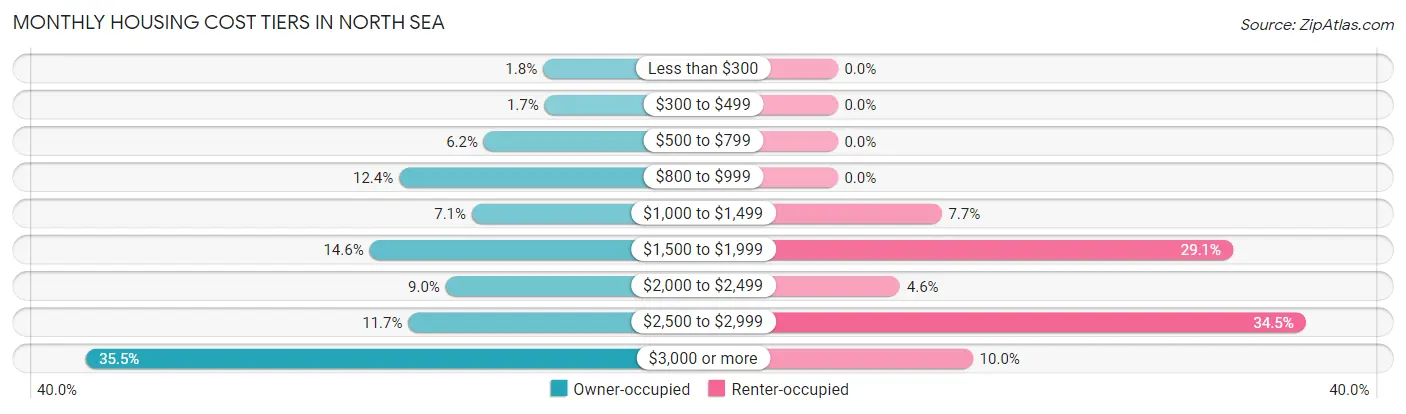
| Monthly Cost | Owner-occupied | Renter-occupied |
| Less than $300 | 35 (1.8%) | 0 (0.0%) |
| $300 to $499 | 33 (1.7%) | 0 (0.0%) |
| $500 to $799 | 119 (6.2%) | 0 (0.0%) |
| $800 to $999 | 239 (12.4%) | 0 (0.0%) |
| $1,000 to $1,499 | 136 (7.1%) | 20 (7.7%) |
| $1,500 to $1,999 | 281 (14.6%) | 76 (29.1%) |
| $2,000 to $2,499 | 173 (9.0%) | 12 (4.6%) |
| $2,500 to $2,999 | 226 (11.7%) | 90 (34.5%) |
| $3,000 or more | 683 (35.5%) | 26 (10.0%) |
| Total | 1,925 (100.0%) | 261 (100.0%) |
Physical Housing Characteristics in North Sea
Housing Structures in North Sea
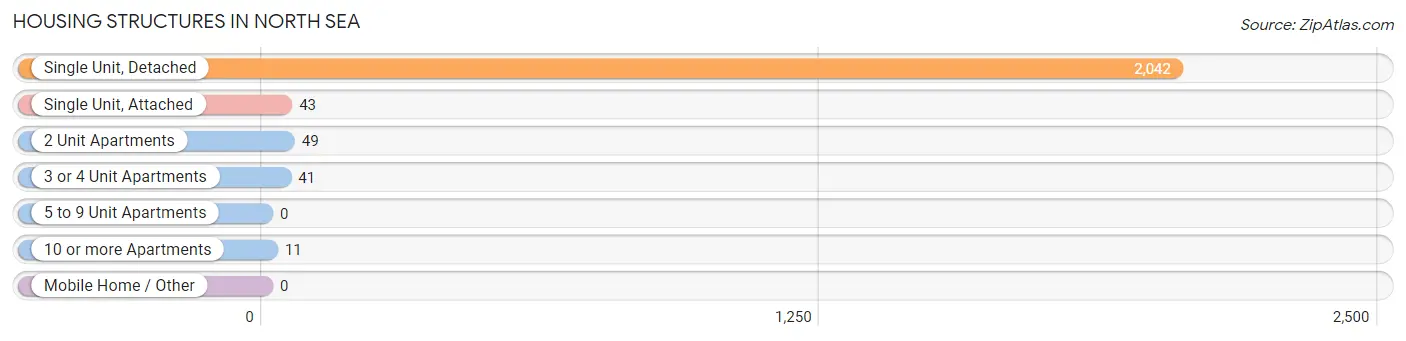
| Structure Type | # Housing Units | % Housing Units |
| Single Unit, Detached | 2,042 | 93.4% |
| Single Unit, Attached | 43 | 2.0% |
| 2 Unit Apartments | 49 | 2.2% |
| 3 or 4 Unit Apartments | 41 | 1.9% |
| 5 to 9 Unit Apartments | 0 | 0.0% |
| 10 or more Apartments | 11 | 0.5% |
| Mobile Home / Other | 0 | 0.0% |
| Total | 2,186 | 100.0% |
Housing Structures by Occupancy in North Sea
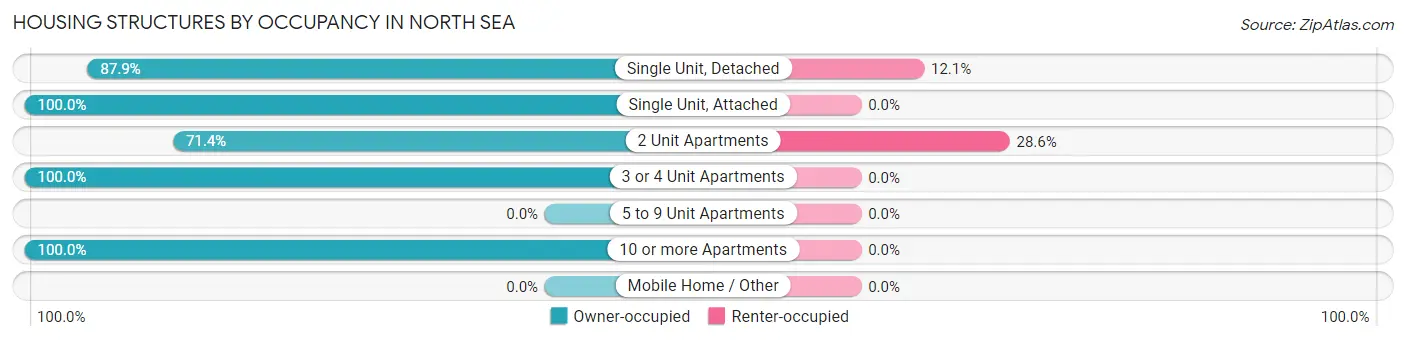
| Structure Type | Owner-occupied | Renter-occupied |
| Single Unit, Detached | 1,795 (87.9%) | 247 (12.1%) |
| Single Unit, Attached | 43 (100.0%) | 0 (0.0%) |
| 2 Unit Apartments | 35 (71.4%) | 14 (28.6%) |
| 3 or 4 Unit Apartments | 41 (100.0%) | 0 (0.0%) |
| 5 to 9 Unit Apartments | 0 (0.0%) | 0 (0.0%) |
| 10 or more Apartments | 11 (100.0%) | 0 (0.0%) |
| Mobile Home / Other | 0 (0.0%) | 0 (0.0%) |
| Total | 1,925 (88.1%) | 261 (11.9%) |
Housing Structures by Number of Rooms in North Sea
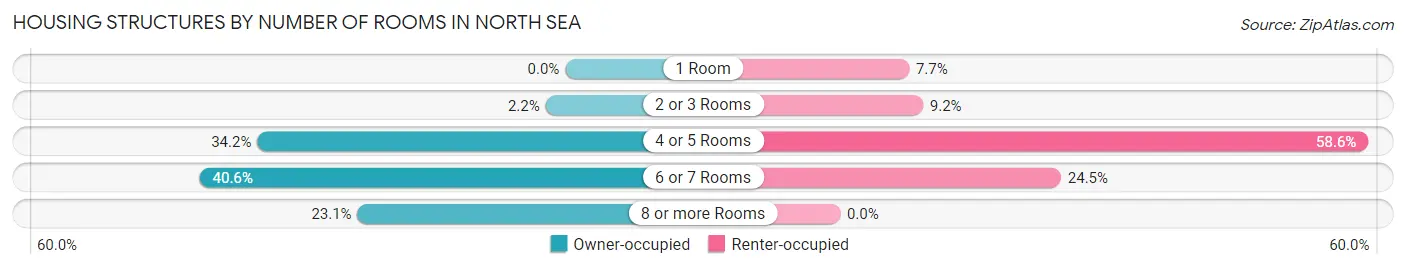
| Number of Rooms | Owner-occupied | Renter-occupied |
| 1 Room | 0 (0.0%) | 20 (7.7%) |
| 2 or 3 Rooms | 42 (2.2%) | 24 (9.2%) |
| 4 or 5 Rooms | 658 (34.2%) | 153 (58.6%) |
| 6 or 7 Rooms | 781 (40.6%) | 64 (24.5%) |
| 8 or more Rooms | 444 (23.1%) | 0 (0.0%) |
| Total | 1,925 (100.0%) | 261 (100.0%) |
Housing Structure by Heating Type in North Sea
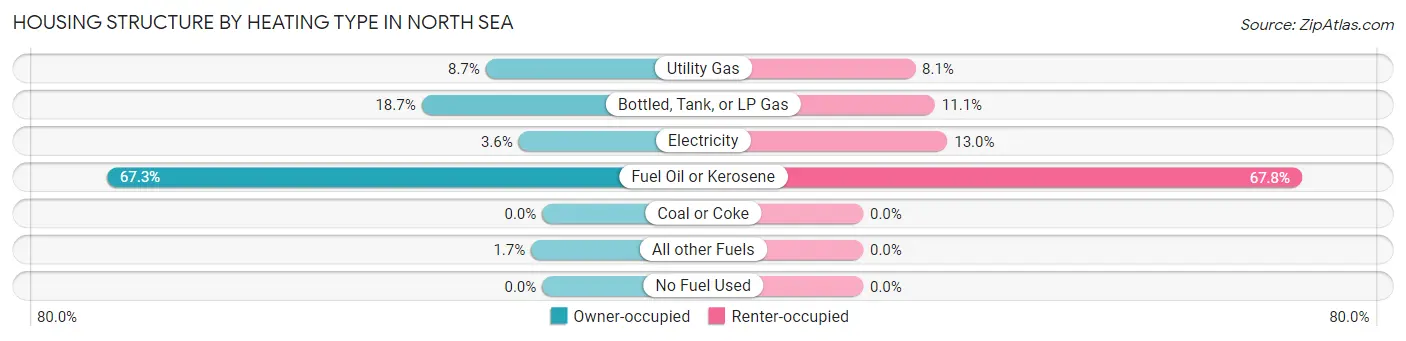
| Heating Type | Owner-occupied | Renter-occupied |
| Utility Gas | 168 (8.7%) | 21 (8.1%) |
| Bottled, Tank, or LP Gas | 359 (18.6%) | 29 (11.1%) |
| Electricity | 70 (3.6%) | 34 (13.0%) |
| Fuel Oil or Kerosene | 1,295 (67.3%) | 177 (67.8%) |
| Coal or Coke | 0 (0.0%) | 0 (0.0%) |
| All other Fuels | 33 (1.7%) | 0 (0.0%) |
| No Fuel Used | 0 (0.0%) | 0 (0.0%) |
| Total | 1,925 (100.0%) | 261 (100.0%) |
Household Vehicle Usage in North Sea
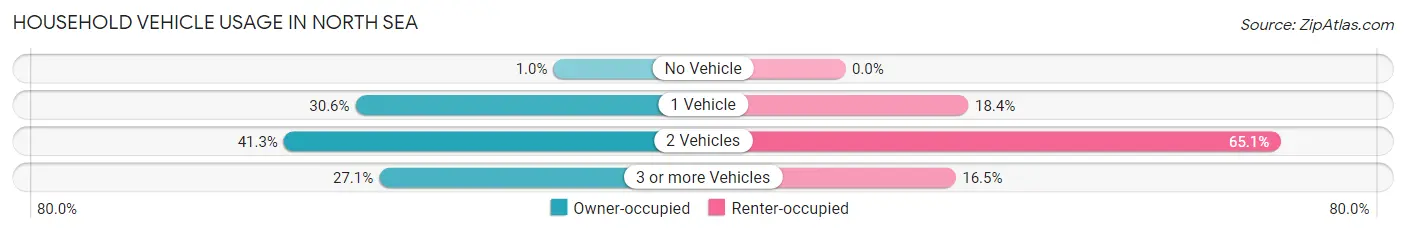
| Vehicles per Household | Owner-occupied | Renter-occupied |
| No Vehicle | 20 (1.0%) | 0 (0.0%) |
| 1 Vehicle | 589 (30.6%) | 48 (18.4%) |
| 2 Vehicles | 795 (41.3%) | 170 (65.1%) |
| 3 or more Vehicles | 521 (27.1%) | 43 (16.5%) |
| Total | 1,925 (100.0%) | 261 (100.0%) |
Real Estate & Mortgages in North Sea
Real Estate and Mortgage Overview in North Sea
| Characteristic | Without Mortgage | With Mortgage |
| Housing Units | 936 | 989 |
| Median Property Value | $1,138,600 | $858,800 |
| Median Household Income | $127,483 | $631 |
| Monthly Housing Costs | $1,324 | $661 |
| Real Estate Taxes | $5,460 | $44 |
Property Value by Mortgage Status in North Sea
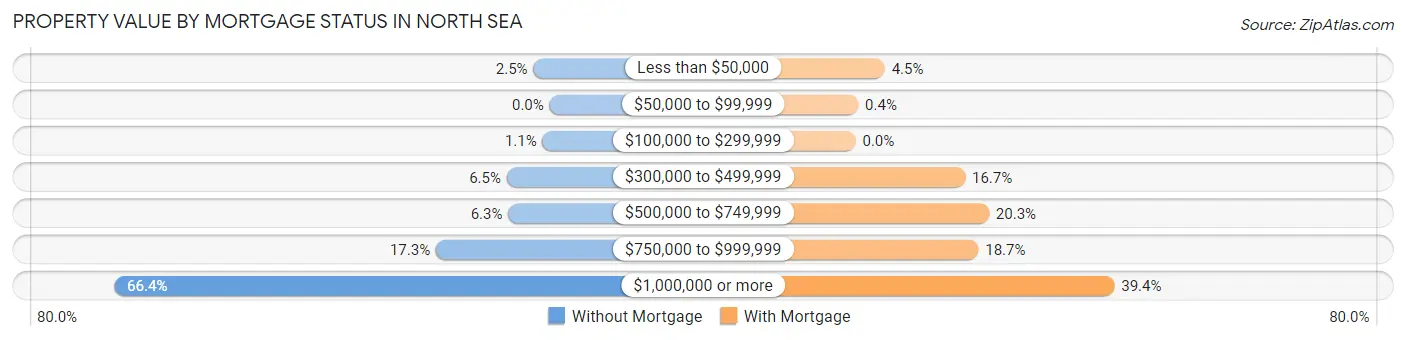
| Property Value | Without Mortgage | With Mortgage |
| Less than $50,000 | 23 (2.5%) | 44 (4.4%) |
| $50,000 to $99,999 | 0 (0.0%) | 4 (0.4%) |
| $100,000 to $299,999 | 10 (1.1%) | 0 (0.0%) |
| $300,000 to $499,999 | 61 (6.5%) | 165 (16.7%) |
| $500,000 to $749,999 | 59 (6.3%) | 201 (20.3%) |
| $750,000 to $999,999 | 162 (17.3%) | 185 (18.7%) |
| $1,000,000 or more | 621 (66.3%) | 390 (39.4%) |
| Total | 936 (100.0%) | 989 (100.0%) |
Household Income by Mortgage Status in North Sea
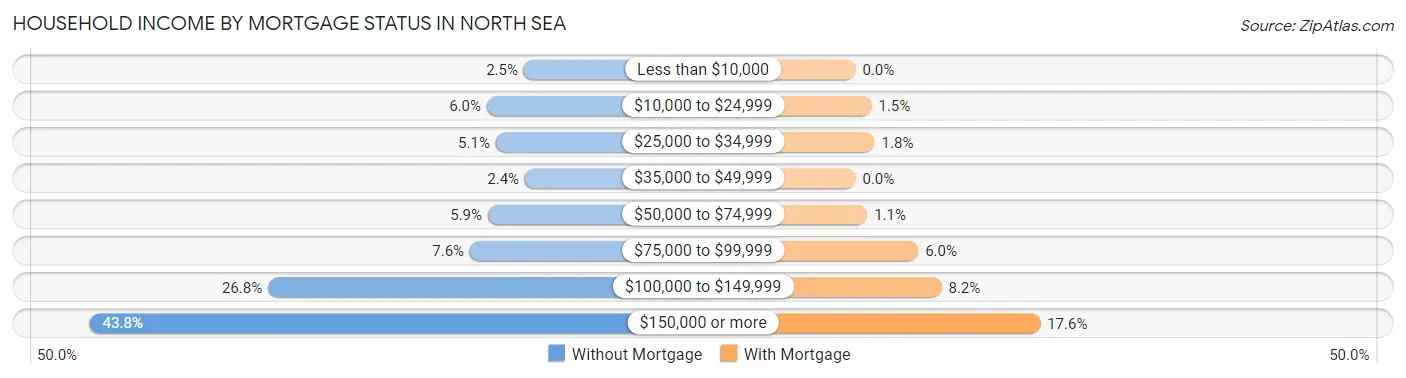
| Household Income | Without Mortgage | With Mortgage |
| Less than $10,000 | 23 (2.5%) | 0 (0.0%) |
| $10,000 to $24,999 | 56 (6.0%) | 15 (1.5%) |
| $25,000 to $34,999 | 48 (5.1%) | 18 (1.8%) |
| $35,000 to $49,999 | 22 (2.4%) | 0 (0.0%) |
| $50,000 to $74,999 | 55 (5.9%) | 11 (1.1%) |
| $75,000 to $99,999 | 71 (7.6%) | 59 (6.0%) |
| $100,000 to $149,999 | 251 (26.8%) | 81 (8.2%) |
| $150,000 or more | 410 (43.8%) | 174 (17.6%) |
| Total | 936 (100.0%) | 989 (100.0%) |
Property Value to Household Income Ratio in North Sea
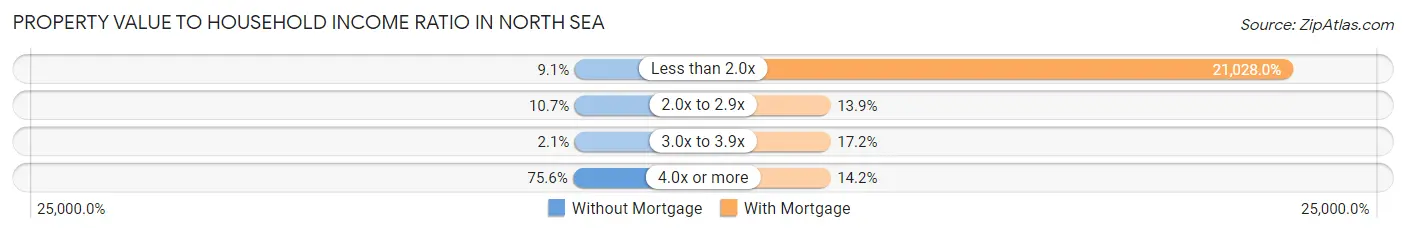
| Value-to-Income Ratio | Without Mortgage | With Mortgage |
| Less than 2.0x | 85 (9.1%) | 207,967 (21,028.0%) |
| 2.0x to 2.9x | 100 (10.7%) | 137 (13.9%) |
| 3.0x to 3.9x | 20 (2.1%) | 170 (17.2%) |
| 4.0x or more | 708 (75.6%) | 140 (14.2%) |
| Total | 936 (100.0%) | 989 (100.0%) |
Real Estate Taxes by Mortgage Status in North Sea
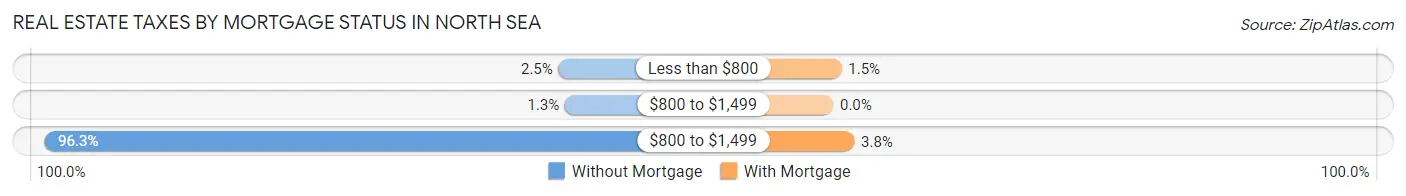
| Property Taxes | Without Mortgage | With Mortgage |
| Less than $800 | 23 (2.5%) | 15 (1.5%) |
| $800 to $1,499 | 12 (1.3%) | 0 (0.0%) |
| $800 to $1,499 | 901 (96.3%) | 38 (3.8%) |
| Total | 936 (100.0%) | 989 (100.0%) |
Health & Disability in North Sea
Health Insurance Coverage by Age in North Sea
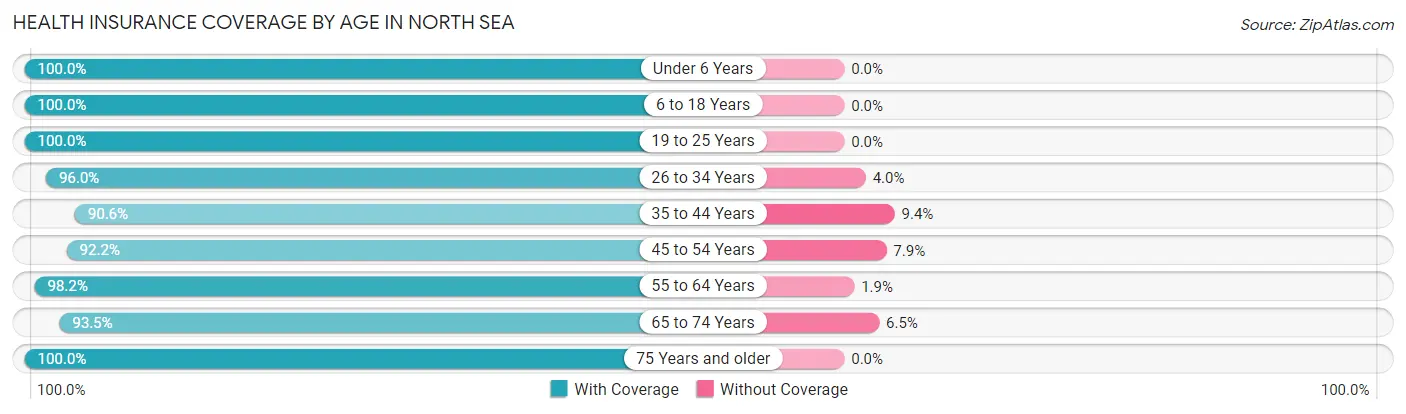
| Age Bracket | With Coverage | Without Coverage |
| Under 6 Years | 289 (100.0%) | 0 (0.0%) |
| 6 to 18 Years | 739 (100.0%) | 0 (0.0%) |
| 19 to 25 Years | 441 (100.0%) | 0 (0.0%) |
| 26 to 34 Years | 505 (96.0%) | 21 (4.0%) |
| 35 to 44 Years | 676 (90.6%) | 70 (9.4%) |
| 45 to 54 Years | 974 (92.1%) | 83 (7.9%) |
| 55 to 64 Years | 690 (98.2%) | 13 (1.8%) |
| 65 to 74 Years | 1,008 (93.5%) | 70 (6.5%) |
| 75 Years and older | 475 (100.0%) | 0 (0.0%) |
| Total | 5,797 (95.8%) | 257 (4.3%) |
Health Insurance Coverage by Citizenship Status in North Sea
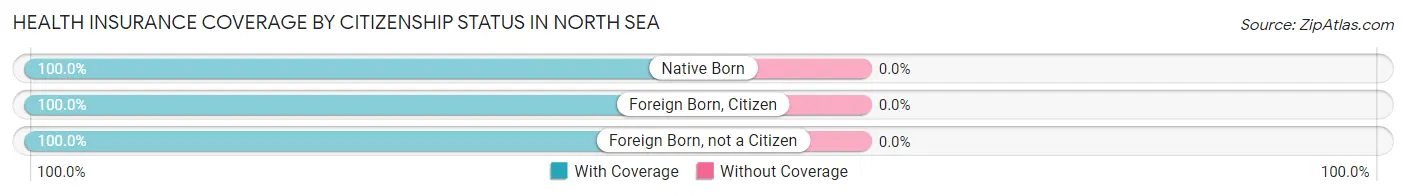
| Citizenship Status | With Coverage | Without Coverage |
| Native Born | 289 (100.0%) | 0 (0.0%) |
| Foreign Born, Citizen | 739 (100.0%) | 0 (0.0%) |
| Foreign Born, not a Citizen | 441 (100.0%) | 0 (0.0%) |
Health Insurance Coverage by Household Income in North Sea
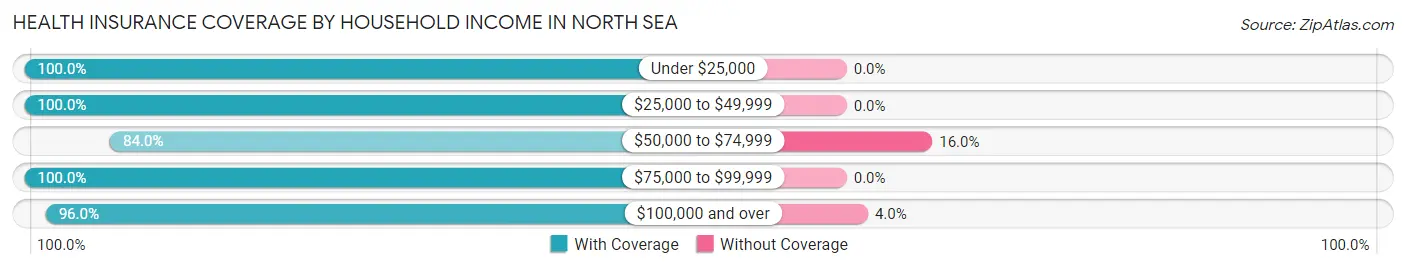
| Household Income | With Coverage | Without Coverage |
| Under $25,000 | 196 (100.0%) | 0 (0.0%) |
| $25,000 to $49,999 | 201 (100.0%) | 0 (0.0%) |
| $50,000 to $74,999 | 325 (84.0%) | 62 (16.0%) |
| $75,000 to $99,999 | 364 (100.0%) | 0 (0.0%) |
| $100,000 and over | 4,711 (96.0%) | 195 (4.0%) |
Public vs Private Health Insurance Coverage by Age in North Sea
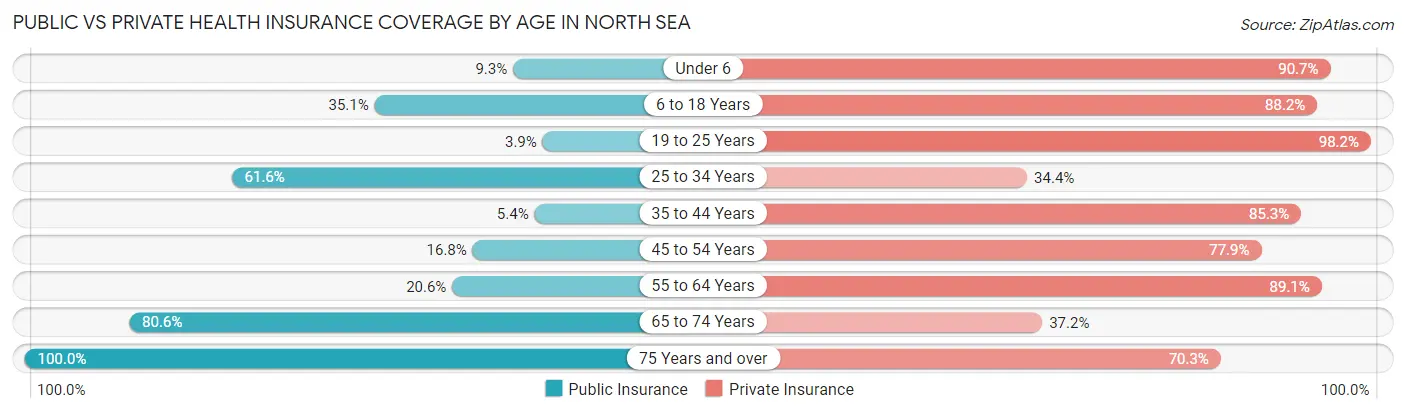
| Age Bracket | Public Insurance | Private Insurance |
| Under 6 | 27 (9.3%) | 262 (90.7%) |
| 6 to 18 Years | 259 (35.0%) | 652 (88.2%) |
| 19 to 25 Years | 17 (3.8%) | 433 (98.2%) |
| 25 to 34 Years | 324 (61.6%) | 181 (34.4%) |
| 35 to 44 Years | 40 (5.4%) | 636 (85.3%) |
| 45 to 54 Years | 178 (16.8%) | 823 (77.9%) |
| 55 to 64 Years | 145 (20.6%) | 626 (89.0%) |
| 65 to 74 Years | 869 (80.6%) | 401 (37.2%) |
| 75 Years and over | 475 (100.0%) | 334 (70.3%) |
| Total | 2,334 (38.6%) | 4,348 (71.8%) |
Disability Status by Sex by Age in North Sea
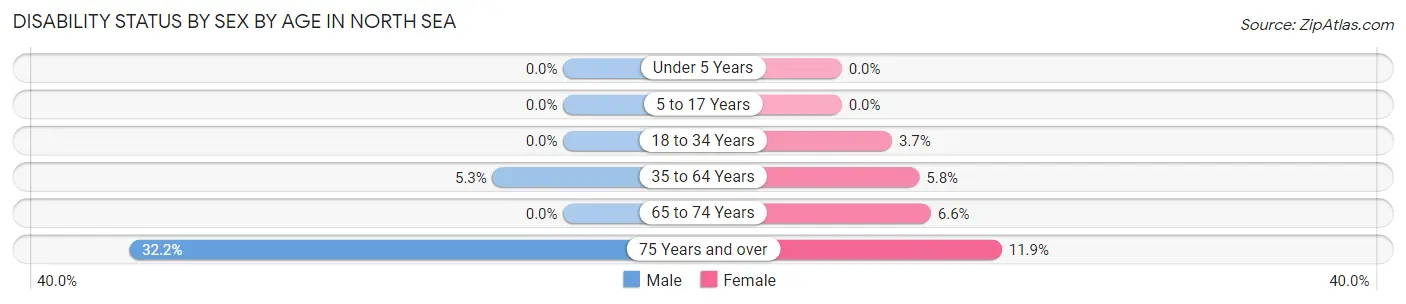
| Age Bracket | Male | Female |
| Under 5 Years | 0 (0.0%) | 0 (0.0%) |
| 5 to 17 Years | 0 (0.0%) | 0 (0.0%) |
| 18 to 34 Years | 0 (0.0%) | 18 (3.7%) |
| 35 to 64 Years | 75 (5.2%) | 62 (5.8%) |
| 65 to 74 Years | 0 (0.0%) | 42 (6.6%) |
| 75 Years and over | 69 (32.2%) | 31 (11.9%) |
Disability Class by Sex by Age in North Sea
Disability Class: Hearing Difficulty
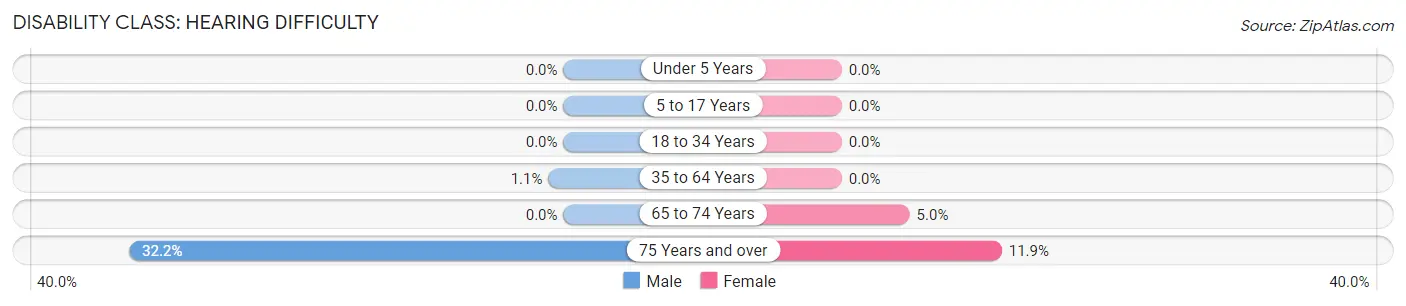
| Age Bracket | Male | Female |
| Under 5 Years | 0 (0.0%) | 0 (0.0%) |
| 5 to 17 Years | 0 (0.0%) | 0 (0.0%) |
| 18 to 34 Years | 0 (0.0%) | 0 (0.0%) |
| 35 to 64 Years | 16 (1.1%) | 0 (0.0%) |
| 65 to 74 Years | 0 (0.0%) | 32 (5.0%) |
| 75 Years and over | 69 (32.2%) | 31 (11.9%) |
Disability Class: Vision Difficulty
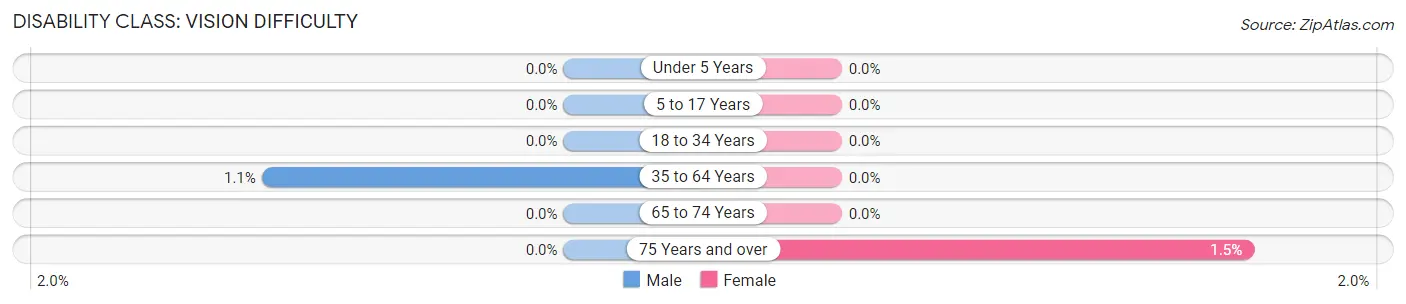
| Age Bracket | Male | Female |
| Under 5 Years | 0 (0.0%) | 0 (0.0%) |
| 5 to 17 Years | 0 (0.0%) | 0 (0.0%) |
| 18 to 34 Years | 0 (0.0%) | 0 (0.0%) |
| 35 to 64 Years | 16 (1.1%) | 0 (0.0%) |
| 65 to 74 Years | 0 (0.0%) | 0 (0.0%) |
| 75 Years and over | 0 (0.0%) | 4 (1.5%) |
Disability Class: Cognitive Difficulty
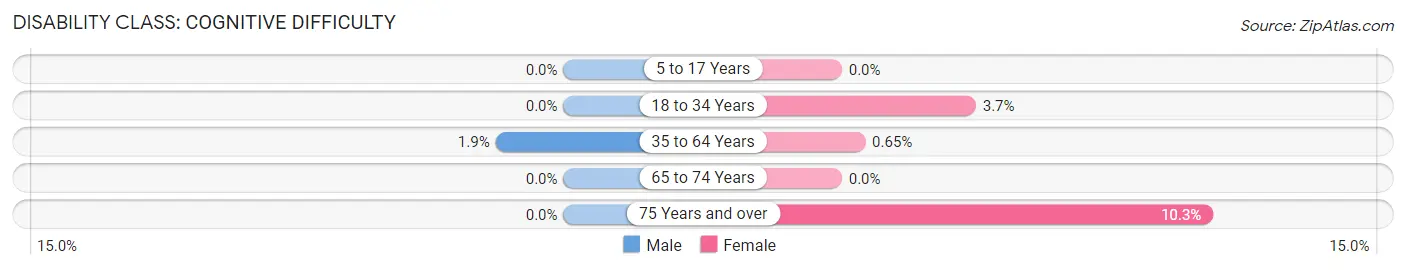
| Age Bracket | Male | Female |
| 5 to 17 Years | 0 (0.0%) | 0 (0.0%) |
| 18 to 34 Years | 0 (0.0%) | 18 (3.7%) |
| 35 to 64 Years | 27 (1.9%) | 7 (0.6%) |
| 65 to 74 Years | 0 (0.0%) | 0 (0.0%) |
| 75 Years and over | 0 (0.0%) | 27 (10.3%) |
Disability Class: Ambulatory Difficulty
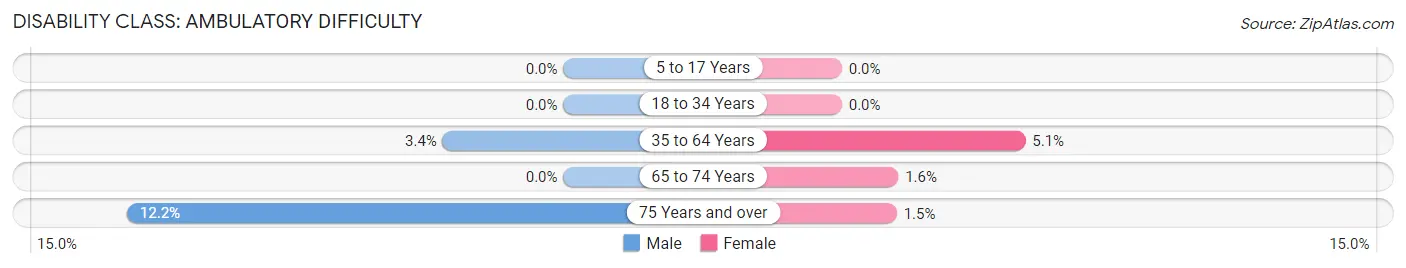
| Age Bracket | Male | Female |
| 5 to 17 Years | 0 (0.0%) | 0 (0.0%) |
| 18 to 34 Years | 0 (0.0%) | 0 (0.0%) |
| 35 to 64 Years | 48 (3.4%) | 55 (5.1%) |
| 65 to 74 Years | 0 (0.0%) | 10 (1.6%) |
| 75 Years and over | 26 (12.1%) | 4 (1.5%) |
Disability Class: Self-Care Difficulty
| Age Bracket | Male | Female |
| 5 to 17 Years | 0 (0.0%) | 0 (0.0%) |
| 18 to 34 Years | 0 (0.0%) | 0 (0.0%) |
| 35 to 64 Years | 0 (0.0%) | 0 (0.0%) |
| 65 to 74 Years | 0 (0.0%) | 0 (0.0%) |
| 75 Years and over | 0 (0.0%) | 0 (0.0%) |
Technology Access in North Sea
Computing Device Access in North Sea
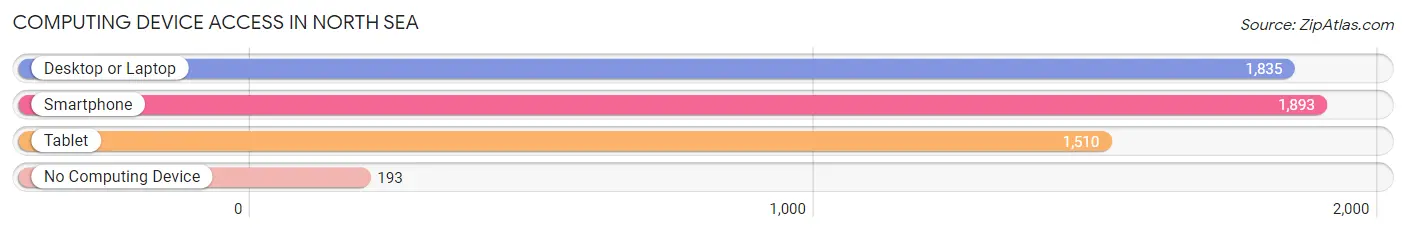
| Device Type | # Households | % Households |
| Desktop or Laptop | 1,835 | 83.9% |
| Smartphone | 1,893 | 86.6% |
| Tablet | 1,510 | 69.1% |
| No Computing Device | 193 | 8.8% |
| Total | 2,186 | 100.0% |
Internet Access in North Sea
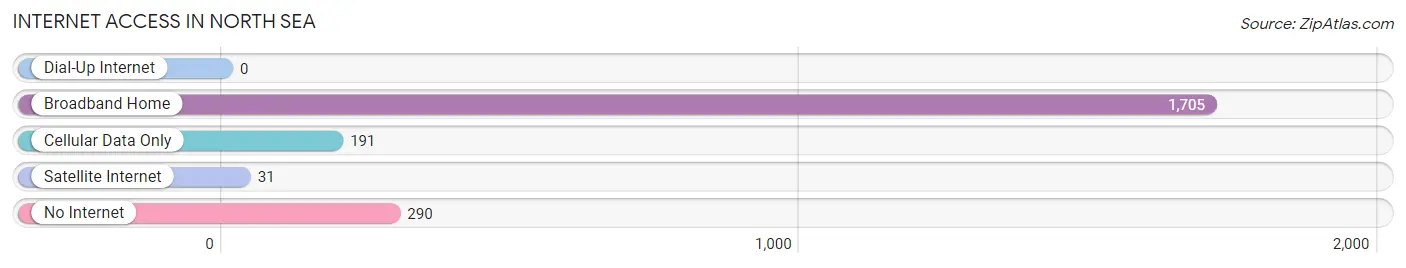
| Internet Type | # Households | % Households |
| Dial-Up Internet | 0 | 0.0% |
| Broadband Home | 1,705 | 78.0% |
| Cellular Data Only | 191 | 8.7% |
| Satellite Internet | 31 | 1.4% |
| No Internet | 290 | 13.3% |
| Total | 2,186 | 100.0% |
North Sea Summary
The North Sea is a marginal sea of the Atlantic Ocean located between the United Kingdom, Norway, Germany, Denmark, Sweden, the Netherlands, and Belgium. It is connected to the Atlantic Ocean through the English Channel in the south and the Norwegian Sea in the north. The North Sea covers an area of around 570,000 square kilometers and has a maximum depth of around 700 meters.
History
The North Sea has been an important part of European history since ancient times. It was an important trade route for the Vikings, who used it to travel to and from Scandinavia and the British Isles. The North Sea was also an important part of the Hanseatic League, a powerful trading network that stretched from the Baltic Sea to the North Sea. The League was a major economic force in Europe during the Middle Ages and Renaissance.
The North Sea was also the site of several major naval battles during the Napoleonic Wars and World War I. In World War II, the North Sea was the site of the Battle of the Atlantic, a major naval conflict between the Allies and the Axis powers.
Geography
The North Sea is bordered by the United Kingdom, Norway, Germany, Denmark, Sweden, the Netherlands, and Belgium. It is connected to the Atlantic Ocean through the English Channel in the south and the Norwegian Sea in the north. The North Sea covers an area of around 570,000 square kilometers and has a maximum depth of around 700 meters.
The North Sea is divided into two main parts: the North Sea proper and the Skagerrak. The North Sea proper is located between the United Kingdom and Norway, while the Skagerrak is located between Norway and Denmark. The North Sea is also home to several islands, including the Shetland Islands, the Orkney Islands, and the Faroe Islands.
Economy
The North Sea is an important economic resource for the countries that border it. It is home to a large fishing industry, as well as oil and gas reserves. The North Sea is also an important shipping route, connecting the countries of Europe to the rest of the world.
The North Sea is also an important source of renewable energy. Several countries, including the United Kingdom, Germany, and the Netherlands, have built offshore wind farms in the North Sea. These wind farms generate electricity that is used to power homes and businesses in the countries that border the North Sea.
Demographics
The North Sea is home to a diverse population of people. The countries that border the North Sea have a variety of cultures and languages. The most common languages spoken in the North Sea region are English, German, Dutch, and Scandinavian languages.
The North Sea is also home to a variety of wildlife. The North Sea is home to a variety of fish, including cod, herring, and mackerel. The North Sea is also home to several species of seabirds, including puffins, gannets, and guillemots. The North Sea is also home to several species of marine mammals, including seals, dolphins, and whales.
Common Questions
What is Per Capita Income in North Sea?
Per Capita income in North Sea is $103,883.
What is the Median Family Income in North Sea?
Median Family Income in North Sea is $204,277.
What is the Median Household income in North Sea?
Median Household Income in North Sea is $150,833.
What is Inequality or Gini Index in North Sea?
Inequality or Gini Index in North Sea is 0.53.
What is the Total Population of North Sea?
Total Population of North Sea is 6,054.
What is the Total Male Population of North Sea?
Total Male Population of North Sea is 3,241.
What is the Total Female Population of North Sea?
Total Female Population of North Sea is 2,813.
What is the Ratio of Males per 100 Females in North Sea?
There are 115.22 Males per 100 Females in North Sea.
What is the Ratio of Females per 100 Males in North Sea?
There are 86.79 Females per 100 Males in North Sea.
What is the Median Population Age in North Sea?
Median Population Age in North Sea is 47.5 Years.
What is the Average Family Size in North Sea
Average Family Size in North Sea is 3.5 People.
What is the Average Household Size in North Sea
Average Household Size in North Sea is 2.8 People.
How Large is the Labor Force in North Sea?
There are 3,557 People in the Labor Forcein in North Sea.
What is the Percentage of People in the Labor Force in North Sea?
69.8% of People are in the Labor Force in North Sea.
What is the Unemployment Rate in North Sea?
Unemployment Rate in North Sea is 0.9%.