Zip Codes with the Highest Percentage of Population Employed in Legal Services & Support in Little Neck, NY
RELATED REPORTS & OPTIONS
Legal Services & Support
Little Neck
Compare Zip Codes
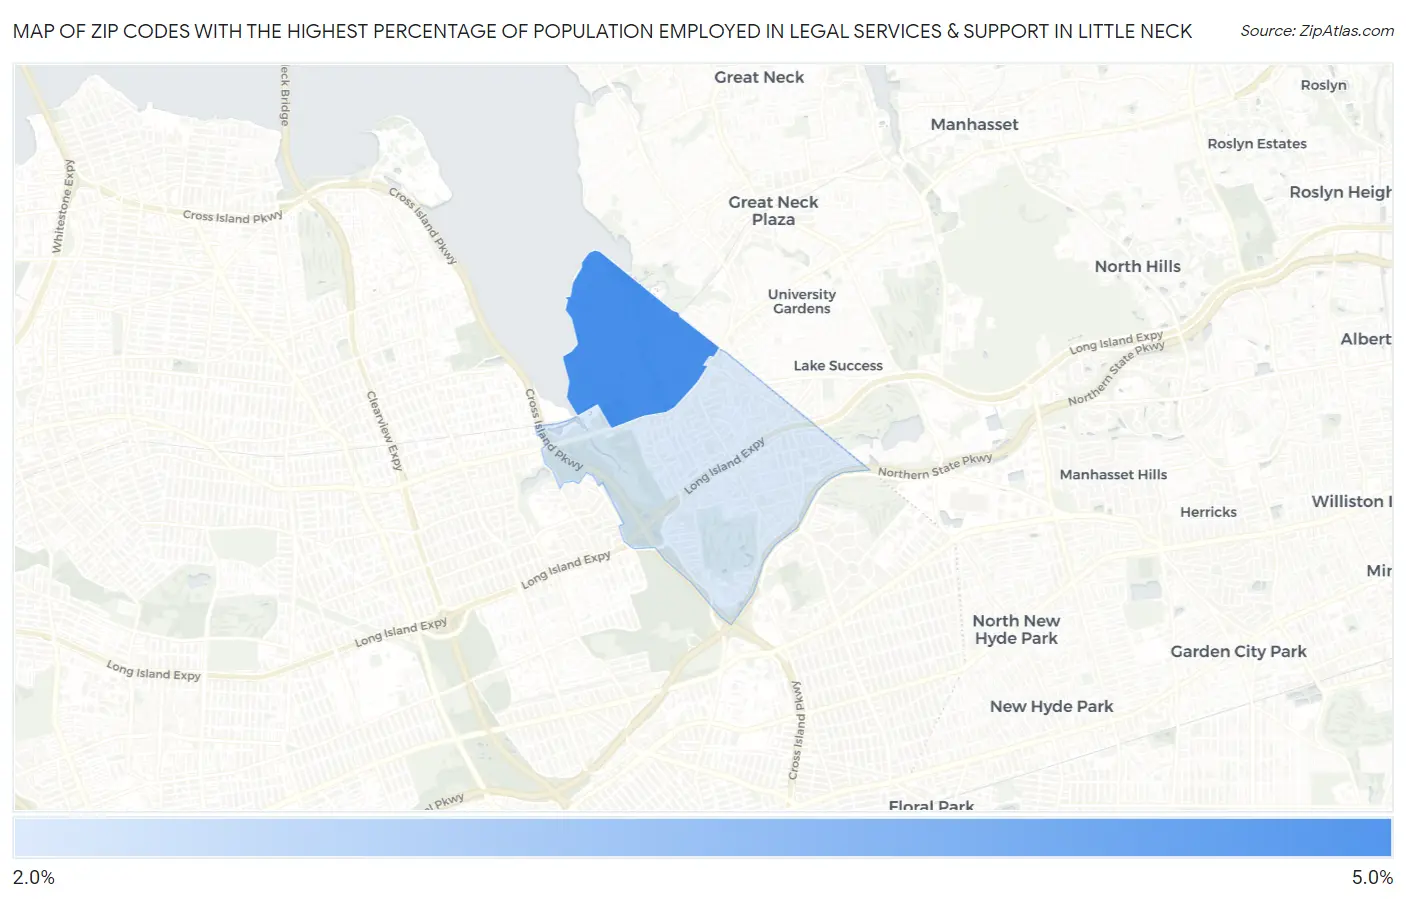
Map of Zip Codes with the Highest Percentage of Population Employed in Legal Services & Support in Little Neck
2.4%
4.6%
Zip Codes with the Highest Percentage of Population Employed in Legal Services & Support in Little Neck, NY
| Zip Code | % Employed | vs State | vs National | |
| 1. | 11363 | 4.6% | 1.9%(+2.73)#127 | 1.2%(+3.41)#857 |
| 2. | 11362 | 2.4% | 1.9%(+0.541)#320 | 1.2%(+1.22)#2,675 |
1
Common Questions
What are the Top Zip Codes with the Highest Percentage of Population Employed in Legal Services & Support in Little Neck, NY?
Top Zip Codes with the Highest Percentage of Population Employed in Legal Services & Support in Little Neck, NY are:
What zip code has the Highest Percentage of Population Employed in Legal Services & Support in Little Neck, NY?
11363 has the Highest Percentage of Population Employed in Legal Services & Support in Little Neck, NY with 4.6%.
What is the Percentage of Population Employed in Legal Services & Support in New York?
Percentage of Population Employed in Legal Services & Support in New York is 1.9%.
What is the Percentage of Population Employed in Legal Services & Support in the United States?
Percentage of Population Employed in Legal Services & Support in the United States is 1.2%.