West Hampton Dunes, NY Map & Demographics
West Hampton Dunes Map
West Hampton Dunes Overview
$172,312
PER CAPITA INCOME
$250,001
AVG FAMILY INCOME
$250,001
AVG HOUSEHOLD INCOME
61.5%
WAGE / INCOME GAP [ % ]
38.5¢/ $1
WAGE / INCOME GAP [ $ ]
0.38
INEQUALITY / GINI INDEX
130
TOTAL POPULATION
55
MALE POPULATION
75
FEMALE POPULATION
73.33
MALES / 100 FEMALES
136.36
FEMALES / 100 MALES
55.3
MEDIAN AGE
2.8
AVG FAMILY SIZE
2.7
AVG HOUSEHOLD SIZE
73
LABOR FORCE [ PEOPLE ]
64.0%
PERCENT IN LABOR FORCE
1.4%
UNEMPLOYMENT RATE
Income in West Hampton Dunes
Income Overview in West Hampton Dunes
Per Capita Income in West Hampton Dunes is $172,312, while median incomes of families and households are $250,001 and $250,001 respectively.
| Characteristic | Number | Measure |
| Per Capita Income | 130 | $172,312 |
| Median Family Income | 45 | $250,001 |
| Mean Family Income | 45 | $484,153 |
| Median Household Income | 48 | $250,001 |
| Mean Household Income | 48 | $470,131 |
| Income Deficit | 45 | $0 |
| Wage / Income Gap (%) | 130 | 61.50% |
| Wage / Income Gap ($) | 130 | 38.50¢ per $1 |
| Gini / Inequality Index | 130 | 0.38 |
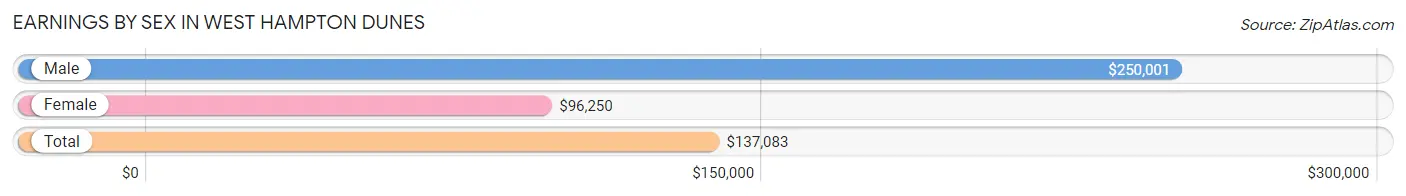
Earnings by Sex in West Hampton Dunes
Average Earnings in West Hampton Dunes are $137,083, $250,001 for men and $96,250 for women, a difference of 61.5%.
| Sex | Number | Average Earnings |
| Male | 36 (47.4%) | $250,001 |
| Female | 40 (52.6%) | $96,250 |
| Total | 76 (100.0%) | $137,083 |
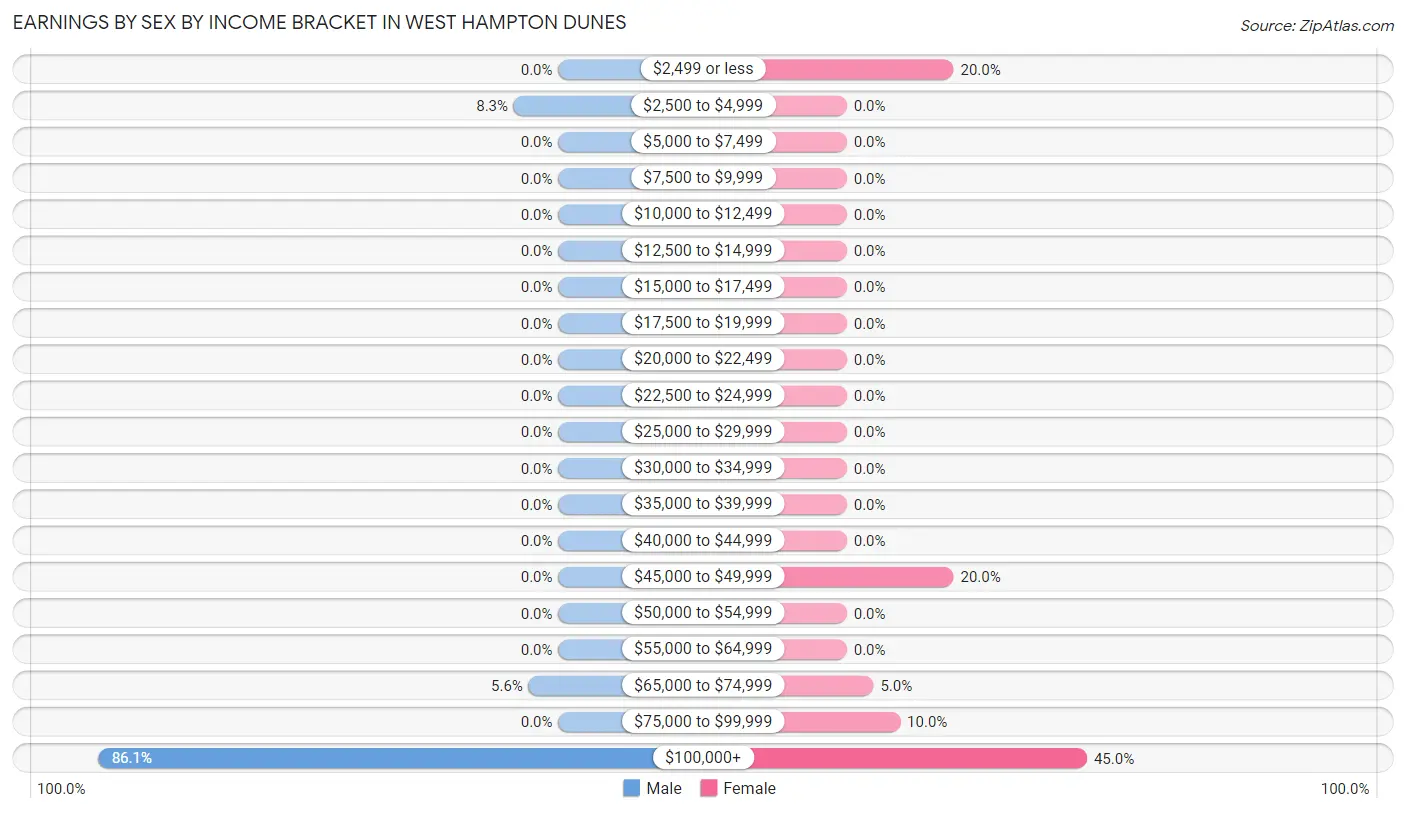
Earnings by Sex by Income Bracket in West Hampton Dunes
The most common earnings brackets in West Hampton Dunes are $100,000+ for men (31 | 86.1%) and $100,000+ for women (18 | 45.0%).
| Income | Male | Female |
| $2,499 or less | 0 (0.0%) | 8 (20.0%) |
| $2,500 to $4,999 | 3 (8.3%) | 0 (0.0%) |
| $5,000 to $7,499 | 0 (0.0%) | 0 (0.0%) |
| $7,500 to $9,999 | 0 (0.0%) | 0 (0.0%) |
| $10,000 to $12,499 | 0 (0.0%) | 0 (0.0%) |
| $12,500 to $14,999 | 0 (0.0%) | 0 (0.0%) |
| $15,000 to $17,499 | 0 (0.0%) | 0 (0.0%) |
| $17,500 to $19,999 | 0 (0.0%) | 0 (0.0%) |
| $20,000 to $22,499 | 0 (0.0%) | 0 (0.0%) |
| $22,500 to $24,999 | 0 (0.0%) | 0 (0.0%) |
| $25,000 to $29,999 | 0 (0.0%) | 0 (0.0%) |
| $30,000 to $34,999 | 0 (0.0%) | 0 (0.0%) |
| $35,000 to $39,999 | 0 (0.0%) | 0 (0.0%) |
| $40,000 to $44,999 | 0 (0.0%) | 0 (0.0%) |
| $45,000 to $49,999 | 0 (0.0%) | 8 (20.0%) |
| $50,000 to $54,999 | 0 (0.0%) | 0 (0.0%) |
| $55,000 to $64,999 | 0 (0.0%) | 0 (0.0%) |
| $65,000 to $74,999 | 2 (5.6%) | 2 (5.0%) |
| $75,000 to $99,999 | 0 (0.0%) | 4 (10.0%) |
| $100,000+ | 31 (86.1%) | 18 (45.0%) |
| Total | 36 (100.0%) | 40 (100.0%) |
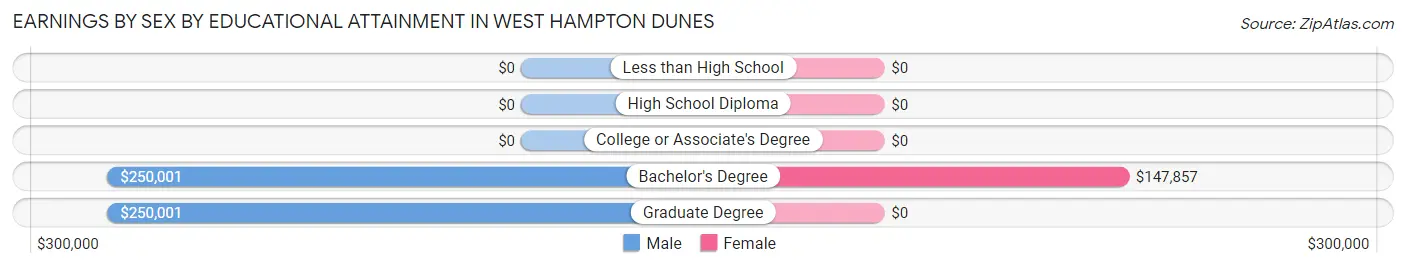
Earnings by Sex by Educational Attainment in West Hampton Dunes
Average earnings in West Hampton Dunes are $250,001 for men and $96,250 for women, a difference of 61.5%. Men with an educational attainment of bachelor's degree enjoy the highest average annual earnings of $250,001, while those with bachelor's degree education earn the least with $250,001. Women with an educational attainment of bachelor's degree earn the most with the average annual earnings of $147,857, while those with bachelor's degree education have the smallest earnings of $147,857.
| Educational Attainment | Male Income | Female Income |
| Less than High School | - | - |
| High School Diploma | - | - |
| College or Associate's Degree | - | - |
| Bachelor's Degree | $250,001 | $147,857 |
| Graduate Degree | $250,001 | $0 |
| Total | $250,001 | $96,250 |
Family Income in West Hampton Dunes
Family Income Brackets in West Hampton Dunes
According to the West Hampton Dunes family income data, there are 35 families falling into the $200,000+ income range, which is the most common income bracket and makes up 77.8% of all families.
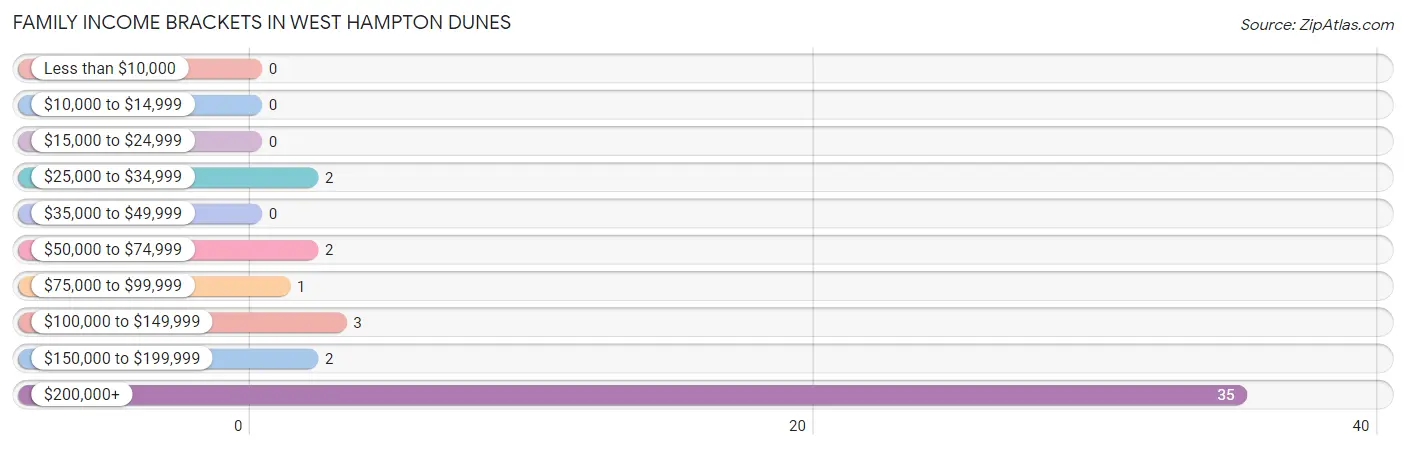
| Income Bracket | # Families | % Families |
| Less than $10,000 | 0 | 0.0% |
| $10,000 to $14,999 | 0 | 0.0% |
| $15,000 to $24,999 | 0 | 0.0% |
| $25,000 to $34,999 | 2 | 4.4% |
| $35,000 to $49,999 | 0 | 0.0% |
| $50,000 to $74,999 | 2 | 4.4% |
| $75,000 to $99,999 | 1 | 2.2% |
| $100,000 to $149,999 | 3 | 6.7% |
| $150,000 to $199,999 | 2 | 4.4% |
| $200,000+ | 35 | 77.8% |
Family Income by Famaliy Size in West Hampton Dunes
2-person families (23 | 51.1%) account for the highest median family income in West Hampton Dunes with $250,001 per family, while 2-person families (23 | 51.1%) have the highest median income of $125,000 per family member.
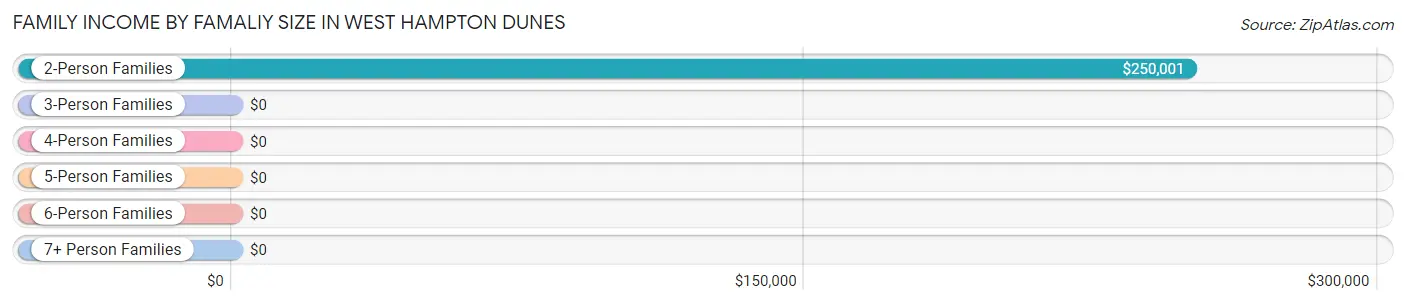
| Income Bracket | # Families | Median Income |
| 2-Person Families | 23 (51.1%) | $250,001 |
| 3-Person Families | 8 (17.8%) | $0 |
| 4-Person Families | 14 (31.1%) | $0 |
| 5-Person Families | 0 (0.0%) | $0 |
| 6-Person Families | 0 (0.0%) | $0 |
| 7+ Person Families | 0 (0.0%) | $0 |
| Total | 45 (100.0%) | $250,001 |
Family Income by Number of Earners in West Hampton Dunes
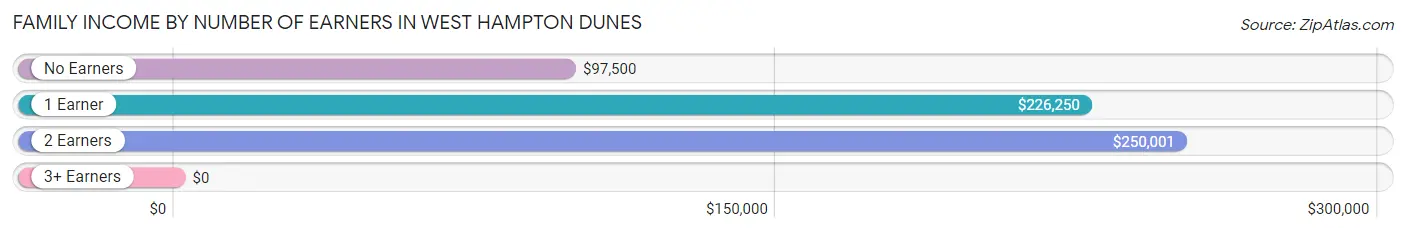
| Number of Earners | # Families | Median Income |
| No Earners | 6 (13.3%) | $97,500 |
| 1 Earner | 10 (22.2%) | $226,250 |
| 2 Earners | 23 (51.1%) | $250,001 |
| 3+ Earners | 6 (13.3%) | $0 |
| Total | 45 (100.0%) | $250,001 |
Household Income in West Hampton Dunes
Household Income Brackets in West Hampton Dunes
With 38 households falling in the category, the $200,000+ income range is the most frequent in West Hampton Dunes, accounting for 79.2% of all households.
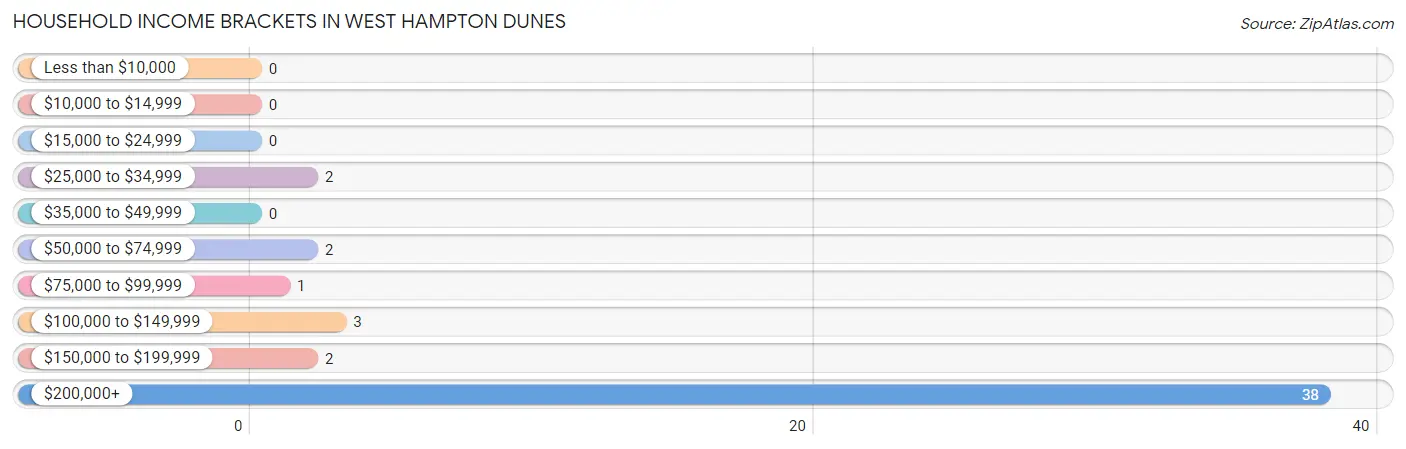
| Income Bracket | # Households | % Households |
| Less than $10,000 | 0 | 0.0% |
| $10,000 to $14,999 | 0 | 0.0% |
| $15,000 to $24,999 | 0 | 0.0% |
| $25,000 to $34,999 | 2 | 4.2% |
| $35,000 to $49,999 | 0 | 0.0% |
| $50,000 to $74,999 | 2 | 4.2% |
| $75,000 to $99,999 | 1 | 2.1% |
| $100,000 to $149,999 | 3 | 6.3% |
| $150,000 to $199,999 | 2 | 4.2% |
| $200,000+ | 38 | 79.2% |
Household Income by Householder Age in West Hampton Dunes
The median household income in West Hampton Dunes is $250,001, with the highest median household income of $250,001 found in the 45 to 64 years age bracket for the primary householder. A total of 30 households (62.5%) fall into this category.
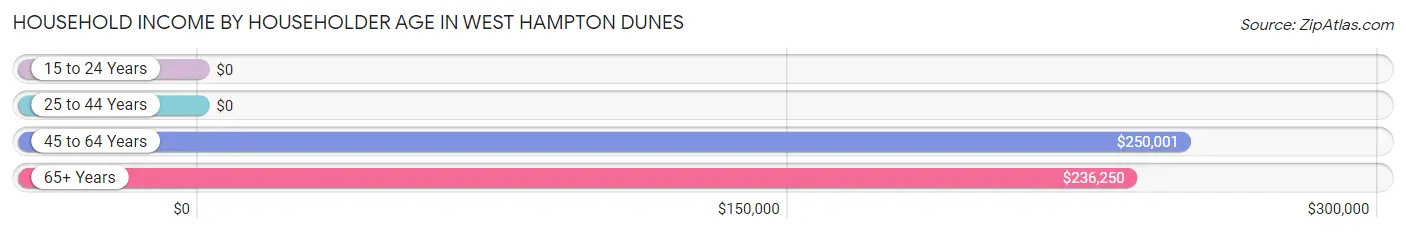
| Income Bracket | # Households | Median Income |
| 15 to 24 Years | 0 (0.0%) | $0 |
| 25 to 44 Years | 7 (14.6%) | $0 |
| 45 to 64 Years | 30 (62.5%) | $250,001 |
| 65+ Years | 11 (22.9%) | $236,250 |
| Total | 48 (100.0%) | $250,001 |
Poverty in West Hampton Dunes
Income Below Poverty by Sex and Age in West Hampton Dunes
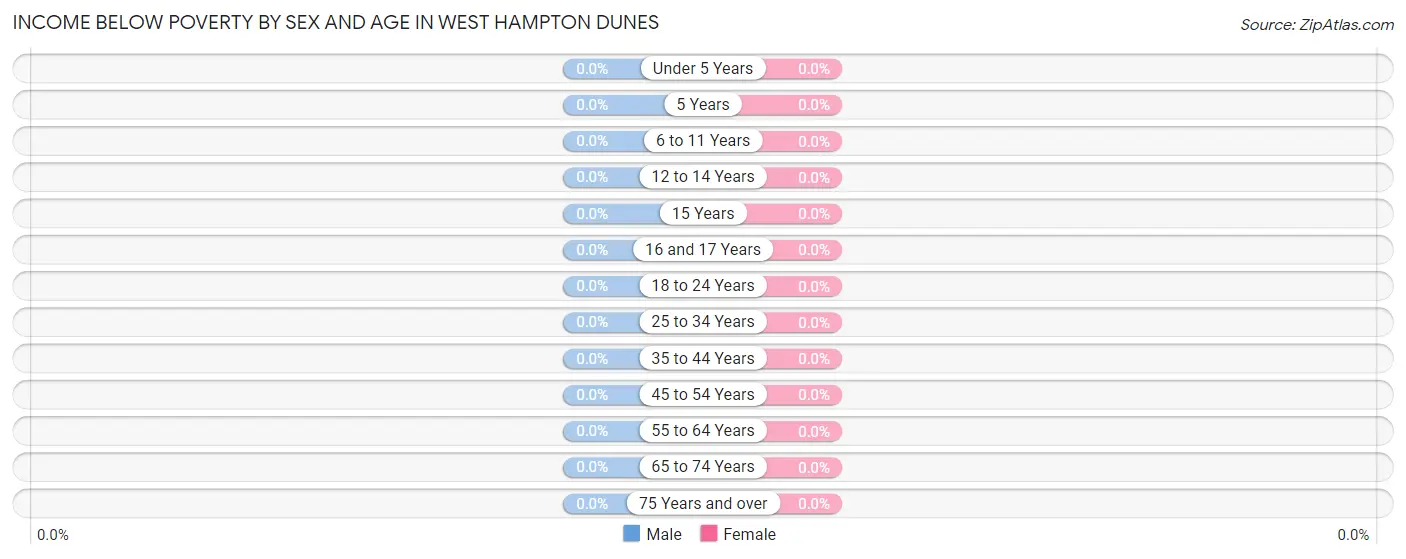
| Age Bracket | Male | Female |
| Under 5 Years | 0 (0.0%) | 0 (0.0%) |
| 5 Years | 0 (0.0%) | 0 (0.0%) |
| 6 to 11 Years | 0 (0.0%) | 0 (0.0%) |
| 12 to 14 Years | 0 (0.0%) | 0 (0.0%) |
| 15 Years | 0 (0.0%) | 0 (0.0%) |
| 16 and 17 Years | 0 (0.0%) | 0 (0.0%) |
| 18 to 24 Years | 0 (0.0%) | 0 (0.0%) |
| 25 to 34 Years | 0 (0.0%) | 0 (0.0%) |
| 35 to 44 Years | 0 (0.0%) | 0 (0.0%) |
| 45 to 54 Years | 0 (0.0%) | 0 (0.0%) |
| 55 to 64 Years | 0 (0.0%) | 0 (0.0%) |
| 65 to 74 Years | 0 (0.0%) | 0 (0.0%) |
| 75 Years and over | 0 (0.0%) | 0 (0.0%) |
| Total | 0 (0.0%) | 0 (0.0%) |
Income Above Poverty by Sex and Age in West Hampton Dunes
According to the poverty statistics in West Hampton Dunes, males aged under 5 years and females aged under 5 years are the age groups that are most secure financially, with 100.0% of males and 100.0% of females in these age groups living above the poverty line.
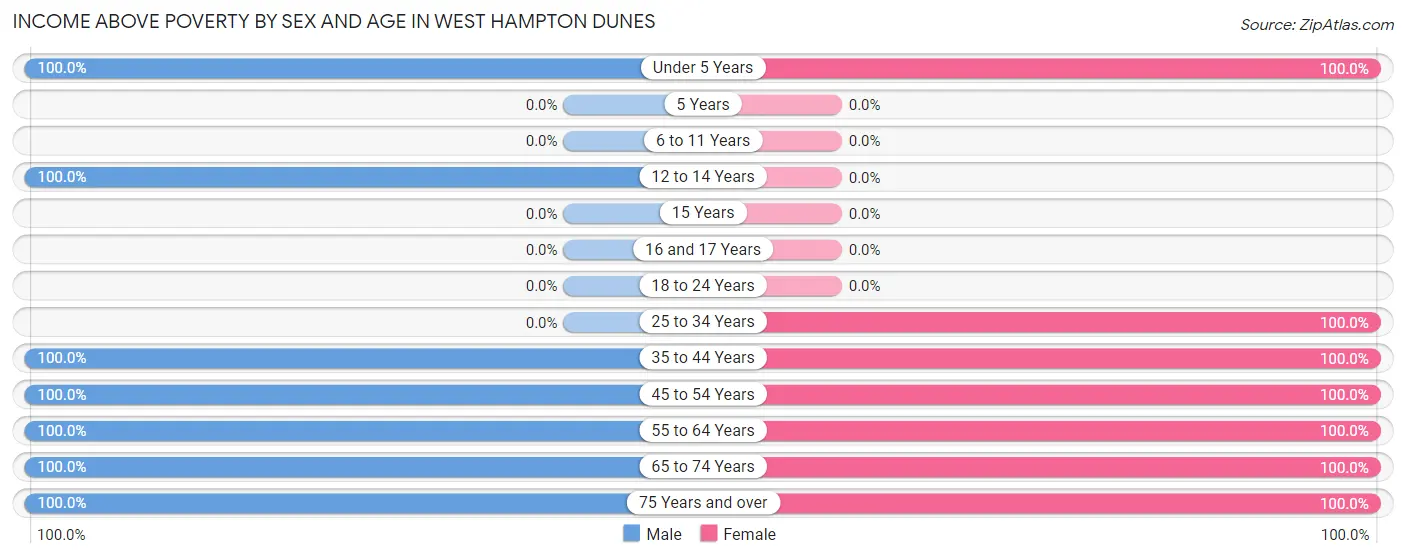
| Age Bracket | Male | Female |
| Under 5 Years | 7 (100.0%) | 7 (100.0%) |
| 5 Years | 0 (0.0%) | 0 (0.0%) |
| 6 to 11 Years | 0 (0.0%) | 0 (0.0%) |
| 12 to 14 Years | 2 (100.0%) | 0 (0.0%) |
| 15 Years | 0 (0.0%) | 0 (0.0%) |
| 16 and 17 Years | 0 (0.0%) | 0 (0.0%) |
| 18 to 24 Years | 0 (0.0%) | 0 (0.0%) |
| 25 to 34 Years | 0 (0.0%) | 24 (100.0%) |
| 35 to 44 Years | 7 (100.0%) | 7 (100.0%) |
| 45 to 54 Years | 2 (100.0%) | 5 (100.0%) |
| 55 to 64 Years | 25 (100.0%) | 23 (100.0%) |
| 65 to 74 Years | 6 (100.0%) | 7 (100.0%) |
| 75 Years and over | 6 (100.0%) | 2 (100.0%) |
| Total | 55 (100.0%) | 75 (100.0%) |
Income Below Poverty Among Married-Couple Families in West Hampton Dunes
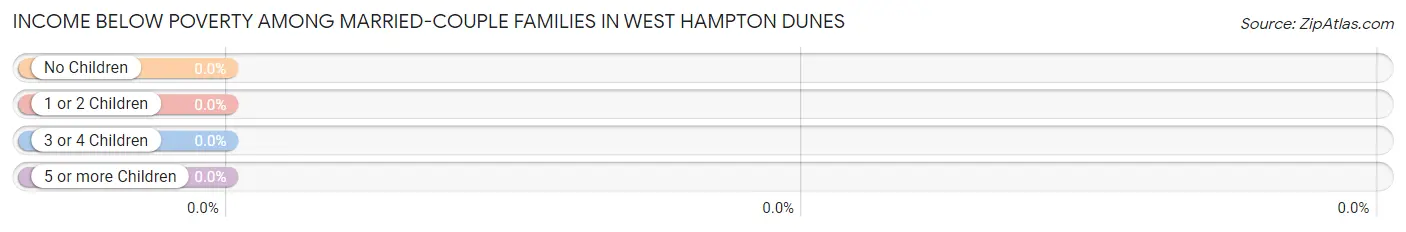
| Children | Above Poverty | Below Poverty |
| No Children | 34 (100.0%) | 0 (0.0%) |
| 1 or 2 Children | 9 (100.0%) | 0 (0.0%) |
| 3 or 4 Children | 0 (0.0%) | 0 (0.0%) |
| 5 or more Children | 0 (0.0%) | 0 (0.0%) |
| Total | 43 (100.0%) | 0 (0.0%) |
Income Below Poverty Among Single-Parent Households in West Hampton Dunes
| Children | Single Father | Single Mother |
| No Children | 0 (0.0%) | 0 (0.0%) |
| 1 or 2 Children | 0 (0.0%) | 0 (0.0%) |
| 3 or 4 Children | 0 (0.0%) | 0 (0.0%) |
| 5 or more Children | 0 (0.0%) | 0 (0.0%) |
| Total | 0 (0.0%) | 0 (0.0%) |
Income Below Poverty Among Married-Couple vs Single-Parent Households in West Hampton Dunes
| Children | Married-Couple Families | Single-Parent Households |
| No Children | 0 (0.0%) | 0 (0.0%) |
| 1 or 2 Children | 0 (0.0%) | 0 (0.0%) |
| 3 or 4 Children | 0 (0.0%) | 0 (0.0%) |
| 5 or more Children | 0 (0.0%) | 0 (0.0%) |
| Total | 0 (0.0%) | 0 (0.0%) |
Race in West Hampton Dunes
The most populous races in West Hampton Dunes are , and White / Caucasian (130 | 100.0%).
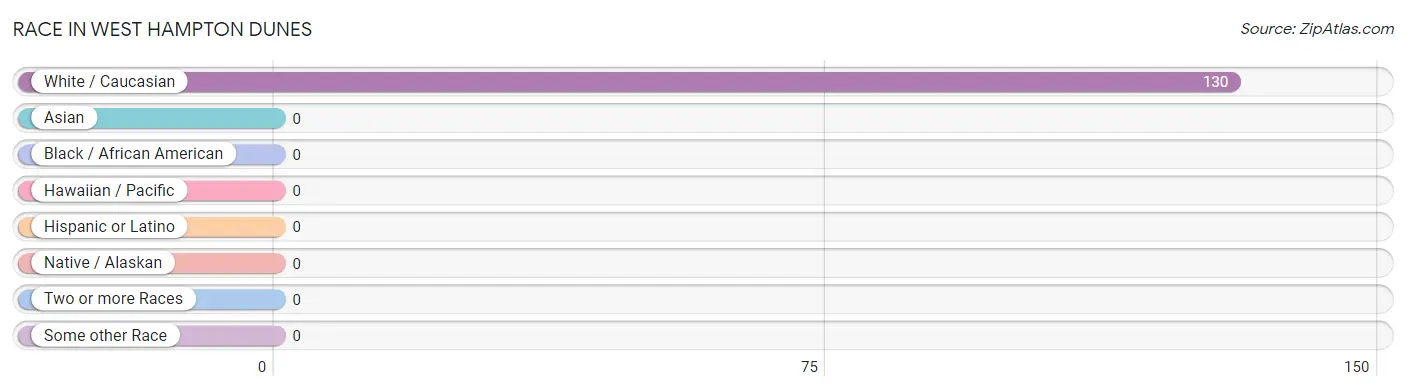
| Race | # Population | % Population |
| Asian | 0 | 0.0% |
| Black / African American | 0 | 0.0% |
| Hawaiian / Pacific | 0 | 0.0% |
| Hispanic or Latino | 0 | 0.0% |
| Native / Alaskan | 0 | 0.0% |
| White / Caucasian | 130 | 100.0% |
| Two or more Races | 0 | 0.0% |
| Some other Race | 0 | 0.0% |
| Total | 130 | 100.0% |
Ancestry in West Hampton Dunes
The most populous ancestries reported in West Hampton Dunes are Italian (39 | 30.0%), German (32 | 24.6%), English (25 | 19.2%), Polish (13 | 10.0%), and Irish (11 | 8.5%), together accounting for 92.3% of all West Hampton Dunes residents.
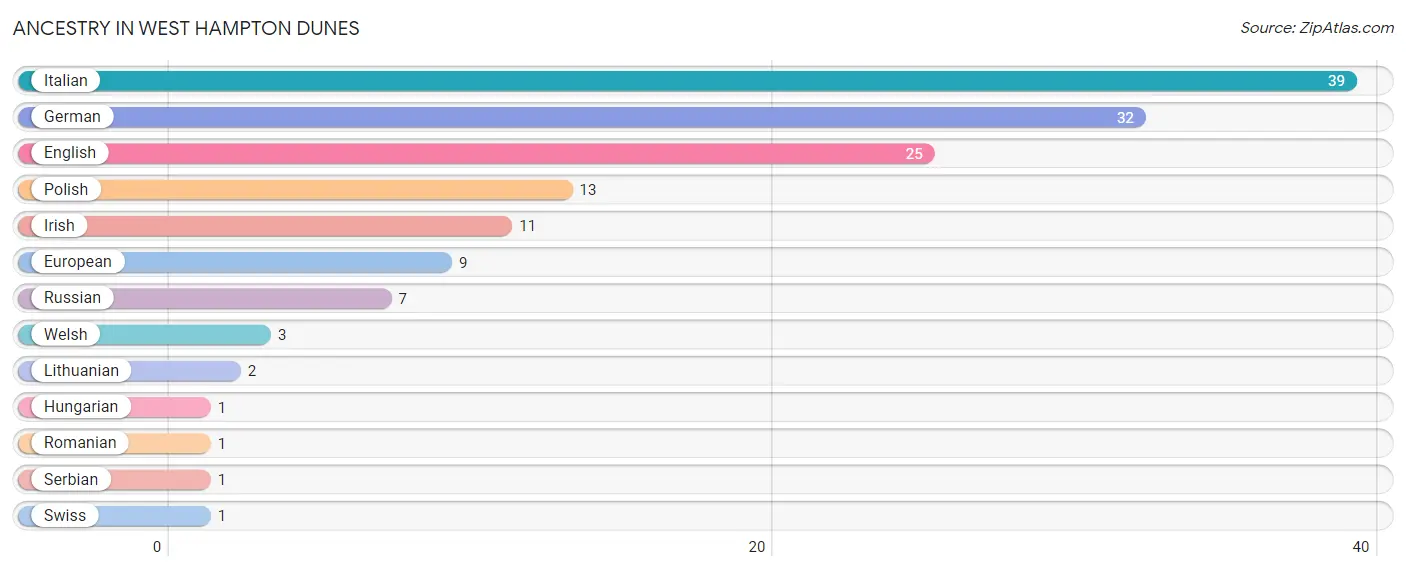
| Ancestry | # Population | % Population |
| English | 25 | 19.2% |
| European | 9 | 6.9% |
| German | 32 | 24.6% |
| Hungarian | 1 | 0.8% |
| Irish | 11 | 8.5% |
| Italian | 39 | 30.0% |
| Lithuanian | 2 | 1.5% |
| Polish | 13 | 10.0% |
| Romanian | 1 | 0.8% |
| Russian | 7 | 5.4% |
| Serbian | 1 | 0.8% |
| Swiss | 1 | 0.8% |
| Welsh | 3 | 2.3% | View All 13 Rows |
Immigrants in West Hampton Dunes
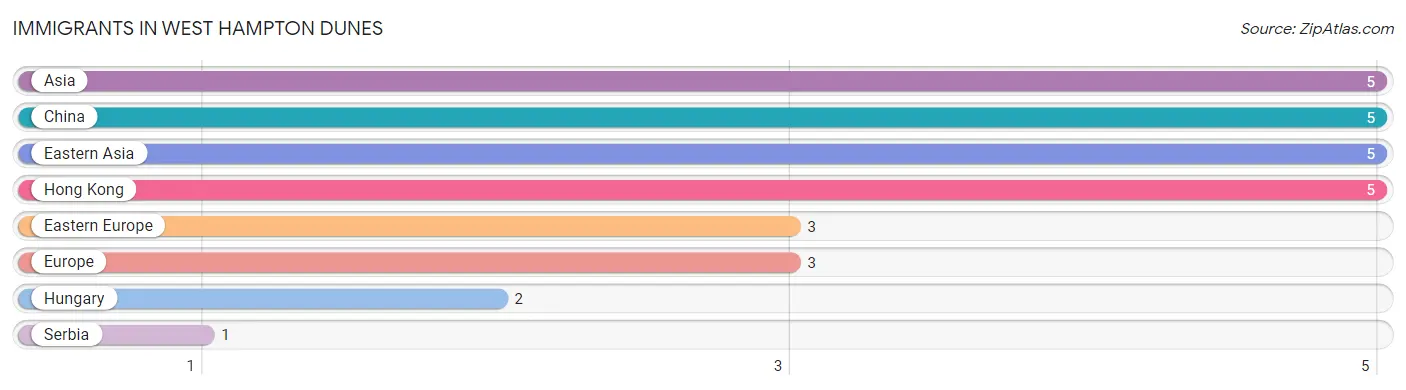
The most numerous immigrant groups reported in West Hampton Dunes came from Asia (5 | 3.8%), China (5 | 3.8%), Eastern Asia (5 | 3.8%), Hong Kong (5 | 3.8%), and Eastern Europe (3 | 2.3%), together accounting for 17.7% of all West Hampton Dunes residents.
| Immigration Origin | # Population | % Population |
| Asia | 5 | 3.8% |
| China | 5 | 3.8% |
| Eastern Asia | 5 | 3.8% |
| Eastern Europe | 3 | 2.3% |
| Europe | 3 | 2.3% |
| Hong Kong | 5 | 3.8% |
| Hungary | 2 | 1.5% |
| Serbia | 1 | 0.8% | View All 8 Rows |
Sex and Age in West Hampton Dunes
Sex and Age in West Hampton Dunes
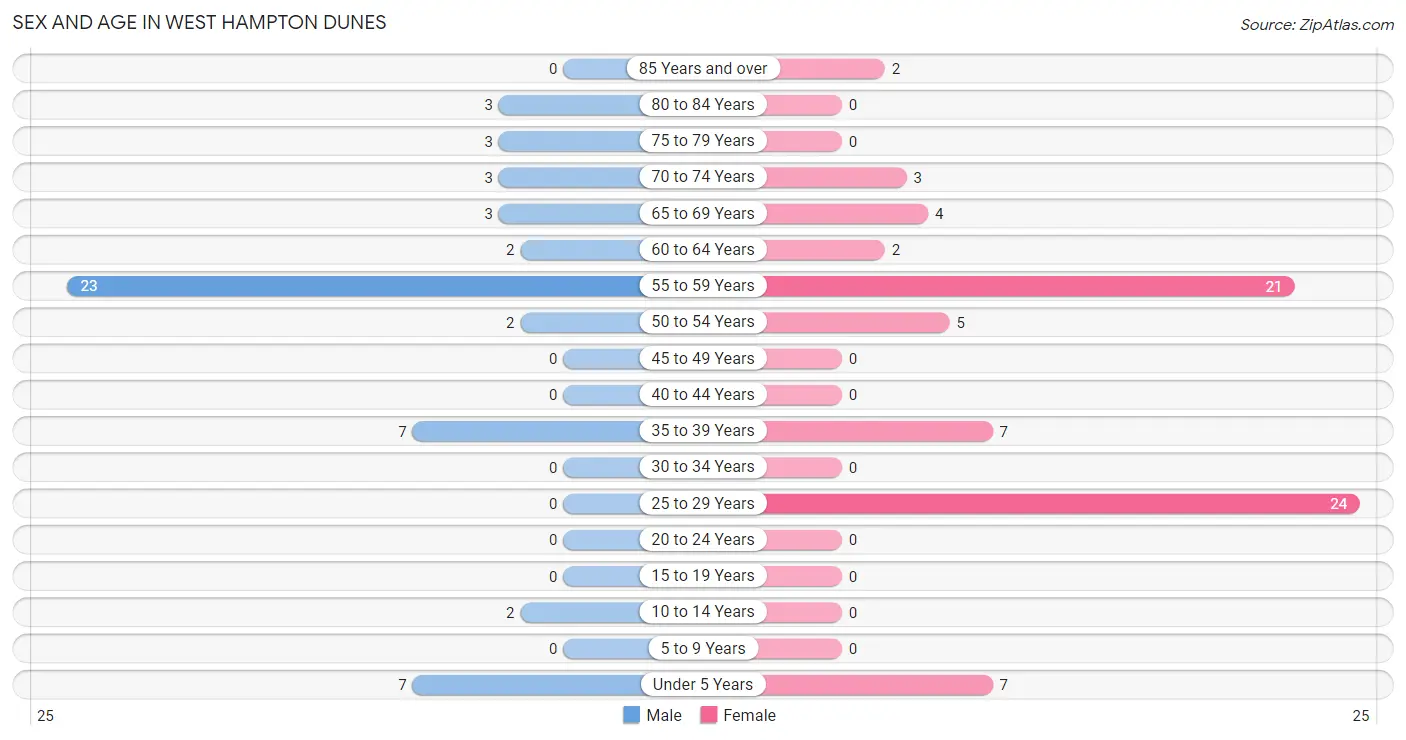
The most populous age groups in West Hampton Dunes are 55 to 59 Years (23 | 41.8%) for men and 25 to 29 Years (24 | 32.0%) for women.
| Age Bracket | Male | Female |
| Under 5 Years | 7 (12.7%) | 7 (9.3%) |
| 5 to 9 Years | 0 (0.0%) | 0 (0.0%) |
| 10 to 14 Years | 2 (3.6%) | 0 (0.0%) |
| 15 to 19 Years | 0 (0.0%) | 0 (0.0%) |
| 20 to 24 Years | 0 (0.0%) | 0 (0.0%) |
| 25 to 29 Years | 0 (0.0%) | 24 (32.0%) |
| 30 to 34 Years | 0 (0.0%) | 0 (0.0%) |
| 35 to 39 Years | 7 (12.7%) | 7 (9.3%) |
| 40 to 44 Years | 0 (0.0%) | 0 (0.0%) |
| 45 to 49 Years | 0 (0.0%) | 0 (0.0%) |
| 50 to 54 Years | 2 (3.6%) | 5 (6.7%) |
| 55 to 59 Years | 23 (41.8%) | 21 (28.0%) |
| 60 to 64 Years | 2 (3.6%) | 2 (2.7%) |
| 65 to 69 Years | 3 (5.4%) | 4 (5.3%) |
| 70 to 74 Years | 3 (5.4%) | 3 (4.0%) |
| 75 to 79 Years | 3 (5.4%) | 0 (0.0%) |
| 80 to 84 Years | 3 (5.4%) | 0 (0.0%) |
| 85 Years and over | 0 (0.0%) | 2 (2.7%) |
| Total | 55 (100.0%) | 75 (100.0%) |
Families and Households in West Hampton Dunes
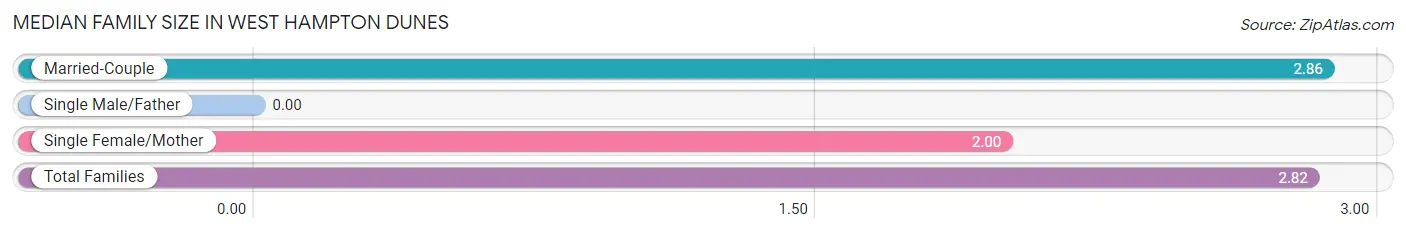
Median Family Size in West Hampton Dunes
| Family Type | # Families | Family Size |
| Married-Couple | 43 (95.6%) | 2.86 |
| Single Male/Father | 0 (0.0%) | - |
| Single Female/Mother | 2 (4.4%) | 2.00 |
| Total Families | 45 (100.0%) | 2.82 |
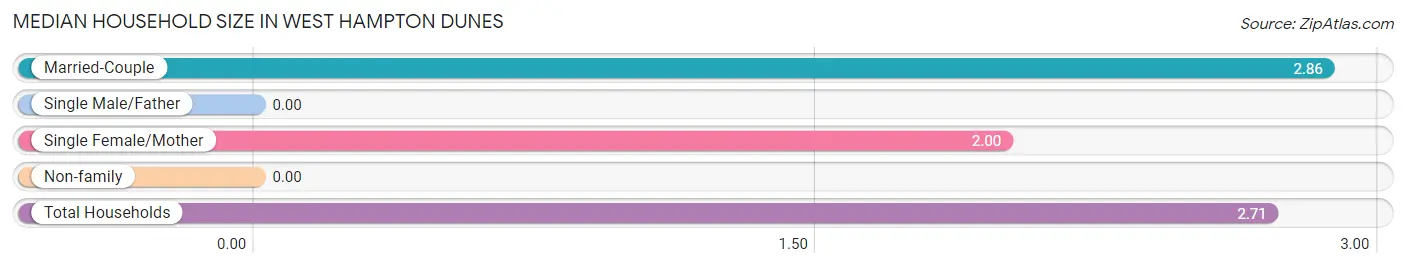
Median Household Size in West Hampton Dunes
| Household Type | # Households | Household Size |
| Married-Couple | 43 (89.6%) | 2.86 |
| Single Male/Father | 0 (0.0%) | - |
| Single Female/Mother | 2 (4.2%) | 2.00 |
| Non-family | 3 (6.2%) | - |
| Total Households | 48 (100.0%) | 2.71 |
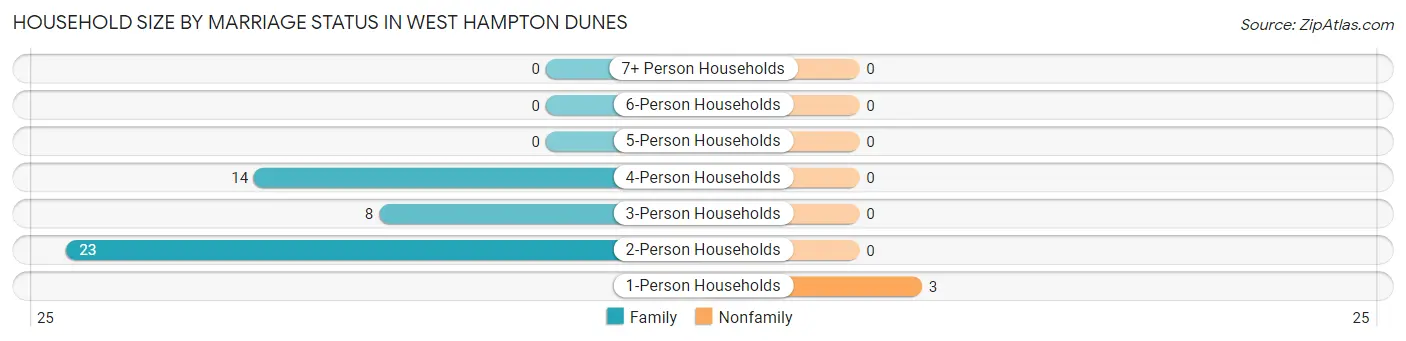
Household Size by Marriage Status in West Hampton Dunes
Out of a total of 48 households in West Hampton Dunes, 45 (93.8%) are family households, while 3 (6.2%) are nonfamily households. The most numerous type of family households are 2-person households, comprising 23, and the most common type of nonfamily households are 1-person households, comprising 3.
| Household Size | Family Households | Nonfamily Households |
| 1-Person Households | - | 3 (6.2%) |
| 2-Person Households | 23 (47.9%) | 0 (0.0%) |
| 3-Person Households | 8 (16.7%) | 0 (0.0%) |
| 4-Person Households | 14 (29.2%) | 0 (0.0%) |
| 5-Person Households | 0 (0.0%) | 0 (0.0%) |
| 6-Person Households | 0 (0.0%) | 0 (0.0%) |
| 7+ Person Households | 0 (0.0%) | 0 (0.0%) |
| Total | 45 (93.8%) | 3 (6.2%) |
Female Fertility in West Hampton Dunes
Fertility by Age in West Hampton Dunes
| Age Bracket | Women with Births | Births / 1,000 Women |
| 15 to 19 years | 0 (0.0%) | 0.0 |
| 20 to 34 years | 0 (0.0%) | 0.0 |
| 35 to 50 years | 0 (0.0%) | 0.0 |
| Total | 0 (0.0%) | 0.0 |
Fertility by Age by Marriage Status in West Hampton Dunes
| Age Bracket | Married | Unmarried |
| 15 to 19 years | 0 (0.0%) | 0 (0.0%) |
| 20 to 34 years | 0 (0.0%) | 0 (0.0%) |
| 35 to 50 years | 0 (0.0%) | 0 (0.0%) |
| Total | 0 (0.0%) | 0 (0.0%) |
Fertility by Education in West Hampton Dunes
| Educational Attainment | Women with Births | Births / 1,000 Women |
| Less than High School | 0 (0.0%) | 0.0 |
| High School Diploma | 0 (0.0%) | 0.0 |
| College or Associate's Degree | 0 (0.0%) | 0.0 |
| Bachelor's Degree | 0 (0.0%) | 0.0 |
| Graduate Degree | 0 (0.0%) | 0.0 |
| Total | 0 (0.0%) | 0.0 |
Fertility by Education by Marriage Status in West Hampton Dunes
| Educational Attainment | Married | Unmarried |
| Less than High School | 0 (0.0%) | 0 (0.0%) |
| High School Diploma | 0 (0.0%) | 0 (0.0%) |
| College or Associate's Degree | 0 (0.0%) | 0 (0.0%) |
| Bachelor's Degree | 0 (0.0%) | 0 (0.0%) |
| Graduate Degree | 0 (0.0%) | 0 (0.0%) |
| Total | 0 (0.0%) | 0 (0.0%) |
Employment Characteristics in West Hampton Dunes
Employment by Class of Employer in West Hampton Dunes
Among the 72 employed individuals in West Hampton Dunes, private company employees (69 | 95.8%), and self-employed (incorporated) (3 | 4.2%) make up the most common classes of employment.
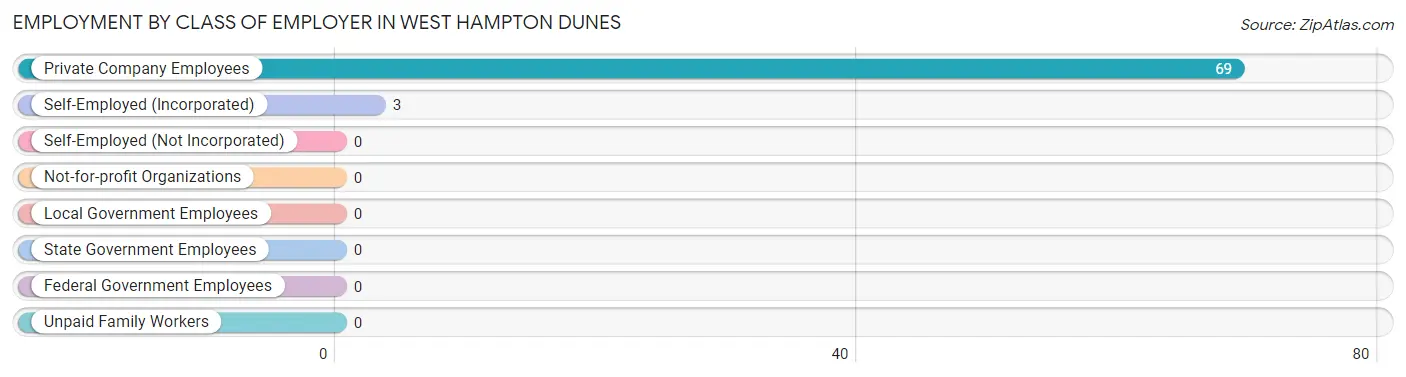
| Employer Class | # Employees | % Employees |
| Private Company Employees | 69 | 95.8% |
| Self-Employed (Incorporated) | 3 | 4.2% |
| Self-Employed (Not Incorporated) | 0 | 0.0% |
| Not-for-profit Organizations | 0 | 0.0% |
| Local Government Employees | 0 | 0.0% |
| State Government Employees | 0 | 0.0% |
| Federal Government Employees | 0 | 0.0% |
| Unpaid Family Workers | 0 | 0.0% |
| Total | 72 | 100.0% |
Employment Status by Age in West Hampton Dunes
According to the labor force statistics for West Hampton Dunes, out of the total population over 16 years of age (114), 64.0% or 73 individuals are in the labor force, with 1.4% or 1 of them unemployed. The age group with the highest labor force participation rate is 35 to 44 years, with 100.0% or 14 individuals in the labor force. Within the labor force, the 60 to 64 years age range has the highest percentage of unemployed individuals, with 33.3% or 1 of them being unemployed.
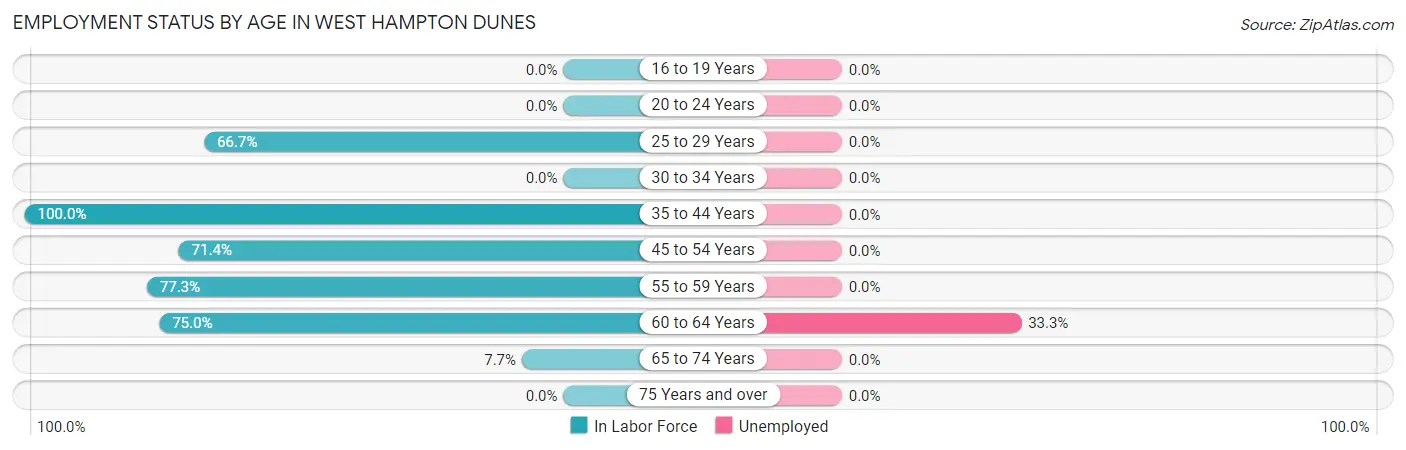
| Age Bracket | In Labor Force | Unemployed |
| 16 to 19 Years | 0 (0.0%) | 0 (0.0%) |
| 20 to 24 Years | 0 (0.0%) | 0 (0.0%) |
| 25 to 29 Years | 16 (66.7%) | 0 (0.0%) |
| 30 to 34 Years | 0 (0.0%) | 0 (0.0%) |
| 35 to 44 Years | 14 (100.0%) | 0 (0.0%) |
| 45 to 54 Years | 5 (71.4%) | 0 (0.0%) |
| 55 to 59 Years | 34 (77.3%) | 0 (0.0%) |
| 60 to 64 Years | 3 (75.0%) | 1 (33.3%) |
| 65 to 74 Years | 1 (7.7%) | 0 (0.0%) |
| 75 Years and over | 0 (0.0%) | 0 (0.0%) |
| Total | 73 (64.0%) | 1 (1.4%) |
Employment Status by Educational Attainment in West Hampton Dunes
According to labor force statistics for West Hampton Dunes, 77.4% of individuals (72) out of the total population between 25 and 64 years of age (93) are in the labor force, with 1.4% or 1 of them being unemployed. The group with the highest labor force participation rate are those with the educational attainment of college / associate degree, with 100.0% or 9 individuals in the labor force. Within the labor force, individuals with bachelor's degree or higher education have the highest percentage of unemployment, with 1.8% or 1 of them being unemployed.
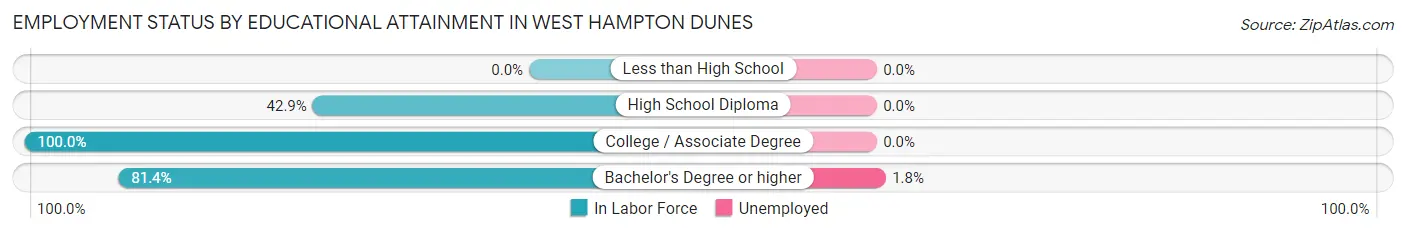
| Educational Attainment | In Labor Force | Unemployed |
| Less than High School | 0 (0.0%) | 0 (0.0%) |
| High School Diploma | 6 (42.9%) | 0 (0.0%) |
| College / Associate Degree | 9 (100.0%) | 0 (0.0%) |
| Bachelor's Degree or higher | 57 (81.4%) | 1 (1.8%) |
| Total | 72 (77.4%) | 1 (1.4%) |
Employment Occupations by Sex in West Hampton Dunes
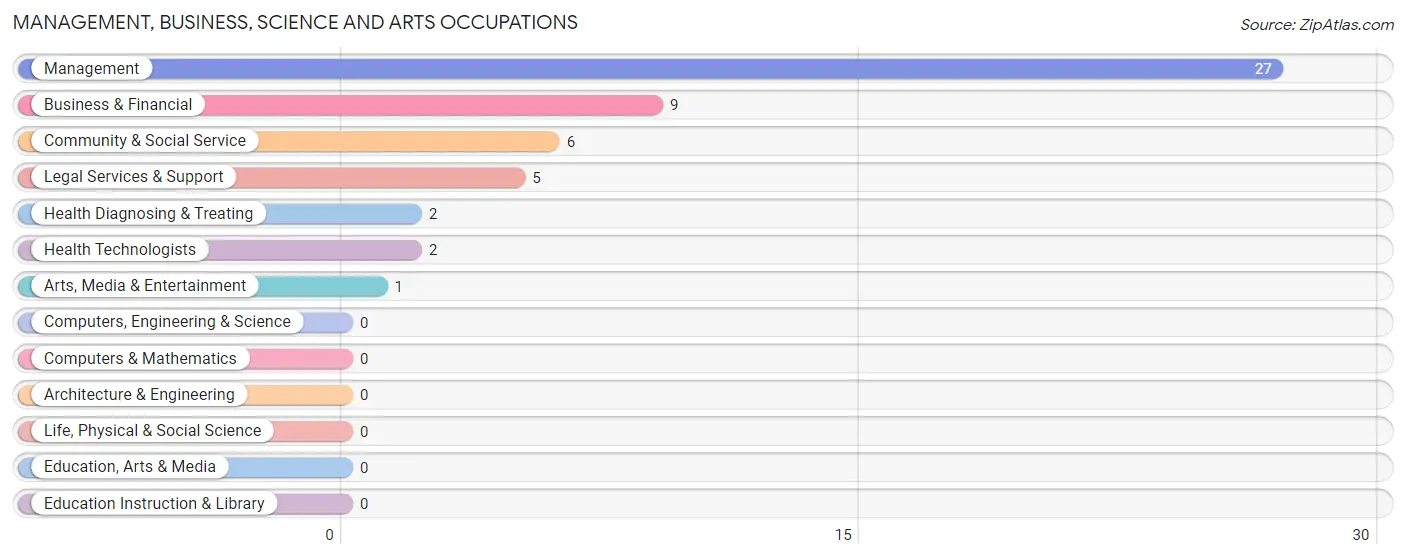
Management, Business, Science and Arts Occupations
The most common Management, Business, Science and Arts occupations in West Hampton Dunes are Management (27 | 37.5%), Business & Financial (9 | 12.5%), Community & Social Service (6 | 8.3%), Legal Services & Support (5 | 6.9%), and Health Diagnosing & Treating (2 | 2.8%).
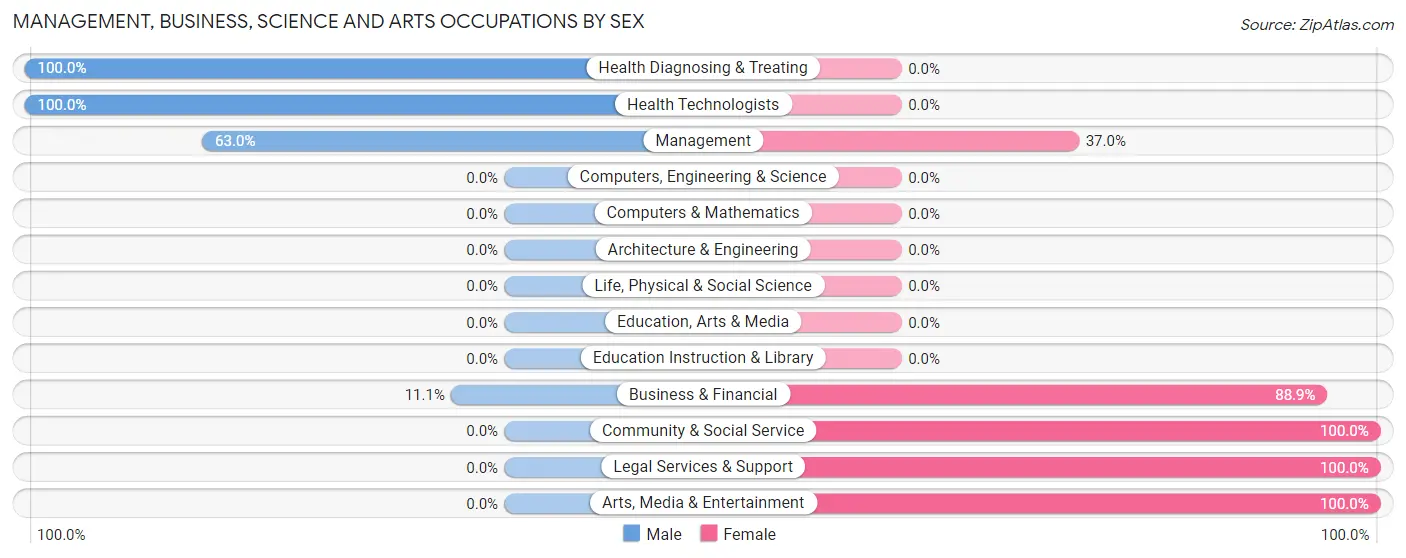
Management, Business, Science and Arts Occupations by Sex
Within the Management, Business, Science and Arts occupations in West Hampton Dunes, the most male-oriented occupations are Health Diagnosing & Treating (100.0%), Health Technologists (100.0%), and Management (63.0%), while the most female-oriented occupations are Community & Social Service (100.0%), Legal Services & Support (100.0%), and Arts, Media & Entertainment (100.0%).
| Occupation | Male | Female |
| Management | 17 (63.0%) | 10 (37.0%) |
| Business & Financial | 1 (11.1%) | 8 (88.9%) |
| Computers, Engineering & Science | 0 (0.0%) | 0 (0.0%) |
| Computers & Mathematics | 0 (0.0%) | 0 (0.0%) |
| Architecture & Engineering | 0 (0.0%) | 0 (0.0%) |
| Life, Physical & Social Science | 0 (0.0%) | 0 (0.0%) |
| Community & Social Service | 0 (0.0%) | 6 (100.0%) |
| Education, Arts & Media | 0 (0.0%) | 0 (0.0%) |
| Legal Services & Support | 0 (0.0%) | 5 (100.0%) |
| Education Instruction & Library | 0 (0.0%) | 0 (0.0%) |
| Arts, Media & Entertainment | 0 (0.0%) | 1 (100.0%) |
| Health Diagnosing & Treating | 2 (100.0%) | 0 (0.0%) |
| Health Technologists | 2 (100.0%) | 0 (0.0%) |
| Total (Category) | 20 (45.5%) | 24 (54.5%) |
| Total (Overall) | 33 (45.8%) | 39 (54.2%) |
Services Occupations
Services Occupations by Sex
| Occupation | Male | Female |
| Healthcare Support | 0 (0.0%) | 0 (0.0%) |
| Security & Protection | 0 (0.0%) | 0 (0.0%) |
| Firefighting & Prevention | 0 (0.0%) | 0 (0.0%) |
| Law Enforcement | 0 (0.0%) | 0 (0.0%) |
| Food Preparation & Serving | 0 (0.0%) | 0 (0.0%) |
| Cleaning & Maintenance | 0 (0.0%) | 0 (0.0%) |
| Personal Care & Service | 0 (0.0%) | 0 (0.0%) |
| Total (Category) | 0 (0.0%) | 0 (0.0%) |
| Total (Overall) | 33 (45.8%) | 39 (54.2%) |
Sales and Office Occupations
The most common Sales and Office occupations in West Hampton Dunes are Office & Administration (14 | 19.4%), and Sales & Related (6 | 8.3%).

Sales and Office Occupations by Sex

| Occupation | Male | Female |
| Sales & Related | 6 (100.0%) | 0 (0.0%) |
| Office & Administration | 7 (50.0%) | 7 (50.0%) |
| Total (Category) | 13 (65.0%) | 7 (35.0%) |
| Total (Overall) | 33 (45.8%) | 39 (54.2%) |
Natural Resources, Construction and Maintenance Occupations
Natural Resources, Construction and Maintenance Occupations by Sex
| Occupation | Male | Female |
| Farming, Fishing & Forestry | 0 (0.0%) | 0 (0.0%) |
| Construction & Extraction | 0 (0.0%) | 0 (0.0%) |
| Installation, Maintenance & Repair | 0 (0.0%) | 0 (0.0%) |
| Total (Category) | 0 (0.0%) | 0 (0.0%) |
| Total (Overall) | 33 (45.8%) | 39 (54.2%) |
Production, Transportation and Moving Occupations
The most common Production, Transportation and Moving occupations in West Hampton Dunes are , and Material Moving (8 | 11.1%).
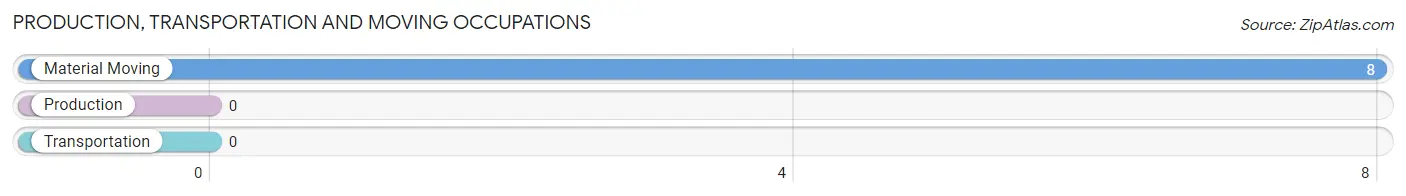
Production, Transportation and Moving Occupations by Sex
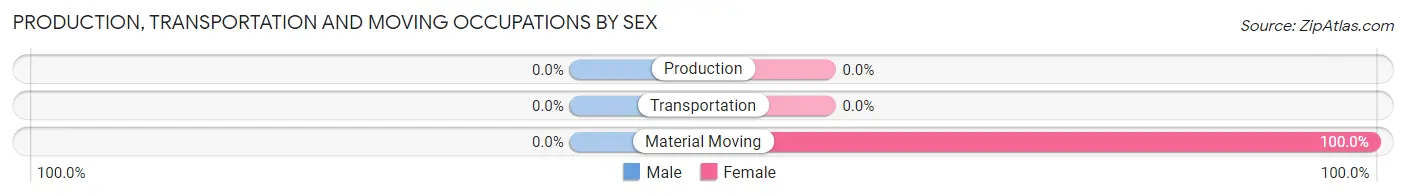
| Occupation | Male | Female |
| Production | 0 (0.0%) | 0 (0.0%) |
| Transportation | 0 (0.0%) | 0 (0.0%) |
| Material Moving | 0 (0.0%) | 8 (100.0%) |
| Total (Category) | 0 (0.0%) | 8 (100.0%) |
| Total (Overall) | 33 (45.8%) | 39 (54.2%) |
Employment Industries by Sex in West Hampton Dunes
Employment Industries in West Hampton Dunes
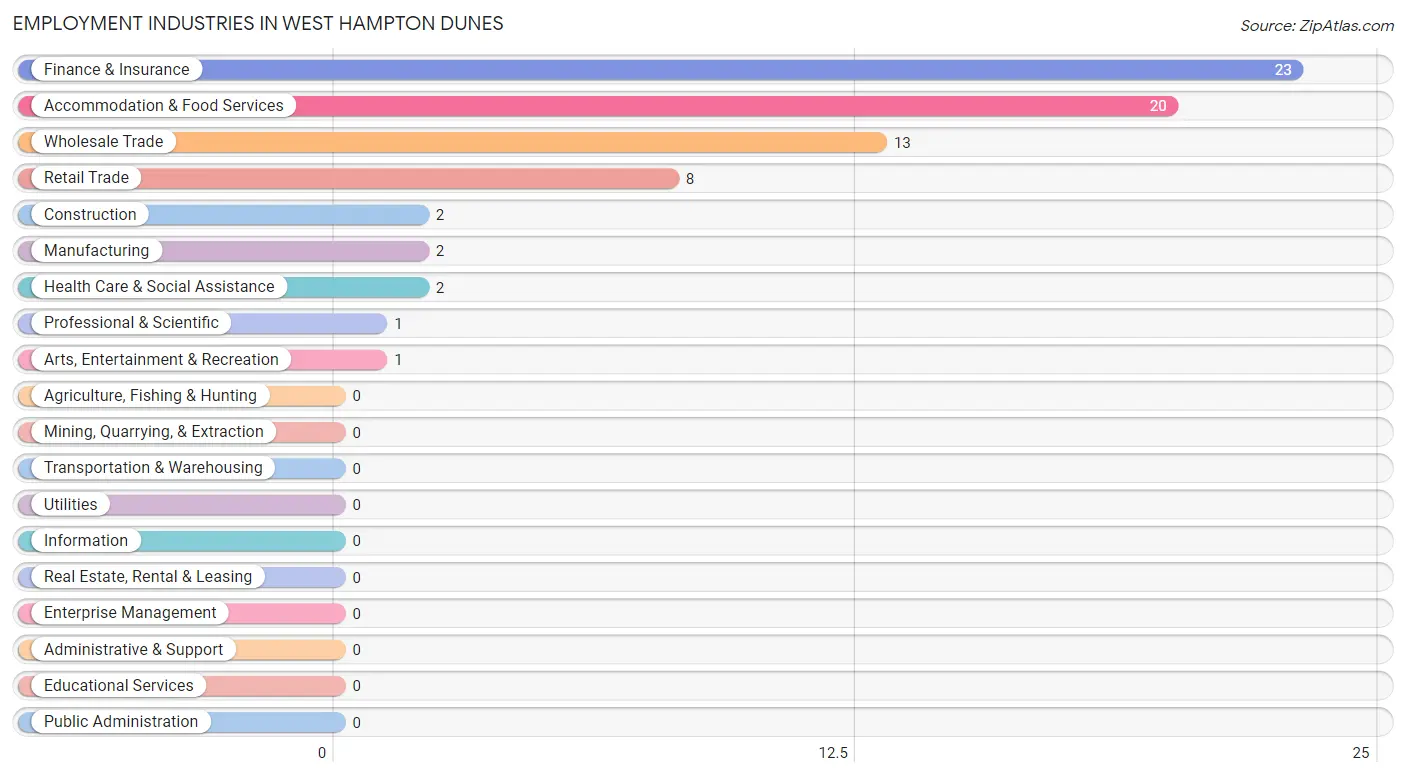
The major employment industries in West Hampton Dunes include Finance & Insurance (23 | 31.9%), Accommodation & Food Services (20 | 27.8%), Wholesale Trade (13 | 18.1%), Retail Trade (8 | 11.1%), and Construction (2 | 2.8%).
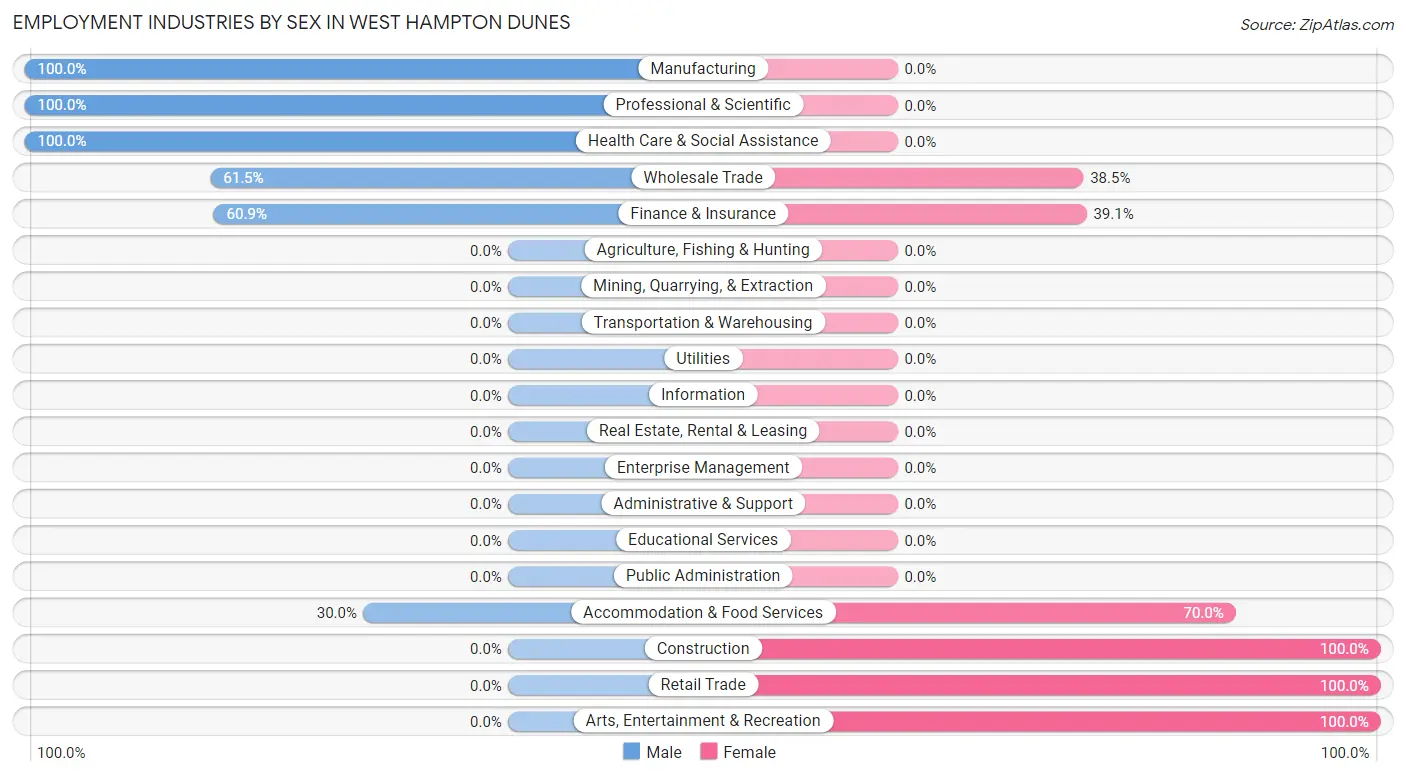
Employment Industries by Sex in West Hampton Dunes
The West Hampton Dunes industries that see more men than women are Manufacturing (100.0%), Professional & Scientific (100.0%), and Health Care & Social Assistance (100.0%), whereas the industries that tend to have a higher number of women are Construction (100.0%), Retail Trade (100.0%), and Arts, Entertainment & Recreation (100.0%).
| Industry | Male | Female |
| Agriculture, Fishing & Hunting | 0 (0.0%) | 0 (0.0%) |
| Mining, Quarrying, & Extraction | 0 (0.0%) | 0 (0.0%) |
| Construction | 0 (0.0%) | 2 (100.0%) |
| Manufacturing | 2 (100.0%) | 0 (0.0%) |
| Wholesale Trade | 8 (61.5%) | 5 (38.5%) |
| Retail Trade | 0 (0.0%) | 8 (100.0%) |
| Transportation & Warehousing | 0 (0.0%) | 0 (0.0%) |
| Utilities | 0 (0.0%) | 0 (0.0%) |
| Information | 0 (0.0%) | 0 (0.0%) |
| Finance & Insurance | 14 (60.9%) | 9 (39.1%) |
| Real Estate, Rental & Leasing | 0 (0.0%) | 0 (0.0%) |
| Professional & Scientific | 1 (100.0%) | 0 (0.0%) |
| Enterprise Management | 0 (0.0%) | 0 (0.0%) |
| Administrative & Support | 0 (0.0%) | 0 (0.0%) |
| Educational Services | 0 (0.0%) | 0 (0.0%) |
| Health Care & Social Assistance | 2 (100.0%) | 0 (0.0%) |
| Arts, Entertainment & Recreation | 0 (0.0%) | 1 (100.0%) |
| Accommodation & Food Services | 6 (30.0%) | 14 (70.0%) |
| Public Administration | 0 (0.0%) | 0 (0.0%) |
| Total | 33 (45.8%) | 39 (54.2%) |
Education in West Hampton Dunes
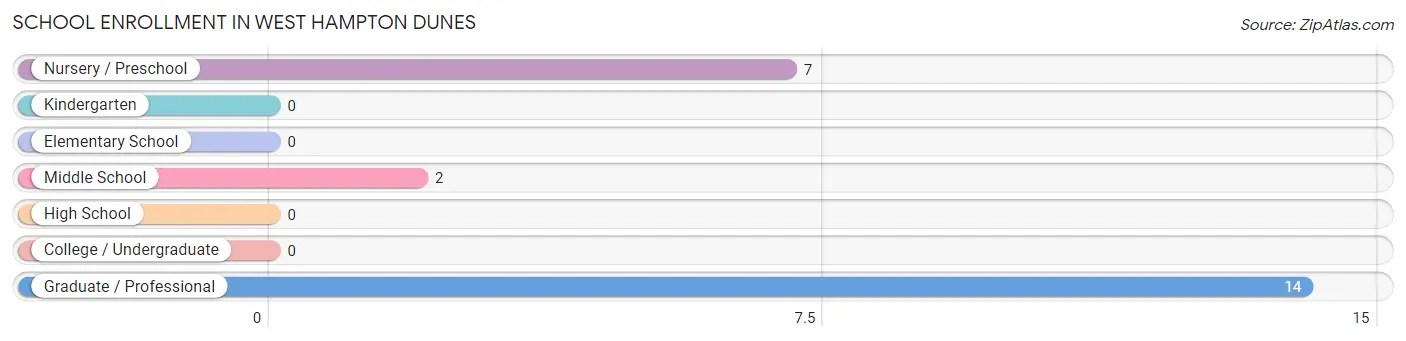
School Enrollment in West Hampton Dunes
The most common levels of schooling among the 23 students in West Hampton Dunes are graduate / professional (14 | 60.9%), nursery / preschool (7 | 30.4%), and middle school (2 | 8.7%).
| School Level | # Students | % Students |
| Nursery / Preschool | 7 | 30.4% |
| Kindergarten | 0 | 0.0% |
| Elementary School | 0 | 0.0% |
| Middle School | 2 | 8.7% |
| High School | 0 | 0.0% |
| College / Undergraduate | 0 | 0.0% |
| Graduate / Professional | 14 | 60.9% |
| Total | 23 | 100.0% |
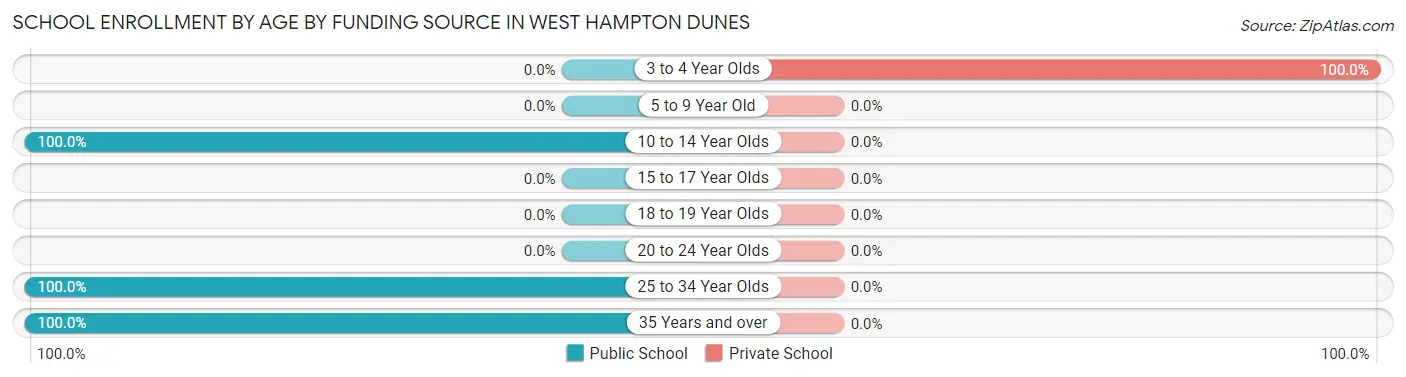
School Enrollment by Age by Funding Source in West Hampton Dunes
Out of a total of 23 students who are enrolled in schools in West Hampton Dunes, 7 (30.4%) attend a private institution, while the remaining 16 (69.6%) are enrolled in public schools. The age group of 3 to 4 year olds has the highest likelihood of being enrolled in private schools, with 7 (100.0% in the age bracket) enrolled. Conversely, the age group of 10 to 14 year olds has the lowest likelihood of being enrolled in a private school, with 2 (100.0% in the age bracket) attending a public institution.
| Age Bracket | Public School | Private School |
| 3 to 4 Year Olds | 0 (0.0%) | 7 (100.0%) |
| 5 to 9 Year Old | 0 (0.0%) | 0 (0.0%) |
| 10 to 14 Year Olds | 2 (100.0%) | 0 (0.0%) |
| 15 to 17 Year Olds | 0 (0.0%) | 0 (0.0%) |
| 18 to 19 Year Olds | 0 (0.0%) | 0 (0.0%) |
| 20 to 24 Year Olds | 0 (0.0%) | 0 (0.0%) |
| 25 to 34 Year Olds | 8 (100.0%) | 0 (0.0%) |
| 35 Years and over | 6 (100.0%) | 0 (0.0%) |
| Total | 16 (69.6%) | 7 (30.4%) |
Educational Attainment by Field of Study in West Hampton Dunes
Business (51 | 53.7%), social sciences (16 | 16.8%), education (7 | 7.4%), engineering (6 | 6.3%), and liberal arts & history (5 | 5.3%) are the most common fields of study among 95 individuals in West Hampton Dunes who have obtained a bachelor's degree or higher.
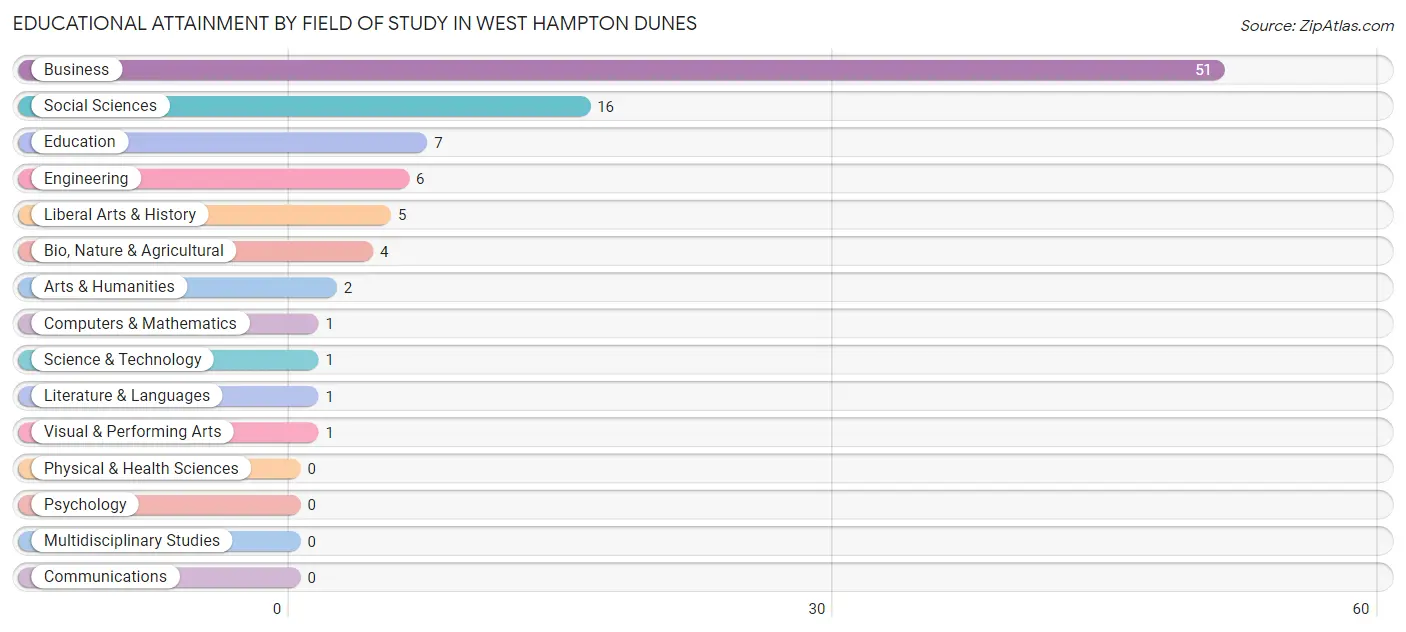
| Field of Study | # Graduates | % Graduates |
| Computers & Mathematics | 1 | 1.1% |
| Bio, Nature & Agricultural | 4 | 4.2% |
| Physical & Health Sciences | 0 | 0.0% |
| Psychology | 0 | 0.0% |
| Social Sciences | 16 | 16.8% |
| Engineering | 6 | 6.3% |
| Multidisciplinary Studies | 0 | 0.0% |
| Science & Technology | 1 | 1.1% |
| Business | 51 | 53.7% |
| Education | 7 | 7.4% |
| Literature & Languages | 1 | 1.1% |
| Liberal Arts & History | 5 | 5.3% |
| Visual & Performing Arts | 1 | 1.1% |
| Communications | 0 | 0.0% |
| Arts & Humanities | 2 | 2.1% |
| Total | 95 | 100.0% |
Transportation & Commute in West Hampton Dunes
Vehicle Availability by Sex in West Hampton Dunes
The most prevalent vehicle ownership categories in West Hampton Dunes are males with 2 vehicles (18, accounting for 54.5%) and females with 2 vehicles (25, making up 46.2%).
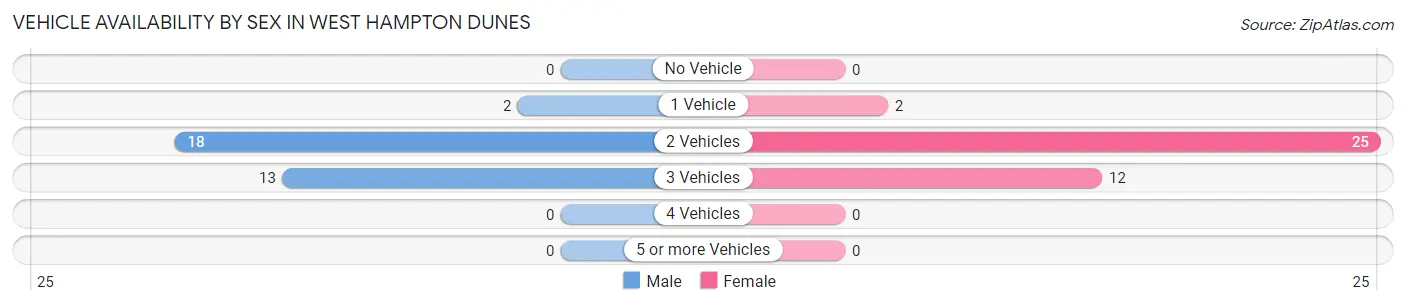
| Vehicles Available | Male | Female |
| No Vehicle | 0 (0.0%) | 0 (0.0%) |
| 1 Vehicle | 2 (6.1%) | 2 (5.1%) |
| 2 Vehicles | 18 (54.5%) | 25 (64.1%) |
| 3 Vehicles | 13 (39.4%) | 12 (30.8%) |
| 4 Vehicles | 0 (0.0%) | 0 (0.0%) |
| 5 or more Vehicles | 0 (0.0%) | 0 (0.0%) |
| Total | 33 (100.0%) | 39 (100.0%) |
Commute Time in West Hampton Dunes
The most frequently occuring commute durations in West Hampton Dunes are 60 to 89 minutes (19 commuters, 37.2%), 90 or more minutes (15 commuters, 29.4%), and 40 to 44 minutes (8 commuters, 15.7%).
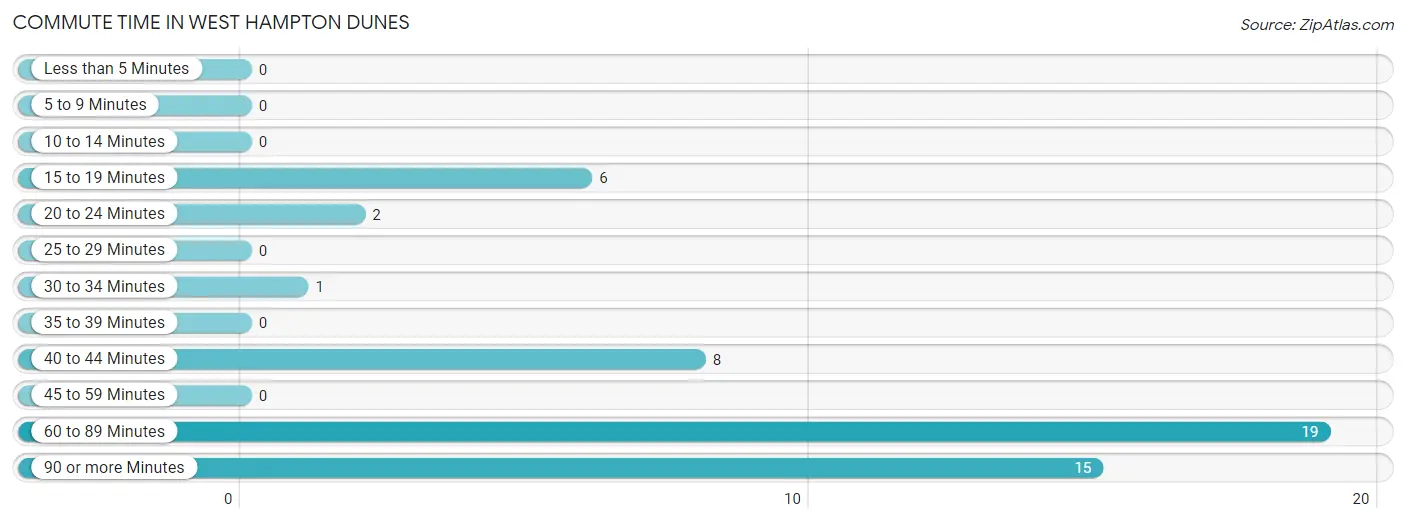
| Commute Time | # Commuters | % Commuters |
| Less than 5 Minutes | 0 | 0.0% |
| 5 to 9 Minutes | 0 | 0.0% |
| 10 to 14 Minutes | 0 | 0.0% |
| 15 to 19 Minutes | 6 | 11.8% |
| 20 to 24 Minutes | 2 | 3.9% |
| 25 to 29 Minutes | 0 | 0.0% |
| 30 to 34 Minutes | 1 | 2.0% |
| 35 to 39 Minutes | 0 | 0.0% |
| 40 to 44 Minutes | 8 | 15.7% |
| 45 to 59 Minutes | 0 | 0.0% |
| 60 to 89 Minutes | 19 | 37.2% |
| 90 or more Minutes | 15 | 29.4% |
Commute Time by Sex in West Hampton Dunes
The most common commute times in West Hampton Dunes are 60 to 89 minutes (19 commuters, 70.4%) for males and 40 to 44 minutes (8 commuters, 33.3%) for females.
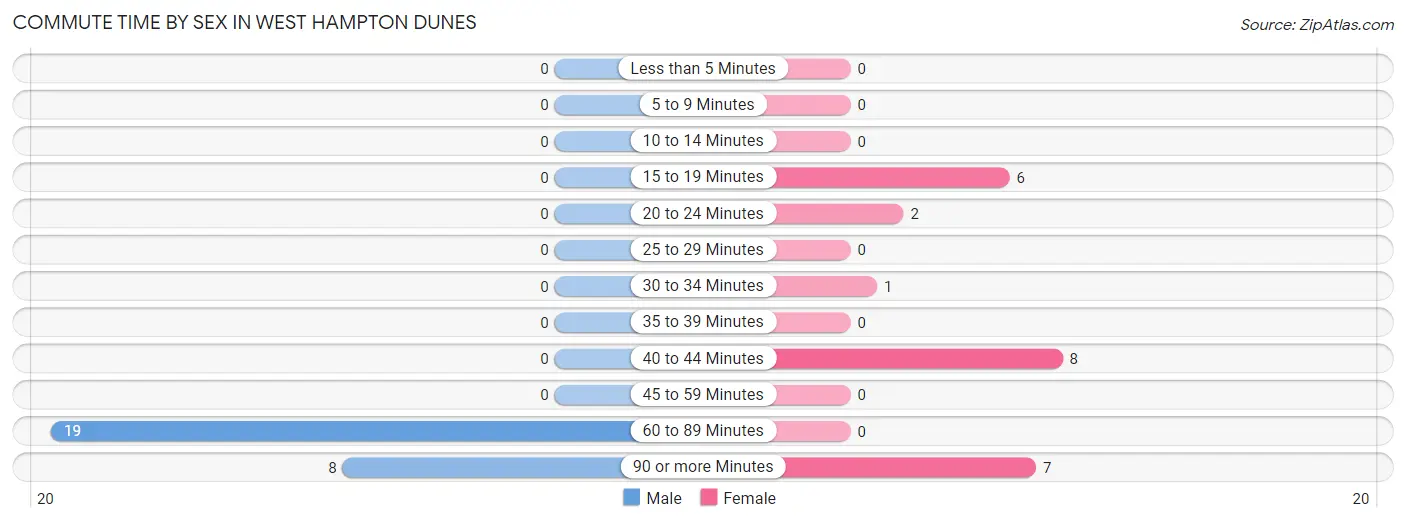
| Commute Time | Male | Female |
| Less than 5 Minutes | 0 (0.0%) | 0 (0.0%) |
| 5 to 9 Minutes | 0 (0.0%) | 0 (0.0%) |
| 10 to 14 Minutes | 0 (0.0%) | 0 (0.0%) |
| 15 to 19 Minutes | 0 (0.0%) | 6 (25.0%) |
| 20 to 24 Minutes | 0 (0.0%) | 2 (8.3%) |
| 25 to 29 Minutes | 0 (0.0%) | 0 (0.0%) |
| 30 to 34 Minutes | 0 (0.0%) | 1 (4.2%) |
| 35 to 39 Minutes | 0 (0.0%) | 0 (0.0%) |
| 40 to 44 Minutes | 0 (0.0%) | 8 (33.3%) |
| 45 to 59 Minutes | 0 (0.0%) | 0 (0.0%) |
| 60 to 89 Minutes | 19 (70.4%) | 0 (0.0%) |
| 90 or more Minutes | 8 (29.6%) | 7 (29.2%) |
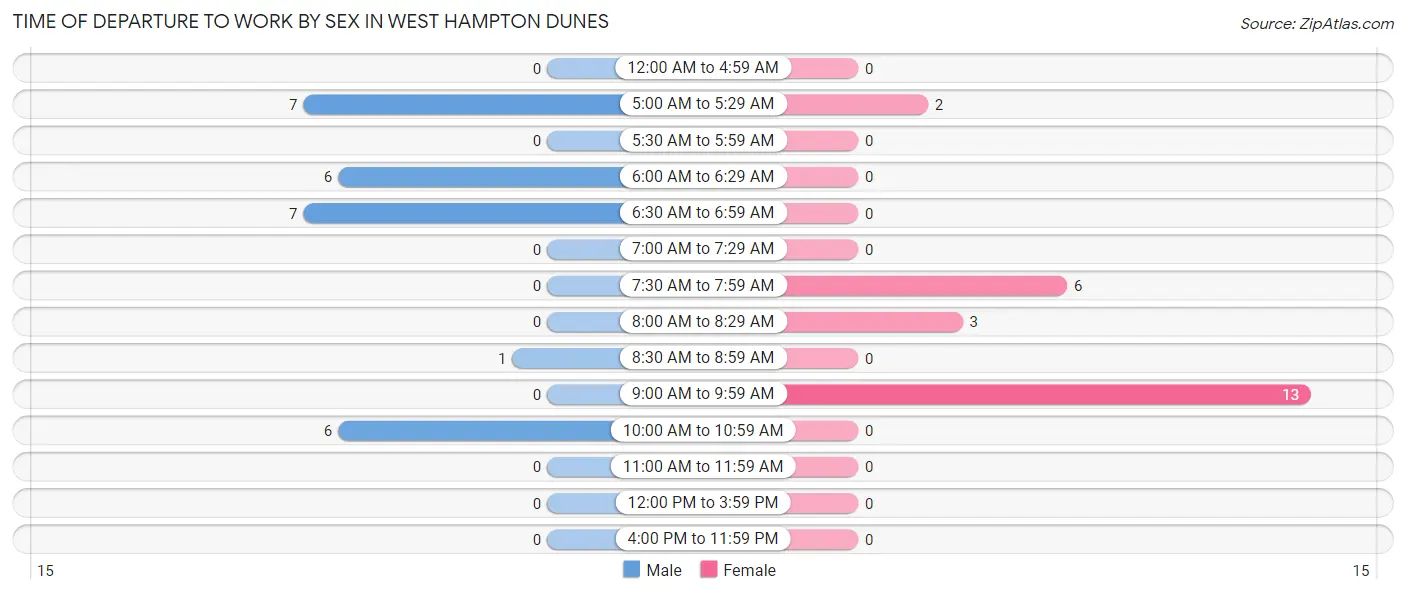
Time of Departure to Work by Sex in West Hampton Dunes
The most frequent times of departure to work in West Hampton Dunes are 5:00 AM to 5:29 AM (7, 25.9%) for males and 9:00 AM to 9:59 AM (13, 54.2%) for females.
| Time of Departure | Male | Female |
| 12:00 AM to 4:59 AM | 0 (0.0%) | 0 (0.0%) |
| 5:00 AM to 5:29 AM | 7 (25.9%) | 2 (8.3%) |
| 5:30 AM to 5:59 AM | 0 (0.0%) | 0 (0.0%) |
| 6:00 AM to 6:29 AM | 6 (22.2%) | 0 (0.0%) |
| 6:30 AM to 6:59 AM | 7 (25.9%) | 0 (0.0%) |
| 7:00 AM to 7:29 AM | 0 (0.0%) | 0 (0.0%) |
| 7:30 AM to 7:59 AM | 0 (0.0%) | 6 (25.0%) |
| 8:00 AM to 8:29 AM | 0 (0.0%) | 3 (12.5%) |
| 8:30 AM to 8:59 AM | 1 (3.7%) | 0 (0.0%) |
| 9:00 AM to 9:59 AM | 0 (0.0%) | 13 (54.2%) |
| 10:00 AM to 10:59 AM | 6 (22.2%) | 0 (0.0%) |
| 11:00 AM to 11:59 AM | 0 (0.0%) | 0 (0.0%) |
| 12:00 PM to 3:59 PM | 0 (0.0%) | 0 (0.0%) |
| 4:00 PM to 11:59 PM | 0 (0.0%) | 0 (0.0%) |
| Total | 27 (100.0%) | 24 (100.0%) |
Housing Occupancy in West Hampton Dunes
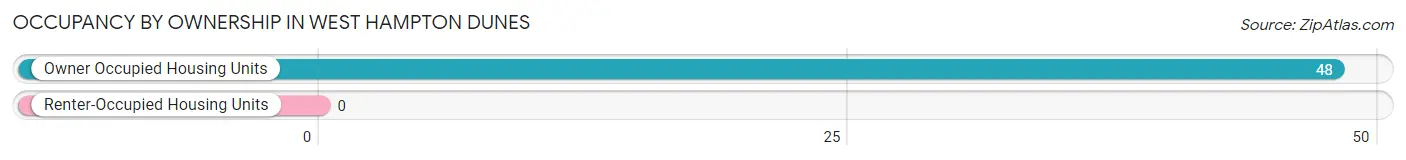
Occupancy by Ownership in West Hampton Dunes
Of the total 48 dwellings in West Hampton Dunes, owner-occupied units account for 48 (100.0%), while renter-occupied units make up 0 (0.0%).
| Occupancy | # Housing Units | % Housing Units |
| Owner Occupied Housing Units | 48 | 100.0% |
| Renter-Occupied Housing Units | 0 | 0.0% |
| Total Occupied Housing Units | 48 | 100.0% |
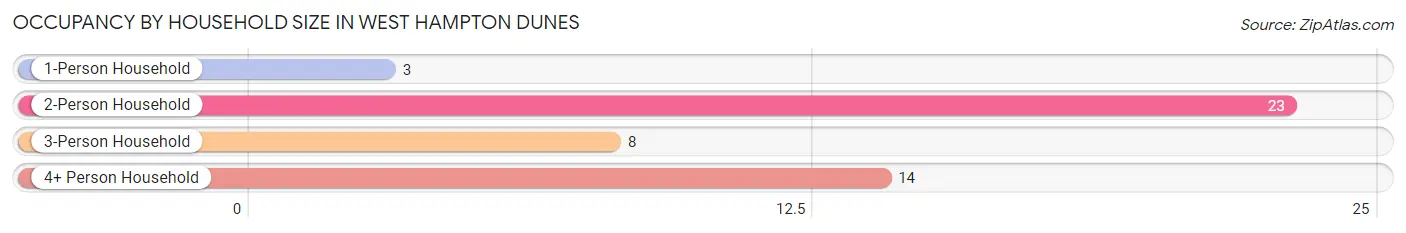
Occupancy by Household Size in West Hampton Dunes
| Household Size | # Housing Units | % Housing Units |
| 1-Person Household | 3 | 6.2% |
| 2-Person Household | 23 | 47.9% |
| 3-Person Household | 8 | 16.7% |
| 4+ Person Household | 14 | 29.2% |
| Total Housing Units | 48 | 100.0% |
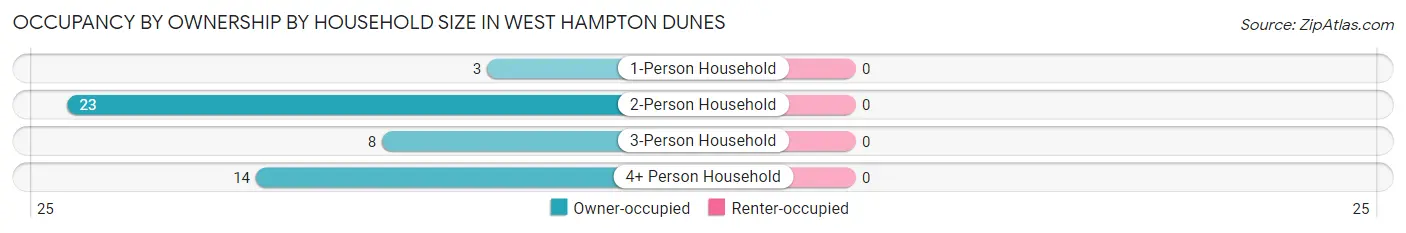
Occupancy by Ownership by Household Size in West Hampton Dunes
| Household Size | Owner-occupied | Renter-occupied |
| 1-Person Household | 3 (100.0%) | 0 (0.0%) |
| 2-Person Household | 23 (100.0%) | 0 (0.0%) |
| 3-Person Household | 8 (100.0%) | 0 (0.0%) |
| 4+ Person Household | 14 (100.0%) | 0 (0.0%) |
| Total Housing Units | 48 (100.0%) | 0 (0.0%) |
Occupancy by Educational Attainment in West Hampton Dunes
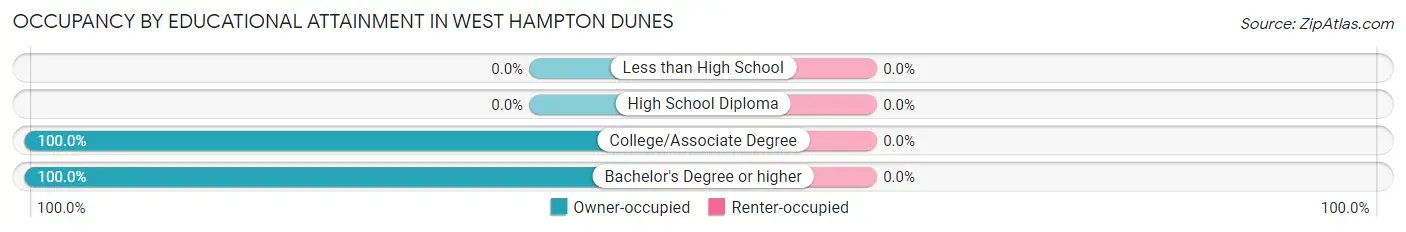
| Household Size | Owner-occupied | Renter-occupied |
| Less than High School | 0 (0.0%) | 0 (0.0%) |
| High School Diploma | 0 (0.0%) | 0 (0.0%) |
| College/Associate Degree | 1 (100.0%) | 0 (0.0%) |
| Bachelor's Degree or higher | 47 (100.0%) | 0 (0.0%) |
Occupancy by Age of Householder in West Hampton Dunes
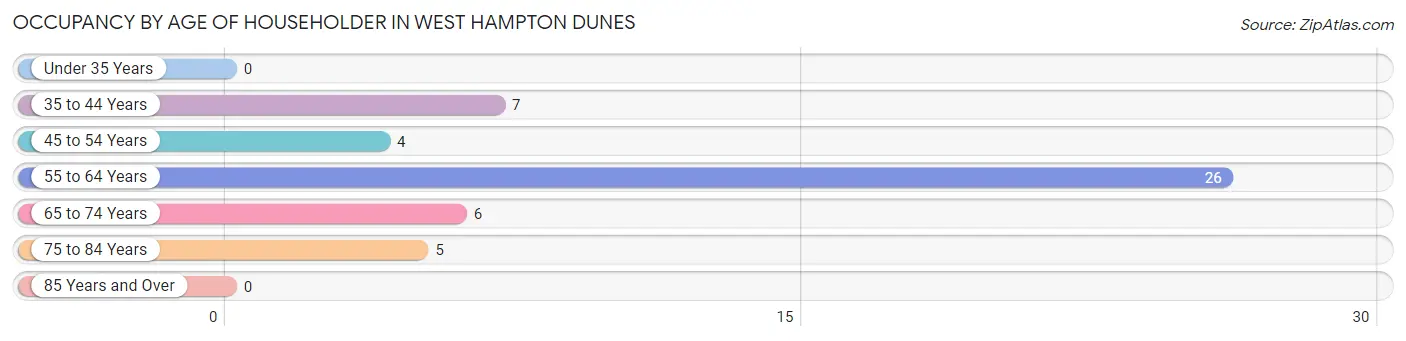
| Age Bracket | # Households | % Households |
| Under 35 Years | 0 | 0.0% |
| 35 to 44 Years | 7 | 14.6% |
| 45 to 54 Years | 4 | 8.3% |
| 55 to 64 Years | 26 | 54.2% |
| 65 to 74 Years | 6 | 12.5% |
| 75 to 84 Years | 5 | 10.4% |
| 85 Years and Over | 0 | 0.0% |
| Total | 48 | 100.0% |
Housing Finances in West Hampton Dunes
Median Income by Occupancy in West Hampton Dunes
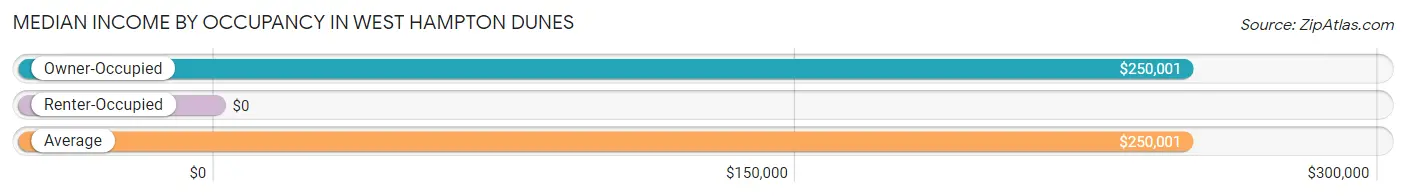
| Occupancy Type | # Households | Median Income |
| Owner-Occupied | 48 (100.0%) | $250,001 |
| Renter-Occupied | 0 (0.0%) | $0 |
| Average | 48 (100.0%) | $250,001 |
Occupancy by Householder Income Bracket in West Hampton Dunes
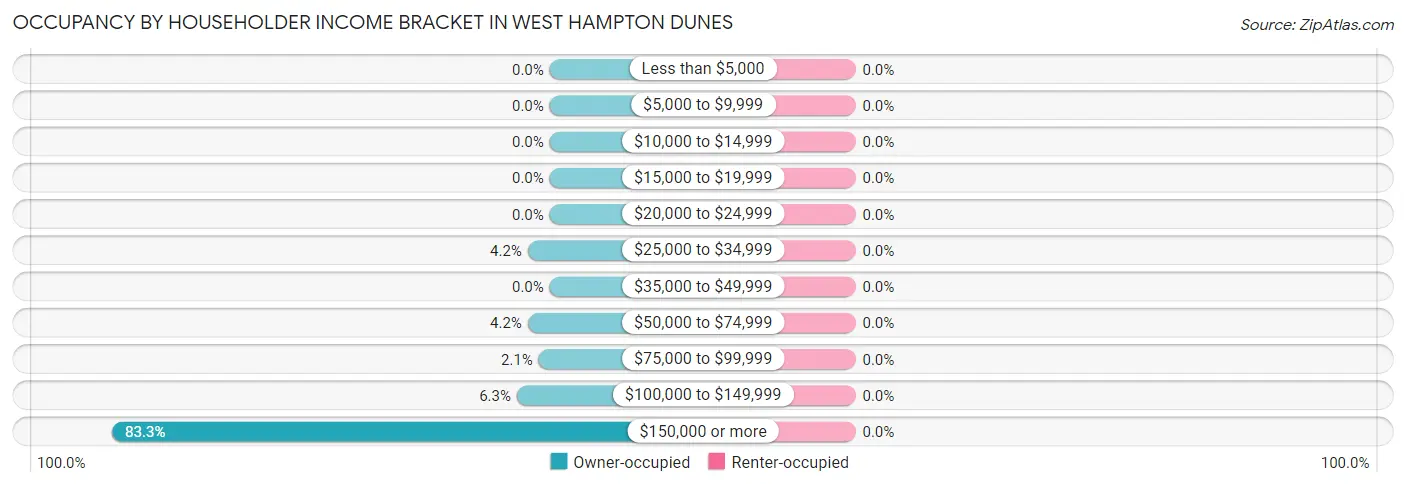
| Income Bracket | Owner-occupied | Renter-occupied |
| Less than $5,000 | 0 (0.0%) | 0 (0.0%) |
| $5,000 to $9,999 | 0 (0.0%) | 0 (0.0%) |
| $10,000 to $14,999 | 0 (0.0%) | 0 (0.0%) |
| $15,000 to $19,999 | 0 (0.0%) | 0 (0.0%) |
| $20,000 to $24,999 | 0 (0.0%) | 0 (0.0%) |
| $25,000 to $34,999 | 2 (4.2%) | 0 (0.0%) |
| $35,000 to $49,999 | 0 (0.0%) | 0 (0.0%) |
| $50,000 to $74,999 | 2 (4.2%) | 0 (0.0%) |
| $75,000 to $99,999 | 1 (2.1%) | 0 (0.0%) |
| $100,000 to $149,999 | 3 (6.2%) | 0 (0.0%) |
| $150,000 or more | 40 (83.3%) | 0 (0.0%) |
| Total | 48 (100.0%) | 0 (0.0%) |
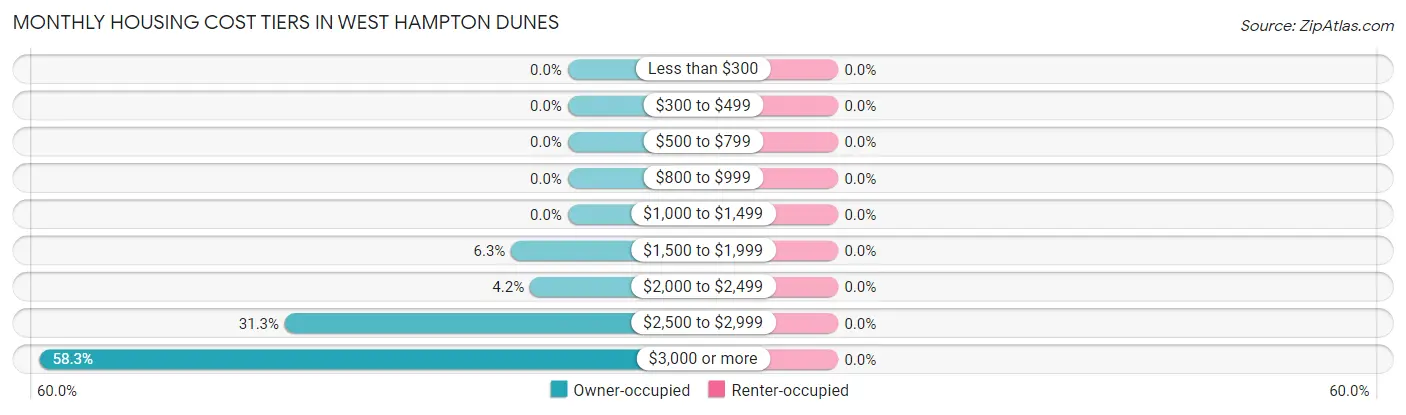
Monthly Housing Cost Tiers in West Hampton Dunes
| Monthly Cost | Owner-occupied | Renter-occupied |
| Less than $300 | 0 (0.0%) | 0 (0.0%) |
| $300 to $499 | 0 (0.0%) | 0 (0.0%) |
| $500 to $799 | 0 (0.0%) | 0 (0.0%) |
| $800 to $999 | 0 (0.0%) | 0 (0.0%) |
| $1,000 to $1,499 | 0 (0.0%) | 0 (0.0%) |
| $1,500 to $1,999 | 3 (6.2%) | 0 (0.0%) |
| $2,000 to $2,499 | 2 (4.2%) | 0 (0.0%) |
| $2,500 to $2,999 | 15 (31.2%) | 0 (0.0%) |
| $3,000 or more | 28 (58.3%) | 0 (0.0%) |
| Total | 48 (100.0%) | 0 (0.0%) |
Physical Housing Characteristics in West Hampton Dunes
Housing Structures in West Hampton Dunes
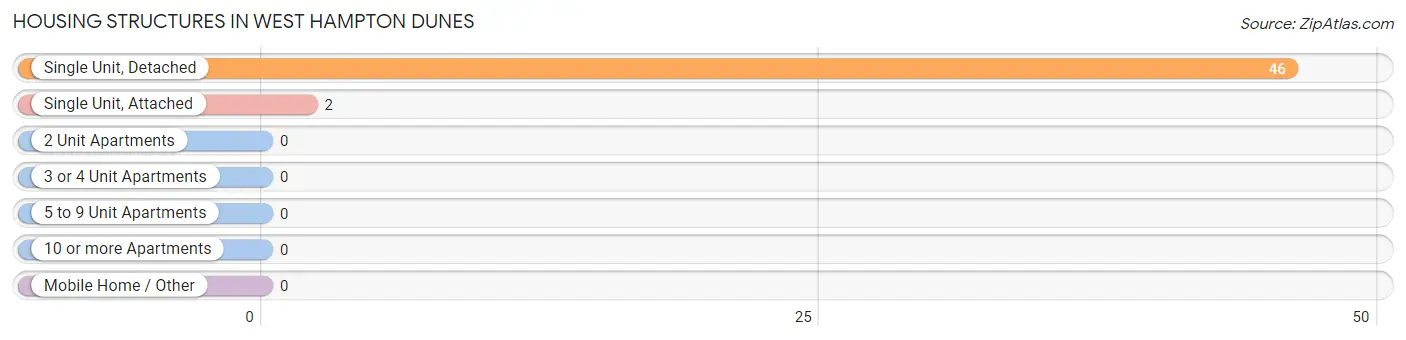
| Structure Type | # Housing Units | % Housing Units |
| Single Unit, Detached | 46 | 95.8% |
| Single Unit, Attached | 2 | 4.2% |
| 2 Unit Apartments | 0 | 0.0% |
| 3 or 4 Unit Apartments | 0 | 0.0% |
| 5 to 9 Unit Apartments | 0 | 0.0% |
| 10 or more Apartments | 0 | 0.0% |
| Mobile Home / Other | 0 | 0.0% |
| Total | 48 | 100.0% |
Housing Structures by Occupancy in West Hampton Dunes
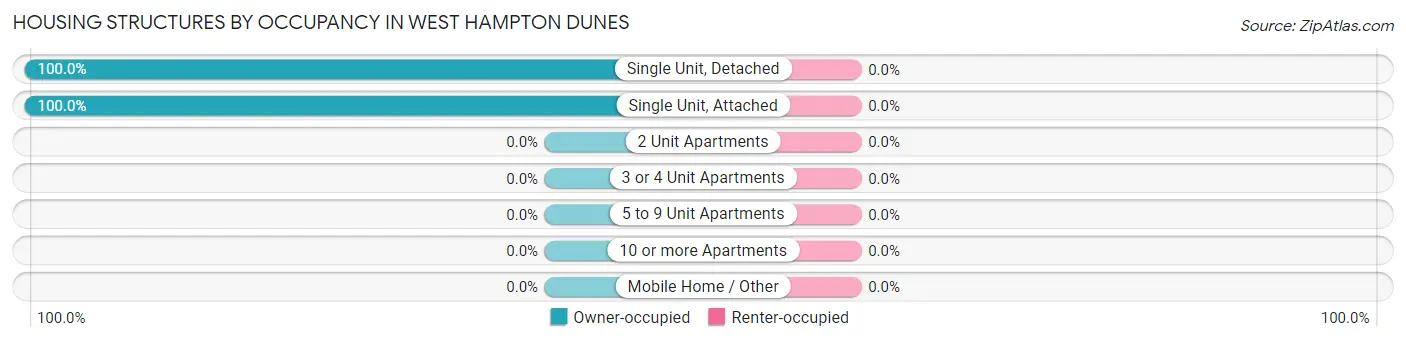
| Structure Type | Owner-occupied | Renter-occupied |
| Single Unit, Detached | 46 (100.0%) | 0 (0.0%) |
| Single Unit, Attached | 2 (100.0%) | 0 (0.0%) |
| 2 Unit Apartments | 0 (0.0%) | 0 (0.0%) |
| 3 or 4 Unit Apartments | 0 (0.0%) | 0 (0.0%) |
| 5 to 9 Unit Apartments | 0 (0.0%) | 0 (0.0%) |
| 10 or more Apartments | 0 (0.0%) | 0 (0.0%) |
| Mobile Home / Other | 0 (0.0%) | 0 (0.0%) |
| Total | 48 (100.0%) | 0 (0.0%) |
Housing Structures by Number of Rooms in West Hampton Dunes
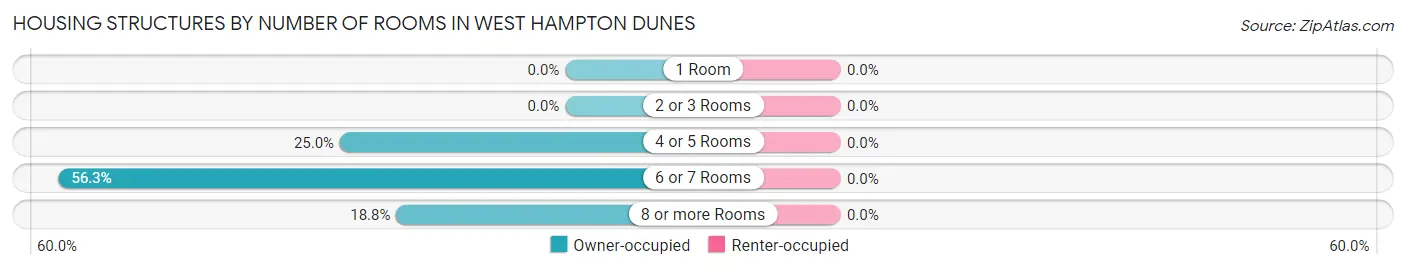
| Number of Rooms | Owner-occupied | Renter-occupied |
| 1 Room | 0 (0.0%) | 0 (0.0%) |
| 2 or 3 Rooms | 0 (0.0%) | 0 (0.0%) |
| 4 or 5 Rooms | 12 (25.0%) | 0 (0.0%) |
| 6 or 7 Rooms | 27 (56.2%) | 0 (0.0%) |
| 8 or more Rooms | 9 (18.8%) | 0 (0.0%) |
| Total | 48 (100.0%) | 0 (0.0%) |
Housing Structure by Heating Type in West Hampton Dunes
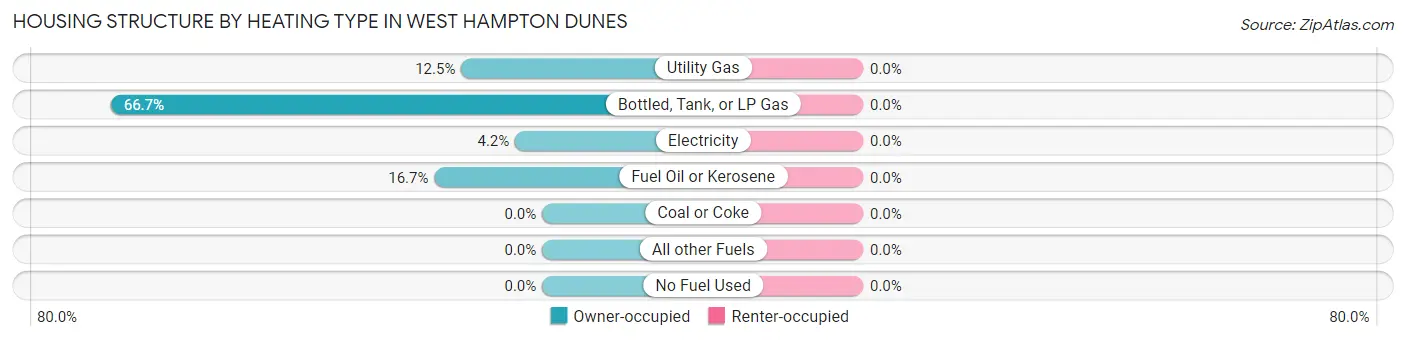
| Heating Type | Owner-occupied | Renter-occupied |
| Utility Gas | 6 (12.5%) | 0 (0.0%) |
| Bottled, Tank, or LP Gas | 32 (66.7%) | 0 (0.0%) |
| Electricity | 2 (4.2%) | 0 (0.0%) |
| Fuel Oil or Kerosene | 8 (16.7%) | 0 (0.0%) |
| Coal or Coke | 0 (0.0%) | 0 (0.0%) |
| All other Fuels | 0 (0.0%) | 0 (0.0%) |
| No Fuel Used | 0 (0.0%) | 0 (0.0%) |
| Total | 48 (100.0%) | 0 (0.0%) |
Household Vehicle Usage in West Hampton Dunes
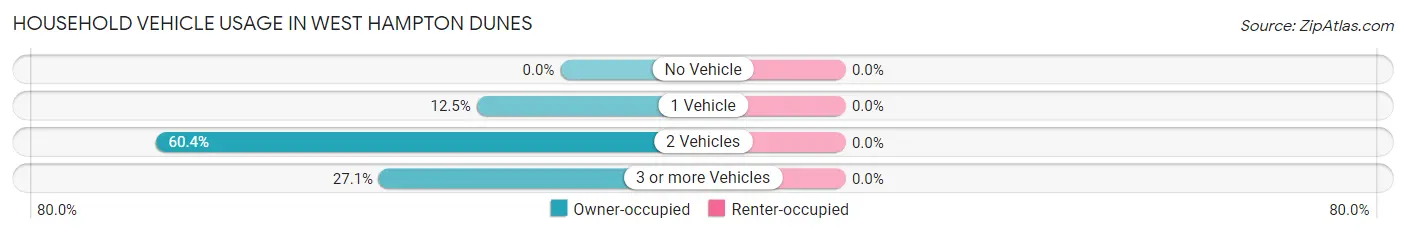
| Vehicles per Household | Owner-occupied | Renter-occupied |
| No Vehicle | 0 (0.0%) | 0 (0.0%) |
| 1 Vehicle | 6 (12.5%) | 0 (0.0%) |
| 2 Vehicles | 29 (60.4%) | 0 (0.0%) |
| 3 or more Vehicles | 13 (27.1%) | 0 (0.0%) |
| Total | 48 (100.0%) | 0 (0.0%) |
Real Estate & Mortgages in West Hampton Dunes
Real Estate and Mortgage Overview in West Hampton Dunes
| Characteristic | Without Mortgage | With Mortgage |
| Housing Units | 24 | 24 |
| Median Property Value | $2,000,001 | $2,000,001 |
| Median Household Income | $250,001 | $22 |
| Monthly Housing Costs | $1,501 | $22 |
| Real Estate Taxes | $10,001 | $0 |
Property Value by Mortgage Status in West Hampton Dunes
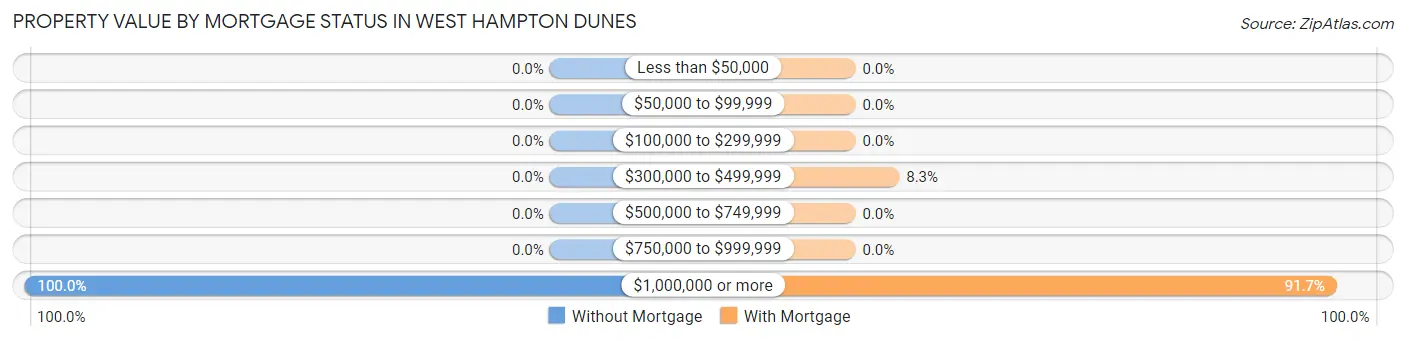
| Property Value | Without Mortgage | With Mortgage |
| Less than $50,000 | 0 (0.0%) | 0 (0.0%) |
| $50,000 to $99,999 | 0 (0.0%) | 0 (0.0%) |
| $100,000 to $299,999 | 0 (0.0%) | 0 (0.0%) |
| $300,000 to $499,999 | 0 (0.0%) | 2 (8.3%) |
| $500,000 to $749,999 | 0 (0.0%) | 0 (0.0%) |
| $750,000 to $999,999 | 0 (0.0%) | 0 (0.0%) |
| $1,000,000 or more | 24 (100.0%) | 22 (91.7%) |
| Total | 24 (100.0%) | 24 (100.0%) |
Household Income by Mortgage Status in West Hampton Dunes
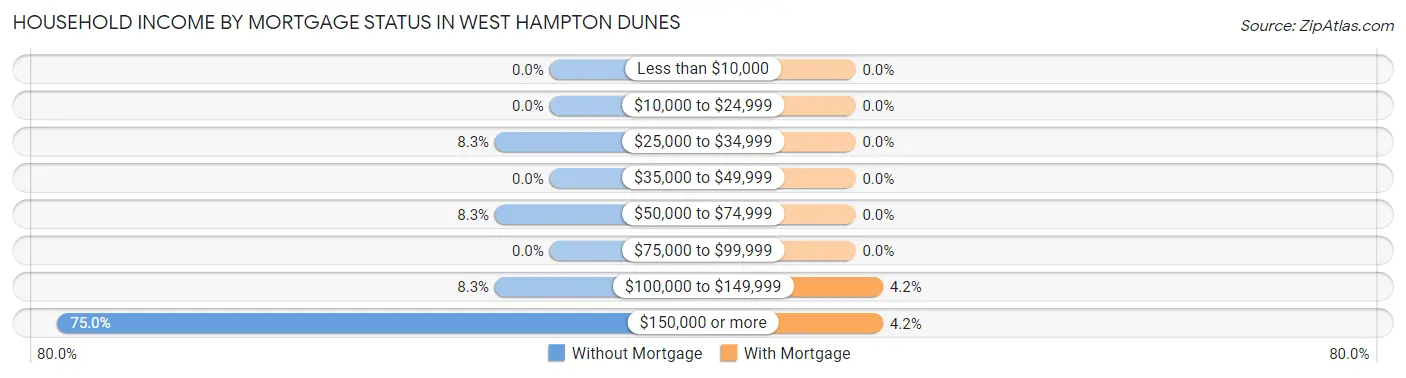
| Household Income | Without Mortgage | With Mortgage |
| Less than $10,000 | 0 (0.0%) | 0 (0.0%) |
| $10,000 to $24,999 | 0 (0.0%) | 0 (0.0%) |
| $25,000 to $34,999 | 2 (8.3%) | 0 (0.0%) |
| $35,000 to $49,999 | 0 (0.0%) | 0 (0.0%) |
| $50,000 to $74,999 | 2 (8.3%) | 0 (0.0%) |
| $75,000 to $99,999 | 0 (0.0%) | 0 (0.0%) |
| $100,000 to $149,999 | 2 (8.3%) | 1 (4.2%) |
| $150,000 or more | 18 (75.0%) | 1 (4.2%) |
| Total | 24 (100.0%) | 24 (100.0%) |
Property Value to Household Income Ratio in West Hampton Dunes
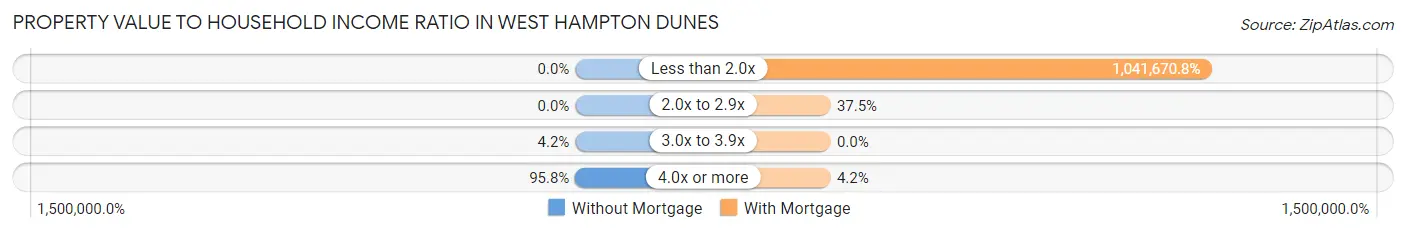
| Value-to-Income Ratio | Without Mortgage | With Mortgage |
| Less than 2.0x | 0 (0.0%) | 250,001 (1,041,670.8%) |
| 2.0x to 2.9x | 0 (0.0%) | 9 (37.5%) |
| 3.0x to 3.9x | 1 (4.2%) | 0 (0.0%) |
| 4.0x or more | 23 (95.8%) | 1 (4.2%) |
| Total | 24 (100.0%) | 24 (100.0%) |
Real Estate Taxes by Mortgage Status in West Hampton Dunes
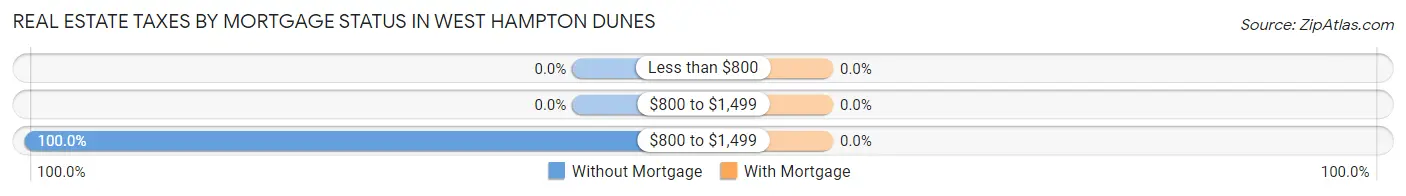
| Property Taxes | Without Mortgage | With Mortgage |
| Less than $800 | 0 (0.0%) | 0 (0.0%) |
| $800 to $1,499 | 0 (0.0%) | 0 (0.0%) |
| $800 to $1,499 | 24 (100.0%) | 0 (0.0%) |
| Total | 24 (100.0%) | 24 (100.0%) |
Health & Disability in West Hampton Dunes
Health Insurance Coverage by Age in West Hampton Dunes
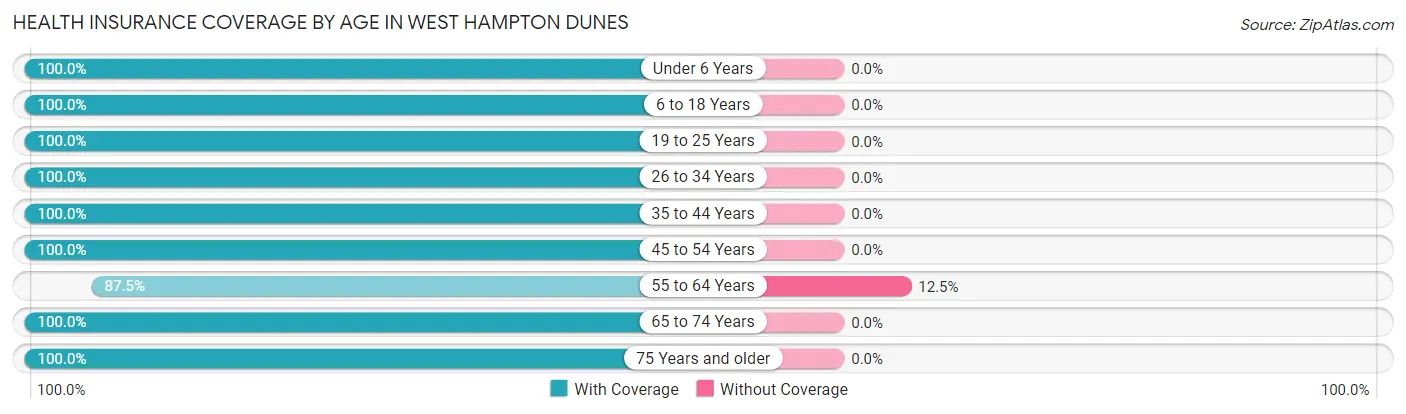
| Age Bracket | With Coverage | Without Coverage |
| Under 6 Years | 14 (100.0%) | 0 (0.0%) |
| 6 to 18 Years | 2 (100.0%) | 0 (0.0%) |
| 19 to 25 Years | 8 (100.0%) | 0 (0.0%) |
| 26 to 34 Years | 16 (100.0%) | 0 (0.0%) |
| 35 to 44 Years | 14 (100.0%) | 0 (0.0%) |
| 45 to 54 Years | 7 (100.0%) | 0 (0.0%) |
| 55 to 64 Years | 42 (87.5%) | 6 (12.5%) |
| 65 to 74 Years | 13 (100.0%) | 0 (0.0%) |
| 75 Years and older | 8 (100.0%) | 0 (0.0%) |
| Total | 124 (95.4%) | 6 (4.6%) |
Health Insurance Coverage by Citizenship Status in West Hampton Dunes
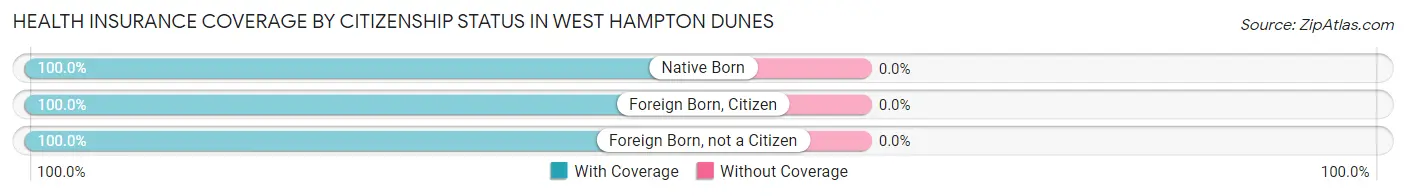
| Citizenship Status | With Coverage | Without Coverage |
| Native Born | 14 (100.0%) | 0 (0.0%) |
| Foreign Born, Citizen | 2 (100.0%) | 0 (0.0%) |
| Foreign Born, not a Citizen | 8 (100.0%) | 0 (0.0%) |
Health Insurance Coverage by Household Income in West Hampton Dunes
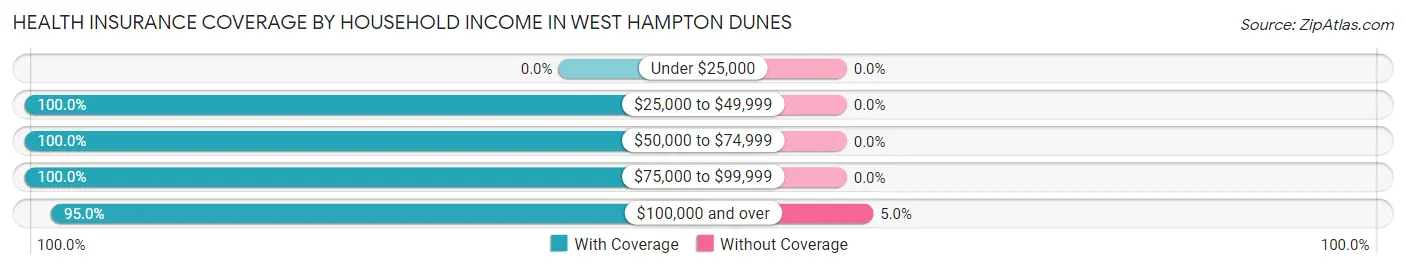
| Household Income | With Coverage | Without Coverage |
| Under $25,000 | 0 (0.0%) | 0 (0.0%) |
| $25,000 to $49,999 | 3 (100.0%) | 0 (0.0%) |
| $50,000 to $74,999 | 4 (100.0%) | 0 (0.0%) |
| $75,000 to $99,999 | 2 (100.0%) | 0 (0.0%) |
| $100,000 and over | 115 (95.0%) | 6 (5.0%) |
Public vs Private Health Insurance Coverage by Age in West Hampton Dunes
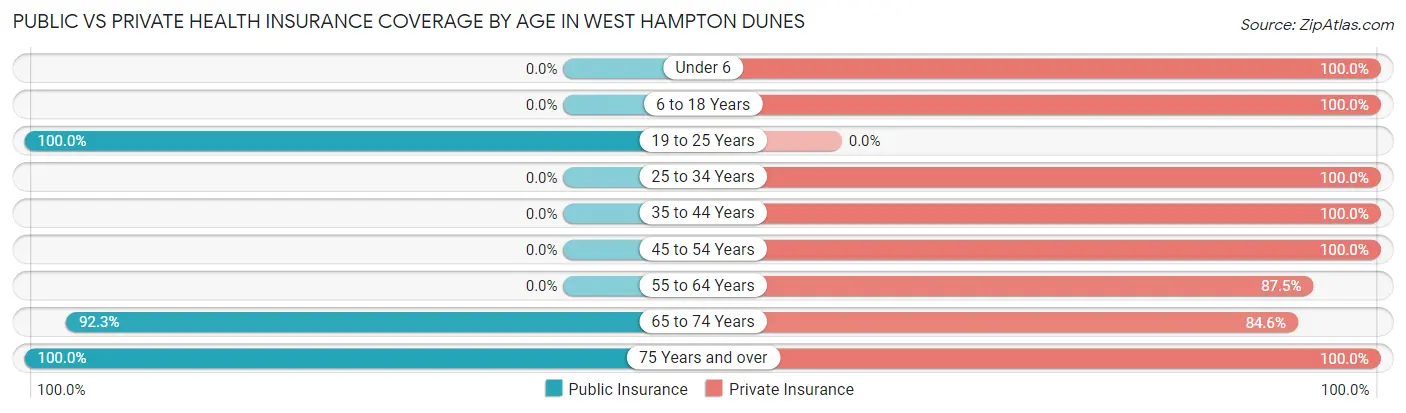
| Age Bracket | Public Insurance | Private Insurance |
| Under 6 | 0 (0.0%) | 14 (100.0%) |
| 6 to 18 Years | 0 (0.0%) | 2 (100.0%) |
| 19 to 25 Years | 8 (100.0%) | 0 (0.0%) |
| 25 to 34 Years | 0 (0.0%) | 16 (100.0%) |
| 35 to 44 Years | 0 (0.0%) | 14 (100.0%) |
| 45 to 54 Years | 0 (0.0%) | 7 (100.0%) |
| 55 to 64 Years | 0 (0.0%) | 42 (87.5%) |
| 65 to 74 Years | 12 (92.3%) | 11 (84.6%) |
| 75 Years and over | 8 (100.0%) | 8 (100.0%) |
| Total | 28 (21.5%) | 114 (87.7%) |
Disability Status by Sex by Age in West Hampton Dunes
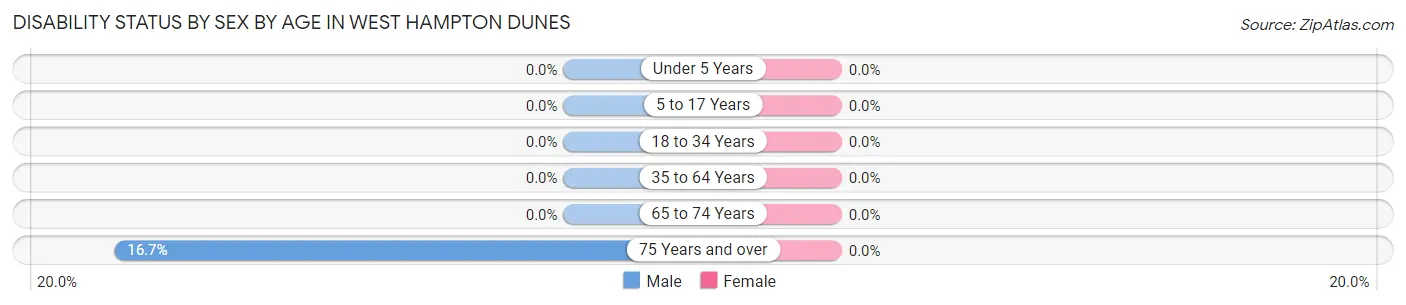
| Age Bracket | Male | Female |
| Under 5 Years | 0 (0.0%) | 0 (0.0%) |
| 5 to 17 Years | 0 (0.0%) | 0 (0.0%) |
| 18 to 34 Years | 0 (0.0%) | 0 (0.0%) |
| 35 to 64 Years | 0 (0.0%) | 0 (0.0%) |
| 65 to 74 Years | 0 (0.0%) | 0 (0.0%) |
| 75 Years and over | 1 (16.7%) | 0 (0.0%) |
Disability Class by Sex by Age in West Hampton Dunes
Disability Class: Hearing Difficulty
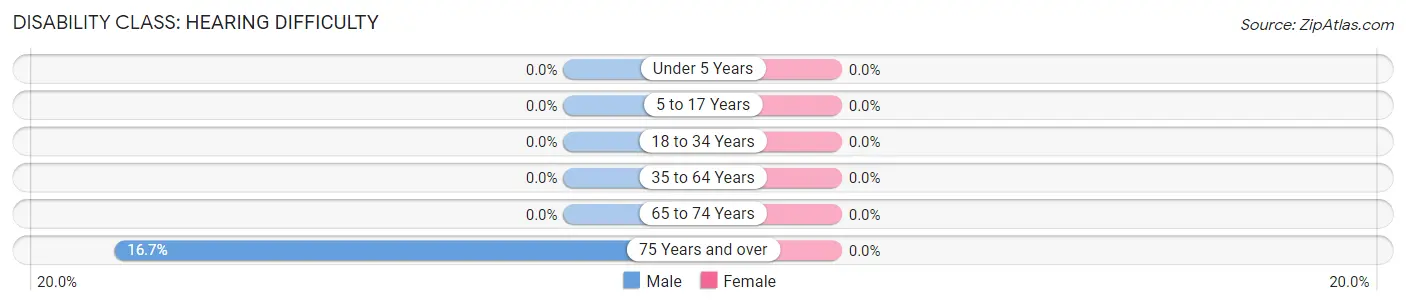
| Age Bracket | Male | Female |
| Under 5 Years | 0 (0.0%) | 0 (0.0%) |
| 5 to 17 Years | 0 (0.0%) | 0 (0.0%) |
| 18 to 34 Years | 0 (0.0%) | 0 (0.0%) |
| 35 to 64 Years | 0 (0.0%) | 0 (0.0%) |
| 65 to 74 Years | 0 (0.0%) | 0 (0.0%) |
| 75 Years and over | 1 (16.7%) | 0 (0.0%) |
Disability Class: Vision Difficulty
| Age Bracket | Male | Female |
| Under 5 Years | 0 (0.0%) | 0 (0.0%) |
| 5 to 17 Years | 0 (0.0%) | 0 (0.0%) |
| 18 to 34 Years | 0 (0.0%) | 0 (0.0%) |
| 35 to 64 Years | 0 (0.0%) | 0 (0.0%) |
| 65 to 74 Years | 0 (0.0%) | 0 (0.0%) |
| 75 Years and over | 0 (0.0%) | 0 (0.0%) |
Disability Class: Cognitive Difficulty
| Age Bracket | Male | Female |
| 5 to 17 Years | 0 (0.0%) | 0 (0.0%) |
| 18 to 34 Years | 0 (0.0%) | 0 (0.0%) |
| 35 to 64 Years | 0 (0.0%) | 0 (0.0%) |
| 65 to 74 Years | 0 (0.0%) | 0 (0.0%) |
| 75 Years and over | 0 (0.0%) | 0 (0.0%) |
Disability Class: Ambulatory Difficulty
| Age Bracket | Male | Female |
| 5 to 17 Years | 0 (0.0%) | 0 (0.0%) |
| 18 to 34 Years | 0 (0.0%) | 0 (0.0%) |
| 35 to 64 Years | 0 (0.0%) | 0 (0.0%) |
| 65 to 74 Years | 0 (0.0%) | 0 (0.0%) |
| 75 Years and over | 0 (0.0%) | 0 (0.0%) |
Disability Class: Self-Care Difficulty
| Age Bracket | Male | Female |
| 5 to 17 Years | 0 (0.0%) | 0 (0.0%) |
| 18 to 34 Years | 0 (0.0%) | 0 (0.0%) |
| 35 to 64 Years | 0 (0.0%) | 0 (0.0%) |
| 65 to 74 Years | 0 (0.0%) | 0 (0.0%) |
| 75 Years and over | 0 (0.0%) | 0 (0.0%) |
Technology Access in West Hampton Dunes
Computing Device Access in West Hampton Dunes
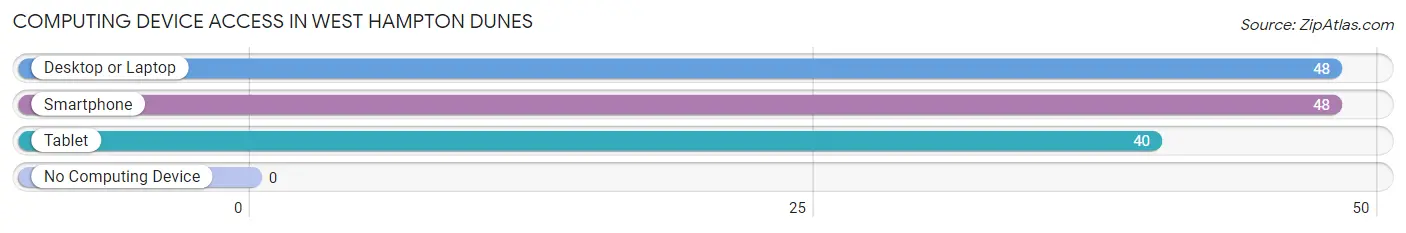
| Device Type | # Households | % Households |
| Desktop or Laptop | 48 | 100.0% |
| Smartphone | 48 | 100.0% |
| Tablet | 40 | 83.3% |
| No Computing Device | 0 | 0.0% |
| Total | 48 | 100.0% |
Internet Access in West Hampton Dunes
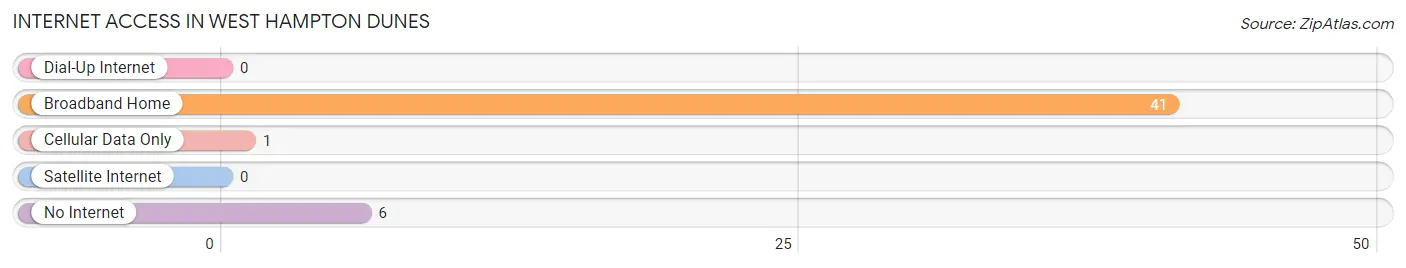
| Internet Type | # Households | % Households |
| Dial-Up Internet | 0 | 0.0% |
| Broadband Home | 41 | 85.4% |
| Cellular Data Only | 1 | 2.1% |
| Satellite Internet | 0 | 0.0% |
| No Internet | 6 | 12.5% |
| Total | 48 | 100.0% |
West Hampton Dunes Summary
Hampton Dunes, NY is a small village located in the Town of Southampton in Suffolk County, New York. It is situated on the eastern end of the barrier island of Fire Island, which is located off the south shore of Long Island. The village was incorporated in 1993 and is home to approximately 500 year-round residents.
History
The area that is now known as West Hampton Dunes was originally inhabited by the Shinnecock Indians. The Shinnecock were a Native American tribe that lived in the area for centuries before the arrival of European settlers. The first Europeans to settle in the area were Dutch settlers in the late 1600s. The area was then known as Fire Island Beach.
In the late 1800s, the area was developed as a resort destination for wealthy New Yorkers. The area was known as Westhampton Beach and was home to several large hotels and resorts. In the early 1900s, the area was hit hard by a series of hurricanes and storms that caused significant damage to the area.
In the 1950s, the area was developed as a residential community. The area was known as Westhampton Dunes and was home to several hundred homes. In the late 1980s, the area was hit hard by a series of storms and hurricanes that caused significant damage to the area. In response to the damage, the village of West Hampton Dunes was incorporated in 1993.
Geography
West Hampton Dunes is located on the eastern end of the barrier island of Fire Island, which is located off the south shore of Long Island. The village is bordered by the Atlantic Ocean to the south and the Great South Bay to the north. The village is approximately 4.5 miles long and 0.5 miles wide. The village is home to several beaches, including Dune Road Beach, Westhampton Beach, and Cupsogue Beach.
Economy
The economy of West Hampton Dunes is largely based on tourism. The village is home to several hotels and resorts, as well as restaurants and shops. The village is also home to several marinas, which provide access to the Great South Bay and the Atlantic Ocean. The village is also home to several art galleries and museums, as well as a number of recreational activities.
Demographics
As of the 2010 census, the population of West Hampton Dunes was 498. The racial makeup of the village was 94.2% White, 2.2% African American, 0.2% Native American, 0.8% Asian, 0.2% Pacific Islander, and 2.4% from other races. The median household income was $90,000, and the median family income was $100,000. The per capita income was $45,000.
Conclusion
West Hampton Dunes is a small village located in the Town of Southampton in Suffolk County, New York. It is situated on the eastern end of the barrier island of Fire Island, which is located off the south shore of Long Island. The village was incorporated in 1993 and is home to approximately 500 year-round residents. The economy of West Hampton Dunes is largely based on tourism, and the village is home to several hotels and resorts, as well as restaurants and shops. As of the 2010 census, the population of West Hampton Dunes was 498. The racial makeup of the village was 94.2% White, 2.2% African American, 0.2% Native American, 0.8% Asian, 0.2% Pacific Islander, and 2.4% from other races. The median household income was $90,000, and the median family income was $100,000. The per capita income was $45,000.
Common Questions
What is Per Capita Income in West Hampton Dunes?
Per Capita income in West Hampton Dunes is $172,312.
What is the Median Family Income in West Hampton Dunes?
Median Family Income in West Hampton Dunes is $250,001.
What is the Median Household income in West Hampton Dunes?
Median Household Income in West Hampton Dunes is $250,001.
What is Income or Wage Gap in West Hampton Dunes?
Income or Wage Gap in West Hampton Dunes is 61.5%.
Women in West Hampton Dunes earn 38.5 cents for every dollar earned by a man.
What is Inequality or Gini Index in West Hampton Dunes?
Inequality or Gini Index in West Hampton Dunes is 0.38.
What is the Total Population of West Hampton Dunes?
Total Population of West Hampton Dunes is 130.
What is the Total Male Population of West Hampton Dunes?
Total Male Population of West Hampton Dunes is 55.
What is the Total Female Population of West Hampton Dunes?
Total Female Population of West Hampton Dunes is 75.
What is the Ratio of Males per 100 Females in West Hampton Dunes?
There are 73.33 Males per 100 Females in West Hampton Dunes.
What is the Ratio of Females per 100 Males in West Hampton Dunes?
There are 136.36 Females per 100 Males in West Hampton Dunes.
What is the Median Population Age in West Hampton Dunes?
Median Population Age in West Hampton Dunes is 55.3 Years.
What is the Average Family Size in West Hampton Dunes
Average Family Size in West Hampton Dunes is 2.8 People.
What is the Average Household Size in West Hampton Dunes
Average Household Size in West Hampton Dunes is 2.7 People.
How Large is the Labor Force in West Hampton Dunes?
There are 73 People in the Labor Forcein in West Hampton Dunes.
What is the Percentage of People in the Labor Force in West Hampton Dunes?
64.0% of People are in the Labor Force in West Hampton Dunes.
What is the Unemployment Rate in West Hampton Dunes?
Unemployment Rate in West Hampton Dunes is 1.4%.