Pelham, NY Map & Demographics
Pelham Map
Pelham Overview
$83,510
PER CAPITA INCOME
$183,000
AVG FAMILY INCOME
$172,692
AVG HOUSEHOLD INCOME
29.4%
WAGE / INCOME GAP [ % ]
70.6¢/ $1
WAGE / INCOME GAP [ $ ]
0.49
INEQUALITY / GINI INDEX
7,261
TOTAL POPULATION
3,798
MALE POPULATION
3,463
FEMALE POPULATION
109.67
MALES / 100 FEMALES
91.18
FEMALES / 100 MALES
39.1
MEDIAN AGE
3.5
AVG FAMILY SIZE
3.2
AVG HOUSEHOLD SIZE
3,801
LABOR FORCE [ PEOPLE ]
70.8%
PERCENT IN LABOR FORCE
6.2%
UNEMPLOYMENT RATE
Pelham Zip Codes
Pelham Area Codes
Income in Pelham
Income Overview in Pelham
Per Capita Income in Pelham is $83,510, while median incomes of families and households are $183,000 and $172,692 respectively.
| Characteristic | Number | Measure |
| Per Capita Income | 7,261 | $83,510 |
| Median Family Income | 1,868 | $183,000 |
| Mean Family Income | 1,868 | $286,133 |
| Median Household Income | 2,244 | $172,692 |
| Mean Household Income | 2,244 | $260,167 |
| Income Deficit | 1,868 | $0 |
| Wage / Income Gap (%) | 7,261 | 29.36% |
| Wage / Income Gap ($) | 7,261 | 70.64¢ per $1 |
| Gini / Inequality Index | 7,261 | 0.49 |
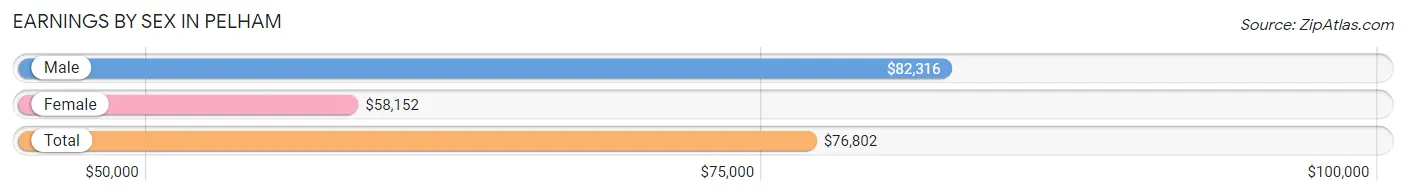
Earnings by Sex in Pelham
Average Earnings in Pelham are $76,802, $82,316 for men and $58,152 for women, a difference of 29.4%.
| Sex | Number | Average Earnings |
| Male | 2,346 (56.9%) | $82,316 |
| Female | 1,780 (43.1%) | $58,152 |
| Total | 4,126 (100.0%) | $76,802 |
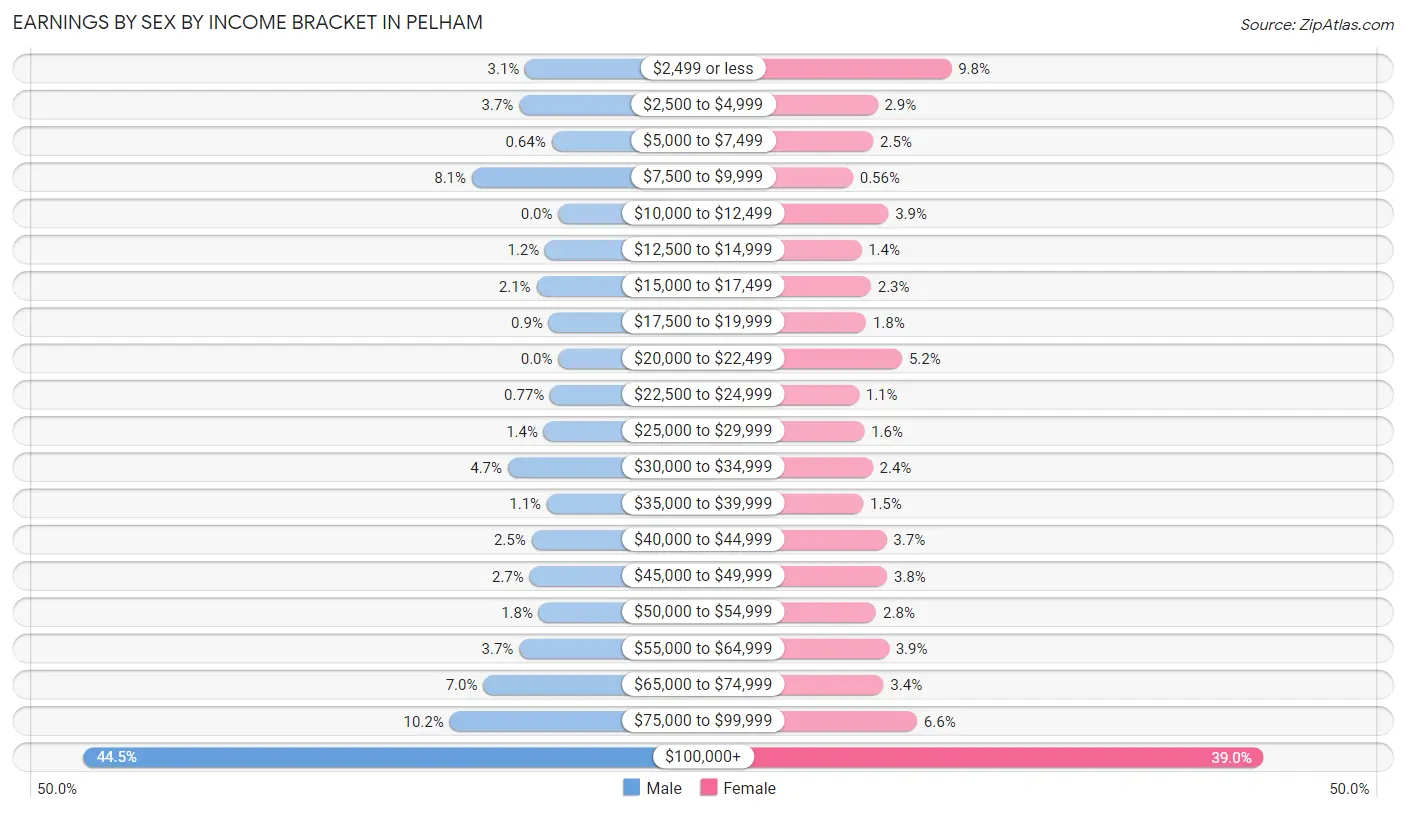
Earnings by Sex by Income Bracket in Pelham
The most common earnings brackets in Pelham are $100,000+ for men (1,043 | 44.5%) and $100,000+ for women (695 | 39.0%).
| Income | Male | Female |
| $2,499 or less | 73 (3.1%) | 174 (9.8%) |
| $2,500 to $4,999 | 86 (3.7%) | 51 (2.9%) |
| $5,000 to $7,499 | 15 (0.6%) | 44 (2.5%) |
| $7,500 to $9,999 | 190 (8.1%) | 10 (0.6%) |
| $10,000 to $12,499 | 0 (0.0%) | 69 (3.9%) |
| $12,500 to $14,999 | 29 (1.2%) | 24 (1.3%) |
| $15,000 to $17,499 | 48 (2.1%) | 40 (2.2%) |
| $17,500 to $19,999 | 21 (0.9%) | 32 (1.8%) |
| $20,000 to $22,499 | 0 (0.0%) | 92 (5.2%) |
| $22,500 to $24,999 | 18 (0.8%) | 20 (1.1%) |
| $25,000 to $29,999 | 32 (1.4%) | 29 (1.6%) |
| $30,000 to $34,999 | 111 (4.7%) | 43 (2.4%) |
| $35,000 to $39,999 | 25 (1.1%) | 27 (1.5%) |
| $40,000 to $44,999 | 59 (2.5%) | 66 (3.7%) |
| $45,000 to $49,999 | 63 (2.7%) | 67 (3.8%) |
| $50,000 to $54,999 | 43 (1.8%) | 49 (2.8%) |
| $55,000 to $64,999 | 86 (3.7%) | 70 (3.9%) |
| $65,000 to $74,999 | 165 (7.0%) | 61 (3.4%) |
| $75,000 to $99,999 | 239 (10.2%) | 117 (6.6%) |
| $100,000+ | 1,043 (44.5%) | 695 (39.0%) |
| Total | 2,346 (100.0%) | 1,780 (100.0%) |
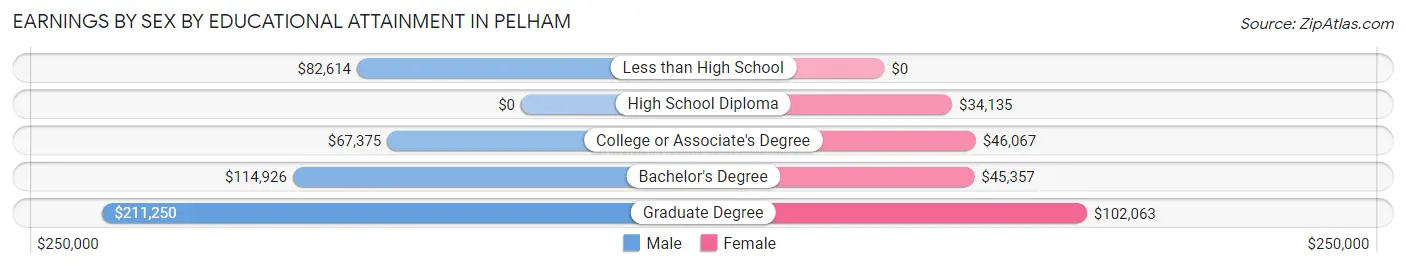
Earnings by Sex by Educational Attainment in Pelham
Average earnings in Pelham are $103,989 for men and $70,000 for women, a difference of 32.7%. Men with an educational attainment of graduate degree enjoy the highest average annual earnings of $211,250, while those with college or associate's degree education earn the least with $67,375. Women with an educational attainment of graduate degree earn the most with the average annual earnings of $102,063, while those with high school diploma education have the smallest earnings of $34,135.
| Educational Attainment | Male Income | Female Income |
| Less than High School | $82,614 | $0 |
| High School Diploma | - | - |
| College or Associate's Degree | $67,375 | $46,067 |
| Bachelor's Degree | $114,926 | $45,357 |
| Graduate Degree | $211,250 | $102,063 |
| Total | $103,989 | $70,000 |
Family Income in Pelham
Family Income Brackets in Pelham
According to the Pelham family income data, there are 897 families falling into the $200,000+ income range, which is the most common income bracket and makes up 48.0% of all families. Conversely, the $10,000 to $14,999 income bracket is the least frequent group with only 2 families (0.1%) belonging to this category.
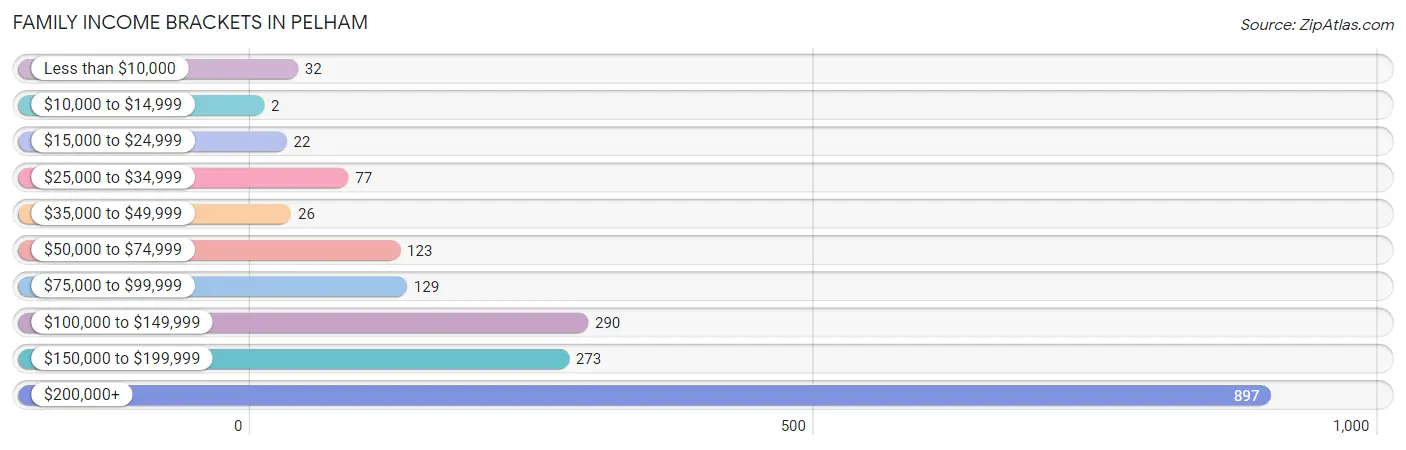
| Income Bracket | # Families | % Families |
| Less than $10,000 | 32 | 1.7% |
| $10,000 to $14,999 | 2 | 0.1% |
| $15,000 to $24,999 | 22 | 1.2% |
| $25,000 to $34,999 | 77 | 4.1% |
| $35,000 to $49,999 | 26 | 1.4% |
| $50,000 to $74,999 | 123 | 6.6% |
| $75,000 to $99,999 | 129 | 6.9% |
| $100,000 to $149,999 | 290 | 15.5% |
| $150,000 to $199,999 | 273 | 14.6% |
| $200,000+ | 897 | 48.0% |
Family Income by Famaliy Size in Pelham
4-person families (571 | 30.6%) account for the highest median family income in Pelham with $250,001 per family, while 2-person families (605 | 32.4%) have the highest median income of $68,840 per family member.
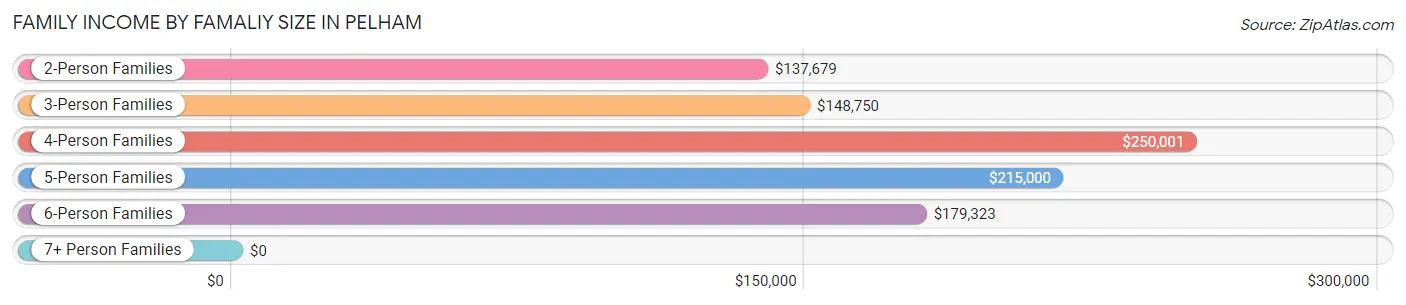
| Income Bracket | # Families | Median Income |
| 2-Person Families | 605 (32.4%) | $137,679 |
| 3-Person Families | 430 (23.0%) | $148,750 |
| 4-Person Families | 571 (30.6%) | $250,001 |
| 5-Person Families | 152 (8.1%) | $215,000 |
| 6-Person Families | 70 (3.7%) | $179,323 |
| 7+ Person Families | 40 (2.1%) | $0 |
| Total | 1,868 (100.0%) | $183,000 |
Family Income by Number of Earners in Pelham
The median family income in Pelham is $183,000, with families comprising 2 earners (973) having the highest median family income of $229,821, while families with 1 earner (491) have the lowest median family income of $97,934, accounting for 52.1% and 26.3% of families, respectively.
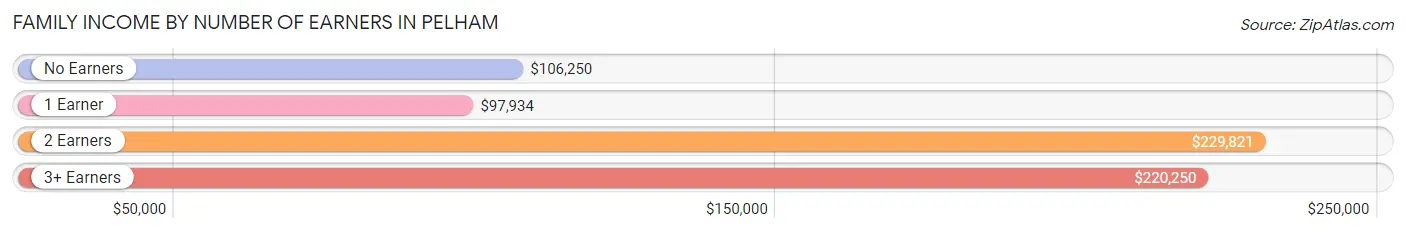
| Number of Earners | # Families | Median Income |
| No Earners | 116 (6.2%) | $106,250 |
| 1 Earner | 491 (26.3%) | $97,934 |
| 2 Earners | 973 (52.1%) | $229,821 |
| 3+ Earners | 288 (15.4%) | $220,250 |
| Total | 1,868 (100.0%) | $183,000 |
Household Income in Pelham
Household Income Brackets in Pelham
With 976 households falling in the category, the $200,000+ income range is the most frequent in Pelham, accounting for 43.5% of all households.
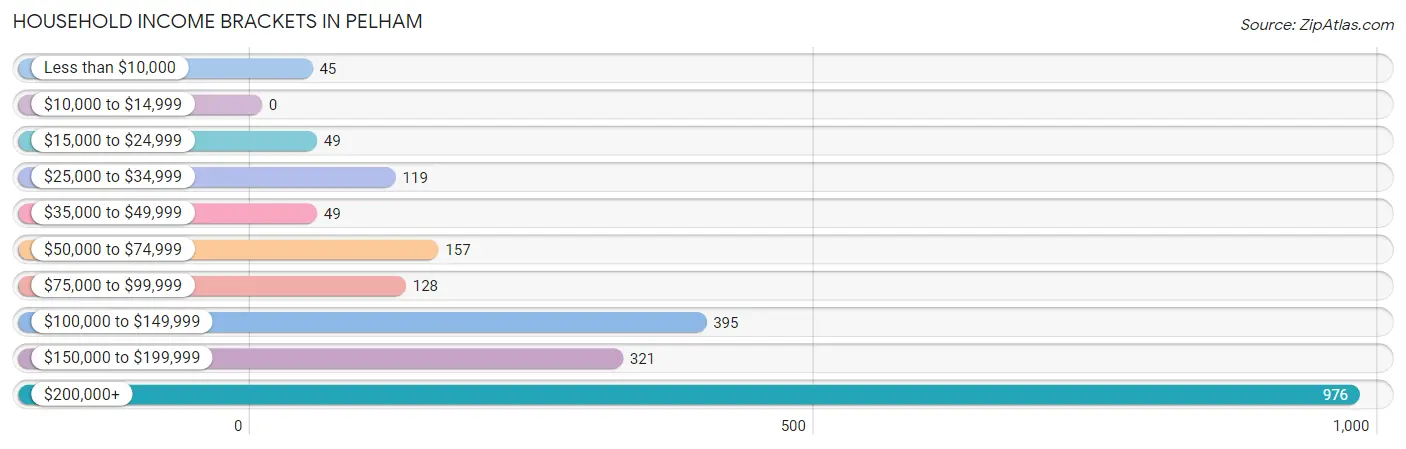
| Income Bracket | # Households | % Households |
| Less than $10,000 | 45 | 2.0% |
| $10,000 to $14,999 | 0 | 0.0% |
| $15,000 to $24,999 | 49 | 2.2% |
| $25,000 to $34,999 | 119 | 5.3% |
| $35,000 to $49,999 | 49 | 2.2% |
| $50,000 to $74,999 | 157 | 7.0% |
| $75,000 to $99,999 | 128 | 5.7% |
| $100,000 to $149,999 | 395 | 17.6% |
| $150,000 to $199,999 | 321 | 14.3% |
| $200,000+ | 976 | 43.5% |
Household Income by Householder Age in Pelham
The median household income in Pelham is $172,692, with the highest median household income of $203,750 found in the 25 to 44 years age bracket for the primary householder. A total of 783 households (34.9%) fall into this category. Meanwhile, the 15 to 24 years age bracket for the primary householder has the lowest median household income of $0, with 30 households (1.3%) in this group.
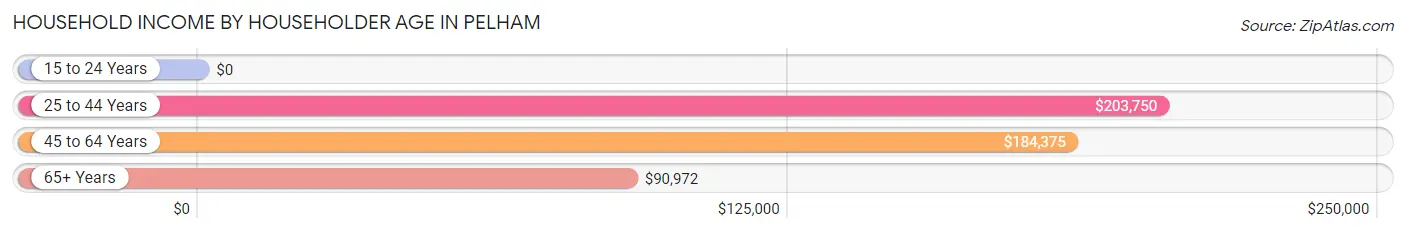
| Income Bracket | # Households | Median Income |
| 15 to 24 Years | 30 (1.3%) | $0 |
| 25 to 44 Years | 783 (34.9%) | $203,750 |
| 45 to 64 Years | 906 (40.4%) | $184,375 |
| 65+ Years | 525 (23.4%) | $90,972 |
| Total | 2,244 (100.0%) | $172,692 |
Poverty in Pelham
Income Below Poverty by Sex and Age in Pelham
With 1.7% poverty level for males and 5.0% for females among the residents of Pelham, 65 to 74 year old males and 18 to 24 year old females are the most vulnerable to poverty, with 17 males (7.6%) and 23 females (20.9%) in their respective age groups living below the poverty level.
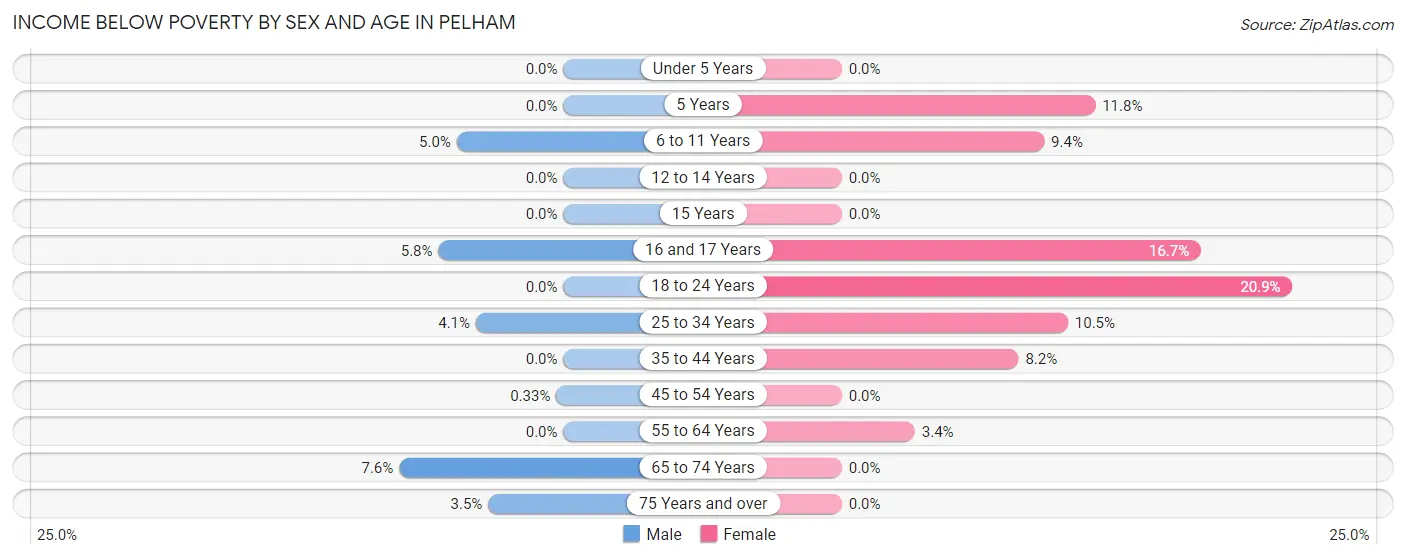
| Age Bracket | Male | Female |
| Under 5 Years | 0 (0.0%) | 0 (0.0%) |
| 5 Years | 0 (0.0%) | 2 (11.8%) |
| 6 to 11 Years | 22 (5.0%) | 29 (9.4%) |
| 12 to 14 Years | 0 (0.0%) | 0 (0.0%) |
| 15 Years | 0 (0.0%) | 0 (0.0%) |
| 16 and 17 Years | 8 (5.8%) | 24 (16.7%) |
| 18 to 24 Years | 0 (0.0%) | 23 (20.9%) |
| 25 to 34 Years | 11 (4.1%) | 28 (10.5%) |
| 35 to 44 Years | 0 (0.0%) | 58 (8.2%) |
| 45 to 54 Years | 2 (0.3%) | 0 (0.0%) |
| 55 to 64 Years | 0 (0.0%) | 10 (3.4%) |
| 65 to 74 Years | 17 (7.6%) | 0 (0.0%) |
| 75 Years and over | 6 (3.5%) | 0 (0.0%) |
| Total | 66 (1.7%) | 174 (5.0%) |
Income Above Poverty by Sex and Age in Pelham
According to the poverty statistics in Pelham, males aged under 5 years and females aged under 5 years are the age groups that are most secure financially, with 100.0% of males and 100.0% of females in these age groups living above the poverty line.
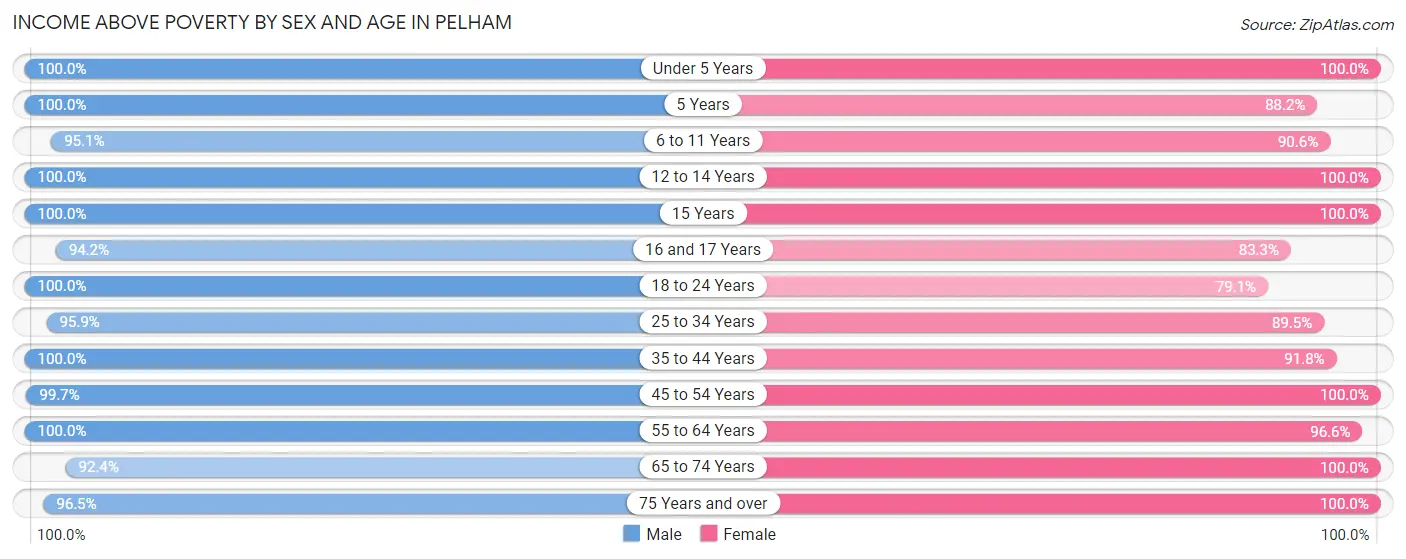
| Age Bracket | Male | Female |
| Under 5 Years | 147 (100.0%) | 278 (100.0%) |
| 5 Years | 48 (100.0%) | 15 (88.2%) |
| 6 to 11 Years | 422 (95.1%) | 280 (90.6%) |
| 12 to 14 Years | 240 (100.0%) | 218 (100.0%) |
| 15 Years | 112 (100.0%) | 79 (100.0%) |
| 16 and 17 Years | 130 (94.2%) | 120 (83.3%) |
| 18 to 24 Years | 395 (100.0%) | 87 (79.1%) |
| 25 to 34 Years | 260 (95.9%) | 239 (89.5%) |
| 35 to 44 Years | 554 (100.0%) | 649 (91.8%) |
| 45 to 54 Years | 609 (99.7%) | 554 (100.0%) |
| 55 to 64 Years | 443 (100.0%) | 285 (96.6%) |
| 65 to 74 Years | 206 (92.4%) | 219 (100.0%) |
| 75 Years and over | 166 (96.5%) | 266 (100.0%) |
| Total | 3,732 (98.3%) | 3,289 (95.0%) |
Income Below Poverty Among Married-Couple Families in Pelham
The poverty statistics for married-couple families in Pelham show that 0.3% or 5 of the total 1,518 families live below the poverty line. Families with no children have the highest poverty rate of 0.8%, comprising of 5 families. On the other hand, families with 1 or 2 children have the lowest poverty rate of 0.0%, which includes 0 families.
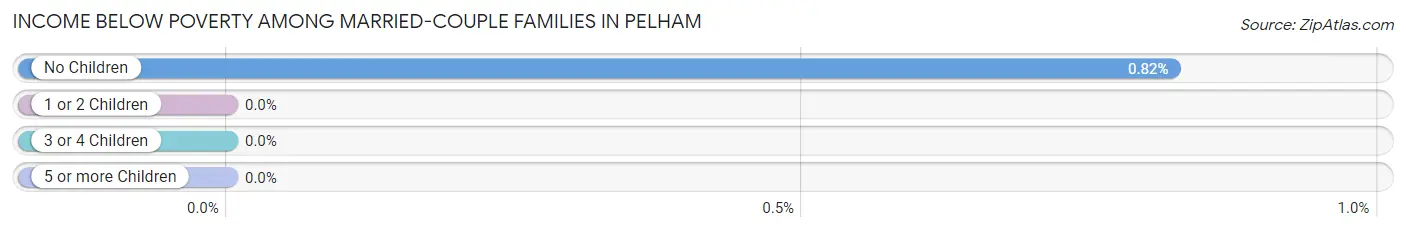
| Children | Above Poverty | Below Poverty |
| No Children | 603 (99.2%) | 5 (0.8%) |
| 1 or 2 Children | 719 (100.0%) | 0 (0.0%) |
| 3 or 4 Children | 191 (100.0%) | 0 (0.0%) |
| 5 or more Children | 0 (0.0%) | 0 (0.0%) |
| Total | 1,513 (99.7%) | 5 (0.3%) |
Income Below Poverty Among Single-Parent Households in Pelham
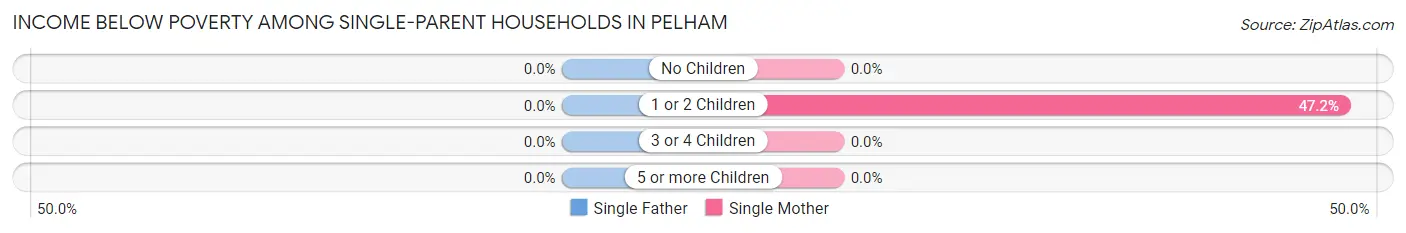
| Children | Single Father | Single Mother |
| No Children | 0 (0.0%) | 0 (0.0%) |
| 1 or 2 Children | 0 (0.0%) | 51 (47.2%) |
| 3 or 4 Children | 0 (0.0%) | 0 (0.0%) |
| 5 or more Children | 0 (0.0%) | 0 (0.0%) |
| Total | 0 (0.0%) | 51 (20.6%) |
Income Below Poverty Among Married-Couple vs Single-Parent Households in Pelham
The poverty data for Pelham shows that 5 of the married-couple family households (0.3%) and 51 of the single-parent households (14.6%) are living below the poverty level. Within the married-couple family households, those with no children have the highest poverty rate, with 5 households (0.8%) falling below the poverty line. Among the single-parent households, those with 1 or 2 children have the highest poverty rate, with 51 household (27.0%) living below poverty.
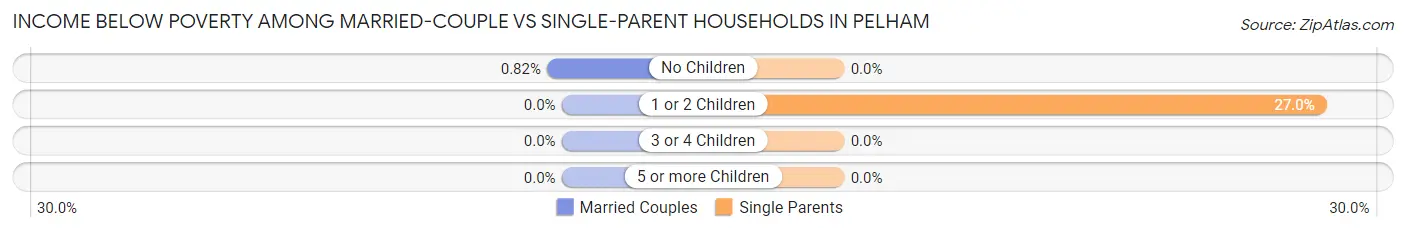
| Children | Married-Couple Families | Single-Parent Households |
| No Children | 5 (0.8%) | 0 (0.0%) |
| 1 or 2 Children | 0 (0.0%) | 51 (27.0%) |
| 3 or 4 Children | 0 (0.0%) | 0 (0.0%) |
| 5 or more Children | 0 (0.0%) | 0 (0.0%) |
| Total | 5 (0.3%) | 51 (14.6%) |
Race in Pelham
The most populous races in Pelham are White / Caucasian (5,078 | 69.9%), Hispanic or Latino (1,022 | 14.1%), and Two or more Races (937 | 12.9%).
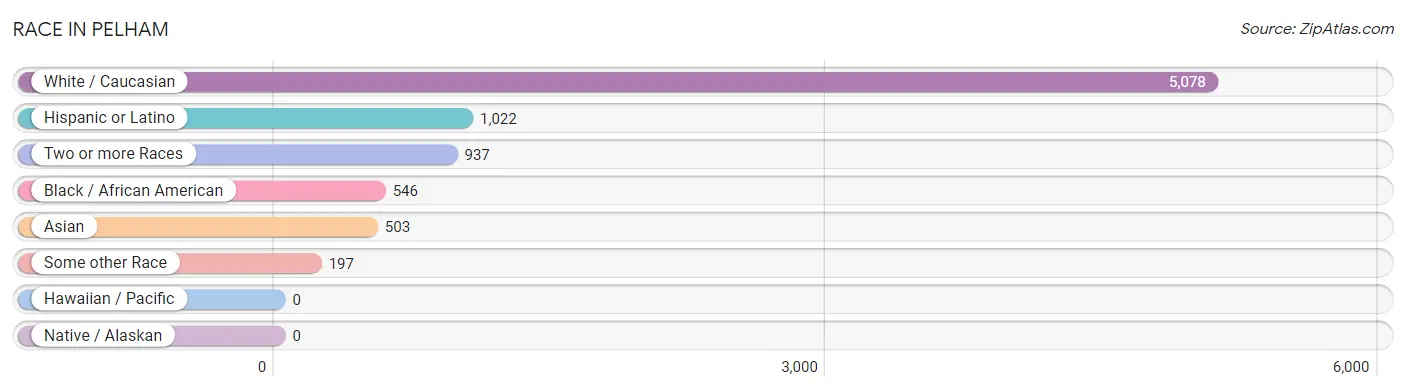
| Race | # Population | % Population |
| Asian | 503 | 6.9% |
| Black / African American | 546 | 7.5% |
| Hawaiian / Pacific | 0 | 0.0% |
| Hispanic or Latino | 1,022 | 14.1% |
| Native / Alaskan | 0 | 0.0% |
| White / Caucasian | 5,078 | 69.9% |
| Two or more Races | 937 | 12.9% |
| Some other Race | 197 | 2.7% |
| Total | 7,261 | 100.0% |
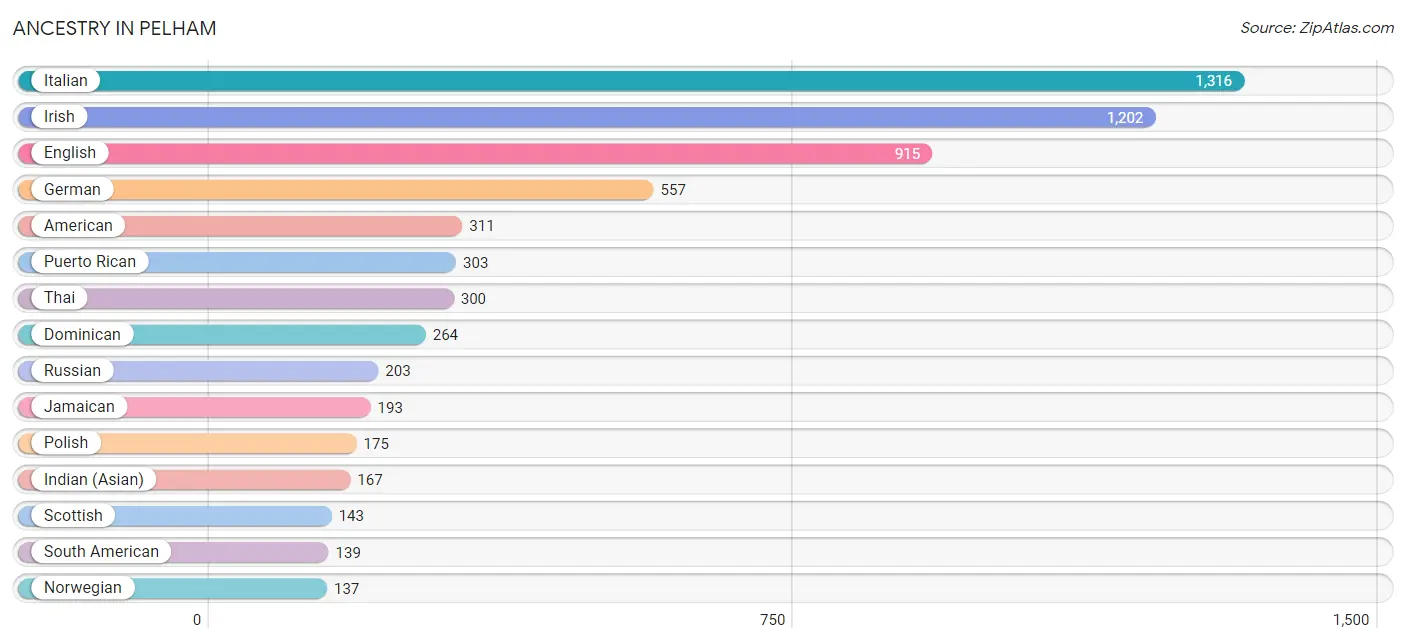
Ancestry in Pelham
The most populous ancestries reported in Pelham are Italian (1,316 | 18.1%), Irish (1,202 | 16.6%), English (915 | 12.6%), German (557 | 7.7%), and American (311 | 4.3%), together accounting for 59.2% of all Pelham residents.
| Ancestry | # Population | % Population |
| African | 11 | 0.2% |
| Albanian | 75 | 1.0% |
| American | 311 | 4.3% |
| Arab | 32 | 0.4% |
| Argentinean | 28 | 0.4% |
| Armenian | 6 | 0.1% |
| Australian | 12 | 0.2% |
| Austrian | 41 | 0.6% |
| Basque | 7 | 0.1% |
| Bhutanese | 16 | 0.2% |
| Bolivian | 5 | 0.1% |
| Brazilian | 133 | 1.8% |
| British | 76 | 1.1% |
| Bulgarian | 109 | 1.5% |
| Burmese | 119 | 1.6% |
| Canadian | 94 | 1.3% |
| Cherokee | 15 | 0.2% |
| Colombian | 29 | 0.4% |
| Cuban | 49 | 0.7% |
| Czech | 10 | 0.1% |
| Dominican | 264 | 3.6% |
| Dutch | 48 | 0.7% |
| Eastern European | 108 | 1.5% |
| Ecuadorian | 77 | 1.1% |
| Egyptian | 30 | 0.4% |
| English | 915 | 12.6% |
| European | 132 | 1.8% |
| Finnish | 51 | 0.7% |
| French | 63 | 0.9% |
| French Canadian | 12 | 0.2% |
| German | 557 | 7.7% |
| Greek | 67 | 0.9% |
| Hungarian | 27 | 0.4% |
| Indian (Asian) | 167 | 2.3% |
| Irish | 1,202 | 16.6% |
| Italian | 1,316 | 18.1% |
| Jamaican | 193 | 2.7% |
| Korean | 27 | 0.4% |
| Laotian | 9 | 0.1% |
| Latvian | 22 | 0.3% |
| Lebanese | 2 | 0.0% |
| Lithuanian | 38 | 0.5% |
| Mexican | 71 | 1.0% |
| Northern European | 18 | 0.3% |
| Norwegian | 137 | 1.9% |
| Polish | 175 | 2.4% |
| Portuguese | 30 | 0.4% |
| Puerto Rican | 303 | 4.2% |
| Romanian | 49 | 0.7% |
| Russian | 203 | 2.8% |
| Scandinavian | 48 | 0.7% |
| Scotch-Irish | 10 | 0.1% |
| Scottish | 143 | 2.0% |
| Slavic | 4 | 0.1% |
| Slovene | 23 | 0.3% |
| South American | 139 | 1.9% |
| Spaniard | 119 | 1.6% |
| Spanish | 63 | 0.9% |
| Sri Lankan | 9 | 0.1% |
| Subsaharan African | 11 | 0.2% |
| Swedish | 54 | 0.7% |
| Swiss | 31 | 0.4% |
| Thai | 300 | 4.1% |
| Ukrainian | 31 | 0.4% |
| Welsh | 19 | 0.3% |
| West Indian | 12 | 0.2% |
| Yugoslavian | 27 | 0.4% | View All 67 Rows |
Immigrants in Pelham
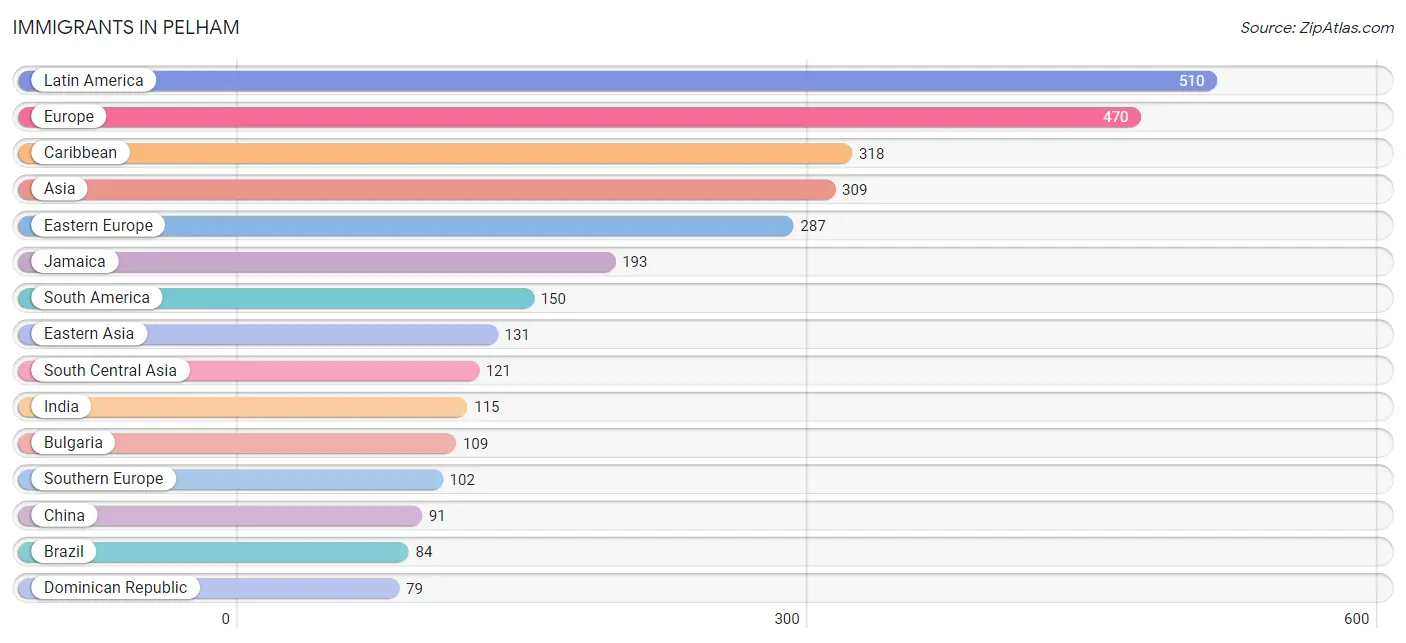
The most numerous immigrant groups reported in Pelham came from Latin America (510 | 7.0%), Europe (470 | 6.5%), Caribbean (318 | 4.4%), Asia (309 | 4.3%), and Eastern Europe (287 | 4.0%), together accounting for 26.1% of all Pelham residents.
| Immigration Origin | # Population | % Population |
| Africa | 24 | 0.3% |
| Albania | 71 | 1.0% |
| Argentina | 22 | 0.3% |
| Asia | 309 | 4.3% |
| Australia | 23 | 0.3% |
| Bangladesh | 6 | 0.1% |
| Belarus | 5 | 0.1% |
| Belgium | 2 | 0.0% |
| Belize | 10 | 0.1% |
| Bosnia and Herzegovina | 9 | 0.1% |
| Brazil | 84 | 1.2% |
| Bulgaria | 109 | 1.5% |
| Cabo Verde | 3 | 0.0% |
| Canada | 39 | 0.5% |
| Caribbean | 318 | 4.4% |
| Central America | 42 | 0.6% |
| China | 91 | 1.3% |
| Cuba | 12 | 0.2% |
| Dominican Republic | 79 | 1.1% |
| Eastern Asia | 131 | 1.8% |
| Eastern Europe | 287 | 4.0% |
| Ecuador | 17 | 0.2% |
| Egypt | 21 | 0.3% |
| England | 5 | 0.1% |
| Europe | 470 | 6.5% |
| Germany | 14 | 0.2% |
| Greece | 25 | 0.3% |
| Guyana | 27 | 0.4% |
| India | 115 | 1.6% |
| Indonesia | 4 | 0.1% |
| Italy | 57 | 0.8% |
| Jamaica | 193 | 2.7% |
| Japan | 6 | 0.1% |
| Korea | 34 | 0.5% |
| Latin America | 510 | 7.0% |
| Mexico | 32 | 0.4% |
| Northern Africa | 21 | 0.3% |
| Northern Europe | 61 | 0.8% |
| Oceania | 23 | 0.3% |
| Philippines | 11 | 0.2% |
| Portugal | 20 | 0.3% |
| Romania | 19 | 0.3% |
| Russia | 8 | 0.1% |
| South America | 150 | 2.1% |
| South Central Asia | 121 | 1.7% |
| South Eastern Asia | 41 | 0.6% |
| Southern Europe | 102 | 1.4% |
| Sweden | 43 | 0.6% |
| Thailand | 8 | 0.1% |
| Ukraine | 17 | 0.2% |
| Vietnam | 18 | 0.3% |
| Western Africa | 3 | 0.0% |
| Western Asia | 16 | 0.2% |
| Western Europe | 16 | 0.2% | View All 54 Rows |
Sex and Age in Pelham
Sex and Age in Pelham
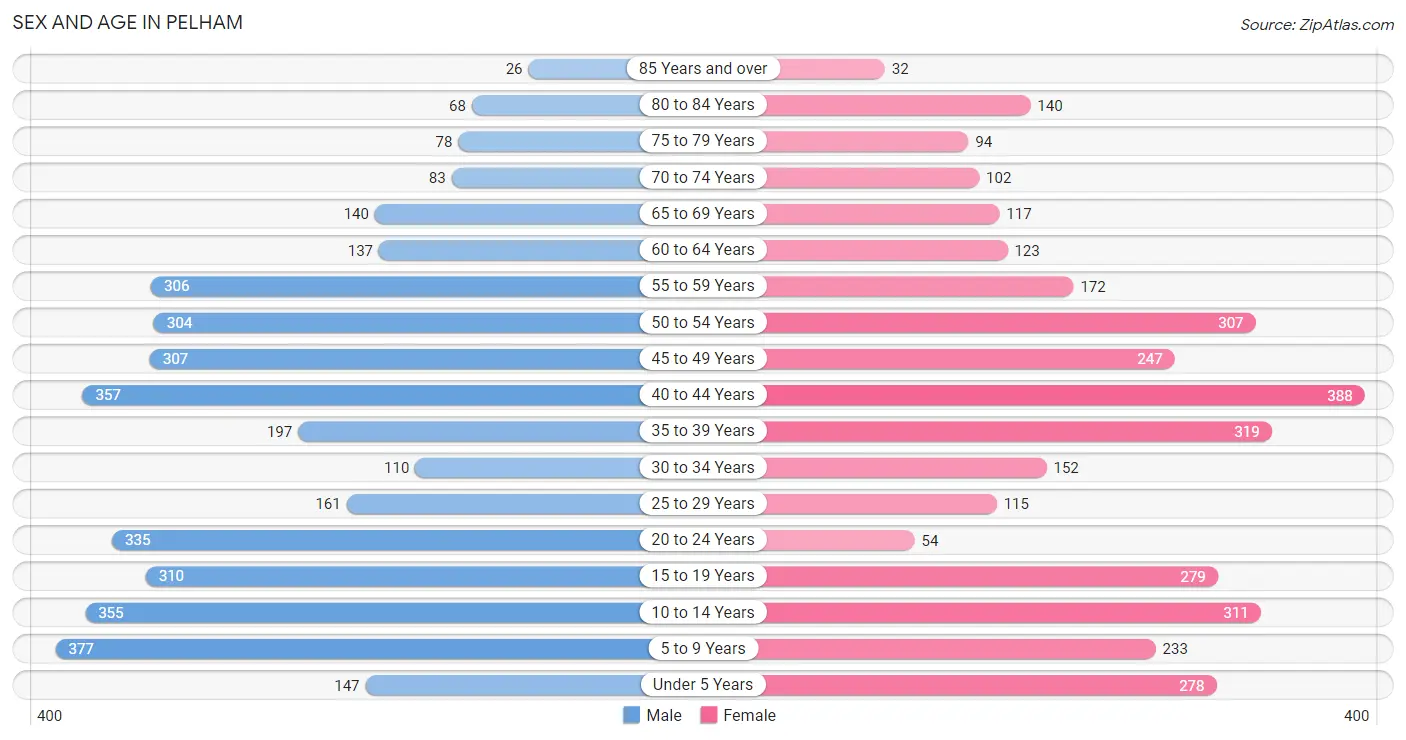
The most populous age groups in Pelham are 5 to 9 Years (377 | 9.9%) for men and 40 to 44 Years (388 | 11.2%) for women.
| Age Bracket | Male | Female |
| Under 5 Years | 147 (3.9%) | 278 (8.0%) |
| 5 to 9 Years | 377 (9.9%) | 233 (6.7%) |
| 10 to 14 Years | 355 (9.3%) | 311 (9.0%) |
| 15 to 19 Years | 310 (8.2%) | 279 (8.1%) |
| 20 to 24 Years | 335 (8.8%) | 54 (1.6%) |
| 25 to 29 Years | 161 (4.2%) | 115 (3.3%) |
| 30 to 34 Years | 110 (2.9%) | 152 (4.4%) |
| 35 to 39 Years | 197 (5.2%) | 319 (9.2%) |
| 40 to 44 Years | 357 (9.4%) | 388 (11.2%) |
| 45 to 49 Years | 307 (8.1%) | 247 (7.1%) |
| 50 to 54 Years | 304 (8.0%) | 307 (8.9%) |
| 55 to 59 Years | 306 (8.1%) | 172 (5.0%) |
| 60 to 64 Years | 137 (3.6%) | 123 (3.5%) |
| 65 to 69 Years | 140 (3.7%) | 117 (3.4%) |
| 70 to 74 Years | 83 (2.2%) | 102 (2.9%) |
| 75 to 79 Years | 78 (2.1%) | 94 (2.7%) |
| 80 to 84 Years | 68 (1.8%) | 140 (4.0%) |
| 85 Years and over | 26 (0.7%) | 32 (0.9%) |
| Total | 3,798 (100.0%) | 3,463 (100.0%) |
Families and Households in Pelham
Median Family Size in Pelham
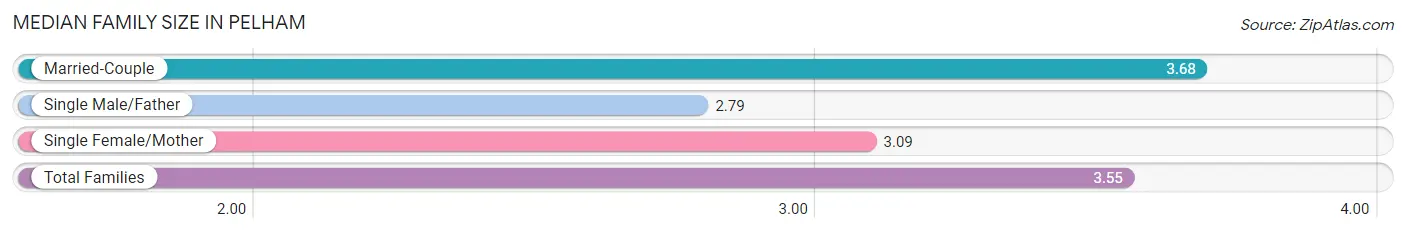
The median family size in Pelham is 3.55 persons per family, with married-couple families (1,518 | 81.3%) accounting for the largest median family size of 3.68 persons per family. On the other hand, single male/father families (103 | 5.5%) represent the smallest median family size with 2.79 persons per family.
| Family Type | # Families | Family Size |
| Married-Couple | 1,518 (81.3%) | 3.68 |
| Single Male/Father | 103 (5.5%) | 2.79 |
| Single Female/Mother | 247 (13.2%) | 3.09 |
| Total Families | 1,868 (100.0%) | 3.55 |
Median Household Size in Pelham
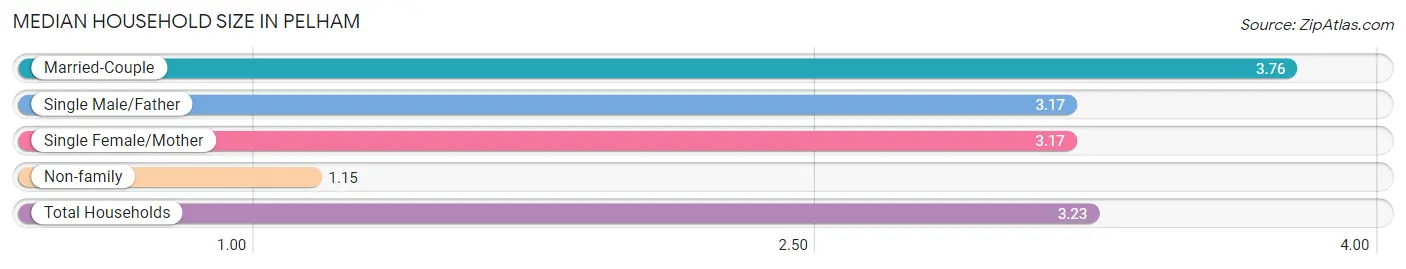
The median household size in Pelham is 3.23 persons per household, with married-couple households (1,518 | 67.6%) accounting for the largest median household size of 3.76 persons per household. non-family households (376 | 16.8%) represent the smallest median household size with 1.15 persons per household.
| Household Type | # Households | Household Size |
| Married-Couple | 1,518 (67.6%) | 3.76 |
| Single Male/Father | 103 (4.6%) | 3.17 |
| Single Female/Mother | 247 (11.0%) | 3.17 |
| Non-family | 376 (16.8%) | 1.15 |
| Total Households | 2,244 (100.0%) | 3.23 |
Household Size by Marriage Status in Pelham
Out of a total of 2,244 households in Pelham, 1,868 (83.2%) are family households, while 376 (16.8%) are nonfamily households. The most numerous type of family households are 4-person households, comprising 587, and the most common type of nonfamily households are 1-person households, comprising 340.
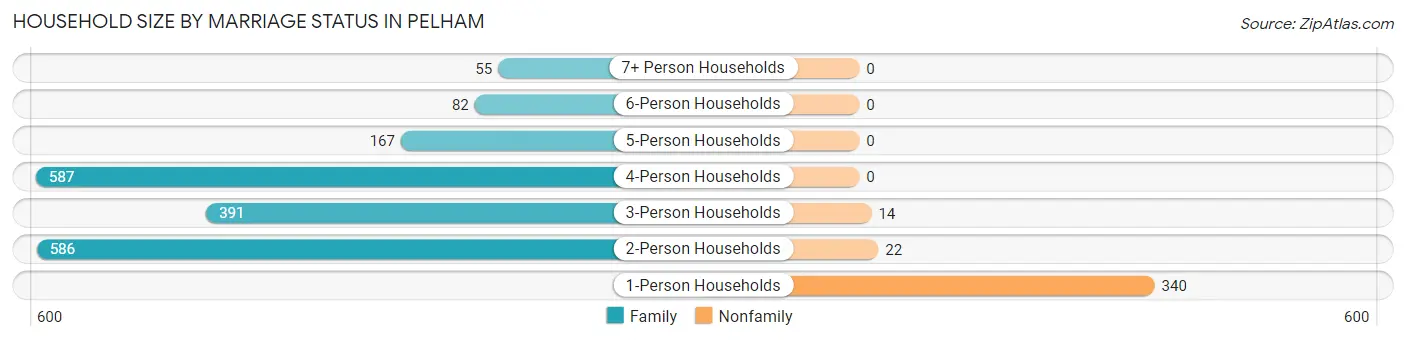
| Household Size | Family Households | Nonfamily Households |
| 1-Person Households | - | 340 (15.1%) |
| 2-Person Households | 586 (26.1%) | 22 (1.0%) |
| 3-Person Households | 391 (17.4%) | 14 (0.6%) |
| 4-Person Households | 587 (26.2%) | 0 (0.0%) |
| 5-Person Households | 167 (7.4%) | 0 (0.0%) |
| 6-Person Households | 82 (3.6%) | 0 (0.0%) |
| 7+ Person Households | 55 (2.5%) | 0 (0.0%) |
| Total | 1,868 (83.2%) | 376 (16.8%) |
Female Fertility in Pelham
Fertility by Age in Pelham
Average fertility rate in Pelham is 55.0 births per 1,000 women. Women in the age bracket of 20 to 34 years have the highest fertility rate with 100.0 births per 1,000 women. Women in the age bracket of 35 to 50 years acount for 63.2% of all women with births.
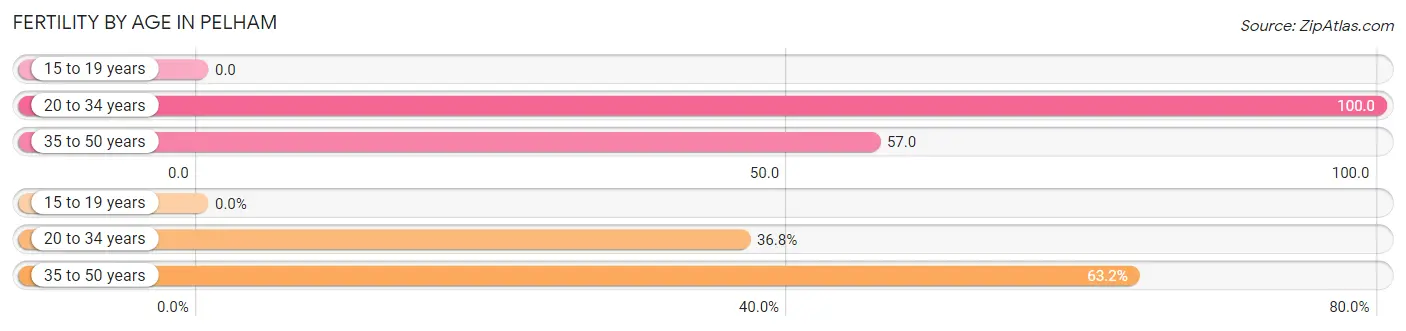
| Age Bracket | Women with Births | Births / 1,000 Women |
| 15 to 19 years | 0 (0.0%) | 0.0 |
| 20 to 34 years | 32 (36.8%) | 100.0 |
| 35 to 50 years | 55 (63.2%) | 57.0 |
| Total | 87 (100.0%) | 55.0 |
Fertility by Age by Marriage Status in Pelham
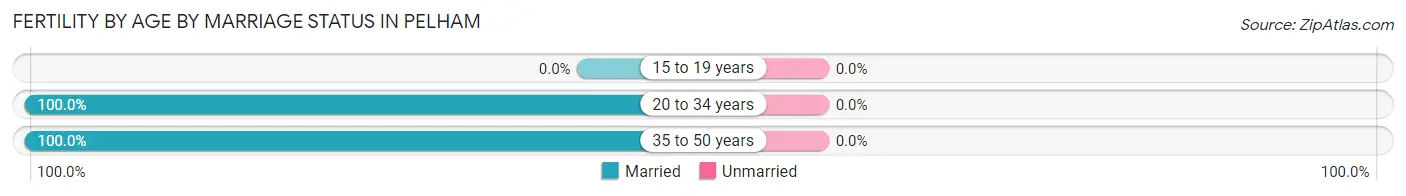
| Age Bracket | Married | Unmarried |
| 15 to 19 years | 0 (0.0%) | 0 (0.0%) |
| 20 to 34 years | 32 (100.0%) | 0 (0.0%) |
| 35 to 50 years | 55 (100.0%) | 0 (0.0%) |
| Total | 87 (100.0%) | 0 (0.0%) |
Fertility by Education in Pelham
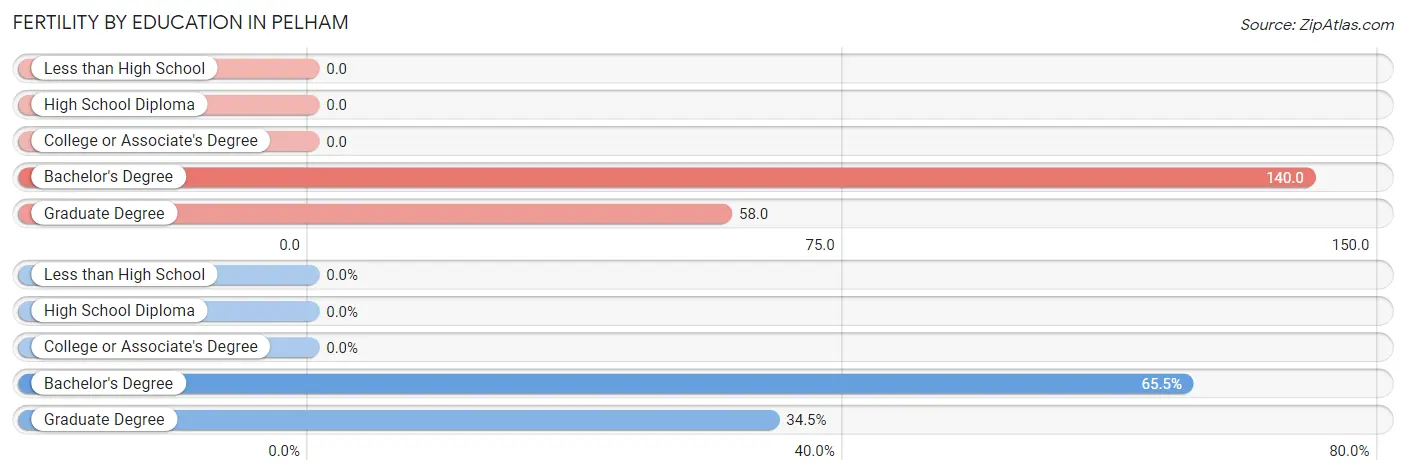
| Educational Attainment | Women with Births | Births / 1,000 Women |
| Less than High School | 0 (0.0%) | 0.0 |
| High School Diploma | 0 (0.0%) | 0.0 |
| College or Associate's Degree | 0 (0.0%) | 0.0 |
| Bachelor's Degree | 57 (65.5%) | 140.0 |
| Graduate Degree | 30 (34.5%) | 58.0 |
| Total | 87 (100.0%) | 55.0 |
Fertility by Education by Marriage Status in Pelham
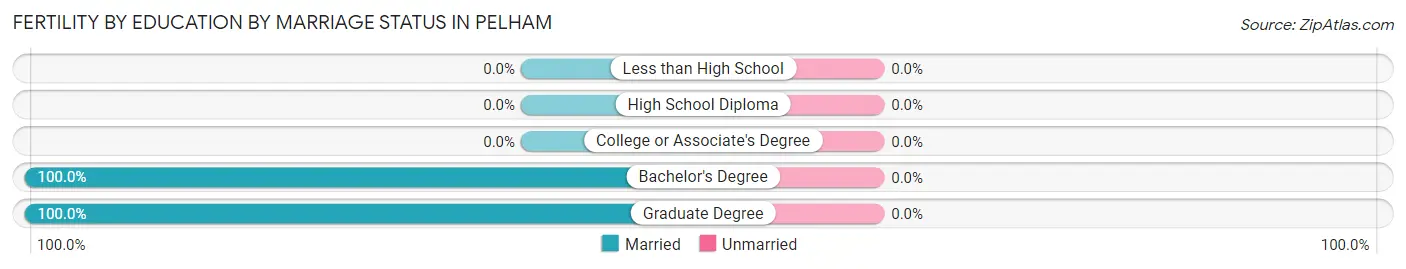
| Educational Attainment | Married | Unmarried |
| Less than High School | 0 (0.0%) | 0 (0.0%) |
| High School Diploma | 0 (0.0%) | 0 (0.0%) |
| College or Associate's Degree | 0 (0.0%) | 0 (0.0%) |
| Bachelor's Degree | 57 (100.0%) | 0 (0.0%) |
| Graduate Degree | 30 (100.0%) | 0 (0.0%) |
| Total | 87 (100.0%) | 0 (0.0%) |
Employment Characteristics in Pelham
Employment by Class of Employer in Pelham
Among the 3,498 employed individuals in Pelham, private company employees (2,233 | 63.8%), not-for-profit organizations (376 | 10.7%), and local government employees (336 | 9.6%) make up the most common classes of employment.
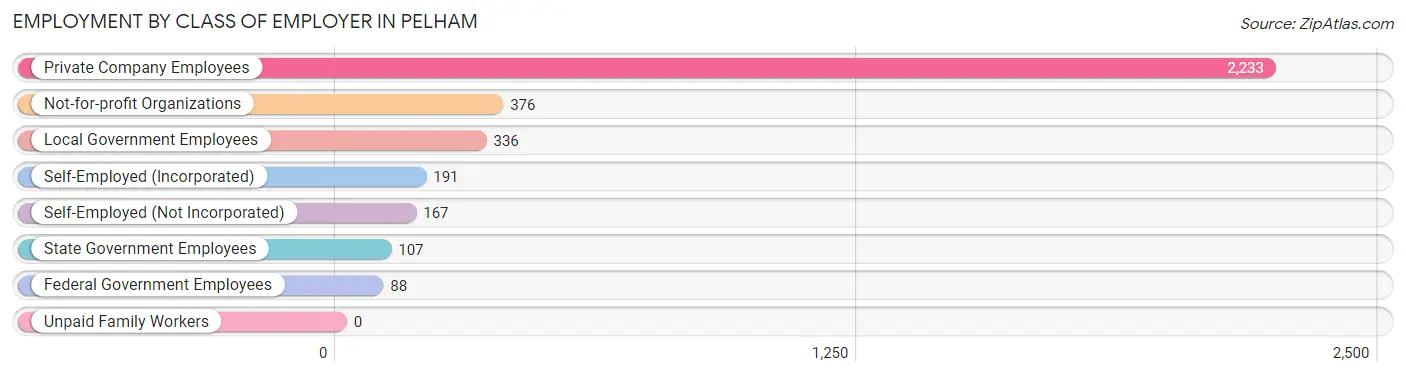
| Employer Class | # Employees | % Employees |
| Private Company Employees | 2,233 | 63.8% |
| Self-Employed (Incorporated) | 191 | 5.5% |
| Self-Employed (Not Incorporated) | 167 | 4.8% |
| Not-for-profit Organizations | 376 | 10.7% |
| Local Government Employees | 336 | 9.6% |
| State Government Employees | 107 | 3.1% |
| Federal Government Employees | 88 | 2.5% |
| Unpaid Family Workers | 0 | 0.0% |
| Total | 3,498 | 100.0% |
Employment Status by Age in Pelham
According to the labor force statistics for Pelham, out of the total population over 16 years of age (5,369), 70.8% or 3,801 individuals are in the labor force, with 6.2% or 236 of them unemployed. The age group with the highest labor force participation rate is 30 to 34 years, with 89.7% or 235 individuals in the labor force. Within the labor force, the 60 to 64 years age range has the highest percentage of unemployed individuals, with 12.9% or 23 of them being unemployed.
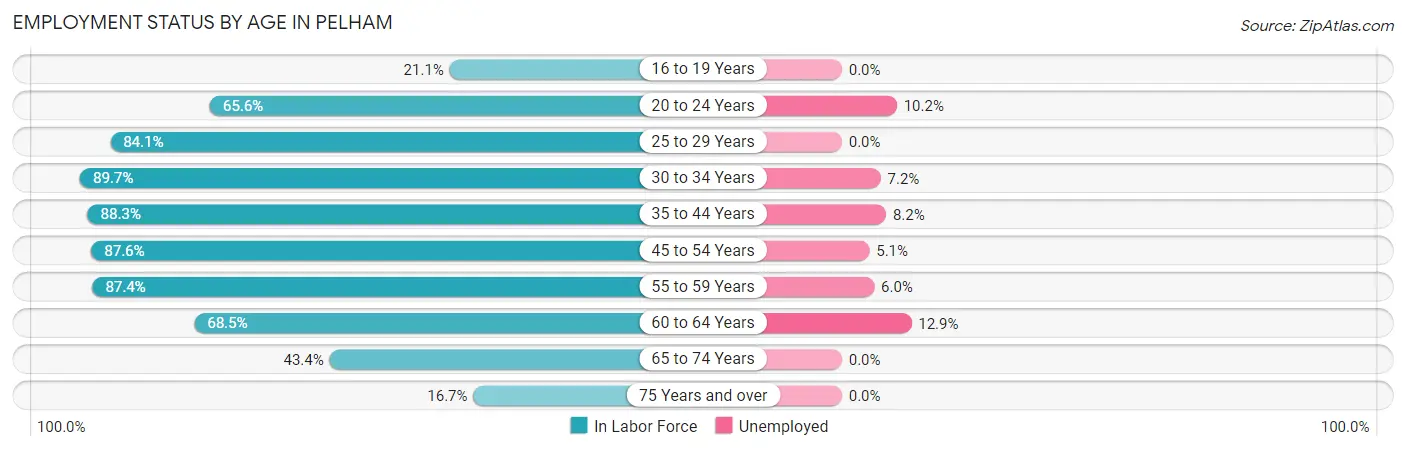
| Age Bracket | In Labor Force | Unemployed |
| 16 to 19 Years | 84 (21.1%) | 0 (0.0%) |
| 20 to 24 Years | 255 (65.6%) | 26 (10.2%) |
| 25 to 29 Years | 232 (84.1%) | 0 (0.0%) |
| 30 to 34 Years | 235 (89.7%) | 17 (7.2%) |
| 35 to 44 Years | 1,113 (88.3%) | 91 (8.2%) |
| 45 to 54 Years | 1,021 (87.6%) | 52 (5.1%) |
| 55 to 59 Years | 418 (87.4%) | 25 (6.0%) |
| 60 to 64 Years | 178 (68.5%) | 23 (12.9%) |
| 65 to 74 Years | 192 (43.4%) | 0 (0.0%) |
| 75 Years and over | 73 (16.7%) | 0 (0.0%) |
| Total | 3,801 (70.8%) | 236 (6.2%) |
Employment Status by Educational Attainment in Pelham
According to labor force statistics for Pelham, 86.4% of individuals (3,199) out of the total population between 25 and 64 years of age (3,702) are in the labor force, with 6.5% or 208 of them being unemployed. The group with the highest labor force participation rate are those with the educational attainment of bachelor's degree or higher, with 88.5% or 2,246 individuals in the labor force. Within the labor force, individuals with less than high school education have the highest percentage of unemployment, with 21.6% or 11 of them being unemployed.
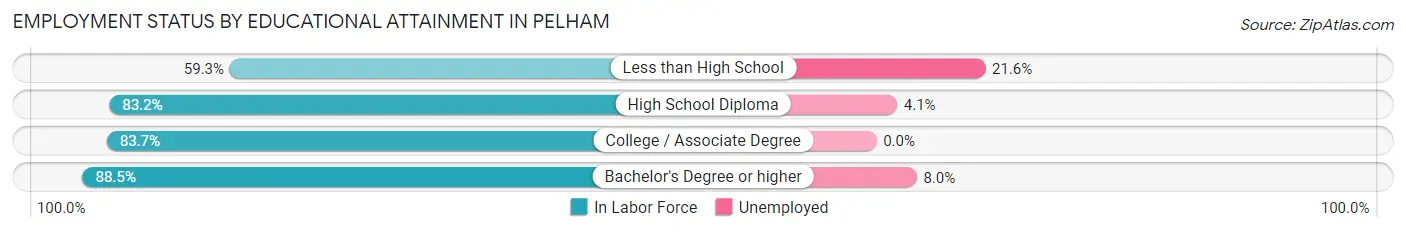
| Educational Attainment | In Labor Force | Unemployed |
| Less than High School | 51 (59.3%) | 19 (21.6%) |
| High School Diploma | 416 (83.2%) | 20 (4.1%) |
| College / Associate Degree | 484 (83.7%) | 0 (0.0%) |
| Bachelor's Degree or higher | 2,246 (88.5%) | 203 (8.0%) |
| Total | 3,199 (86.4%) | 241 (6.5%) |
Employment Occupations by Sex in Pelham
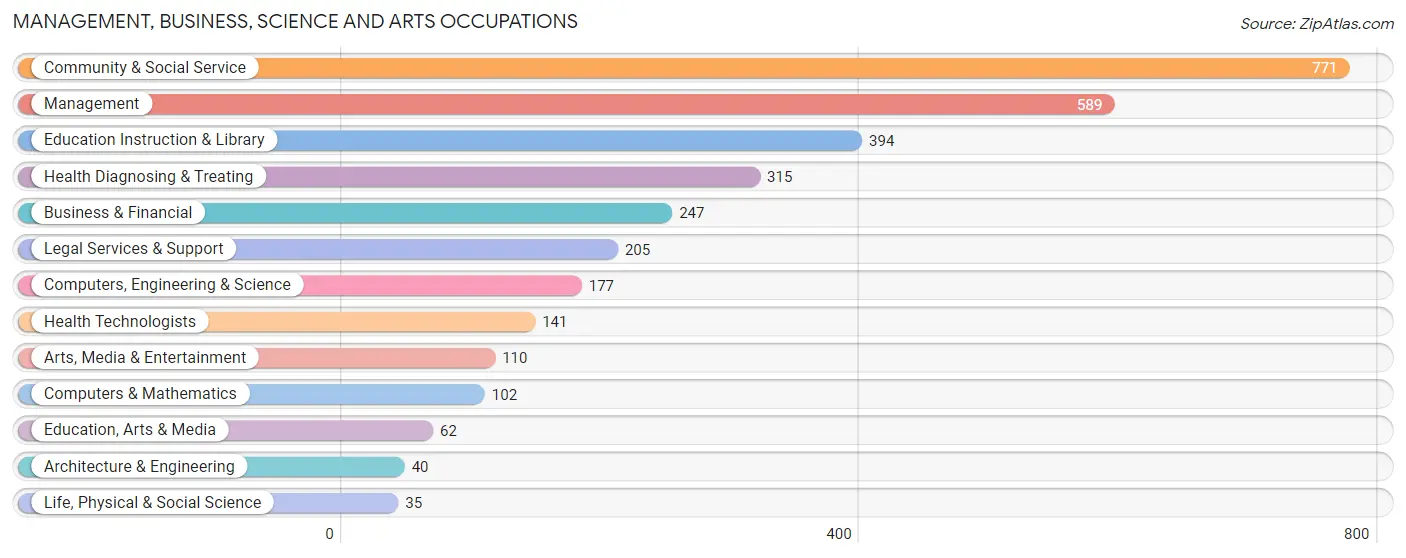
Management, Business, Science and Arts Occupations
The most common Management, Business, Science and Arts occupations in Pelham are Community & Social Service (771 | 21.6%), Management (589 | 16.5%), Education Instruction & Library (394 | 11.1%), Health Diagnosing & Treating (315 | 8.8%), and Business & Financial (247 | 6.9%).
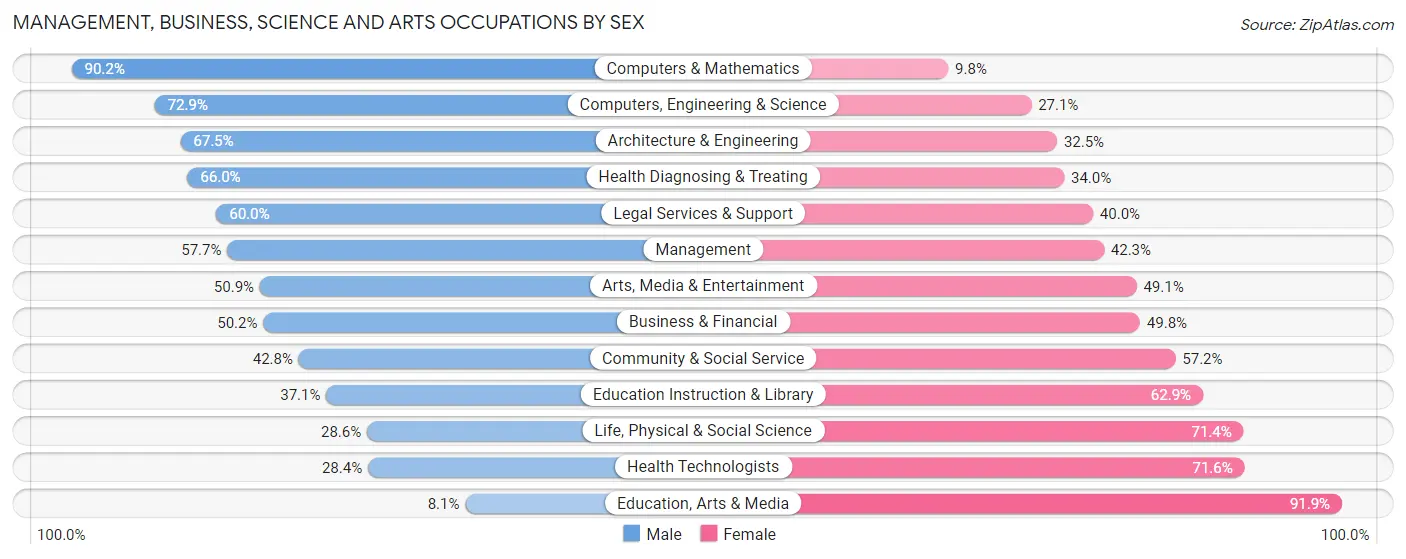
Management, Business, Science and Arts Occupations by Sex
Within the Management, Business, Science and Arts occupations in Pelham, the most male-oriented occupations are Computers & Mathematics (90.2%), Computers, Engineering & Science (72.9%), and Architecture & Engineering (67.5%), while the most female-oriented occupations are Education, Arts & Media (91.9%), Health Technologists (71.6%), and Life, Physical & Social Science (71.4%).
| Occupation | Male | Female |
| Management | 340 (57.7%) | 249 (42.3%) |
| Business & Financial | 124 (50.2%) | 123 (49.8%) |
| Computers, Engineering & Science | 129 (72.9%) | 48 (27.1%) |
| Computers & Mathematics | 92 (90.2%) | 10 (9.8%) |
| Architecture & Engineering | 27 (67.5%) | 13 (32.5%) |
| Life, Physical & Social Science | 10 (28.6%) | 25 (71.4%) |
| Community & Social Service | 330 (42.8%) | 441 (57.2%) |
| Education, Arts & Media | 5 (8.1%) | 57 (91.9%) |
| Legal Services & Support | 123 (60.0%) | 82 (40.0%) |
| Education Instruction & Library | 146 (37.1%) | 248 (62.9%) |
| Arts, Media & Entertainment | 56 (50.9%) | 54 (49.1%) |
| Health Diagnosing & Treating | 208 (66.0%) | 107 (34.0%) |
| Health Technologists | 40 (28.4%) | 101 (71.6%) |
| Total (Category) | 1,131 (53.9%) | 968 (46.1%) |
| Total (Overall) | 2,047 (57.4%) | 1,520 (42.6%) |
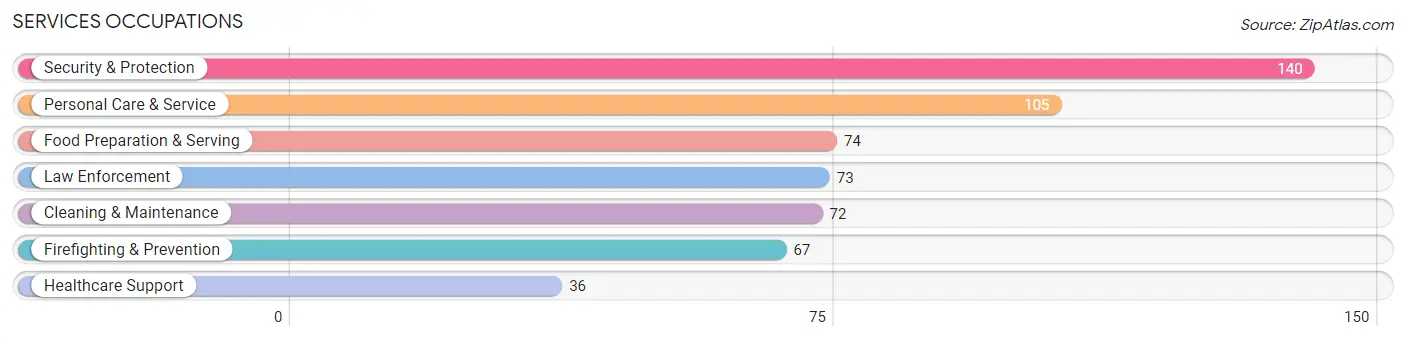
Services Occupations
The most common Services occupations in Pelham are Security & Protection (140 | 3.9%), Personal Care & Service (105 | 2.9%), Food Preparation & Serving (74 | 2.1%), Law Enforcement (73 | 2.1%), and Cleaning & Maintenance (72 | 2.0%).
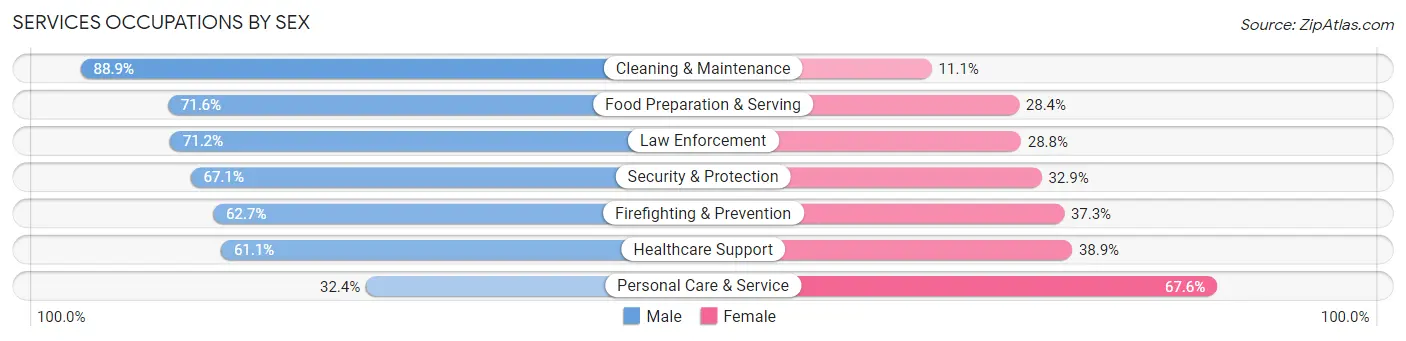
Services Occupations by Sex
Within the Services occupations in Pelham, the most male-oriented occupations are Cleaning & Maintenance (88.9%), Food Preparation & Serving (71.6%), and Law Enforcement (71.2%), while the most female-oriented occupations are Personal Care & Service (67.6%), Healthcare Support (38.9%), and Firefighting & Prevention (37.3%).
| Occupation | Male | Female |
| Healthcare Support | 22 (61.1%) | 14 (38.9%) |
| Security & Protection | 94 (67.1%) | 46 (32.9%) |
| Firefighting & Prevention | 42 (62.7%) | 25 (37.3%) |
| Law Enforcement | 52 (71.2%) | 21 (28.8%) |
| Food Preparation & Serving | 53 (71.6%) | 21 (28.4%) |
| Cleaning & Maintenance | 64 (88.9%) | 8 (11.1%) |
| Personal Care & Service | 34 (32.4%) | 71 (67.6%) |
| Total (Category) | 267 (62.5%) | 160 (37.5%) |
| Total (Overall) | 2,047 (57.4%) | 1,520 (42.6%) |
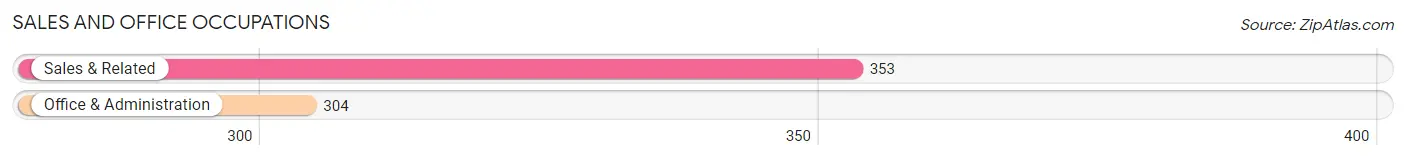
Sales and Office Occupations
The most common Sales and Office occupations in Pelham are Sales & Related (353 | 9.9%), and Office & Administration (304 | 8.5%).
Sales and Office Occupations by Sex
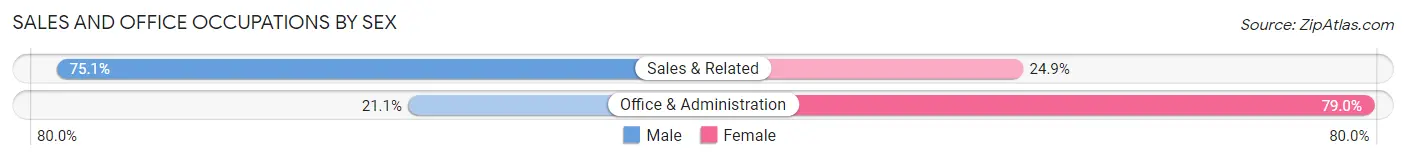
| Occupation | Male | Female |
| Sales & Related | 265 (75.1%) | 88 (24.9%) |
| Office & Administration | 64 (21.0%) | 240 (78.9%) |
| Total (Category) | 329 (50.1%) | 328 (49.9%) |
| Total (Overall) | 2,047 (57.4%) | 1,520 (42.6%) |
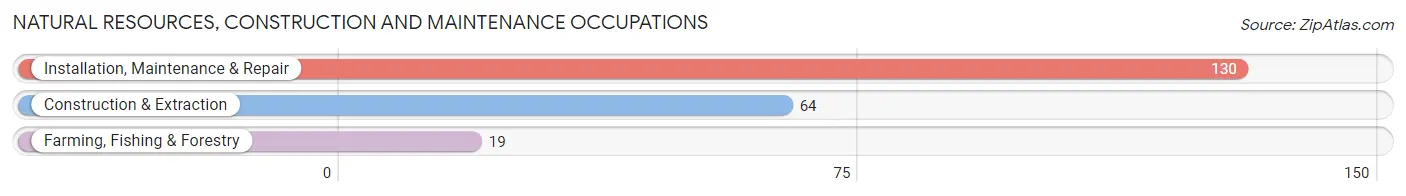
Natural Resources, Construction and Maintenance Occupations
The most common Natural Resources, Construction and Maintenance occupations in Pelham are Installation, Maintenance & Repair (130 | 3.6%), Construction & Extraction (64 | 1.8%), and Farming, Fishing & Forestry (19 | 0.5%).
Natural Resources, Construction and Maintenance Occupations by Sex
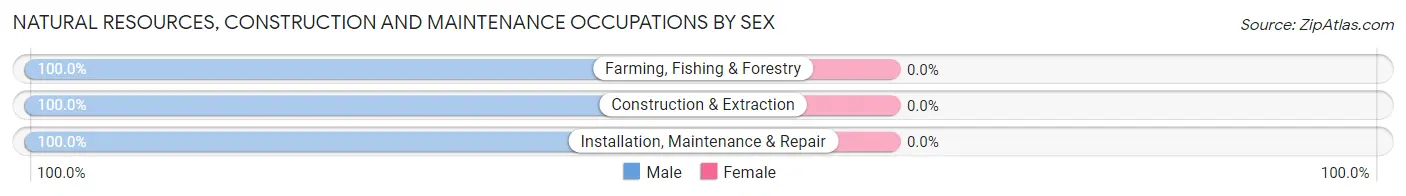
| Occupation | Male | Female |
| Farming, Fishing & Forestry | 19 (100.0%) | 0 (0.0%) |
| Construction & Extraction | 64 (100.0%) | 0 (0.0%) |
| Installation, Maintenance & Repair | 130 (100.0%) | 0 (0.0%) |
| Total (Category) | 213 (100.0%) | 0 (0.0%) |
| Total (Overall) | 2,047 (57.4%) | 1,520 (42.6%) |
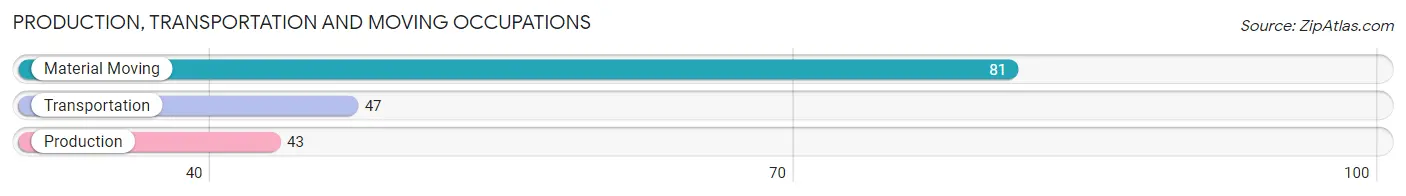
Production, Transportation and Moving Occupations
The most common Production, Transportation and Moving occupations in Pelham are Material Moving (81 | 2.3%), Transportation (47 | 1.3%), and Production (43 | 1.2%).
Production, Transportation and Moving Occupations by Sex
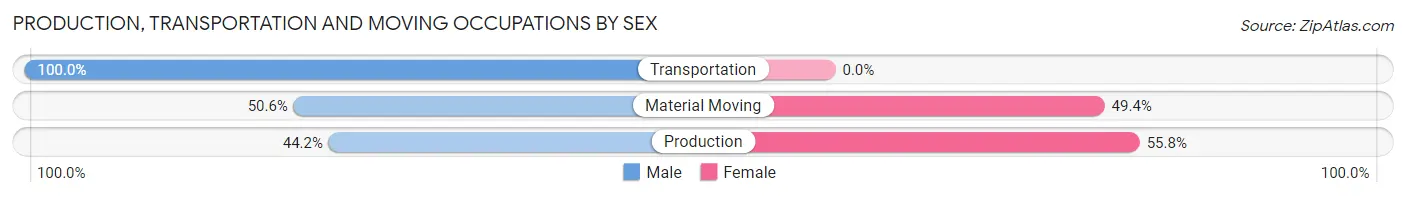
| Occupation | Male | Female |
| Production | 19 (44.2%) | 24 (55.8%) |
| Transportation | 47 (100.0%) | 0 (0.0%) |
| Material Moving | 41 (50.6%) | 40 (49.4%) |
| Total (Category) | 107 (62.6%) | 64 (37.4%) |
| Total (Overall) | 2,047 (57.4%) | 1,520 (42.6%) |
Employment Industries by Sex in Pelham
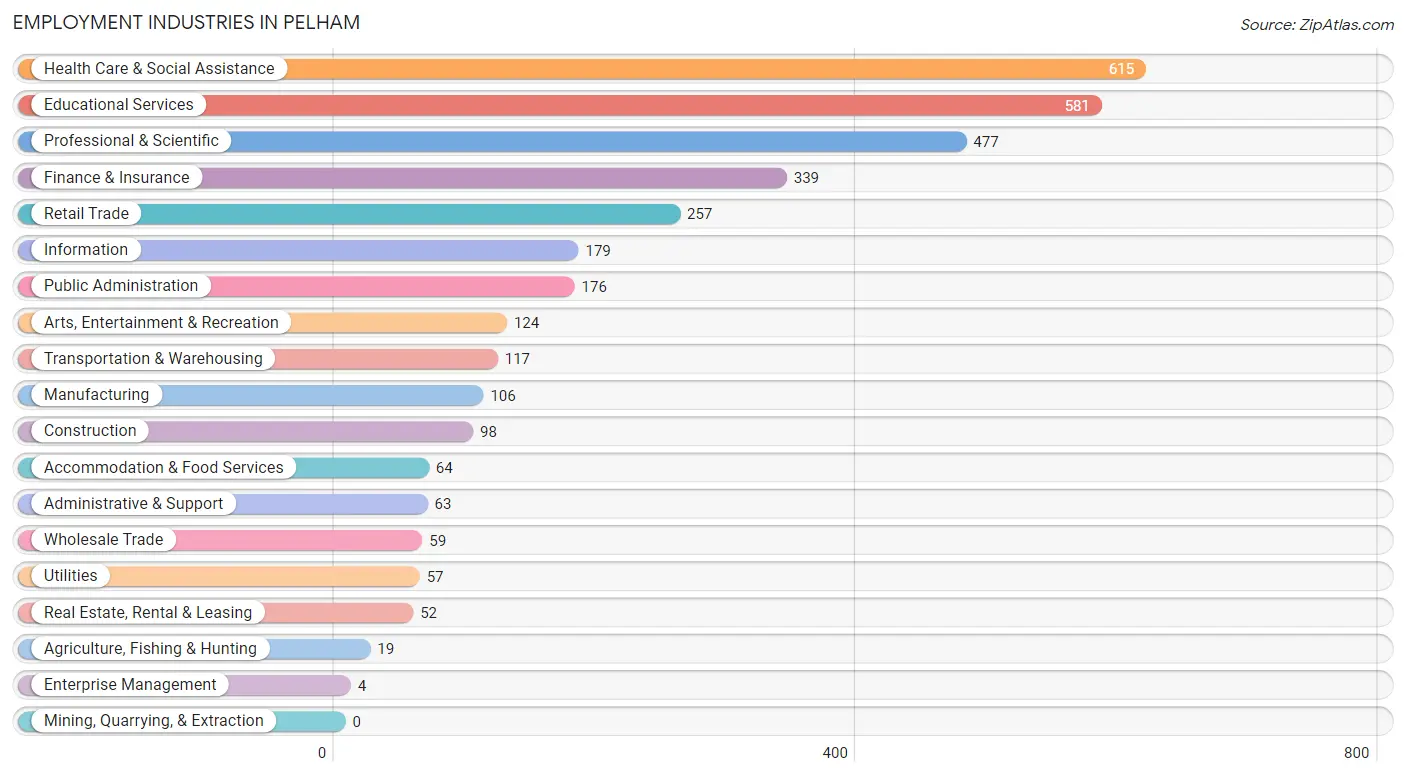
Employment Industries in Pelham
The major employment industries in Pelham include Health Care & Social Assistance (615 | 17.2%), Educational Services (581 | 16.3%), Professional & Scientific (477 | 13.4%), Finance & Insurance (339 | 9.5%), and Retail Trade (257 | 7.2%).
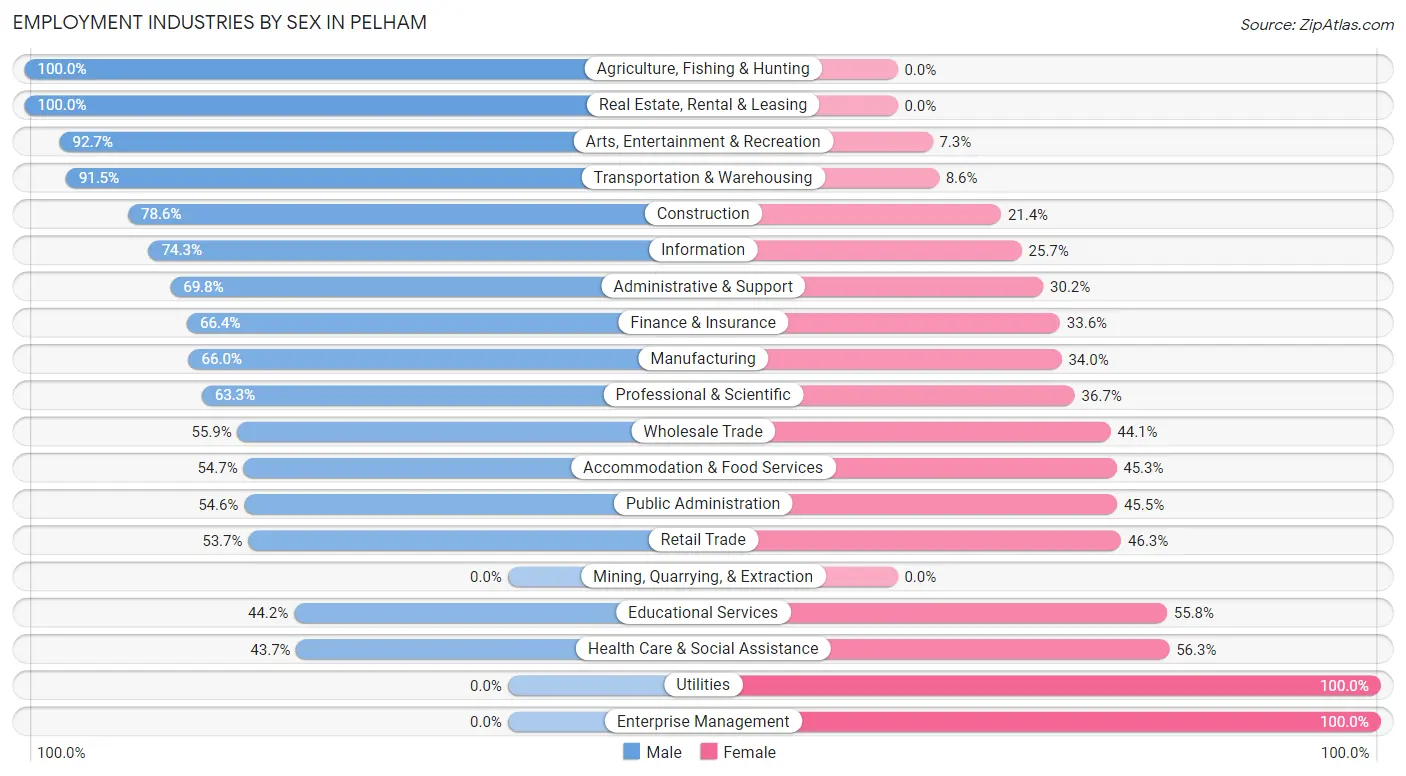
Employment Industries by Sex in Pelham
The Pelham industries that see more men than women are Agriculture, Fishing & Hunting (100.0%), Real Estate, Rental & Leasing (100.0%), and Arts, Entertainment & Recreation (92.7%), whereas the industries that tend to have a higher number of women are Utilities (100.0%), Enterprise Management (100.0%), and Health Care & Social Assistance (56.3%).
| Industry | Male | Female |
| Agriculture, Fishing & Hunting | 19 (100.0%) | 0 (0.0%) |
| Mining, Quarrying, & Extraction | 0 (0.0%) | 0 (0.0%) |
| Construction | 77 (78.6%) | 21 (21.4%) |
| Manufacturing | 70 (66.0%) | 36 (34.0%) |
| Wholesale Trade | 33 (55.9%) | 26 (44.1%) |
| Retail Trade | 138 (53.7%) | 119 (46.3%) |
| Transportation & Warehousing | 107 (91.4%) | 10 (8.6%) |
| Utilities | 0 (0.0%) | 57 (100.0%) |
| Information | 133 (74.3%) | 46 (25.7%) |
| Finance & Insurance | 225 (66.4%) | 114 (33.6%) |
| Real Estate, Rental & Leasing | 52 (100.0%) | 0 (0.0%) |
| Professional & Scientific | 302 (63.3%) | 175 (36.7%) |
| Enterprise Management | 0 (0.0%) | 4 (100.0%) |
| Administrative & Support | 44 (69.8%) | 19 (30.2%) |
| Educational Services | 257 (44.2%) | 324 (55.8%) |
| Health Care & Social Assistance | 269 (43.7%) | 346 (56.3%) |
| Arts, Entertainment & Recreation | 115 (92.7%) | 9 (7.3%) |
| Accommodation & Food Services | 35 (54.7%) | 29 (45.3%) |
| Public Administration | 96 (54.5%) | 80 (45.5%) |
| Total | 2,047 (57.4%) | 1,520 (42.6%) |
Education in Pelham
School Enrollment in Pelham
The most common levels of schooling among the 2,468 students in Pelham are high school (585 | 23.7%), middle school (545 | 22.1%), and elementary school (535 | 21.7%).
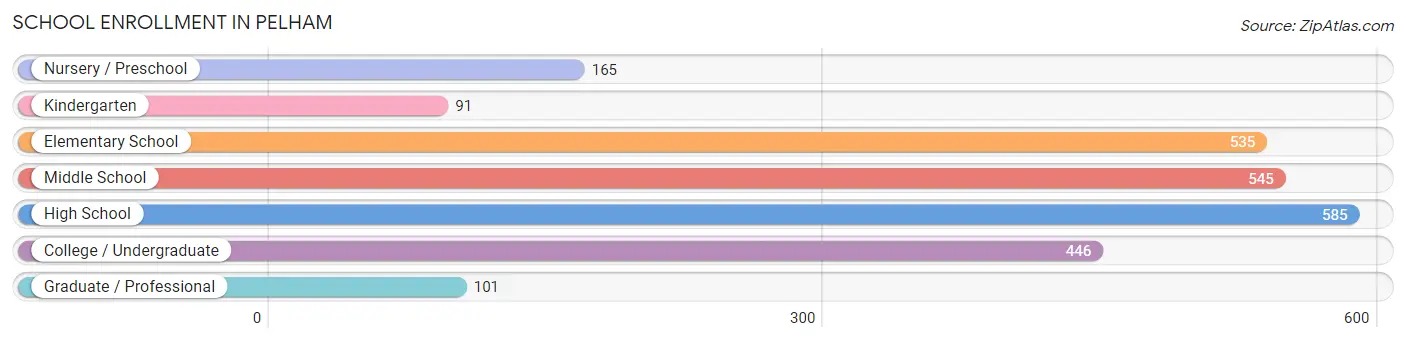
| School Level | # Students | % Students |
| Nursery / Preschool | 165 | 6.7% |
| Kindergarten | 91 | 3.7% |
| Elementary School | 535 | 21.7% |
| Middle School | 545 | 22.1% |
| High School | 585 | 23.7% |
| College / Undergraduate | 446 | 18.1% |
| Graduate / Professional | 101 | 4.1% |
| Total | 2,468 | 100.0% |
School Enrollment by Age by Funding Source in Pelham
Out of a total of 2,468 students who are enrolled in schools in Pelham, 464 (18.8%) attend a private institution, while the remaining 2,004 (81.2%) are enrolled in public schools. The age group of 25 to 34 year olds has the highest likelihood of being enrolled in private schools, with 57 (86.4% in the age bracket) enrolled. Conversely, the age group of 15 to 17 year olds has the lowest likelihood of being enrolled in a private school, with 457 (96.6% in the age bracket) attending a public institution.
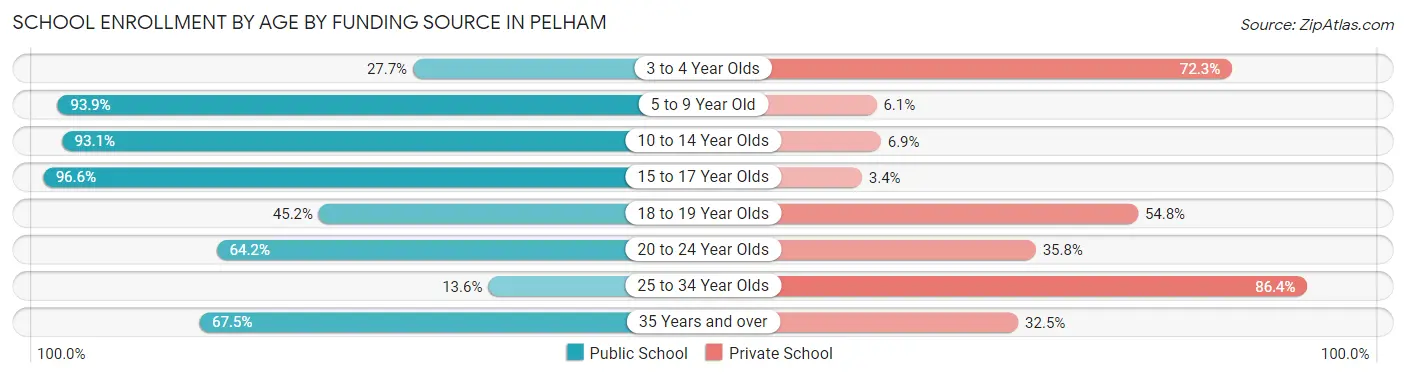
| Age Bracket | Public School | Private School |
| 3 to 4 Year Olds | 44 (27.7%) | 115 (72.3%) |
| 5 to 9 Year Old | 569 (93.9%) | 37 (6.1%) |
| 10 to 14 Year Olds | 620 (93.1%) | 46 (6.9%) |
| 15 to 17 Year Olds | 457 (96.6%) | 16 (3.4%) |
| 18 to 19 Year Olds | 47 (45.2%) | 57 (54.8%) |
| 20 to 24 Year Olds | 176 (64.2%) | 98 (35.8%) |
| 25 to 34 Year Olds | 9 (13.6%) | 57 (86.4%) |
| 35 Years and over | 81 (67.5%) | 39 (32.5%) |
| Total | 2,004 (81.2%) | 464 (18.8%) |
Educational Attainment by Field of Study in Pelham
Business (541 | 16.8%), social sciences (501 | 15.6%), liberal arts & history (346 | 10.8%), science & technology (257 | 8.0%), and literature & languages (236 | 7.3%) are the most common fields of study among 3,217 individuals in Pelham who have obtained a bachelor's degree or higher.
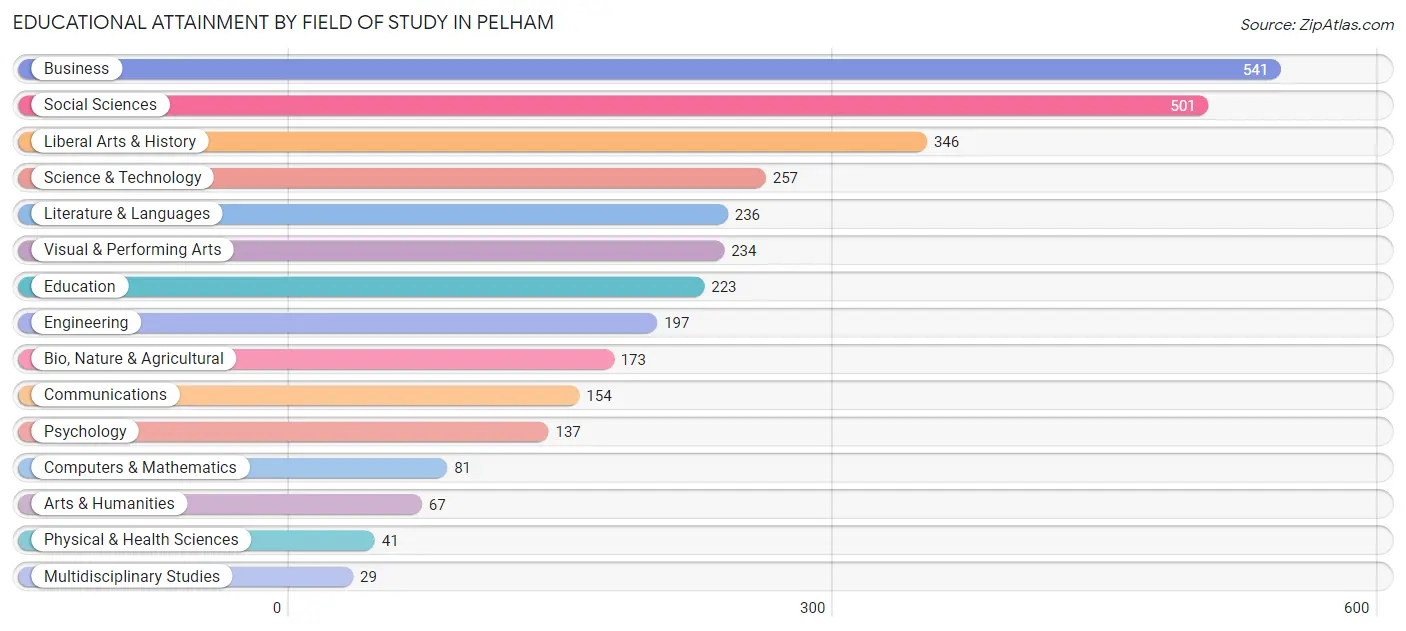
| Field of Study | # Graduates | % Graduates |
| Computers & Mathematics | 81 | 2.5% |
| Bio, Nature & Agricultural | 173 | 5.4% |
| Physical & Health Sciences | 41 | 1.3% |
| Psychology | 137 | 4.3% |
| Social Sciences | 501 | 15.6% |
| Engineering | 197 | 6.1% |
| Multidisciplinary Studies | 29 | 0.9% |
| Science & Technology | 257 | 8.0% |
| Business | 541 | 16.8% |
| Education | 223 | 6.9% |
| Literature & Languages | 236 | 7.3% |
| Liberal Arts & History | 346 | 10.8% |
| Visual & Performing Arts | 234 | 7.3% |
| Communications | 154 | 4.8% |
| Arts & Humanities | 67 | 2.1% |
| Total | 3,217 | 100.0% |
Transportation & Commute in Pelham
Vehicle Availability by Sex in Pelham
The most prevalent vehicle ownership categories in Pelham are males with 1 vehicle (759, accounting for 37.8%) and females with 1 vehicle (465, making up 51.2%).
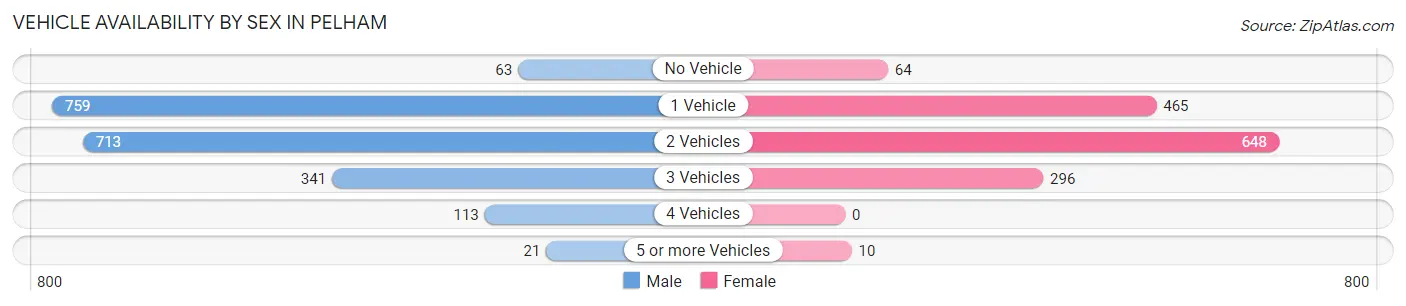
| Vehicles Available | Male | Female |
| No Vehicle | 63 (3.1%) | 64 (4.3%) |
| 1 Vehicle | 759 (37.8%) | 465 (31.4%) |
| 2 Vehicles | 713 (35.5%) | 648 (43.7%) |
| 3 Vehicles | 341 (17.0%) | 296 (20.0%) |
| 4 Vehicles | 113 (5.6%) | 0 (0.0%) |
| 5 or more Vehicles | 21 (1.0%) | 10 (0.7%) |
| Total | 2,010 (100.0%) | 1,483 (100.0%) |
Commute Time in Pelham
The most frequently occuring commute durations in Pelham are 45 to 59 minutes (607 commuters, 22.2%), 60 to 89 minutes (448 commuters, 16.4%), and 30 to 34 minutes (352 commuters, 12.9%).
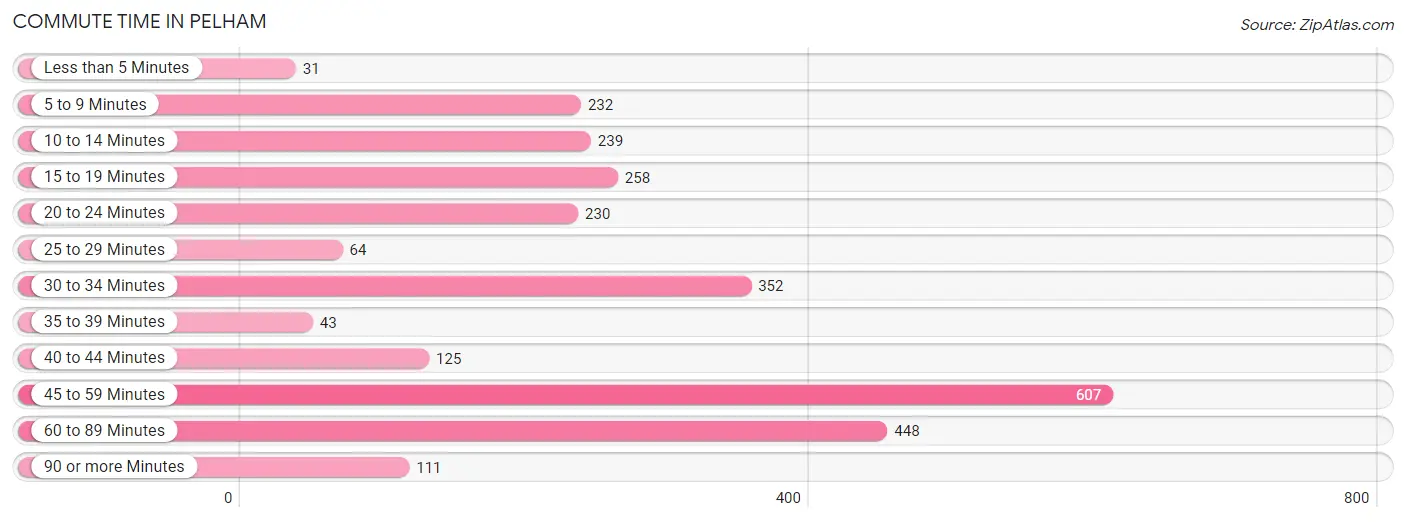
| Commute Time | # Commuters | % Commuters |
| Less than 5 Minutes | 31 | 1.1% |
| 5 to 9 Minutes | 232 | 8.5% |
| 10 to 14 Minutes | 239 | 8.7% |
| 15 to 19 Minutes | 258 | 9.4% |
| 20 to 24 Minutes | 230 | 8.4% |
| 25 to 29 Minutes | 64 | 2.3% |
| 30 to 34 Minutes | 352 | 12.9% |
| 35 to 39 Minutes | 43 | 1.6% |
| 40 to 44 Minutes | 125 | 4.6% |
| 45 to 59 Minutes | 607 | 22.2% |
| 60 to 89 Minutes | 448 | 16.4% |
| 90 or more Minutes | 111 | 4.1% |
Commute Time by Sex in Pelham
The most common commute times in Pelham are 45 to 59 minutes (464 commuters, 28.2%) for males and 60 to 89 minutes (228 commuters, 20.9%) for females.
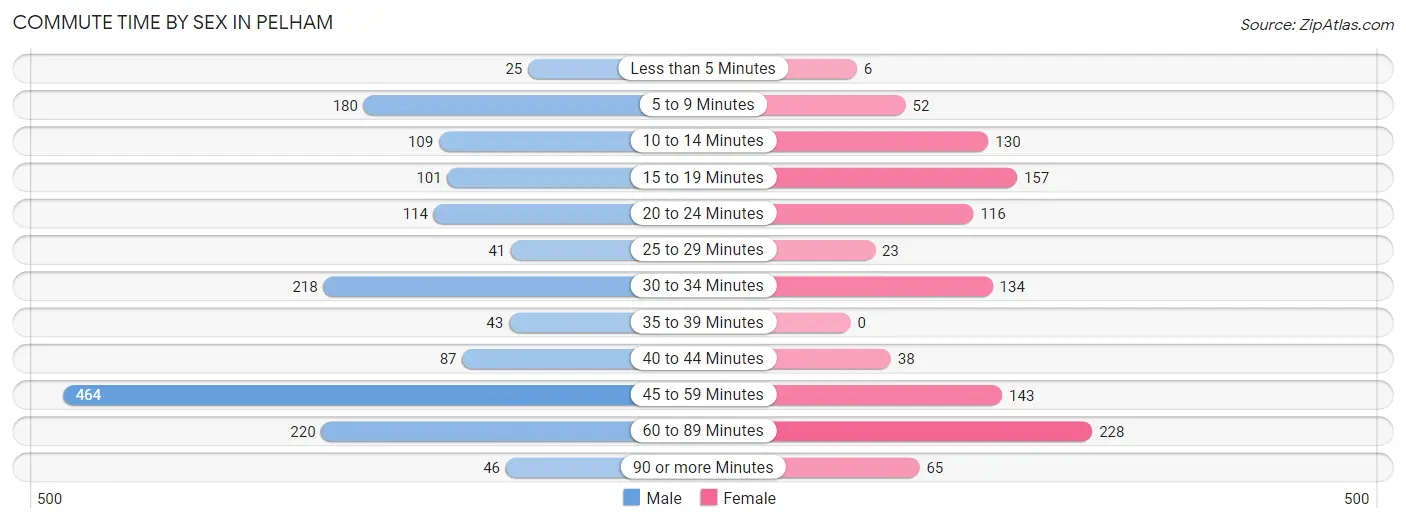
| Commute Time | Male | Female |
| Less than 5 Minutes | 25 (1.5%) | 6 (0.5%) |
| 5 to 9 Minutes | 180 (10.9%) | 52 (4.8%) |
| 10 to 14 Minutes | 109 (6.6%) | 130 (11.9%) |
| 15 to 19 Minutes | 101 (6.1%) | 157 (14.4%) |
| 20 to 24 Minutes | 114 (6.9%) | 116 (10.6%) |
| 25 to 29 Minutes | 41 (2.5%) | 23 (2.1%) |
| 30 to 34 Minutes | 218 (13.2%) | 134 (12.3%) |
| 35 to 39 Minutes | 43 (2.6%) | 0 (0.0%) |
| 40 to 44 Minutes | 87 (5.3%) | 38 (3.5%) |
| 45 to 59 Minutes | 464 (28.2%) | 143 (13.1%) |
| 60 to 89 Minutes | 220 (13.4%) | 228 (20.9%) |
| 90 or more Minutes | 46 (2.8%) | 65 (5.9%) |
Time of Departure to Work by Sex in Pelham
The most frequent times of departure to work in Pelham are 8:30 AM to 8:59 AM (270, 16.4%) for males and 7:00 AM to 7:29 AM (255, 23.4%) for females.
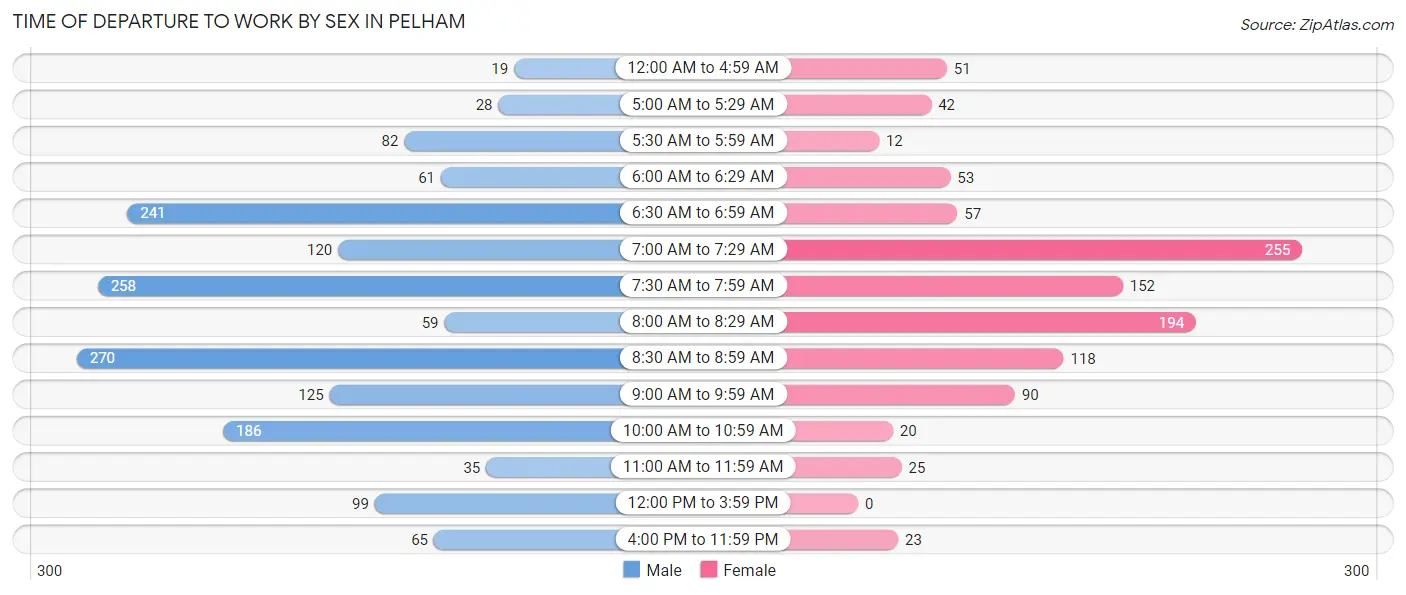
| Time of Departure | Male | Female |
| 12:00 AM to 4:59 AM | 19 (1.1%) | 51 (4.7%) |
| 5:00 AM to 5:29 AM | 28 (1.7%) | 42 (3.8%) |
| 5:30 AM to 5:59 AM | 82 (5.0%) | 12 (1.1%) |
| 6:00 AM to 6:29 AM | 61 (3.7%) | 53 (4.9%) |
| 6:30 AM to 6:59 AM | 241 (14.6%) | 57 (5.2%) |
| 7:00 AM to 7:29 AM | 120 (7.3%) | 255 (23.4%) |
| 7:30 AM to 7:59 AM | 258 (15.7%) | 152 (13.9%) |
| 8:00 AM to 8:29 AM | 59 (3.6%) | 194 (17.8%) |
| 8:30 AM to 8:59 AM | 270 (16.4%) | 118 (10.8%) |
| 9:00 AM to 9:59 AM | 125 (7.6%) | 90 (8.2%) |
| 10:00 AM to 10:59 AM | 186 (11.3%) | 20 (1.8%) |
| 11:00 AM to 11:59 AM | 35 (2.1%) | 25 (2.3%) |
| 12:00 PM to 3:59 PM | 99 (6.0%) | 0 (0.0%) |
| 4:00 PM to 11:59 PM | 65 (3.9%) | 23 (2.1%) |
| Total | 1,648 (100.0%) | 1,092 (100.0%) |
Housing Occupancy in Pelham
Occupancy by Ownership in Pelham
Of the total 2,244 dwellings in Pelham, owner-occupied units account for 1,589 (70.8%), while renter-occupied units make up 655 (29.2%).
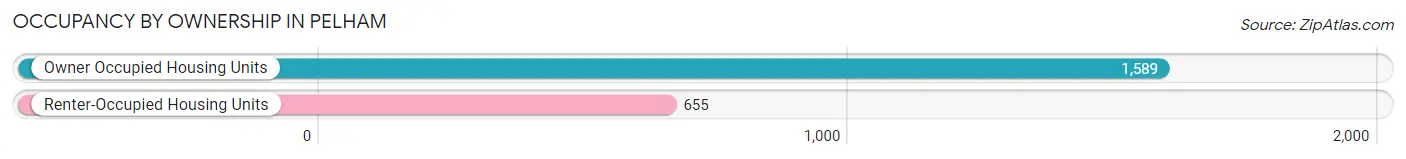
| Occupancy | # Housing Units | % Housing Units |
| Owner Occupied Housing Units | 1,589 | 70.8% |
| Renter-Occupied Housing Units | 655 | 29.2% |
| Total Occupied Housing Units | 2,244 | 100.0% |
Occupancy by Household Size in Pelham
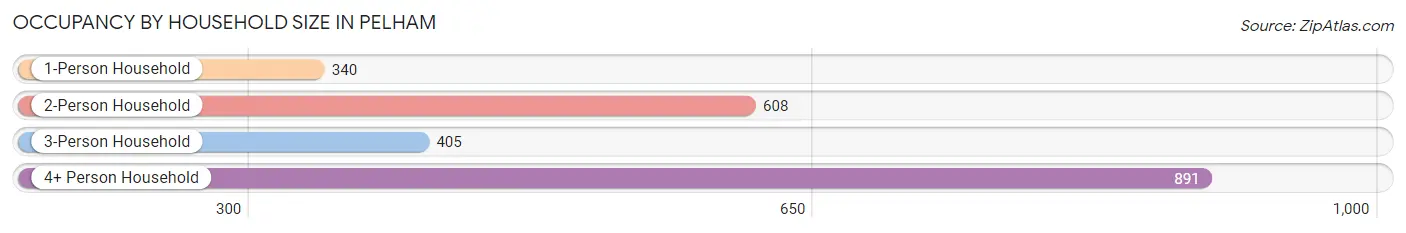
| Household Size | # Housing Units | % Housing Units |
| 1-Person Household | 340 | 15.1% |
| 2-Person Household | 608 | 27.1% |
| 3-Person Household | 405 | 18.0% |
| 4+ Person Household | 891 | 39.7% |
| Total Housing Units | 2,244 | 100.0% |
Occupancy by Ownership by Household Size in Pelham
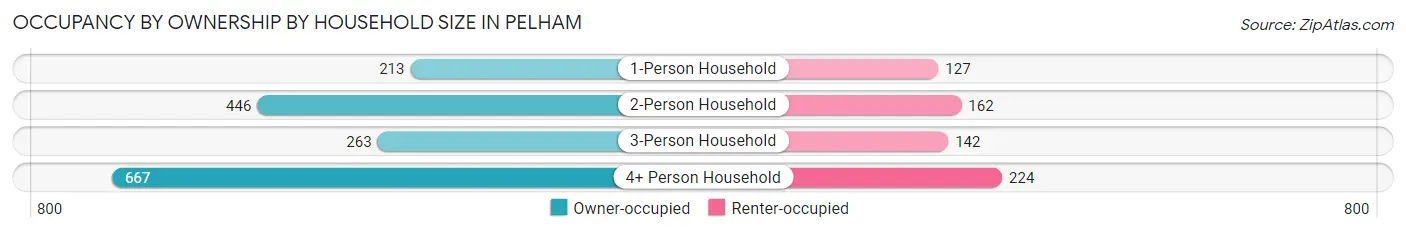
| Household Size | Owner-occupied | Renter-occupied |
| 1-Person Household | 213 (62.6%) | 127 (37.3%) |
| 2-Person Household | 446 (73.4%) | 162 (26.6%) |
| 3-Person Household | 263 (64.9%) | 142 (35.1%) |
| 4+ Person Household | 667 (74.9%) | 224 (25.1%) |
| Total Housing Units | 1,589 (70.8%) | 655 (29.2%) |
Occupancy by Educational Attainment in Pelham
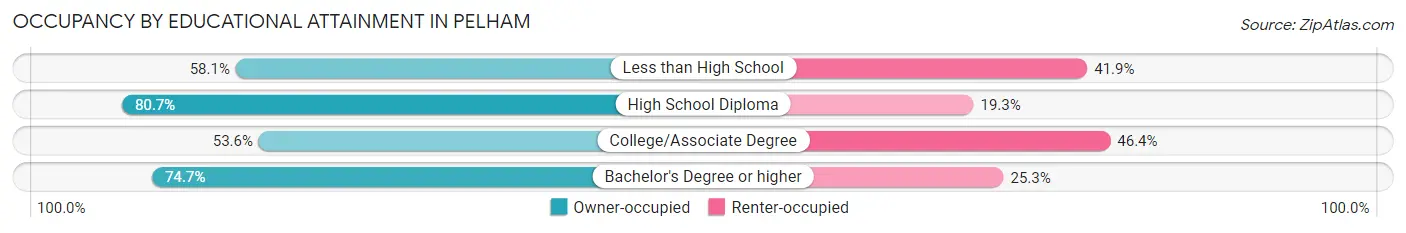
| Household Size | Owner-occupied | Renter-occupied |
| Less than High School | 25 (58.1%) | 18 (41.9%) |
| High School Diploma | 188 (80.7%) | 45 (19.3%) |
| College/Associate Degree | 240 (53.6%) | 208 (46.4%) |
| Bachelor's Degree or higher | 1,136 (74.7%) | 384 (25.3%) |
Occupancy by Age of Householder in Pelham
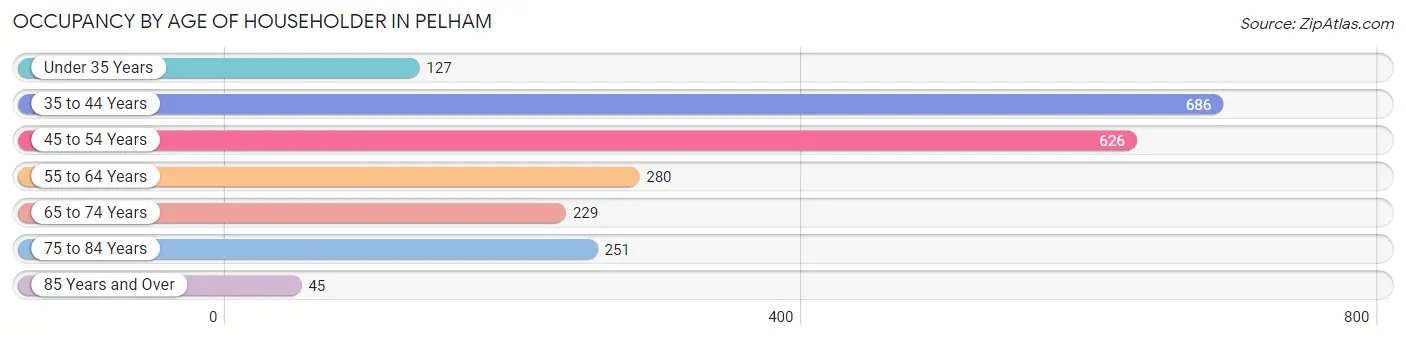
| Age Bracket | # Households | % Households |
| Under 35 Years | 127 | 5.7% |
| 35 to 44 Years | 686 | 30.6% |
| 45 to 54 Years | 626 | 27.9% |
| 55 to 64 Years | 280 | 12.5% |
| 65 to 74 Years | 229 | 10.2% |
| 75 to 84 Years | 251 | 11.2% |
| 85 Years and Over | 45 | 2.0% |
| Total | 2,244 | 100.0% |
Housing Finances in Pelham
Median Income by Occupancy in Pelham
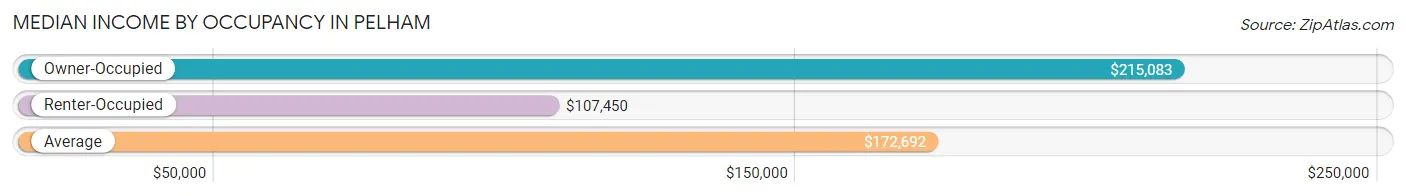
| Occupancy Type | # Households | Median Income |
| Owner-Occupied | 1,589 (70.8%) | $215,083 |
| Renter-Occupied | 655 (29.2%) | $107,450 |
| Average | 2,244 (100.0%) | $172,692 |
Occupancy by Householder Income Bracket in Pelham
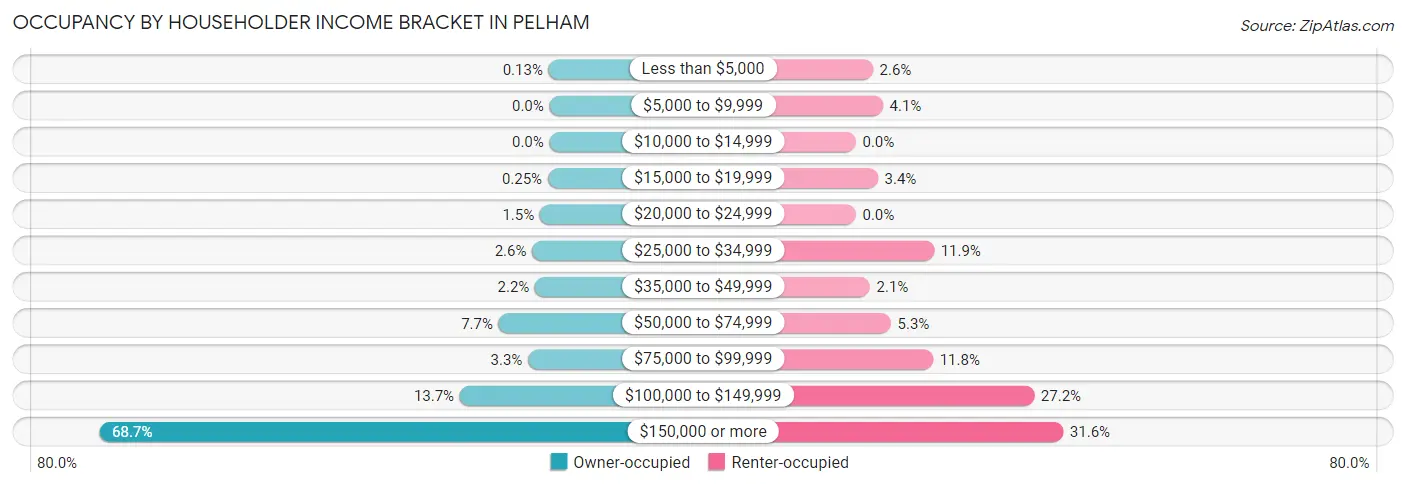
| Income Bracket | Owner-occupied | Renter-occupied |
| Less than $5,000 | 2 (0.1%) | 17 (2.6%) |
| $5,000 to $9,999 | 0 (0.0%) | 27 (4.1%) |
| $10,000 to $14,999 | 0 (0.0%) | 0 (0.0%) |
| $15,000 to $19,999 | 4 (0.3%) | 22 (3.4%) |
| $20,000 to $24,999 | 23 (1.5%) | 0 (0.0%) |
| $25,000 to $34,999 | 42 (2.6%) | 78 (11.9%) |
| $35,000 to $49,999 | 35 (2.2%) | 14 (2.1%) |
| $50,000 to $74,999 | 123 (7.7%) | 35 (5.3%) |
| $75,000 to $99,999 | 52 (3.3%) | 77 (11.8%) |
| $100,000 to $149,999 | 217 (13.7%) | 178 (27.2%) |
| $150,000 or more | 1,091 (68.7%) | 207 (31.6%) |
| Total | 1,589 (100.0%) | 655 (100.0%) |
Monthly Housing Cost Tiers in Pelham
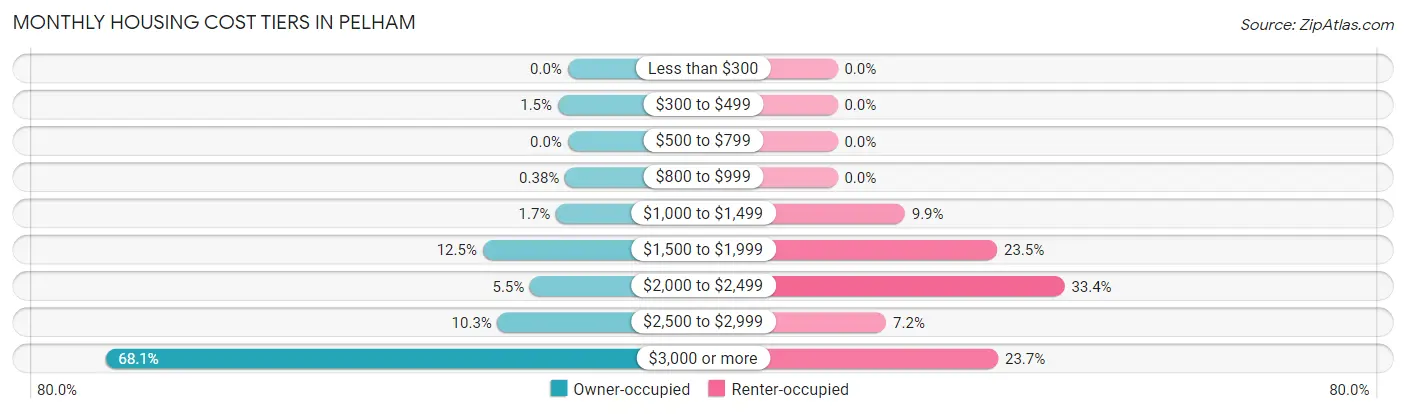
| Monthly Cost | Owner-occupied | Renter-occupied |
| Less than $300 | 0 (0.0%) | 0 (0.0%) |
| $300 to $499 | 23 (1.5%) | 0 (0.0%) |
| $500 to $799 | 0 (0.0%) | 0 (0.0%) |
| $800 to $999 | 6 (0.4%) | 0 (0.0%) |
| $1,000 to $1,499 | 27 (1.7%) | 65 (9.9%) |
| $1,500 to $1,999 | 199 (12.5%) | 154 (23.5%) |
| $2,000 to $2,499 | 88 (5.5%) | 219 (33.4%) |
| $2,500 to $2,999 | 164 (10.3%) | 47 (7.2%) |
| $3,000 or more | 1,082 (68.1%) | 155 (23.7%) |
| Total | 1,589 (100.0%) | 655 (100.0%) |
Physical Housing Characteristics in Pelham
Housing Structures in Pelham
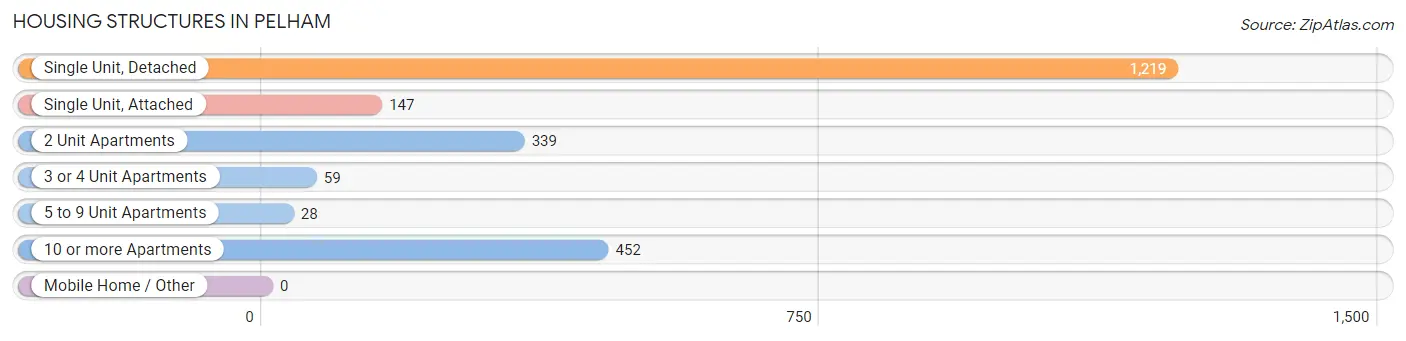
| Structure Type | # Housing Units | % Housing Units |
| Single Unit, Detached | 1,219 | 54.3% |
| Single Unit, Attached | 147 | 6.6% |
| 2 Unit Apartments | 339 | 15.1% |
| 3 or 4 Unit Apartments | 59 | 2.6% |
| 5 to 9 Unit Apartments | 28 | 1.3% |
| 10 or more Apartments | 452 | 20.1% |
| Mobile Home / Other | 0 | 0.0% |
| Total | 2,244 | 100.0% |
Housing Structures by Occupancy in Pelham
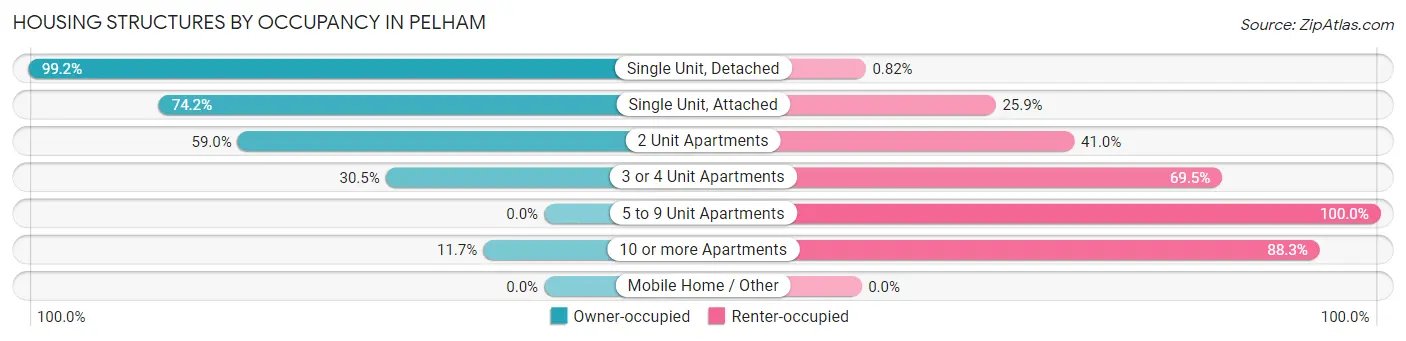
| Structure Type | Owner-occupied | Renter-occupied |
| Single Unit, Detached | 1,209 (99.2%) | 10 (0.8%) |
| Single Unit, Attached | 109 (74.2%) | 38 (25.9%) |
| 2 Unit Apartments | 200 (59.0%) | 139 (41.0%) |
| 3 or 4 Unit Apartments | 18 (30.5%) | 41 (69.5%) |
| 5 to 9 Unit Apartments | 0 (0.0%) | 28 (100.0%) |
| 10 or more Apartments | 53 (11.7%) | 399 (88.3%) |
| Mobile Home / Other | 0 (0.0%) | 0 (0.0%) |
| Total | 1,589 (70.8%) | 655 (29.2%) |
Housing Structures by Number of Rooms in Pelham
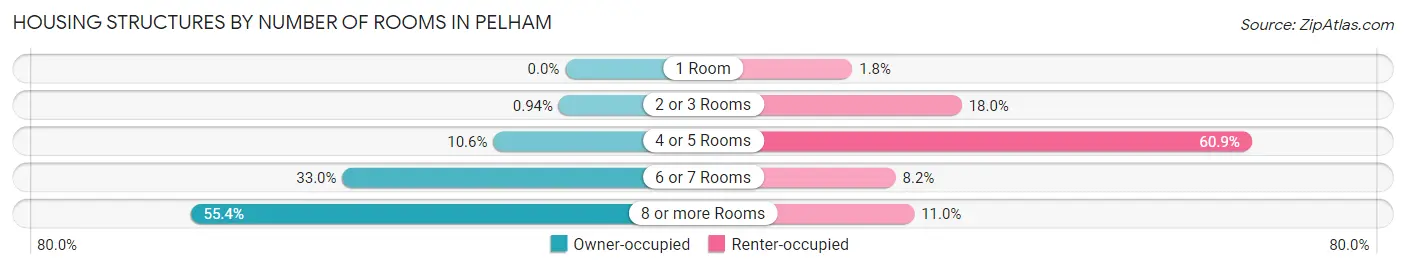
| Number of Rooms | Owner-occupied | Renter-occupied |
| 1 Room | 0 (0.0%) | 12 (1.8%) |
| 2 or 3 Rooms | 15 (0.9%) | 118 (18.0%) |
| 4 or 5 Rooms | 169 (10.6%) | 399 (60.9%) |
| 6 or 7 Rooms | 524 (33.0%) | 54 (8.2%) |
| 8 or more Rooms | 881 (55.4%) | 72 (11.0%) |
| Total | 1,589 (100.0%) | 655 (100.0%) |
Housing Structure by Heating Type in Pelham
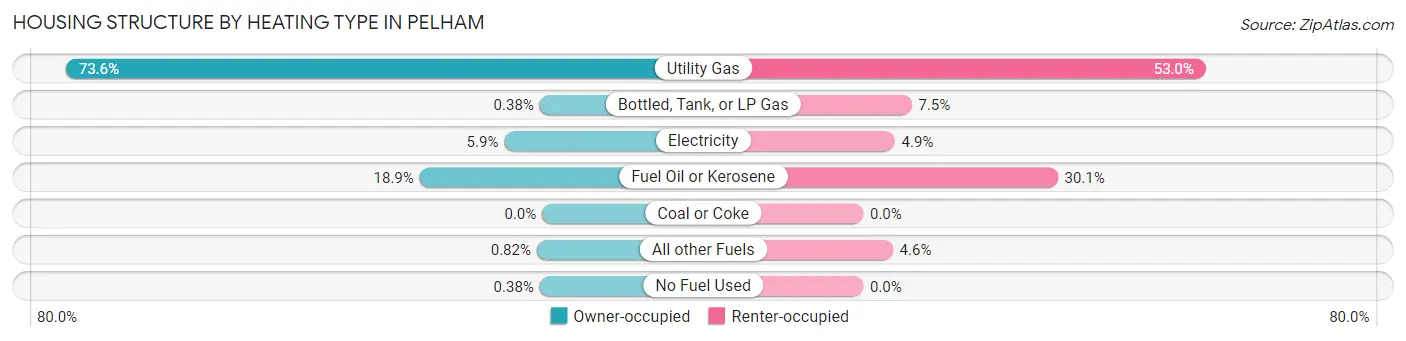
| Heating Type | Owner-occupied | Renter-occupied |
| Utility Gas | 1,170 (73.6%) | 347 (53.0%) |
| Bottled, Tank, or LP Gas | 6 (0.4%) | 49 (7.5%) |
| Electricity | 93 (5.9%) | 32 (4.9%) |
| Fuel Oil or Kerosene | 301 (18.9%) | 197 (30.1%) |
| Coal or Coke | 0 (0.0%) | 0 (0.0%) |
| All other Fuels | 13 (0.8%) | 30 (4.6%) |
| No Fuel Used | 6 (0.4%) | 0 (0.0%) |
| Total | 1,589 (100.0%) | 655 (100.0%) |
Household Vehicle Usage in Pelham
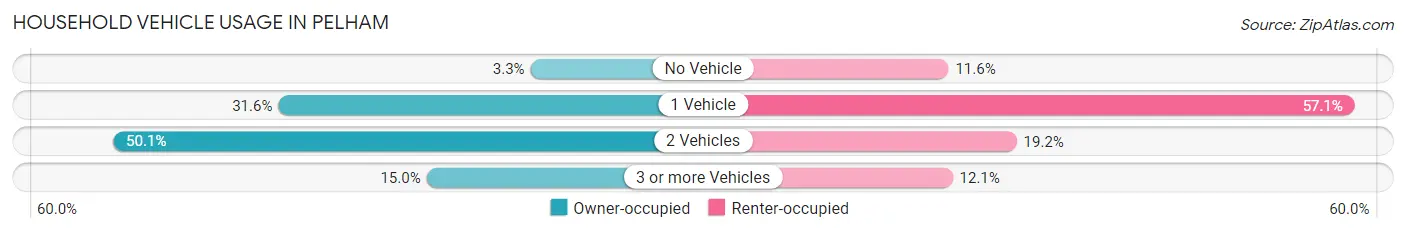
| Vehicles per Household | Owner-occupied | Renter-occupied |
| No Vehicle | 53 (3.3%) | 76 (11.6%) |
| 1 Vehicle | 502 (31.6%) | 374 (57.1%) |
| 2 Vehicles | 796 (50.1%) | 126 (19.2%) |
| 3 or more Vehicles | 238 (15.0%) | 79 (12.1%) |
| Total | 1,589 (100.0%) | 655 (100.0%) |
Real Estate & Mortgages in Pelham
Real Estate and Mortgage Overview in Pelham
| Characteristic | Without Mortgage | With Mortgage |
| Housing Units | 468 | 1,121 |
| Median Property Value | $742,100 | $881,500 |
| Median Household Income | $137,581 | $891 |
| Monthly Housing Costs | $1,501 | $1,030 |
| Real Estate Taxes | $10,001 | $0 |
Property Value by Mortgage Status in Pelham
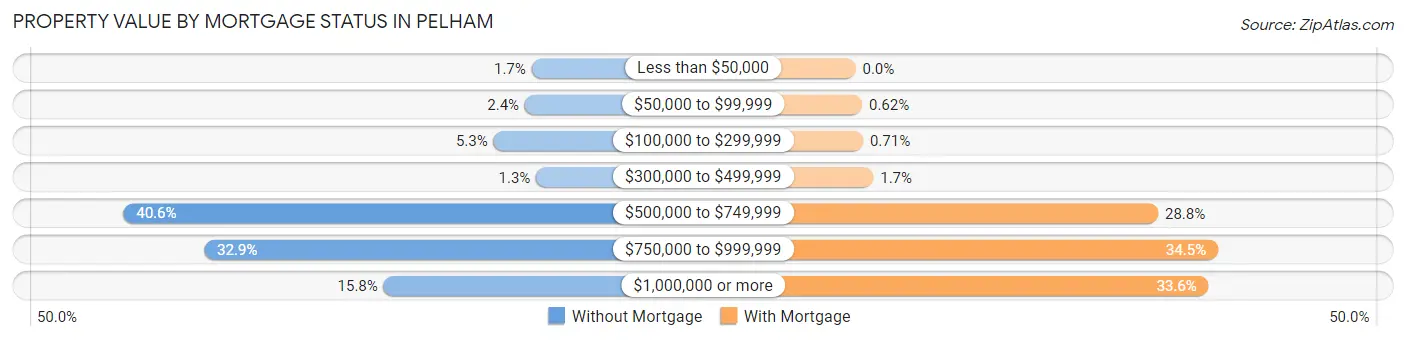
| Property Value | Without Mortgage | With Mortgage |
| Less than $50,000 | 8 (1.7%) | 0 (0.0%) |
| $50,000 to $99,999 | 11 (2.4%) | 7 (0.6%) |
| $100,000 to $299,999 | 25 (5.3%) | 8 (0.7%) |
| $300,000 to $499,999 | 6 (1.3%) | 19 (1.7%) |
| $500,000 to $749,999 | 190 (40.6%) | 323 (28.8%) |
| $750,000 to $999,999 | 154 (32.9%) | 387 (34.5%) |
| $1,000,000 or more | 74 (15.8%) | 377 (33.6%) |
| Total | 468 (100.0%) | 1,121 (100.0%) |
Household Income by Mortgage Status in Pelham
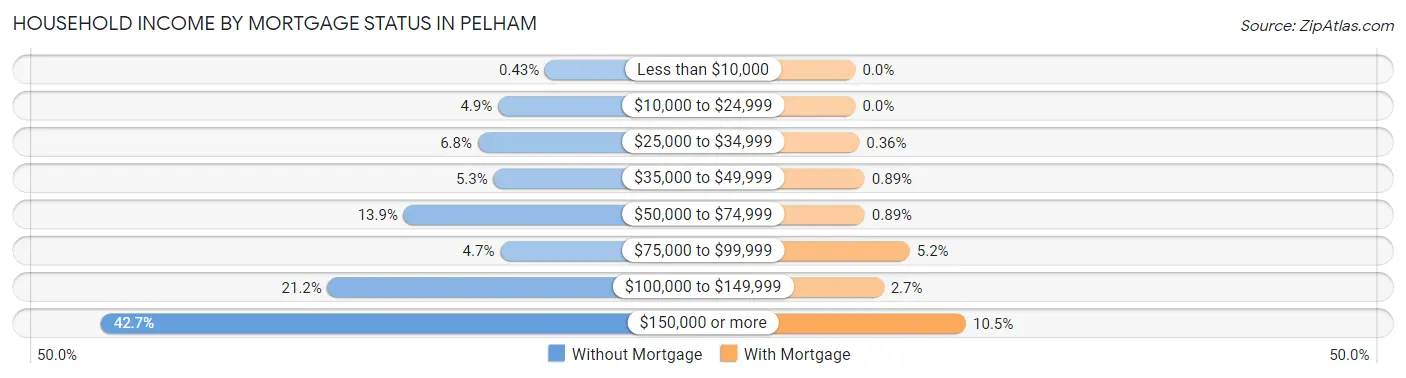
| Household Income | Without Mortgage | With Mortgage |
| Less than $10,000 | 2 (0.4%) | 0 (0.0%) |
| $10,000 to $24,999 | 23 (4.9%) | 0 (0.0%) |
| $25,000 to $34,999 | 32 (6.8%) | 4 (0.4%) |
| $35,000 to $49,999 | 25 (5.3%) | 10 (0.9%) |
| $50,000 to $74,999 | 65 (13.9%) | 10 (0.9%) |
| $75,000 to $99,999 | 22 (4.7%) | 58 (5.2%) |
| $100,000 to $149,999 | 99 (21.1%) | 30 (2.7%) |
| $150,000 or more | 200 (42.7%) | 118 (10.5%) |
| Total | 468 (100.0%) | 1,121 (100.0%) |
Property Value to Household Income Ratio in Pelham
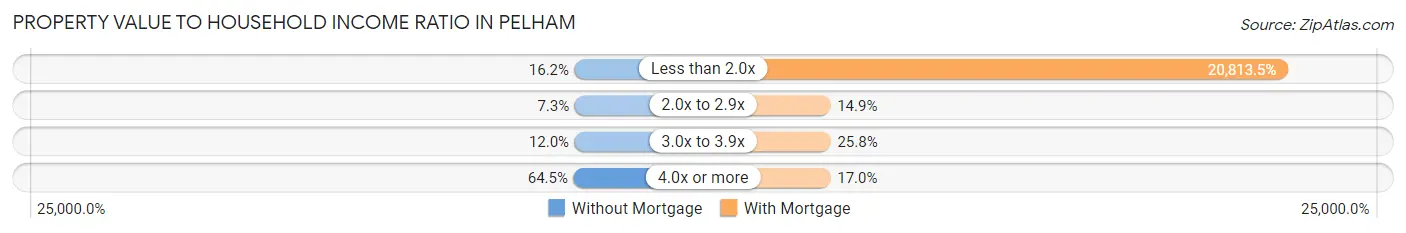
| Value-to-Income Ratio | Without Mortgage | With Mortgage |
| Less than 2.0x | 76 (16.2%) | 233,319 (20,813.5%) |
| 2.0x to 2.9x | 34 (7.3%) | 167 (14.9%) |
| 3.0x to 3.9x | 56 (12.0%) | 289 (25.8%) |
| 4.0x or more | 302 (64.5%) | 190 (17.0%) |
| Total | 468 (100.0%) | 1,121 (100.0%) |
Real Estate Taxes by Mortgage Status in Pelham
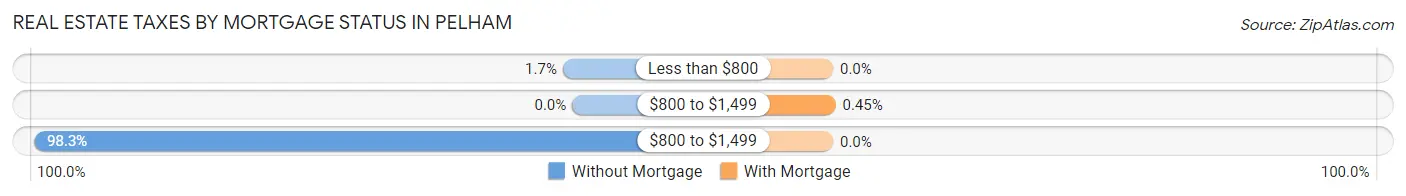
| Property Taxes | Without Mortgage | With Mortgage |
| Less than $800 | 8 (1.7%) | 0 (0.0%) |
| $800 to $1,499 | 0 (0.0%) | 5 (0.4%) |
| $800 to $1,499 | 460 (98.3%) | 0 (0.0%) |
| Total | 468 (100.0%) | 1,121 (100.0%) |
Health & Disability in Pelham
Health Insurance Coverage by Age in Pelham
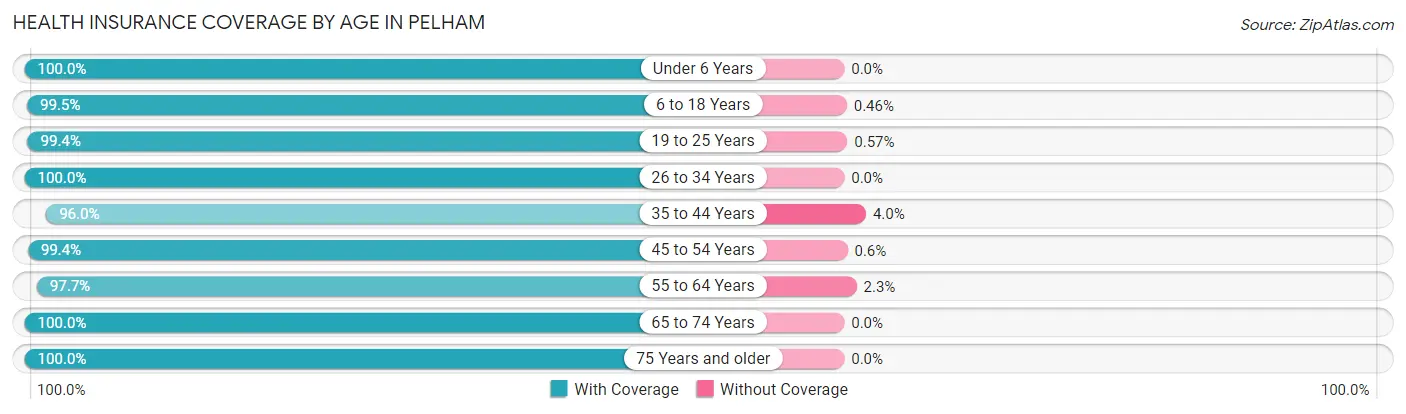
| Age Bracket | With Coverage | Without Coverage |
| Under 6 Years | 490 (100.0%) | 0 (0.0%) |
| 6 to 18 Years | 1,723 (99.5%) | 8 (0.5%) |
| 19 to 25 Years | 527 (99.4%) | 3 (0.6%) |
| 26 to 34 Years | 466 (100.0%) | 0 (0.0%) |
| 35 to 44 Years | 1,210 (96.0%) | 51 (4.0%) |
| 45 to 54 Years | 1,158 (99.4%) | 7 (0.6%) |
| 55 to 64 Years | 721 (97.7%) | 17 (2.3%) |
| 65 to 74 Years | 442 (100.0%) | 0 (0.0%) |
| 75 Years and older | 438 (100.0%) | 0 (0.0%) |
| Total | 7,175 (98.8%) | 86 (1.2%) |
Health Insurance Coverage by Citizenship Status in Pelham
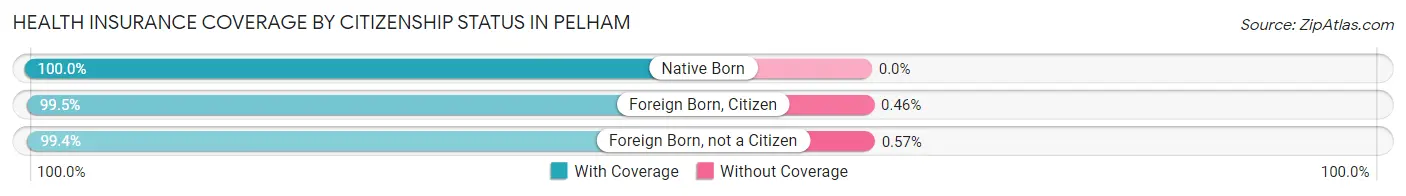
| Citizenship Status | With Coverage | Without Coverage |
| Native Born | 490 (100.0%) | 0 (0.0%) |
| Foreign Born, Citizen | 1,723 (99.5%) | 8 (0.5%) |
| Foreign Born, not a Citizen | 527 (99.4%) | 3 (0.6%) |
Health Insurance Coverage by Household Income in Pelham
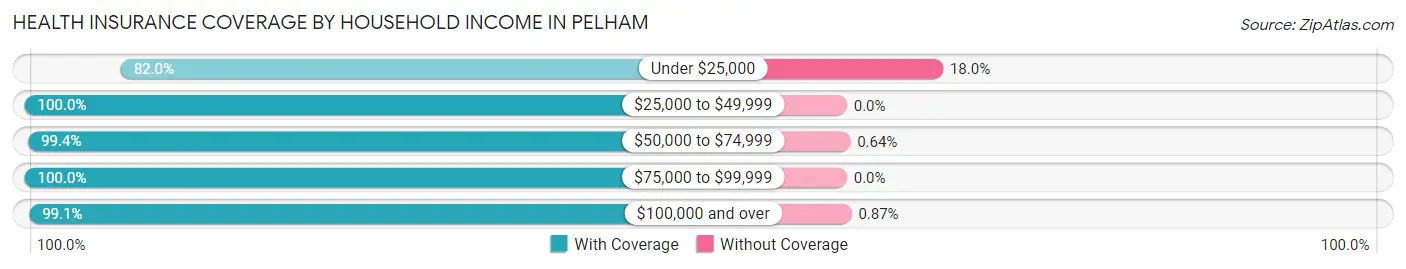
| Household Income | With Coverage | Without Coverage |
| Under $25,000 | 141 (82.0%) | 31 (18.0%) |
| $25,000 to $49,999 | 324 (100.0%) | 0 (0.0%) |
| $50,000 to $74,999 | 465 (99.4%) | 3 (0.6%) |
| $75,000 to $99,999 | 284 (100.0%) | 0 (0.0%) |
| $100,000 and over | 5,945 (99.1%) | 52 (0.9%) |
Public vs Private Health Insurance Coverage by Age in Pelham
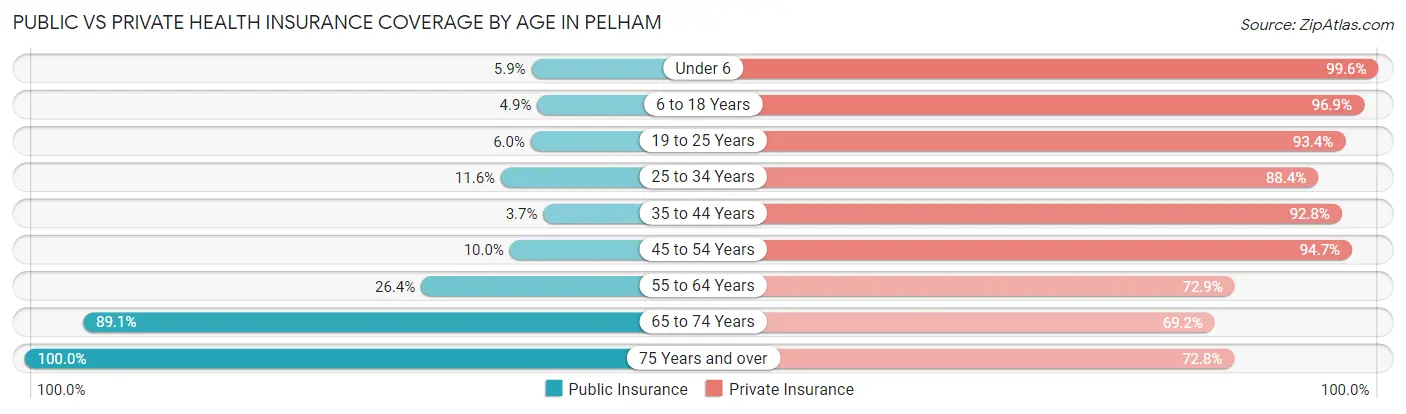
| Age Bracket | Public Insurance | Private Insurance |
| Under 6 | 29 (5.9%) | 488 (99.6%) |
| 6 to 18 Years | 84 (4.9%) | 1,677 (96.9%) |
| 19 to 25 Years | 32 (6.0%) | 495 (93.4%) |
| 25 to 34 Years | 54 (11.6%) | 412 (88.4%) |
| 35 to 44 Years | 47 (3.7%) | 1,170 (92.8%) |
| 45 to 54 Years | 116 (10.0%) | 1,103 (94.7%) |
| 55 to 64 Years | 195 (26.4%) | 538 (72.9%) |
| 65 to 74 Years | 394 (89.1%) | 306 (69.2%) |
| 75 Years and over | 438 (100.0%) | 319 (72.8%) |
| Total | 1,389 (19.1%) | 6,508 (89.6%) |
Disability Status by Sex by Age in Pelham
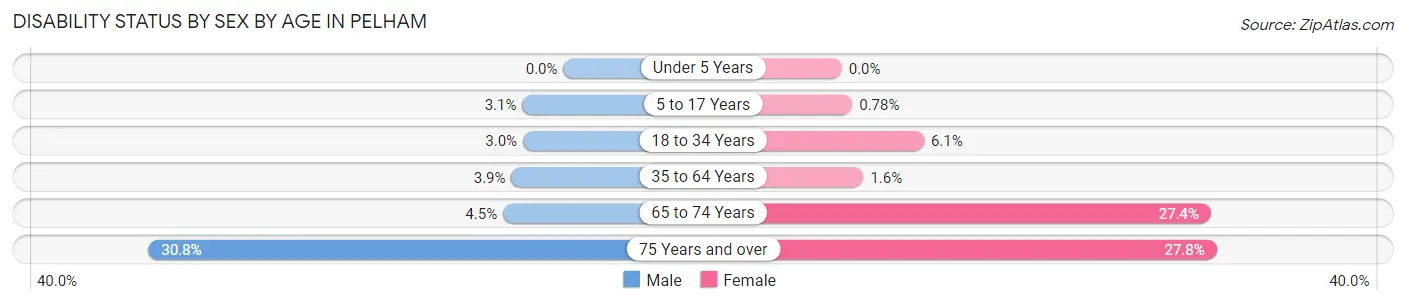
| Age Bracket | Male | Female |
| Under 5 Years | 0 (0.0%) | 0 (0.0%) |
| 5 to 17 Years | 30 (3.0%) | 6 (0.8%) |
| 18 to 34 Years | 20 (3.0%) | 23 (6.1%) |
| 35 to 64 Years | 62 (3.9%) | 25 (1.6%) |
| 65 to 74 Years | 10 (4.5%) | 60 (27.4%) |
| 75 Years and over | 53 (30.8%) | 74 (27.8%) |
Disability Class by Sex by Age in Pelham
Disability Class: Hearing Difficulty
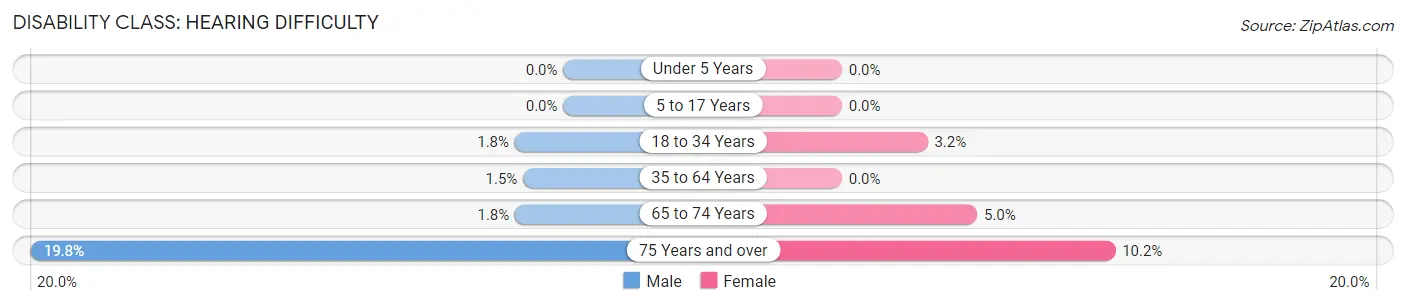
| Age Bracket | Male | Female |
| Under 5 Years | 0 (0.0%) | 0 (0.0%) |
| 5 to 17 Years | 0 (0.0%) | 0 (0.0%) |
| 18 to 34 Years | 12 (1.8%) | 12 (3.2%) |
| 35 to 64 Years | 24 (1.5%) | 0 (0.0%) |
| 65 to 74 Years | 4 (1.8%) | 11 (5.0%) |
| 75 Years and over | 34 (19.8%) | 27 (10.2%) |
Disability Class: Vision Difficulty
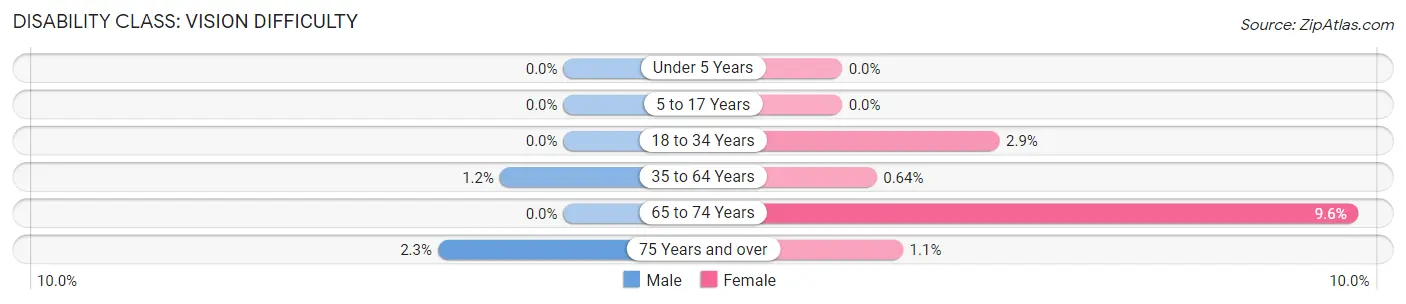
| Age Bracket | Male | Female |
| Under 5 Years | 0 (0.0%) | 0 (0.0%) |
| 5 to 17 Years | 0 (0.0%) | 0 (0.0%) |
| 18 to 34 Years | 0 (0.0%) | 11 (2.9%) |
| 35 to 64 Years | 19 (1.2%) | 10 (0.6%) |
| 65 to 74 Years | 0 (0.0%) | 21 (9.6%) |
| 75 Years and over | 4 (2.3%) | 3 (1.1%) |
Disability Class: Cognitive Difficulty
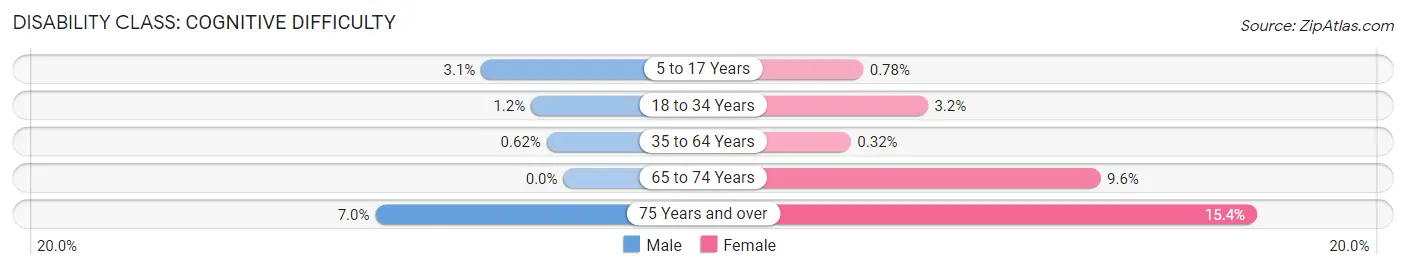
| Age Bracket | Male | Female |
| 5 to 17 Years | 30 (3.0%) | 6 (0.8%) |
| 18 to 34 Years | 8 (1.2%) | 12 (3.2%) |
| 35 to 64 Years | 10 (0.6%) | 5 (0.3%) |
| 65 to 74 Years | 0 (0.0%) | 21 (9.6%) |
| 75 Years and over | 12 (7.0%) | 41 (15.4%) |
Disability Class: Ambulatory Difficulty
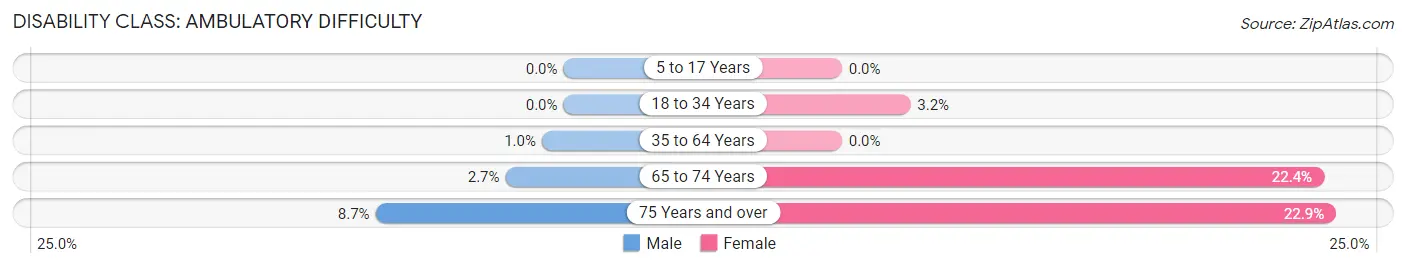
| Age Bracket | Male | Female |
| 5 to 17 Years | 0 (0.0%) | 0 (0.0%) |
| 18 to 34 Years | 0 (0.0%) | 12 (3.2%) |
| 35 to 64 Years | 16 (1.0%) | 0 (0.0%) |
| 65 to 74 Years | 6 (2.7%) | 49 (22.4%) |
| 75 Years and over | 15 (8.7%) | 61 (22.9%) |
Disability Class: Self-Care Difficulty
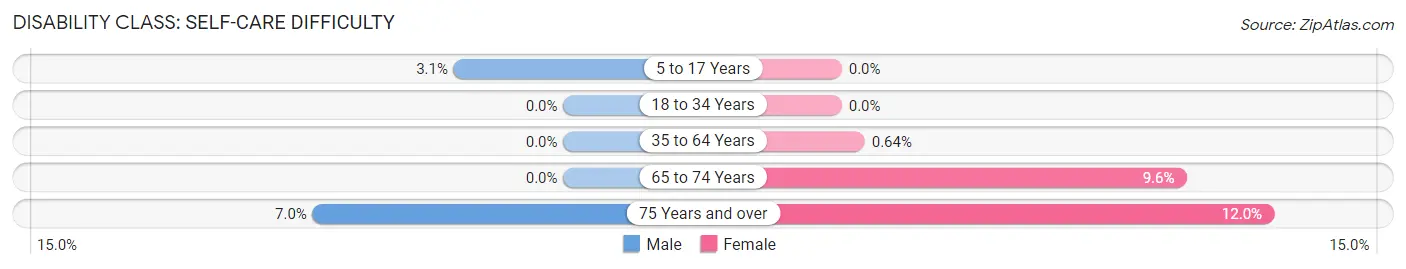
| Age Bracket | Male | Female |
| 5 to 17 Years | 30 (3.0%) | 0 (0.0%) |
| 18 to 34 Years | 0 (0.0%) | 0 (0.0%) |
| 35 to 64 Years | 0 (0.0%) | 10 (0.6%) |
| 65 to 74 Years | 0 (0.0%) | 21 (9.6%) |
| 75 Years and over | 12 (7.0%) | 32 (12.0%) |
Technology Access in Pelham
Computing Device Access in Pelham
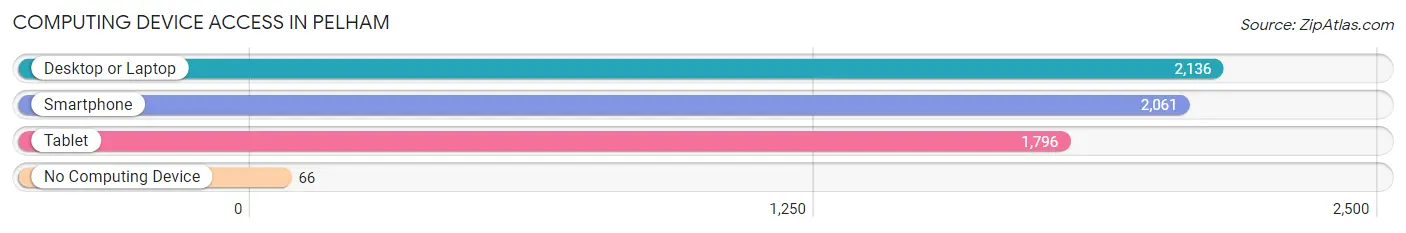
| Device Type | # Households | % Households |
| Desktop or Laptop | 2,136 | 95.2% |
| Smartphone | 2,061 | 91.8% |
| Tablet | 1,796 | 80.0% |
| No Computing Device | 66 | 2.9% |
| Total | 2,244 | 100.0% |
Internet Access in Pelham
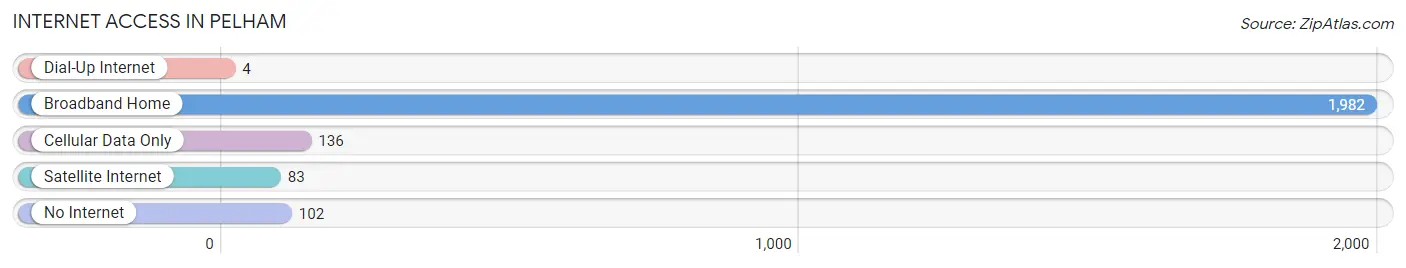
| Internet Type | # Households | % Households |
| Dial-Up Internet | 4 | 0.2% |
| Broadband Home | 1,982 | 88.3% |
| Cellular Data Only | 136 | 6.1% |
| Satellite Internet | 83 | 3.7% |
| No Internet | 102 | 4.5% |
| Total | 2,244 | 100.0% |
Pelham Summary
Pelham, New York is a small village located in Westchester County, New York. It is situated in the southeastern corner of the county, just north of the Bronx. The village is bordered by the towns of Eastchester, New Rochelle, and Mount Vernon. The population of Pelham was 5,486 at the 2010 census.
History
The area that is now Pelham was originally inhabited by the Siwanoy Native American tribe. The first European settlers arrived in the area in 1654, when Thomas Pell purchased the land from the Siwanoy. The area was then known as the Manor of Pelham. The village of Pelham was officially incorporated in 1788.
In the 19th century, Pelham was a popular summer resort for wealthy New Yorkers. The village was home to several grand estates, including the Pelhamwood Estate, which was owned by the prominent Astor family.
Geography
Pelham is located in southeastern Westchester County, just north of the Bronx. It is bordered by the towns of Eastchester, New Rochelle, and Mount Vernon. The village is situated on the Hutchinson River, which flows through the village.
The village has a total area of 1.2 square miles, all of which is land. The terrain is mostly flat, with some hills in the northern part of the village.
Economy
The economy of Pelham is largely based on retail and services. The village is home to several small businesses, including restaurants, shops, and professional services. The village also has a few larger employers, such as the Pelham Country Club and the Pelham Bay Park.
Demographics
As of the 2010 census, the population of Pelham was 5,486. The racial makeup of the village was 79.2% White, 11.2% African American, 0.3% Native American, 4.2% Asian, and 4.9% from other races. Hispanic or Latino of any race were 11.7% of the population.
The median household income in Pelham was $90,945, and the median family income was $106,945. The per capita income was $41,945. About 4.2% of families and 5.7% of the population were below the poverty line.
The village is served by the Pelham Union Free School District, which consists of four schools: Pelham Elementary School, Pelham Middle School, Pelham Memorial High School, and Pelham Preparatory Academy. The village is also home to several private schools, including the Pelham Country Day School and the Pelham Preparatory School.
Common Questions
What is Per Capita Income in Pelham?
Per Capita income in Pelham is $83,510.
What is the Median Family Income in Pelham?
Median Family Income in Pelham is $183,000.
What is the Median Household income in Pelham?
Median Household Income in Pelham is $172,692.
What is Income or Wage Gap in Pelham?
Income or Wage Gap in Pelham is 29.4%.
Women in Pelham earn 70.6 cents for every dollar earned by a man.
What is Inequality or Gini Index in Pelham?
Inequality or Gini Index in Pelham is 0.49.
What is the Total Population of Pelham?
Total Population of Pelham is 7,261.
What is the Total Male Population of Pelham?
Total Male Population of Pelham is 3,798.
What is the Total Female Population of Pelham?
Total Female Population of Pelham is 3,463.
What is the Ratio of Males per 100 Females in Pelham?
There are 109.67 Males per 100 Females in Pelham.
What is the Ratio of Females per 100 Males in Pelham?
There are 91.18 Females per 100 Males in Pelham.
What is the Median Population Age in Pelham?
Median Population Age in Pelham is 39.1 Years.
What is the Average Family Size in Pelham
Average Family Size in Pelham is 3.5 People.
What is the Average Household Size in Pelham
Average Household Size in Pelham is 3.2 People.
How Large is the Labor Force in Pelham?
There are 3,801 People in the Labor Forcein in Pelham.
What is the Percentage of People in the Labor Force in Pelham?
70.8% of People are in the Labor Force in Pelham.
What is the Unemployment Rate in Pelham?
Unemployment Rate in Pelham is 6.2%.