Port Washington, NY Map & Demographics
Port Washington Map
Port Washington Overview
$85,046
PER CAPITA INCOME
$216,635
AVG FAMILY INCOME
$177,439
AVG HOUSEHOLD INCOME
30.3%
WAGE / INCOME GAP [ % ]
69.7¢/ $1
WAGE / INCOME GAP [ $ ]
$24,916
FAMILY INCOME DEFICIT
0.47
INEQUALITY / GINI INDEX
17,015
TOTAL POPULATION
8,667
MALE POPULATION
8,348
FEMALE POPULATION
103.82
MALES / 100 FEMALES
96.32
FEMALES / 100 MALES
41.4
MEDIAN AGE
3.3
AVG FAMILY SIZE
2.9
AVG HOUSEHOLD SIZE
8,412
LABOR FORCE [ PEOPLE ]
65.1%
PERCENT IN LABOR FORCE
3.1%
UNEMPLOYMENT RATE
Port Washington Zip Codes
Port Washington Area Codes
Income in Port Washington
Income Overview in Port Washington
Per Capita Income in Port Washington is $85,046, while median incomes of families and households are $216,635 and $177,439 respectively.
| Characteristic | Number | Measure |
| Per Capita Income | 17,015 | $85,046 |
| Median Family Income | 4,633 | $216,635 |
| Mean Family Income | 4,633 | $281,800 |
| Median Household Income | 5,820 | $177,439 |
| Mean Household Income | 5,820 | $246,543 |
| Income Deficit | 4,633 | $24,916 |
| Wage / Income Gap (%) | 17,015 | 30.31% |
| Wage / Income Gap ($) | 17,015 | 69.69¢ per $1 |
| Gini / Inequality Index | 17,015 | 0.47 |
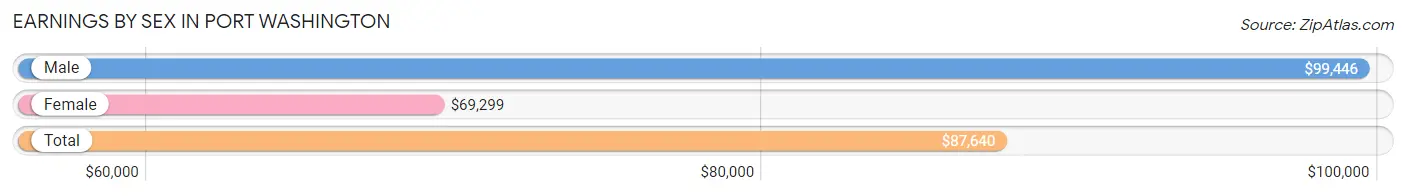
Earnings by Sex in Port Washington
Average Earnings in Port Washington are $87,640, $99,446 for men and $69,299 for women, a difference of 30.3%.
| Sex | Number | Average Earnings |
| Male | 4,711 (53.2%) | $99,446 |
| Female | 4,136 (46.8%) | $69,299 |
| Total | 8,847 (100.0%) | $87,640 |
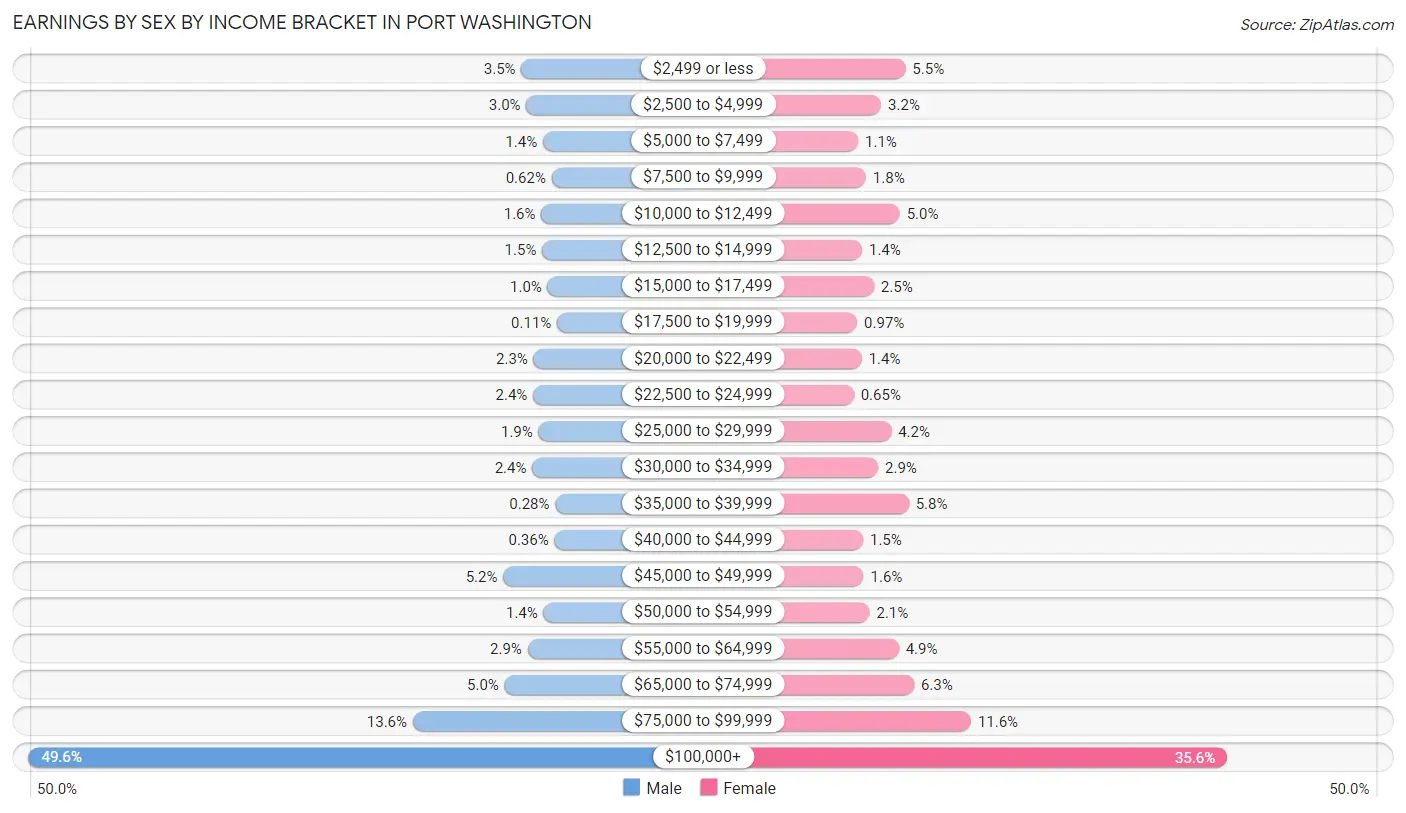
Earnings by Sex by Income Bracket in Port Washington
The most common earnings brackets in Port Washington are $100,000+ for men (2,338 | 49.6%) and $100,000+ for women (1,473 | 35.6%).
| Income | Male | Female |
| $2,499 or less | 163 (3.5%) | 227 (5.5%) |
| $2,500 to $4,999 | 141 (3.0%) | 133 (3.2%) |
| $5,000 to $7,499 | 68 (1.4%) | 44 (1.1%) |
| $7,500 to $9,999 | 29 (0.6%) | 74 (1.8%) |
| $10,000 to $12,499 | 75 (1.6%) | 205 (5.0%) |
| $12,500 to $14,999 | 71 (1.5%) | 59 (1.4%) |
| $15,000 to $17,499 | 47 (1.0%) | 105 (2.5%) |
| $17,500 to $19,999 | 5 (0.1%) | 40 (1.0%) |
| $20,000 to $22,499 | 109 (2.3%) | 58 (1.4%) |
| $22,500 to $24,999 | 111 (2.4%) | 27 (0.6%) |
| $25,000 to $29,999 | 87 (1.8%) | 172 (4.2%) |
| $30,000 to $34,999 | 115 (2.4%) | 121 (2.9%) |
| $35,000 to $39,999 | 13 (0.3%) | 240 (5.8%) |
| $40,000 to $44,999 | 17 (0.4%) | 63 (1.5%) |
| $45,000 to $49,999 | 243 (5.2%) | 65 (1.6%) |
| $50,000 to $54,999 | 65 (1.4%) | 88 (2.1%) |
| $55,000 to $64,999 | 135 (2.9%) | 201 (4.9%) |
| $65,000 to $74,999 | 237 (5.0%) | 260 (6.3%) |
| $75,000 to $99,999 | 642 (13.6%) | 481 (11.6%) |
| $100,000+ | 2,338 (49.6%) | 1,473 (35.6%) |
| Total | 4,711 (100.0%) | 4,136 (100.0%) |
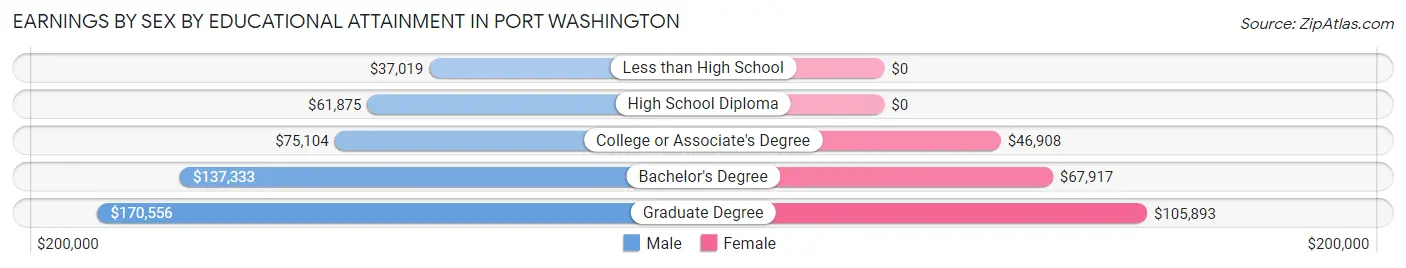
Earnings by Sex by Educational Attainment in Port Washington
Average earnings in Port Washington are $119,444 for men and $76,731 for women, a difference of 35.8%. Men with an educational attainment of graduate degree enjoy the highest average annual earnings of $170,556, while those with less than high school education earn the least with $37,019. Women with an educational attainment of graduate degree earn the most with the average annual earnings of $105,893, while those with college or associate's degree education have the smallest earnings of $46,908.
| Educational Attainment | Male Income | Female Income |
| Less than High School | $37,019 | $0 |
| High School Diploma | $61,875 | $0 |
| College or Associate's Degree | $75,104 | $46,908 |
| Bachelor's Degree | $137,333 | $67,917 |
| Graduate Degree | $170,556 | $105,893 |
| Total | $119,444 | $76,731 |
Family Income in Port Washington
Family Income Brackets in Port Washington
According to the Port Washington family income data, there are 2,469 families falling into the $200,000+ income range, which is the most common income bracket and makes up 53.3% of all families. Conversely, the $10,000 to $14,999 income bracket is the least frequent group with only 5 families (0.1%) belonging to this category.
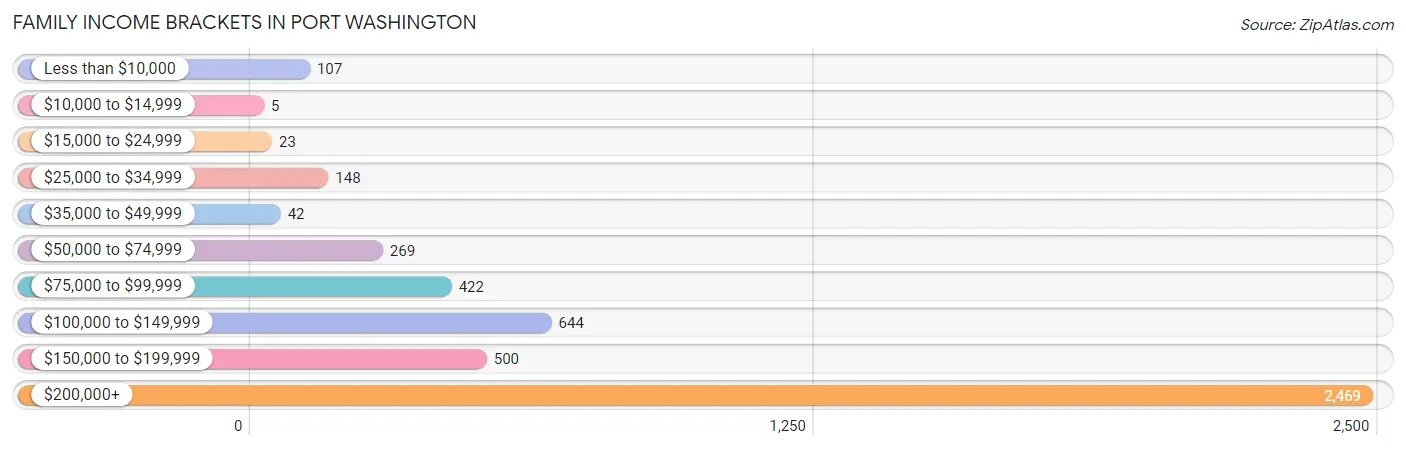
| Income Bracket | # Families | % Families |
| Less than $10,000 | 107 | 2.3% |
| $10,000 to $14,999 | 5 | 0.1% |
| $15,000 to $24,999 | 23 | 0.5% |
| $25,000 to $34,999 | 148 | 3.2% |
| $35,000 to $49,999 | 42 | 0.9% |
| $50,000 to $74,999 | 269 | 5.8% |
| $75,000 to $99,999 | 422 | 9.1% |
| $100,000 to $149,999 | 644 | 13.9% |
| $150,000 to $199,999 | 500 | 10.8% |
| $200,000+ | 2,469 | 53.3% |
Family Income by Famaliy Size in Port Washington
5-person families (374 | 8.1%) account for the highest median family income in Port Washington with $250,001 per family, while 2-person families (1,698 | 36.6%) have the highest median income of $74,916 per family member.
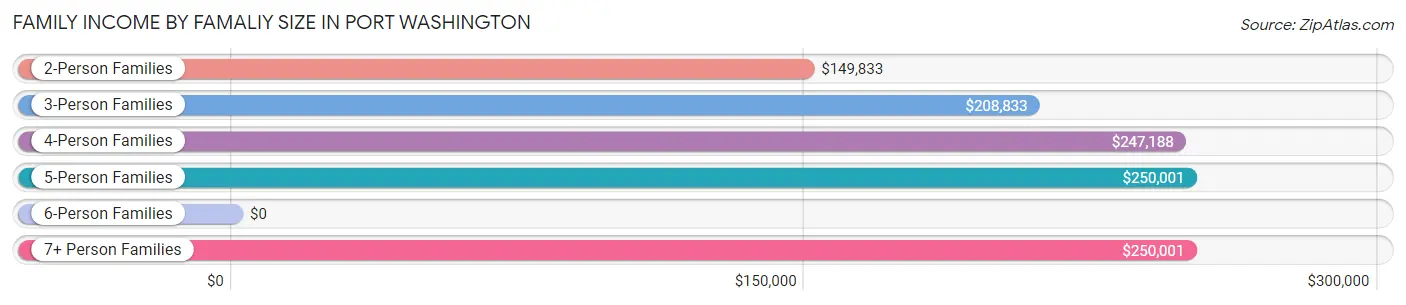
| Income Bracket | # Families | Median Income |
| 2-Person Families | 1,698 (36.6%) | $149,833 |
| 3-Person Families | 954 (20.6%) | $208,833 |
| 4-Person Families | 1,453 (31.4%) | $247,188 |
| 5-Person Families | 374 (8.1%) | $250,001 |
| 6-Person Families | 131 (2.8%) | $0 |
| 7+ Person Families | 23 (0.5%) | $250,001 |
| Total | 4,633 (100.0%) | $216,635 |
Family Income by Number of Earners in Port Washington
The median family income in Port Washington is $216,635, with families comprising 3+ earners (559) having the highest median family income of $250,001, while families with 1 earner (1,120) have the lowest median family income of $101,389, accounting for 12.1% and 24.2% of families, respectively.
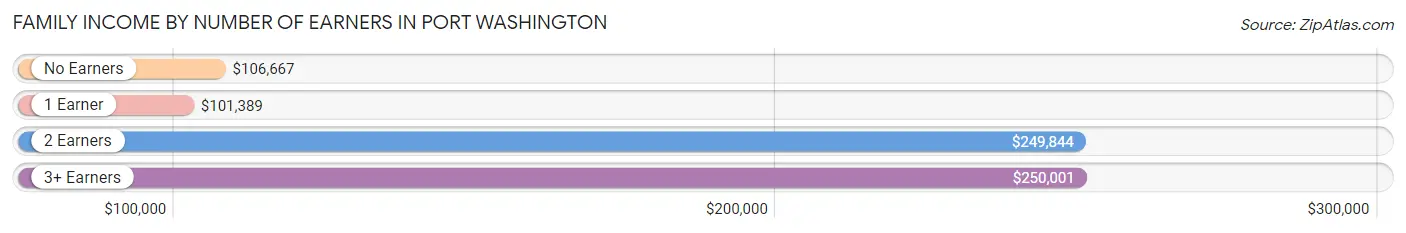
| Number of Earners | # Families | Median Income |
| No Earners | 490 (10.6%) | $106,667 |
| 1 Earner | 1,120 (24.2%) | $101,389 |
| 2 Earners | 2,464 (53.2%) | $249,844 |
| 3+ Earners | 559 (12.1%) | $250,001 |
| Total | 4,633 (100.0%) | $216,635 |
Household Income in Port Washington
Household Income Brackets in Port Washington
With 2,596 households falling in the category, the $200,000+ income range is the most frequent in Port Washington, accounting for 44.6% of all households. In contrast, only 23 households (0.4%) fall into the $10,000 to $14,999 income bracket, making it the least populous group.
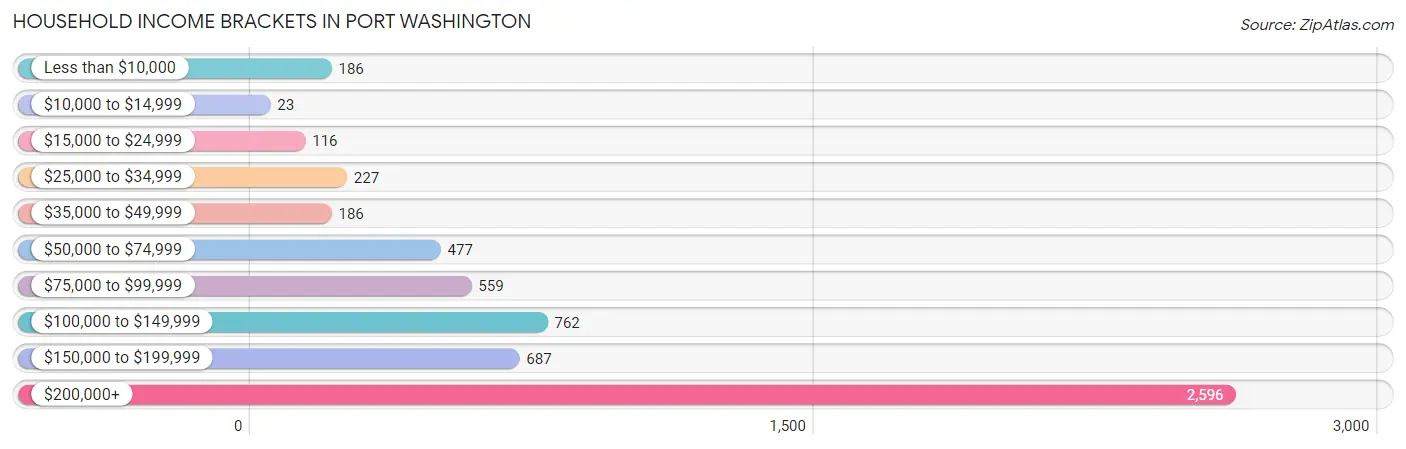
| Income Bracket | # Households | % Households |
| Less than $10,000 | 186 | 3.2% |
| $10,000 to $14,999 | 23 | 0.4% |
| $15,000 to $24,999 | 116 | 2.0% |
| $25,000 to $34,999 | 227 | 3.9% |
| $35,000 to $49,999 | 186 | 3.2% |
| $50,000 to $74,999 | 477 | 8.2% |
| $75,000 to $99,999 | 559 | 9.6% |
| $100,000 to $149,999 | 762 | 13.1% |
| $150,000 to $199,999 | 687 | 11.8% |
| $200,000+ | 2,596 | 44.6% |
Household Income by Householder Age in Port Washington
The median household income in Port Washington is $177,439, with the highest median household income of $232,733 found in the 25 to 44 years age bracket for the primary householder. A total of 1,588 households (27.3%) fall into this category. Meanwhile, the 15 to 24 years age bracket for the primary householder has the lowest median household income of $0, with 72 households (1.2%) in this group.
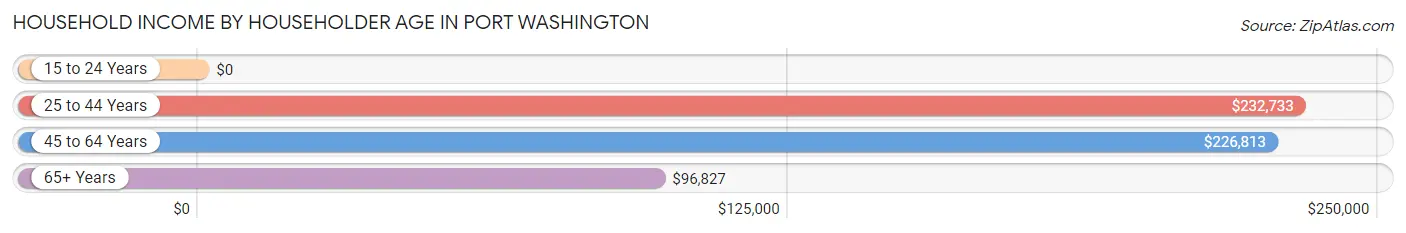
| Income Bracket | # Households | Median Income |
| 15 to 24 Years | 72 (1.2%) | $0 |
| 25 to 44 Years | 1,588 (27.3%) | $232,733 |
| 45 to 64 Years | 2,109 (36.2%) | $226,813 |
| 65+ Years | 2,051 (35.2%) | $96,827 |
| Total | 5,820 (100.0%) | $177,439 |
Poverty in Port Washington
Income Below Poverty by Sex and Age in Port Washington
With 4.2% poverty level for males and 5.6% for females among the residents of Port Washington, 5 year old males and 16 and 17 year old females are the most vulnerable to poverty, with 43 males (11.4%) and 38 females (17.8%) in their respective age groups living below the poverty level.
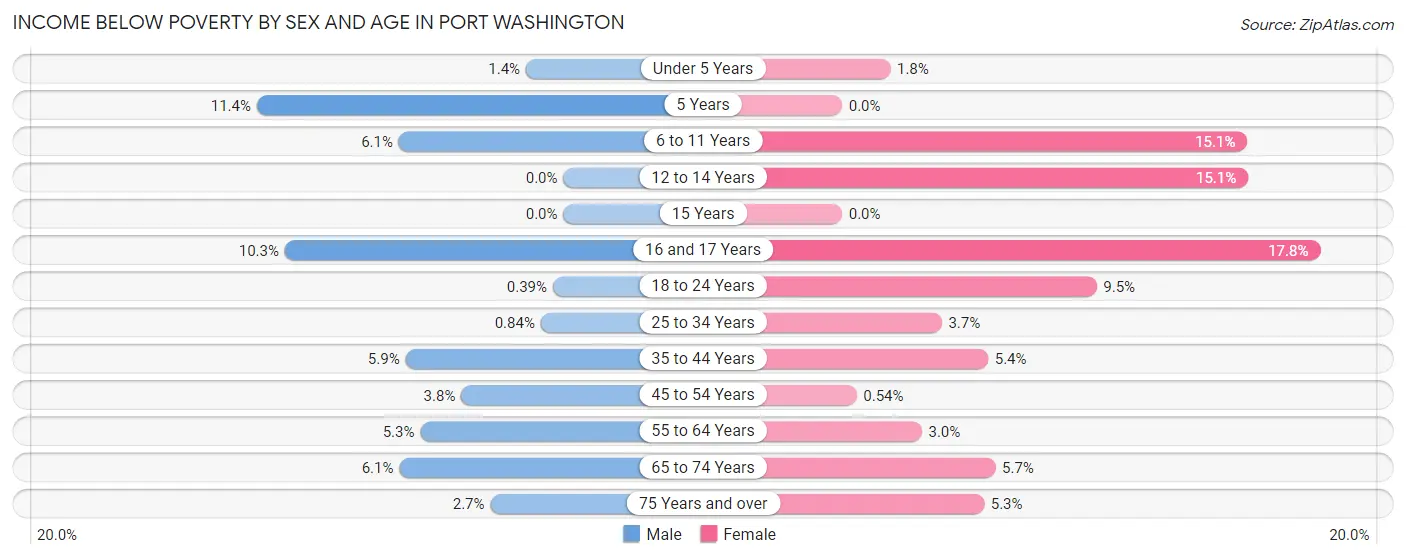
| Age Bracket | Male | Female |
| Under 5 Years | 10 (1.4%) | 11 (1.8%) |
| 5 Years | 43 (11.4%) | 0 (0.0%) |
| 6 to 11 Years | 48 (6.1%) | 101 (15.0%) |
| 12 to 14 Years | 0 (0.0%) | 49 (15.1%) |
| 15 Years | 0 (0.0%) | 0 (0.0%) |
| 16 and 17 Years | 24 (10.3%) | 38 (17.8%) |
| 18 to 24 Years | 2 (0.4%) | 31 (9.5%) |
| 25 to 34 Years | 7 (0.8%) | 25 (3.7%) |
| 35 to 44 Years | 68 (5.9%) | 69 (5.4%) |
| 45 to 54 Years | 38 (3.8%) | 6 (0.5%) |
| 55 to 64 Years | 54 (5.3%) | 33 (3.0%) |
| 65 to 74 Years | 51 (6.1%) | 49 (5.7%) |
| 75 Years and over | 18 (2.7%) | 47 (5.3%) |
| Total | 363 (4.2%) | 459 (5.6%) |
Income Above Poverty by Sex and Age in Port Washington
According to the poverty statistics in Port Washington, males aged 12 to 14 years and females aged 5 years are the age groups that are most secure financially, with 100.0% of males and 100.0% of females in these age groups living above the poverty line.
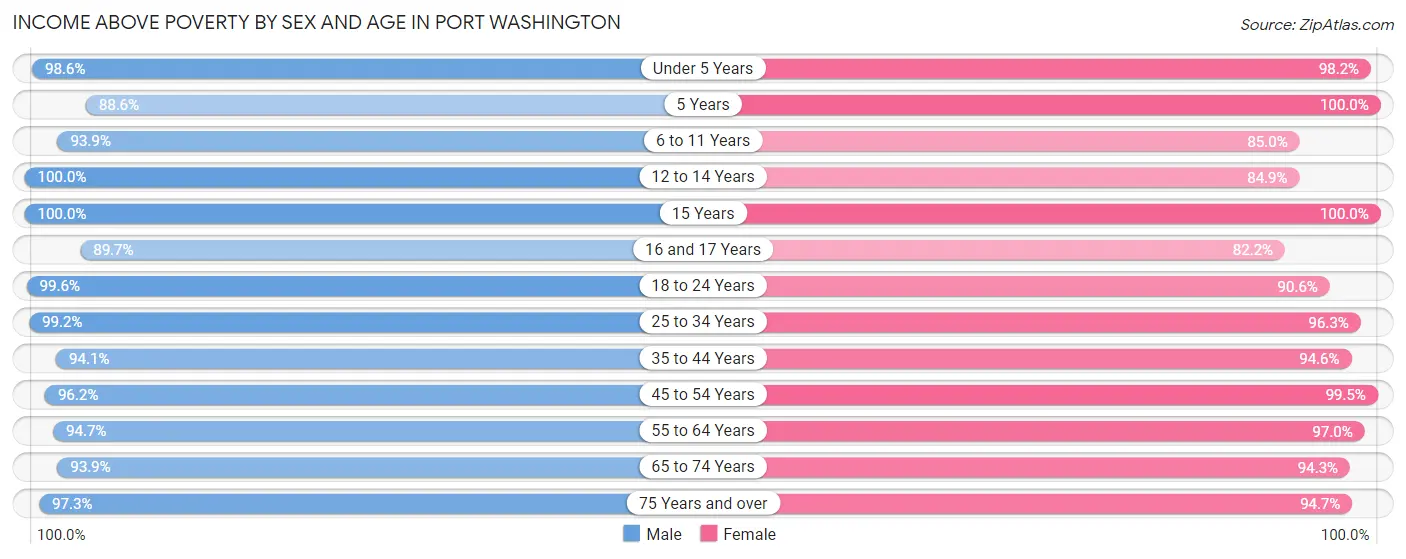
| Age Bracket | Male | Female |
| Under 5 Years | 707 (98.6%) | 604 (98.2%) |
| 5 Years | 335 (88.6%) | 84 (100.0%) |
| 6 to 11 Years | 738 (93.9%) | 570 (85.0%) |
| 12 to 14 Years | 405 (100.0%) | 276 (84.9%) |
| 15 Years | 67 (100.0%) | 46 (100.0%) |
| 16 and 17 Years | 208 (89.7%) | 176 (82.2%) |
| 18 to 24 Years | 506 (99.6%) | 297 (90.5%) |
| 25 to 34 Years | 825 (99.2%) | 650 (96.3%) |
| 35 to 44 Years | 1,092 (94.1%) | 1,203 (94.6%) |
| 45 to 54 Years | 964 (96.2%) | 1,101 (99.5%) |
| 55 to 64 Years | 963 (94.7%) | 1,081 (97.0%) |
| 65 to 74 Years | 786 (93.9%) | 812 (94.3%) |
| 75 Years and over | 646 (97.3%) | 844 (94.7%) |
| Total | 8,242 (95.8%) | 7,744 (94.4%) |
Income Below Poverty Among Married-Couple Families in Port Washington
The poverty statistics for married-couple families in Port Washington show that 0.6% or 26 of the total 4,082 families live below the poverty line. Families with 1 or 2 children have the highest poverty rate of 0.8%, comprising of 13 families. On the other hand, families with 3 or 4 children have the lowest poverty rate of 0.0%, which includes 0 families.
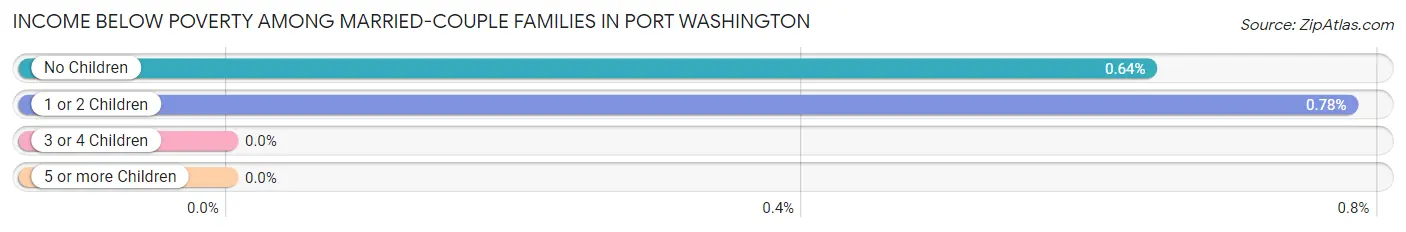
| Children | Above Poverty | Below Poverty |
| No Children | 2,020 (99.4%) | 13 (0.6%) |
| 1 or 2 Children | 1,645 (99.2%) | 13 (0.8%) |
| 3 or 4 Children | 387 (100.0%) | 0 (0.0%) |
| 5 or more Children | 4 (100.0%) | 0 (0.0%) |
| Total | 4,056 (99.4%) | 26 (0.6%) |
Income Below Poverty Among Single-Parent Households in Port Washington
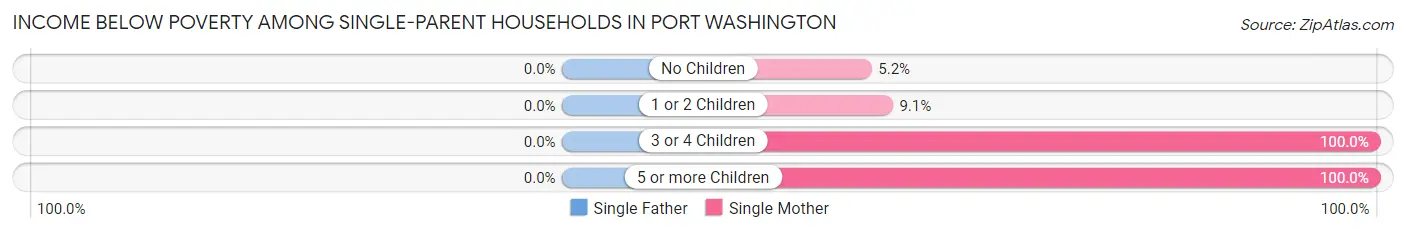
| Children | Single Father | Single Mother |
| No Children | 0 (0.0%) | 13 (5.2%) |
| 1 or 2 Children | 0 (0.0%) | 11 (9.1%) |
| 3 or 4 Children | 0 (0.0%) | 20 (100.0%) |
| 5 or more Children | 0 (0.0%) | 41 (100.0%) |
| Total | 0 (0.0%) | 85 (19.6%) |
Income Below Poverty Among Married-Couple vs Single-Parent Households in Port Washington
The poverty data for Port Washington shows that 26 of the married-couple family households (0.6%) and 85 of the single-parent households (15.4%) are living below the poverty level. Within the married-couple family households, those with 1 or 2 children have the highest poverty rate, with 13 households (0.8%) falling below the poverty line. Among the single-parent households, those with 3 or 4 children have the highest poverty rate, with 20 household (100.0%) living below poverty.
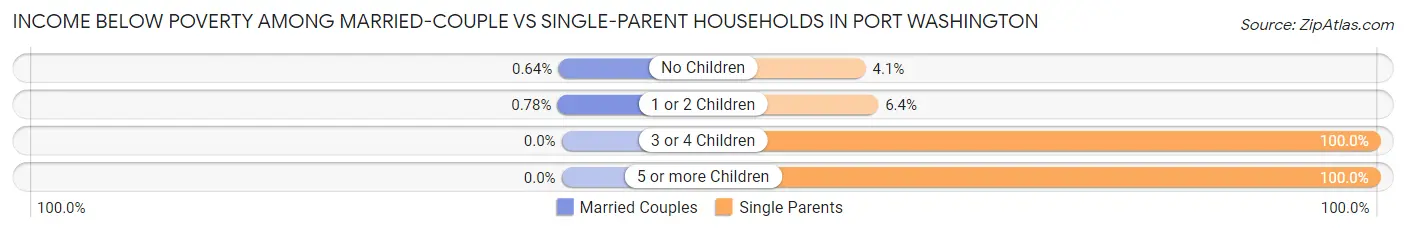
| Children | Married-Couple Families | Single-Parent Households |
| No Children | 13 (0.6%) | 13 (4.1%) |
| 1 or 2 Children | 13 (0.8%) | 11 (6.4%) |
| 3 or 4 Children | 0 (0.0%) | 20 (100.0%) |
| 5 or more Children | 0 (0.0%) | 41 (100.0%) |
| Total | 26 (0.6%) | 85 (15.4%) |
Race in Port Washington
The most populous races in Port Washington are White / Caucasian (12,937 | 76.0%), Asian (2,082 | 12.2%), and Hispanic or Latino (1,773 | 10.4%).
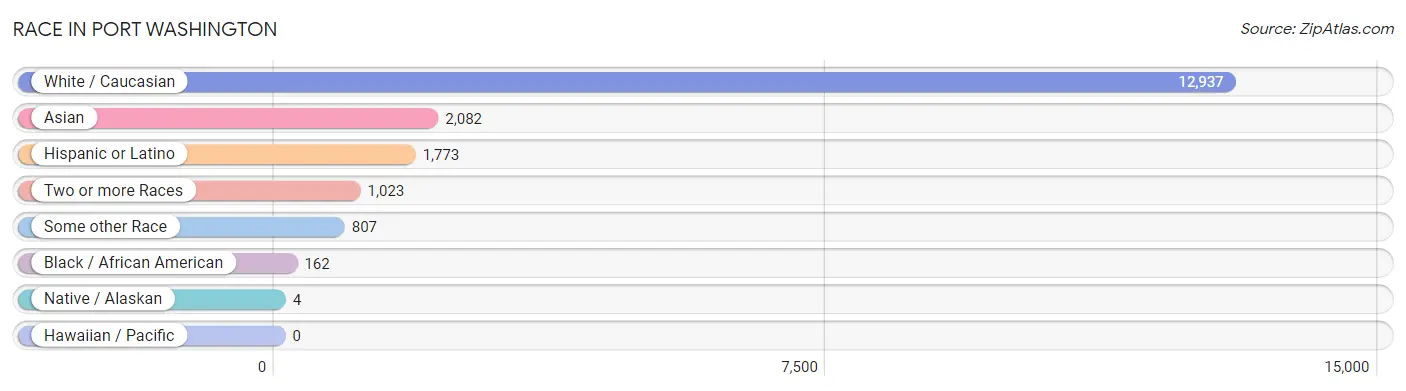
| Race | # Population | % Population |
| Asian | 2,082 | 12.2% |
| Black / African American | 162 | 0.9% |
| Hawaiian / Pacific | 0 | 0.0% |
| Hispanic or Latino | 1,773 | 10.4% |
| Native / Alaskan | 4 | 0.0% |
| White / Caucasian | 12,937 | 76.0% |
| Two or more Races | 1,023 | 6.0% |
| Some other Race | 807 | 4.7% |
| Total | 17,015 | 100.0% |
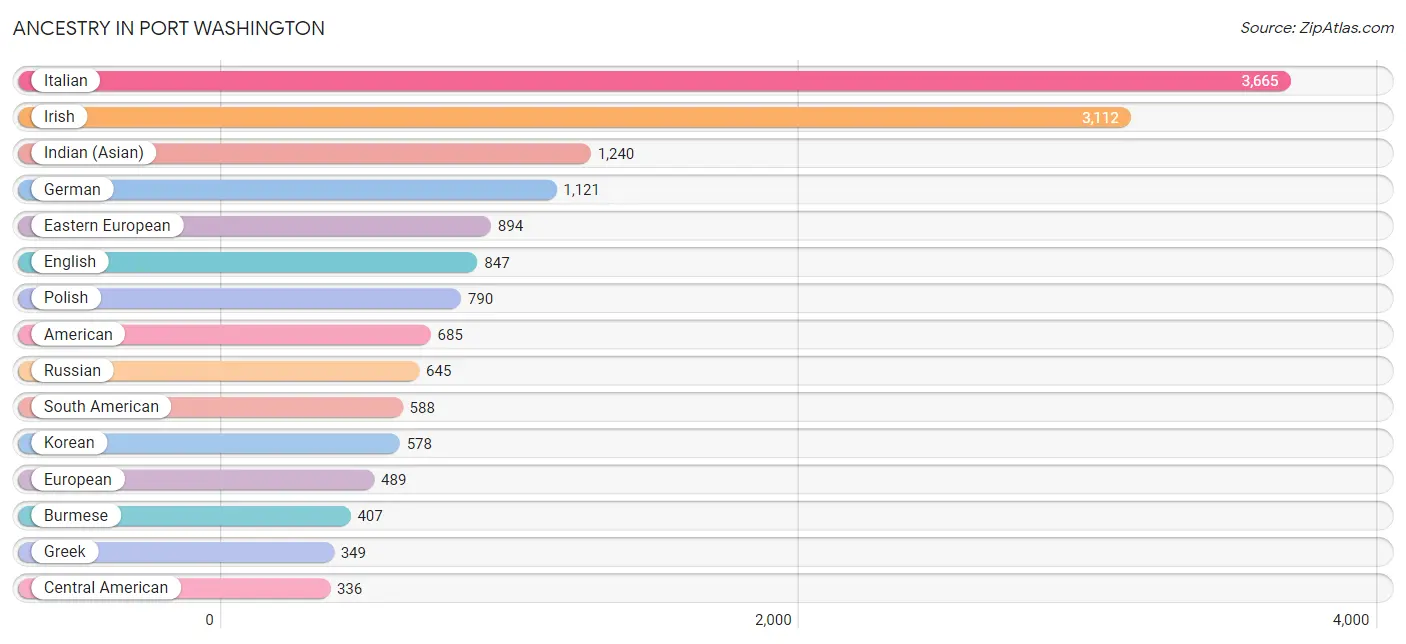
Ancestry in Port Washington
The most populous ancestries reported in Port Washington are Italian (3,665 | 21.5%), Irish (3,112 | 18.3%), Indian (Asian) (1,240 | 7.3%), German (1,121 | 6.6%), and Eastern European (894 | 5.2%), together accounting for 59.0% of all Port Washington residents.
| Ancestry | # Population | % Population |
| Alsatian | 12 | 0.1% |
| American | 685 | 4.0% |
| Arab | 112 | 0.7% |
| Argentinean | 82 | 0.5% |
| Armenian | 171 | 1.0% |
| Australian | 53 | 0.3% |
| Austrian | 124 | 0.7% |
| Bhutanese | 143 | 0.8% |
| Brazilian | 12 | 0.1% |
| British | 93 | 0.5% |
| Bulgarian | 43 | 0.3% |
| Burmese | 407 | 2.4% |
| Canadian | 6 | 0.0% |
| Central American | 336 | 2.0% |
| Chilean | 7 | 0.0% |
| Colombian | 264 | 1.5% |
| Croatian | 30 | 0.2% |
| Cuban | 63 | 0.4% |
| Cypriot | 24 | 0.1% |
| Czech | 48 | 0.3% |
| Danish | 13 | 0.1% |
| Dominican | 124 | 0.7% |
| Dutch | 78 | 0.5% |
| Eastern European | 894 | 5.2% |
| Ecuadorian | 169 | 1.0% |
| English | 847 | 5.0% |
| Estonian | 13 | 0.1% |
| European | 489 | 2.9% |
| Filipino | 165 | 1.0% |
| French | 149 | 0.9% |
| French Canadian | 55 | 0.3% |
| German | 1,121 | 6.6% |
| Greek | 349 | 2.1% |
| Guatemalan | 59 | 0.4% |
| Honduran | 4 | 0.0% |
| Hungarian | 269 | 1.6% |
| Icelander | 32 | 0.2% |
| Indian (Asian) | 1,240 | 7.3% |
| Iranian | 64 | 0.4% |
| Irish | 3,112 | 18.3% |
| Israeli | 11 | 0.1% |
| Italian | 3,665 | 21.5% |
| Jamaican | 30 | 0.2% |
| Korean | 578 | 3.4% |
| Latvian | 8 | 0.1% |
| Lebanese | 11 | 0.1% |
| Lithuanian | 163 | 1.0% |
| Mexican | 40 | 0.2% |
| Moroccan | 53 | 0.3% |
| Norwegian | 79 | 0.5% |
| Panamanian | 143 | 0.8% |
| Peruvian | 45 | 0.3% |
| Polish | 790 | 4.6% |
| Portuguese | 3 | 0.0% |
| Puerto Rican | 141 | 0.8% |
| Romanian | 82 | 0.5% |
| Russian | 645 | 3.8% |
| Salvadoran | 130 | 0.8% |
| Scotch-Irish | 55 | 0.3% |
| Scottish | 229 | 1.3% |
| Senegalese | 13 | 0.1% |
| Serbian | 12 | 0.1% |
| Slovak | 51 | 0.3% |
| Slovene | 25 | 0.2% |
| Somali | 26 | 0.2% |
| South African | 31 | 0.2% |
| South American | 588 | 3.5% |
| Spaniard | 98 | 0.6% |
| Spanish | 55 | 0.3% |
| Sri Lankan | 5 | 0.0% |
| Subsaharan African | 70 | 0.4% |
| Swedish | 49 | 0.3% |
| Swiss | 6 | 0.0% |
| Syrian | 10 | 0.1% |
| Thai | 105 | 0.6% |
| Turkish | 16 | 0.1% |
| Ukrainian | 155 | 0.9% |
| Venezuelan | 21 | 0.1% |
| Vietnamese | 46 | 0.3% |
| Welsh | 123 | 0.7% | View All 80 Rows |
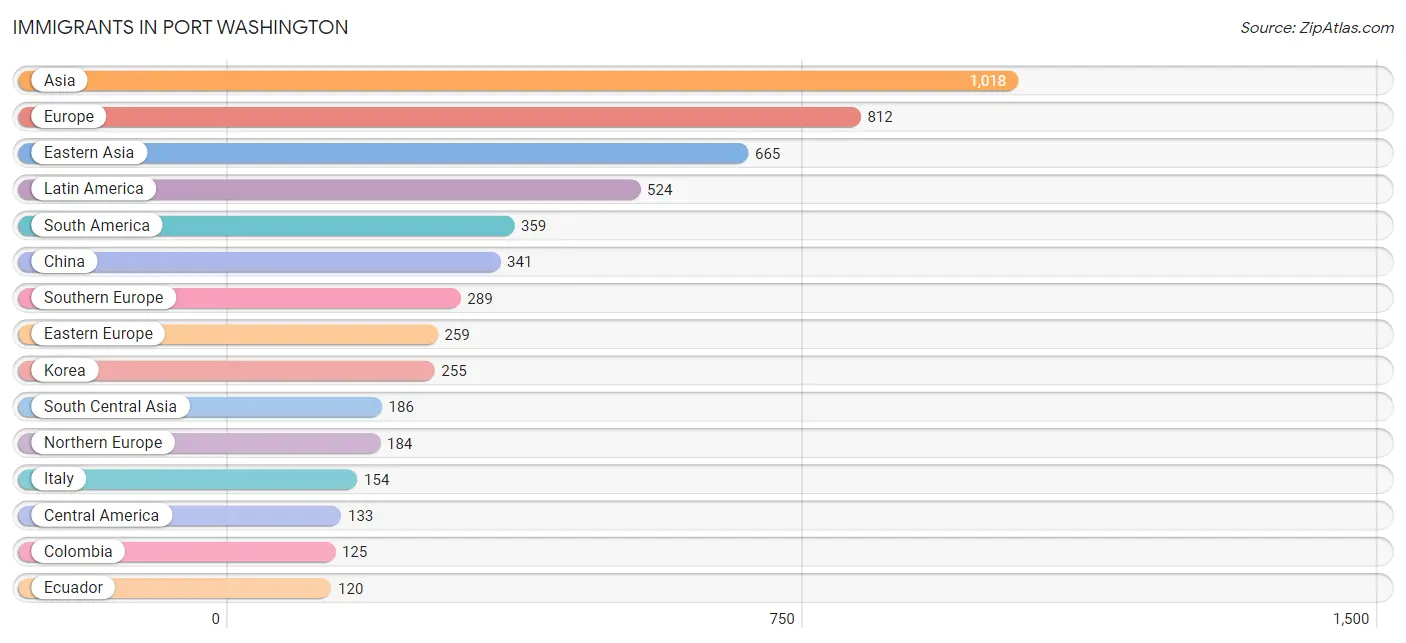
Immigrants in Port Washington
The most numerous immigrant groups reported in Port Washington came from Asia (1,018 | 6.0%), Europe (812 | 4.8%), Eastern Asia (665 | 3.9%), Latin America (524 | 3.1%), and South America (359 | 2.1%), together accounting for 19.9% of all Port Washington residents.
| Immigration Origin | # Population | % Population |
| Africa | 52 | 0.3% |
| Argentina | 22 | 0.1% |
| Armenia | 9 | 0.1% |
| Asia | 1,018 | 6.0% |
| Australia | 27 | 0.2% |
| Bangladesh | 28 | 0.2% |
| Belarus | 28 | 0.2% |
| Brazil | 29 | 0.2% |
| Bulgaria | 21 | 0.1% |
| Canada | 6 | 0.0% |
| Caribbean | 32 | 0.2% |
| Central America | 133 | 0.8% |
| Chile | 7 | 0.0% |
| China | 341 | 2.0% |
| Colombia | 125 | 0.7% |
| Cuba | 25 | 0.2% |
| Czechoslovakia | 34 | 0.2% |
| Denmark | 13 | 0.1% |
| Dominican Republic | 4 | 0.0% |
| Eastern Asia | 665 | 3.9% |
| Eastern Europe | 259 | 1.5% |
| Ecuador | 120 | 0.7% |
| El Salvador | 93 | 0.5% |
| England | 37 | 0.2% |
| Europe | 812 | 4.8% |
| France | 17 | 0.1% |
| Germany | 54 | 0.3% |
| Greece | 83 | 0.5% |
| Guatemala | 15 | 0.1% |
| Honduras | 19 | 0.1% |
| Hong Kong | 75 | 0.4% |
| Hungary | 55 | 0.3% |
| India | 119 | 0.7% |
| Iran | 39 | 0.2% |
| Ireland | 8 | 0.1% |
| Israel | 25 | 0.2% |
| Italy | 154 | 0.9% |
| Jamaica | 3 | 0.0% |
| Japan | 69 | 0.4% |
| Korea | 255 | 1.5% |
| Latin America | 524 | 3.1% |
| Lebanon | 3 | 0.0% |
| Lithuania | 51 | 0.3% |
| Mexico | 6 | 0.0% |
| Netherlands | 9 | 0.1% |
| Northern Africa | 8 | 0.1% |
| Northern Europe | 184 | 1.1% |
| Oceania | 27 | 0.2% |
| Peru | 56 | 0.3% |
| Philippines | 87 | 0.5% |
| Poland | 39 | 0.2% |
| Russia | 18 | 0.1% |
| Senegal | 13 | 0.1% |
| South Africa | 31 | 0.2% |
| South America | 359 | 2.1% |
| South Central Asia | 186 | 1.1% |
| South Eastern Asia | 87 | 0.5% |
| Southern Europe | 289 | 1.7% |
| Spain | 52 | 0.3% |
| Taiwan | 70 | 0.4% |
| Turkey | 20 | 0.1% |
| Western Africa | 13 | 0.1% |
| Western Asia | 80 | 0.5% |
| Western Europe | 80 | 0.5% | View All 64 Rows |
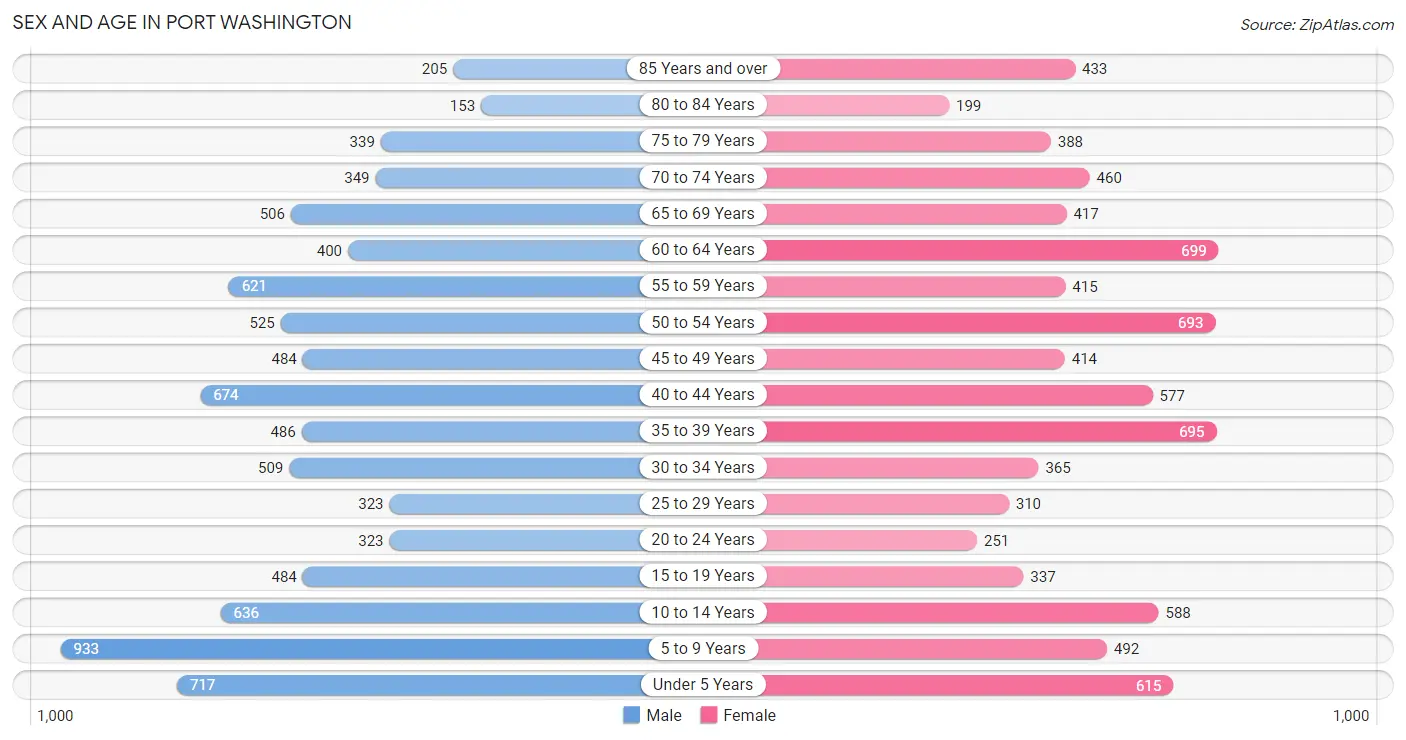
Sex and Age in Port Washington
Sex and Age in Port Washington
The most populous age groups in Port Washington are 5 to 9 Years (933 | 10.8%) for men and 60 to 64 Years (699 | 8.4%) for women.
| Age Bracket | Male | Female |
| Under 5 Years | 717 (8.3%) | 615 (7.4%) |
| 5 to 9 Years | 933 (10.8%) | 492 (5.9%) |
| 10 to 14 Years | 636 (7.3%) | 588 (7.0%) |
| 15 to 19 Years | 484 (5.6%) | 337 (4.0%) |
| 20 to 24 Years | 323 (3.7%) | 251 (3.0%) |
| 25 to 29 Years | 323 (3.7%) | 310 (3.7%) |
| 30 to 34 Years | 509 (5.9%) | 365 (4.4%) |
| 35 to 39 Years | 486 (5.6%) | 695 (8.3%) |
| 40 to 44 Years | 674 (7.8%) | 577 (6.9%) |
| 45 to 49 Years | 484 (5.6%) | 414 (5.0%) |
| 50 to 54 Years | 525 (6.1%) | 693 (8.3%) |
| 55 to 59 Years | 621 (7.2%) | 415 (5.0%) |
| 60 to 64 Years | 400 (4.6%) | 699 (8.4%) |
| 65 to 69 Years | 506 (5.8%) | 417 (5.0%) |
| 70 to 74 Years | 349 (4.0%) | 460 (5.5%) |
| 75 to 79 Years | 339 (3.9%) | 388 (4.6%) |
| 80 to 84 Years | 153 (1.8%) | 199 (2.4%) |
| 85 Years and over | 205 (2.4%) | 433 (5.2%) |
| Total | 8,667 (100.0%) | 8,348 (100.0%) |
Families and Households in Port Washington
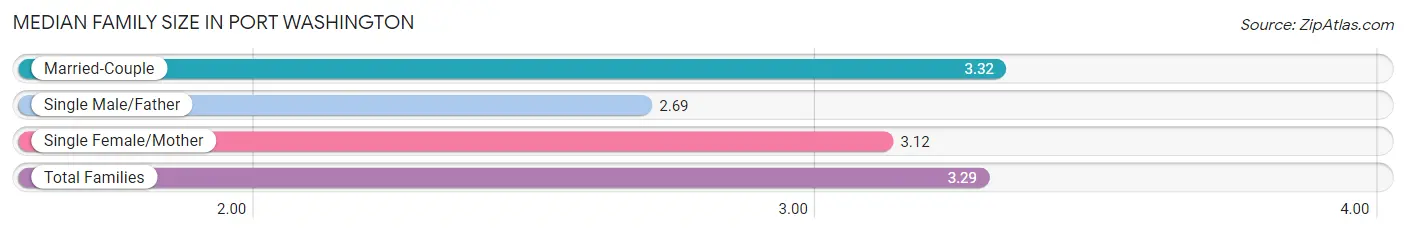
Median Family Size in Port Washington
The median family size in Port Washington is 3.29 persons per family, with married-couple families (4,082 | 88.1%) accounting for the largest median family size of 3.32 persons per family. On the other hand, single male/father families (117 | 2.5%) represent the smallest median family size with 2.69 persons per family.
| Family Type | # Families | Family Size |
| Married-Couple | 4,082 (88.1%) | 3.32 |
| Single Male/Father | 117 (2.5%) | 2.69 |
| Single Female/Mother | 434 (9.4%) | 3.12 |
| Total Families | 4,633 (100.0%) | 3.29 |
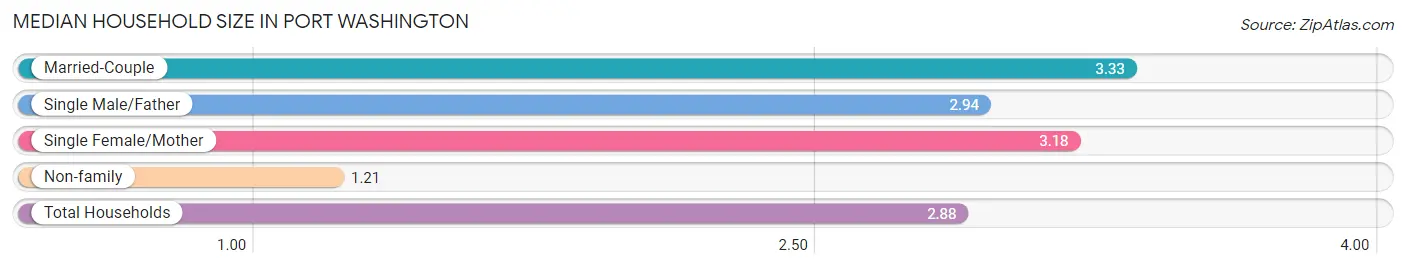
Median Household Size in Port Washington
The median household size in Port Washington is 2.88 persons per household, with married-couple households (4,082 | 70.1%) accounting for the largest median household size of 3.33 persons per household. non-family households (1,187 | 20.4%) represent the smallest median household size with 1.21 persons per household.
| Household Type | # Households | Household Size |
| Married-Couple | 4,082 (70.1%) | 3.33 |
| Single Male/Father | 117 (2.0%) | 2.94 |
| Single Female/Mother | 434 (7.5%) | 3.18 |
| Non-family | 1,187 (20.4%) | 1.21 |
| Total Households | 5,820 (100.0%) | 2.88 |
Household Size by Marriage Status in Port Washington
Out of a total of 5,820 households in Port Washington, 4,633 (79.6%) are family households, while 1,187 (20.4%) are nonfamily households. The most numerous type of family households are 2-person households, comprising 1,649, and the most common type of nonfamily households are 1-person households, comprising 1,049.
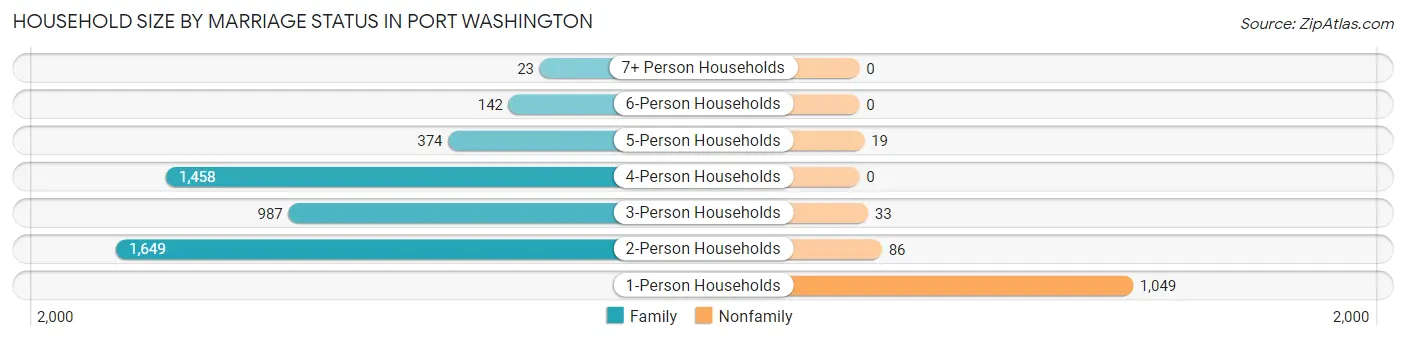
| Household Size | Family Households | Nonfamily Households |
| 1-Person Households | - | 1,049 (18.0%) |
| 2-Person Households | 1,649 (28.3%) | 86 (1.5%) |
| 3-Person Households | 987 (17.0%) | 33 (0.6%) |
| 4-Person Households | 1,458 (25.1%) | 0 (0.0%) |
| 5-Person Households | 374 (6.4%) | 19 (0.3%) |
| 6-Person Households | 142 (2.4%) | 0 (0.0%) |
| 7+ Person Households | 23 (0.4%) | 0 (0.0%) |
| Total | 4,633 (79.6%) | 1,187 (20.4%) |
Female Fertility in Port Washington
Fertility by Age in Port Washington
Average fertility rate in Port Washington is 84.0 births per 1,000 women. Women in the age bracket of 20 to 34 years have the highest fertility rate with 104.0 births per 1,000 women. Women in the age bracket of 35 to 50 years acount for 63.5% of all women with births.
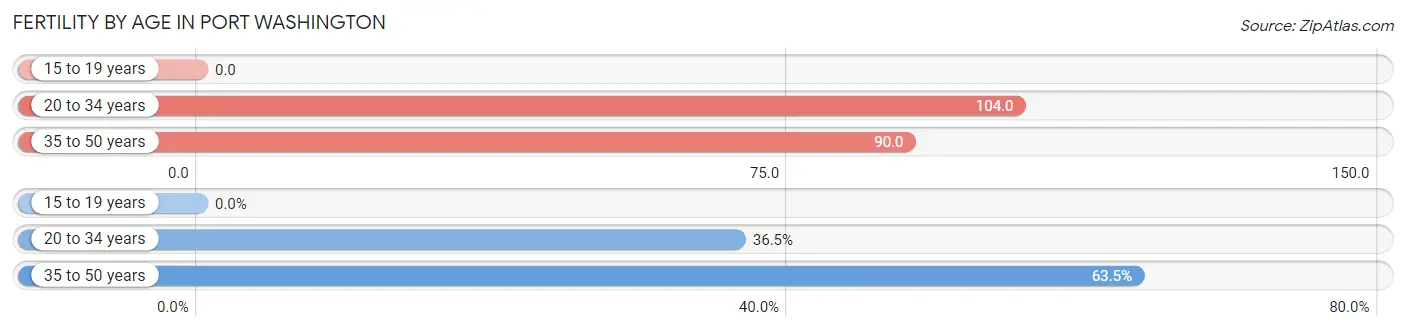
| Age Bracket | Women with Births | Births / 1,000 Women |
| 15 to 19 years | 0 (0.0%) | 0.0 |
| 20 to 34 years | 96 (36.5%) | 104.0 |
| 35 to 50 years | 167 (63.5%) | 90.0 |
| Total | 263 (100.0%) | 84.0 |
Fertility by Age by Marriage Status in Port Washington
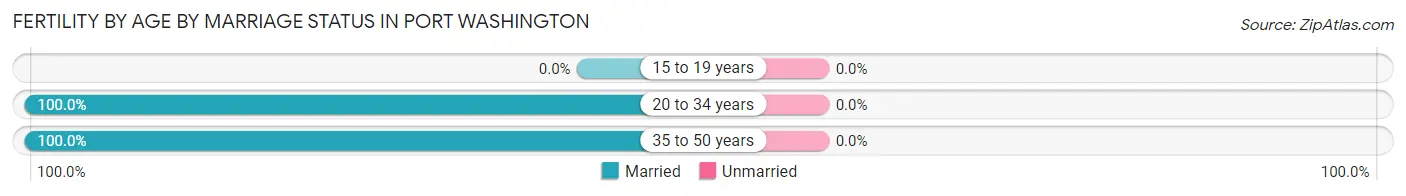
| Age Bracket | Married | Unmarried |
| 15 to 19 years | 0 (0.0%) | 0 (0.0%) |
| 20 to 34 years | 96 (100.0%) | 0 (0.0%) |
| 35 to 50 years | 167 (100.0%) | 0 (0.0%) |
| Total | 263 (100.0%) | 0 (0.0%) |
Fertility by Education in Port Washington
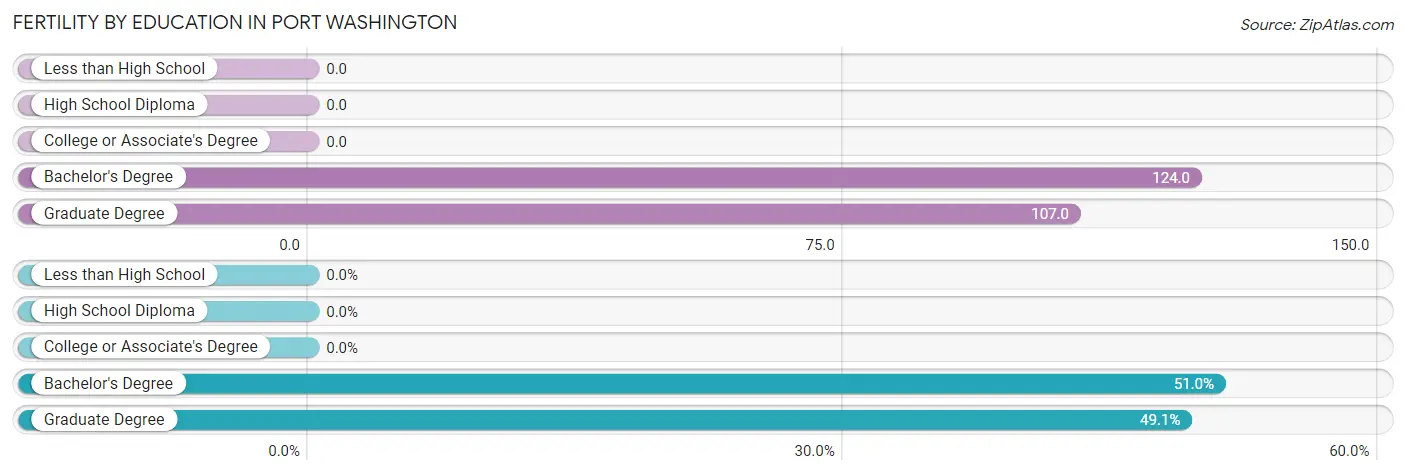
| Educational Attainment | Women with Births | Births / 1,000 Women |
| Less than High School | 0 (0.0%) | 0.0 |
| High School Diploma | 0 (0.0%) | 0.0 |
| College or Associate's Degree | 0 (0.0%) | 0.0 |
| Bachelor's Degree | 134 (50.9%) | 124.0 |
| Graduate Degree | 129 (49.0%) | 107.0 |
| Total | 263 (100.0%) | 84.0 |
Fertility by Education by Marriage Status in Port Washington
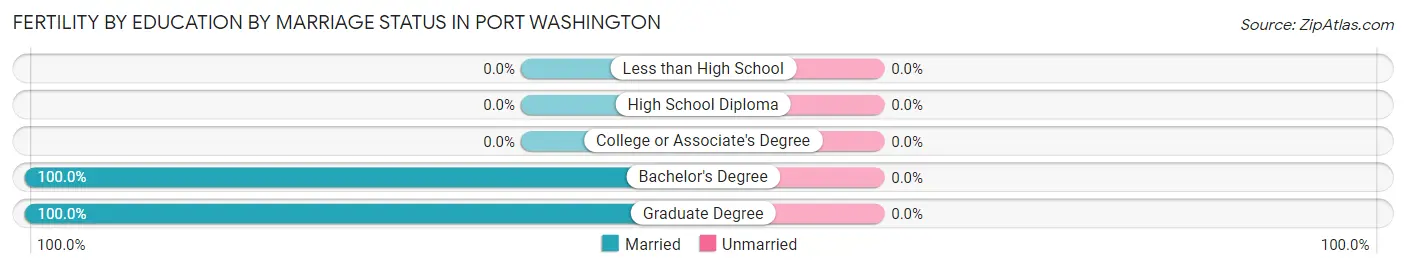
| Educational Attainment | Married | Unmarried |
| Less than High School | 0 (0.0%) | 0 (0.0%) |
| High School Diploma | 0 (0.0%) | 0 (0.0%) |
| College or Associate's Degree | 0 (0.0%) | 0 (0.0%) |
| Bachelor's Degree | 134 (100.0%) | 0 (0.0%) |
| Graduate Degree | 129 (100.0%) | 0 (0.0%) |
| Total | 263 (100.0%) | 0 (0.0%) |
Employment Characteristics in Port Washington
Employment by Class of Employer in Port Washington
Among the 8,080 employed individuals in Port Washington, private company employees (4,959 | 61.4%), not-for-profit organizations (911 | 11.3%), and self-employed (not incorporated) (647 | 8.0%) make up the most common classes of employment.
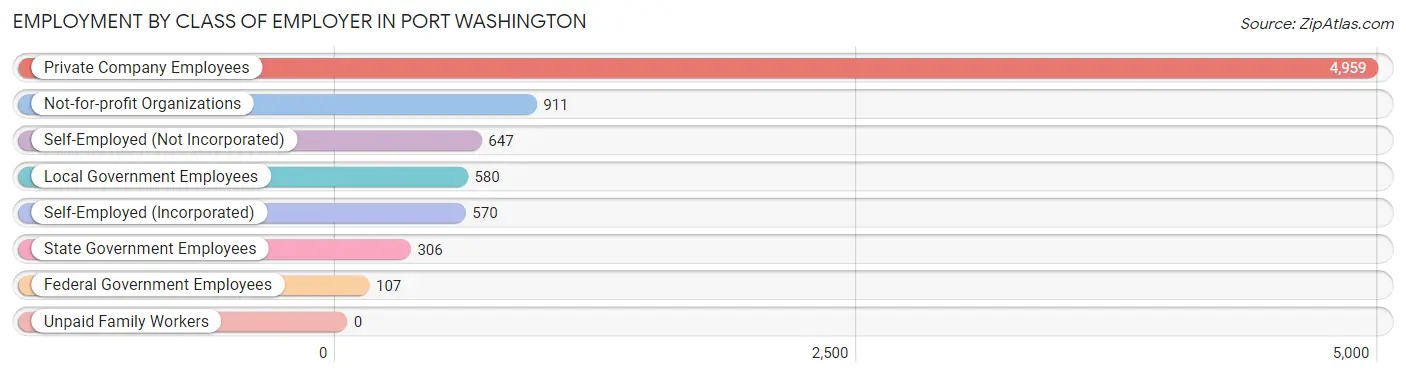
| Employer Class | # Employees | % Employees |
| Private Company Employees | 4,959 | 61.4% |
| Self-Employed (Incorporated) | 570 | 7.0% |
| Self-Employed (Not Incorporated) | 647 | 8.0% |
| Not-for-profit Organizations | 911 | 11.3% |
| Local Government Employees | 580 | 7.2% |
| State Government Employees | 306 | 3.8% |
| Federal Government Employees | 107 | 1.3% |
| Unpaid Family Workers | 0 | 0.0% |
| Total | 8,080 | 100.0% |
Employment Status by Age in Port Washington
According to the labor force statistics for Port Washington, out of the total population over 16 years of age (12,921), 65.1% or 8,412 individuals are in the labor force, with 3.1% or 261 of them unemployed. The age group with the highest labor force participation rate is 55 to 59 years, with 89.6% or 928 individuals in the labor force. Within the labor force, the 16 to 19 years age range has the highest percentage of unemployed individuals, with 21.0% or 29 of them being unemployed.
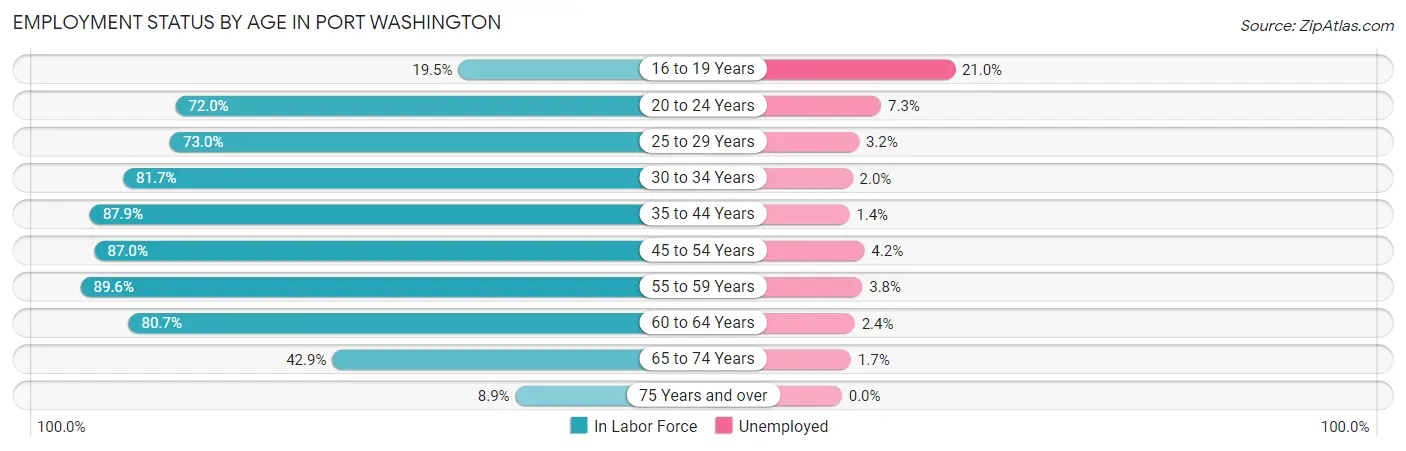
| Age Bracket | In Labor Force | Unemployed |
| 16 to 19 Years | 138 (19.5%) | 29 (21.0%) |
| 20 to 24 Years | 413 (72.0%) | 30 (7.3%) |
| 25 to 29 Years | 462 (73.0%) | 15 (3.2%) |
| 30 to 34 Years | 714 (81.7%) | 14 (2.0%) |
| 35 to 44 Years | 2,138 (87.9%) | 30 (1.4%) |
| 45 to 54 Years | 1,841 (87.0%) | 77 (4.2%) |
| 55 to 59 Years | 928 (89.6%) | 35 (3.8%) |
| 60 to 64 Years | 887 (80.7%) | 21 (2.4%) |
| 65 to 74 Years | 743 (42.9%) | 13 (1.7%) |
| 75 Years and over | 153 (8.9%) | 0 (0.0%) |
| Total | 8,412 (65.1%) | 261 (3.1%) |
Employment Status by Educational Attainment in Port Washington
According to labor force statistics for Port Washington, 85.1% of individuals (6,970) out of the total population between 25 and 64 years of age (8,190) are in the labor force, with 2.7% or 188 of them being unemployed. The group with the highest labor force participation rate are those with the educational attainment of bachelor's degree or higher, with 88.5% or 5,732 individuals in the labor force. Within the labor force, individuals with college / associate degree education have the highest percentage of unemployment, with 5.3% or 34 of them being unemployed.
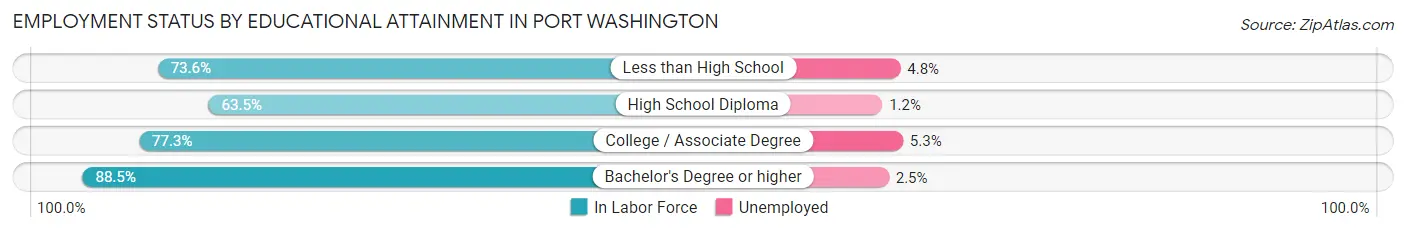
| Educational Attainment | In Labor Force | Unemployed |
| Less than High School | 251 (73.6%) | 16 (4.8%) |
| High School Diploma | 346 (63.5%) | 7 (1.2%) |
| College / Associate Degree | 639 (77.3%) | 44 (5.3%) |
| Bachelor's Degree or higher | 5,732 (88.5%) | 162 (2.5%) |
| Total | 6,970 (85.1%) | 221 (2.7%) |
Employment Occupations by Sex in Port Washington
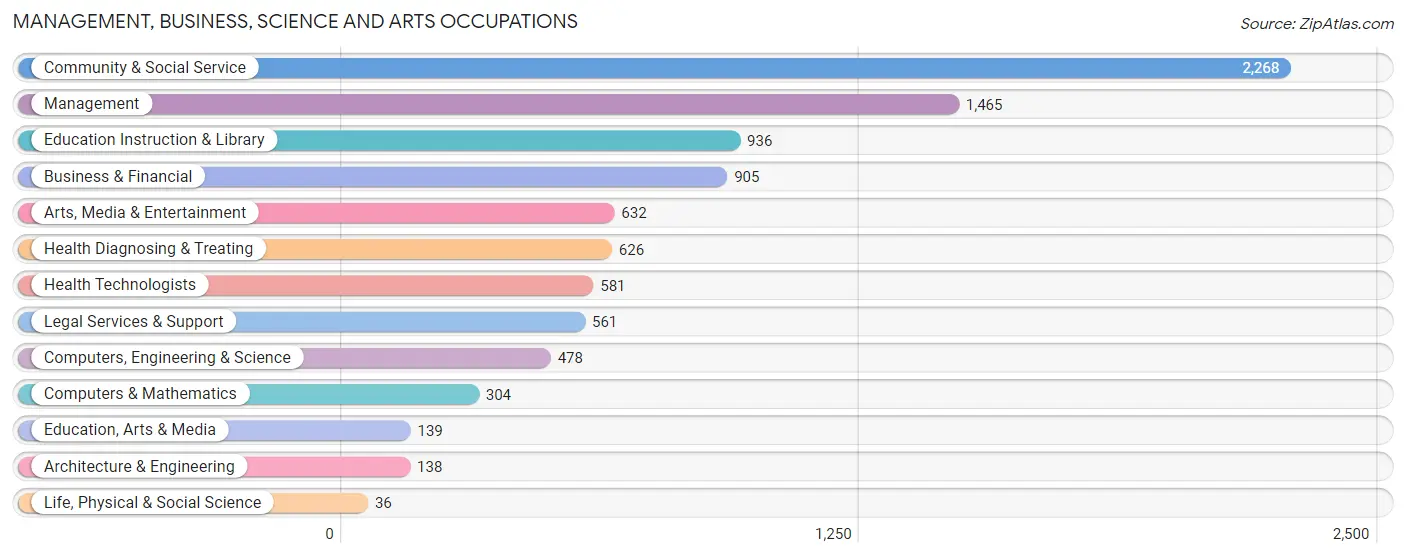
Management, Business, Science and Arts Occupations
The most common Management, Business, Science and Arts occupations in Port Washington are Community & Social Service (2,268 | 27.8%), Management (1,465 | 18.0%), Education Instruction & Library (936 | 11.5%), Business & Financial (905 | 11.1%), and Arts, Media & Entertainment (632 | 7.7%).
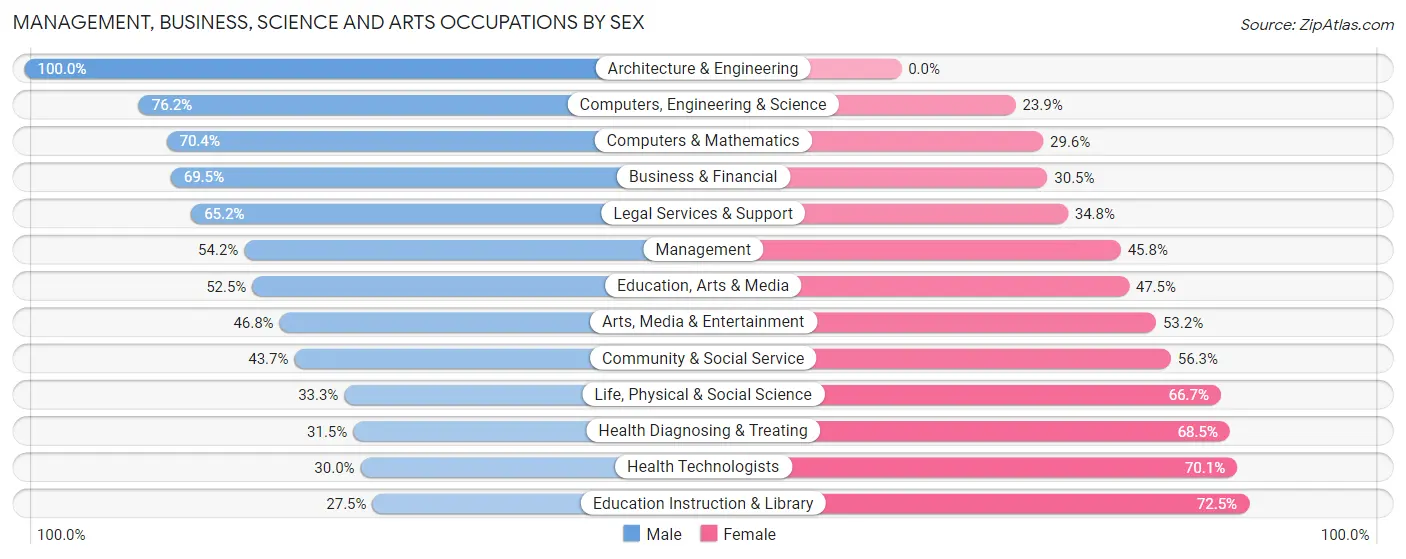
Management, Business, Science and Arts Occupations by Sex
Within the Management, Business, Science and Arts occupations in Port Washington, the most male-oriented occupations are Architecture & Engineering (100.0%), Computers, Engineering & Science (76.1%), and Computers & Mathematics (70.4%), while the most female-oriented occupations are Education Instruction & Library (72.5%), Health Technologists (70.1%), and Health Diagnosing & Treating (68.5%).
| Occupation | Male | Female |
| Management | 794 (54.2%) | 671 (45.8%) |
| Business & Financial | 629 (69.5%) | 276 (30.5%) |
| Computers, Engineering & Science | 364 (76.1%) | 114 (23.8%) |
| Computers & Mathematics | 214 (70.4%) | 90 (29.6%) |
| Architecture & Engineering | 138 (100.0%) | 0 (0.0%) |
| Life, Physical & Social Science | 12 (33.3%) | 24 (66.7%) |
| Community & Social Service | 992 (43.7%) | 1,276 (56.3%) |
| Education, Arts & Media | 73 (52.5%) | 66 (47.5%) |
| Legal Services & Support | 366 (65.2%) | 195 (34.8%) |
| Education Instruction & Library | 257 (27.5%) | 679 (72.5%) |
| Arts, Media & Entertainment | 296 (46.8%) | 336 (53.2%) |
| Health Diagnosing & Treating | 197 (31.5%) | 429 (68.5%) |
| Health Technologists | 174 (29.9%) | 407 (70.1%) |
| Total (Category) | 2,976 (51.8%) | 2,766 (48.2%) |
| Total (Overall) | 4,395 (53.9%) | 3,757 (46.1%) |
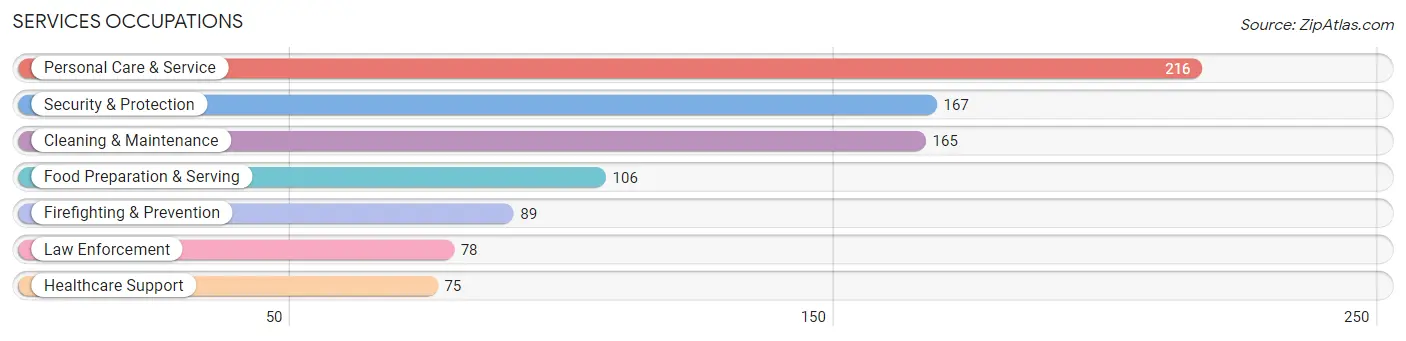
Services Occupations
The most common Services occupations in Port Washington are Personal Care & Service (216 | 2.6%), Security & Protection (167 | 2.1%), Cleaning & Maintenance (165 | 2.0%), Food Preparation & Serving (106 | 1.3%), and Firefighting & Prevention (89 | 1.1%).
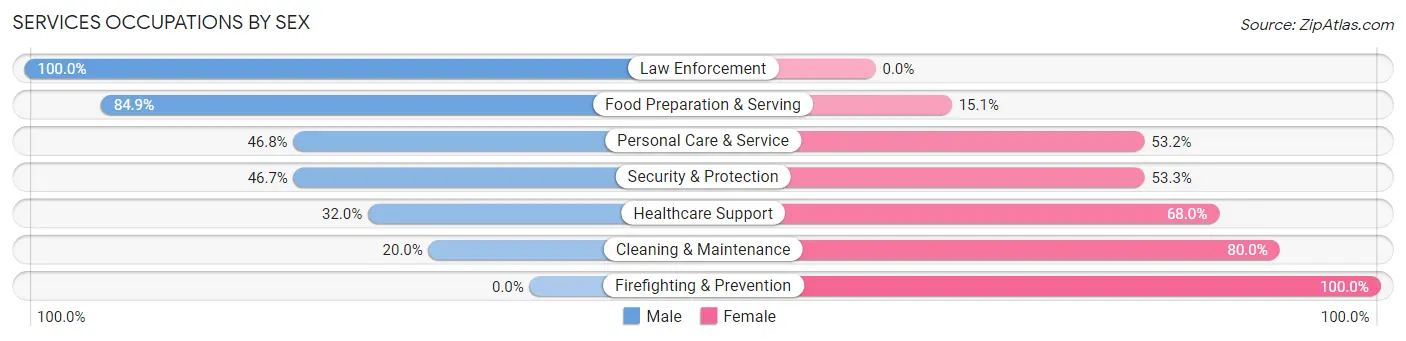
Services Occupations by Sex
Within the Services occupations in Port Washington, the most male-oriented occupations are Law Enforcement (100.0%), Food Preparation & Serving (84.9%), and Personal Care & Service (46.8%), while the most female-oriented occupations are Firefighting & Prevention (100.0%), Cleaning & Maintenance (80.0%), and Healthcare Support (68.0%).
| Occupation | Male | Female |
| Healthcare Support | 24 (32.0%) | 51 (68.0%) |
| Security & Protection | 78 (46.7%) | 89 (53.3%) |
| Firefighting & Prevention | 0 (0.0%) | 89 (100.0%) |
| Law Enforcement | 78 (100.0%) | 0 (0.0%) |
| Food Preparation & Serving | 90 (84.9%) | 16 (15.1%) |
| Cleaning & Maintenance | 33 (20.0%) | 132 (80.0%) |
| Personal Care & Service | 101 (46.8%) | 115 (53.2%) |
| Total (Category) | 326 (44.7%) | 403 (55.3%) |
| Total (Overall) | 4,395 (53.9%) | 3,757 (46.1%) |
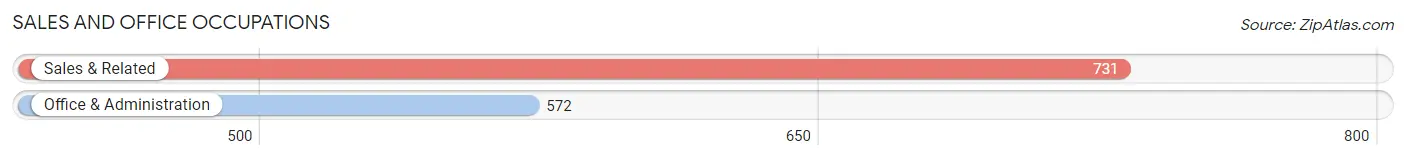
Sales and Office Occupations
The most common Sales and Office occupations in Port Washington are Sales & Related (731 | 9.0%), and Office & Administration (572 | 7.0%).
Sales and Office Occupations by Sex
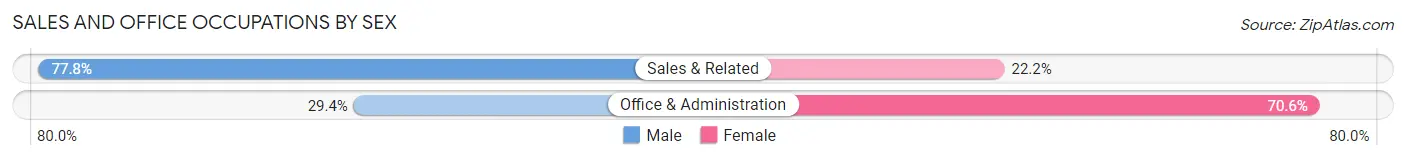
| Occupation | Male | Female |
| Sales & Related | 569 (77.8%) | 162 (22.2%) |
| Office & Administration | 168 (29.4%) | 404 (70.6%) |
| Total (Category) | 737 (56.6%) | 566 (43.4%) |
| Total (Overall) | 4,395 (53.9%) | 3,757 (46.1%) |
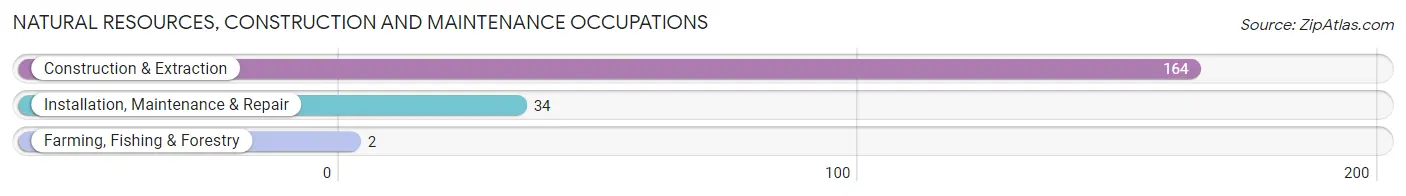
Natural Resources, Construction and Maintenance Occupations
The most common Natural Resources, Construction and Maintenance occupations in Port Washington are Construction & Extraction (164 | 2.0%), Installation, Maintenance & Repair (34 | 0.4%), and Farming, Fishing & Forestry (2 | 0.0%).
Natural Resources, Construction and Maintenance Occupations by Sex
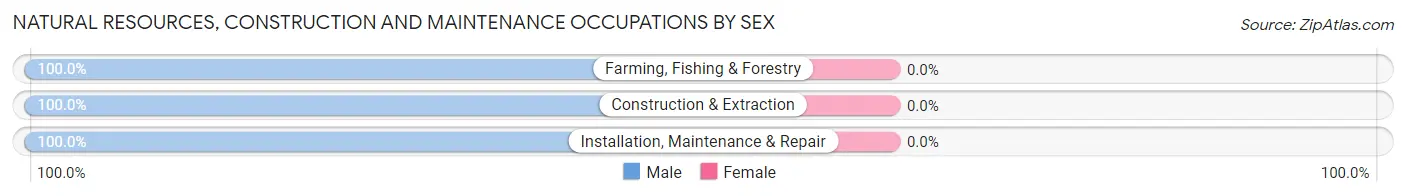
| Occupation | Male | Female |
| Farming, Fishing & Forestry | 2 (100.0%) | 0 (0.0%) |
| Construction & Extraction | 164 (100.0%) | 0 (0.0%) |
| Installation, Maintenance & Repair | 34 (100.0%) | 0 (0.0%) |
| Total (Category) | 200 (100.0%) | 0 (0.0%) |
| Total (Overall) | 4,395 (53.9%) | 3,757 (46.1%) |
Production, Transportation and Moving Occupations
The most common Production, Transportation and Moving occupations in Port Washington are Transportation (118 | 1.5%), Production (36 | 0.4%), and Material Moving (24 | 0.3%).
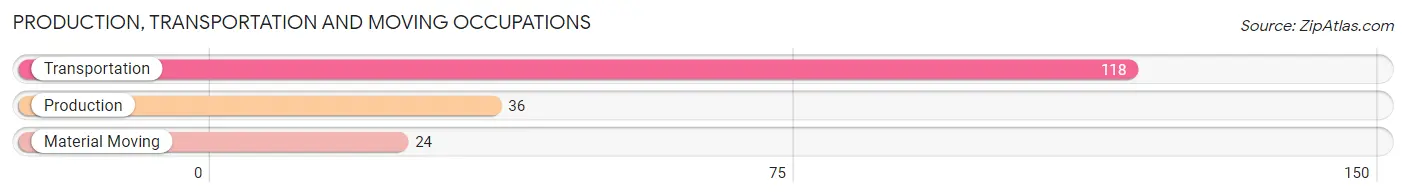
Production, Transportation and Moving Occupations by Sex
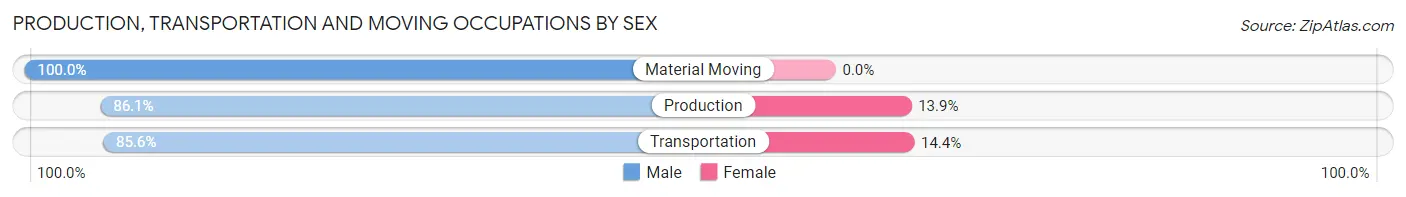
| Occupation | Male | Female |
| Production | 31 (86.1%) | 5 (13.9%) |
| Transportation | 101 (85.6%) | 17 (14.4%) |
| Material Moving | 24 (100.0%) | 0 (0.0%) |
| Total (Category) | 156 (87.6%) | 22 (12.4%) |
| Total (Overall) | 4,395 (53.9%) | 3,757 (46.1%) |
Employment Industries by Sex in Port Washington
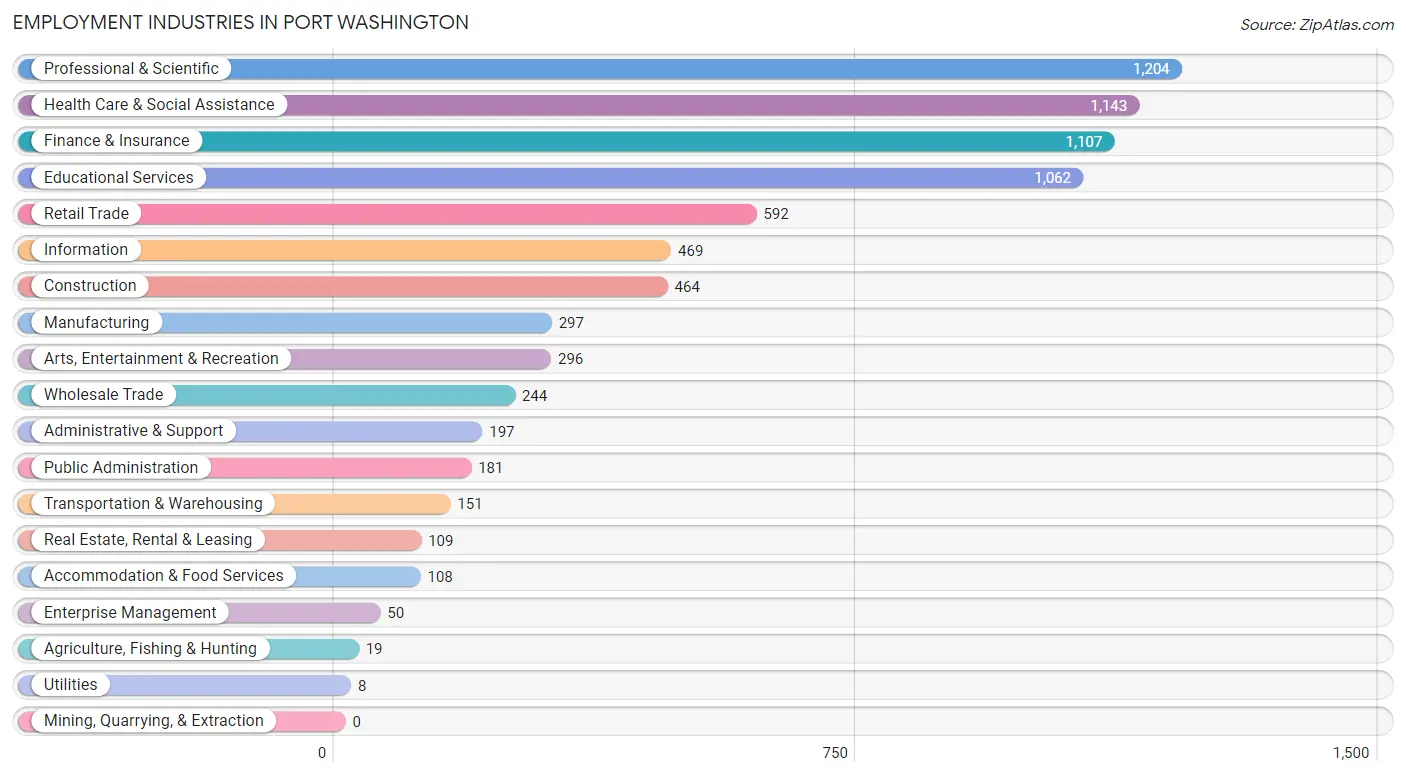
Employment Industries in Port Washington
The major employment industries in Port Washington include Professional & Scientific (1,204 | 14.8%), Health Care & Social Assistance (1,143 | 14.0%), Finance & Insurance (1,107 | 13.6%), Educational Services (1,062 | 13.0%), and Retail Trade (592 | 7.3%).
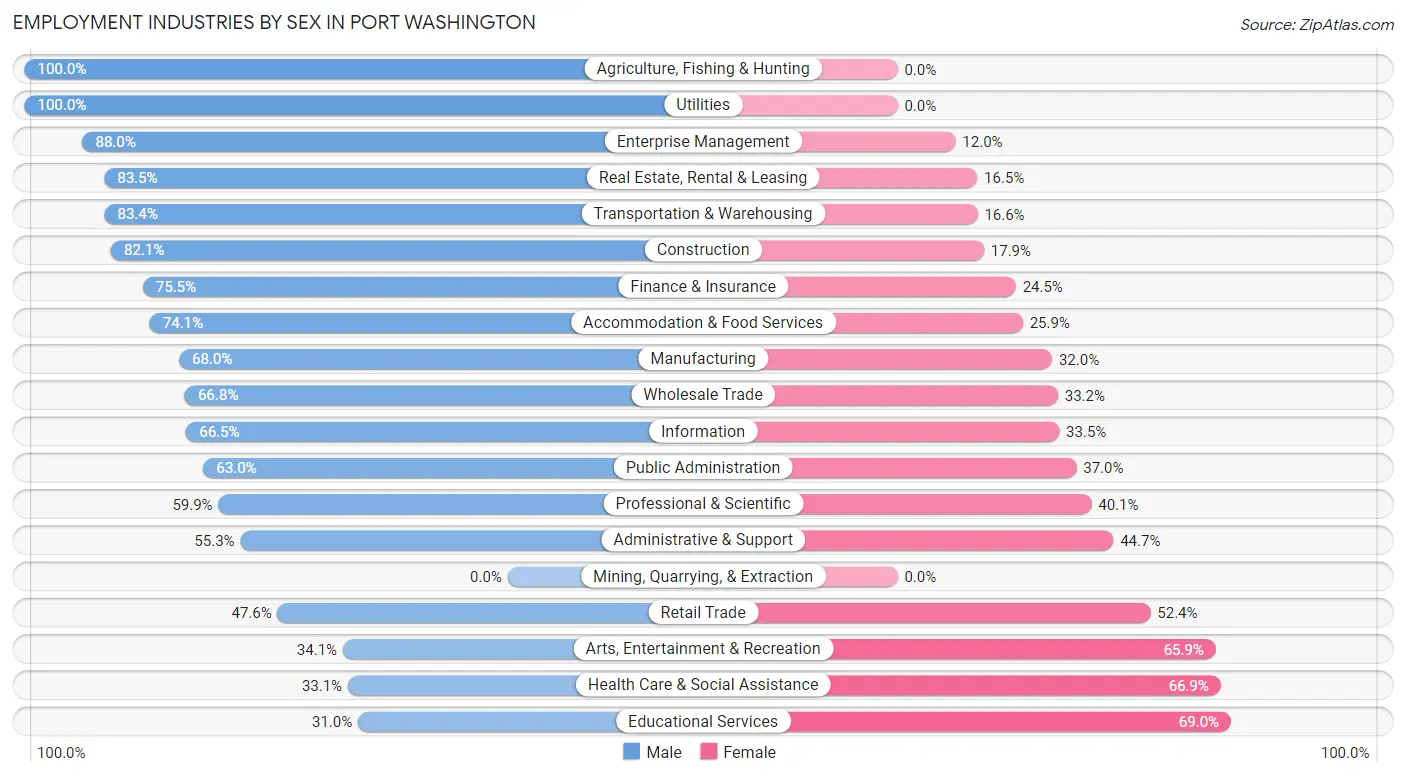
Employment Industries by Sex in Port Washington
The Port Washington industries that see more men than women are Agriculture, Fishing & Hunting (100.0%), Utilities (100.0%), and Enterprise Management (88.0%), whereas the industries that tend to have a higher number of women are Educational Services (69.0%), Health Care & Social Assistance (66.9%), and Arts, Entertainment & Recreation (65.9%).
| Industry | Male | Female |
| Agriculture, Fishing & Hunting | 19 (100.0%) | 0 (0.0%) |
| Mining, Quarrying, & Extraction | 0 (0.0%) | 0 (0.0%) |
| Construction | 381 (82.1%) | 83 (17.9%) |
| Manufacturing | 202 (68.0%) | 95 (32.0%) |
| Wholesale Trade | 163 (66.8%) | 81 (33.2%) |
| Retail Trade | 282 (47.6%) | 310 (52.4%) |
| Transportation & Warehousing | 126 (83.4%) | 25 (16.6%) |
| Utilities | 8 (100.0%) | 0 (0.0%) |
| Information | 312 (66.5%) | 157 (33.5%) |
| Finance & Insurance | 836 (75.5%) | 271 (24.5%) |
| Real Estate, Rental & Leasing | 91 (83.5%) | 18 (16.5%) |
| Professional & Scientific | 721 (59.9%) | 483 (40.1%) |
| Enterprise Management | 44 (88.0%) | 6 (12.0%) |
| Administrative & Support | 109 (55.3%) | 88 (44.7%) |
| Educational Services | 329 (31.0%) | 733 (69.0%) |
| Health Care & Social Assistance | 378 (33.1%) | 765 (66.9%) |
| Arts, Entertainment & Recreation | 101 (34.1%) | 195 (65.9%) |
| Accommodation & Food Services | 80 (74.1%) | 28 (25.9%) |
| Public Administration | 114 (63.0%) | 67 (37.0%) |
| Total | 4,395 (53.9%) | 3,757 (46.1%) |
Education in Port Washington
School Enrollment in Port Washington
The most common levels of schooling among the 4,076 students in Port Washington are middle school (997 | 24.5%), elementary school (872 | 21.4%), and high school (717 | 17.6%).
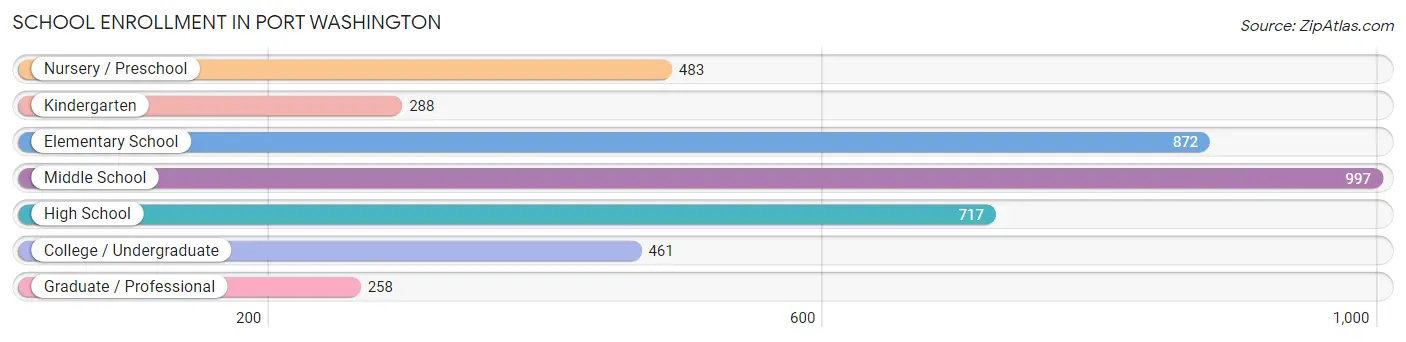
| School Level | # Students | % Students |
| Nursery / Preschool | 483 | 11.8% |
| Kindergarten | 288 | 7.1% |
| Elementary School | 872 | 21.4% |
| Middle School | 997 | 24.5% |
| High School | 717 | 17.6% |
| College / Undergraduate | 461 | 11.3% |
| Graduate / Professional | 258 | 6.3% |
| Total | 4,076 | 100.0% |
School Enrollment by Age by Funding Source in Port Washington
Out of a total of 4,076 students who are enrolled in schools in Port Washington, 1,178 (28.9%) attend a private institution, while the remaining 2,898 (71.1%) are enrolled in public schools. The age group of 3 to 4 year olds has the highest likelihood of being enrolled in private schools, with 250 (73.8% in the age bracket) enrolled. Conversely, the age group of 5 to 9 year old has the lowest likelihood of being enrolled in a private school, with 1,061 (85.6% in the age bracket) attending a public institution.
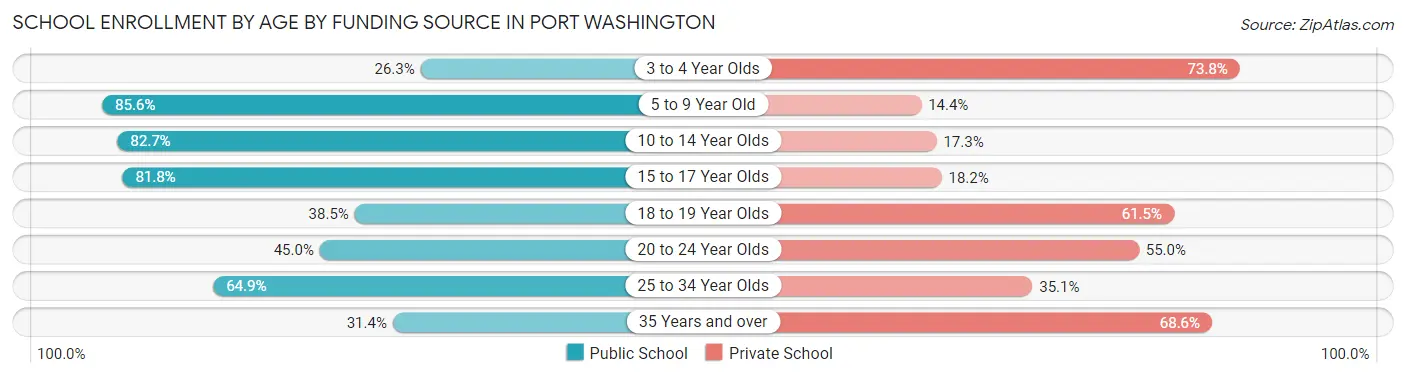
| Age Bracket | Public School | Private School |
| 3 to 4 Year Olds | 89 (26.3%) | 250 (73.8%) |
| 5 to 9 Year Old | 1,061 (85.6%) | 179 (14.4%) |
| 10 to 14 Year Olds | 971 (82.7%) | 203 (17.3%) |
| 15 to 17 Year Olds | 426 (81.8%) | 95 (18.2%) |
| 18 to 19 Year Olds | 94 (38.5%) | 150 (61.5%) |
| 20 to 24 Year Olds | 154 (45.0%) | 188 (55.0%) |
| 25 to 34 Year Olds | 72 (64.9%) | 39 (35.1%) |
| 35 Years and over | 33 (31.4%) | 72 (68.6%) |
| Total | 2,898 (71.1%) | 1,178 (28.9%) |
Educational Attainment by Field of Study in Port Washington
Business (1,919 | 20.6%), social sciences (1,130 | 12.1%), liberal arts & history (787 | 8.5%), education (699 | 7.5%), and visual & performing arts (624 | 6.7%) are the most common fields of study among 9,304 individuals in Port Washington who have obtained a bachelor's degree or higher.
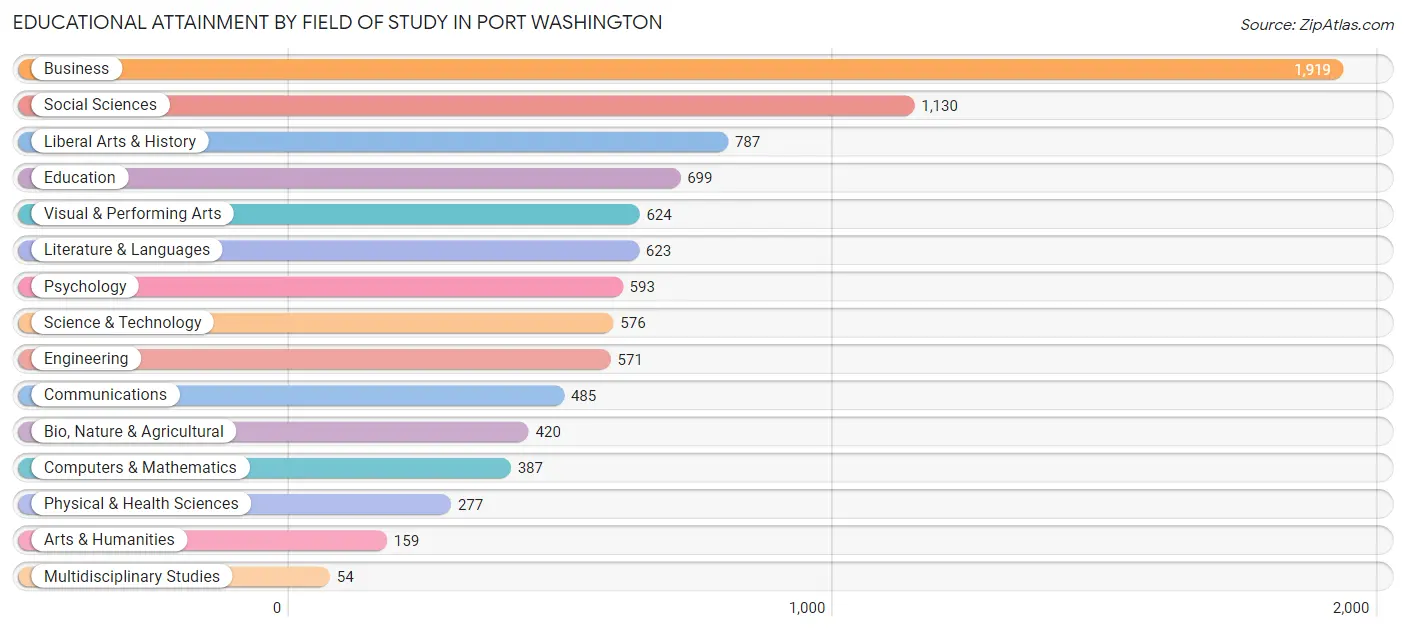
| Field of Study | # Graduates | % Graduates |
| Computers & Mathematics | 387 | 4.2% |
| Bio, Nature & Agricultural | 420 | 4.5% |
| Physical & Health Sciences | 277 | 3.0% |
| Psychology | 593 | 6.4% |
| Social Sciences | 1,130 | 12.1% |
| Engineering | 571 | 6.1% |
| Multidisciplinary Studies | 54 | 0.6% |
| Science & Technology | 576 | 6.2% |
| Business | 1,919 | 20.6% |
| Education | 699 | 7.5% |
| Literature & Languages | 623 | 6.7% |
| Liberal Arts & History | 787 | 8.5% |
| Visual & Performing Arts | 624 | 6.7% |
| Communications | 485 | 5.2% |
| Arts & Humanities | 159 | 1.7% |
| Total | 9,304 | 100.0% |
Transportation & Commute in Port Washington
Vehicle Availability by Sex in Port Washington
The most prevalent vehicle ownership categories in Port Washington are males with 2 vehicles (1,972, accounting for 45.0%) and females with 2 vehicles (1,753, making up 53.3%).
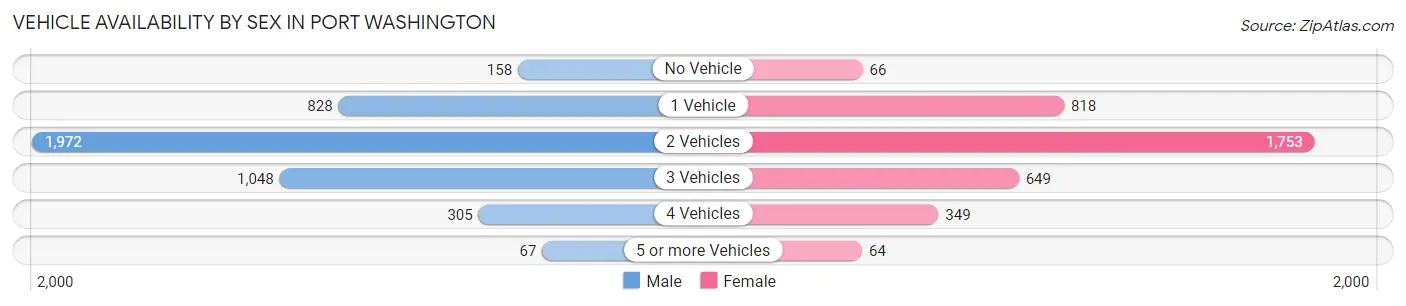
| Vehicles Available | Male | Female |
| No Vehicle | 158 (3.6%) | 66 (1.8%) |
| 1 Vehicle | 828 (18.9%) | 818 (22.1%) |
| 2 Vehicles | 1,972 (45.0%) | 1,753 (47.4%) |
| 3 Vehicles | 1,048 (23.9%) | 649 (17.5%) |
| 4 Vehicles | 305 (7.0%) | 349 (9.4%) |
| 5 or more Vehicles | 67 (1.5%) | 64 (1.7%) |
| Total | 4,378 (100.0%) | 3,699 (100.0%) |
Commute Time in Port Washington
The most frequently occuring commute durations in Port Washington are 60 to 89 minutes (1,316 commuters, 21.2%), 10 to 14 minutes (759 commuters, 12.2%), and 30 to 34 minutes (746 commuters, 12.0%).
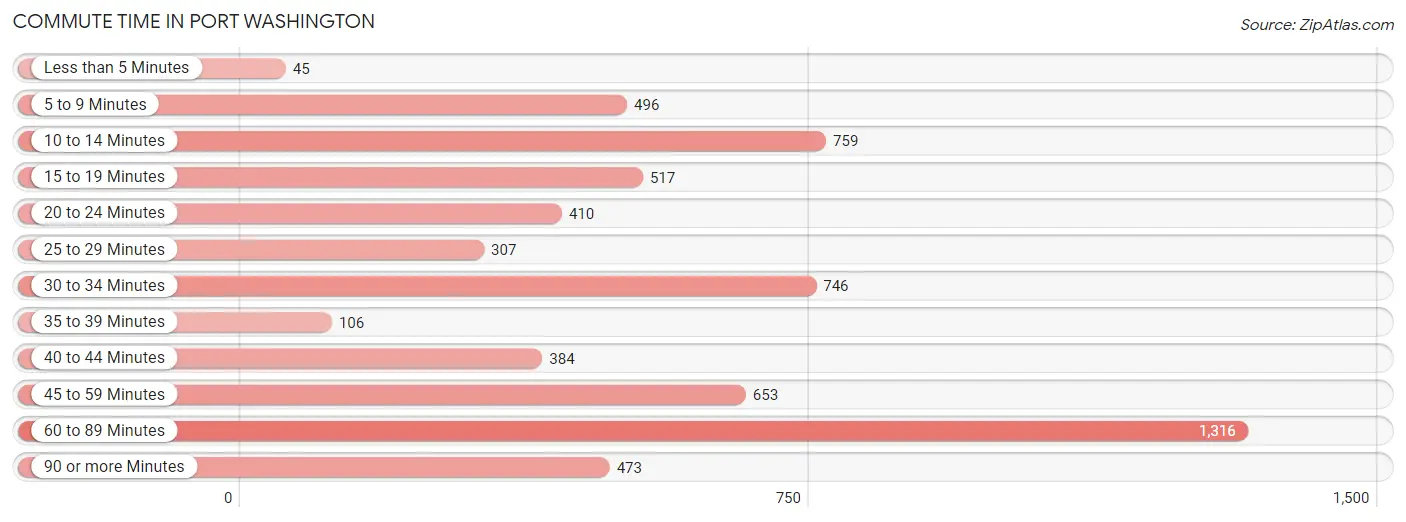
| Commute Time | # Commuters | % Commuters |
| Less than 5 Minutes | 45 | 0.7% |
| 5 to 9 Minutes | 496 | 8.0% |
| 10 to 14 Minutes | 759 | 12.2% |
| 15 to 19 Minutes | 517 | 8.3% |
| 20 to 24 Minutes | 410 | 6.6% |
| 25 to 29 Minutes | 307 | 4.9% |
| 30 to 34 Minutes | 746 | 12.0% |
| 35 to 39 Minutes | 106 | 1.7% |
| 40 to 44 Minutes | 384 | 6.2% |
| 45 to 59 Minutes | 653 | 10.5% |
| 60 to 89 Minutes | 1,316 | 21.2% |
| 90 or more Minutes | 473 | 7.6% |
Commute Time by Sex in Port Washington
The most common commute times in Port Washington are 60 to 89 minutes (982 commuters, 30.2%) for males and 10 to 14 minutes (398 commuters, 13.4%) for females.
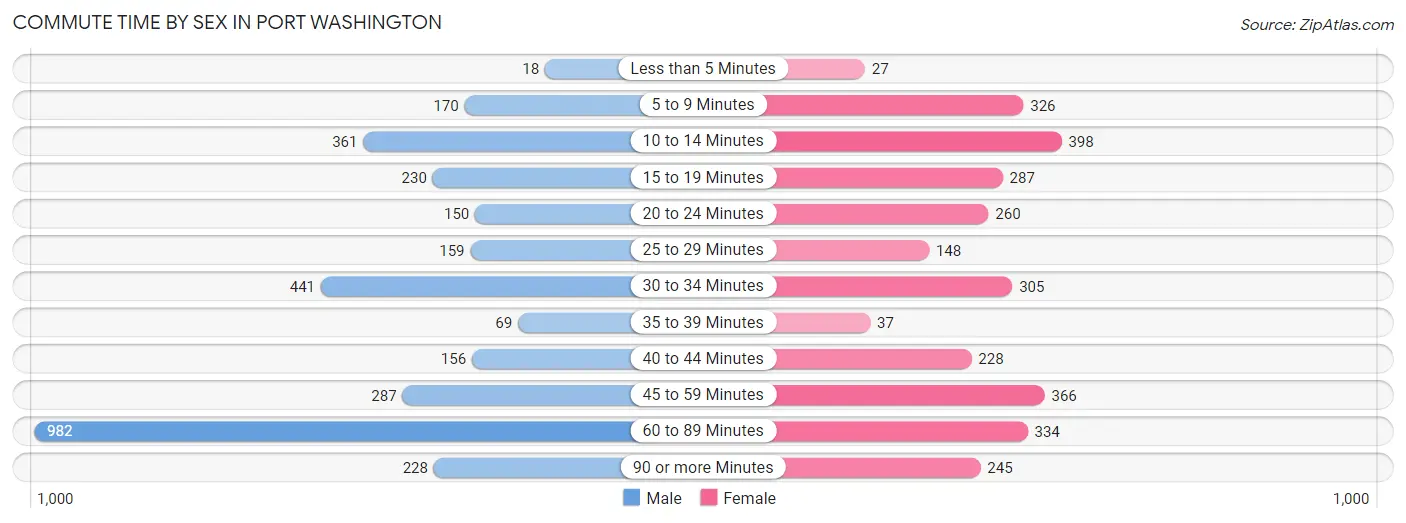
| Commute Time | Male | Female |
| Less than 5 Minutes | 18 (0.5%) | 27 (0.9%) |
| 5 to 9 Minutes | 170 (5.2%) | 326 (11.0%) |
| 10 to 14 Minutes | 361 (11.1%) | 398 (13.4%) |
| 15 to 19 Minutes | 230 (7.1%) | 287 (9.7%) |
| 20 to 24 Minutes | 150 (4.6%) | 260 (8.8%) |
| 25 to 29 Minutes | 159 (4.9%) | 148 (5.0%) |
| 30 to 34 Minutes | 441 (13.6%) | 305 (10.3%) |
| 35 to 39 Minutes | 69 (2.1%) | 37 (1.3%) |
| 40 to 44 Minutes | 156 (4.8%) | 228 (7.7%) |
| 45 to 59 Minutes | 287 (8.8%) | 366 (12.4%) |
| 60 to 89 Minutes | 982 (30.2%) | 334 (11.3%) |
| 90 or more Minutes | 228 (7.0%) | 245 (8.3%) |
Time of Departure to Work by Sex in Port Washington
The most frequent times of departure to work in Port Washington are 8:00 AM to 8:29 AM (618, 19.0%) for males and 7:00 AM to 7:29 AM (552, 18.6%) for females.
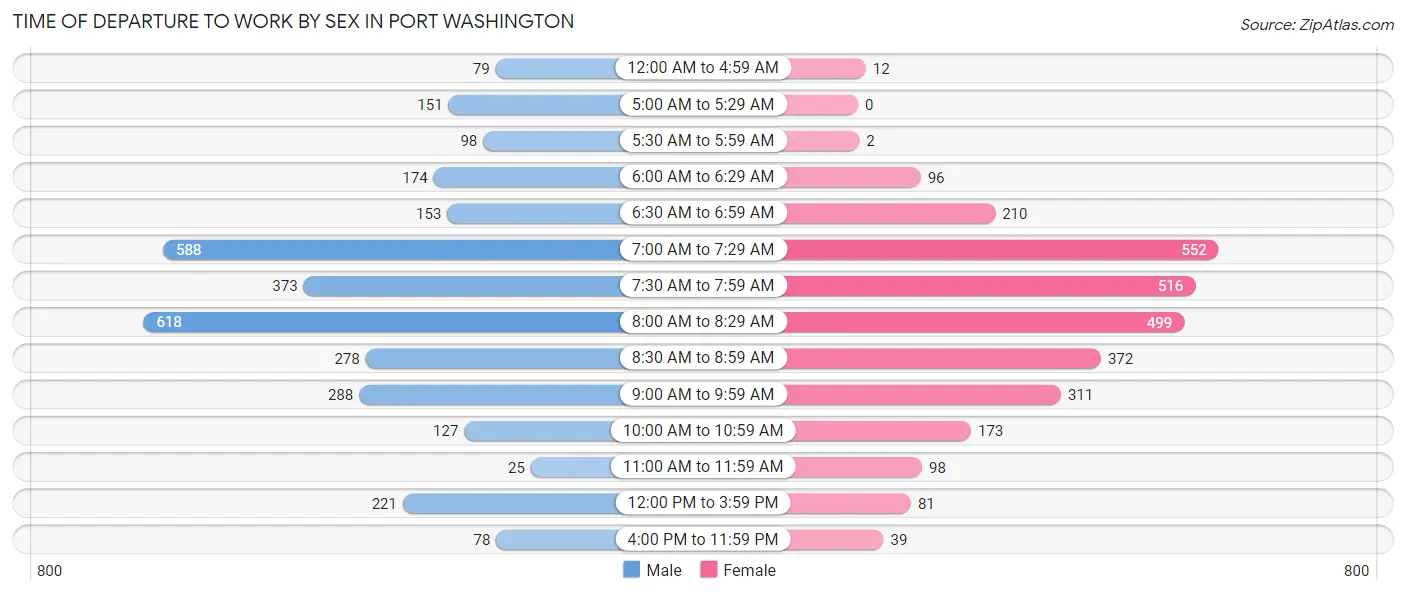
| Time of Departure | Male | Female |
| 12:00 AM to 4:59 AM | 79 (2.4%) | 12 (0.4%) |
| 5:00 AM to 5:29 AM | 151 (4.6%) | 0 (0.0%) |
| 5:30 AM to 5:59 AM | 98 (3.0%) | 2 (0.1%) |
| 6:00 AM to 6:29 AM | 174 (5.3%) | 96 (3.2%) |
| 6:30 AM to 6:59 AM | 153 (4.7%) | 210 (7.1%) |
| 7:00 AM to 7:29 AM | 588 (18.1%) | 552 (18.6%) |
| 7:30 AM to 7:59 AM | 373 (11.5%) | 516 (17.4%) |
| 8:00 AM to 8:29 AM | 618 (19.0%) | 499 (16.9%) |
| 8:30 AM to 8:59 AM | 278 (8.6%) | 372 (12.6%) |
| 9:00 AM to 9:59 AM | 288 (8.9%) | 311 (10.5%) |
| 10:00 AM to 10:59 AM | 127 (3.9%) | 173 (5.8%) |
| 11:00 AM to 11:59 AM | 25 (0.8%) | 98 (3.3%) |
| 12:00 PM to 3:59 PM | 221 (6.8%) | 81 (2.7%) |
| 4:00 PM to 11:59 PM | 78 (2.4%) | 39 (1.3%) |
| Total | 3,251 (100.0%) | 2,961 (100.0%) |
Housing Occupancy in Port Washington
Occupancy by Ownership in Port Washington
Of the total 5,820 dwellings in Port Washington, owner-occupied units account for 4,586 (78.8%), while renter-occupied units make up 1,234 (21.2%).
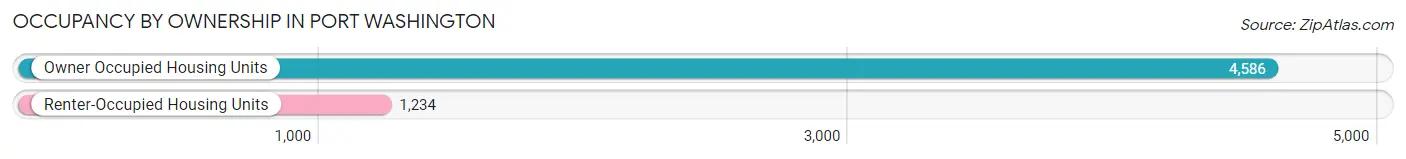
| Occupancy | # Housing Units | % Housing Units |
| Owner Occupied Housing Units | 4,586 | 78.8% |
| Renter-Occupied Housing Units | 1,234 | 21.2% |
| Total Occupied Housing Units | 5,820 | 100.0% |
Occupancy by Household Size in Port Washington
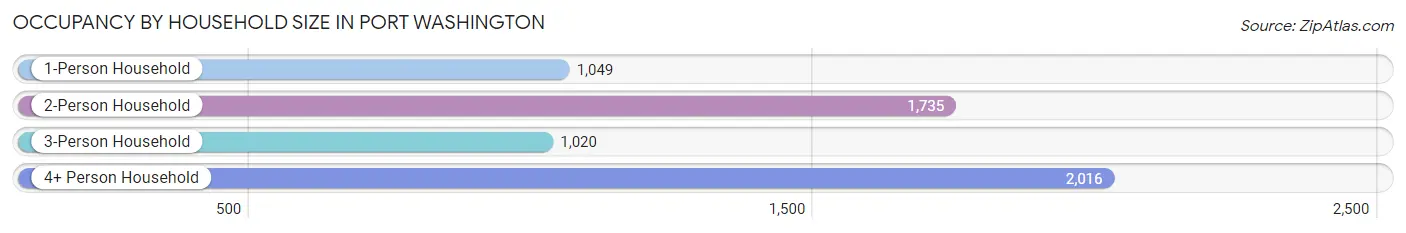
| Household Size | # Housing Units | % Housing Units |
| 1-Person Household | 1,049 | 18.0% |
| 2-Person Household | 1,735 | 29.8% |
| 3-Person Household | 1,020 | 17.5% |
| 4+ Person Household | 2,016 | 34.6% |
| Total Housing Units | 5,820 | 100.0% |
Occupancy by Ownership by Household Size in Port Washington
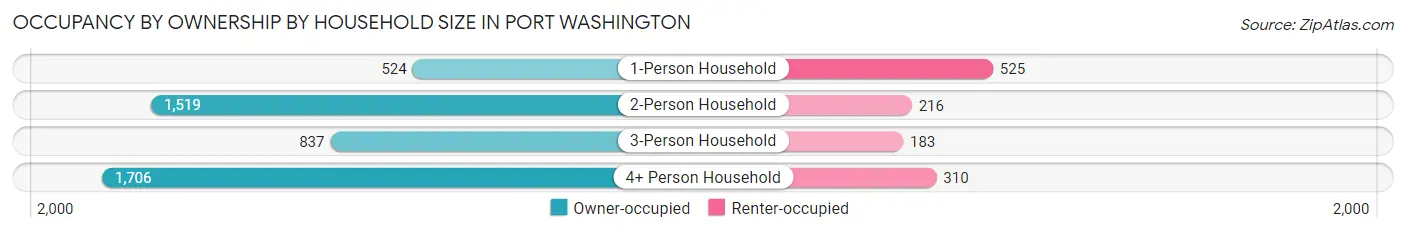
| Household Size | Owner-occupied | Renter-occupied |
| 1-Person Household | 524 (49.9%) | 525 (50.0%) |
| 2-Person Household | 1,519 (87.5%) | 216 (12.4%) |
| 3-Person Household | 837 (82.1%) | 183 (17.9%) |
| 4+ Person Household | 1,706 (84.6%) | 310 (15.4%) |
| Total Housing Units | 4,586 (78.8%) | 1,234 (21.2%) |
Occupancy by Educational Attainment in Port Washington
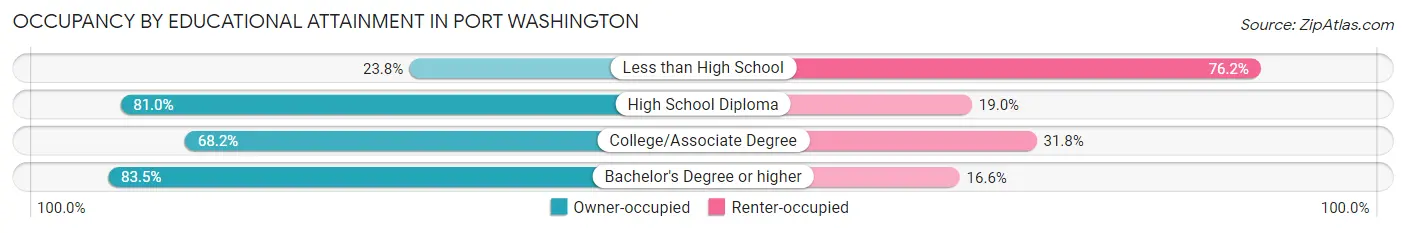
| Household Size | Owner-occupied | Renter-occupied |
| Less than High School | 58 (23.8%) | 186 (76.2%) |
| High School Diploma | 333 (81.0%) | 78 (19.0%) |
| College/Associate Degree | 515 (68.2%) | 240 (31.8%) |
| Bachelor's Degree or higher | 3,680 (83.5%) | 730 (16.6%) |
Occupancy by Age of Householder in Port Washington
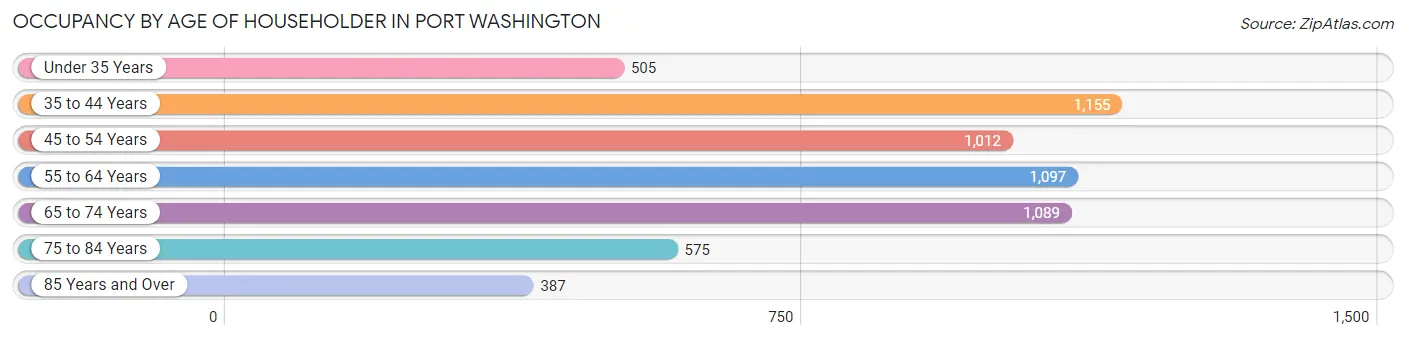
| Age Bracket | # Households | % Households |
| Under 35 Years | 505 | 8.7% |
| 35 to 44 Years | 1,155 | 19.9% |
| 45 to 54 Years | 1,012 | 17.4% |
| 55 to 64 Years | 1,097 | 18.9% |
| 65 to 74 Years | 1,089 | 18.7% |
| 75 to 84 Years | 575 | 9.9% |
| 85 Years and Over | 387 | 6.7% |
| Total | 5,820 | 100.0% |
Housing Finances in Port Washington
Median Income by Occupancy in Port Washington
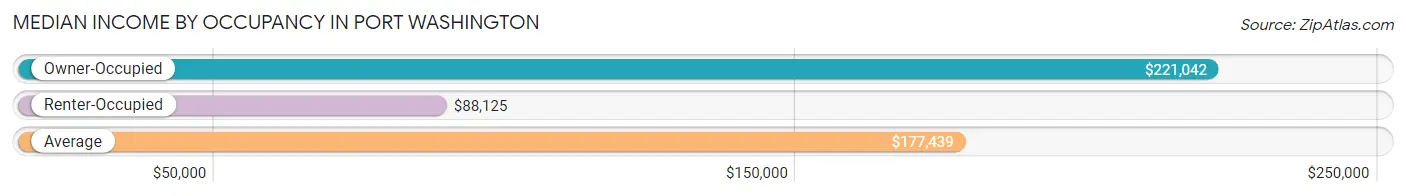
| Occupancy Type | # Households | Median Income |
| Owner-Occupied | 4,586 (78.8%) | $221,042 |
| Renter-Occupied | 1,234 (21.2%) | $88,125 |
| Average | 5,820 (100.0%) | $177,439 |
Occupancy by Householder Income Bracket in Port Washington
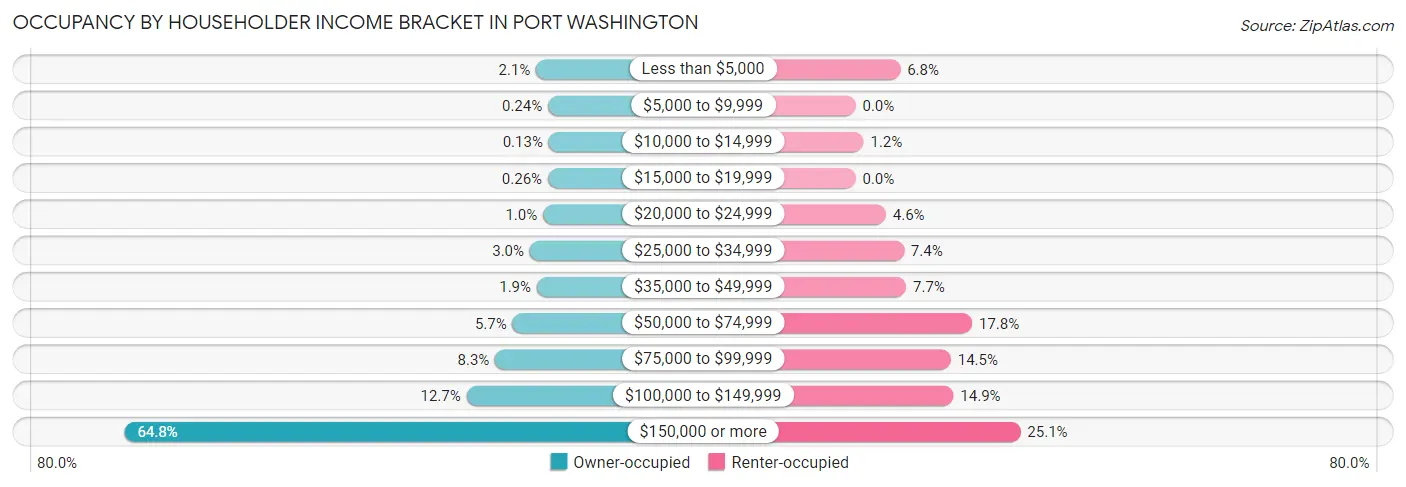
| Income Bracket | Owner-occupied | Renter-occupied |
| Less than $5,000 | 94 (2.1%) | 84 (6.8%) |
| $5,000 to $9,999 | 11 (0.2%) | 0 (0.0%) |
| $10,000 to $14,999 | 6 (0.1%) | 15 (1.2%) |
| $15,000 to $19,999 | 12 (0.3%) | 0 (0.0%) |
| $20,000 to $24,999 | 46 (1.0%) | 57 (4.6%) |
| $25,000 to $34,999 | 138 (3.0%) | 91 (7.4%) |
| $35,000 to $49,999 | 89 (1.9%) | 95 (7.7%) |
| $50,000 to $74,999 | 259 (5.7%) | 219 (17.7%) |
| $75,000 to $99,999 | 380 (8.3%) | 179 (14.5%) |
| $100,000 to $149,999 | 580 (12.7%) | 184 (14.9%) |
| $150,000 or more | 2,971 (64.8%) | 310 (25.1%) |
| Total | 4,586 (100.0%) | 1,234 (100.0%) |
Monthly Housing Cost Tiers in Port Washington
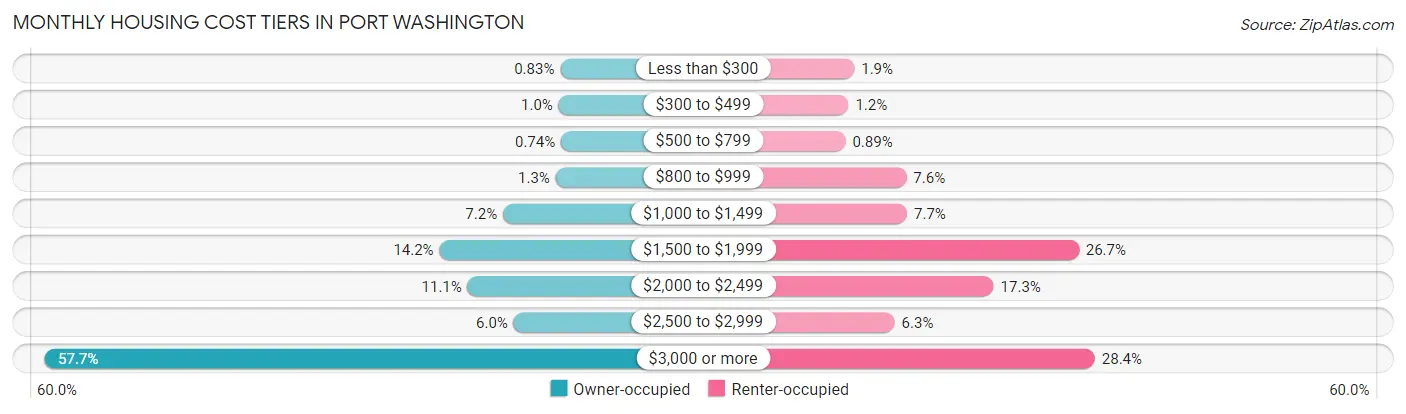
| Monthly Cost | Owner-occupied | Renter-occupied |
| Less than $300 | 38 (0.8%) | 23 (1.9%) |
| $300 to $499 | 46 (1.0%) | 15 (1.2%) |
| $500 to $799 | 34 (0.7%) | 11 (0.9%) |
| $800 to $999 | 61 (1.3%) | 94 (7.6%) |
| $1,000 to $1,499 | 328 (7.1%) | 95 (7.7%) |
| $1,500 to $1,999 | 650 (14.2%) | 329 (26.7%) |
| $2,000 to $2,499 | 507 (11.1%) | 213 (17.3%) |
| $2,500 to $2,999 | 274 (6.0%) | 78 (6.3%) |
| $3,000 or more | 2,648 (57.7%) | 351 (28.4%) |
| Total | 4,586 (100.0%) | 1,234 (100.0%) |
Physical Housing Characteristics in Port Washington
Housing Structures in Port Washington
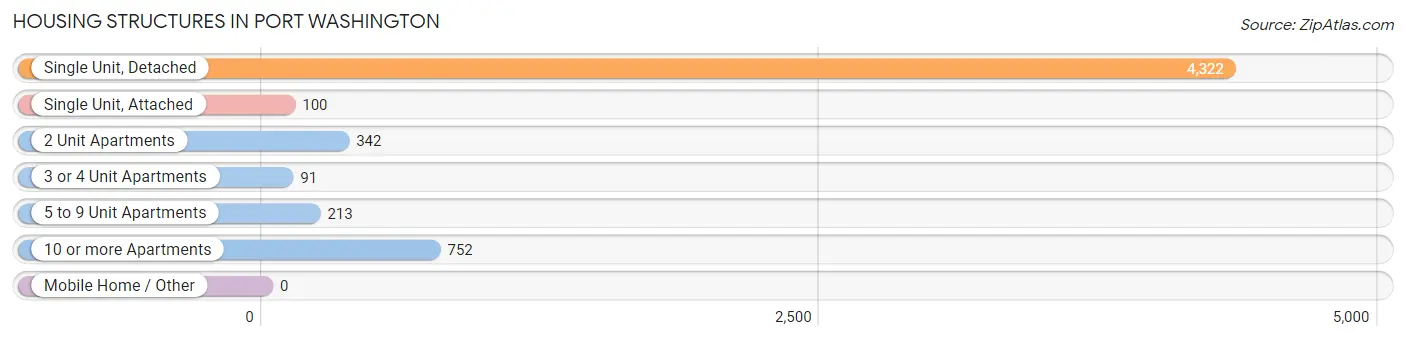
| Structure Type | # Housing Units | % Housing Units |
| Single Unit, Detached | 4,322 | 74.3% |
| Single Unit, Attached | 100 | 1.7% |
| 2 Unit Apartments | 342 | 5.9% |
| 3 or 4 Unit Apartments | 91 | 1.6% |
| 5 to 9 Unit Apartments | 213 | 3.7% |
| 10 or more Apartments | 752 | 12.9% |
| Mobile Home / Other | 0 | 0.0% |
| Total | 5,820 | 100.0% |
Housing Structures by Occupancy in Port Washington
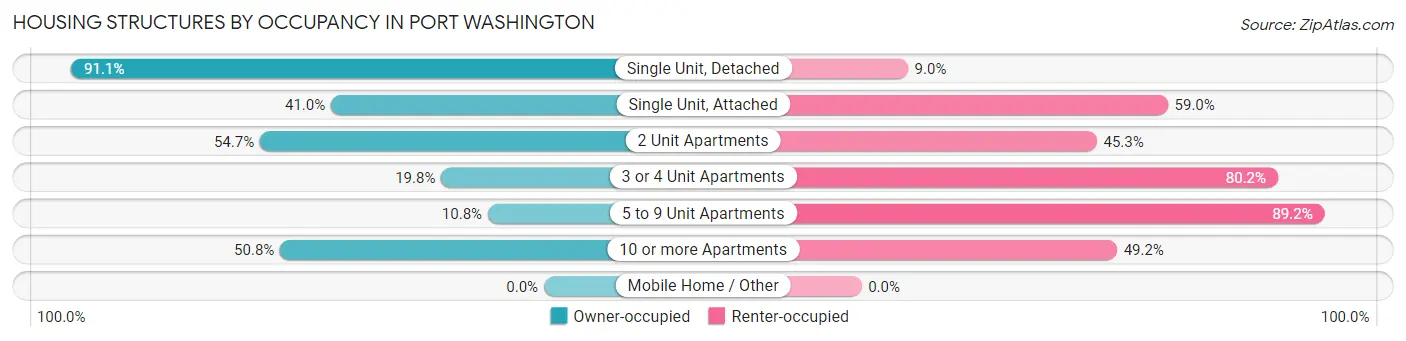
| Structure Type | Owner-occupied | Renter-occupied |
| Single Unit, Detached | 3,935 (91.0%) | 387 (8.9%) |
| Single Unit, Attached | 41 (41.0%) | 59 (59.0%) |
| 2 Unit Apartments | 187 (54.7%) | 155 (45.3%) |
| 3 or 4 Unit Apartments | 18 (19.8%) | 73 (80.2%) |
| 5 to 9 Unit Apartments | 23 (10.8%) | 190 (89.2%) |
| 10 or more Apartments | 382 (50.8%) | 370 (49.2%) |
| Mobile Home / Other | 0 (0.0%) | 0 (0.0%) |
| Total | 4,586 (78.8%) | 1,234 (21.2%) |
Housing Structures by Number of Rooms in Port Washington
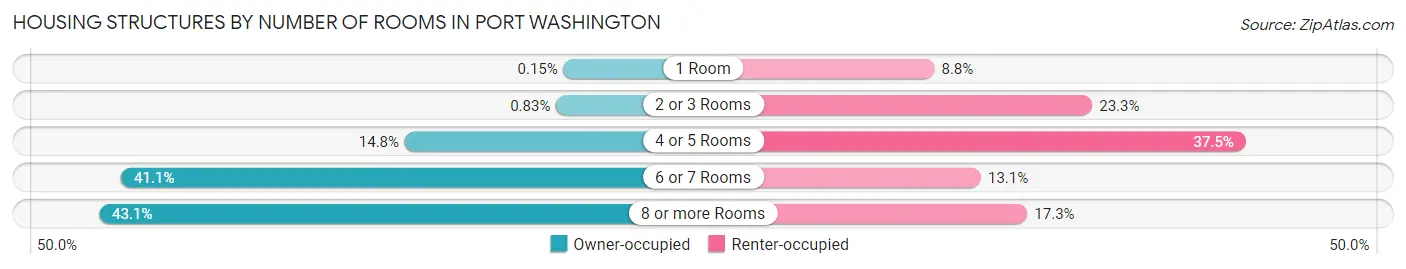
| Number of Rooms | Owner-occupied | Renter-occupied |
| 1 Room | 7 (0.2%) | 108 (8.7%) |
| 2 or 3 Rooms | 38 (0.8%) | 288 (23.3%) |
| 4 or 5 Rooms | 680 (14.8%) | 463 (37.5%) |
| 6 or 7 Rooms | 1,884 (41.1%) | 161 (13.1%) |
| 8 or more Rooms | 1,977 (43.1%) | 214 (17.3%) |
| Total | 4,586 (100.0%) | 1,234 (100.0%) |
Housing Structure by Heating Type in Port Washington
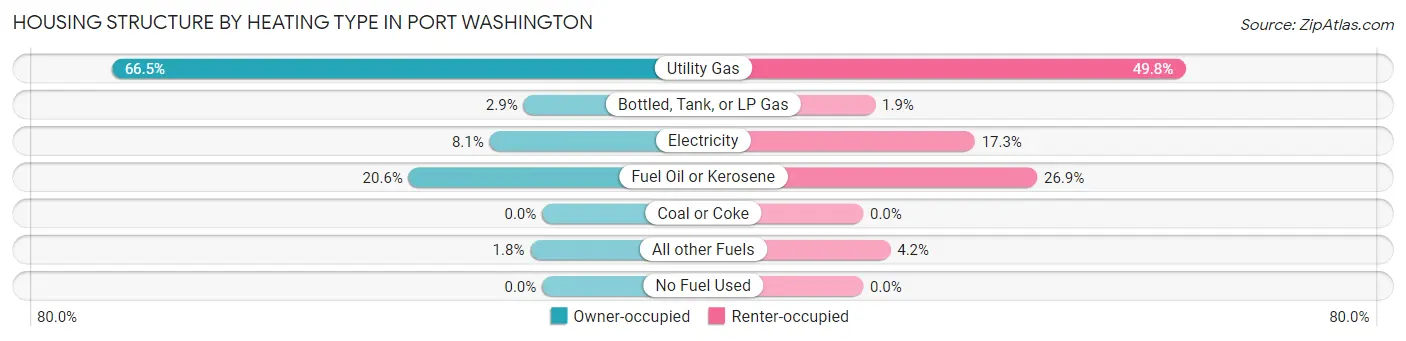
| Heating Type | Owner-occupied | Renter-occupied |
| Utility Gas | 3,051 (66.5%) | 614 (49.8%) |
| Bottled, Tank, or LP Gas | 132 (2.9%) | 23 (1.9%) |
| Electricity | 373 (8.1%) | 213 (17.3%) |
| Fuel Oil or Kerosene | 946 (20.6%) | 332 (26.9%) |
| Coal or Coke | 0 (0.0%) | 0 (0.0%) |
| All other Fuels | 84 (1.8%) | 52 (4.2%) |
| No Fuel Used | 0 (0.0%) | 0 (0.0%) |
| Total | 4,586 (100.0%) | 1,234 (100.0%) |
Household Vehicle Usage in Port Washington
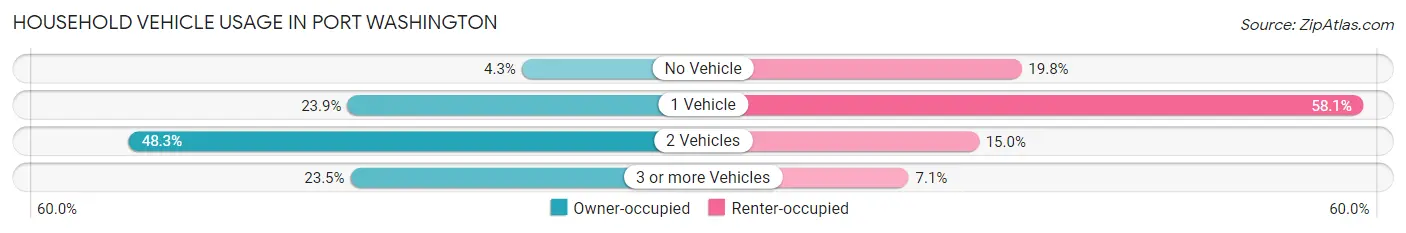
| Vehicles per Household | Owner-occupied | Renter-occupied |
| No Vehicle | 198 (4.3%) | 244 (19.8%) |
| 1 Vehicle | 1,094 (23.9%) | 717 (58.1%) |
| 2 Vehicles | 2,216 (48.3%) | 185 (15.0%) |
| 3 or more Vehicles | 1,078 (23.5%) | 88 (7.1%) |
| Total | 4,586 (100.0%) | 1,234 (100.0%) |
Real Estate & Mortgages in Port Washington
Real Estate and Mortgage Overview in Port Washington
| Characteristic | Without Mortgage | With Mortgage |
| Housing Units | 1,571 | 3,015 |
| Median Property Value | $920,200 | $955,900 |
| Median Household Income | $138,972 | $2,263 |
| Monthly Housing Costs | $1,501 | $2,512 |
| Real Estate Taxes | $10,001 | $82 |
Property Value by Mortgage Status in Port Washington
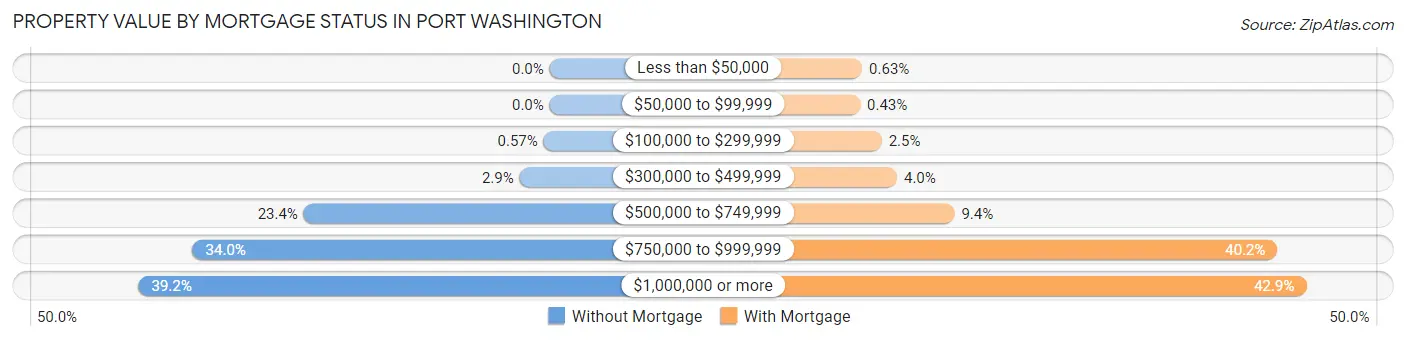
| Property Value | Without Mortgage | With Mortgage |
| Less than $50,000 | 0 (0.0%) | 19 (0.6%) |
| $50,000 to $99,999 | 0 (0.0%) | 13 (0.4%) |
| $100,000 to $299,999 | 9 (0.6%) | 75 (2.5%) |
| $300,000 to $499,999 | 45 (2.9%) | 119 (4.0%) |
| $500,000 to $749,999 | 368 (23.4%) | 284 (9.4%) |
| $750,000 to $999,999 | 534 (34.0%) | 1,211 (40.2%) |
| $1,000,000 or more | 615 (39.2%) | 1,294 (42.9%) |
| Total | 1,571 (100.0%) | 3,015 (100.0%) |
Household Income by Mortgage Status in Port Washington
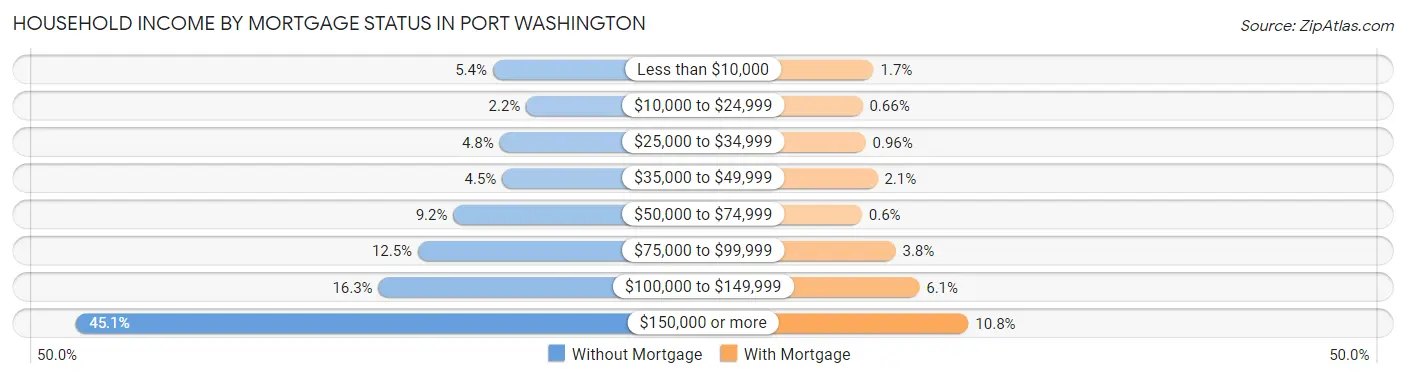
| Household Income | Without Mortgage | With Mortgage |
| Less than $10,000 | 85 (5.4%) | 52 (1.7%) |
| $10,000 to $24,999 | 35 (2.2%) | 20 (0.7%) |
| $25,000 to $34,999 | 75 (4.8%) | 29 (1.0%) |
| $35,000 to $49,999 | 71 (4.5%) | 63 (2.1%) |
| $50,000 to $74,999 | 144 (9.2%) | 18 (0.6%) |
| $75,000 to $99,999 | 197 (12.5%) | 115 (3.8%) |
| $100,000 to $149,999 | 256 (16.3%) | 183 (6.1%) |
| $150,000 or more | 708 (45.1%) | 324 (10.7%) |
| Total | 1,571 (100.0%) | 3,015 (100.0%) |
Property Value to Household Income Ratio in Port Washington
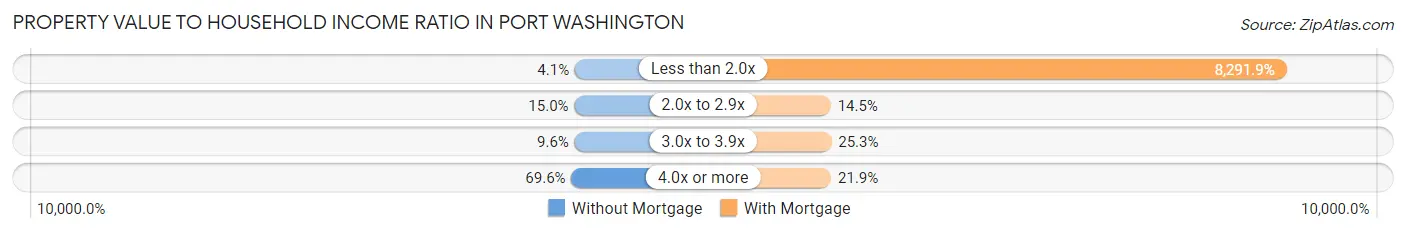
| Value-to-Income Ratio | Without Mortgage | With Mortgage |
| Less than 2.0x | 65 (4.1%) | 250,001 (8,291.9%) |
| 2.0x to 2.9x | 235 (15.0%) | 437 (14.5%) |
| 3.0x to 3.9x | 150 (9.6%) | 763 (25.3%) |
| 4.0x or more | 1,094 (69.6%) | 660 (21.9%) |
| Total | 1,571 (100.0%) | 3,015 (100.0%) |
Real Estate Taxes by Mortgage Status in Port Washington
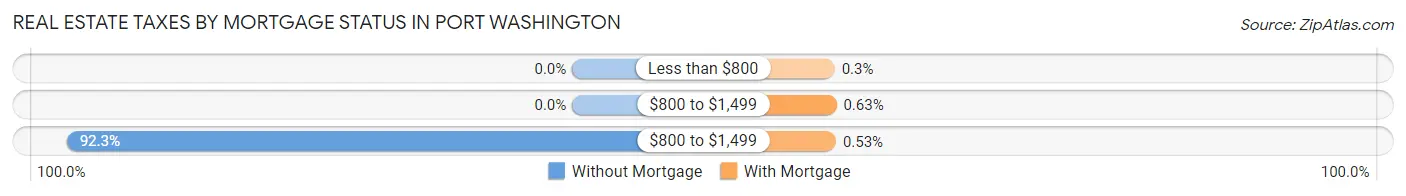
| Property Taxes | Without Mortgage | With Mortgage |
| Less than $800 | 0 (0.0%) | 9 (0.3%) |
| $800 to $1,499 | 0 (0.0%) | 19 (0.6%) |
| $800 to $1,499 | 1,450 (92.3%) | 16 (0.5%) |
| Total | 1,571 (100.0%) | 3,015 (100.0%) |
Health & Disability in Port Washington
Health Insurance Coverage by Age in Port Washington
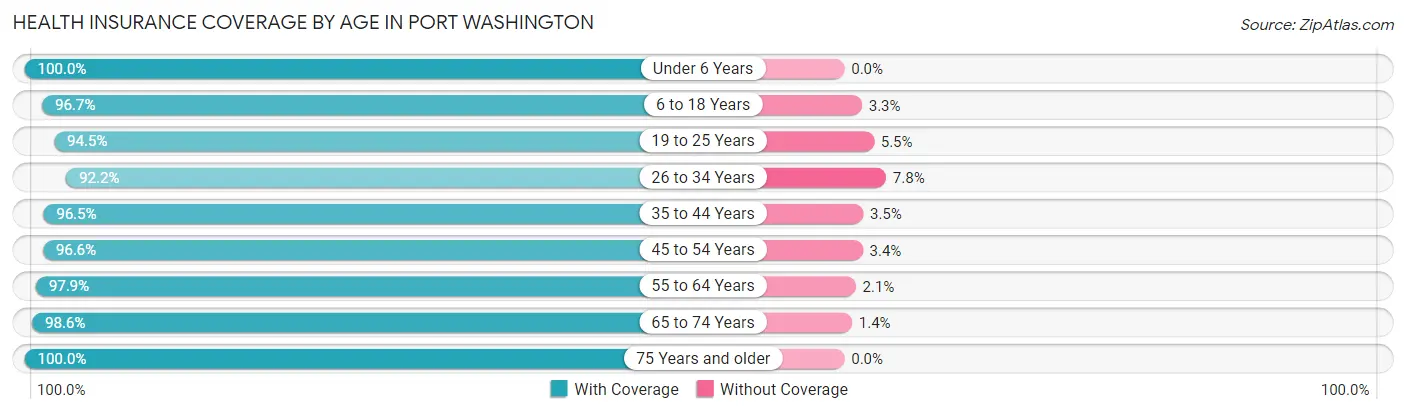
| Age Bracket | With Coverage | Without Coverage |
| Under 6 Years | 1,794 (100.0%) | 0 (0.0%) |
| 6 to 18 Years | 2,732 (96.7%) | 92 (3.3%) |
| 19 to 25 Years | 910 (94.5%) | 53 (5.5%) |
| 26 to 34 Years | 1,201 (92.2%) | 101 (7.8%) |
| 35 to 44 Years | 2,347 (96.5%) | 85 (3.5%) |
| 45 to 54 Years | 2,037 (96.6%) | 72 (3.4%) |
| 55 to 64 Years | 2,086 (97.9%) | 45 (2.1%) |
| 65 to 74 Years | 1,674 (98.6%) | 24 (1.4%) |
| 75 Years and older | 1,555 (100.0%) | 0 (0.0%) |
| Total | 16,336 (97.2%) | 472 (2.8%) |
Health Insurance Coverage by Citizenship Status in Port Washington
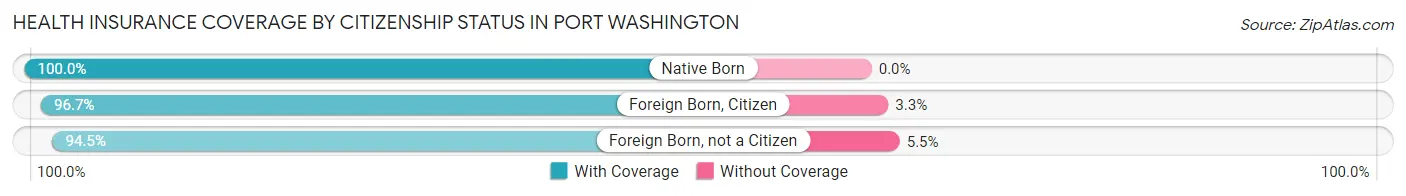
| Citizenship Status | With Coverage | Without Coverage |
| Native Born | 1,794 (100.0%) | 0 (0.0%) |
| Foreign Born, Citizen | 2,732 (96.7%) | 92 (3.3%) |
| Foreign Born, not a Citizen | 910 (94.5%) | 53 (5.5%) |
Health Insurance Coverage by Household Income in Port Washington
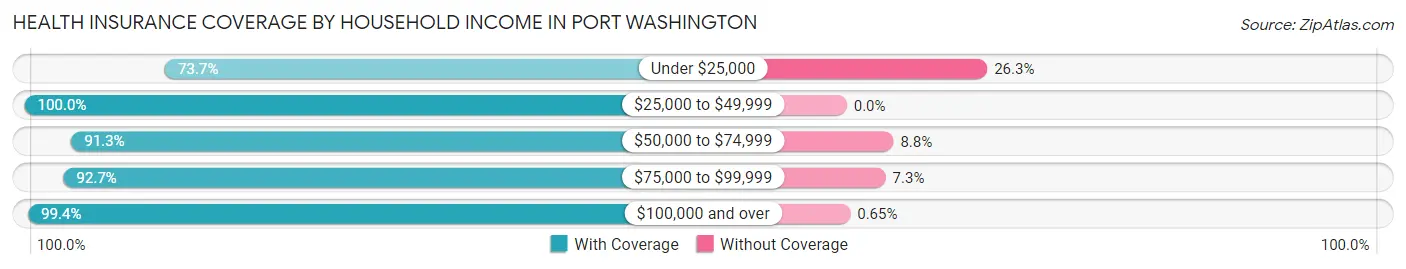
| Household Income | With Coverage | Without Coverage |
| Under $25,000 | 549 (73.7%) | 196 (26.3%) |
| $25,000 to $49,999 | 635 (100.0%) | 0 (0.0%) |
| $50,000 to $74,999 | 959 (91.2%) | 92 (8.7%) |
| $75,000 to $99,999 | 1,248 (92.7%) | 98 (7.3%) |
| $100,000 and over | 12,899 (99.4%) | 84 (0.6%) |
Public vs Private Health Insurance Coverage by Age in Port Washington
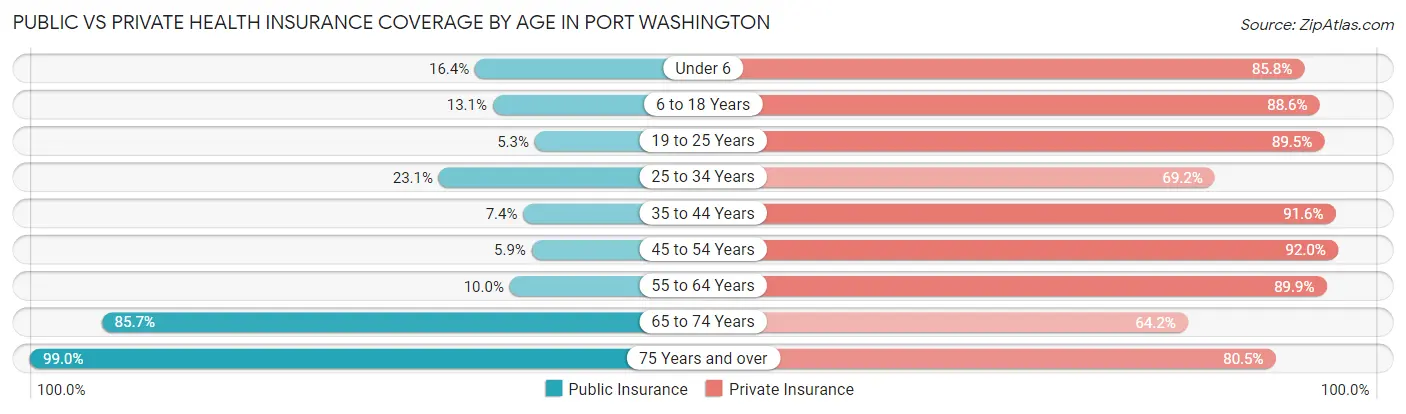
| Age Bracket | Public Insurance | Private Insurance |
| Under 6 | 294 (16.4%) | 1,539 (85.8%) |
| 6 to 18 Years | 370 (13.1%) | 2,503 (88.6%) |
| 19 to 25 Years | 51 (5.3%) | 862 (89.5%) |
| 25 to 34 Years | 301 (23.1%) | 901 (69.2%) |
| 35 to 44 Years | 181 (7.4%) | 2,228 (91.6%) |
| 45 to 54 Years | 124 (5.9%) | 1,941 (92.0%) |
| 55 to 64 Years | 212 (10.0%) | 1,916 (89.9%) |
| 65 to 74 Years | 1,455 (85.7%) | 1,090 (64.2%) |
| 75 Years and over | 1,539 (99.0%) | 1,251 (80.4%) |
| Total | 4,527 (26.9%) | 14,231 (84.7%) |
Disability Status by Sex by Age in Port Washington
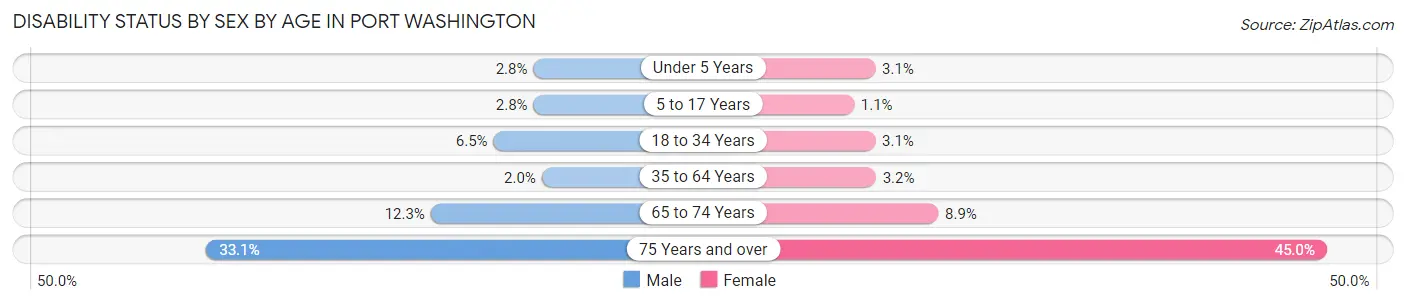
| Age Bracket | Male | Female |
| Under 5 Years | 20 (2.8%) | 19 (3.1%) |
| 5 to 17 Years | 52 (2.8%) | 15 (1.1%) |
| 18 to 34 Years | 87 (6.5%) | 31 (3.1%) |
| 35 to 64 Years | 64 (2.0%) | 110 (3.2%) |
| 65 to 74 Years | 103 (12.3%) | 77 (8.9%) |
| 75 Years and over | 220 (33.1%) | 401 (45.0%) |
Disability Class by Sex by Age in Port Washington
Disability Class: Hearing Difficulty
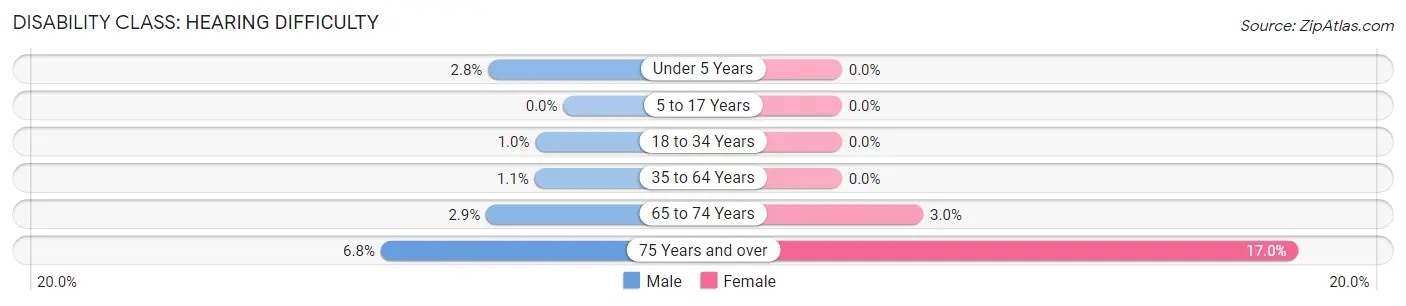
| Age Bracket | Male | Female |
| Under 5 Years | 20 (2.8%) | 0 (0.0%) |
| 5 to 17 Years | 0 (0.0%) | 0 (0.0%) |
| 18 to 34 Years | 14 (1.0%) | 0 (0.0%) |
| 35 to 64 Years | 34 (1.1%) | 0 (0.0%) |
| 65 to 74 Years | 24 (2.9%) | 26 (3.0%) |
| 75 Years and over | 45 (6.8%) | 151 (17.0%) |
Disability Class: Vision Difficulty
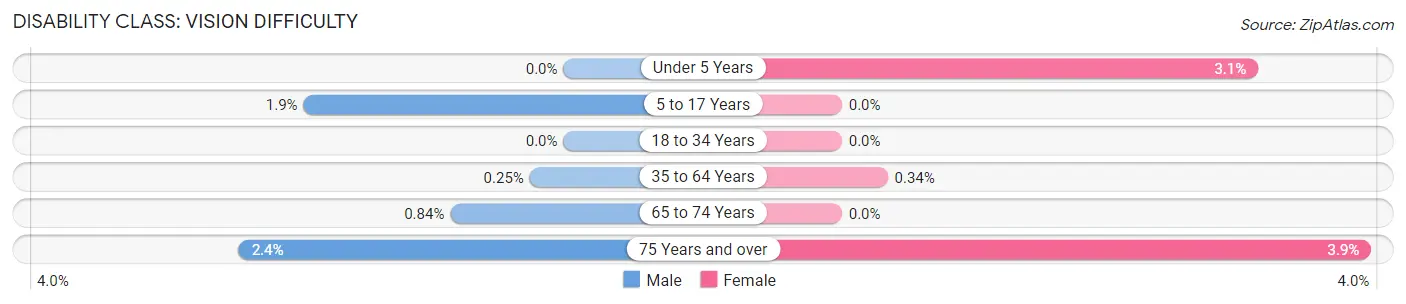
| Age Bracket | Male | Female |
| Under 5 Years | 0 (0.0%) | 19 (3.1%) |
| 5 to 17 Years | 36 (1.9%) | 0 (0.0%) |
| 18 to 34 Years | 0 (0.0%) | 0 (0.0%) |
| 35 to 64 Years | 8 (0.3%) | 12 (0.3%) |
| 65 to 74 Years | 7 (0.8%) | 0 (0.0%) |
| 75 Years and over | 16 (2.4%) | 35 (3.9%) |
Disability Class: Cognitive Difficulty
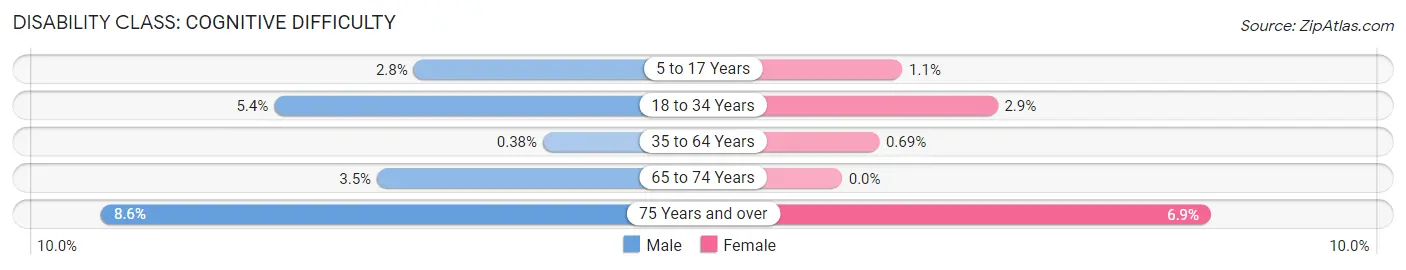
| Age Bracket | Male | Female |
| 5 to 17 Years | 52 (2.8%) | 15 (1.1%) |
| 18 to 34 Years | 72 (5.4%) | 29 (2.9%) |
| 35 to 64 Years | 12 (0.4%) | 24 (0.7%) |
| 65 to 74 Years | 29 (3.5%) | 0 (0.0%) |
| 75 Years and over | 57 (8.6%) | 61 (6.9%) |
Disability Class: Ambulatory Difficulty
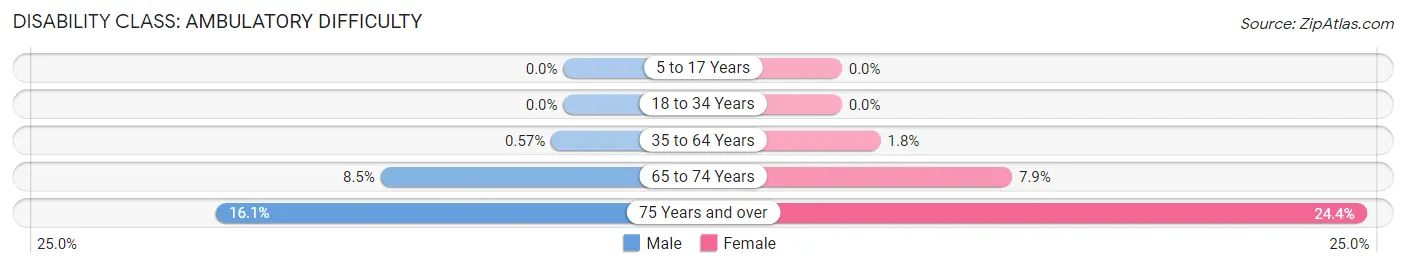
| Age Bracket | Male | Female |
| 5 to 17 Years | 0 (0.0%) | 0 (0.0%) |
| 18 to 34 Years | 0 (0.0%) | 0 (0.0%) |
| 35 to 64 Years | 18 (0.6%) | 63 (1.8%) |
| 65 to 74 Years | 71 (8.5%) | 68 (7.9%) |
| 75 Years and over | 107 (16.1%) | 217 (24.3%) |
Disability Class: Self-Care Difficulty
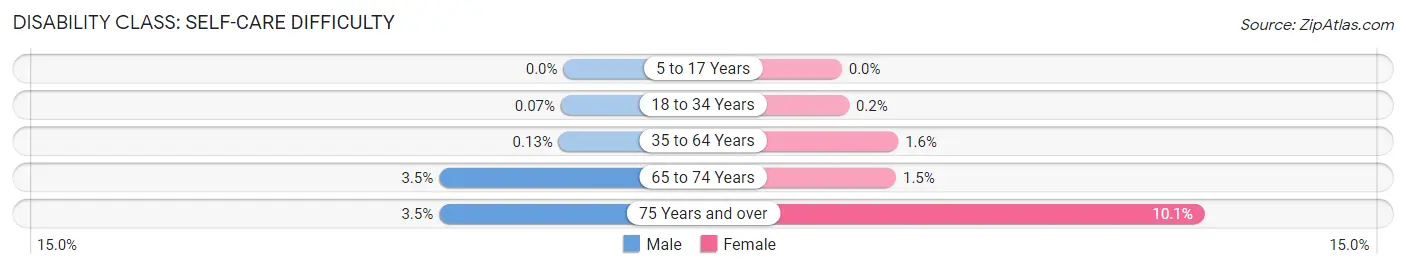
| Age Bracket | Male | Female |
| 5 to 17 Years | 0 (0.0%) | 0 (0.0%) |
| 18 to 34 Years | 1 (0.1%) | 2 (0.2%) |
| 35 to 64 Years | 4 (0.1%) | 55 (1.6%) |
| 65 to 74 Years | 29 (3.5%) | 13 (1.5%) |
| 75 Years and over | 23 (3.5%) | 90 (10.1%) |
Technology Access in Port Washington
Computing Device Access in Port Washington
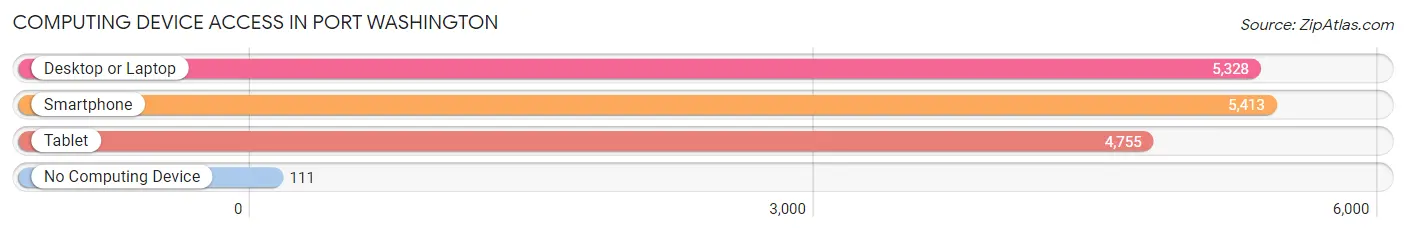
| Device Type | # Households | % Households |
| Desktop or Laptop | 5,328 | 91.5% |
| Smartphone | 5,413 | 93.0% |
| Tablet | 4,755 | 81.7% |
| No Computing Device | 111 | 1.9% |
| Total | 5,820 | 100.0% |
Internet Access in Port Washington
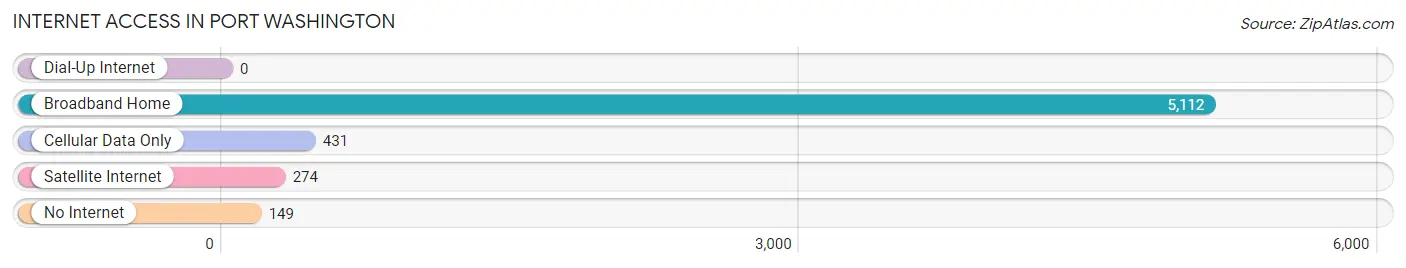
| Internet Type | # Households | % Households |
| Dial-Up Internet | 0 | 0.0% |
| Broadband Home | 5,112 | 87.8% |
| Cellular Data Only | 431 | 7.4% |
| Satellite Internet | 274 | 4.7% |
| No Internet | 149 | 2.6% |
| Total | 5,820 | 100.0% |
Port Washington Summary
Port Washington is a village located in Nassau County, New York, United States. It is located on the North Shore of Long Island, approximately 25 miles east of Manhattan. The village is part of the Town of North Hempstead and is located on Manhasset Bay. As of the 2010 census, the village had a population of 15,846.
History
The area that is now Port Washington was originally inhabited by the Matinecock Native American tribe. The first European settlers arrived in the area in 1643, when the Dutch West India Company purchased land from the Matinecock. The area was known as Cow Neck, and the first settlement was established in 1644. The area was renamed Port Washington in 1867, after the Revolutionary War hero General George Washington.
The village was incorporated in 1898, and the first mayor was elected in 1899. The village was a popular summer resort destination in the late 19th and early 20th centuries, and many of the homes and buildings from this period still stand today.
Geography
Port Washington is located at 40°49'N 73°41'W (40.817, -73.683). According to the United States Census Bureau, the village has a total area of 4.2 square miles (10.8 km2), of which 3.9 square miles (10.1 km2) is land and 0.3 square miles (0.7 km2) is water.
The village is located on Manhasset Bay, which is part of the Long Island Sound. The village is bordered by the Town of North Hempstead to the west, the Town of Oyster Bay to the east, and the City of Glen Cove to the south.
Economy
Port Washington is a residential community with a strong commercial base. The village is home to many small businesses, including restaurants, retail stores, and professional services. The village is also home to several large corporations, including Northwell Health, a healthcare provider, and Cablevision, a media and telecommunications company.
The village is also home to the Port Washington Business Improvement District, which works to promote economic development in the village. The district works to attract new businesses to the village, as well as to promote existing businesses.
Demographics
As of the 2010 census, there were 15,846 people, 5,945 households, and 4,072 families residing in the village. The population density was 4,068.3 people per square mile (1,569.2/km2). There were 6,093 housing units at an average density of 1,564.3 per square mile (604.2/km2). The racial makeup of the village was 79.2% White, 8.2% African American, 0.2% Native American, 7.3% Asian, 0.1% Pacific Islander, 2.3% from other races, and 2.7% from two or more races. Hispanic or Latino of any race were 8.7% of the population.
There were 5,945 households, out of which 33.2% had children under the age of 18 living with them, 54.2% were married couples living together, 10.7% had a female householder with no husband present, and 30.7% were non-families. 24.7% of all households were made up of individuals, and 10.2% had someone living alone who was 65 years of age or older. The average household size was 2.64 and the average family size was 3.17.
In the village, the population was spread out, with 24.2% under the age of 18, 6.2% from 18 to 24, 28.2% from 25 to 44, 25.2% from 45 to 64, and 16.2% who were 65 years of age or older. The median age was 39 years. For every 100 females, there were 91.2 males. For every 100 females age 18 and over, there were 87.3 males.
The median income for a household in the village was $76,945, and the median income for a family was $90,945. Males had a median income of $60,945 versus $41,945 for females. The per capita income for the village was $35,945. About 3.2% of families and 4.7% of the population were below the poverty line, including 5.2% of those under age 18 and 4.2% of those age 65 or over.
Common Questions
What is Per Capita Income in Port Washington?
Per Capita income in Port Washington is $85,046.
What is the Median Family Income in Port Washington?
Median Family Income in Port Washington is $216,635.
What is the Median Household income in Port Washington?
Median Household Income in Port Washington is $177,439.
What is Income or Wage Gap in Port Washington?
Income or Wage Gap in Port Washington is 30.3%.
Women in Port Washington earn 69.7 cents for every dollar earned by a man.
What is Family Income Deficit in Port Washington?
Family Income Deficit in Port Washington is $24,916.
Families that are below poverty line in Port Washington earn $24,916 less on average than the poverty threshold level.
What is Inequality or Gini Index in Port Washington?
Inequality or Gini Index in Port Washington is 0.47.
What is the Total Population of Port Washington?
Total Population of Port Washington is 17,015.
What is the Total Male Population of Port Washington?
Total Male Population of Port Washington is 8,667.
What is the Total Female Population of Port Washington?
Total Female Population of Port Washington is 8,348.
What is the Ratio of Males per 100 Females in Port Washington?
There are 103.82 Males per 100 Females in Port Washington.
What is the Ratio of Females per 100 Males in Port Washington?
There are 96.32 Females per 100 Males in Port Washington.
What is the Median Population Age in Port Washington?
Median Population Age in Port Washington is 41.4 Years.
What is the Average Family Size in Port Washington
Average Family Size in Port Washington is 3.3 People.
What is the Average Household Size in Port Washington
Average Household Size in Port Washington is 2.9 People.
How Large is the Labor Force in Port Washington?
There are 8,412 People in the Labor Forcein in Port Washington.
What is the Percentage of People in the Labor Force in Port Washington?
65.1% of People are in the Labor Force in Port Washington.
What is the Unemployment Rate in Port Washington?
Unemployment Rate in Port Washington is 3.1%.