Pelham Manor, NY Map & Demographics
Pelham Manor Map
Pelham Manor Overview
$128,831
PER CAPITA INCOME
$250,001
AVG FAMILY INCOME
$250,001
AVG HOUSEHOLD INCOME
42.1%
WAGE / INCOME GAP [ % ]
57.9¢/ $1
WAGE / INCOME GAP [ $ ]
0.46
INEQUALITY / GINI INDEX
5,682
TOTAL POPULATION
2,729
MALE POPULATION
2,953
FEMALE POPULATION
92.41
MALES / 100 FEMALES
108.21
FEMALES / 100 MALES
40.4
MEDIAN AGE
3.4
AVG FAMILY SIZE
2.9
AVG HOUSEHOLD SIZE
2,724
LABOR FORCE [ PEOPLE ]
65.3%
PERCENT IN LABOR FORCE
5.2%
UNEMPLOYMENT RATE
Income in Pelham Manor
Income Overview in Pelham Manor
Per Capita Income in Pelham Manor is $128,831, while median incomes of families and households are $250,001 and $250,001 respectively.
| Characteristic | Number | Measure |
| Per Capita Income | 5,682 | $128,831 |
| Median Family Income | 1,502 | $250,001 |
| Mean Family Income | 1,502 | $426,079 |
| Median Household Income | 1,977 | $250,001 |
| Mean Household Income | 1,977 | $363,968 |
| Income Deficit | 1,502 | $0 |
| Wage / Income Gap (%) | 5,682 | 42.09% |
| Wage / Income Gap ($) | 5,682 | 57.91¢ per $1 |
| Gini / Inequality Index | 5,682 | 0.46 |
Earnings by Sex in Pelham Manor
Average Earnings in Pelham Manor are $116,833, $158,750 for men and $91,929 for women, a difference of 42.1%.
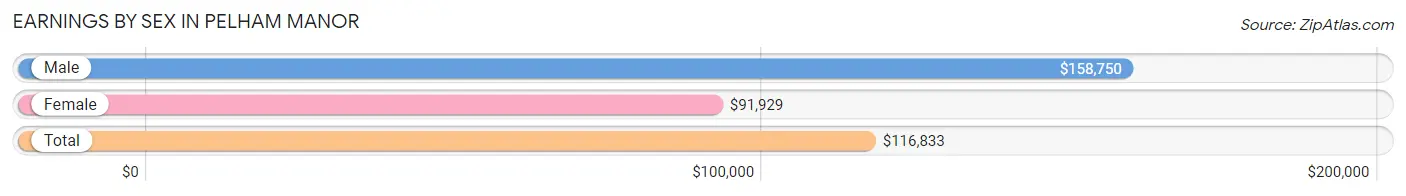
| Sex | Number | Average Earnings |
| Male | 1,367 (48.4%) | $158,750 |
| Female | 1,457 (51.6%) | $91,929 |
| Total | 2,824 (100.0%) | $116,833 |
Earnings by Sex by Income Bracket in Pelham Manor
The most common earnings brackets in Pelham Manor are $100,000+ for men (1,022 | 74.8%) and $100,000+ for women (646 | 44.3%).
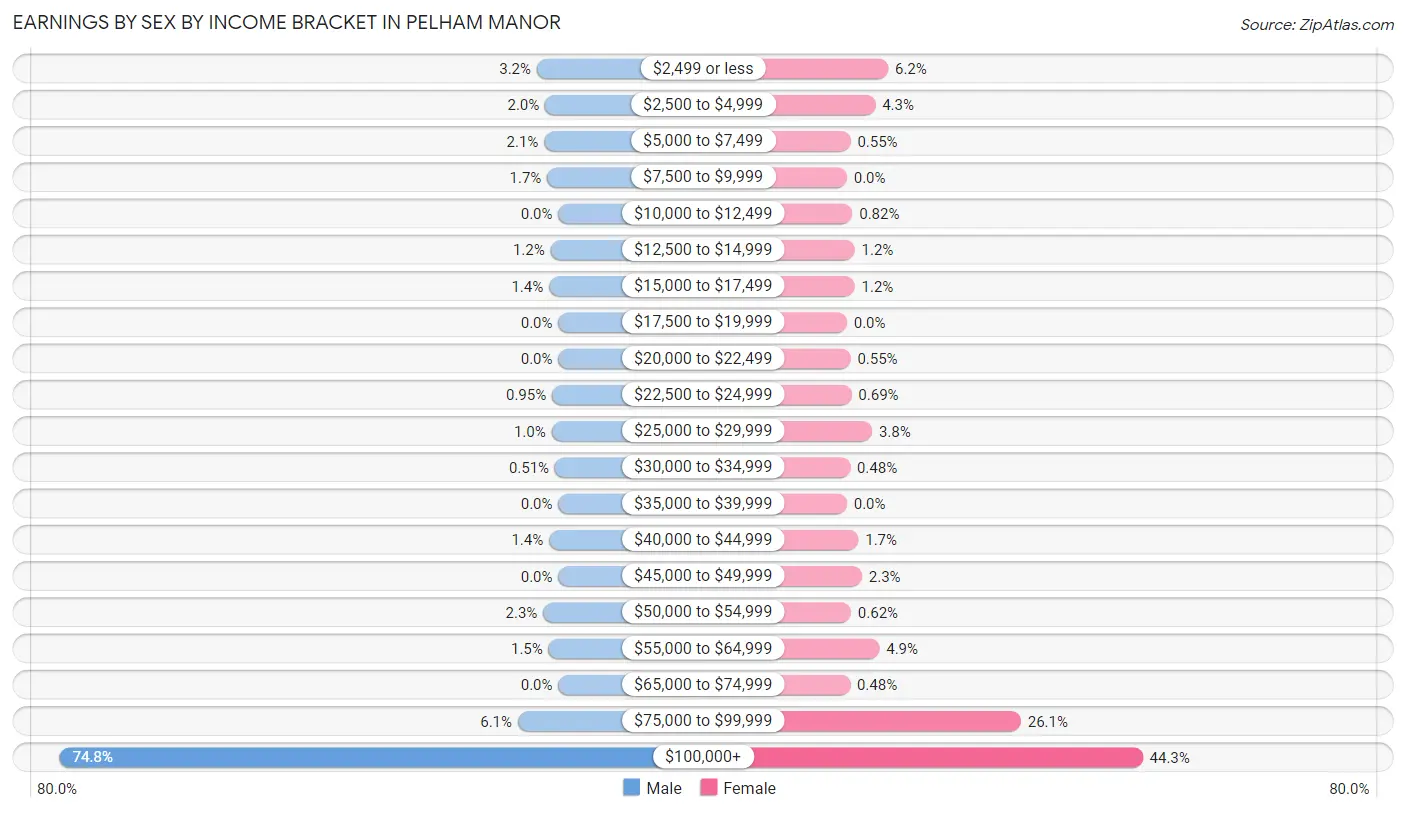
| Income | Male | Female |
| $2,499 or less | 44 (3.2%) | 90 (6.2%) |
| $2,500 to $4,999 | 27 (2.0%) | 62 (4.3%) |
| $5,000 to $7,499 | 29 (2.1%) | 8 (0.5%) |
| $7,500 to $9,999 | 23 (1.7%) | 0 (0.0%) |
| $10,000 to $12,499 | 0 (0.0%) | 12 (0.8%) |
| $12,500 to $14,999 | 16 (1.2%) | 17 (1.2%) |
| $15,000 to $17,499 | 19 (1.4%) | 17 (1.2%) |
| $17,500 to $19,999 | 0 (0.0%) | 0 (0.0%) |
| $20,000 to $22,499 | 0 (0.0%) | 8 (0.5%) |
| $22,500 to $24,999 | 13 (0.9%) | 10 (0.7%) |
| $25,000 to $29,999 | 14 (1.0%) | 55 (3.8%) |
| $30,000 to $34,999 | 7 (0.5%) | 7 (0.5%) |
| $35,000 to $39,999 | 0 (0.0%) | 0 (0.0%) |
| $40,000 to $44,999 | 19 (1.4%) | 25 (1.7%) |
| $45,000 to $49,999 | 0 (0.0%) | 33 (2.3%) |
| $50,000 to $54,999 | 31 (2.3%) | 9 (0.6%) |
| $55,000 to $64,999 | 20 (1.5%) | 71 (4.9%) |
| $65,000 to $74,999 | 0 (0.0%) | 7 (0.5%) |
| $75,000 to $99,999 | 83 (6.1%) | 380 (26.1%) |
| $100,000+ | 1,022 (74.8%) | 646 (44.3%) |
| Total | 1,367 (100.0%) | 1,457 (100.0%) |
Earnings by Sex by Educational Attainment in Pelham Manor
Average earnings in Pelham Manor are $172,023 for men and $100,347 for women, a difference of 41.7%. Men with an educational attainment of graduate degree enjoy the highest average annual earnings of $191,094, while those with bachelor's degree education earn the least with $158,287. Women with an educational attainment of graduate degree earn the most with the average annual earnings of $131,850, while those with high school diploma education have the smallest earnings of $16,563.
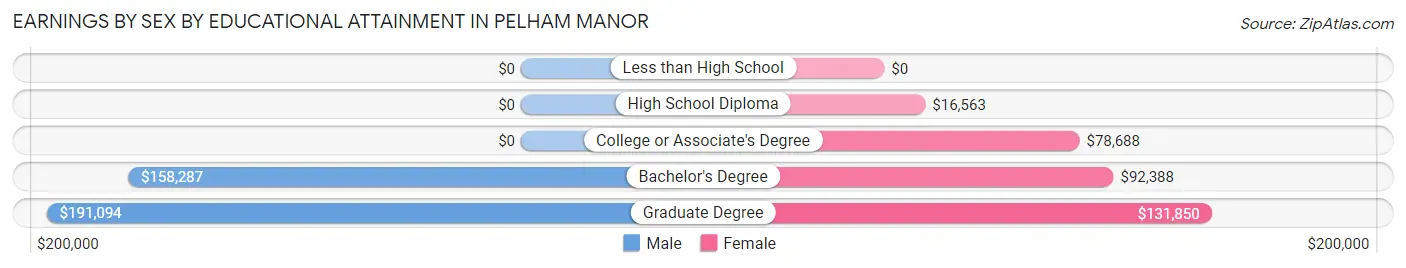
| Educational Attainment | Male Income | Female Income |
| Less than High School | - | - |
| High School Diploma | - | - |
| College or Associate's Degree | - | - |
| Bachelor's Degree | $158,287 | $92,388 |
| Graduate Degree | $191,094 | $131,850 |
| Total | $172,023 | $100,347 |
Family Income in Pelham Manor
Family Income Brackets in Pelham Manor
According to the Pelham Manor family income data, there are 1,120 families falling into the $200,000+ income range, which is the most common income bracket and makes up 74.6% of all families.
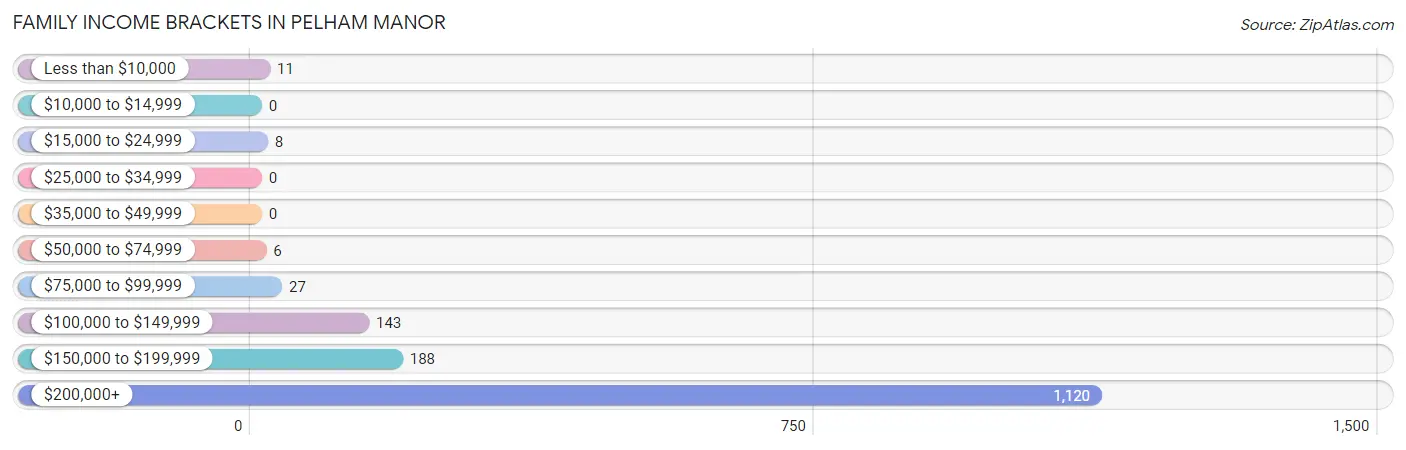
| Income Bracket | # Families | % Families |
| Less than $10,000 | 11 | 0.7% |
| $10,000 to $14,999 | 0 | 0.0% |
| $15,000 to $24,999 | 8 | 0.5% |
| $25,000 to $34,999 | 0 | 0.0% |
| $35,000 to $49,999 | 0 | 0.0% |
| $50,000 to $74,999 | 6 | 0.4% |
| $75,000 to $99,999 | 27 | 1.8% |
| $100,000 to $149,999 | 143 | 9.5% |
| $150,000 to $199,999 | 188 | 12.5% |
| $200,000+ | 1,120 | 74.6% |
Family Income by Famaliy Size in Pelham Manor
2-person families (563 | 37.5%) account for the highest median family income in Pelham Manor with $250,001 per family, while 2-person families (563 | 37.5%) have the highest median income of $125,000 per family member.
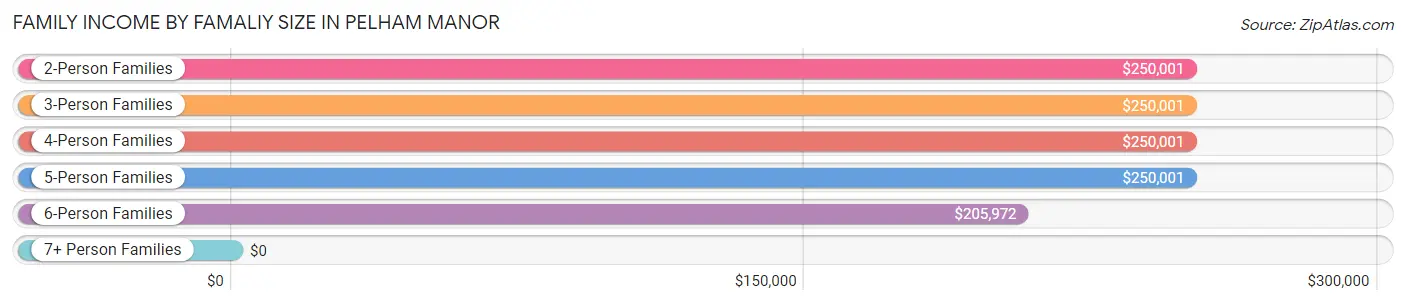
| Income Bracket | # Families | Median Income |
| 2-Person Families | 563 (37.5%) | $250,001 |
| 3-Person Families | 285 (19.0%) | $250,001 |
| 4-Person Families | 432 (28.8%) | $250,001 |
| 5-Person Families | 105 (7.0%) | $250,001 |
| 6-Person Families | 85 (5.7%) | $205,972 |
| 7+ Person Families | 32 (2.1%) | $0 |
| Total | 1,502 (100.0%) | $250,001 |
Family Income by Number of Earners in Pelham Manor
The median family income in Pelham Manor is $250,001, with families comprising 2 earners (773) having the highest median family income of $250,001, while families with no earners (133) have the lowest median family income of $119,226, accounting for 51.5% and 8.8% of families, respectively.
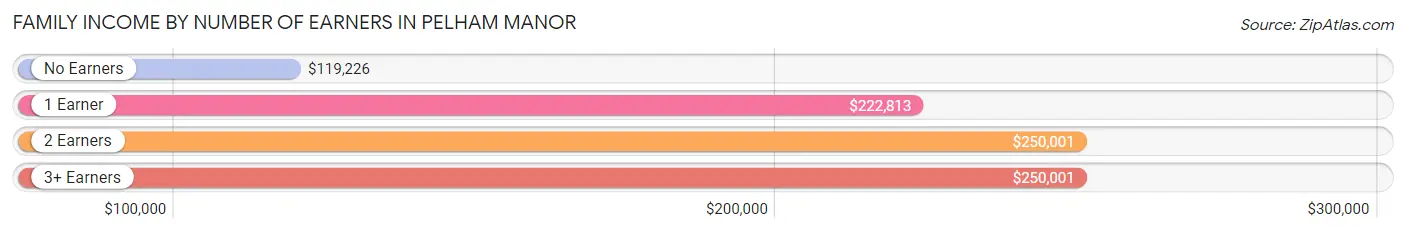
| Number of Earners | # Families | Median Income |
| No Earners | 133 (8.8%) | $119,226 |
| 1 Earner | 448 (29.8%) | $222,813 |
| 2 Earners | 773 (51.5%) | $250,001 |
| 3+ Earners | 148 (9.9%) | $250,001 |
| Total | 1,502 (100.0%) | $250,001 |
Household Income in Pelham Manor
Household Income Brackets in Pelham Manor
With 1,230 households falling in the category, the $200,000+ income range is the most frequent in Pelham Manor, accounting for 62.2% of all households.
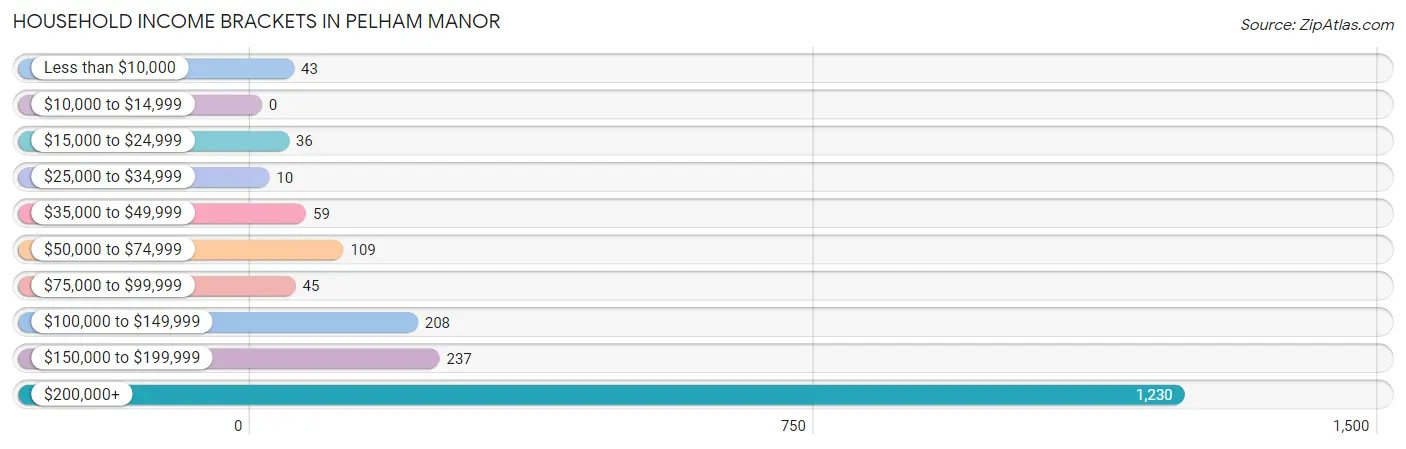
| Income Bracket | # Households | % Households |
| Less than $10,000 | 43 | 2.2% |
| $10,000 to $14,999 | 0 | 0.0% |
| $15,000 to $24,999 | 36 | 1.8% |
| $25,000 to $34,999 | 10 | 0.5% |
| $35,000 to $49,999 | 59 | 3.0% |
| $50,000 to $74,999 | 109 | 5.5% |
| $75,000 to $99,999 | 45 | 2.3% |
| $100,000 to $149,999 | 208 | 10.5% |
| $150,000 to $199,999 | 237 | 12.0% |
| $200,000+ | 1,230 | 62.2% |
Household Income by Householder Age in Pelham Manor
The median household income in Pelham Manor is $250,001, with the highest median household income of $250,001 found in the 25 to 44 years age bracket for the primary householder. A total of 496 households (25.1%) fall into this category.
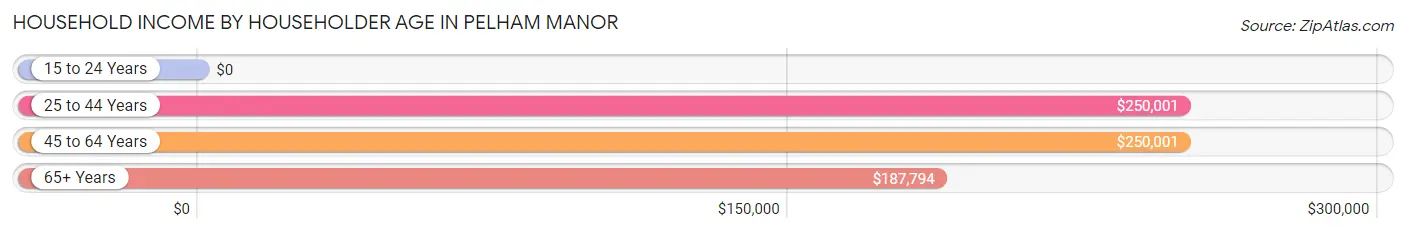
| Income Bracket | # Households | Median Income |
| 15 to 24 Years | 0 (0.0%) | $0 |
| 25 to 44 Years | 496 (25.1%) | $250,001 |
| 45 to 64 Years | 901 (45.6%) | $250,001 |
| 65+ Years | 580 (29.3%) | $187,794 |
| Total | 1,977 (100.0%) | $250,001 |
Poverty in Pelham Manor
Income Below Poverty by Sex and Age in Pelham Manor
With 1.9% poverty level for males and 1.3% for females among the residents of Pelham Manor, 35 to 44 year old males and 75 year old and over females are the most vulnerable to poverty, with 34 males (8.6%) and 21 females (8.6%) in their respective age groups living below the poverty level.
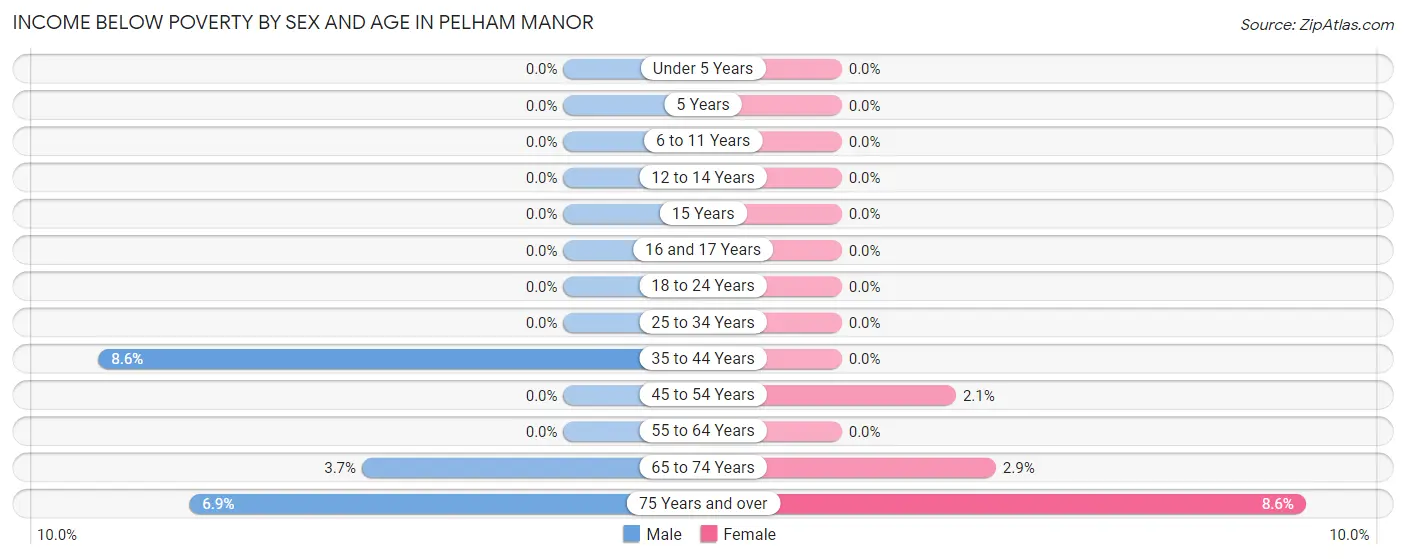
| Age Bracket | Male | Female |
| Under 5 Years | 0 (0.0%) | 0 (0.0%) |
| 5 Years | 0 (0.0%) | 0 (0.0%) |
| 6 to 11 Years | 0 (0.0%) | 0 (0.0%) |
| 12 to 14 Years | 0 (0.0%) | 0 (0.0%) |
| 15 Years | 0 (0.0%) | 0 (0.0%) |
| 16 and 17 Years | 0 (0.0%) | 0 (0.0%) |
| 18 to 24 Years | 0 (0.0%) | 0 (0.0%) |
| 25 to 34 Years | 0 (0.0%) | 0 (0.0%) |
| 35 to 44 Years | 34 (8.6%) | 0 (0.0%) |
| 45 to 54 Years | 0 (0.0%) | 8 (2.1%) |
| 55 to 64 Years | 0 (0.0%) | 0 (0.0%) |
| 65 to 74 Years | 8 (3.7%) | 8 (2.9%) |
| 75 Years and over | 10 (6.9%) | 21 (8.6%) |
| Total | 52 (1.9%) | 37 (1.3%) |
Income Above Poverty by Sex and Age in Pelham Manor
According to the poverty statistics in Pelham Manor, males aged under 5 years and females aged under 5 years are the age groups that are most secure financially, with 100.0% of males and 100.0% of females in these age groups living above the poverty line.
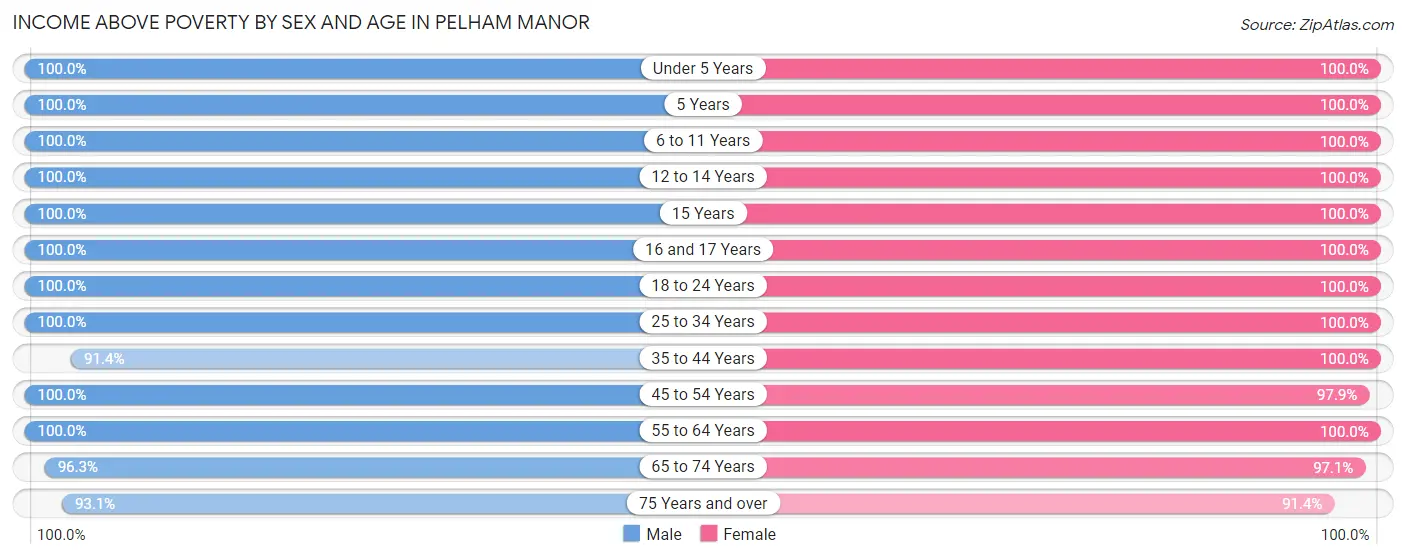
| Age Bracket | Male | Female |
| Under 5 Years | 90 (100.0%) | 141 (100.0%) |
| 5 Years | 69 (100.0%) | 22 (100.0%) |
| 6 to 11 Years | 444 (100.0%) | 324 (100.0%) |
| 12 to 14 Years | 203 (100.0%) | 98 (100.0%) |
| 15 Years | 62 (100.0%) | 57 (100.0%) |
| 16 and 17 Years | 47 (100.0%) | 112 (100.0%) |
| 18 to 24 Years | 149 (100.0%) | 199 (100.0%) |
| 25 to 34 Years | 166 (100.0%) | 190 (100.0%) |
| 35 to 44 Years | 360 (91.4%) | 511 (100.0%) |
| 45 to 54 Years | 415 (100.0%) | 370 (97.9%) |
| 55 to 64 Years | 332 (100.0%) | 397 (100.0%) |
| 65 to 74 Years | 206 (96.3%) | 272 (97.1%) |
| 75 Years and over | 134 (93.1%) | 223 (91.4%) |
| Total | 2,677 (98.1%) | 2,916 (98.8%) |
Income Below Poverty Among Married-Couple Families in Pelham Manor
The poverty statistics for married-couple families in Pelham Manor show that 1.3% or 18 of the total 1,331 families live below the poverty line. Families with no children have the highest poverty rate of 2.8%, comprising of 18 families. On the other hand, families with 1 or 2 children have the lowest poverty rate of 0.0%, which includes 0 families.
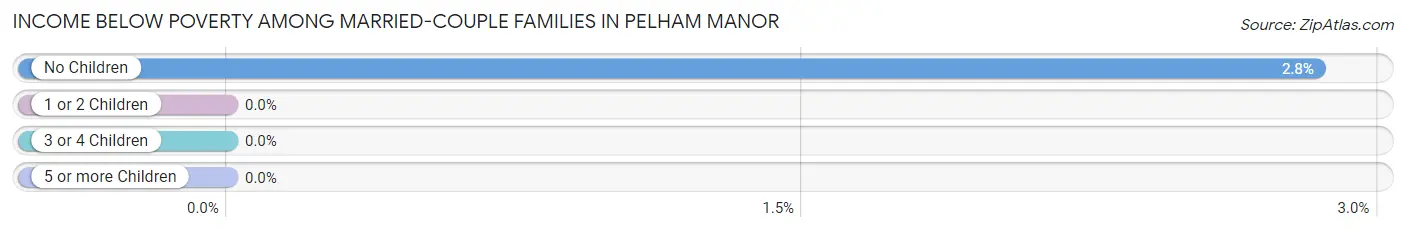
| Children | Above Poverty | Below Poverty |
| No Children | 615 (97.2%) | 18 (2.8%) |
| 1 or 2 Children | 523 (100.0%) | 0 (0.0%) |
| 3 or 4 Children | 143 (100.0%) | 0 (0.0%) |
| 5 or more Children | 32 (100.0%) | 0 (0.0%) |
| Total | 1,313 (98.7%) | 18 (1.3%) |
Income Below Poverty Among Single-Parent Households in Pelham Manor
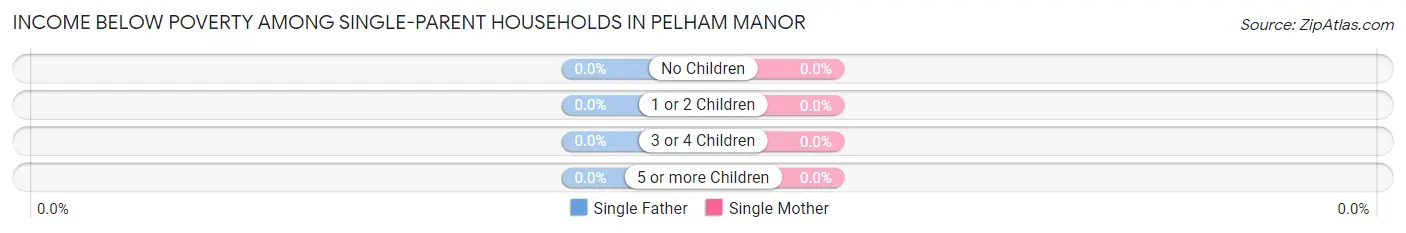
| Children | Single Father | Single Mother |
| No Children | 0 (0.0%) | 0 (0.0%) |
| 1 or 2 Children | 0 (0.0%) | 0 (0.0%) |
| 3 or 4 Children | 0 (0.0%) | 0 (0.0%) |
| 5 or more Children | 0 (0.0%) | 0 (0.0%) |
| Total | 0 (0.0%) | 0 (0.0%) |
Income Below Poverty Among Married-Couple vs Single-Parent Households in Pelham Manor
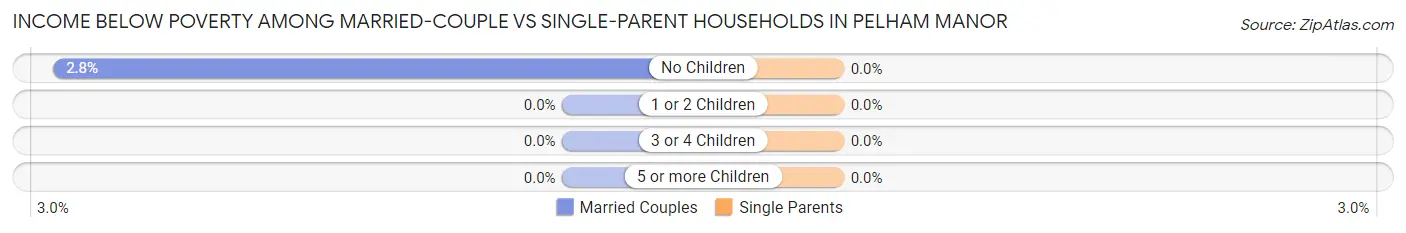
| Children | Married-Couple Families | Single-Parent Households |
| No Children | 18 (2.8%) | 0 (0.0%) |
| 1 or 2 Children | 0 (0.0%) | 0 (0.0%) |
| 3 or 4 Children | 0 (0.0%) | 0 (0.0%) |
| 5 or more Children | 0 (0.0%) | 0 (0.0%) |
| Total | 18 (1.3%) | 0 (0.0%) |
Race in Pelham Manor
The most populous races in Pelham Manor are White / Caucasian (4,486 | 78.9%), Hispanic or Latino (446 | 7.9%), and Black / African American (393 | 6.9%).
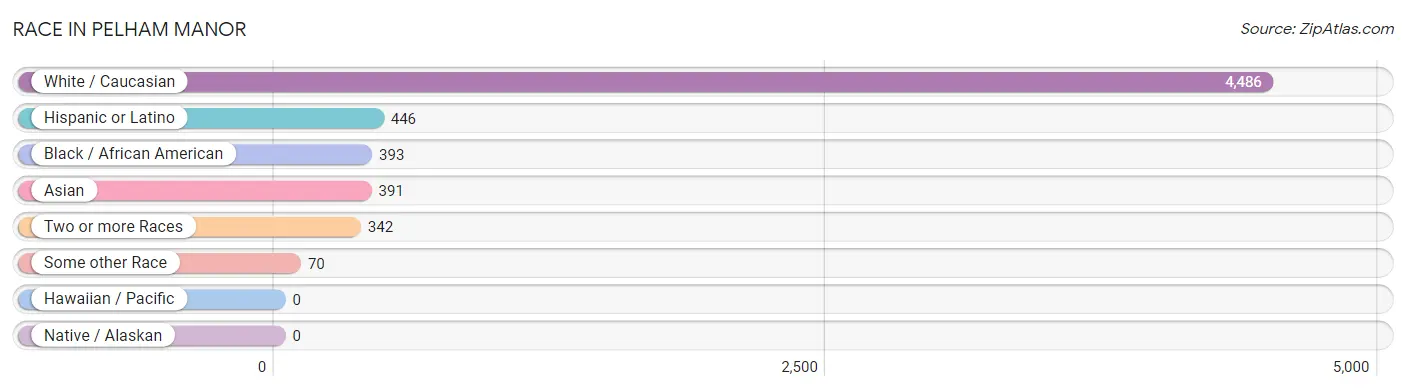
| Race | # Population | % Population |
| Asian | 391 | 6.9% |
| Black / African American | 393 | 6.9% |
| Hawaiian / Pacific | 0 | 0.0% |
| Hispanic or Latino | 446 | 7.9% |
| Native / Alaskan | 0 | 0.0% |
| White / Caucasian | 4,486 | 78.9% |
| Two or more Races | 342 | 6.0% |
| Some other Race | 70 | 1.2% |
| Total | 5,682 | 100.0% |
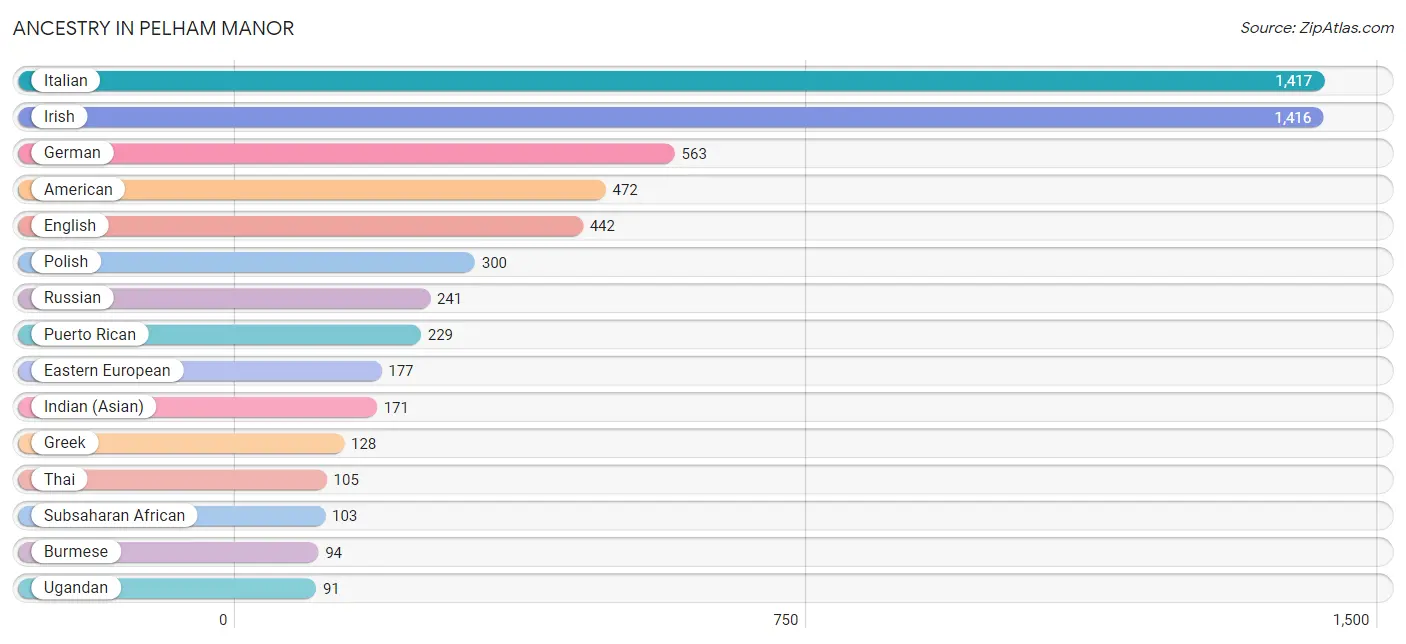
Ancestry in Pelham Manor
The most populous ancestries reported in Pelham Manor are Italian (1,417 | 24.9%), Irish (1,416 | 24.9%), German (563 | 9.9%), American (472 | 8.3%), and English (442 | 7.8%), together accounting for 75.9% of all Pelham Manor residents.
| Ancestry | # Population | % Population |
| African | 12 | 0.2% |
| American | 472 | 8.3% |
| Arab | 51 | 0.9% |
| Austrian | 32 | 0.6% |
| Barbadian | 3 | 0.1% |
| Basque | 6 | 0.1% |
| British | 6 | 0.1% |
| Burmese | 94 | 1.7% |
| Cajun | 11 | 0.2% |
| Canadian | 13 | 0.2% |
| Central American Indian | 12 | 0.2% |
| Croatian | 32 | 0.6% |
| Czech | 7 | 0.1% |
| Czechoslovakian | 7 | 0.1% |
| Dominican | 62 | 1.1% |
| Dutch | 49 | 0.9% |
| Eastern European | 177 | 3.1% |
| Ecuadorian | 12 | 0.2% |
| Egyptian | 41 | 0.7% |
| English | 442 | 7.8% |
| European | 15 | 0.3% |
| Finnish | 24 | 0.4% |
| French | 73 | 1.3% |
| French Canadian | 8 | 0.1% |
| German | 563 | 9.9% |
| Greek | 128 | 2.2% |
| Hungarian | 7 | 0.1% |
| Indian (Asian) | 171 | 3.0% |
| Indonesian | 7 | 0.1% |
| Irish | 1,416 | 24.9% |
| Italian | 1,417 | 24.9% |
| Jamaican | 12 | 0.2% |
| Korean | 89 | 1.6% |
| Lithuanian | 27 | 0.5% |
| Mexican | 88 | 1.5% |
| Northern European | 19 | 0.3% |
| Norwegian | 24 | 0.4% |
| Okinawan | 5 | 0.1% |
| Polish | 300 | 5.3% |
| Puerto Rican | 229 | 4.0% |
| Romanian | 38 | 0.7% |
| Russian | 241 | 4.2% |
| Scotch-Irish | 8 | 0.1% |
| Scottish | 62 | 1.1% |
| Serbian | 50 | 0.9% |
| Slovak | 9 | 0.2% |
| South American | 12 | 0.2% |
| Sri Lankan | 62 | 1.1% |
| Subsaharan African | 103 | 1.8% |
| Swedish | 34 | 0.6% |
| Swiss | 15 | 0.3% |
| Thai | 105 | 1.8% |
| Trinidadian and Tobagonian | 26 | 0.5% |
| Turkish | 9 | 0.2% |
| Ugandan | 91 | 1.6% |
| Ukrainian | 27 | 0.5% |
| Welsh | 27 | 0.5% |
| Yugoslavian | 10 | 0.2% | View All 58 Rows |
Immigrants in Pelham Manor
The most numerous immigrant groups reported in Pelham Manor came from Asia (315 | 5.5%), Europe (267 | 4.7%), Africa (240 | 4.2%), Nigeria (139 | 2.5%), and Western Africa (139 | 2.5%), together accounting for 19.4% of all Pelham Manor residents.
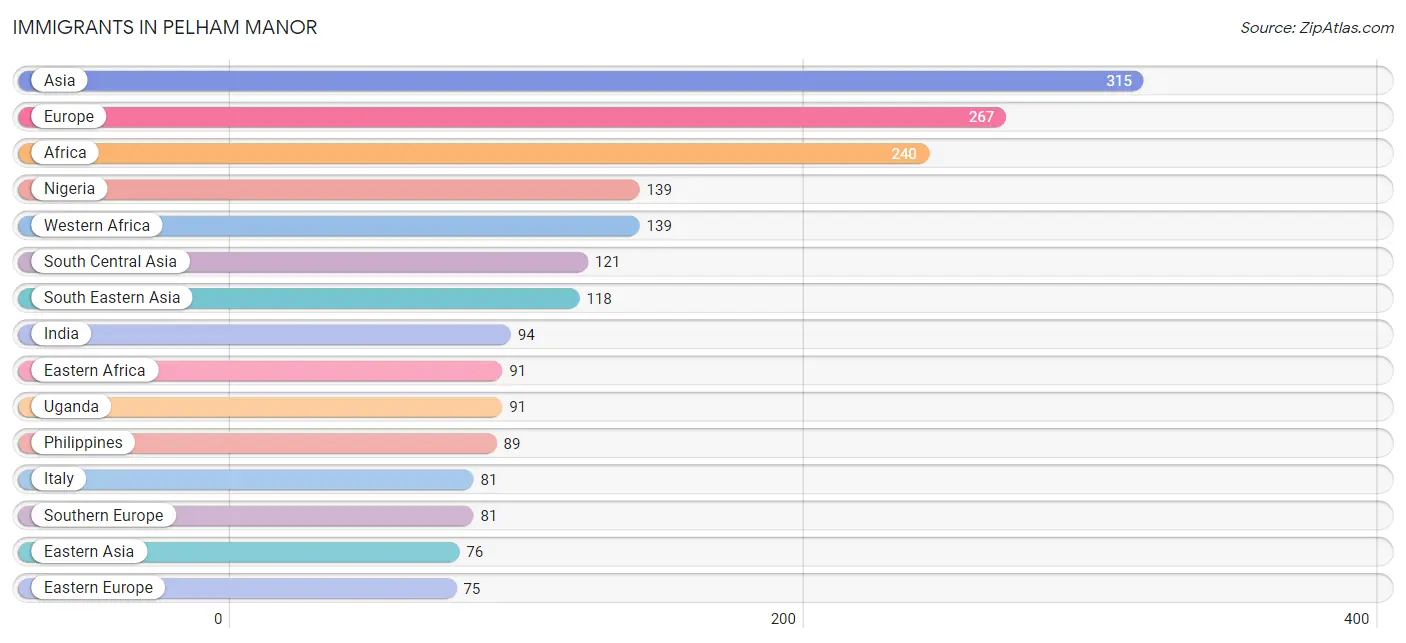
| Immigration Origin | # Population | % Population |
| Africa | 240 | 4.2% |
| Asia | 315 | 5.5% |
| Austria | 8 | 0.1% |
| Bosnia and Herzegovina | 10 | 0.2% |
| Canada | 42 | 0.7% |
| Caribbean | 37 | 0.6% |
| China | 62 | 1.1% |
| Dominican Republic | 15 | 0.3% |
| Eastern Africa | 91 | 1.6% |
| Eastern Asia | 76 | 1.3% |
| Eastern Europe | 75 | 1.3% |
| Ecuador | 12 | 0.2% |
| Europe | 267 | 4.7% |
| France | 10 | 0.2% |
| Germany | 32 | 0.6% |
| Hong Kong | 7 | 0.1% |
| India | 94 | 1.7% |
| Ireland | 41 | 0.7% |
| Italy | 81 | 1.4% |
| Jamaica | 12 | 0.2% |
| Korea | 14 | 0.3% |
| Latin America | 49 | 0.9% |
| Morocco | 10 | 0.2% |
| Nepal | 12 | 0.2% |
| Nigeria | 139 | 2.5% |
| Northern Africa | 10 | 0.2% |
| Northern Europe | 61 | 1.1% |
| Pakistan | 15 | 0.3% |
| Philippines | 89 | 1.6% |
| Poland | 29 | 0.5% |
| Romania | 20 | 0.4% |
| Russia | 6 | 0.1% |
| Scotland | 20 | 0.4% |
| Serbia | 10 | 0.2% |
| Singapore | 5 | 0.1% |
| South America | 12 | 0.2% |
| South Central Asia | 121 | 2.1% |
| South Eastern Asia | 118 | 2.1% |
| Southern Europe | 81 | 1.4% |
| Trinidad and Tobago | 10 | 0.2% |
| Uganda | 91 | 1.6% |
| Vietnam | 17 | 0.3% |
| Western Africa | 139 | 2.5% |
| Western Europe | 50 | 0.9% | View All 44 Rows |
Sex and Age in Pelham Manor
Sex and Age in Pelham Manor
The most populous age groups in Pelham Manor are 10 to 14 Years (368 | 13.5%) for men and 40 to 44 Years (323 | 10.9%) for women.
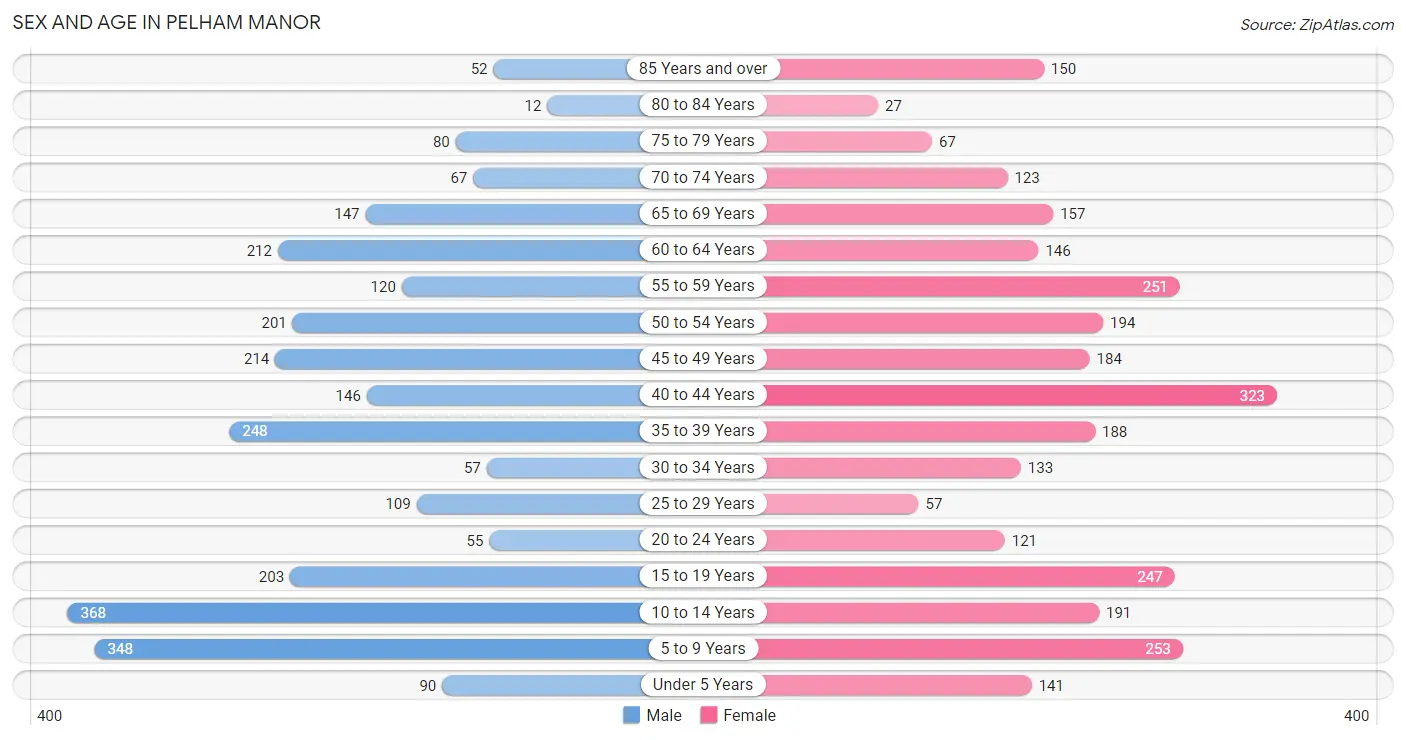
| Age Bracket | Male | Female |
| Under 5 Years | 90 (3.3%) | 141 (4.8%) |
| 5 to 9 Years | 348 (12.8%) | 253 (8.6%) |
| 10 to 14 Years | 368 (13.5%) | 191 (6.5%) |
| 15 to 19 Years | 203 (7.4%) | 247 (8.4%) |
| 20 to 24 Years | 55 (2.0%) | 121 (4.1%) |
| 25 to 29 Years | 109 (4.0%) | 57 (1.9%) |
| 30 to 34 Years | 57 (2.1%) | 133 (4.5%) |
| 35 to 39 Years | 248 (9.1%) | 188 (6.4%) |
| 40 to 44 Years | 146 (5.3%) | 323 (10.9%) |
| 45 to 49 Years | 214 (7.8%) | 184 (6.2%) |
| 50 to 54 Years | 201 (7.4%) | 194 (6.6%) |
| 55 to 59 Years | 120 (4.4%) | 251 (8.5%) |
| 60 to 64 Years | 212 (7.8%) | 146 (4.9%) |
| 65 to 69 Years | 147 (5.4%) | 157 (5.3%) |
| 70 to 74 Years | 67 (2.5%) | 123 (4.2%) |
| 75 to 79 Years | 80 (2.9%) | 67 (2.3%) |
| 80 to 84 Years | 12 (0.4%) | 27 (0.9%) |
| 85 Years and over | 52 (1.9%) | 150 (5.1%) |
| Total | 2,729 (100.0%) | 2,953 (100.0%) |
Families and Households in Pelham Manor
Median Family Size in Pelham Manor
The median family size in Pelham Manor is 3.42 persons per family, with single male/father families (23 | 1.5%) accounting for the largest median family size of 6.22 persons per family. On the other hand, single female/mother families (148 | 9.9%) represent the smallest median family size with 2.57 persons per family.
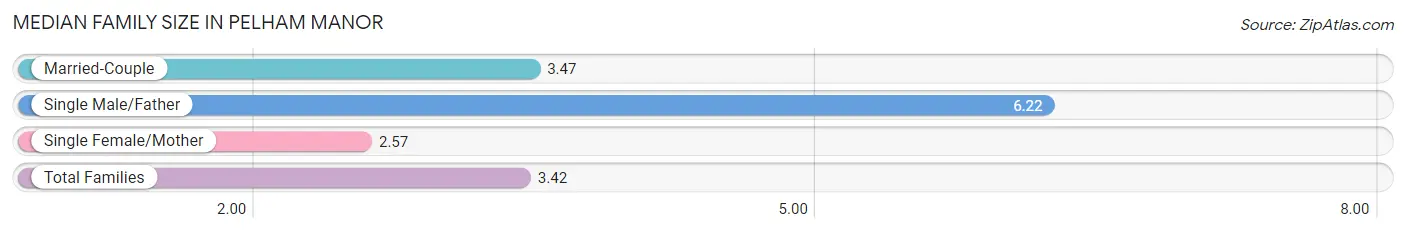
| Family Type | # Families | Family Size |
| Married-Couple | 1,331 (88.6%) | 3.47 |
| Single Male/Father | 23 (1.5%) | 6.22 |
| Single Female/Mother | 148 (9.9%) | 2.57 |
| Total Families | 1,502 (100.0%) | 3.42 |
Median Household Size in Pelham Manor
The median household size in Pelham Manor is 2.86 persons per household, with single male/father households (23 | 1.2%) accounting for the largest median household size of 6.22 persons per household. non-family households (475 | 24.0%) represent the smallest median household size with 1.07 persons per household.
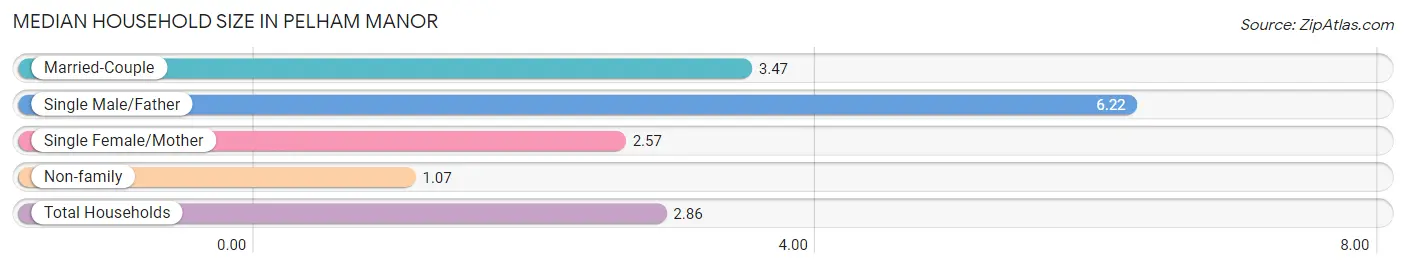
| Household Type | # Households | Household Size |
| Married-Couple | 1,331 (67.3%) | 3.47 |
| Single Male/Father | 23 (1.2%) | 6.22 |
| Single Female/Mother | 148 (7.5%) | 2.57 |
| Non-family | 475 (24.0%) | 1.07 |
| Total Households | 1,977 (100.0%) | 2.86 |
Household Size by Marriage Status in Pelham Manor
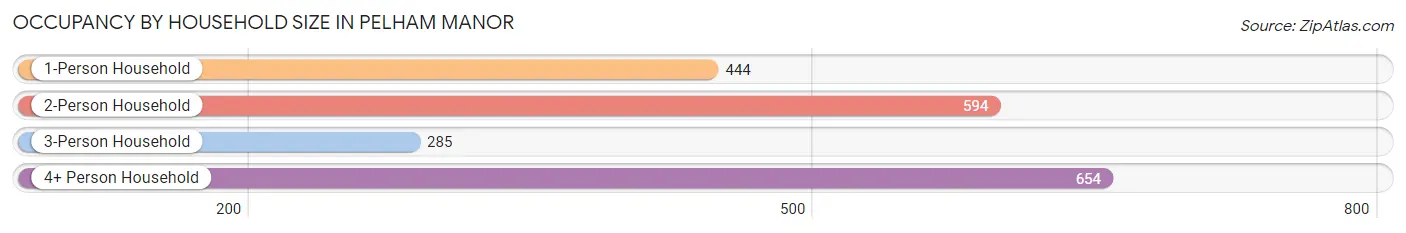
Out of a total of 1,977 households in Pelham Manor, 1,502 (76.0%) are family households, while 475 (24.0%) are nonfamily households. The most numerous type of family households are 2-person households, comprising 563, and the most common type of nonfamily households are 1-person households, comprising 444.
| Household Size | Family Households | Nonfamily Households |
| 1-Person Households | - | 444 (22.5%) |
| 2-Person Households | 563 (28.5%) | 31 (1.6%) |
| 3-Person Households | 285 (14.4%) | 0 (0.0%) |
| 4-Person Households | 432 (21.8%) | 0 (0.0%) |
| 5-Person Households | 105 (5.3%) | 0 (0.0%) |
| 6-Person Households | 85 (4.3%) | 0 (0.0%) |
| 7+ Person Households | 32 (1.6%) | 0 (0.0%) |
| Total | 1,502 (76.0%) | 475 (24.0%) |
Female Fertility in Pelham Manor
Fertility by Age in Pelham Manor
Average fertility rate in Pelham Manor is 16.0 births per 1,000 women. Women in the age bracket of 20 to 34 years have the highest fertility rate with 68.0 births per 1,000 women. Women in the age bracket of 20 to 34 years acount for 100.0% of all women with births.
| Age Bracket | Women with Births | Births / 1,000 Women |
| 15 to 19 years | 0 (0.0%) | 0.0 |
| 20 to 34 years | 21 (100.0%) | 68.0 |
| 35 to 50 years | 0 (0.0%) | 0.0 |
| Total | 21 (100.0%) | 16.0 |
Fertility by Age by Marriage Status in Pelham Manor
| Age Bracket | Married | Unmarried |
| 15 to 19 years | 0 (0.0%) | 0 (0.0%) |
| 20 to 34 years | 21 (100.0%) | 0 (0.0%) |
| 35 to 50 years | 0 (0.0%) | 0 (0.0%) |
| Total | 21 (100.0%) | 0 (0.0%) |
Fertility by Education in Pelham Manor
| Educational Attainment | Women with Births | Births / 1,000 Women |
| Less than High School | 0 (0.0%) | 0.0 |
| High School Diploma | 0 (0.0%) | 0.0 |
| College or Associate's Degree | 0 (0.0%) | 0.0 |
| Bachelor's Degree | 9 (42.9%) | 18.0 |
| Graduate Degree | 12 (57.1%) | 31.0 |
| Total | 21 (100.0%) | 16.0 |
Fertility by Education by Marriage Status in Pelham Manor
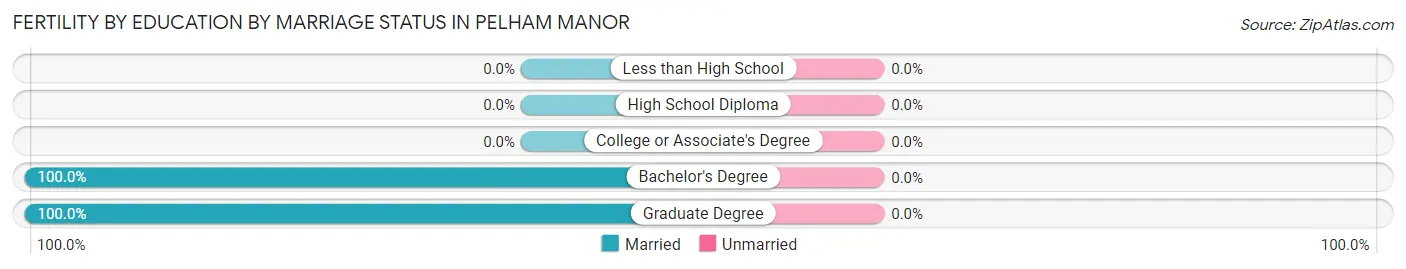
| Educational Attainment | Married | Unmarried |
| Less than High School | 0 (0.0%) | 0 (0.0%) |
| High School Diploma | 0 (0.0%) | 0 (0.0%) |
| College or Associate's Degree | 0 (0.0%) | 0 (0.0%) |
| Bachelor's Degree | 9 (100.0%) | 0 (0.0%) |
| Graduate Degree | 12 (100.0%) | 0 (0.0%) |
| Total | 21 (100.0%) | 0 (0.0%) |
Employment Characteristics in Pelham Manor
Employment by Class of Employer in Pelham Manor
Among the 2,565 employed individuals in Pelham Manor, private company employees (1,442 | 56.2%), not-for-profit organizations (408 | 15.9%), and local government employees (196 | 7.6%) make up the most common classes of employment.
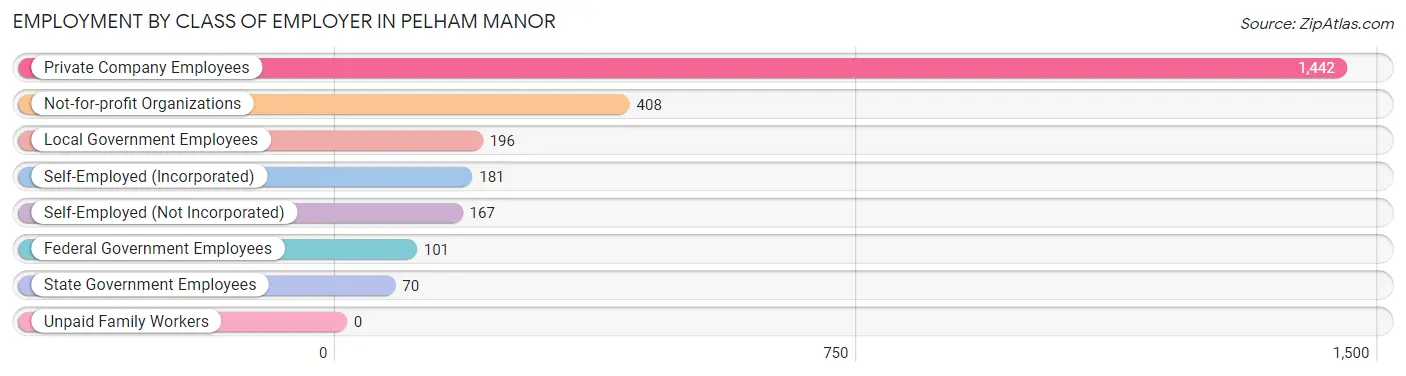
| Employer Class | # Employees | % Employees |
| Private Company Employees | 1,442 | 56.2% |
| Self-Employed (Incorporated) | 181 | 7.1% |
| Self-Employed (Not Incorporated) | 167 | 6.5% |
| Not-for-profit Organizations | 408 | 15.9% |
| Local Government Employees | 196 | 7.6% |
| State Government Employees | 70 | 2.7% |
| Federal Government Employees | 101 | 3.9% |
| Unpaid Family Workers | 0 | 0.0% |
| Total | 2,565 | 100.0% |
Employment Status by Age in Pelham Manor
According to the labor force statistics for Pelham Manor, out of the total population over 16 years of age (4,172), 65.3% or 2,724 individuals are in the labor force, with 5.2% or 142 of them unemployed. The age group with the highest labor force participation rate is 30 to 34 years, with 95.3% or 181 individuals in the labor force. Within the labor force, the 16 to 19 years age range has the highest percentage of unemployed individuals, with 62.0% or 31 of them being unemployed.
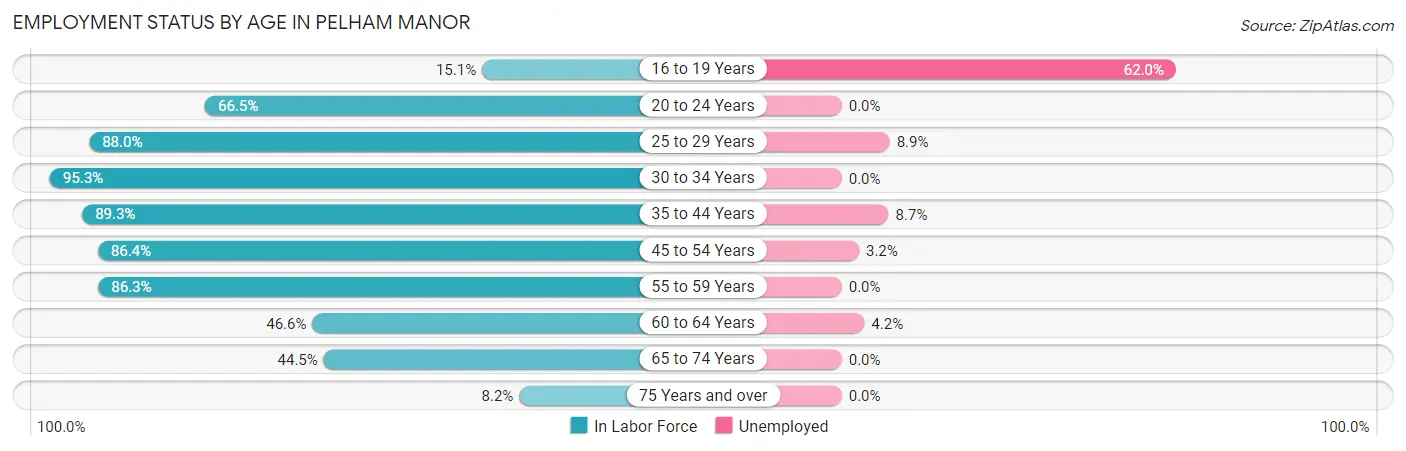
| Age Bracket | In Labor Force | Unemployed |
| 16 to 19 Years | 50 (15.1%) | 31 (62.0%) |
| 20 to 24 Years | 117 (66.5%) | 0 (0.0%) |
| 25 to 29 Years | 146 (88.0%) | 13 (8.9%) |
| 30 to 34 Years | 181 (95.3%) | 0 (0.0%) |
| 35 to 44 Years | 808 (89.3%) | 70 (8.7%) |
| 45 to 54 Years | 685 (86.4%) | 22 (3.2%) |
| 55 to 59 Years | 320 (86.3%) | 0 (0.0%) |
| 60 to 64 Years | 167 (46.6%) | 7 (4.2%) |
| 65 to 74 Years | 220 (44.5%) | 0 (0.0%) |
| 75 Years and over | 32 (8.2%) | 0 (0.0%) |
| Total | 2,724 (65.3%) | 142 (5.2%) |
Employment Status by Educational Attainment in Pelham Manor
According to labor force statistics for Pelham Manor, 82.9% of individuals (2,307) out of the total population between 25 and 64 years of age (2,783) are in the labor force, with 4.9% or 113 of them being unemployed. The group with the highest labor force participation rate are those with the educational attainment of bachelor's degree or higher, with 88.8% or 2,028 individuals in the labor force. Within the labor force, individuals with less than high school education have the highest percentage of unemployment, with 69.4% or 34 of them being unemployed.
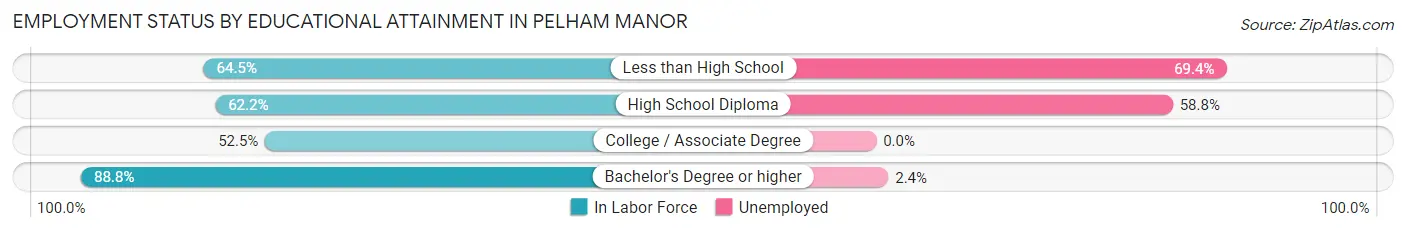
| Educational Attainment | In Labor Force | Unemployed |
| Less than High School | 49 (64.5%) | 53 (69.4%) |
| High School Diploma | 51 (62.2%) | 48 (58.8%) |
| College / Associate Degree | 179 (52.5%) | 0 (0.0%) |
| Bachelor's Degree or higher | 2,028 (88.8%) | 55 (2.4%) |
| Total | 2,307 (82.9%) | 136 (4.9%) |
Employment Occupations by Sex in Pelham Manor
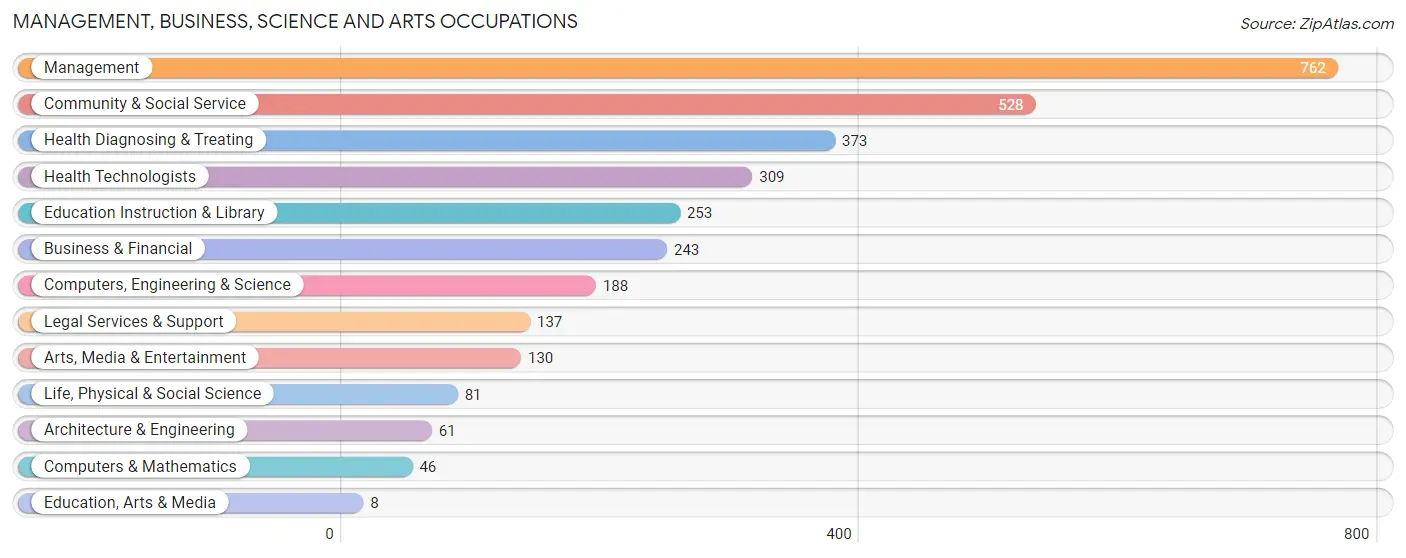
Management, Business, Science and Arts Occupations
The most common Management, Business, Science and Arts occupations in Pelham Manor are Management (762 | 29.5%), Community & Social Service (528 | 20.4%), Health Diagnosing & Treating (373 | 14.4%), Health Technologists (309 | 12.0%), and Education Instruction & Library (253 | 9.8%).
Management, Business, Science and Arts Occupations by Sex
Within the Management, Business, Science and Arts occupations in Pelham Manor, the most male-oriented occupations are Computers & Mathematics (100.0%), Architecture & Engineering (100.0%), and Education, Arts & Media (100.0%), while the most female-oriented occupations are Arts, Media & Entertainment (63.8%), Health Diagnosing & Treating (63.0%), and Education Instruction & Library (61.7%).
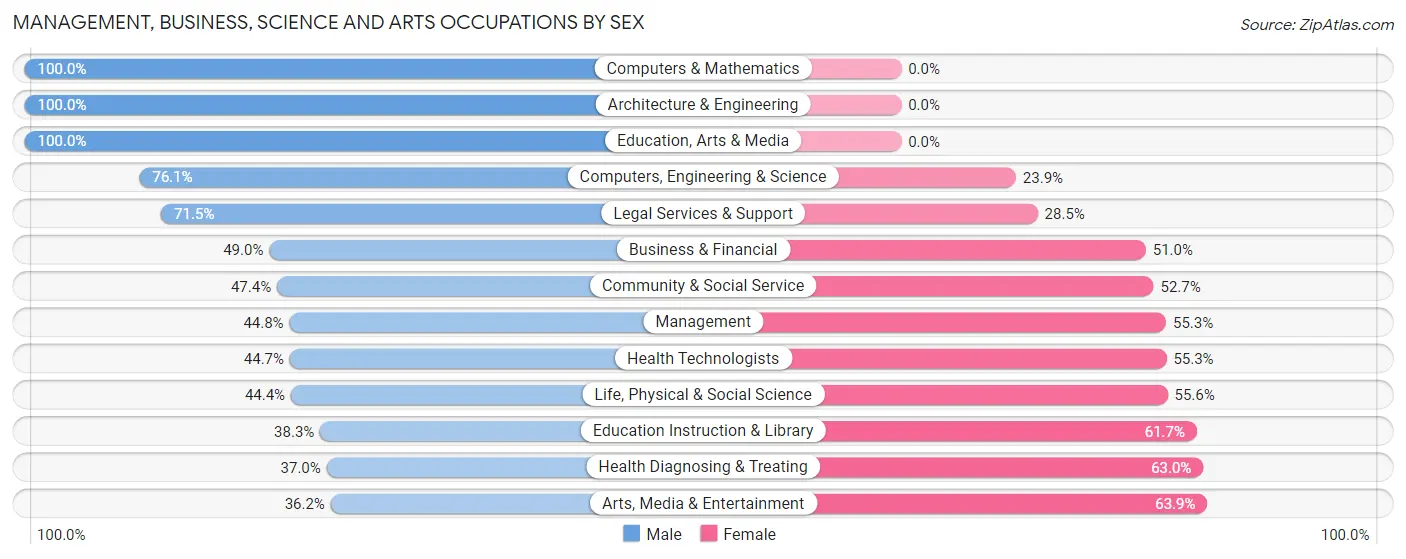
| Occupation | Male | Female |
| Management | 341 (44.8%) | 421 (55.2%) |
| Business & Financial | 119 (49.0%) | 124 (51.0%) |
| Computers, Engineering & Science | 143 (76.1%) | 45 (23.9%) |
| Computers & Mathematics | 46 (100.0%) | 0 (0.0%) |
| Architecture & Engineering | 61 (100.0%) | 0 (0.0%) |
| Life, Physical & Social Science | 36 (44.4%) | 45 (55.6%) |
| Community & Social Service | 250 (47.3%) | 278 (52.6%) |
| Education, Arts & Media | 8 (100.0%) | 0 (0.0%) |
| Legal Services & Support | 98 (71.5%) | 39 (28.5%) |
| Education Instruction & Library | 97 (38.3%) | 156 (61.7%) |
| Arts, Media & Entertainment | 47 (36.1%) | 83 (63.8%) |
| Health Diagnosing & Treating | 138 (37.0%) | 235 (63.0%) |
| Health Technologists | 138 (44.7%) | 171 (55.3%) |
| Total (Category) | 991 (47.3%) | 1,103 (52.7%) |
| Total (Overall) | 1,229 (47.6%) | 1,354 (52.4%) |
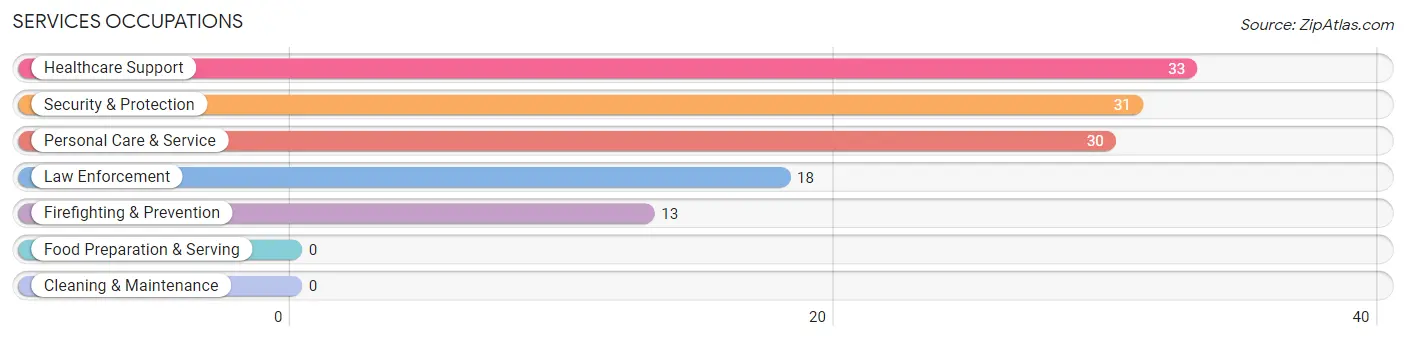
Services Occupations
The most common Services occupations in Pelham Manor are Healthcare Support (33 | 1.3%), Security & Protection (31 | 1.2%), Personal Care & Service (30 | 1.2%), Law Enforcement (18 | 0.7%), and Firefighting & Prevention (13 | 0.5%).
Services Occupations by Sex
Within the Services occupations in Pelham Manor, the most male-oriented occupations are Security & Protection (100.0%), Firefighting & Prevention (100.0%), and Law Enforcement (100.0%), while the most female-oriented occupations are Personal Care & Service (100.0%), and Healthcare Support (57.6%).
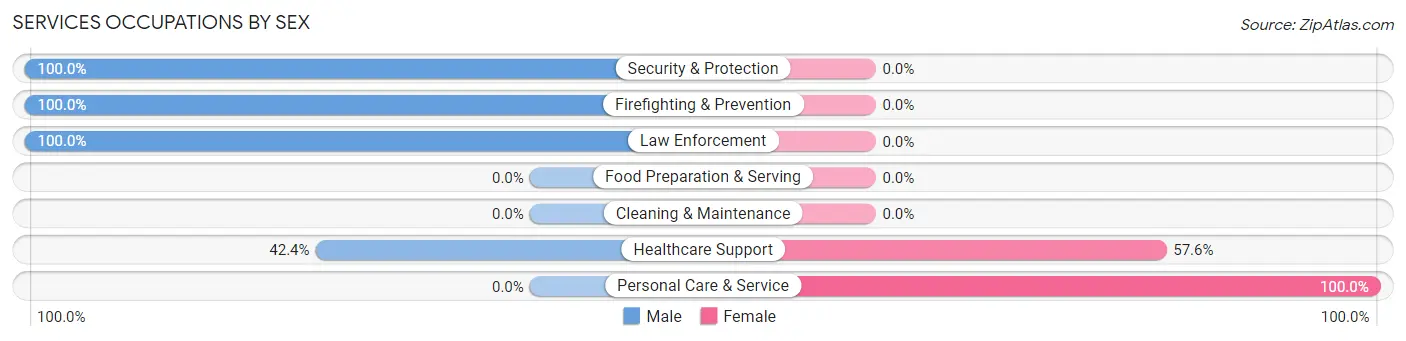
| Occupation | Male | Female |
| Healthcare Support | 14 (42.4%) | 19 (57.6%) |
| Security & Protection | 31 (100.0%) | 0 (0.0%) |
| Firefighting & Prevention | 13 (100.0%) | 0 (0.0%) |
| Law Enforcement | 18 (100.0%) | 0 (0.0%) |
| Food Preparation & Serving | 0 (0.0%) | 0 (0.0%) |
| Cleaning & Maintenance | 0 (0.0%) | 0 (0.0%) |
| Personal Care & Service | 0 (0.0%) | 30 (100.0%) |
| Total (Category) | 45 (47.9%) | 49 (52.1%) |
| Total (Overall) | 1,229 (47.6%) | 1,354 (52.4%) |
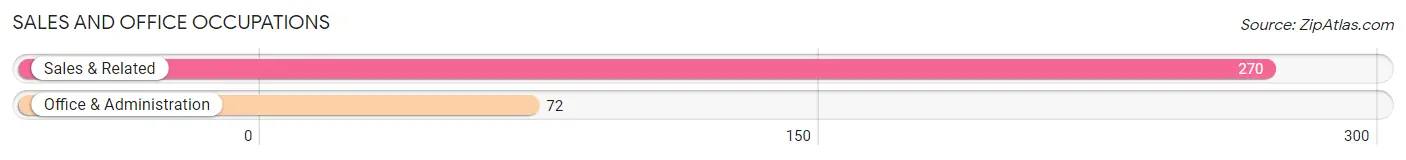
Sales and Office Occupations
The most common Sales and Office occupations in Pelham Manor are Sales & Related (270 | 10.4%), and Office & Administration (72 | 2.8%).
Sales and Office Occupations by Sex
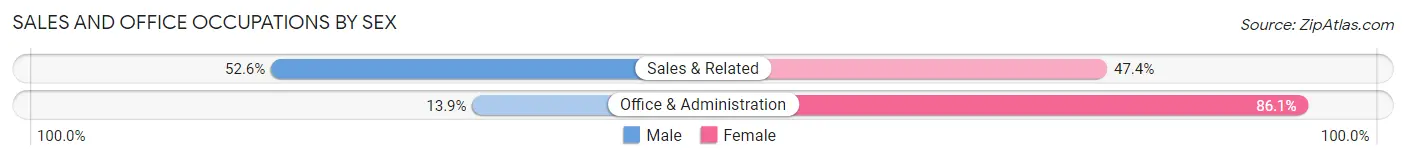
| Occupation | Male | Female |
| Sales & Related | 142 (52.6%) | 128 (47.4%) |
| Office & Administration | 10 (13.9%) | 62 (86.1%) |
| Total (Category) | 152 (44.4%) | 190 (55.6%) |
| Total (Overall) | 1,229 (47.6%) | 1,354 (52.4%) |
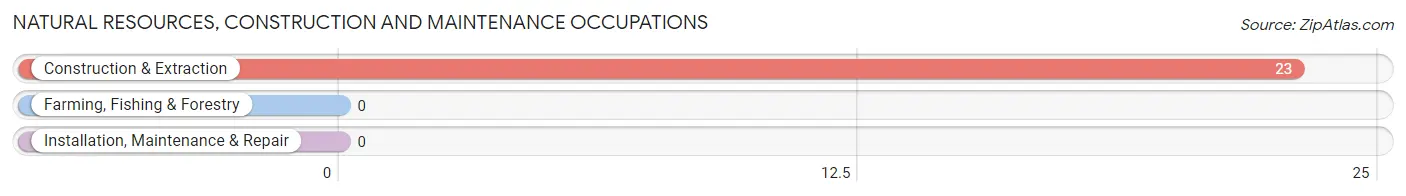
Natural Resources, Construction and Maintenance Occupations
The most common Natural Resources, Construction and Maintenance occupations in Pelham Manor are , and Construction & Extraction (23 | 0.9%).
Natural Resources, Construction and Maintenance Occupations by Sex
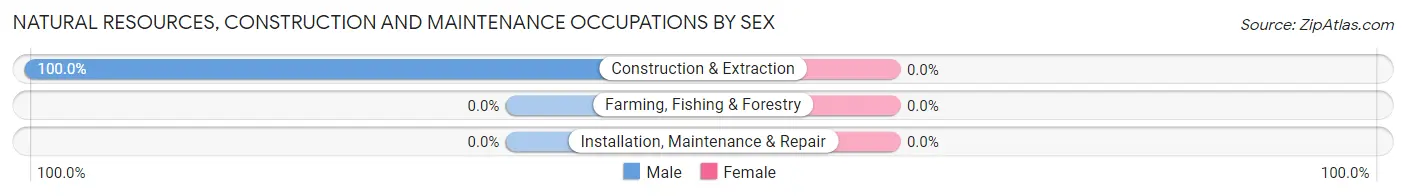
| Occupation | Male | Female |
| Farming, Fishing & Forestry | 0 (0.0%) | 0 (0.0%) |
| Construction & Extraction | 23 (100.0%) | 0 (0.0%) |
| Installation, Maintenance & Repair | 0 (0.0%) | 0 (0.0%) |
| Total (Category) | 23 (100.0%) | 0 (0.0%) |
| Total (Overall) | 1,229 (47.6%) | 1,354 (52.4%) |
Production, Transportation and Moving Occupations
The most common Production, Transportation and Moving occupations in Pelham Manor are Transportation (18 | 0.7%), and Production (12 | 0.5%).
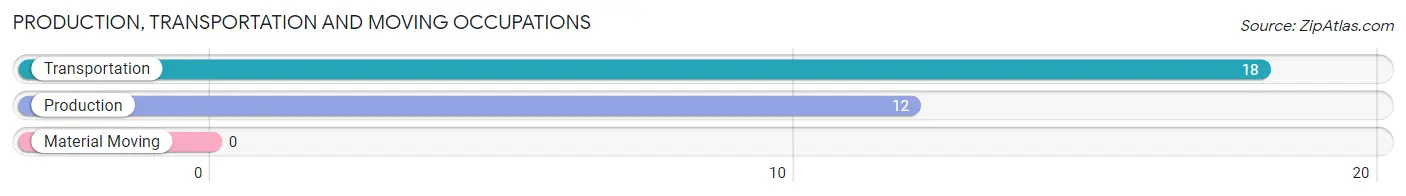
Production, Transportation and Moving Occupations by Sex
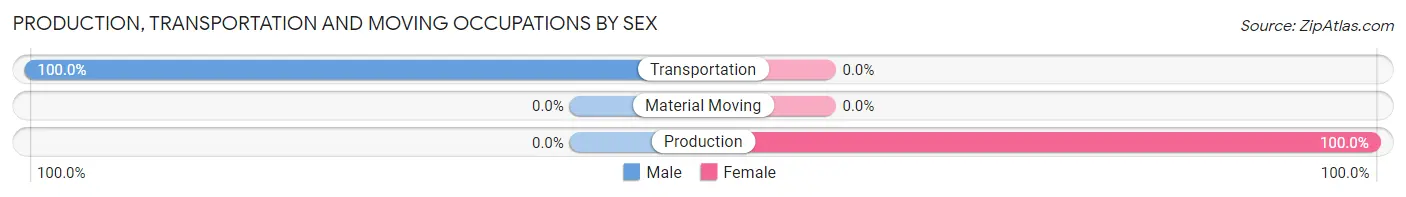
| Occupation | Male | Female |
| Production | 0 (0.0%) | 12 (100.0%) |
| Transportation | 18 (100.0%) | 0 (0.0%) |
| Material Moving | 0 (0.0%) | 0 (0.0%) |
| Total (Category) | 18 (60.0%) | 12 (40.0%) |
| Total (Overall) | 1,229 (47.6%) | 1,354 (52.4%) |
Employment Industries by Sex in Pelham Manor
Employment Industries in Pelham Manor
The major employment industries in Pelham Manor include Professional & Scientific (459 | 17.8%), Health Care & Social Assistance (380 | 14.7%), Finance & Insurance (342 | 13.2%), Educational Services (336 | 13.0%), and Public Administration (165 | 6.4%).
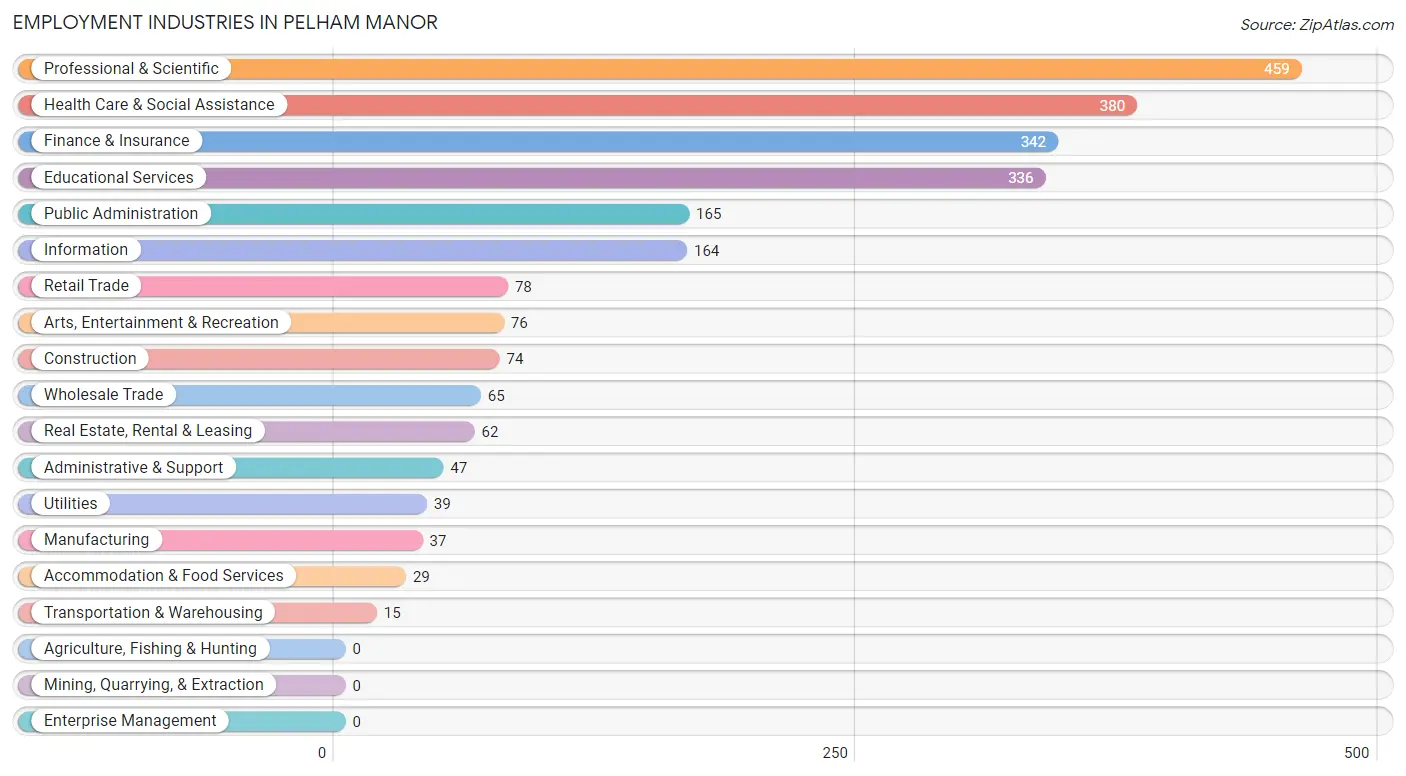
Employment Industries by Sex in Pelham Manor
The Pelham Manor industries that see more men than women are Transportation & Warehousing (100.0%), Utilities (100.0%), and Construction (85.1%), whereas the industries that tend to have a higher number of women are Wholesale Trade (100.0%), Manufacturing (78.4%), and Educational Services (70.2%).
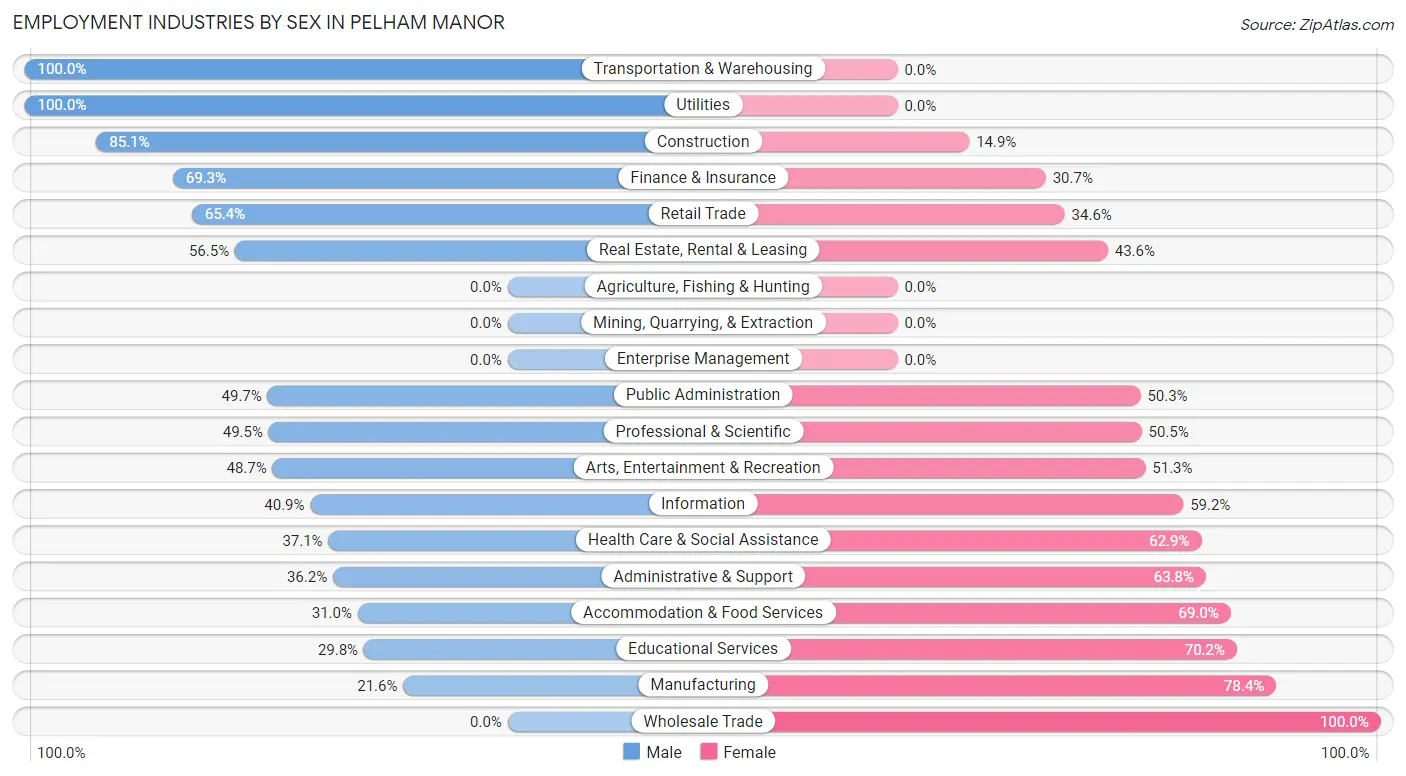
| Industry | Male | Female |
| Agriculture, Fishing & Hunting | 0 (0.0%) | 0 (0.0%) |
| Mining, Quarrying, & Extraction | 0 (0.0%) | 0 (0.0%) |
| Construction | 63 (85.1%) | 11 (14.9%) |
| Manufacturing | 8 (21.6%) | 29 (78.4%) |
| Wholesale Trade | 0 (0.0%) | 65 (100.0%) |
| Retail Trade | 51 (65.4%) | 27 (34.6%) |
| Transportation & Warehousing | 15 (100.0%) | 0 (0.0%) |
| Utilities | 39 (100.0%) | 0 (0.0%) |
| Information | 67 (40.8%) | 97 (59.2%) |
| Finance & Insurance | 237 (69.3%) | 105 (30.7%) |
| Real Estate, Rental & Leasing | 35 (56.5%) | 27 (43.5%) |
| Professional & Scientific | 227 (49.5%) | 232 (50.5%) |
| Enterprise Management | 0 (0.0%) | 0 (0.0%) |
| Administrative & Support | 17 (36.2%) | 30 (63.8%) |
| Educational Services | 100 (29.8%) | 236 (70.2%) |
| Health Care & Social Assistance | 141 (37.1%) | 239 (62.9%) |
| Arts, Entertainment & Recreation | 37 (48.7%) | 39 (51.3%) |
| Accommodation & Food Services | 9 (31.0%) | 20 (69.0%) |
| Public Administration | 82 (49.7%) | 83 (50.3%) |
| Total | 1,229 (47.6%) | 1,354 (52.4%) |
Education in Pelham Manor
School Enrollment in Pelham Manor
The most common levels of schooling among the 1,875 students in Pelham Manor are middle school (465 | 24.8%), elementary school (443 | 23.6%), and high school (407 | 21.7%).
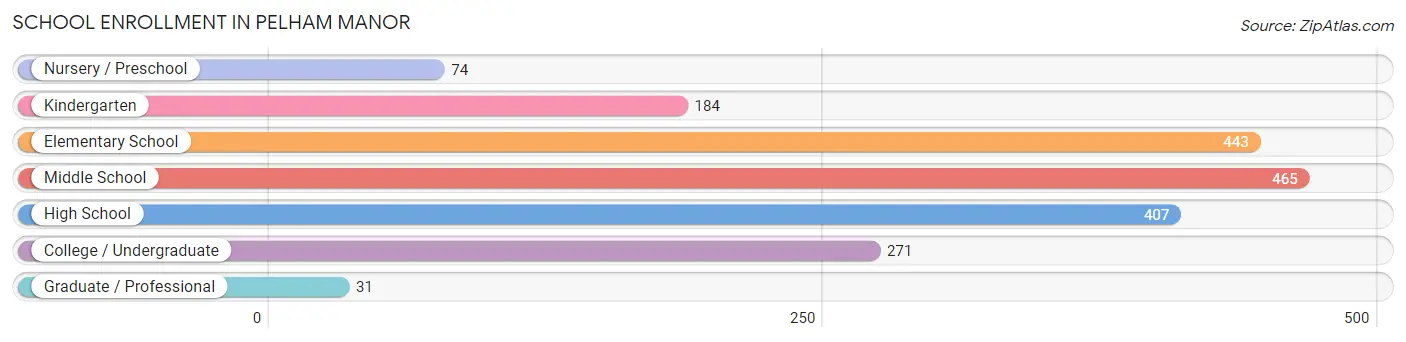
| School Level | # Students | % Students |
| Nursery / Preschool | 74 | 4.0% |
| Kindergarten | 184 | 9.8% |
| Elementary School | 443 | 23.6% |
| Middle School | 465 | 24.8% |
| High School | 407 | 21.7% |
| College / Undergraduate | 271 | 14.4% |
| Graduate / Professional | 31 | 1.7% |
| Total | 1,875 | 100.0% |
School Enrollment by Age by Funding Source in Pelham Manor
Out of a total of 1,875 students who are enrolled in schools in Pelham Manor, 319 (17.0%) attend a private institution, while the remaining 1,556 (83.0%) are enrolled in public schools. The age group of 3 to 4 year olds has the highest likelihood of being enrolled in private schools, with 65 (87.8% in the age bracket) enrolled. Conversely, the age group of 10 to 14 year olds has the lowest likelihood of being enrolled in a private school, with 552 (98.8% in the age bracket) attending a public institution.
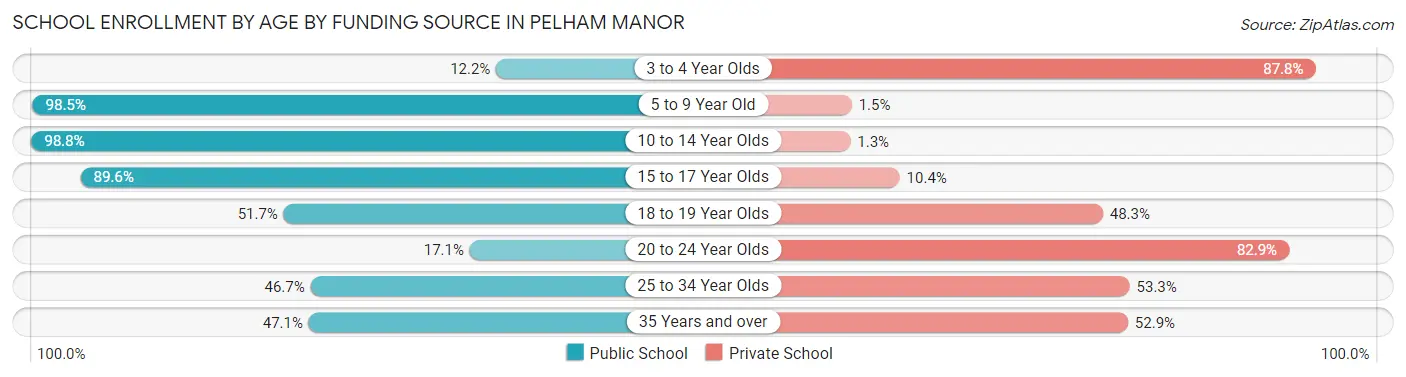
| Age Bracket | Public School | Private School |
| 3 to 4 Year Olds | 9 (12.2%) | 65 (87.8%) |
| 5 to 9 Year Old | 592 (98.5%) | 9 (1.5%) |
| 10 to 14 Year Olds | 552 (98.8%) | 7 (1.3%) |
| 15 to 17 Year Olds | 249 (89.6%) | 29 (10.4%) |
| 18 to 19 Year Olds | 89 (51.7%) | 83 (48.3%) |
| 20 to 24 Year Olds | 14 (17.1%) | 68 (82.9%) |
| 25 to 34 Year Olds | 43 (46.7%) | 49 (53.3%) |
| 35 Years and over | 8 (47.1%) | 9 (52.9%) |
| Total | 1,556 (83.0%) | 319 (17.0%) |
Educational Attainment by Field of Study in Pelham Manor
Business (588 | 18.5%), social sciences (324 | 10.2%), literature & languages (287 | 9.0%), psychology (245 | 7.7%), and liberal arts & history (238 | 7.5%) are the most common fields of study among 3,177 individuals in Pelham Manor who have obtained a bachelor's degree or higher.
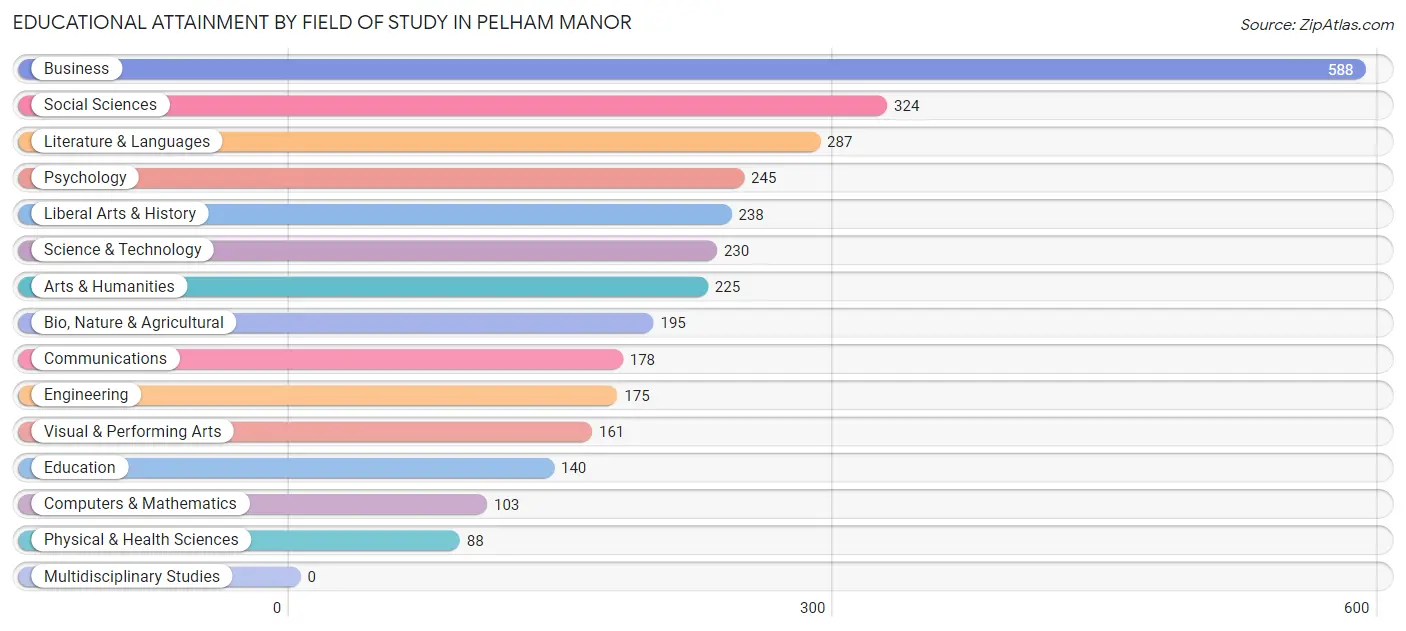
| Field of Study | # Graduates | % Graduates |
| Computers & Mathematics | 103 | 3.2% |
| Bio, Nature & Agricultural | 195 | 6.1% |
| Physical & Health Sciences | 88 | 2.8% |
| Psychology | 245 | 7.7% |
| Social Sciences | 324 | 10.2% |
| Engineering | 175 | 5.5% |
| Multidisciplinary Studies | 0 | 0.0% |
| Science & Technology | 230 | 7.2% |
| Business | 588 | 18.5% |
| Education | 140 | 4.4% |
| Literature & Languages | 287 | 9.0% |
| Liberal Arts & History | 238 | 7.5% |
| Visual & Performing Arts | 161 | 5.1% |
| Communications | 178 | 5.6% |
| Arts & Humanities | 225 | 7.1% |
| Total | 3,177 | 100.0% |
Transportation & Commute in Pelham Manor
Vehicle Availability by Sex in Pelham Manor
The most prevalent vehicle ownership categories in Pelham Manor are males with 2 vehicles (564, accounting for 46.0%) and females with 2 vehicles (599, making up 42.2%).
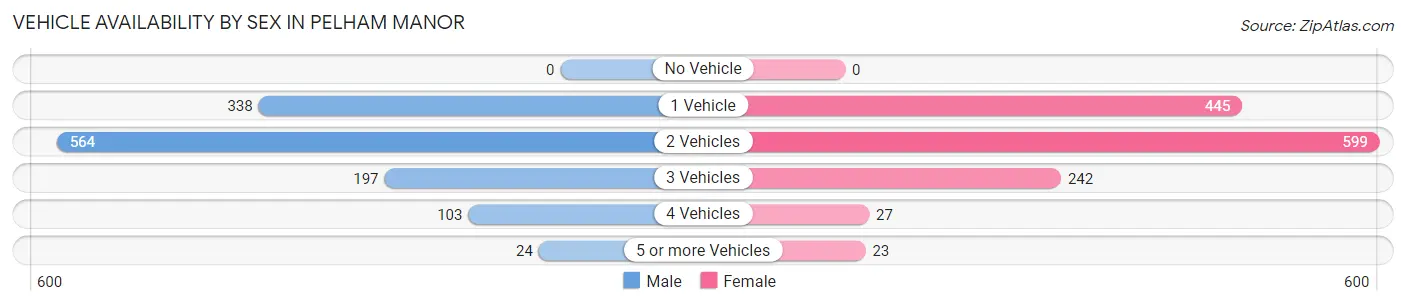
| Vehicles Available | Male | Female |
| No Vehicle | 0 (0.0%) | 0 (0.0%) |
| 1 Vehicle | 338 (27.6%) | 445 (33.3%) |
| 2 Vehicles | 564 (46.0%) | 599 (44.8%) |
| 3 Vehicles | 197 (16.1%) | 242 (18.1%) |
| 4 Vehicles | 103 (8.4%) | 27 (2.0%) |
| 5 or more Vehicles | 24 (2.0%) | 23 (1.7%) |
| Total | 1,226 (100.0%) | 1,336 (100.0%) |
Commute Time in Pelham Manor
The most frequently occuring commute durations in Pelham Manor are 60 to 89 minutes (454 commuters, 23.3%), 30 to 34 minutes (311 commuters, 16.0%), and 45 to 59 minutes (254 commuters, 13.1%).
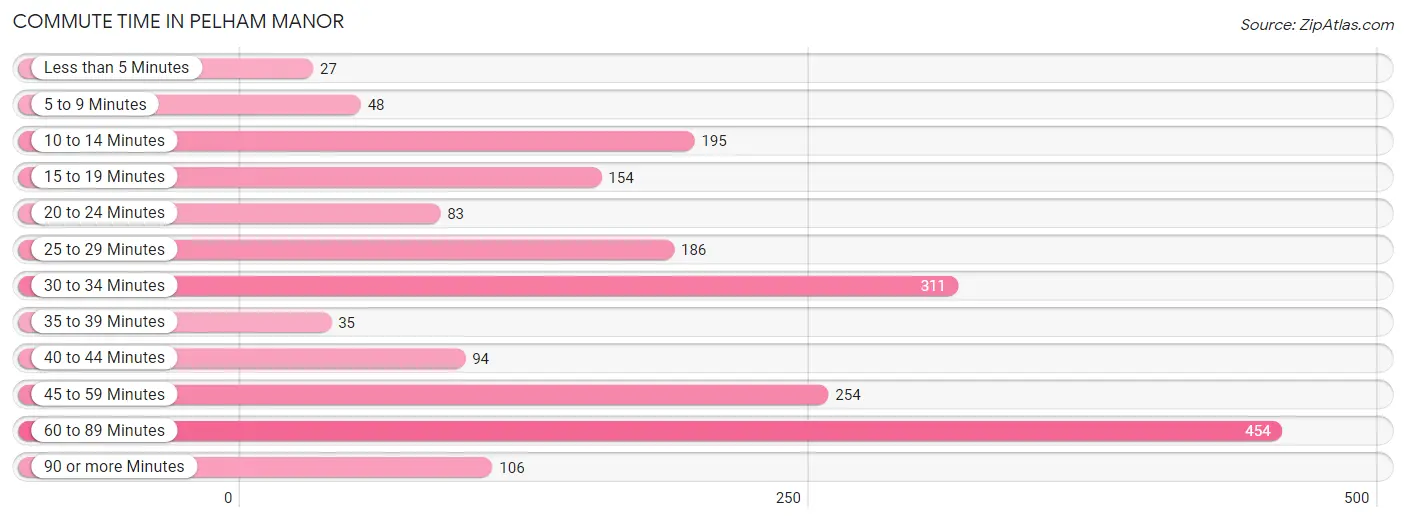
| Commute Time | # Commuters | % Commuters |
| Less than 5 Minutes | 27 | 1.4% |
| 5 to 9 Minutes | 48 | 2.5% |
| 10 to 14 Minutes | 195 | 10.0% |
| 15 to 19 Minutes | 154 | 7.9% |
| 20 to 24 Minutes | 83 | 4.3% |
| 25 to 29 Minutes | 186 | 9.6% |
| 30 to 34 Minutes | 311 | 16.0% |
| 35 to 39 Minutes | 35 | 1.8% |
| 40 to 44 Minutes | 94 | 4.8% |
| 45 to 59 Minutes | 254 | 13.1% |
| 60 to 89 Minutes | 454 | 23.3% |
| 90 or more Minutes | 106 | 5.4% |
Commute Time by Sex in Pelham Manor
The most common commute times in Pelham Manor are 60 to 89 minutes (283 commuters, 29.8%) for males and 30 to 34 minutes (248 commuters, 24.9%) for females.
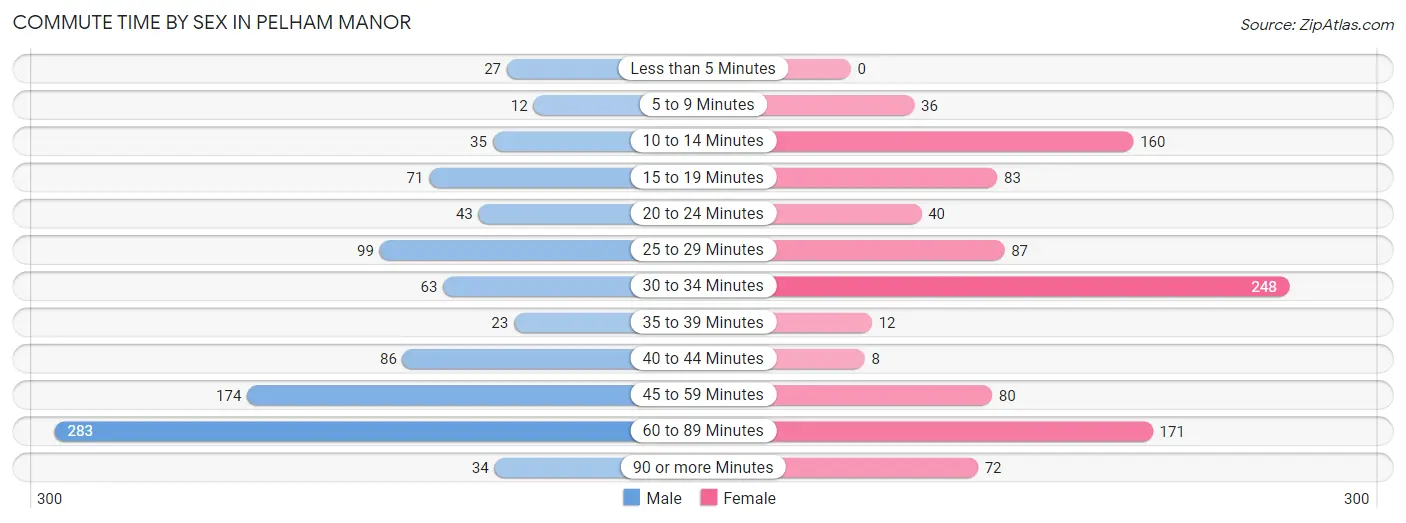
| Commute Time | Male | Female |
| Less than 5 Minutes | 27 (2.8%) | 0 (0.0%) |
| 5 to 9 Minutes | 12 (1.3%) | 36 (3.6%) |
| 10 to 14 Minutes | 35 (3.7%) | 160 (16.1%) |
| 15 to 19 Minutes | 71 (7.5%) | 83 (8.3%) |
| 20 to 24 Minutes | 43 (4.5%) | 40 (4.0%) |
| 25 to 29 Minutes | 99 (10.4%) | 87 (8.7%) |
| 30 to 34 Minutes | 63 (6.6%) | 248 (24.9%) |
| 35 to 39 Minutes | 23 (2.4%) | 12 (1.2%) |
| 40 to 44 Minutes | 86 (9.0%) | 8 (0.8%) |
| 45 to 59 Minutes | 174 (18.3%) | 80 (8.0%) |
| 60 to 89 Minutes | 283 (29.8%) | 171 (17.2%) |
| 90 or more Minutes | 34 (3.6%) | 72 (7.2%) |
Time of Departure to Work by Sex in Pelham Manor
The most frequent times of departure to work in Pelham Manor are 8:00 AM to 8:29 AM (230, 24.2%) for males and 7:30 AM to 7:59 AM (335, 33.6%) for females.
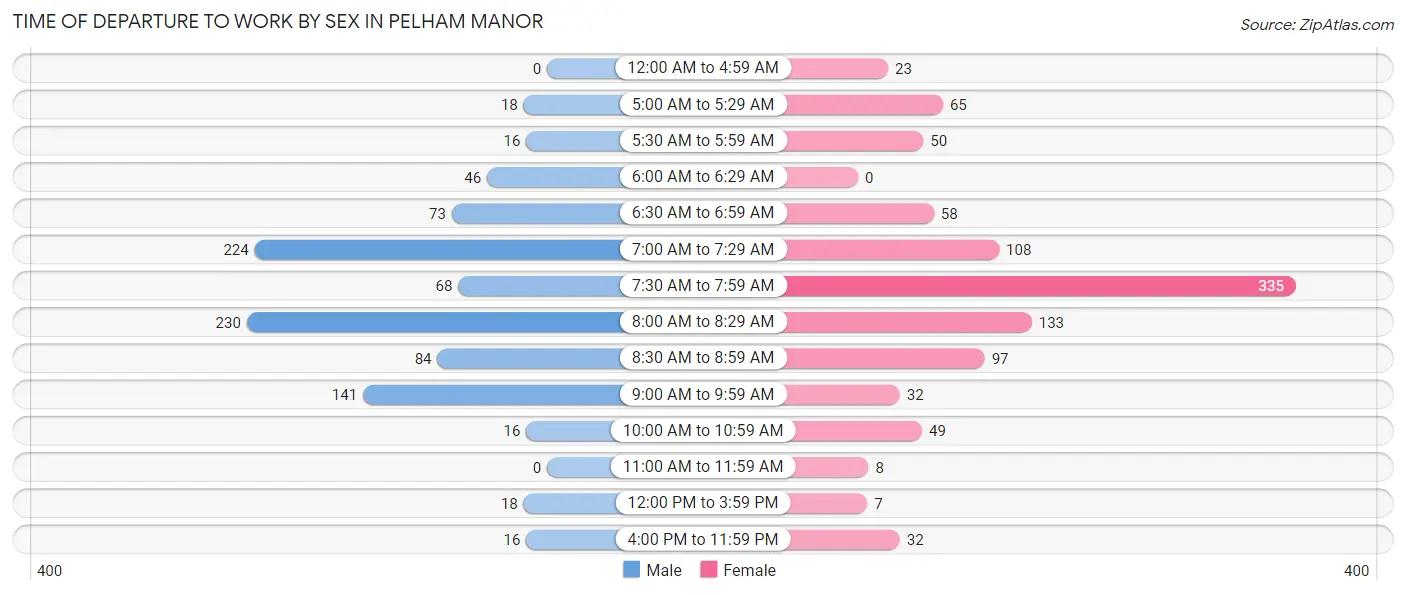
| Time of Departure | Male | Female |
| 12:00 AM to 4:59 AM | 0 (0.0%) | 23 (2.3%) |
| 5:00 AM to 5:29 AM | 18 (1.9%) | 65 (6.5%) |
| 5:30 AM to 5:59 AM | 16 (1.7%) | 50 (5.0%) |
| 6:00 AM to 6:29 AM | 46 (4.8%) | 0 (0.0%) |
| 6:30 AM to 6:59 AM | 73 (7.7%) | 58 (5.8%) |
| 7:00 AM to 7:29 AM | 224 (23.6%) | 108 (10.8%) |
| 7:30 AM to 7:59 AM | 68 (7.2%) | 335 (33.6%) |
| 8:00 AM to 8:29 AM | 230 (24.2%) | 133 (13.3%) |
| 8:30 AM to 8:59 AM | 84 (8.8%) | 97 (9.7%) |
| 9:00 AM to 9:59 AM | 141 (14.8%) | 32 (3.2%) |
| 10:00 AM to 10:59 AM | 16 (1.7%) | 49 (4.9%) |
| 11:00 AM to 11:59 AM | 0 (0.0%) | 8 (0.8%) |
| 12:00 PM to 3:59 PM | 18 (1.9%) | 7 (0.7%) |
| 4:00 PM to 11:59 PM | 16 (1.7%) | 32 (3.2%) |
| Total | 950 (100.0%) | 997 (100.0%) |
Housing Occupancy in Pelham Manor
Occupancy by Ownership in Pelham Manor
Of the total 1,977 dwellings in Pelham Manor, owner-occupied units account for 1,826 (92.4%), while renter-occupied units make up 151 (7.6%).
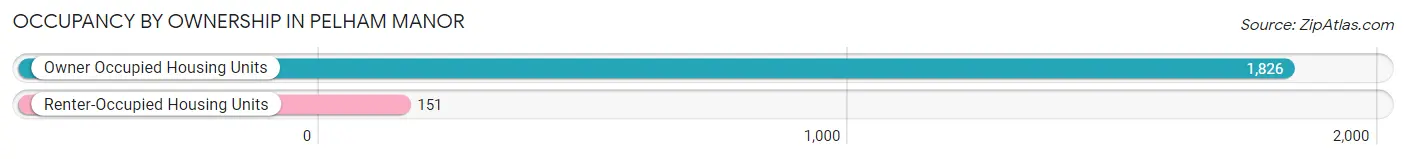
| Occupancy | # Housing Units | % Housing Units |
| Owner Occupied Housing Units | 1,826 | 92.4% |
| Renter-Occupied Housing Units | 151 | 7.6% |
| Total Occupied Housing Units | 1,977 | 100.0% |
Occupancy by Household Size in Pelham Manor
| Household Size | # Housing Units | % Housing Units |
| 1-Person Household | 444 | 22.5% |
| 2-Person Household | 594 | 30.0% |
| 3-Person Household | 285 | 14.4% |
| 4+ Person Household | 654 | 33.1% |
| Total Housing Units | 1,977 | 100.0% |
Occupancy by Ownership by Household Size in Pelham Manor
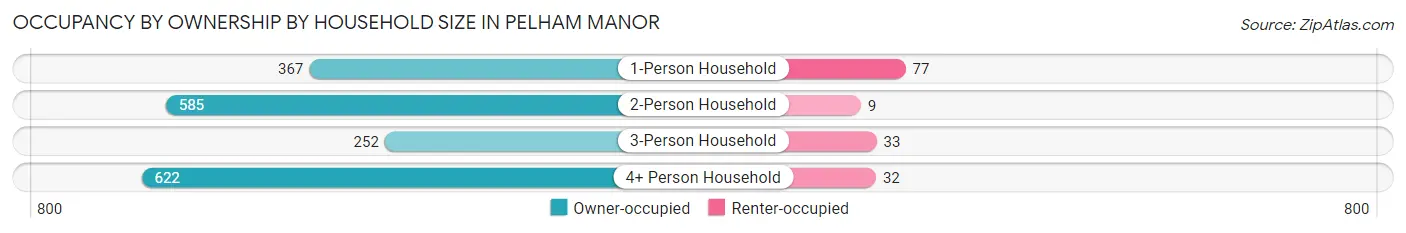
| Household Size | Owner-occupied | Renter-occupied |
| 1-Person Household | 367 (82.7%) | 77 (17.3%) |
| 2-Person Household | 585 (98.5%) | 9 (1.5%) |
| 3-Person Household | 252 (88.4%) | 33 (11.6%) |
| 4+ Person Household | 622 (95.1%) | 32 (4.9%) |
| Total Housing Units | 1,826 (92.4%) | 151 (7.6%) |
Occupancy by Educational Attainment in Pelham Manor
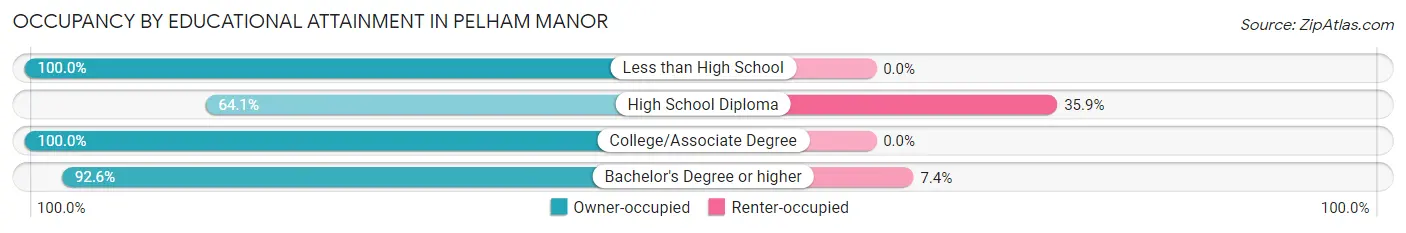
| Household Size | Owner-occupied | Renter-occupied |
| Less than High School | 66 (100.0%) | 0 (0.0%) |
| High School Diploma | 50 (64.1%) | 28 (35.9%) |
| College/Associate Degree | 169 (100.0%) | 0 (0.0%) |
| Bachelor's Degree or higher | 1,541 (92.6%) | 123 (7.4%) |
Occupancy by Age of Householder in Pelham Manor
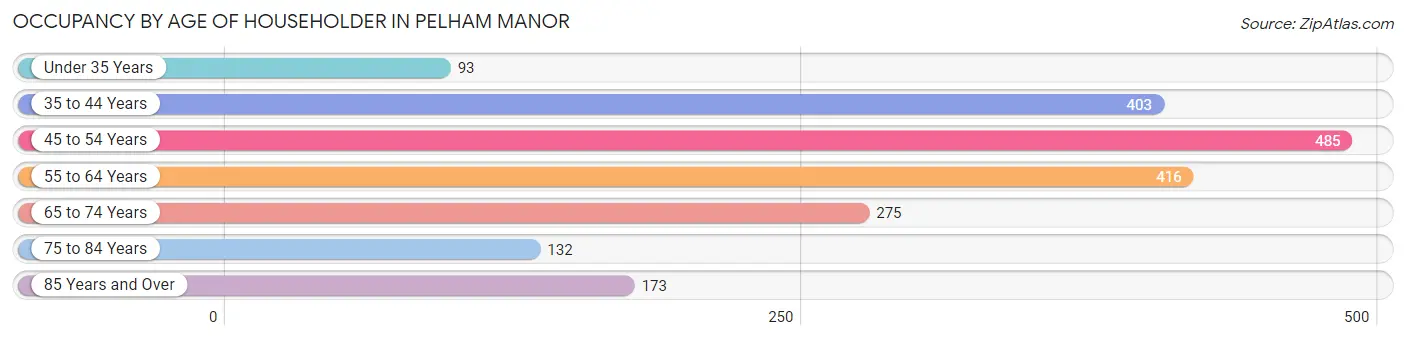
| Age Bracket | # Households | % Households |
| Under 35 Years | 93 | 4.7% |
| 35 to 44 Years | 403 | 20.4% |
| 45 to 54 Years | 485 | 24.5% |
| 55 to 64 Years | 416 | 21.0% |
| 65 to 74 Years | 275 | 13.9% |
| 75 to 84 Years | 132 | 6.7% |
| 85 Years and Over | 173 | 8.7% |
| Total | 1,977 | 100.0% |
Housing Finances in Pelham Manor
Median Income by Occupancy in Pelham Manor
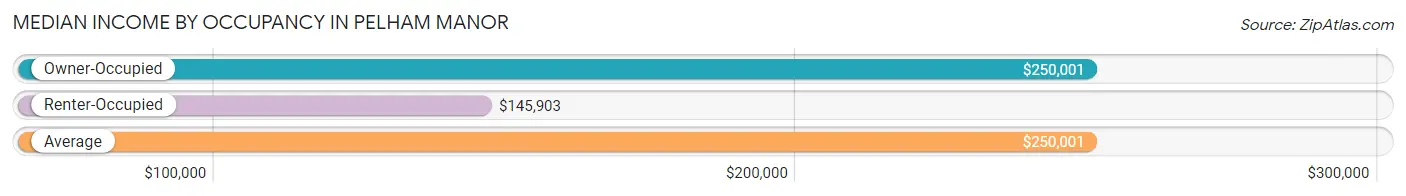
| Occupancy Type | # Households | Median Income |
| Owner-Occupied | 1,826 (92.4%) | $250,001 |
| Renter-Occupied | 151 (7.6%) | $145,903 |
| Average | 1,977 (100.0%) | $250,001 |
Occupancy by Householder Income Bracket in Pelham Manor
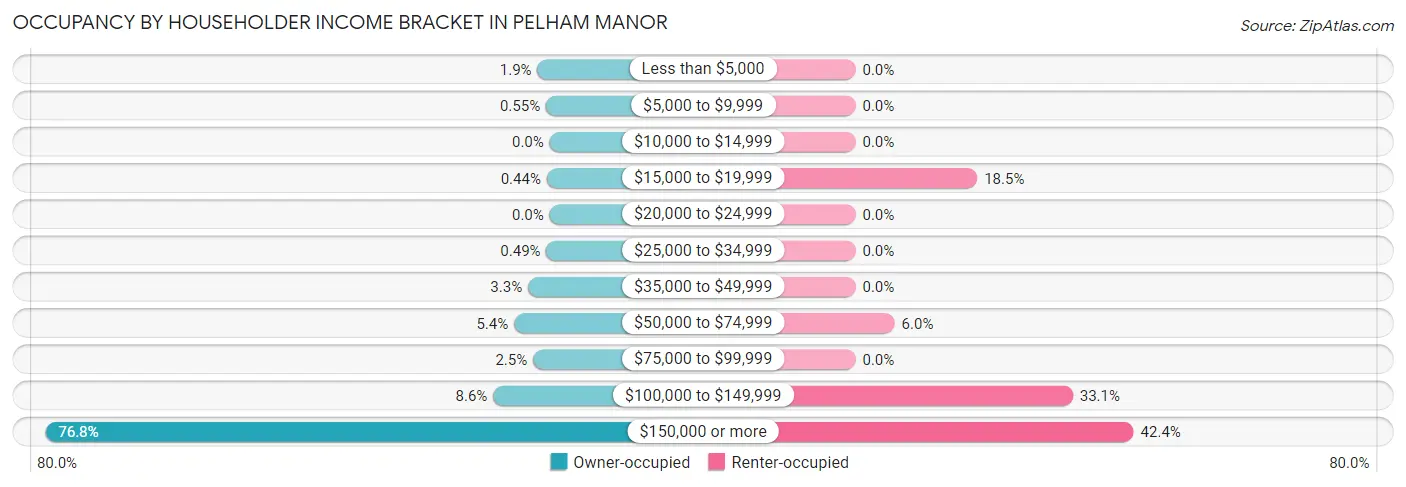
| Income Bracket | Owner-occupied | Renter-occupied |
| Less than $5,000 | 34 (1.9%) | 0 (0.0%) |
| $5,000 to $9,999 | 10 (0.5%) | 0 (0.0%) |
| $10,000 to $14,999 | 0 (0.0%) | 0 (0.0%) |
| $15,000 to $19,999 | 8 (0.4%) | 28 (18.5%) |
| $20,000 to $24,999 | 0 (0.0%) | 0 (0.0%) |
| $25,000 to $34,999 | 9 (0.5%) | 0 (0.0%) |
| $35,000 to $49,999 | 60 (3.3%) | 0 (0.0%) |
| $50,000 to $74,999 | 99 (5.4%) | 9 (6.0%) |
| $75,000 to $99,999 | 46 (2.5%) | 0 (0.0%) |
| $100,000 to $149,999 | 157 (8.6%) | 50 (33.1%) |
| $150,000 or more | 1,403 (76.8%) | 64 (42.4%) |
| Total | 1,826 (100.0%) | 151 (100.0%) |
Monthly Housing Cost Tiers in Pelham Manor
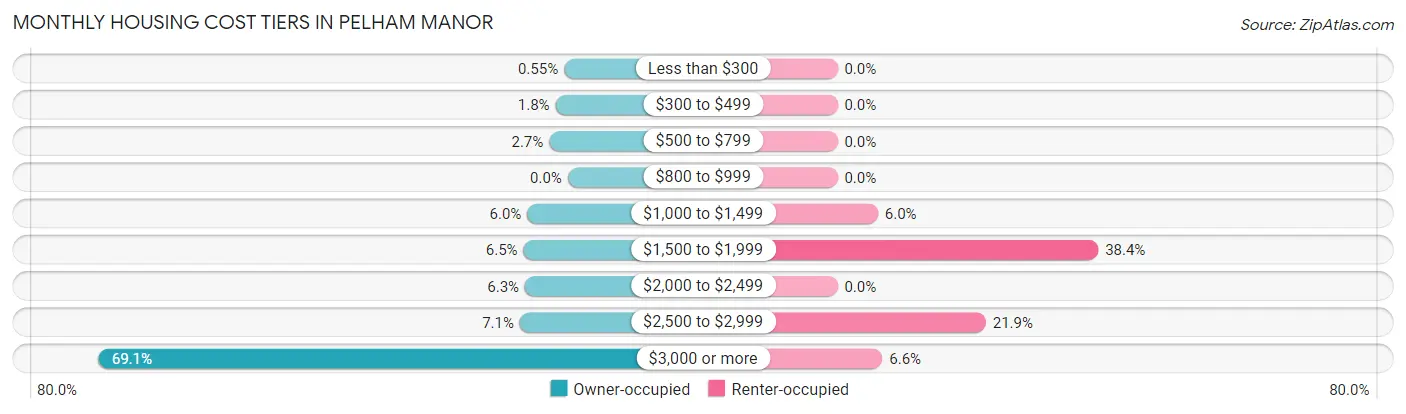
| Monthly Cost | Owner-occupied | Renter-occupied |
| Less than $300 | 10 (0.5%) | 0 (0.0%) |
| $300 to $499 | 33 (1.8%) | 0 (0.0%) |
| $500 to $799 | 50 (2.7%) | 0 (0.0%) |
| $800 to $999 | 0 (0.0%) | 0 (0.0%) |
| $1,000 to $1,499 | 109 (6.0%) | 9 (6.0%) |
| $1,500 to $1,999 | 119 (6.5%) | 58 (38.4%) |
| $2,000 to $2,499 | 115 (6.3%) | 0 (0.0%) |
| $2,500 to $2,999 | 129 (7.1%) | 33 (21.8%) |
| $3,000 or more | 1,261 (69.1%) | 10 (6.6%) |
| Total | 1,826 (100.0%) | 151 (100.0%) |
Physical Housing Characteristics in Pelham Manor
Housing Structures in Pelham Manor
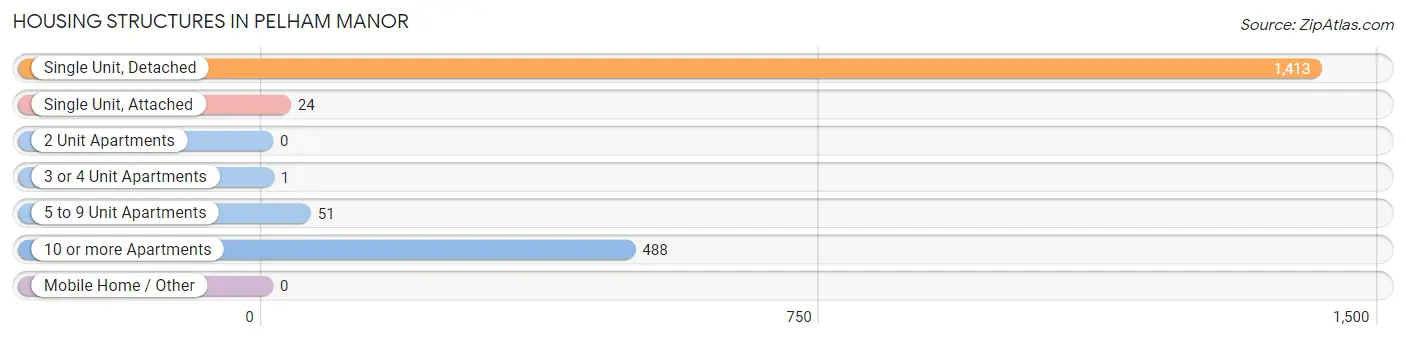
| Structure Type | # Housing Units | % Housing Units |
| Single Unit, Detached | 1,413 | 71.5% |
| Single Unit, Attached | 24 | 1.2% |
| 2 Unit Apartments | 0 | 0.0% |
| 3 or 4 Unit Apartments | 1 | 0.1% |
| 5 to 9 Unit Apartments | 51 | 2.6% |
| 10 or more Apartments | 488 | 24.7% |
| Mobile Home / Other | 0 | 0.0% |
| Total | 1,977 | 100.0% |
Housing Structures by Occupancy in Pelham Manor
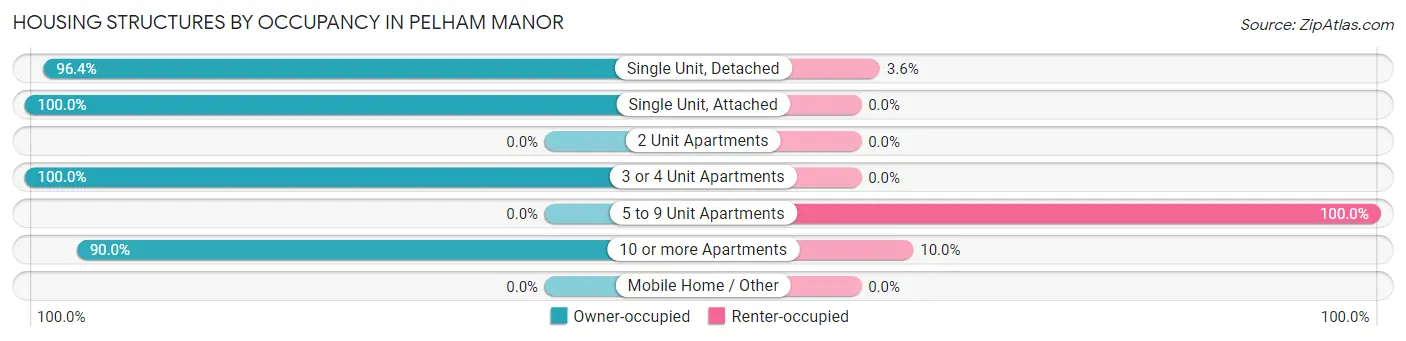
| Structure Type | Owner-occupied | Renter-occupied |
| Single Unit, Detached | 1,362 (96.4%) | 51 (3.6%) |
| Single Unit, Attached | 24 (100.0%) | 0 (0.0%) |
| 2 Unit Apartments | 0 (0.0%) | 0 (0.0%) |
| 3 or 4 Unit Apartments | 1 (100.0%) | 0 (0.0%) |
| 5 to 9 Unit Apartments | 0 (0.0%) | 51 (100.0%) |
| 10 or more Apartments | 439 (90.0%) | 49 (10.0%) |
| Mobile Home / Other | 0 (0.0%) | 0 (0.0%) |
| Total | 1,826 (92.4%) | 151 (7.6%) |
Housing Structures by Number of Rooms in Pelham Manor
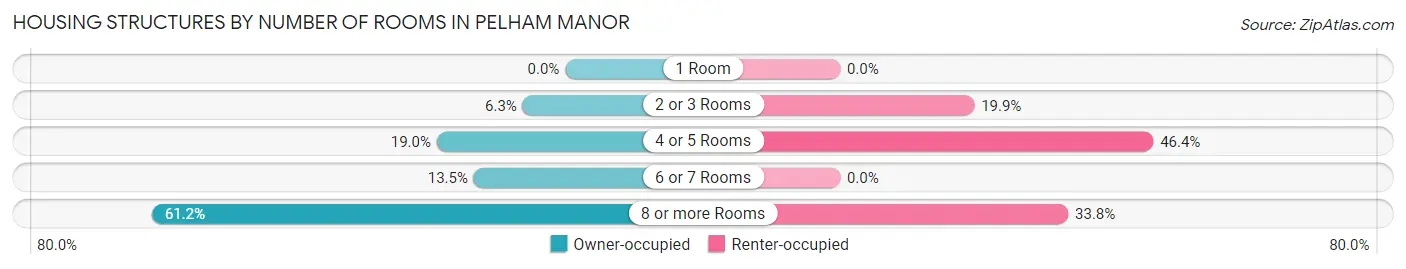
| Number of Rooms | Owner-occupied | Renter-occupied |
| 1 Room | 0 (0.0%) | 0 (0.0%) |
| 2 or 3 Rooms | 115 (6.3%) | 30 (19.9%) |
| 4 or 5 Rooms | 347 (19.0%) | 70 (46.4%) |
| 6 or 7 Rooms | 247 (13.5%) | 0 (0.0%) |
| 8 or more Rooms | 1,117 (61.2%) | 51 (33.8%) |
| Total | 1,826 (100.0%) | 151 (100.0%) |
Housing Structure by Heating Type in Pelham Manor
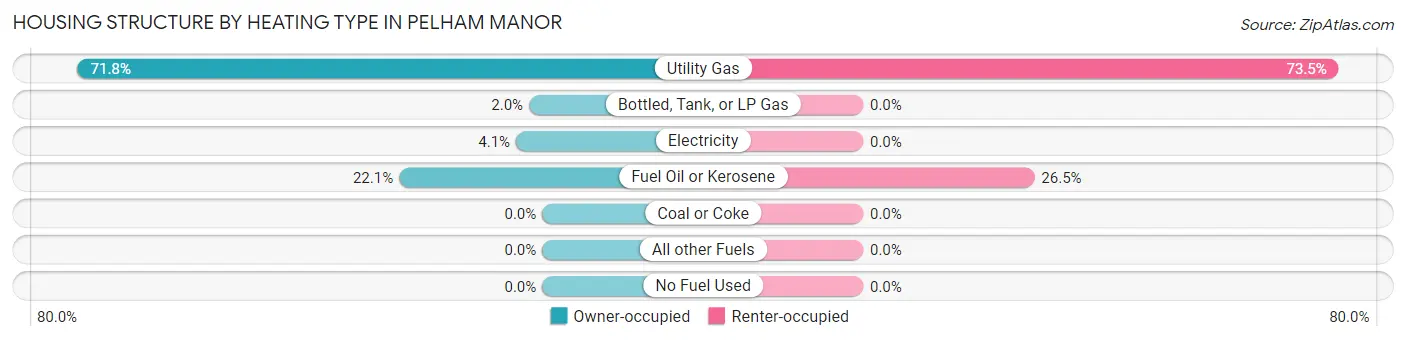
| Heating Type | Owner-occupied | Renter-occupied |
| Utility Gas | 1,311 (71.8%) | 111 (73.5%) |
| Bottled, Tank, or LP Gas | 37 (2.0%) | 0 (0.0%) |
| Electricity | 74 (4.1%) | 0 (0.0%) |
| Fuel Oil or Kerosene | 404 (22.1%) | 40 (26.5%) |
| Coal or Coke | 0 (0.0%) | 0 (0.0%) |
| All other Fuels | 0 (0.0%) | 0 (0.0%) |
| No Fuel Used | 0 (0.0%) | 0 (0.0%) |
| Total | 1,826 (100.0%) | 151 (100.0%) |
Household Vehicle Usage in Pelham Manor
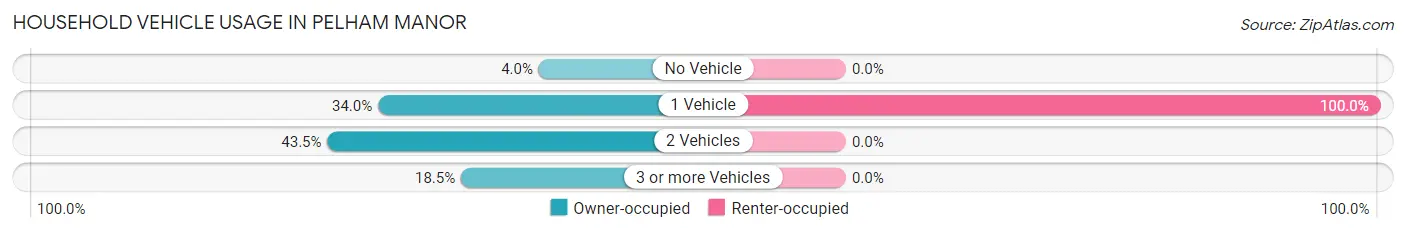
| Vehicles per Household | Owner-occupied | Renter-occupied |
| No Vehicle | 73 (4.0%) | 0 (0.0%) |
| 1 Vehicle | 621 (34.0%) | 151 (100.0%) |
| 2 Vehicles | 794 (43.5%) | 0 (0.0%) |
| 3 or more Vehicles | 338 (18.5%) | 0 (0.0%) |
| Total | 1,826 (100.0%) | 151 (100.0%) |
Real Estate & Mortgages in Pelham Manor
Real Estate and Mortgage Overview in Pelham Manor
| Characteristic | Without Mortgage | With Mortgage |
| Housing Units | 570 | 1,256 |
| Median Property Value | $953,900 | $1,060,400 |
| Median Household Income | $215,385 | $1,018 |
| Monthly Housing Costs | $1,501 | $1,050 |
| Real Estate Taxes | $10,001 | $48 |
Property Value by Mortgage Status in Pelham Manor
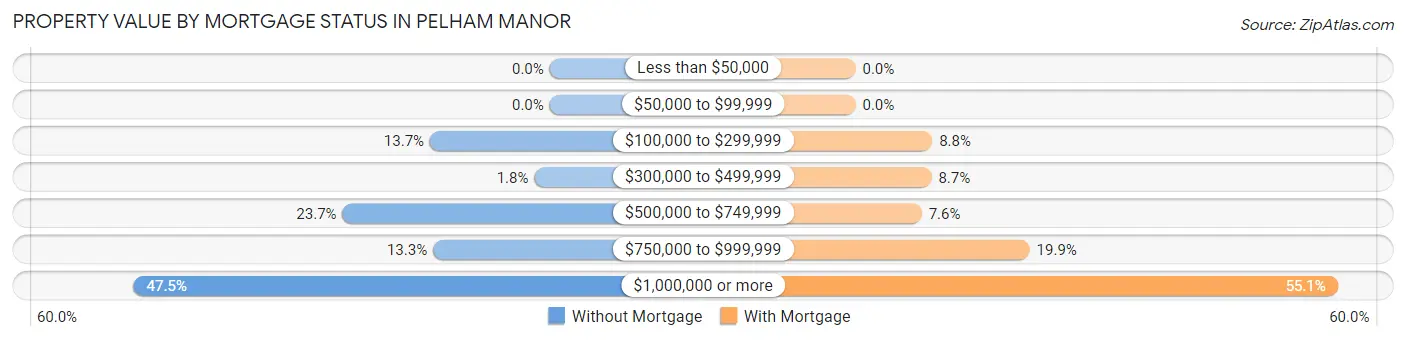
| Property Value | Without Mortgage | With Mortgage |
| Less than $50,000 | 0 (0.0%) | 0 (0.0%) |
| $50,000 to $99,999 | 0 (0.0%) | 0 (0.0%) |
| $100,000 to $299,999 | 78 (13.7%) | 110 (8.8%) |
| $300,000 to $499,999 | 10 (1.8%) | 109 (8.7%) |
| $500,000 to $749,999 | 135 (23.7%) | 95 (7.6%) |
| $750,000 to $999,999 | 76 (13.3%) | 250 (19.9%) |
| $1,000,000 or more | 271 (47.5%) | 692 (55.1%) |
| Total | 570 (100.0%) | 1,256 (100.0%) |
Household Income by Mortgage Status in Pelham Manor
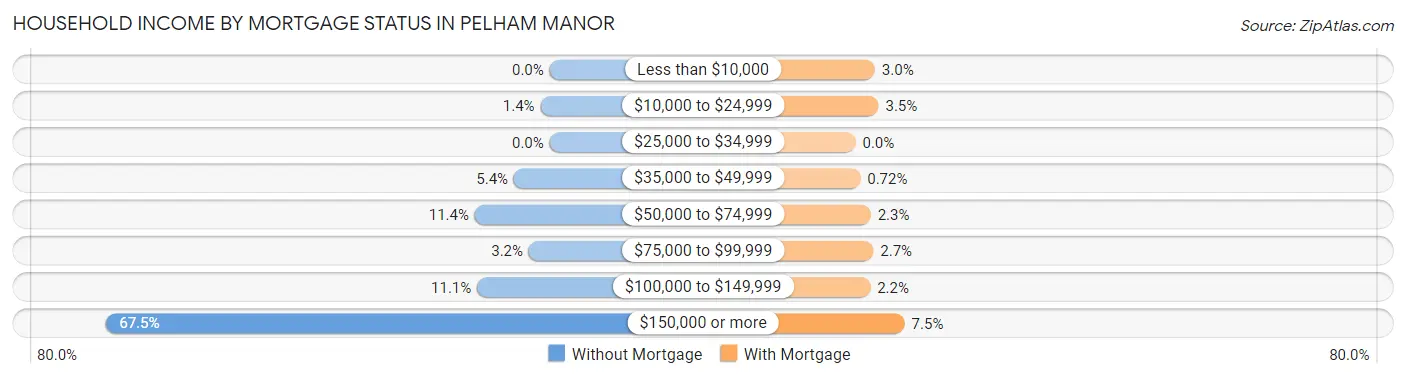
| Household Income | Without Mortgage | With Mortgage |
| Less than $10,000 | 0 (0.0%) | 37 (2.9%) |
| $10,000 to $24,999 | 8 (1.4%) | 44 (3.5%) |
| $25,000 to $34,999 | 0 (0.0%) | 0 (0.0%) |
| $35,000 to $49,999 | 31 (5.4%) | 9 (0.7%) |
| $50,000 to $74,999 | 65 (11.4%) | 29 (2.3%) |
| $75,000 to $99,999 | 18 (3.2%) | 34 (2.7%) |
| $100,000 to $149,999 | 63 (11.1%) | 28 (2.2%) |
| $150,000 or more | 385 (67.5%) | 94 (7.5%) |
| Total | 570 (100.0%) | 1,256 (100.0%) |
Property Value to Household Income Ratio in Pelham Manor
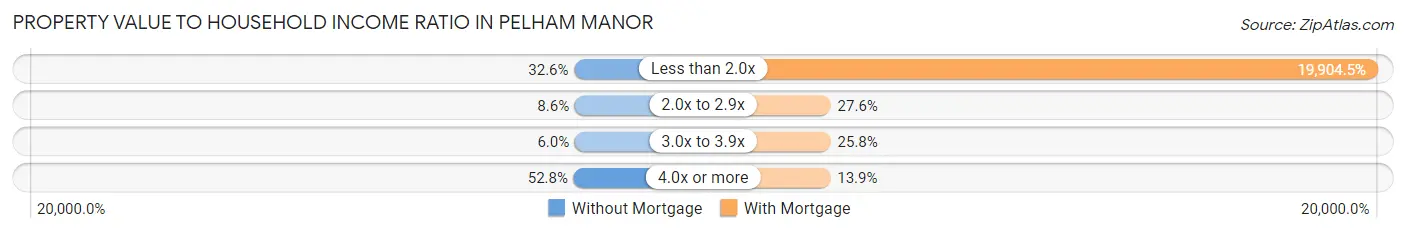
| Value-to-Income Ratio | Without Mortgage | With Mortgage |
| Less than 2.0x | 186 (32.6%) | 250,001 (19,904.5%) |
| 2.0x to 2.9x | 49 (8.6%) | 346 (27.6%) |
| 3.0x to 3.9x | 34 (6.0%) | 324 (25.8%) |
| 4.0x or more | 301 (52.8%) | 175 (13.9%) |
| Total | 570 (100.0%) | 1,256 (100.0%) |
Real Estate Taxes by Mortgage Status in Pelham Manor
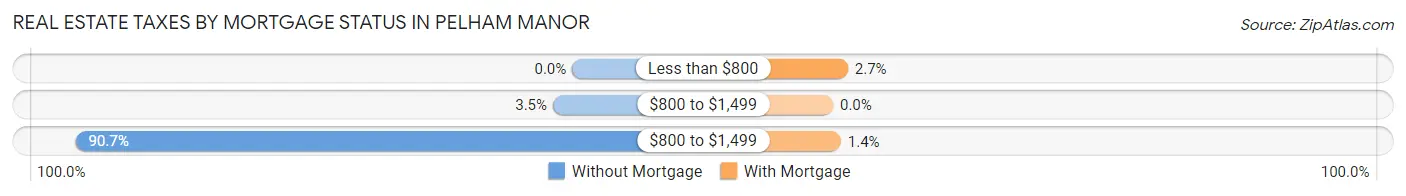
| Property Taxes | Without Mortgage | With Mortgage |
| Less than $800 | 0 (0.0%) | 34 (2.7%) |
| $800 to $1,499 | 20 (3.5%) | 0 (0.0%) |
| $800 to $1,499 | 517 (90.7%) | 18 (1.4%) |
| Total | 570 (100.0%) | 1,256 (100.0%) |
Health & Disability in Pelham Manor
Health Insurance Coverage by Age in Pelham Manor
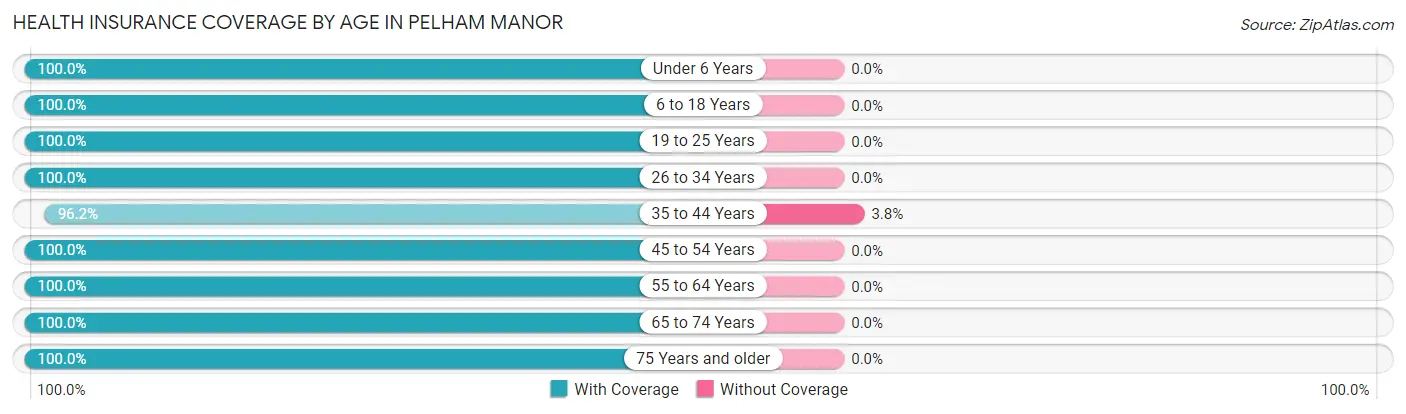
| Age Bracket | With Coverage | Without Coverage |
| Under 6 Years | 322 (100.0%) | 0 (0.0%) |
| 6 to 18 Years | 1,472 (100.0%) | 0 (0.0%) |
| 19 to 25 Years | 260 (100.0%) | 0 (0.0%) |
| 26 to 34 Years | 319 (100.0%) | 0 (0.0%) |
| 35 to 44 Years | 871 (96.2%) | 34 (3.8%) |
| 45 to 54 Years | 793 (100.0%) | 0 (0.0%) |
| 55 to 64 Years | 729 (100.0%) | 0 (0.0%) |
| 65 to 74 Years | 494 (100.0%) | 0 (0.0%) |
| 75 Years and older | 388 (100.0%) | 0 (0.0%) |
| Total | 5,648 (99.4%) | 34 (0.6%) |
Health Insurance Coverage by Citizenship Status in Pelham Manor
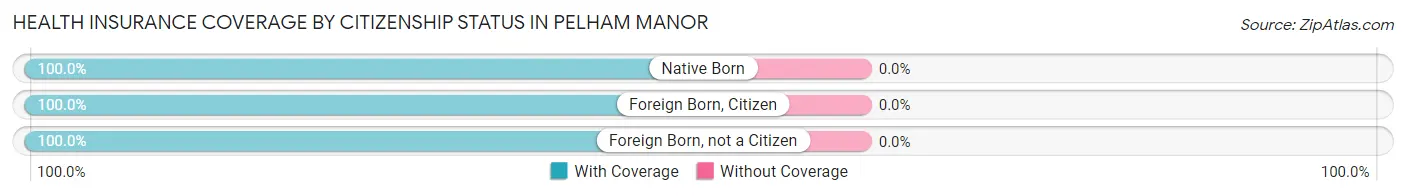
| Citizenship Status | With Coverage | Without Coverage |
| Native Born | 322 (100.0%) | 0 (0.0%) |
| Foreign Born, Citizen | 1,472 (100.0%) | 0 (0.0%) |
| Foreign Born, not a Citizen | 260 (100.0%) | 0 (0.0%) |
Health Insurance Coverage by Household Income in Pelham Manor
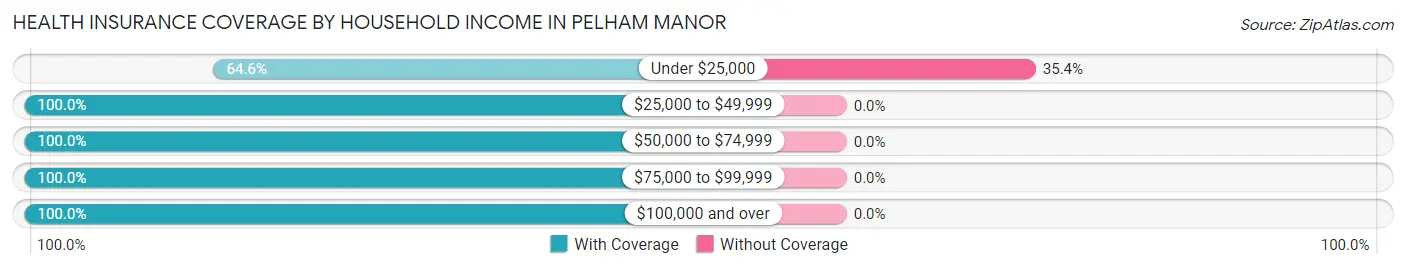
| Household Income | With Coverage | Without Coverage |
| Under $25,000 | 62 (64.6%) | 34 (35.4%) |
| $25,000 to $49,999 | 69 (100.0%) | 0 (0.0%) |
| $50,000 to $74,999 | 125 (100.0%) | 0 (0.0%) |
| $75,000 to $99,999 | 97 (100.0%) | 0 (0.0%) |
| $100,000 and over | 5,264 (100.0%) | 0 (0.0%) |
Public vs Private Health Insurance Coverage by Age in Pelham Manor
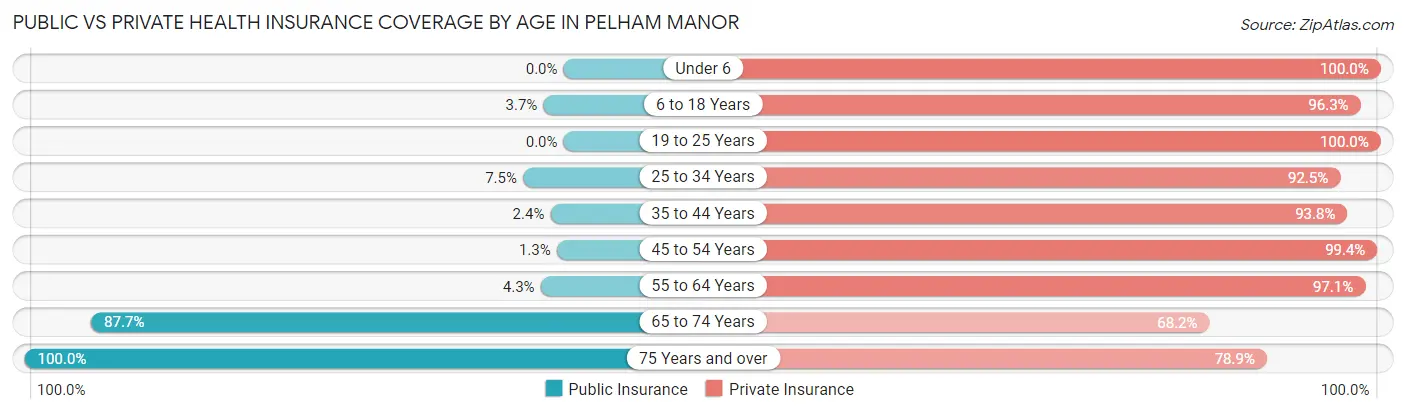
| Age Bracket | Public Insurance | Private Insurance |
| Under 6 | 0 (0.0%) | 322 (100.0%) |
| 6 to 18 Years | 55 (3.7%) | 1,417 (96.3%) |
| 19 to 25 Years | 0 (0.0%) | 260 (100.0%) |
| 25 to 34 Years | 24 (7.5%) | 295 (92.5%) |
| 35 to 44 Years | 22 (2.4%) | 849 (93.8%) |
| 45 to 54 Years | 10 (1.3%) | 788 (99.4%) |
| 55 to 64 Years | 31 (4.3%) | 708 (97.1%) |
| 65 to 74 Years | 433 (87.6%) | 337 (68.2%) |
| 75 Years and over | 388 (100.0%) | 306 (78.9%) |
| Total | 963 (17.0%) | 5,282 (93.0%) |
Disability Status by Sex by Age in Pelham Manor
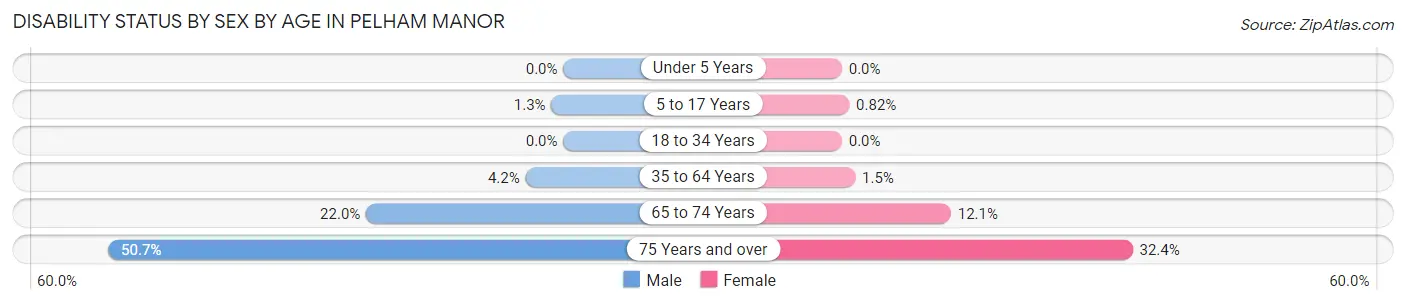
| Age Bracket | Male | Female |
| Under 5 Years | 0 (0.0%) | 0 (0.0%) |
| 5 to 17 Years | 11 (1.3%) | 5 (0.8%) |
| 18 to 34 Years | 0 (0.0%) | 0 (0.0%) |
| 35 to 64 Years | 48 (4.2%) | 19 (1.5%) |
| 65 to 74 Years | 47 (22.0%) | 34 (12.1%) |
| 75 Years and over | 73 (50.7%) | 79 (32.4%) |
Disability Class by Sex by Age in Pelham Manor
Disability Class: Hearing Difficulty
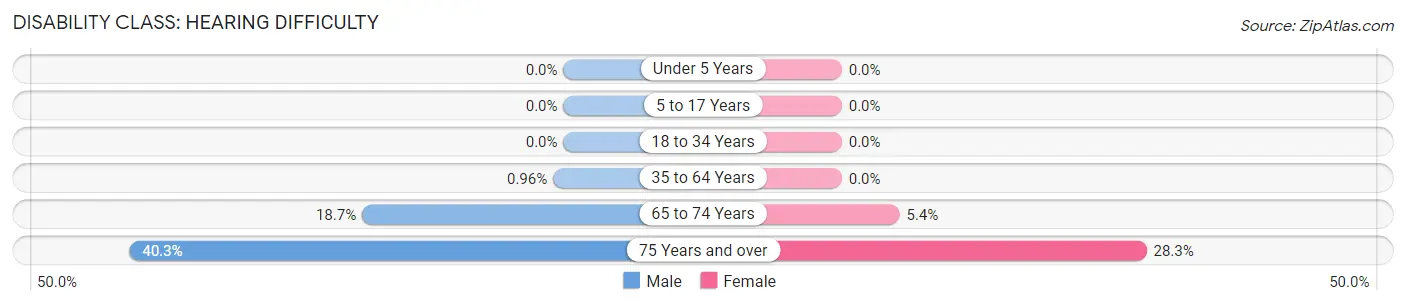
| Age Bracket | Male | Female |
| Under 5 Years | 0 (0.0%) | 0 (0.0%) |
| 5 to 17 Years | 0 (0.0%) | 0 (0.0%) |
| 18 to 34 Years | 0 (0.0%) | 0 (0.0%) |
| 35 to 64 Years | 11 (1.0%) | 0 (0.0%) |
| 65 to 74 Years | 40 (18.7%) | 15 (5.4%) |
| 75 Years and over | 58 (40.3%) | 69 (28.3%) |
Disability Class: Vision Difficulty
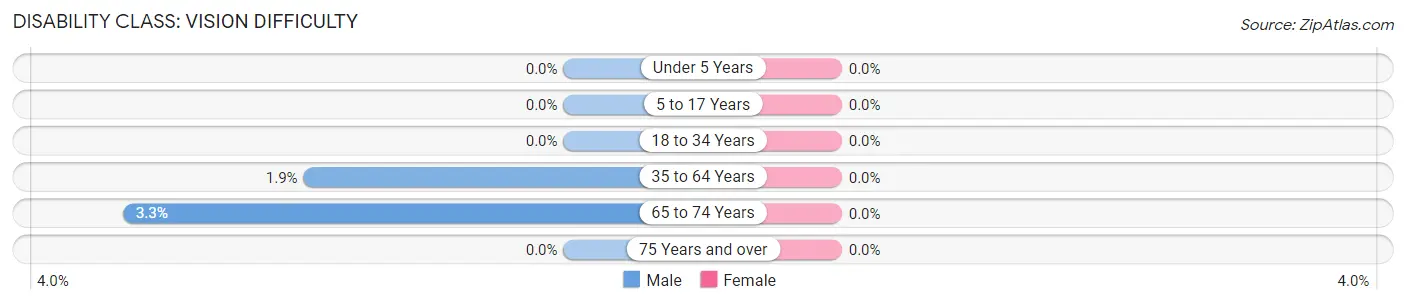
| Age Bracket | Male | Female |
| Under 5 Years | 0 (0.0%) | 0 (0.0%) |
| 5 to 17 Years | 0 (0.0%) | 0 (0.0%) |
| 18 to 34 Years | 0 (0.0%) | 0 (0.0%) |
| 35 to 64 Years | 22 (1.9%) | 0 (0.0%) |
| 65 to 74 Years | 7 (3.3%) | 0 (0.0%) |
| 75 Years and over | 0 (0.0%) | 0 (0.0%) |
Disability Class: Cognitive Difficulty
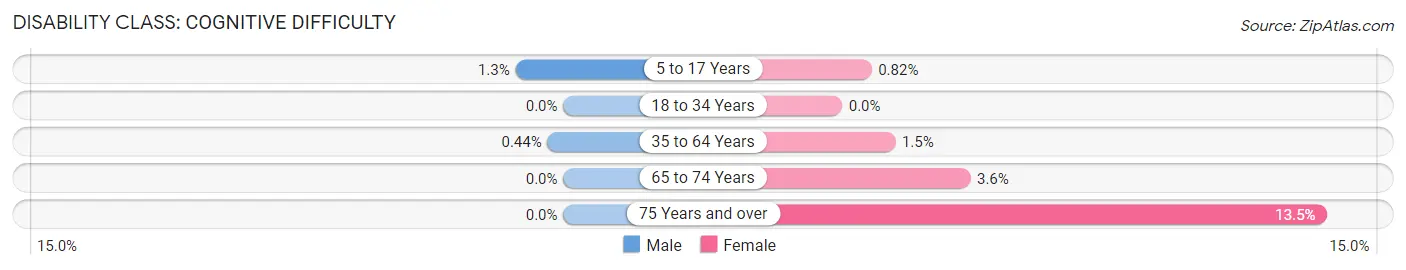
| Age Bracket | Male | Female |
| 5 to 17 Years | 11 (1.3%) | 5 (0.8%) |
| 18 to 34 Years | 0 (0.0%) | 0 (0.0%) |
| 35 to 64 Years | 5 (0.4%) | 19 (1.5%) |
| 65 to 74 Years | 0 (0.0%) | 10 (3.6%) |
| 75 Years and over | 0 (0.0%) | 33 (13.5%) |
Disability Class: Ambulatory Difficulty
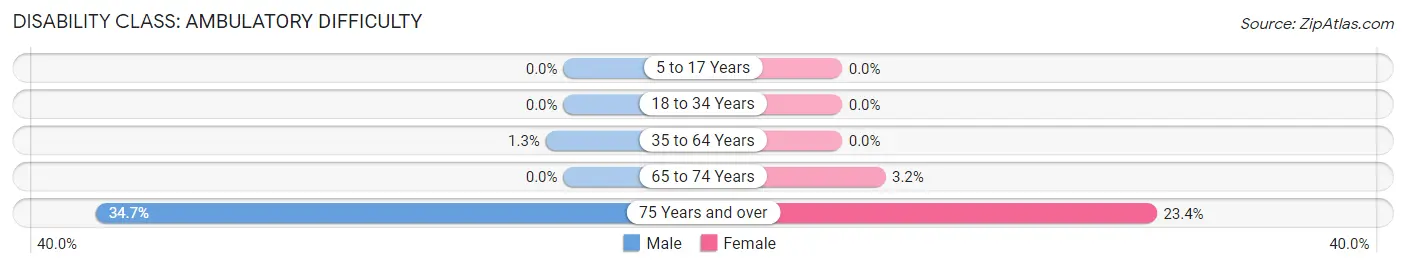
| Age Bracket | Male | Female |
| 5 to 17 Years | 0 (0.0%) | 0 (0.0%) |
| 18 to 34 Years | 0 (0.0%) | 0 (0.0%) |
| 35 to 64 Years | 15 (1.3%) | 0 (0.0%) |
| 65 to 74 Years | 0 (0.0%) | 9 (3.2%) |
| 75 Years and over | 50 (34.7%) | 57 (23.4%) |
Disability Class: Self-Care Difficulty
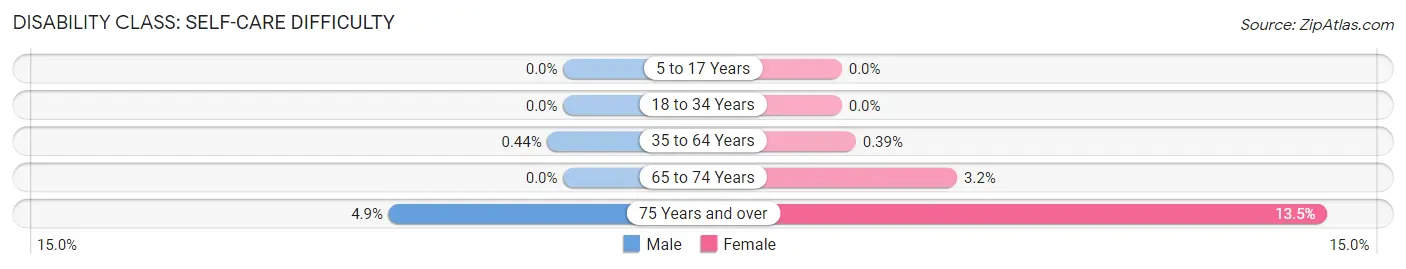
| Age Bracket | Male | Female |
| 5 to 17 Years | 0 (0.0%) | 0 (0.0%) |
| 18 to 34 Years | 0 (0.0%) | 0 (0.0%) |
| 35 to 64 Years | 5 (0.4%) | 5 (0.4%) |
| 65 to 74 Years | 0 (0.0%) | 9 (3.2%) |
| 75 Years and over | 7 (4.9%) | 33 (13.5%) |
Technology Access in Pelham Manor
Computing Device Access in Pelham Manor
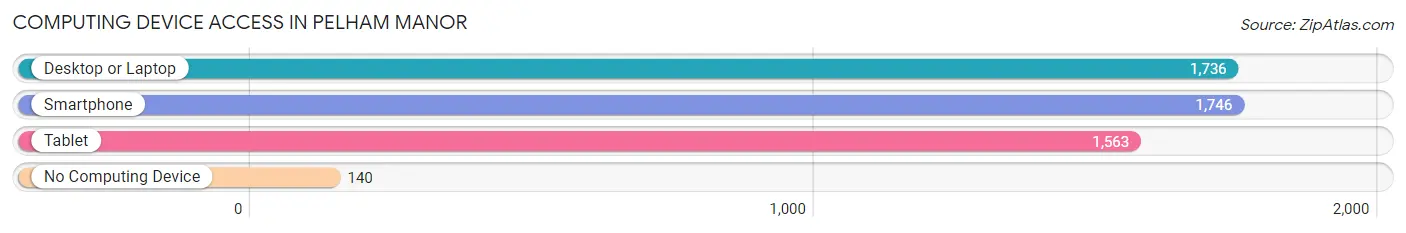
| Device Type | # Households | % Households |
| Desktop or Laptop | 1,736 | 87.8% |
| Smartphone | 1,746 | 88.3% |
| Tablet | 1,563 | 79.1% |
| No Computing Device | 140 | 7.1% |
| Total | 1,977 | 100.0% |
Internet Access in Pelham Manor
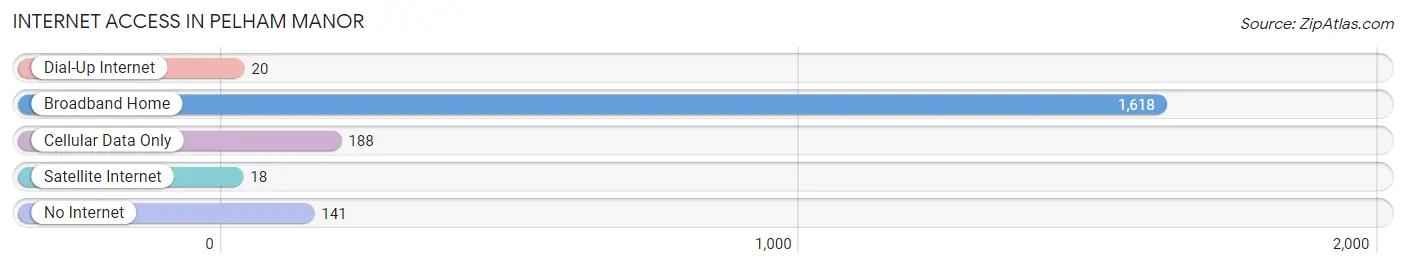
| Internet Type | # Households | % Households |
| Dial-Up Internet | 20 | 1.0% |
| Broadband Home | 1,618 | 81.8% |
| Cellular Data Only | 188 | 9.5% |
| Satellite Internet | 18 | 0.9% |
| No Internet | 141 | 7.1% |
| Total | 1,977 | 100.0% |
Pelham Manor Summary
Pelham Manor is a village located in Westchester County, New York, United States. It is part of the town of Pelham, which also includes the village of Pelham and the hamlet of Pelham Bay. The village is located in the northeast corner of the town, and is bordered by the city of New Rochelle to the north, the village of Pelham to the south, and the Hutchinson River to the east. As of the 2010 census, the village had a population of 5,486.
History
The area that is now Pelham Manor was originally inhabited by the Siwanoy Native American tribe. The first European settlers arrived in the area in 1654, when Thomas Pell purchased the land from the Siwanoy. The area was known as the Manor of Pelham, and was part of the town of Pelham. In 1891, the village of Pelham Manor was incorporated.
Geography
Pelham Manor is located at 40°52'25" North, 73°48'17" West (40.873611, -73.804722). According to the United States Census Bureau, the village has a total area of 1.2 square miles (3.1 km2), all of it land.
Economy
The economy of Pelham Manor is largely based on the service industry. The village is home to a variety of restaurants, retail stores, and professional services. The village is also home to a number of corporate offices, including those of the New York Times, the New York Post, and the New York Daily News.
Demographics
As of the 2010 census, there were 5,486 people, 2,072 households, and 1,541 families residing in the village. The population density was 4,541.7 people per square mile (1,753.2/km2). The racial makeup of the village was 87.2% White, 5.2% African American, 0.2% Native American, 4.2% Asian, 0.1% Pacific Islander, 1.2% from other races, and 2.1% from two or more races. Hispanic or Latino of any race were 5.7% of the population.
The median income for a household in the village was $117,917, and the median income for a family was $136,917. Males had a median income of $100,000 versus $60,000 for females. The per capita income for the village was $60,917. About 2.2% of families and 3.2% of the population were below the poverty line, including 3.7% of those under age 18 and 2.2% of those age 65 or over.
Common Questions
What is Per Capita Income in Pelham Manor?
Per Capita income in Pelham Manor is $128,831.
What is the Median Family Income in Pelham Manor?
Median Family Income in Pelham Manor is $250,001.
What is the Median Household income in Pelham Manor?
Median Household Income in Pelham Manor is $250,001.
What is Income or Wage Gap in Pelham Manor?
Income or Wage Gap in Pelham Manor is 42.1%.
Women in Pelham Manor earn 57.9 cents for every dollar earned by a man.
What is Inequality or Gini Index in Pelham Manor?
Inequality or Gini Index in Pelham Manor is 0.46.
What is the Total Population of Pelham Manor?
Total Population of Pelham Manor is 5,682.
What is the Total Male Population of Pelham Manor?
Total Male Population of Pelham Manor is 2,729.
What is the Total Female Population of Pelham Manor?
Total Female Population of Pelham Manor is 2,953.
What is the Ratio of Males per 100 Females in Pelham Manor?
There are 92.41 Males per 100 Females in Pelham Manor.
What is the Ratio of Females per 100 Males in Pelham Manor?
There are 108.21 Females per 100 Males in Pelham Manor.
What is the Median Population Age in Pelham Manor?
Median Population Age in Pelham Manor is 40.4 Years.
What is the Average Family Size in Pelham Manor
Average Family Size in Pelham Manor is 3.4 People.
What is the Average Household Size in Pelham Manor
Average Household Size in Pelham Manor is 2.9 People.
How Large is the Labor Force in Pelham Manor?
There are 2,724 People in the Labor Forcein in Pelham Manor.
What is the Percentage of People in the Labor Force in Pelham Manor?
65.3% of People are in the Labor Force in Pelham Manor.
What is the Unemployment Rate in Pelham Manor?
Unemployment Rate in Pelham Manor is 5.2%.