Pleasantville, NY Map & Demographics
Pleasantville Map
Pleasantville Overview
$80,691
PER CAPITA INCOME
$229,682
AVG FAMILY INCOME
$167,841
AVG HOUSEHOLD INCOME
20.8%
WAGE / INCOME GAP [ % ]
79.2¢/ $1
WAGE / INCOME GAP [ $ ]
0.47
INEQUALITY / GINI INDEX
7,430
TOTAL POPULATION
3,827
MALE POPULATION
3,603
FEMALE POPULATION
106.22
MALES / 100 FEMALES
94.15
FEMALES / 100 MALES
42.3
MEDIAN AGE
3.3
AVG FAMILY SIZE
2.8
AVG HOUSEHOLD SIZE
3,988
LABOR FORCE [ PEOPLE ]
67.7%
PERCENT IN LABOR FORCE
5.8%
UNEMPLOYMENT RATE
Pleasantville Zip Codes
Pleasantville Area Codes
Income in Pleasantville
Income Overview in Pleasantville
Per Capita Income in Pleasantville is $80,691, while median incomes of families and households are $229,682 and $167,841 respectively.
| Characteristic | Number | Measure |
| Per Capita Income | 7,430 | $80,691 |
| Median Family Income | 1,838 | $229,682 |
| Mean Family Income | 1,838 | $285,599 |
| Median Household Income | 2,609 | $167,841 |
| Mean Household Income | 2,609 | $228,179 |
| Income Deficit | 1,838 | $0 |
| Wage / Income Gap (%) | 7,430 | 20.83% |
| Wage / Income Gap ($) | 7,430 | 79.17¢ per $1 |
| Gini / Inequality Index | 7,430 | 0.47 |
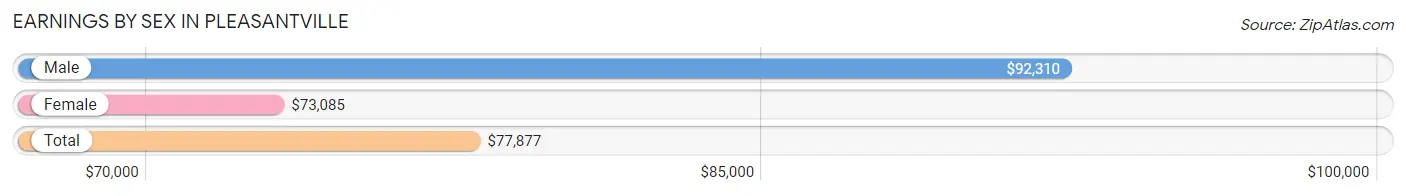
Earnings by Sex in Pleasantville
Average Earnings in Pleasantville are $77,877, $92,310 for men and $73,085 for women, a difference of 20.8%.
| Sex | Number | Average Earnings |
| Male | 2,236 (54.2%) | $92,310 |
| Female | 1,887 (45.8%) | $73,085 |
| Total | 4,123 (100.0%) | $77,877 |
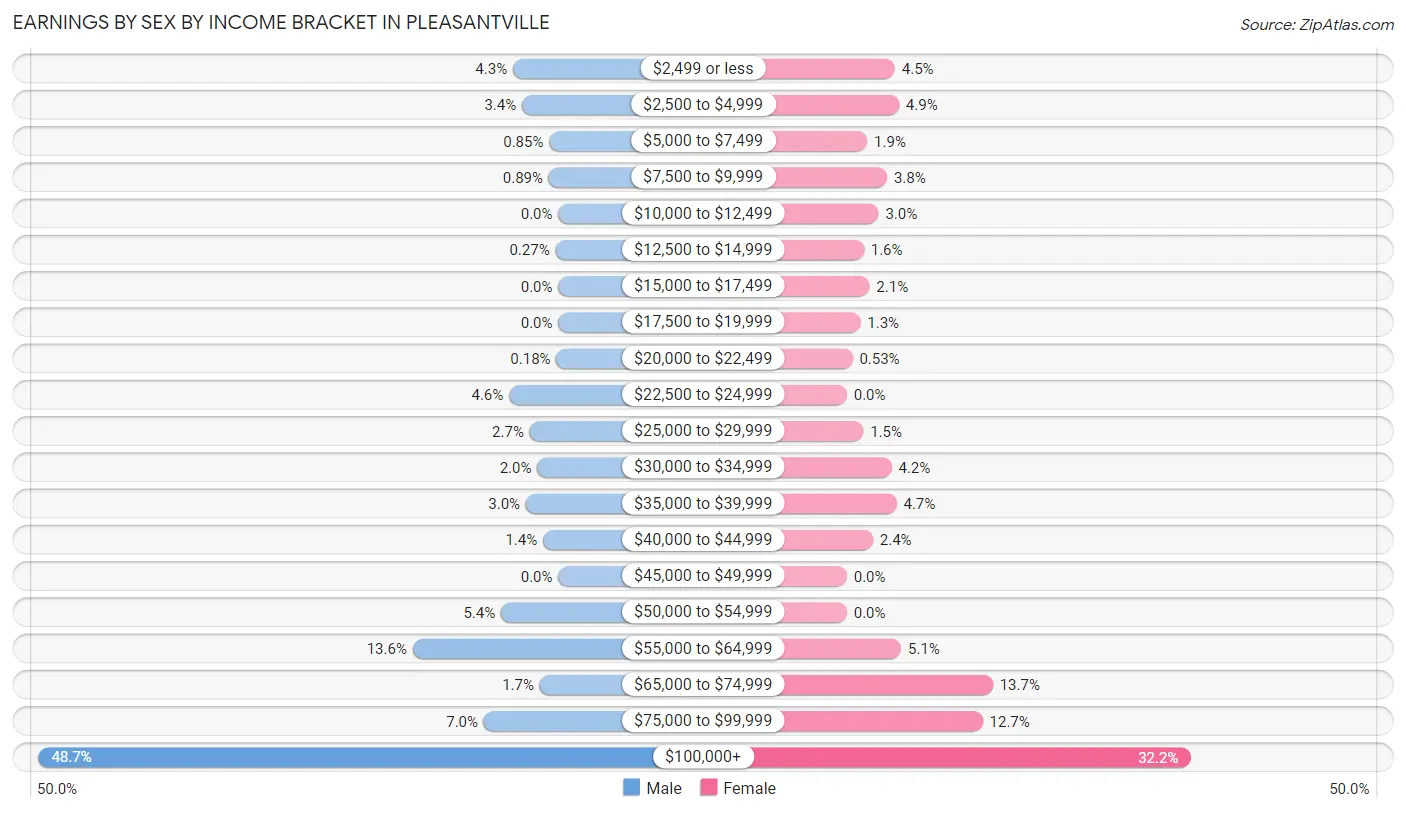
Earnings by Sex by Income Bracket in Pleasantville
The most common earnings brackets in Pleasantville are $100,000+ for men (1,089 | 48.7%) and $100,000+ for women (607 | 32.2%).
| Income | Male | Female |
| $2,499 or less | 95 (4.3%) | 85 (4.5%) |
| $2,500 to $4,999 | 76 (3.4%) | 92 (4.9%) |
| $5,000 to $7,499 | 19 (0.9%) | 36 (1.9%) |
| $7,500 to $9,999 | 20 (0.9%) | 71 (3.8%) |
| $10,000 to $12,499 | 0 (0.0%) | 56 (3.0%) |
| $12,500 to $14,999 | 6 (0.3%) | 30 (1.6%) |
| $15,000 to $17,499 | 0 (0.0%) | 40 (2.1%) |
| $17,500 to $19,999 | 0 (0.0%) | 24 (1.3%) |
| $20,000 to $22,499 | 4 (0.2%) | 10 (0.5%) |
| $22,500 to $24,999 | 103 (4.6%) | 0 (0.0%) |
| $25,000 to $29,999 | 60 (2.7%) | 29 (1.5%) |
| $30,000 to $34,999 | 44 (2.0%) | 79 (4.2%) |
| $35,000 to $39,999 | 68 (3.0%) | 88 (4.7%) |
| $40,000 to $44,999 | 32 (1.4%) | 46 (2.4%) |
| $45,000 to $49,999 | 0 (0.0%) | 0 (0.0%) |
| $50,000 to $54,999 | 120 (5.4%) | 0 (0.0%) |
| $55,000 to $64,999 | 305 (13.6%) | 96 (5.1%) |
| $65,000 to $74,999 | 39 (1.7%) | 258 (13.7%) |
| $75,000 to $99,999 | 156 (7.0%) | 240 (12.7%) |
| $100,000+ | 1,089 (48.7%) | 607 (32.2%) |
| Total | 2,236 (100.0%) | 1,887 (100.0%) |
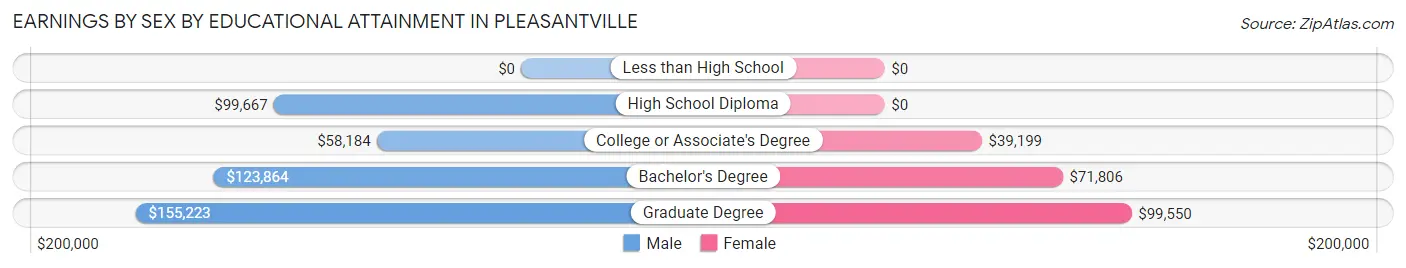
Earnings by Sex by Educational Attainment in Pleasantville
Average earnings in Pleasantville are $113,421 for men and $75,139 for women, a difference of 33.8%. Men with an educational attainment of graduate degree enjoy the highest average annual earnings of $155,223, while those with college or associate's degree education earn the least with $58,184. Women with an educational attainment of graduate degree earn the most with the average annual earnings of $99,550, while those with college or associate's degree education have the smallest earnings of $39,199.
| Educational Attainment | Male Income | Female Income |
| Less than High School | - | - |
| High School Diploma | $99,667 | $0 |
| College or Associate's Degree | $58,184 | $39,199 |
| Bachelor's Degree | $123,864 | $71,806 |
| Graduate Degree | $155,223 | $99,550 |
| Total | $113,421 | $75,139 |
Family Income in Pleasantville
Family Income Brackets in Pleasantville
According to the Pleasantville family income data, there are 1,049 families falling into the $200,000+ income range, which is the most common income bracket and makes up 57.1% of all families.
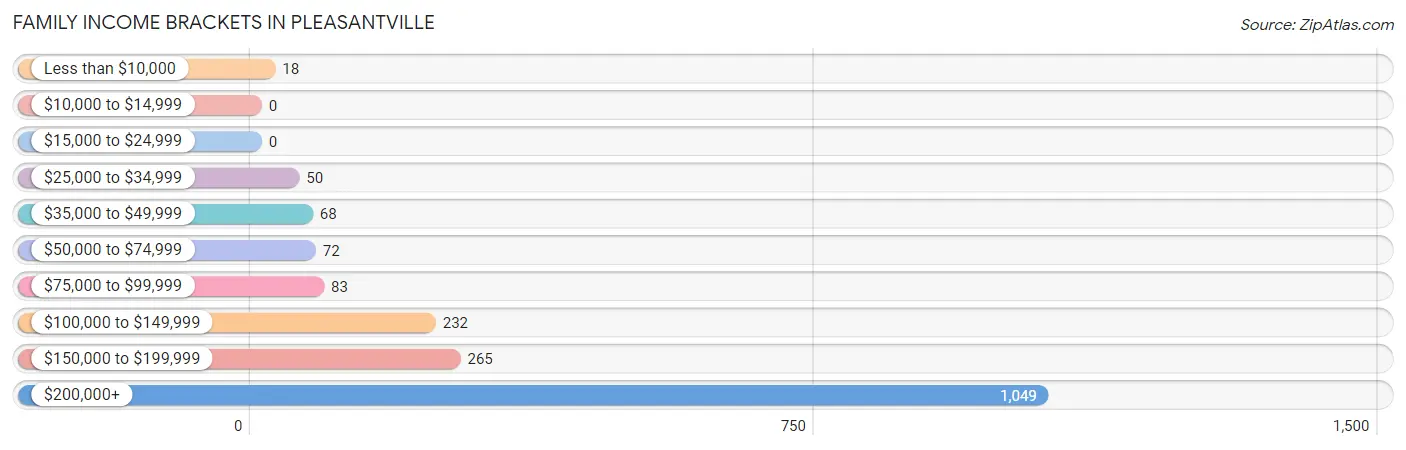
| Income Bracket | # Families | % Families |
| Less than $10,000 | 18 | 1.0% |
| $10,000 to $14,999 | 0 | 0.0% |
| $15,000 to $24,999 | 0 | 0.0% |
| $25,000 to $34,999 | 50 | 2.7% |
| $35,000 to $49,999 | 68 | 3.7% |
| $50,000 to $74,999 | 72 | 3.9% |
| $75,000 to $99,999 | 83 | 4.5% |
| $100,000 to $149,999 | 232 | 12.6% |
| $150,000 to $199,999 | 265 | 14.4% |
| $200,000+ | 1,049 | 57.1% |
Family Income by Famaliy Size in Pleasantville
3-person families (558 | 30.4%) account for the highest median family income in Pleasantville with $250,001 per family, while 2-person families (536 | 29.2%) have the highest median income of $86,058 per family member.
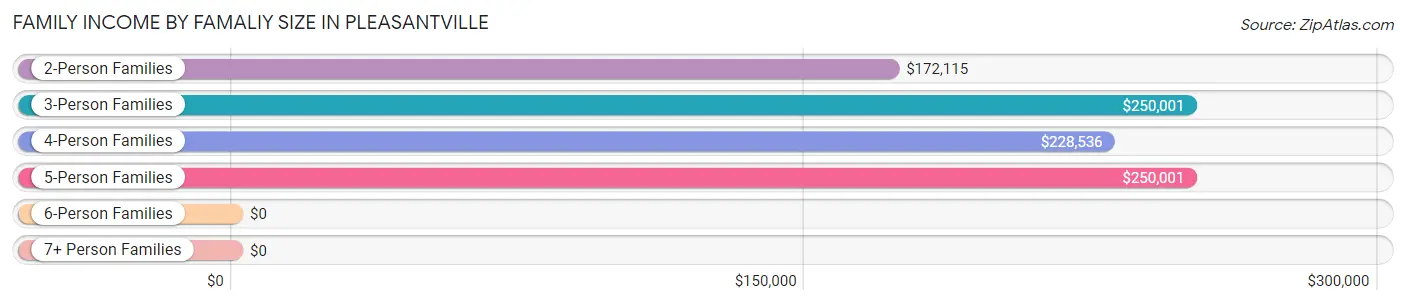
| Income Bracket | # Families | Median Income |
| 2-Person Families | 536 (29.2%) | $172,115 |
| 3-Person Families | 558 (30.4%) | $250,001 |
| 4-Person Families | 551 (30.0%) | $228,536 |
| 5-Person Families | 130 (7.1%) | $250,001 |
| 6-Person Families | 9 (0.5%) | $0 |
| 7+ Person Families | 54 (2.9%) | $0 |
| Total | 1,838 (100.0%) | $229,682 |
Family Income by Number of Earners in Pleasantville
The median family income in Pleasantville is $229,682, with families comprising 2 earners (679) having the highest median family income of $250,001, while families with no earners (87) have the lowest median family income of $114,750, accounting for 36.9% and 4.7% of families, respectively.
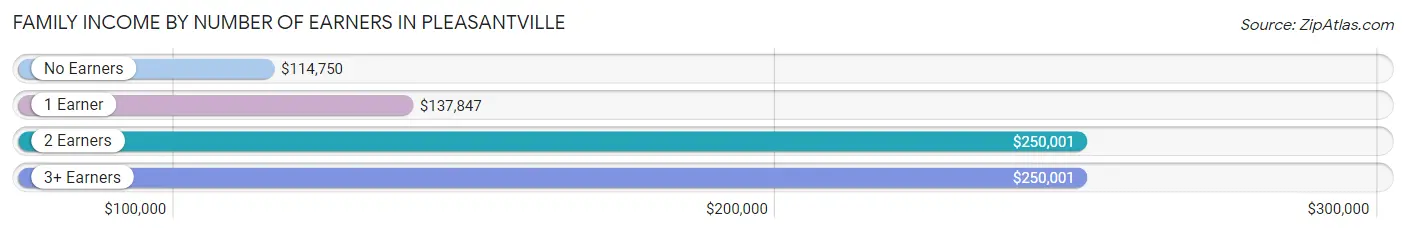
| Number of Earners | # Families | Median Income |
| No Earners | 87 (4.7%) | $114,750 |
| 1 Earner | 661 (36.0%) | $137,847 |
| 2 Earners | 679 (36.9%) | $250,001 |
| 3+ Earners | 411 (22.4%) | $250,001 |
| Total | 1,838 (100.0%) | $229,682 |
Household Income in Pleasantville
Household Income Brackets in Pleasantville
With 1,080 households falling in the category, the $200,000+ income range is the most frequent in Pleasantville, accounting for 41.4% of all households. In contrast, only 13 households (0.5%) fall into the $10,000 to $14,999 income bracket, making it the least populous group.
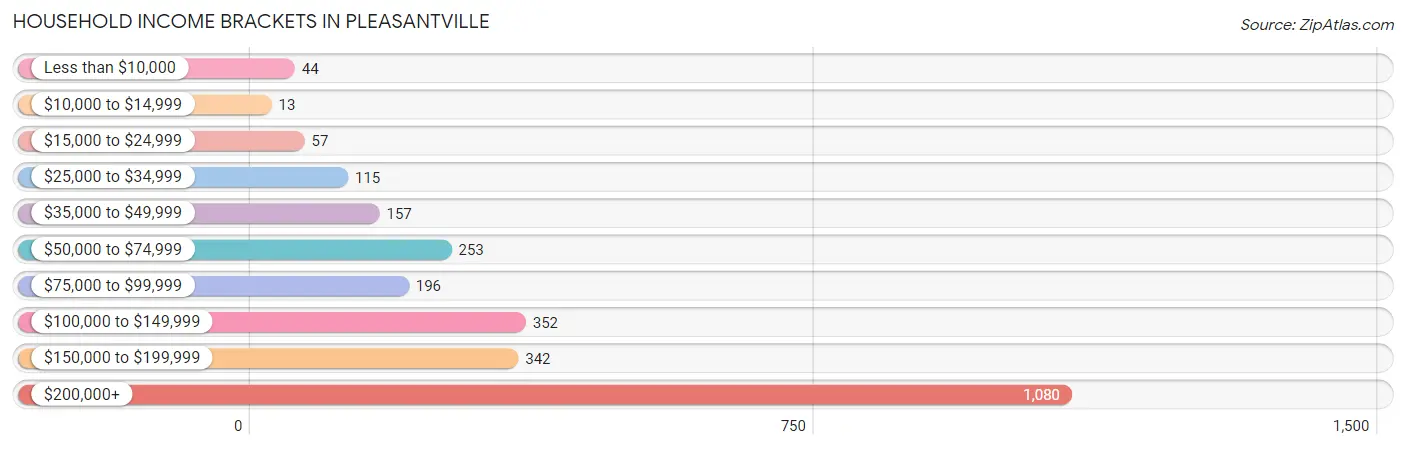
| Income Bracket | # Households | % Households |
| Less than $10,000 | 44 | 1.7% |
| $10,000 to $14,999 | 13 | 0.5% |
| $15,000 to $24,999 | 57 | 2.2% |
| $25,000 to $34,999 | 115 | 4.4% |
| $35,000 to $49,999 | 157 | 6.0% |
| $50,000 to $74,999 | 253 | 9.7% |
| $75,000 to $99,999 | 196 | 7.5% |
| $100,000 to $149,999 | 352 | 13.5% |
| $150,000 to $199,999 | 342 | 13.1% |
| $200,000+ | 1,080 | 41.4% |
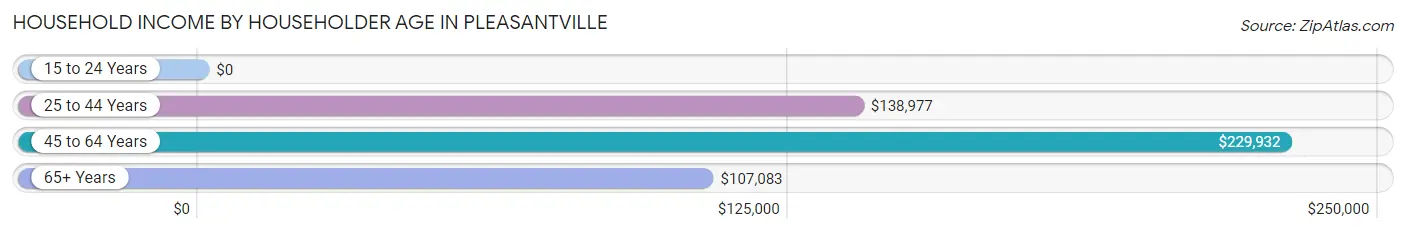
Household Income by Householder Age in Pleasantville
The median household income in Pleasantville is $167,841, with the highest median household income of $229,932 found in the 45 to 64 years age bracket for the primary householder. A total of 1,247 households (47.8%) fall into this category.
| Income Bracket | # Households | Median Income |
| 15 to 24 Years | 0 (0.0%) | $0 |
| 25 to 44 Years | 585 (22.4%) | $138,977 |
| 45 to 64 Years | 1,247 (47.8%) | $229,932 |
| 65+ Years | 777 (29.8%) | $107,083 |
| Total | 2,609 (100.0%) | $167,841 |
Poverty in Pleasantville
Income Below Poverty by Sex and Age in Pleasantville
With 3.3% poverty level for males and 7.1% for females among the residents of Pleasantville, 75 year old and over males and 12 to 14 year old females are the most vulnerable to poverty, with 23 males (18.2%) and 49 females (38.3%) in their respective age groups living below the poverty level.
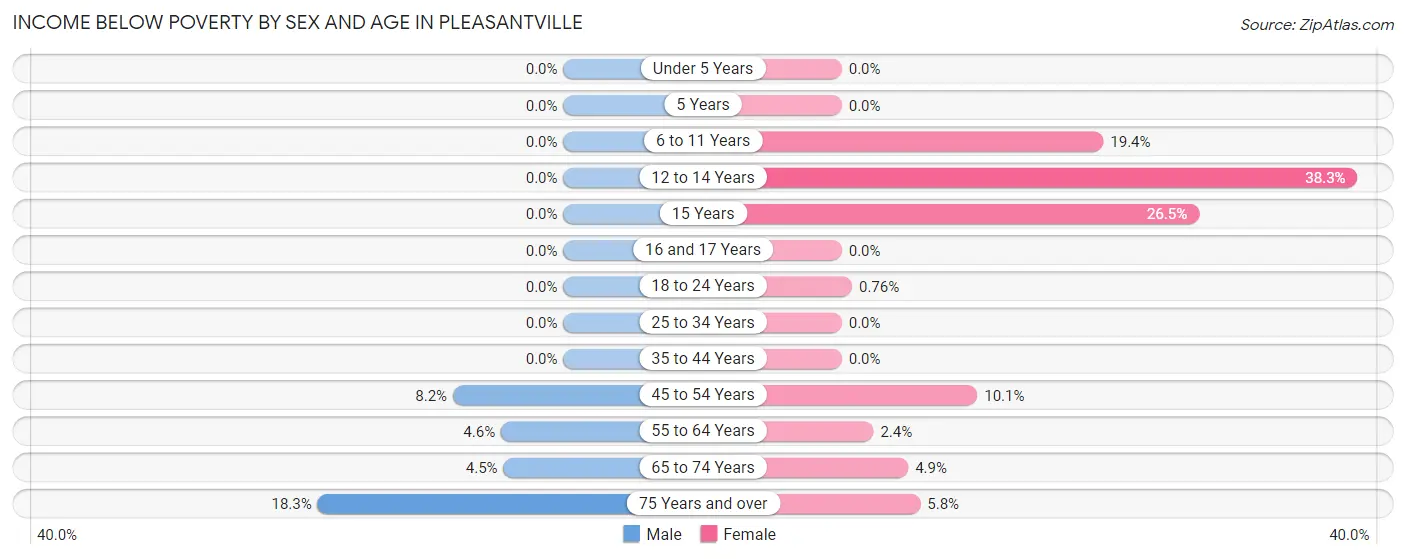
| Age Bracket | Male | Female |
| Under 5 Years | 0 (0.0%) | 0 (0.0%) |
| 5 Years | 0 (0.0%) | 0 (0.0%) |
| 6 to 11 Years | 0 (0.0%) | 47 (19.4%) |
| 12 to 14 Years | 0 (0.0%) | 49 (38.3%) |
| 15 Years | 0 (0.0%) | 35 (26.5%) |
| 16 and 17 Years | 0 (0.0%) | 0 (0.0%) |
| 18 to 24 Years | 0 (0.0%) | 2 (0.8%) |
| 25 to 34 Years | 0 (0.0%) | 0 (0.0%) |
| 35 to 44 Years | 0 (0.0%) | 0 (0.0%) |
| 45 to 54 Years | 62 (8.2%) | 72 (10.1%) |
| 55 to 64 Years | 15 (4.6%) | 11 (2.4%) |
| 65 to 74 Years | 21 (4.4%) | 15 (4.9%) |
| 75 Years and over | 23 (18.2%) | 19 (5.8%) |
| Total | 121 (3.3%) | 250 (7.1%) |
Income Above Poverty by Sex and Age in Pleasantville
According to the poverty statistics in Pleasantville, males aged under 5 years and females aged under 5 years are the age groups that are most secure financially, with 100.0% of males and 100.0% of females in these age groups living above the poverty line.
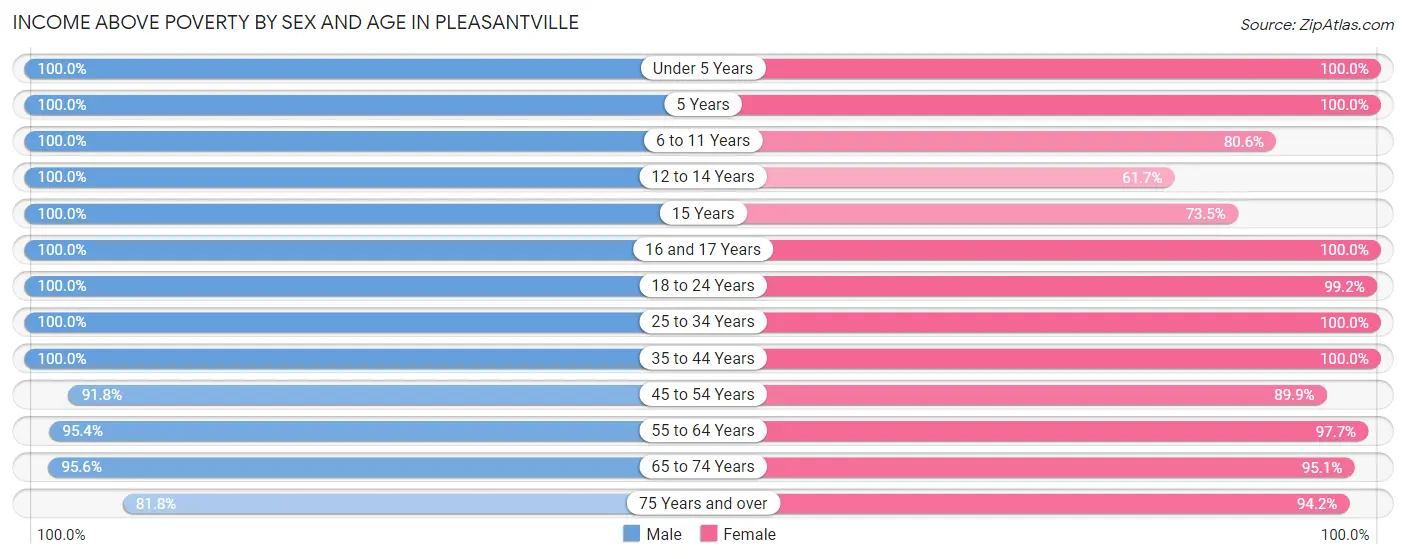
| Age Bracket | Male | Female |
| Under 5 Years | 303 (100.0%) | 41 (100.0%) |
| 5 Years | 25 (100.0%) | 17 (100.0%) |
| 6 to 11 Years | 339 (100.0%) | 195 (80.6%) |
| 12 to 14 Years | 85 (100.0%) | 79 (61.7%) |
| 15 Years | 98 (100.0%) | 97 (73.5%) |
| 16 and 17 Years | 154 (100.0%) | 149 (100.0%) |
| 18 to 24 Years | 287 (100.0%) | 262 (99.2%) |
| 25 to 34 Years | 284 (100.0%) | 223 (100.0%) |
| 35 to 44 Years | 434 (100.0%) | 527 (100.0%) |
| 45 to 54 Years | 694 (91.8%) | 644 (89.9%) |
| 55 to 64 Years | 309 (95.4%) | 457 (97.7%) |
| 65 to 74 Years | 451 (95.6%) | 289 (95.1%) |
| 75 Years and over | 103 (81.8%) | 307 (94.2%) |
| Total | 3,566 (96.7%) | 3,287 (92.9%) |
Income Below Poverty Among Married-Couple Families in Pleasantville
The poverty statistics for married-couple families in Pleasantville show that 1.3% or 19 of the total 1,438 families live below the poverty line. Families with no children have the highest poverty rate of 3.3%, comprising of 19 families. On the other hand, families with 1 or 2 children have the lowest poverty rate of 0.0%, which includes 0 families.
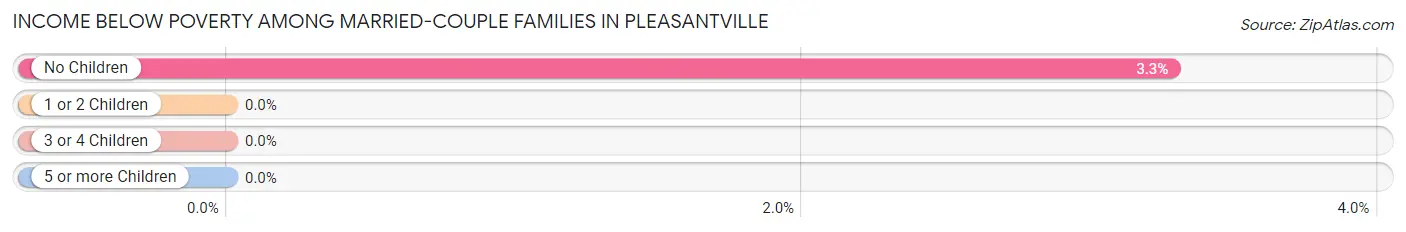
| Children | Above Poverty | Below Poverty |
| No Children | 560 (96.7%) | 19 (3.3%) |
| 1 or 2 Children | 764 (100.0%) | 0 (0.0%) |
| 3 or 4 Children | 95 (100.0%) | 0 (0.0%) |
| 5 or more Children | 0 (0.0%) | 0 (0.0%) |
| Total | 1,419 (98.7%) | 19 (1.3%) |
Income Below Poverty Among Single-Parent Households in Pleasantville
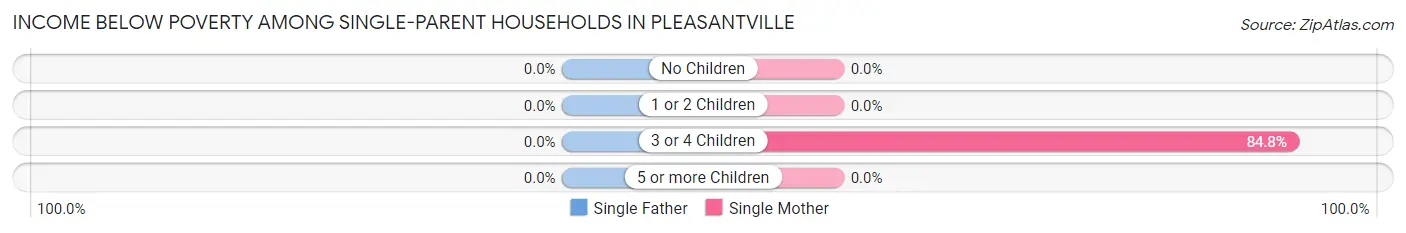
| Children | Single Father | Single Mother |
| No Children | 0 (0.0%) | 0 (0.0%) |
| 1 or 2 Children | 0 (0.0%) | 0 (0.0%) |
| 3 or 4 Children | 0 (0.0%) | 50 (84.8%) |
| 5 or more Children | 0 (0.0%) | 0 (0.0%) |
| Total | 0 (0.0%) | 50 (23.8%) |
Income Below Poverty Among Married-Couple vs Single-Parent Households in Pleasantville
The poverty data for Pleasantville shows that 19 of the married-couple family households (1.3%) and 50 of the single-parent households (12.5%) are living below the poverty level. Within the married-couple family households, those with no children have the highest poverty rate, with 19 households (3.3%) falling below the poverty line. Among the single-parent households, those with 3 or 4 children have the highest poverty rate, with 50 household (84.8%) living below poverty.
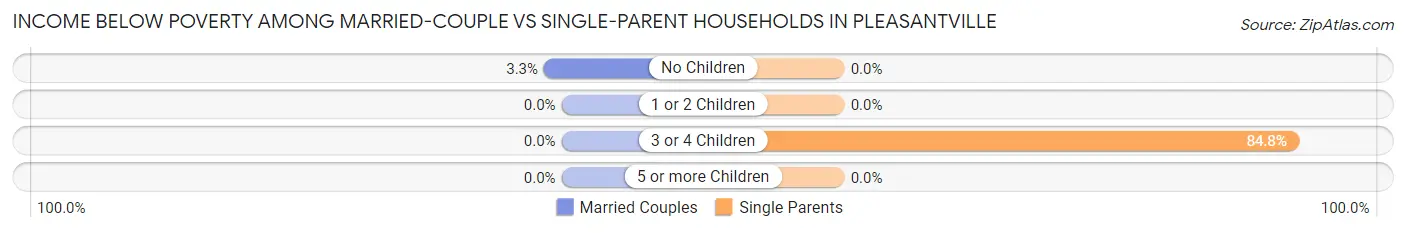
| Children | Married-Couple Families | Single-Parent Households |
| No Children | 19 (3.3%) | 0 (0.0%) |
| 1 or 2 Children | 0 (0.0%) | 0 (0.0%) |
| 3 or 4 Children | 0 (0.0%) | 50 (84.8%) |
| 5 or more Children | 0 (0.0%) | 0 (0.0%) |
| Total | 19 (1.3%) | 50 (12.5%) |
Race in Pleasantville
The most populous races in Pleasantville are White / Caucasian (6,428 | 86.5%), Hispanic or Latino (884 | 11.9%), and Some other Race (445 | 6.0%).
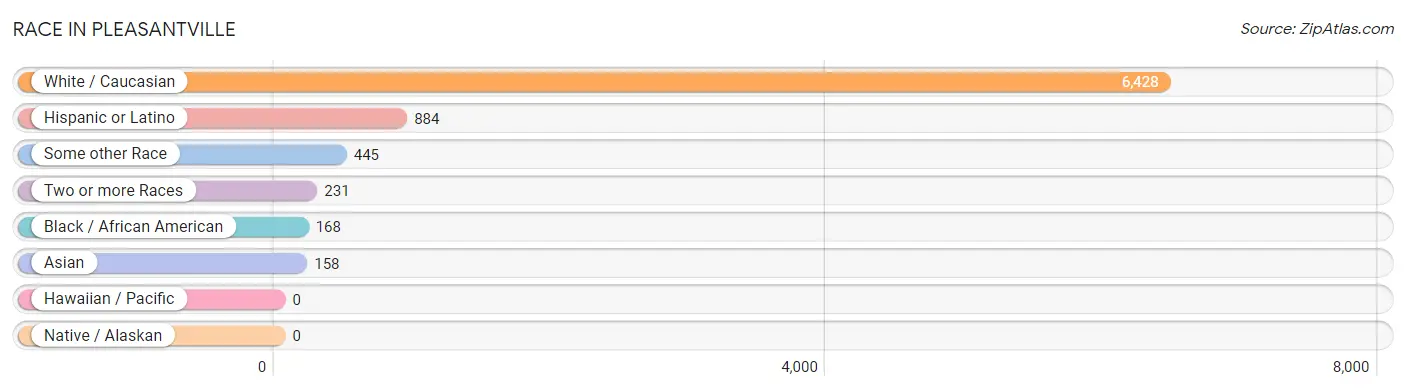
| Race | # Population | % Population |
| Asian | 158 | 2.1% |
| Black / African American | 168 | 2.3% |
| Hawaiian / Pacific | 0 | 0.0% |
| Hispanic or Latino | 884 | 11.9% |
| Native / Alaskan | 0 | 0.0% |
| White / Caucasian | 6,428 | 86.5% |
| Two or more Races | 231 | 3.1% |
| Some other Race | 445 | 6.0% |
| Total | 7,430 | 100.0% |
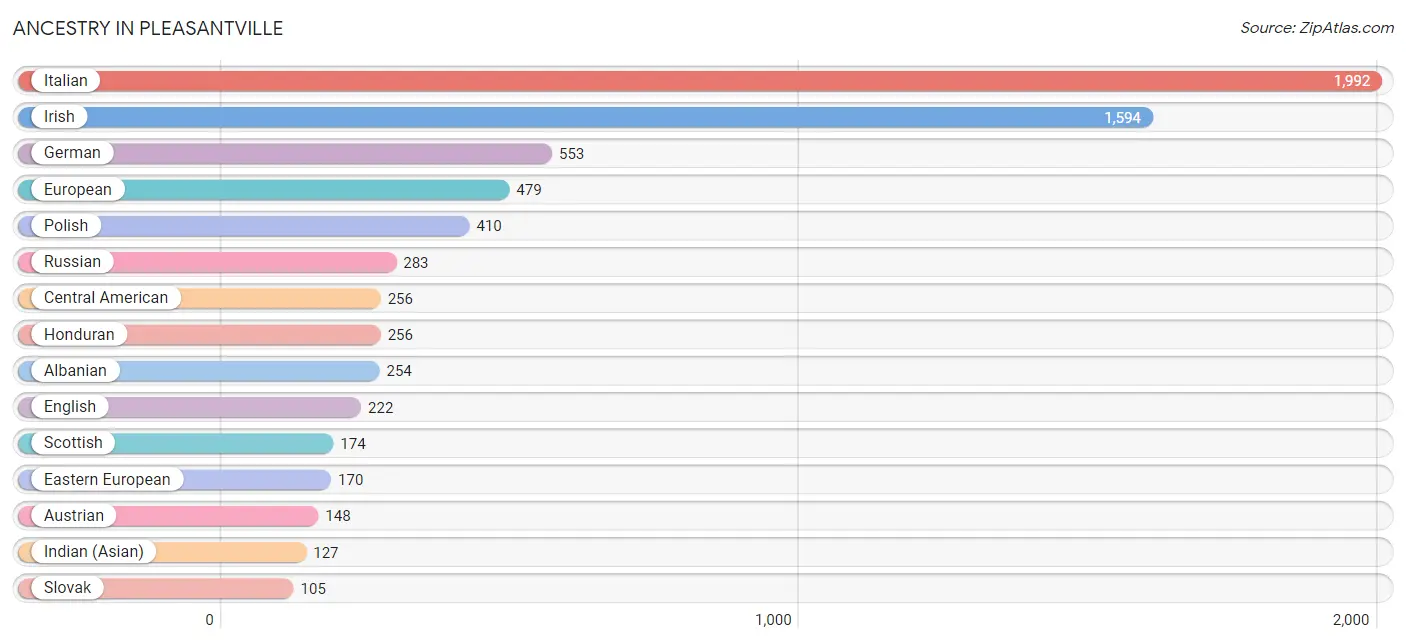
Ancestry in Pleasantville
The most populous ancestries reported in Pleasantville are Italian (1,992 | 26.8%), Irish (1,594 | 21.4%), German (553 | 7.4%), European (479 | 6.5%), and Polish (410 | 5.5%), together accounting for 67.7% of all Pleasantville residents.
| Ancestry | # Population | % Population |
| African | 1 | 0.0% |
| Albanian | 254 | 3.4% |
| American | 79 | 1.1% |
| Arab | 12 | 0.2% |
| Armenian | 16 | 0.2% |
| Austrian | 148 | 2.0% |
| Barbadian | 2 | 0.0% |
| Burmese | 16 | 0.2% |
| Canadian | 12 | 0.2% |
| Central American | 256 | 3.5% |
| Colombian | 35 | 0.5% |
| Croatian | 16 | 0.2% |
| Cuban | 1 | 0.0% |
| Czech | 26 | 0.4% |
| Danish | 13 | 0.2% |
| Dominican | 58 | 0.8% |
| Dutch | 52 | 0.7% |
| Eastern European | 170 | 2.3% |
| Ecuadorian | 9 | 0.1% |
| English | 222 | 3.0% |
| European | 479 | 6.5% |
| Finnish | 72 | 1.0% |
| French | 77 | 1.0% |
| French Canadian | 52 | 0.7% |
| German | 553 | 7.4% |
| Greek | 60 | 0.8% |
| Honduran | 256 | 3.5% |
| Hungarian | 38 | 0.5% |
| Indian (Asian) | 127 | 1.7% |
| Irish | 1,594 | 21.4% |
| Italian | 1,992 | 26.8% |
| Jamaican | 2 | 0.0% |
| Korean | 23 | 0.3% |
| Lebanese | 12 | 0.2% |
| Mexican | 7 | 0.1% |
| Northern European | 90 | 1.2% |
| Norwegian | 92 | 1.2% |
| Peruvian | 22 | 0.3% |
| Polish | 410 | 5.5% |
| Portuguese | 22 | 0.3% |
| Puerto Rican | 37 | 0.5% |
| Romanian | 20 | 0.3% |
| Russian | 283 | 3.8% |
| Scotch-Irish | 46 | 0.6% |
| Scottish | 174 | 2.3% |
| Slavic | 19 | 0.3% |
| Slovak | 105 | 1.4% |
| South American | 66 | 0.9% |
| Spaniard | 51 | 0.7% |
| Subsaharan African | 19 | 0.3% |
| Swedish | 15 | 0.2% |
| Swiss | 15 | 0.2% |
| Thai | 92 | 1.2% |
| Ukrainian | 30 | 0.4% |
| Welsh | 13 | 0.2% | View All 55 Rows |
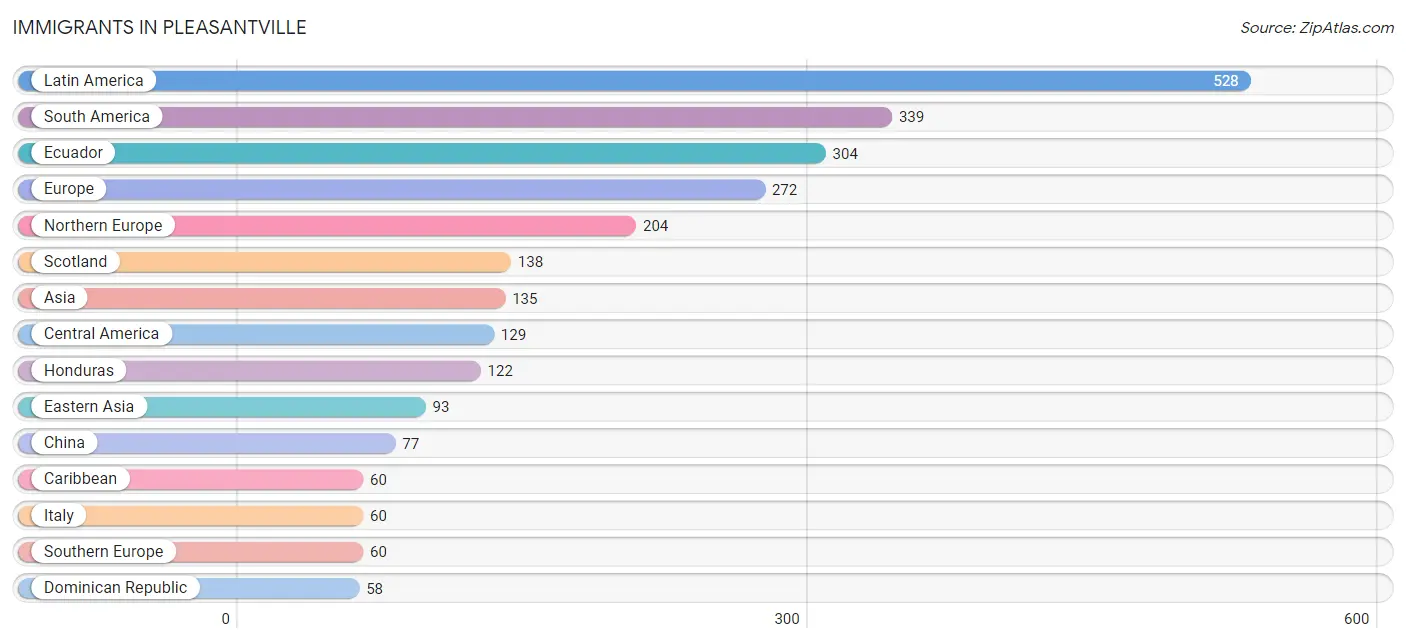
Immigrants in Pleasantville
The most numerous immigrant groups reported in Pleasantville came from Latin America (528 | 7.1%), South America (339 | 4.6%), Ecuador (304 | 4.1%), Europe (272 | 3.7%), and Northern Europe (204 | 2.8%), together accounting for 22.2% of all Pleasantville residents.
| Immigration Origin | # Population | % Population |
| Africa | 4 | 0.1% |
| Asia | 135 | 1.8% |
| Caribbean | 60 | 0.8% |
| Central America | 129 | 1.7% |
| China | 77 | 1.0% |
| Colombia | 35 | 0.5% |
| Dominican Republic | 58 | 0.8% |
| Eastern Asia | 93 | 1.3% |
| Eastern Europe | 8 | 0.1% |
| Ecuador | 304 | 4.1% |
| Europe | 272 | 3.7% |
| Honduras | 122 | 1.6% |
| Hong Kong | 27 | 0.4% |
| India | 30 | 0.4% |
| Ireland | 54 | 0.7% |
| Italy | 60 | 0.8% |
| Jamaica | 2 | 0.0% |
| Korea | 16 | 0.2% |
| Latin America | 528 | 7.1% |
| Lebanon | 12 | 0.2% |
| Mexico | 7 | 0.1% |
| Northern Europe | 204 | 2.8% |
| Scotland | 138 | 1.9% |
| South Africa | 4 | 0.1% |
| South America | 339 | 4.6% |
| South Central Asia | 30 | 0.4% |
| Southern Europe | 60 | 0.8% |
| Taiwan | 24 | 0.3% |
| Western Asia | 12 | 0.2% | View All 29 Rows |
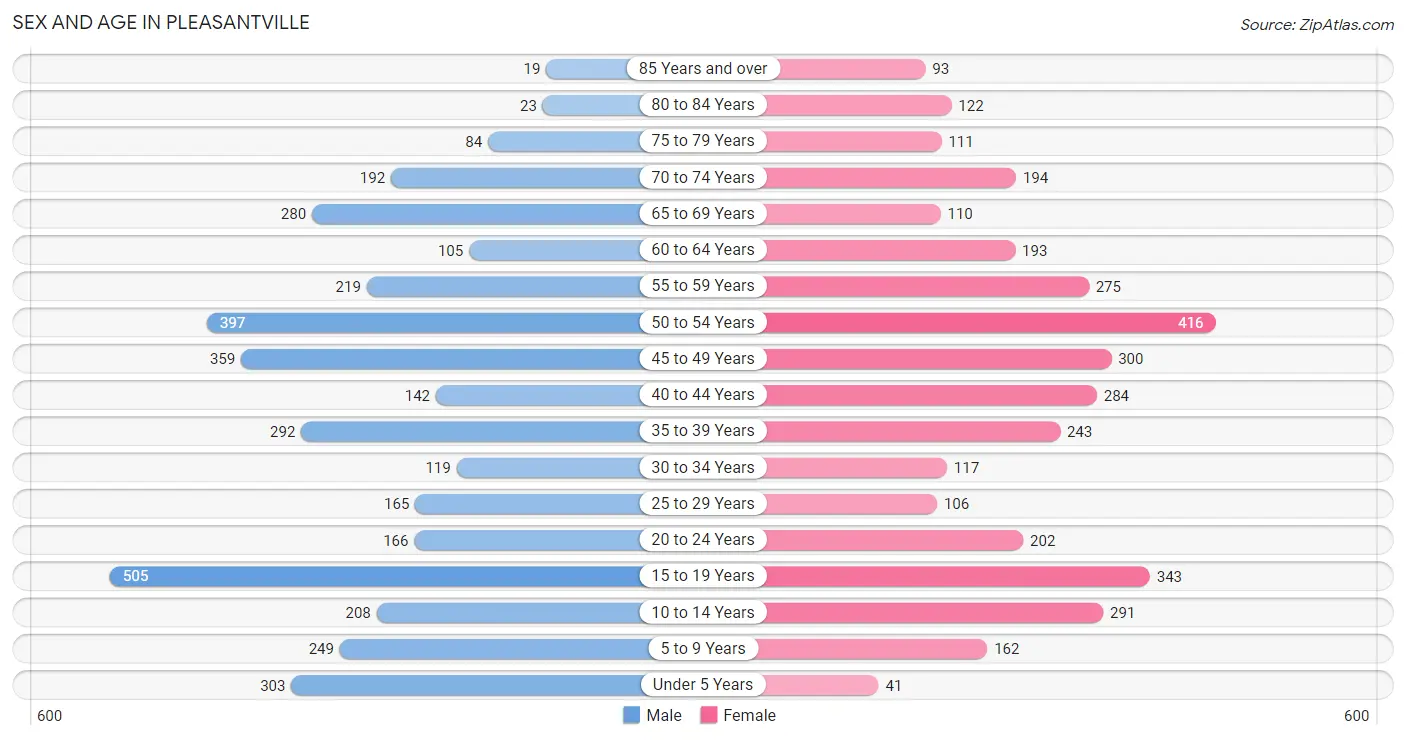
Sex and Age in Pleasantville
Sex and Age in Pleasantville
The most populous age groups in Pleasantville are 15 to 19 Years (505 | 13.2%) for men and 50 to 54 Years (416 | 11.6%) for women.
| Age Bracket | Male | Female |
| Under 5 Years | 303 (7.9%) | 41 (1.1%) |
| 5 to 9 Years | 249 (6.5%) | 162 (4.5%) |
| 10 to 14 Years | 208 (5.4%) | 291 (8.1%) |
| 15 to 19 Years | 505 (13.2%) | 343 (9.5%) |
| 20 to 24 Years | 166 (4.3%) | 202 (5.6%) |
| 25 to 29 Years | 165 (4.3%) | 106 (2.9%) |
| 30 to 34 Years | 119 (3.1%) | 117 (3.3%) |
| 35 to 39 Years | 292 (7.6%) | 243 (6.7%) |
| 40 to 44 Years | 142 (3.7%) | 284 (7.9%) |
| 45 to 49 Years | 359 (9.4%) | 300 (8.3%) |
| 50 to 54 Years | 397 (10.4%) | 416 (11.6%) |
| 55 to 59 Years | 219 (5.7%) | 275 (7.6%) |
| 60 to 64 Years | 105 (2.7%) | 193 (5.4%) |
| 65 to 69 Years | 280 (7.3%) | 110 (3.0%) |
| 70 to 74 Years | 192 (5.0%) | 194 (5.4%) |
| 75 to 79 Years | 84 (2.2%) | 111 (3.1%) |
| 80 to 84 Years | 23 (0.6%) | 122 (3.4%) |
| 85 Years and over | 19 (0.5%) | 93 (2.6%) |
| Total | 3,827 (100.0%) | 3,603 (100.0%) |
Families and Households in Pleasantville
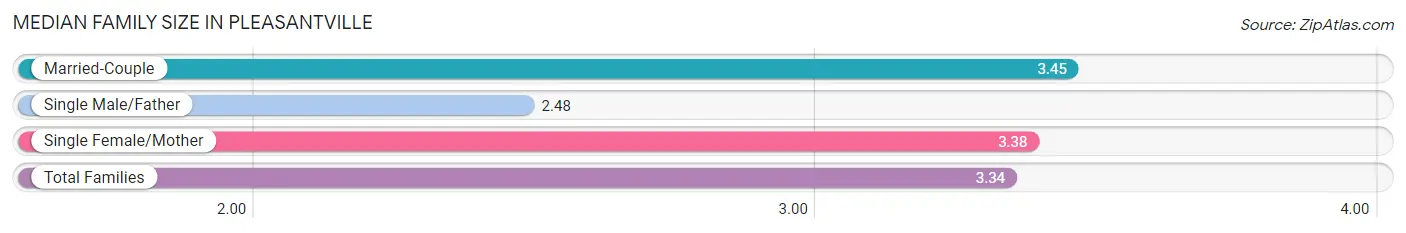
Median Family Size in Pleasantville
The median family size in Pleasantville is 3.34 persons per family, with married-couple families (1,438 | 78.2%) accounting for the largest median family size of 3.45 persons per family. On the other hand, single male/father families (190 | 10.3%) represent the smallest median family size with 2.48 persons per family.
| Family Type | # Families | Family Size |
| Married-Couple | 1,438 (78.2%) | 3.45 |
| Single Male/Father | 190 (10.3%) | 2.48 |
| Single Female/Mother | 210 (11.4%) | 3.38 |
| Total Families | 1,838 (100.0%) | 3.34 |
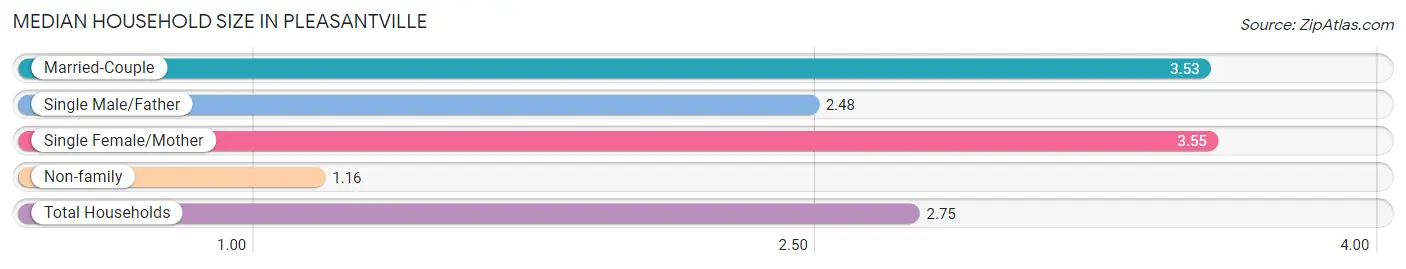
Median Household Size in Pleasantville
The median household size in Pleasantville is 2.75 persons per household, with single female/mother households (210 | 8.1%) accounting for the largest median household size of 3.55 persons per household. non-family households (771 | 29.5%) represent the smallest median household size with 1.16 persons per household.
| Household Type | # Households | Household Size |
| Married-Couple | 1,438 (55.1%) | 3.53 |
| Single Male/Father | 190 (7.3%) | 2.48 |
| Single Female/Mother | 210 (8.1%) | 3.55 |
| Non-family | 771 (29.5%) | 1.16 |
| Total Households | 2,609 (100.0%) | 2.75 |
Household Size by Marriage Status in Pleasantville
Out of a total of 2,609 households in Pleasantville, 1,838 (70.5%) are family households, while 771 (29.5%) are nonfamily households. The most numerous type of family households are 4-person households, comprising 561, and the most common type of nonfamily households are 1-person households, comprising 651.
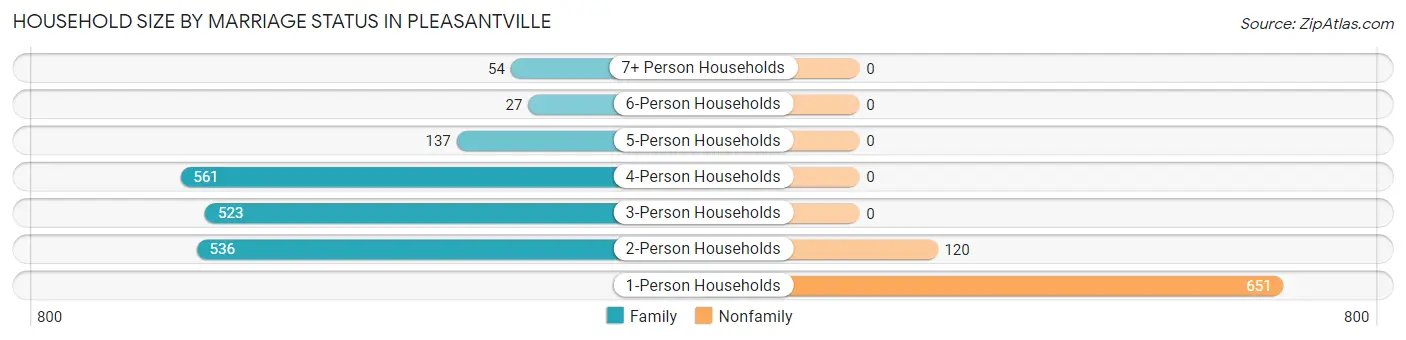
| Household Size | Family Households | Nonfamily Households |
| 1-Person Households | - | 651 (24.9%) |
| 2-Person Households | 536 (20.5%) | 120 (4.6%) |
| 3-Person Households | 523 (20.1%) | 0 (0.0%) |
| 4-Person Households | 561 (21.5%) | 0 (0.0%) |
| 5-Person Households | 137 (5.2%) | 0 (0.0%) |
| 6-Person Households | 27 (1.0%) | 0 (0.0%) |
| 7+ Person Households | 54 (2.1%) | 0 (0.0%) |
| Total | 1,838 (70.5%) | 771 (29.5%) |
Female Fertility in Pleasantville
Fertility by Age in Pleasantville
Average fertility rate in Pleasantville is 32.0 births per 1,000 women. Women in the age bracket of 20 to 34 years have the highest fertility rate with 87.0 births per 1,000 women. Women in the age bracket of 20 to 34 years acount for 66.1% of all women with births.
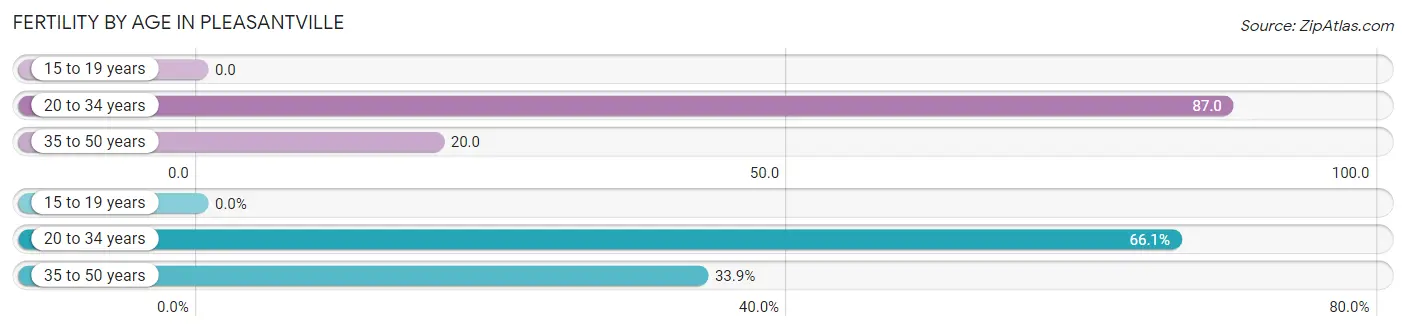
| Age Bracket | Women with Births | Births / 1,000 Women |
| 15 to 19 years | 0 (0.0%) | 0.0 |
| 20 to 34 years | 37 (66.1%) | 87.0 |
| 35 to 50 years | 19 (33.9%) | 20.0 |
| Total | 56 (100.0%) | 32.0 |
Fertility by Age by Marriage Status in Pleasantville
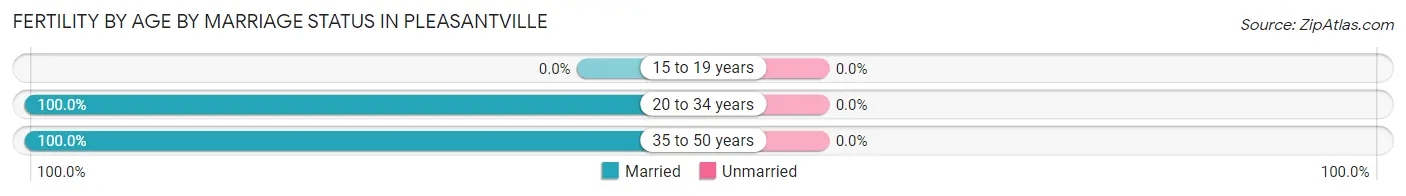
| Age Bracket | Married | Unmarried |
| 15 to 19 years | 0 (0.0%) | 0 (0.0%) |
| 20 to 34 years | 37 (100.0%) | 0 (0.0%) |
| 35 to 50 years | 19 (100.0%) | 0 (0.0%) |
| Total | 56 (100.0%) | 0 (0.0%) |
Fertility by Education in Pleasantville
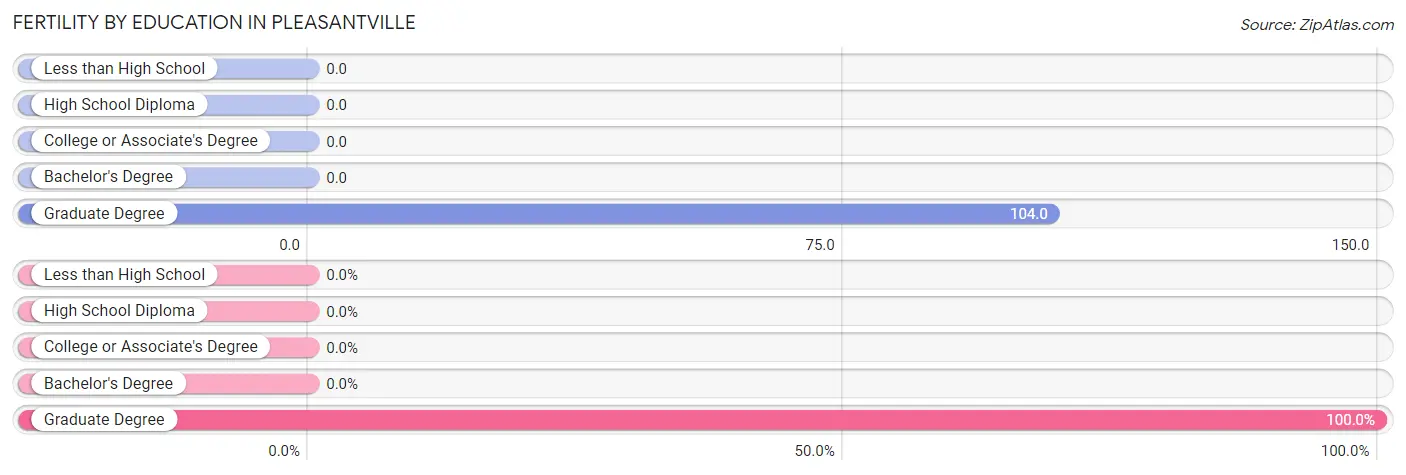
| Educational Attainment | Women with Births | Births / 1,000 Women |
| Less than High School | 0 (0.0%) | 0.0 |
| High School Diploma | 0 (0.0%) | 0.0 |
| College or Associate's Degree | 0 (0.0%) | 0.0 |
| Bachelor's Degree | 0 (0.0%) | 0.0 |
| Graduate Degree | 56 (100.0%) | 104.0 |
| Total | 56 (100.0%) | 32.0 |
Fertility by Education by Marriage Status in Pleasantville
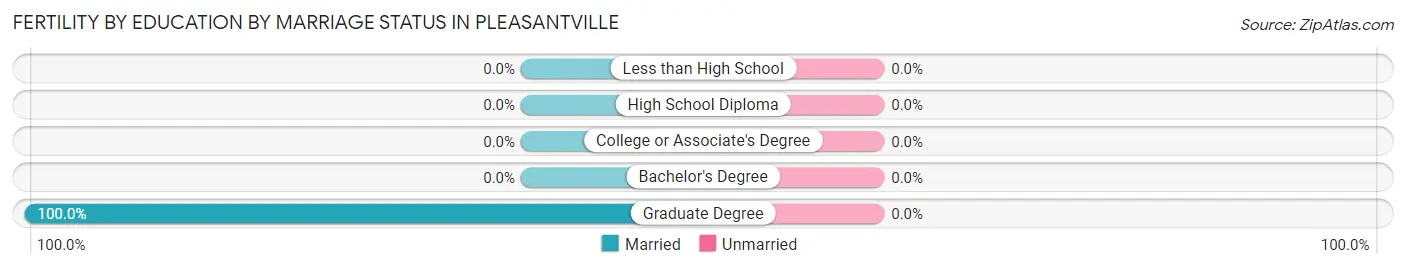
| Educational Attainment | Married | Unmarried |
| Less than High School | 0 (0.0%) | 0 (0.0%) |
| High School Diploma | 0 (0.0%) | 0 (0.0%) |
| College or Associate's Degree | 0 (0.0%) | 0 (0.0%) |
| Bachelor's Degree | 0 (0.0%) | 0 (0.0%) |
| Graduate Degree | 56 (100.0%) | 0 (0.0%) |
| Total | 56 (100.0%) | 0 (0.0%) |
Employment Characteristics in Pleasantville
Employment by Class of Employer in Pleasantville
Among the 3,662 employed individuals in Pleasantville, private company employees (2,268 | 61.9%), local government employees (399 | 10.9%), and not-for-profit organizations (307 | 8.4%) make up the most common classes of employment.
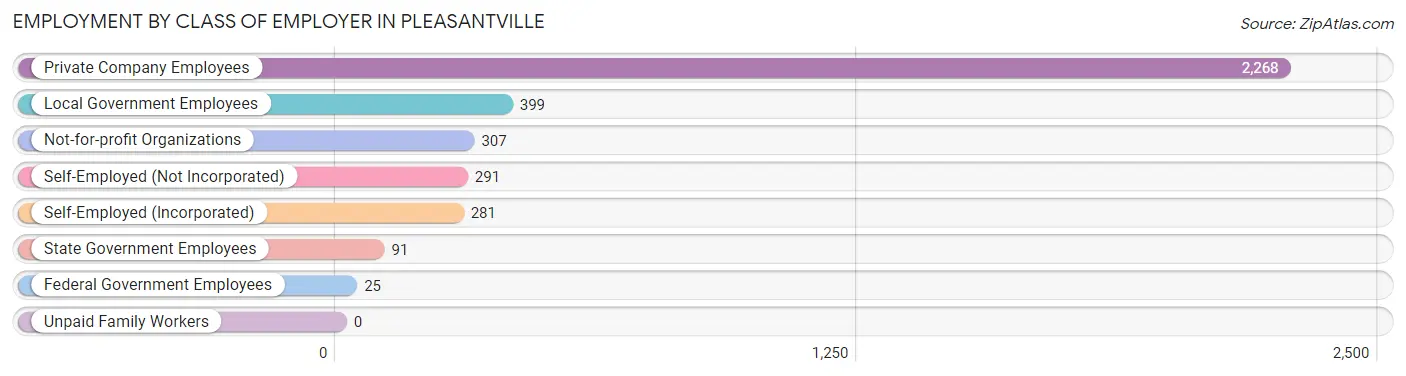
| Employer Class | # Employees | % Employees |
| Private Company Employees | 2,268 | 61.9% |
| Self-Employed (Incorporated) | 281 | 7.7% |
| Self-Employed (Not Incorporated) | 291 | 8.0% |
| Not-for-profit Organizations | 307 | 8.4% |
| Local Government Employees | 399 | 10.9% |
| State Government Employees | 91 | 2.5% |
| Federal Government Employees | 25 | 0.7% |
| Unpaid Family Workers | 0 | 0.0% |
| Total | 3,662 | 100.0% |
Employment Status by Age in Pleasantville
According to the labor force statistics for Pleasantville, out of the total population over 16 years of age (5,891), 67.7% or 3,988 individuals are in the labor force, with 5.8% or 231 of them unemployed. The age group with the highest labor force participation rate is 30 to 34 years, with 96.6% or 228 individuals in the labor force. Within the labor force, the 16 to 19 years age range has the highest percentage of unemployed individuals, with 44.2% or 68 of them being unemployed.
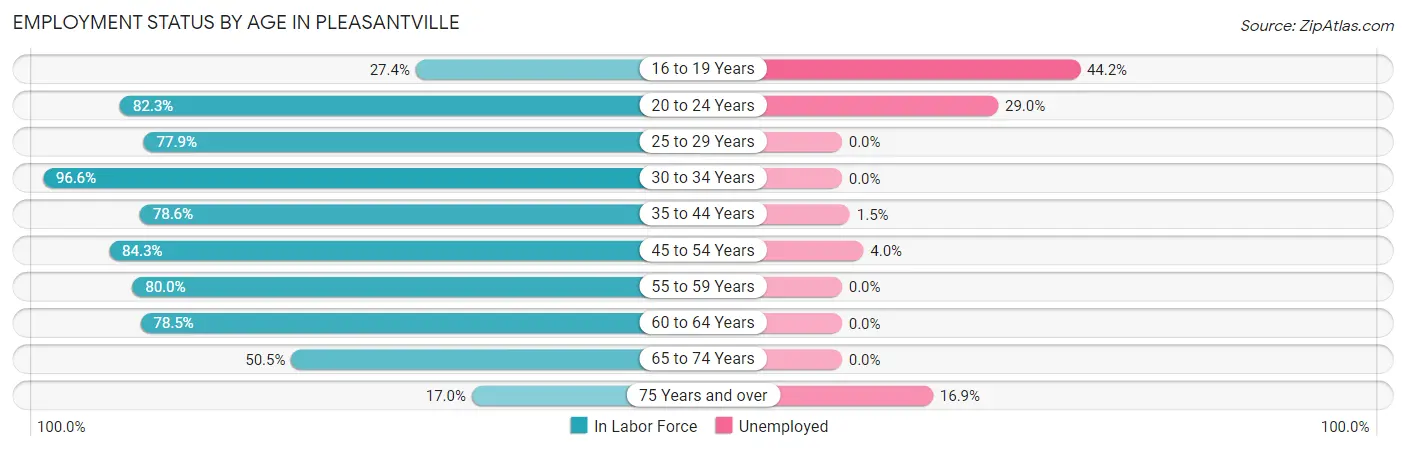
| Age Bracket | In Labor Force | Unemployed |
| 16 to 19 Years | 154 (27.4%) | 68 (44.2%) |
| 20 to 24 Years | 303 (82.3%) | 88 (29.0%) |
| 25 to 29 Years | 211 (77.9%) | 0 (0.0%) |
| 30 to 34 Years | 228 (96.6%) | 0 (0.0%) |
| 35 to 44 Years | 755 (78.6%) | 11 (1.5%) |
| 45 to 54 Years | 1,241 (84.3%) | 50 (4.0%) |
| 55 to 59 Years | 395 (80.0%) | 0 (0.0%) |
| 60 to 64 Years | 234 (78.5%) | 0 (0.0%) |
| 65 to 74 Years | 392 (50.5%) | 0 (0.0%) |
| 75 Years and over | 77 (17.0%) | 13 (16.9%) |
| Total | 3,988 (67.7%) | 231 (5.8%) |
Employment Status by Educational Attainment in Pleasantville
According to labor force statistics for Pleasantville, 82.1% of individuals (3,064) out of the total population between 25 and 64 years of age (3,732) are in the labor force, with 2.0% or 61 of them being unemployed. The group with the highest labor force participation rate are those with the educational attainment of bachelor's degree or higher, with 88.5% or 2,471 individuals in the labor force. Within the labor force, individuals with high school diploma education have the highest percentage of unemployment, with 31.4% or 50 of them being unemployed.
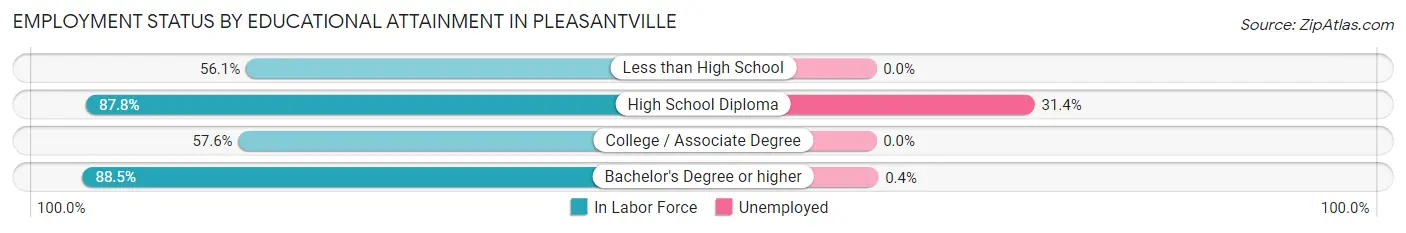
| Educational Attainment | In Labor Force | Unemployed |
| Less than High School | 148 (56.1%) | 0 (0.0%) |
| High School Diploma | 159 (87.8%) | 57 (31.4%) |
| College / Associate Degree | 285 (57.6%) | 0 (0.0%) |
| Bachelor's Degree or higher | 2,471 (88.5%) | 11 (0.4%) |
| Total | 3,064 (82.1%) | 75 (2.0%) |
Employment Occupations by Sex in Pleasantville
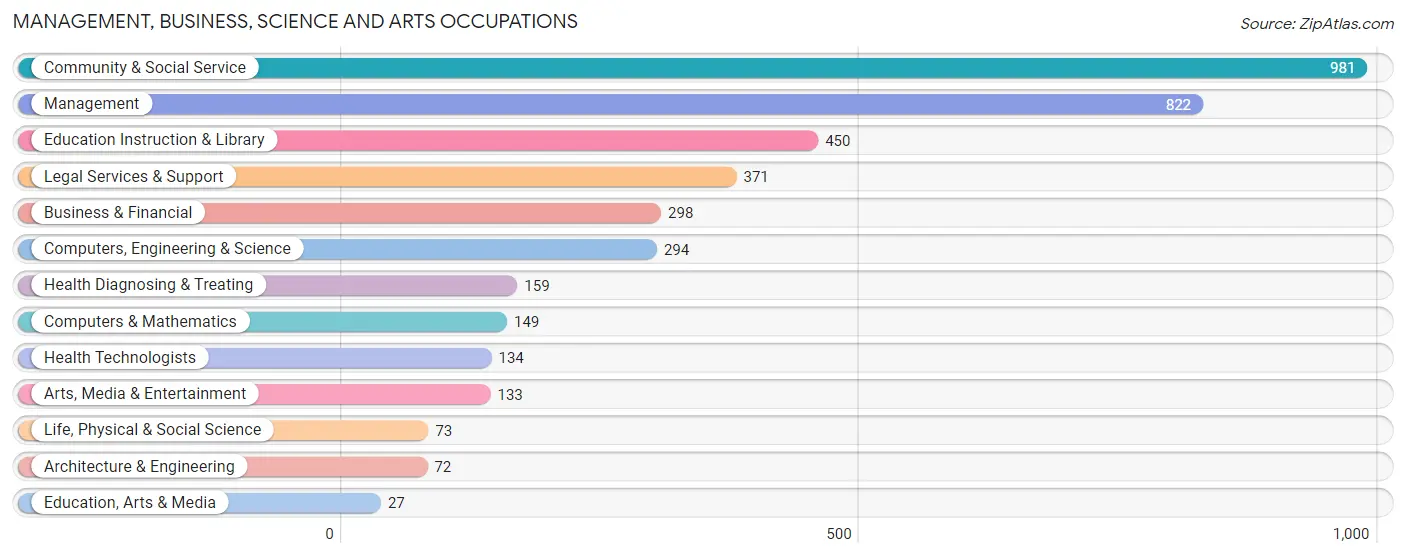
Management, Business, Science and Arts Occupations
The most common Management, Business, Science and Arts occupations in Pleasantville are Community & Social Service (981 | 26.1%), Management (822 | 21.9%), Education Instruction & Library (450 | 12.0%), Legal Services & Support (371 | 9.9%), and Business & Financial (298 | 7.9%).
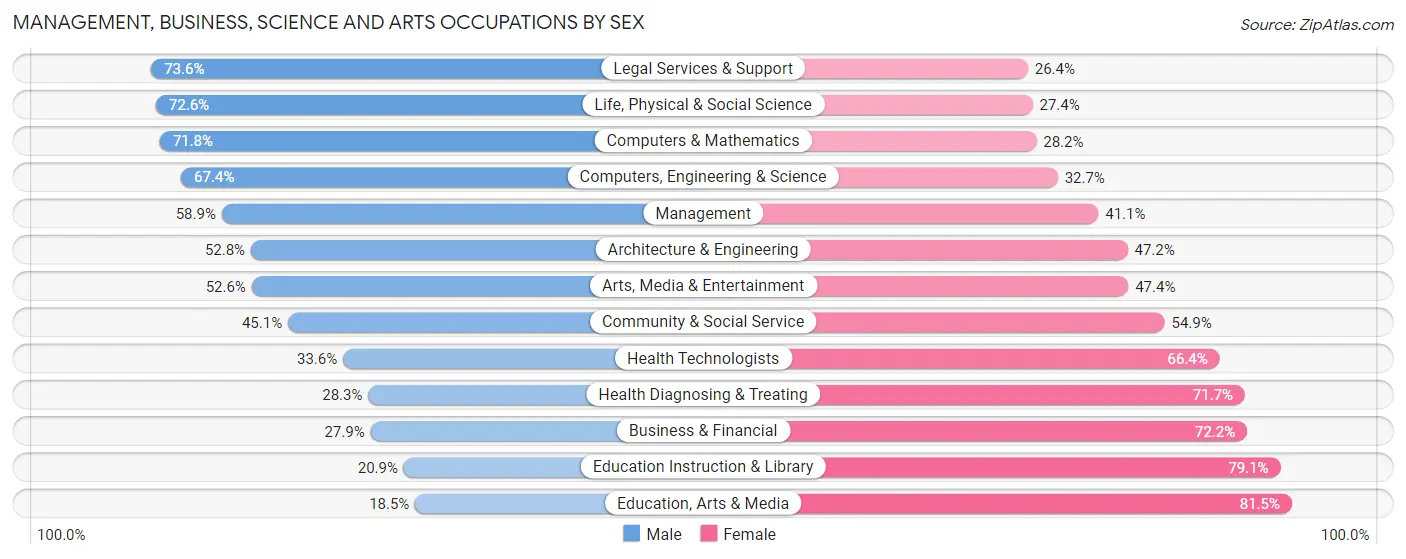
Management, Business, Science and Arts Occupations by Sex
Within the Management, Business, Science and Arts occupations in Pleasantville, the most male-oriented occupations are Legal Services & Support (73.6%), Life, Physical & Social Science (72.6%), and Computers & Mathematics (71.8%), while the most female-oriented occupations are Education, Arts & Media (81.5%), Education Instruction & Library (79.1%), and Business & Financial (72.2%).
| Occupation | Male | Female |
| Management | 484 (58.9%) | 338 (41.1%) |
| Business & Financial | 83 (27.9%) | 215 (72.2%) |
| Computers, Engineering & Science | 198 (67.3%) | 96 (32.7%) |
| Computers & Mathematics | 107 (71.8%) | 42 (28.2%) |
| Architecture & Engineering | 38 (52.8%) | 34 (47.2%) |
| Life, Physical & Social Science | 53 (72.6%) | 20 (27.4%) |
| Community & Social Service | 442 (45.1%) | 539 (54.9%) |
| Education, Arts & Media | 5 (18.5%) | 22 (81.5%) |
| Legal Services & Support | 273 (73.6%) | 98 (26.4%) |
| Education Instruction & Library | 94 (20.9%) | 356 (79.1%) |
| Arts, Media & Entertainment | 70 (52.6%) | 63 (47.4%) |
| Health Diagnosing & Treating | 45 (28.3%) | 114 (71.7%) |
| Health Technologists | 45 (33.6%) | 89 (66.4%) |
| Total (Category) | 1,252 (49.0%) | 1,302 (51.0%) |
| Total (Overall) | 2,058 (54.7%) | 1,702 (45.3%) |
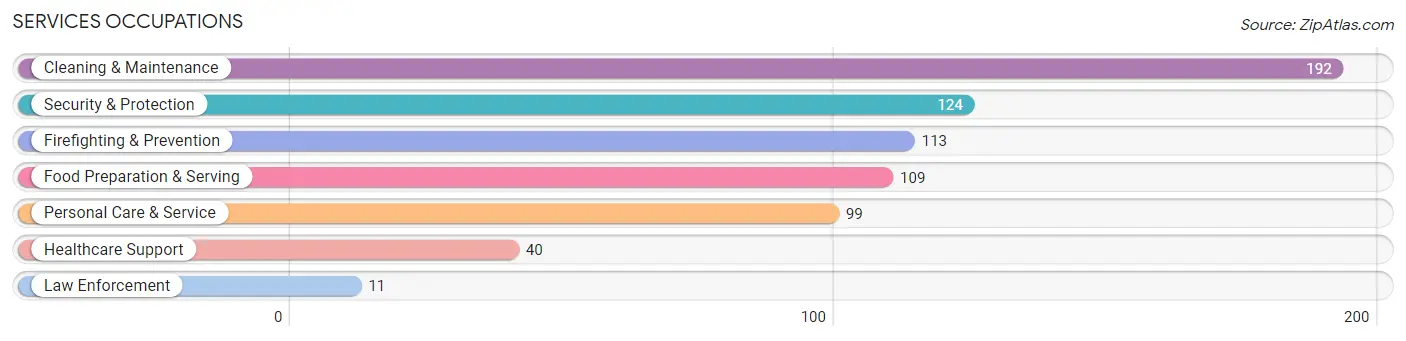
Services Occupations
The most common Services occupations in Pleasantville are Cleaning & Maintenance (192 | 5.1%), Security & Protection (124 | 3.3%), Firefighting & Prevention (113 | 3.0%), Food Preparation & Serving (109 | 2.9%), and Personal Care & Service (99 | 2.6%).
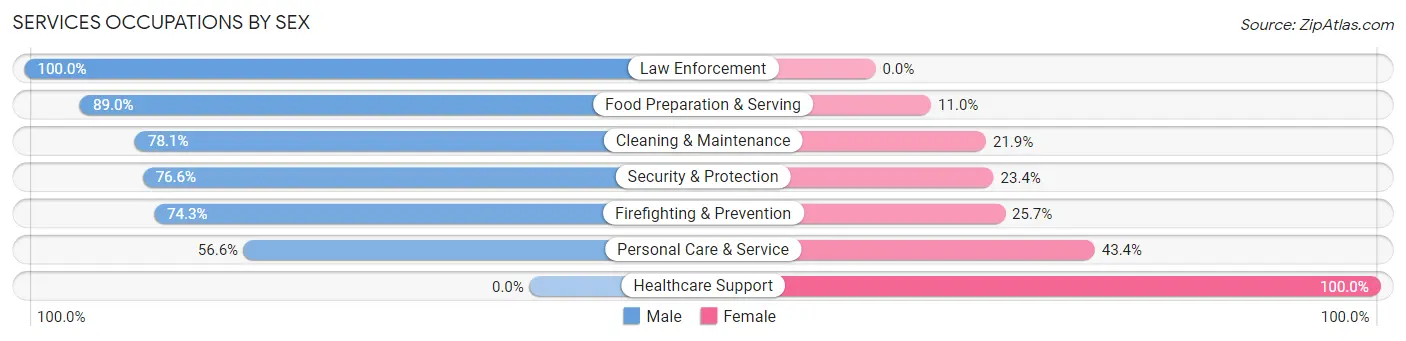
Services Occupations by Sex
Within the Services occupations in Pleasantville, the most male-oriented occupations are Law Enforcement (100.0%), Food Preparation & Serving (89.0%), and Cleaning & Maintenance (78.1%), while the most female-oriented occupations are Healthcare Support (100.0%), Personal Care & Service (43.4%), and Firefighting & Prevention (25.7%).
| Occupation | Male | Female |
| Healthcare Support | 0 (0.0%) | 40 (100.0%) |
| Security & Protection | 95 (76.6%) | 29 (23.4%) |
| Firefighting & Prevention | 84 (74.3%) | 29 (25.7%) |
| Law Enforcement | 11 (100.0%) | 0 (0.0%) |
| Food Preparation & Serving | 97 (89.0%) | 12 (11.0%) |
| Cleaning & Maintenance | 150 (78.1%) | 42 (21.9%) |
| Personal Care & Service | 56 (56.6%) | 43 (43.4%) |
| Total (Category) | 398 (70.6%) | 166 (29.4%) |
| Total (Overall) | 2,058 (54.7%) | 1,702 (45.3%) |
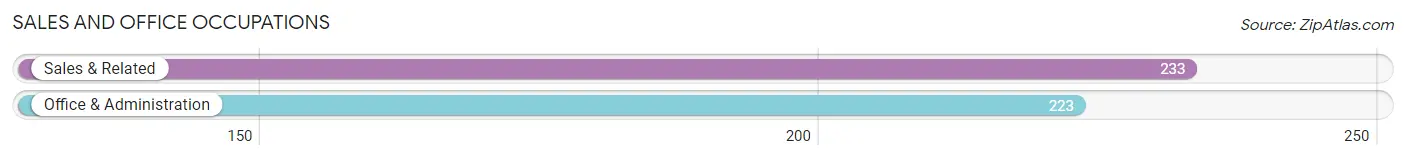
Sales and Office Occupations
The most common Sales and Office occupations in Pleasantville are Sales & Related (233 | 6.2%), and Office & Administration (223 | 5.9%).
Sales and Office Occupations by Sex
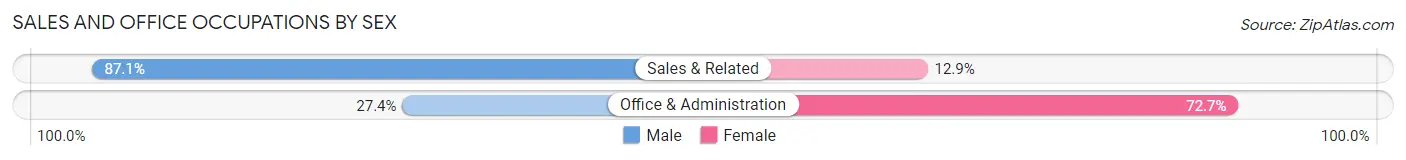
| Occupation | Male | Female |
| Sales & Related | 203 (87.1%) | 30 (12.9%) |
| Office & Administration | 61 (27.4%) | 162 (72.7%) |
| Total (Category) | 264 (57.9%) | 192 (42.1%) |
| Total (Overall) | 2,058 (54.7%) | 1,702 (45.3%) |
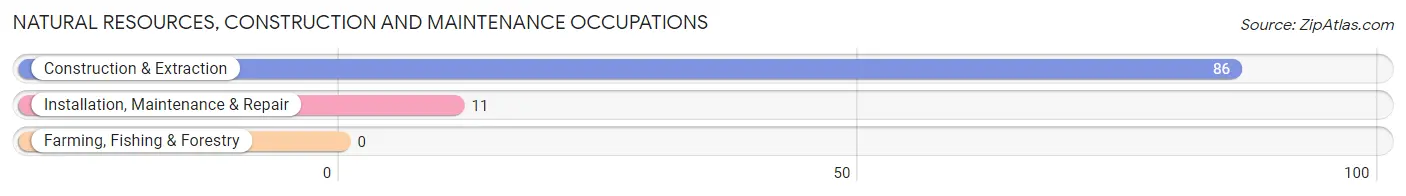
Natural Resources, Construction and Maintenance Occupations
The most common Natural Resources, Construction and Maintenance occupations in Pleasantville are Construction & Extraction (86 | 2.3%), and Installation, Maintenance & Repair (11 | 0.3%).
Natural Resources, Construction and Maintenance Occupations by Sex
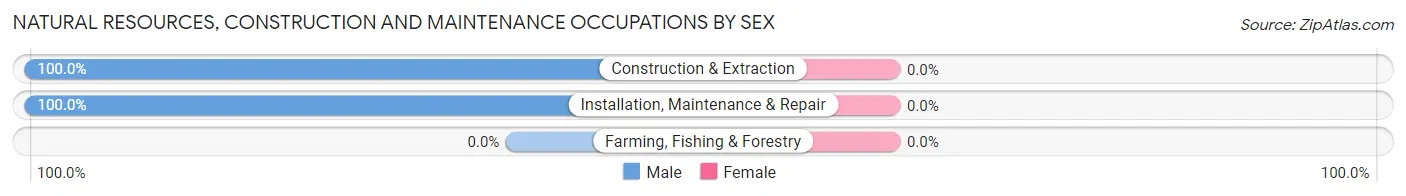
| Occupation | Male | Female |
| Farming, Fishing & Forestry | 0 (0.0%) | 0 (0.0%) |
| Construction & Extraction | 86 (100.0%) | 0 (0.0%) |
| Installation, Maintenance & Repair | 11 (100.0%) | 0 (0.0%) |
| Total (Category) | 97 (100.0%) | 0 (0.0%) |
| Total (Overall) | 2,058 (54.7%) | 1,702 (45.3%) |
Production, Transportation and Moving Occupations
The most common Production, Transportation and Moving occupations in Pleasantville are Transportation (59 | 1.6%), and Material Moving (30 | 0.8%).
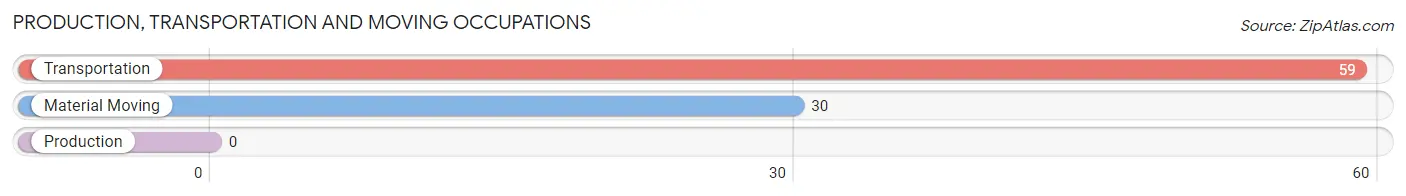
Production, Transportation and Moving Occupations by Sex
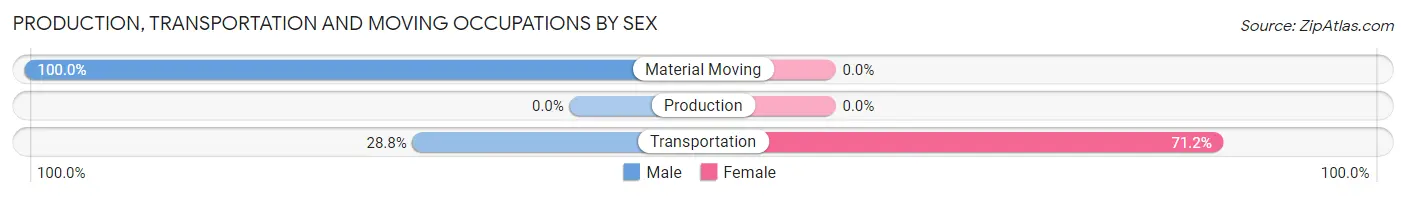
| Occupation | Male | Female |
| Production | 0 (0.0%) | 0 (0.0%) |
| Transportation | 17 (28.8%) | 42 (71.2%) |
| Material Moving | 30 (100.0%) | 0 (0.0%) |
| Total (Category) | 47 (52.8%) | 42 (47.2%) |
| Total (Overall) | 2,058 (54.7%) | 1,702 (45.3%) |
Employment Industries by Sex in Pleasantville
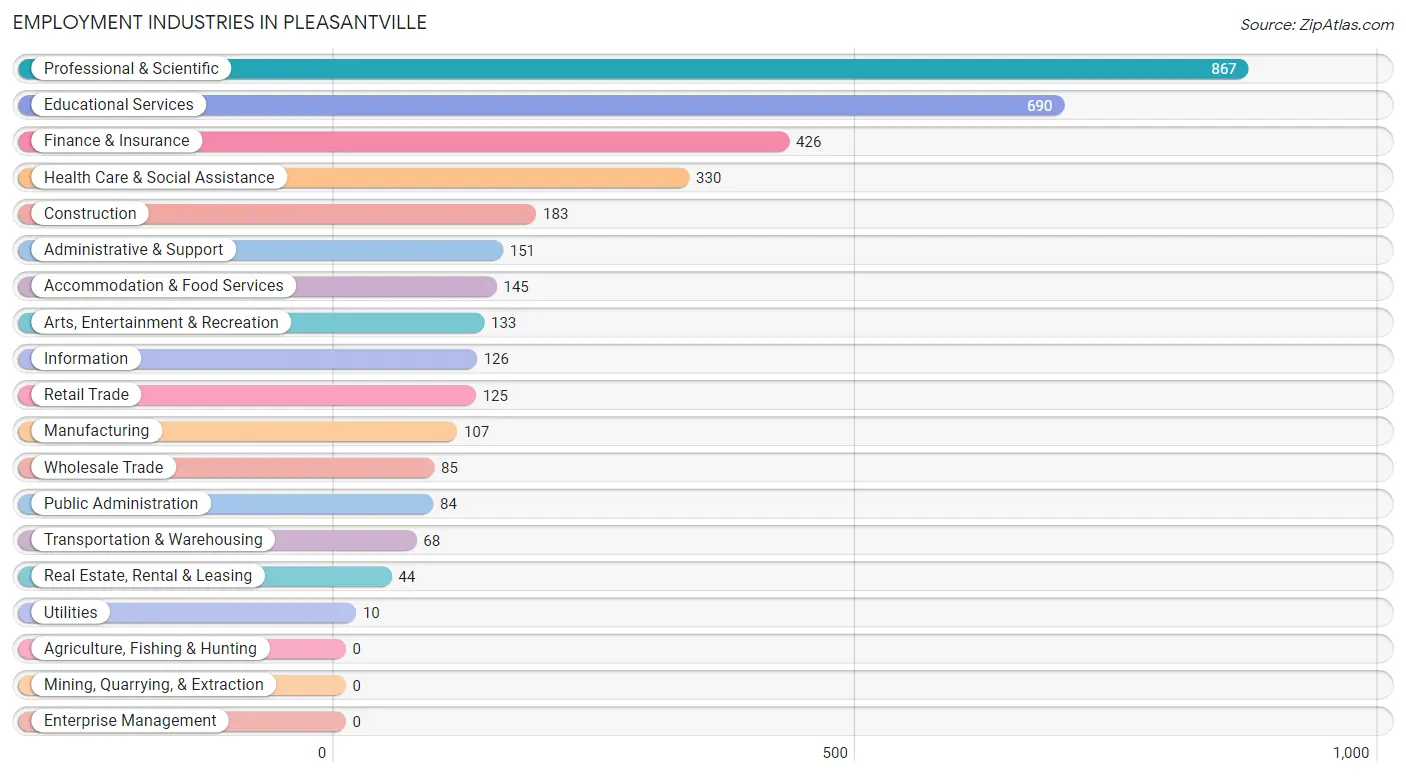
Employment Industries in Pleasantville
The major employment industries in Pleasantville include Professional & Scientific (867 | 23.1%), Educational Services (690 | 18.3%), Finance & Insurance (426 | 11.3%), Health Care & Social Assistance (330 | 8.8%), and Construction (183 | 4.9%).
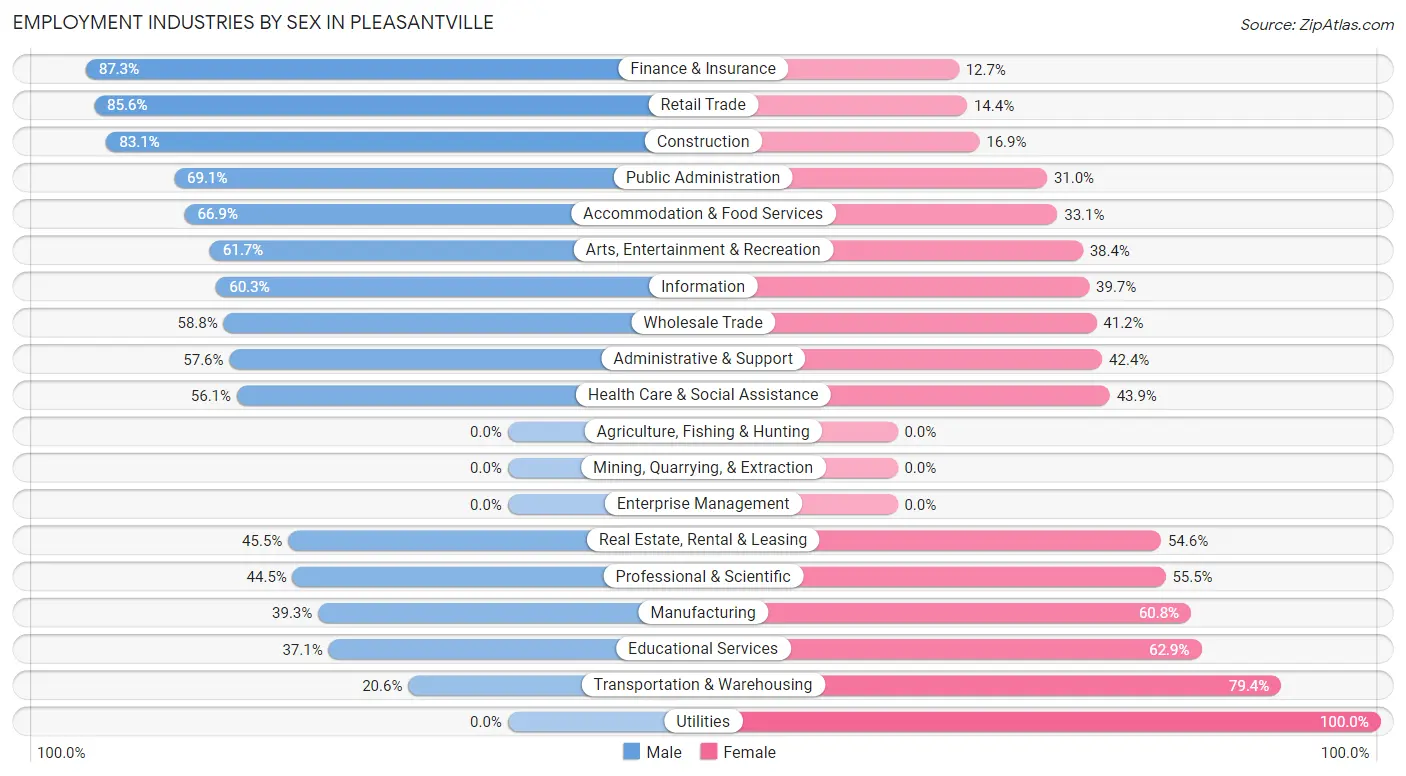
Employment Industries by Sex in Pleasantville
The Pleasantville industries that see more men than women are Finance & Insurance (87.3%), Retail Trade (85.6%), and Construction (83.1%), whereas the industries that tend to have a higher number of women are Utilities (100.0%), Transportation & Warehousing (79.4%), and Educational Services (62.9%).
| Industry | Male | Female |
| Agriculture, Fishing & Hunting | 0 (0.0%) | 0 (0.0%) |
| Mining, Quarrying, & Extraction | 0 (0.0%) | 0 (0.0%) |
| Construction | 152 (83.1%) | 31 (16.9%) |
| Manufacturing | 42 (39.3%) | 65 (60.8%) |
| Wholesale Trade | 50 (58.8%) | 35 (41.2%) |
| Retail Trade | 107 (85.6%) | 18 (14.4%) |
| Transportation & Warehousing | 14 (20.6%) | 54 (79.4%) |
| Utilities | 0 (0.0%) | 10 (100.0%) |
| Information | 76 (60.3%) | 50 (39.7%) |
| Finance & Insurance | 372 (87.3%) | 54 (12.7%) |
| Real Estate, Rental & Leasing | 20 (45.5%) | 24 (54.5%) |
| Professional & Scientific | 386 (44.5%) | 481 (55.5%) |
| Enterprise Management | 0 (0.0%) | 0 (0.0%) |
| Administrative & Support | 87 (57.6%) | 64 (42.4%) |
| Educational Services | 256 (37.1%) | 434 (62.9%) |
| Health Care & Social Assistance | 185 (56.1%) | 145 (43.9%) |
| Arts, Entertainment & Recreation | 82 (61.7%) | 51 (38.4%) |
| Accommodation & Food Services | 97 (66.9%) | 48 (33.1%) |
| Public Administration | 58 (69.1%) | 26 (30.9%) |
| Total | 2,058 (54.7%) | 1,702 (45.3%) |
Education in Pleasantville
School Enrollment in Pleasantville
The most common levels of schooling among the 2,152 students in Pleasantville are high school (771 | 35.8%), elementary school (406 | 18.9%), and middle school (331 | 15.4%).
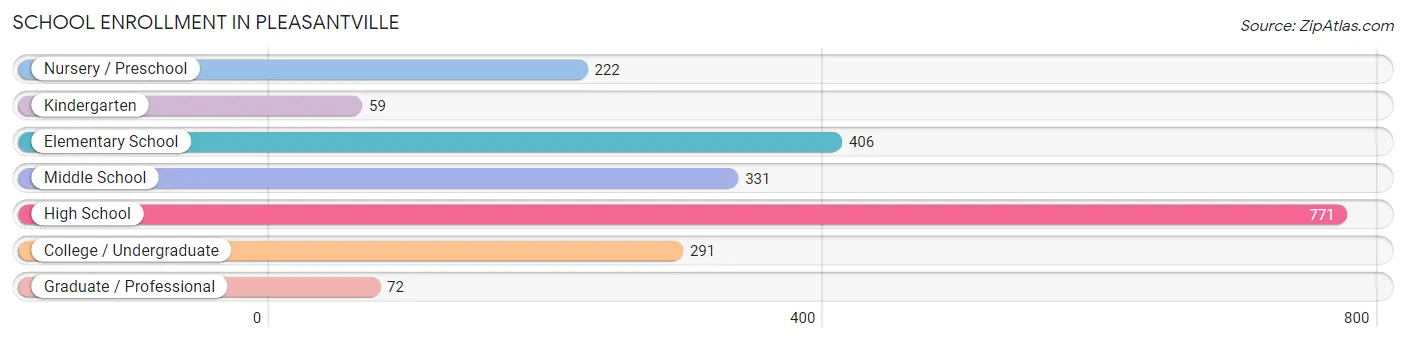
| School Level | # Students | % Students |
| Nursery / Preschool | 222 | 10.3% |
| Kindergarten | 59 | 2.7% |
| Elementary School | 406 | 18.9% |
| Middle School | 331 | 15.4% |
| High School | 771 | 35.8% |
| College / Undergraduate | 291 | 13.5% |
| Graduate / Professional | 72 | 3.4% |
| Total | 2,152 | 100.0% |
School Enrollment by Age by Funding Source in Pleasantville
Out of a total of 2,152 students who are enrolled in schools in Pleasantville, 254 (11.8%) attend a private institution, while the remaining 1,898 (88.2%) are enrolled in public schools. The age group of 35 years and over has the highest likelihood of being enrolled in private schools, with 55 (68.8% in the age bracket) enrolled. Conversely, the age group of 5 to 9 year old has the lowest likelihood of being enrolled in a private school, with 384 (100.0% in the age bracket) attending a public institution.
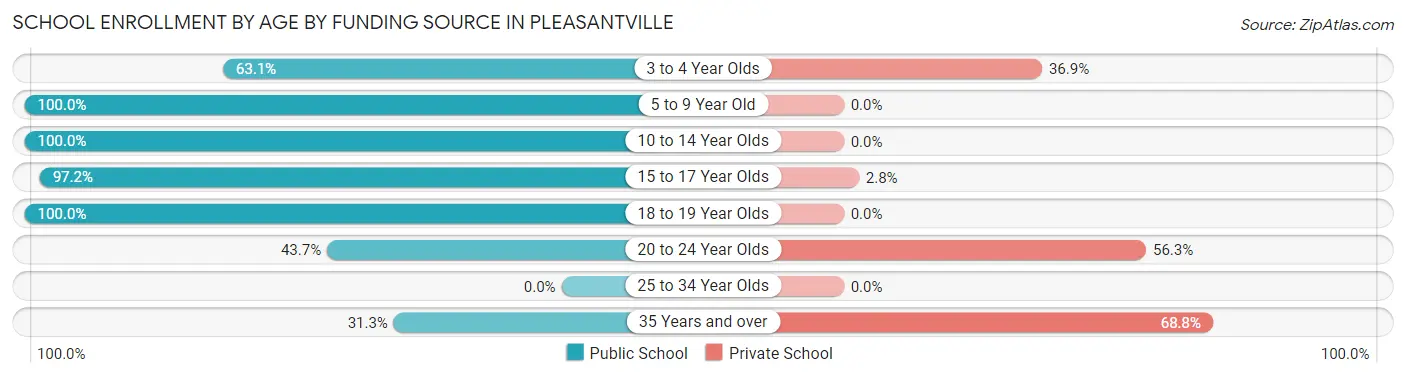
| Age Bracket | Public School | Private School |
| 3 to 4 Year Olds | 140 (63.1%) | 82 (36.9%) |
| 5 to 9 Year Old | 384 (100.0%) | 0 (0.0%) |
| 10 to 14 Year Olds | 474 (100.0%) | 0 (0.0%) |
| 15 to 17 Year Olds | 621 (97.2%) | 18 (2.8%) |
| 18 to 19 Year Olds | 179 (100.0%) | 0 (0.0%) |
| 20 to 24 Year Olds | 76 (43.7%) | 98 (56.3%) |
| 25 to 34 Year Olds | 0 (0.0%) | 0 (0.0%) |
| 35 Years and over | 25 (31.2%) | 55 (68.8%) |
| Total | 1,898 (88.2%) | 254 (11.8%) |
Educational Attainment by Field of Study in Pleasantville
Business (685 | 17.3%), education (501 | 12.7%), engineering (416 | 10.5%), social sciences (414 | 10.4%), and science & technology (319 | 8.1%) are the most common fields of study among 3,960 individuals in Pleasantville who have obtained a bachelor's degree or higher.
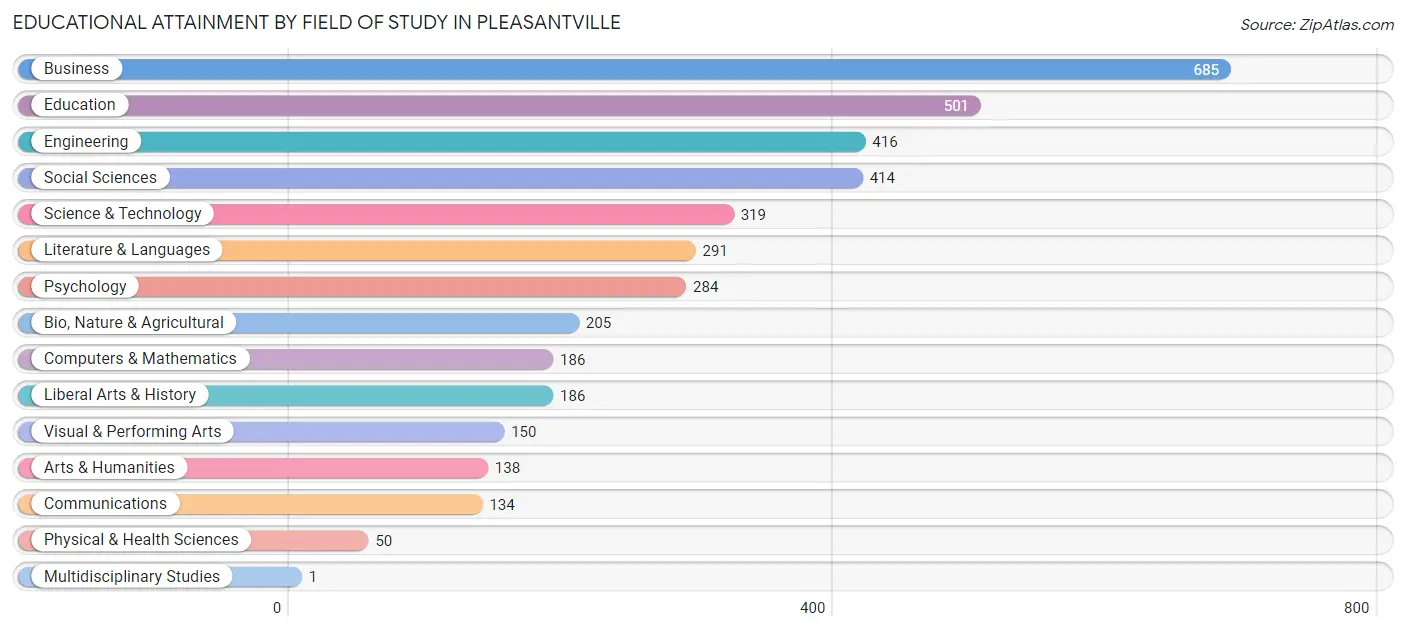
| Field of Study | # Graduates | % Graduates |
| Computers & Mathematics | 186 | 4.7% |
| Bio, Nature & Agricultural | 205 | 5.2% |
| Physical & Health Sciences | 50 | 1.3% |
| Psychology | 284 | 7.2% |
| Social Sciences | 414 | 10.4% |
| Engineering | 416 | 10.5% |
| Multidisciplinary Studies | 1 | 0.0% |
| Science & Technology | 319 | 8.1% |
| Business | 685 | 17.3% |
| Education | 501 | 12.7% |
| Literature & Languages | 291 | 7.3% |
| Liberal Arts & History | 186 | 4.7% |
| Visual & Performing Arts | 150 | 3.8% |
| Communications | 134 | 3.4% |
| Arts & Humanities | 138 | 3.5% |
| Total | 3,960 | 100.0% |
Transportation & Commute in Pleasantville
Vehicle Availability by Sex in Pleasantville
The most prevalent vehicle ownership categories in Pleasantville are males with 2 vehicles (843, accounting for 42.6%) and females with 2 vehicles (571, making up 50.7%).
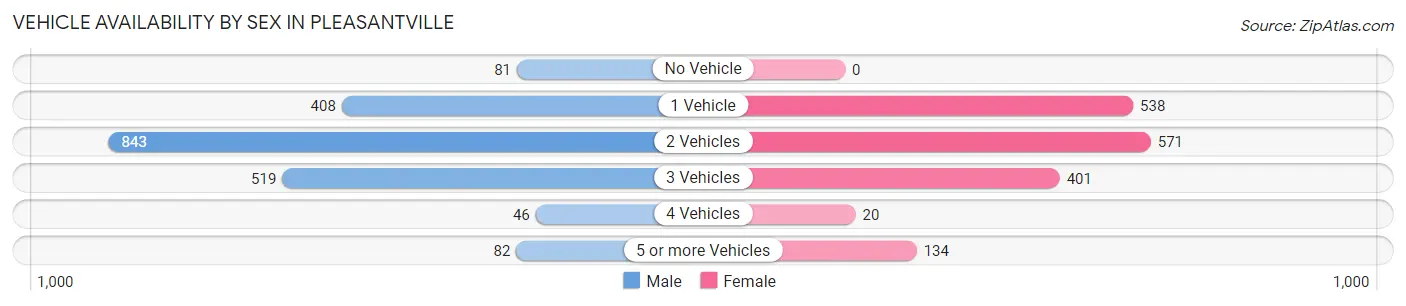
| Vehicles Available | Male | Female |
| No Vehicle | 81 (4.1%) | 0 (0.0%) |
| 1 Vehicle | 408 (20.6%) | 538 (32.3%) |
| 2 Vehicles | 843 (42.6%) | 571 (34.3%) |
| 3 Vehicles | 519 (26.2%) | 401 (24.1%) |
| 4 Vehicles | 46 (2.3%) | 20 (1.2%) |
| 5 or more Vehicles | 82 (4.1%) | 134 (8.1%) |
| Total | 1,979 (100.0%) | 1,664 (100.0%) |
Commute Time in Pleasantville
The most frequently occuring commute durations in Pleasantville are 20 to 24 minutes (483 commuters, 15.3%), 30 to 34 minutes (396 commuters, 12.6%), and 15 to 19 minutes (381 commuters, 12.1%).
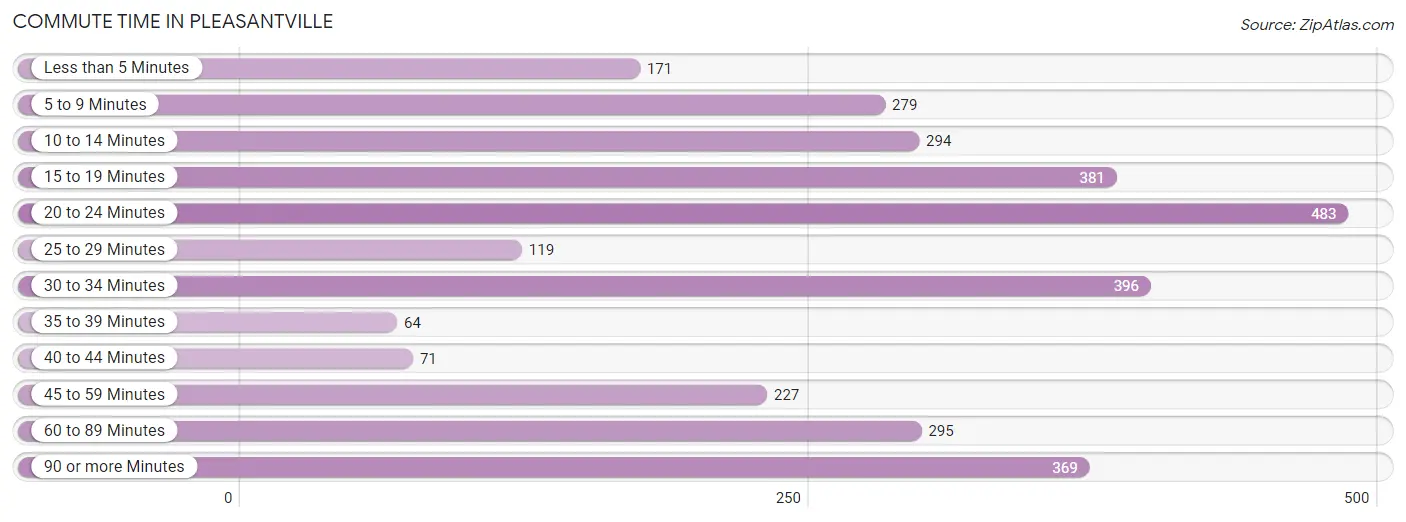
| Commute Time | # Commuters | % Commuters |
| Less than 5 Minutes | 171 | 5.4% |
| 5 to 9 Minutes | 279 | 8.9% |
| 10 to 14 Minutes | 294 | 9.3% |
| 15 to 19 Minutes | 381 | 12.1% |
| 20 to 24 Minutes | 483 | 15.3% |
| 25 to 29 Minutes | 119 | 3.8% |
| 30 to 34 Minutes | 396 | 12.6% |
| 35 to 39 Minutes | 64 | 2.0% |
| 40 to 44 Minutes | 71 | 2.2% |
| 45 to 59 Minutes | 227 | 7.2% |
| 60 to 89 Minutes | 295 | 9.4% |
| 90 or more Minutes | 369 | 11.7% |
Commute Time by Sex in Pleasantville
The most common commute times in Pleasantville are 90 or more minutes (216 commuters, 13.0%) for males and 20 to 24 minutes (301 commuters, 20.2%) for females.
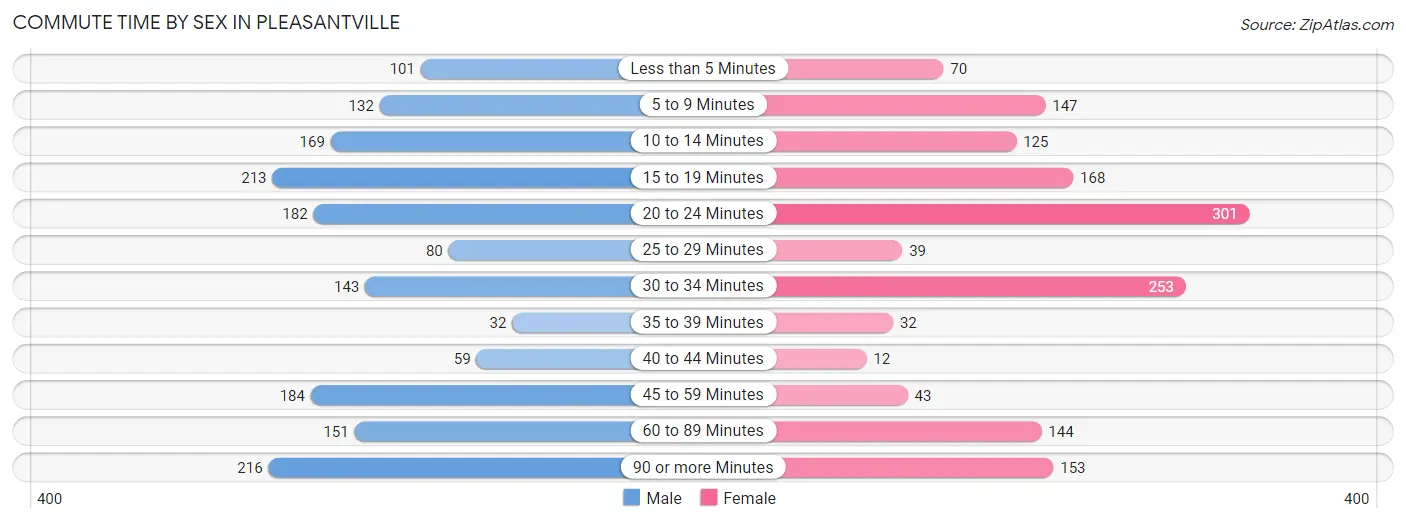
| Commute Time | Male | Female |
| Less than 5 Minutes | 101 (6.1%) | 70 (4.7%) |
| 5 to 9 Minutes | 132 (7.9%) | 147 (9.9%) |
| 10 to 14 Minutes | 169 (10.2%) | 125 (8.4%) |
| 15 to 19 Minutes | 213 (12.8%) | 168 (11.3%) |
| 20 to 24 Minutes | 182 (11.0%) | 301 (20.2%) |
| 25 to 29 Minutes | 80 (4.8%) | 39 (2.6%) |
| 30 to 34 Minutes | 143 (8.6%) | 253 (17.0%) |
| 35 to 39 Minutes | 32 (1.9%) | 32 (2.1%) |
| 40 to 44 Minutes | 59 (3.5%) | 12 (0.8%) |
| 45 to 59 Minutes | 184 (11.1%) | 43 (2.9%) |
| 60 to 89 Minutes | 151 (9.1%) | 144 (9.7%) |
| 90 or more Minutes | 216 (13.0%) | 153 (10.3%) |
Time of Departure to Work by Sex in Pleasantville
The most frequent times of departure to work in Pleasantville are 8:00 AM to 8:29 AM (380, 22.9%) for males and 8:00 AM to 8:29 AM (344, 23.1%) for females.
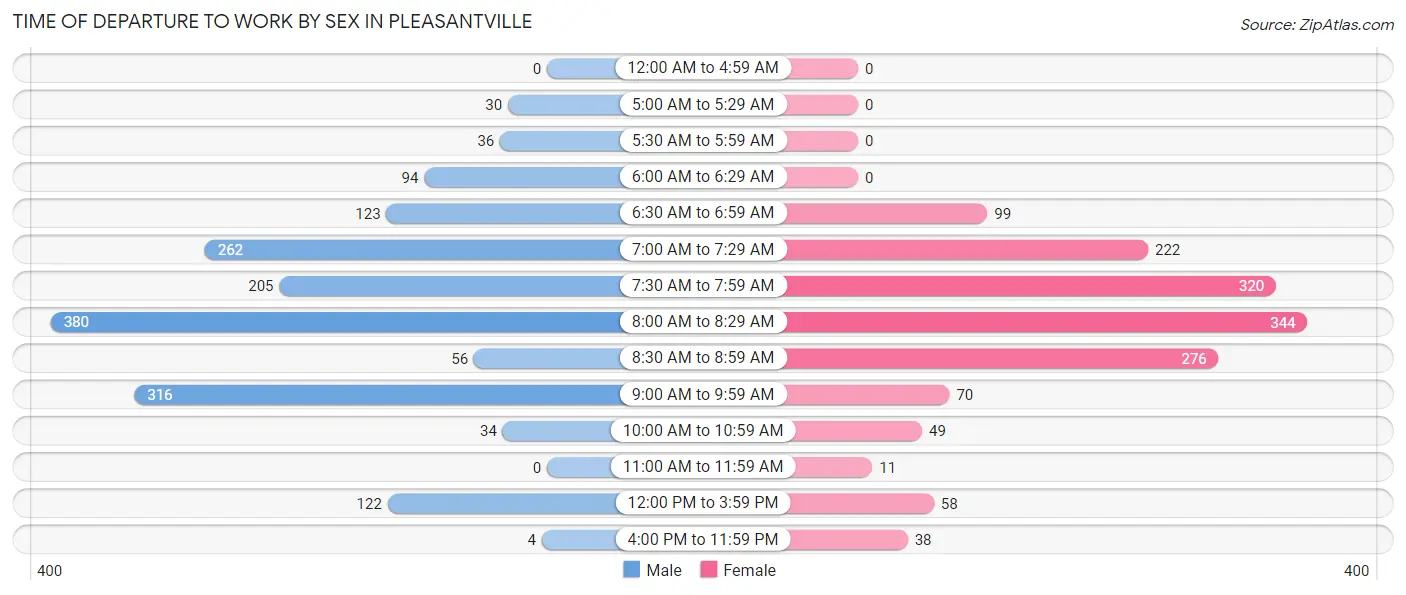
| Time of Departure | Male | Female |
| 12:00 AM to 4:59 AM | 0 (0.0%) | 0 (0.0%) |
| 5:00 AM to 5:29 AM | 30 (1.8%) | 0 (0.0%) |
| 5:30 AM to 5:59 AM | 36 (2.2%) | 0 (0.0%) |
| 6:00 AM to 6:29 AM | 94 (5.7%) | 0 (0.0%) |
| 6:30 AM to 6:59 AM | 123 (7.4%) | 99 (6.7%) |
| 7:00 AM to 7:29 AM | 262 (15.8%) | 222 (14.9%) |
| 7:30 AM to 7:59 AM | 205 (12.3%) | 320 (21.5%) |
| 8:00 AM to 8:29 AM | 380 (22.9%) | 344 (23.1%) |
| 8:30 AM to 8:59 AM | 56 (3.4%) | 276 (18.6%) |
| 9:00 AM to 9:59 AM | 316 (19.0%) | 70 (4.7%) |
| 10:00 AM to 10:59 AM | 34 (2.1%) | 49 (3.3%) |
| 11:00 AM to 11:59 AM | 0 (0.0%) | 11 (0.7%) |
| 12:00 PM to 3:59 PM | 122 (7.3%) | 58 (3.9%) |
| 4:00 PM to 11:59 PM | 4 (0.2%) | 38 (2.6%) |
| Total | 1,662 (100.0%) | 1,487 (100.0%) |
Housing Occupancy in Pleasantville
Occupancy by Ownership in Pleasantville
Of the total 2,609 dwellings in Pleasantville, owner-occupied units account for 2,141 (82.1%), while renter-occupied units make up 468 (17.9%).
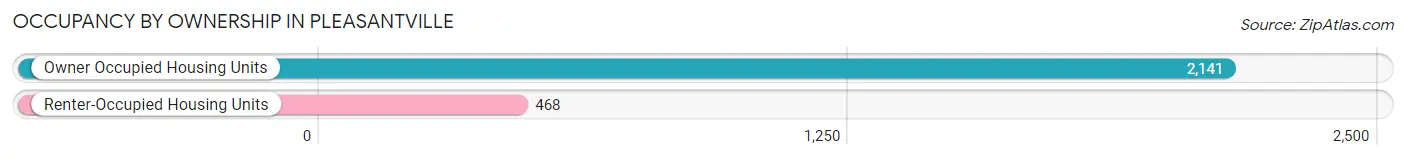
| Occupancy | # Housing Units | % Housing Units |
| Owner Occupied Housing Units | 2,141 | 82.1% |
| Renter-Occupied Housing Units | 468 | 17.9% |
| Total Occupied Housing Units | 2,609 | 100.0% |
Occupancy by Household Size in Pleasantville
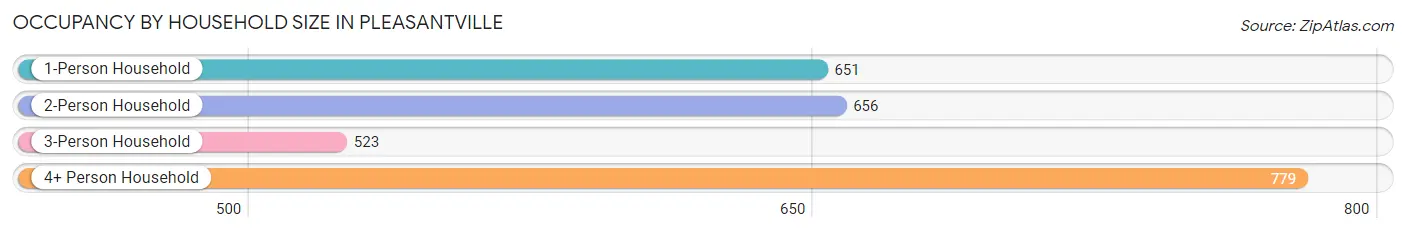
| Household Size | # Housing Units | % Housing Units |
| 1-Person Household | 651 | 24.9% |
| 2-Person Household | 656 | 25.1% |
| 3-Person Household | 523 | 20.1% |
| 4+ Person Household | 779 | 29.9% |
| Total Housing Units | 2,609 | 100.0% |
Occupancy by Ownership by Household Size in Pleasantville
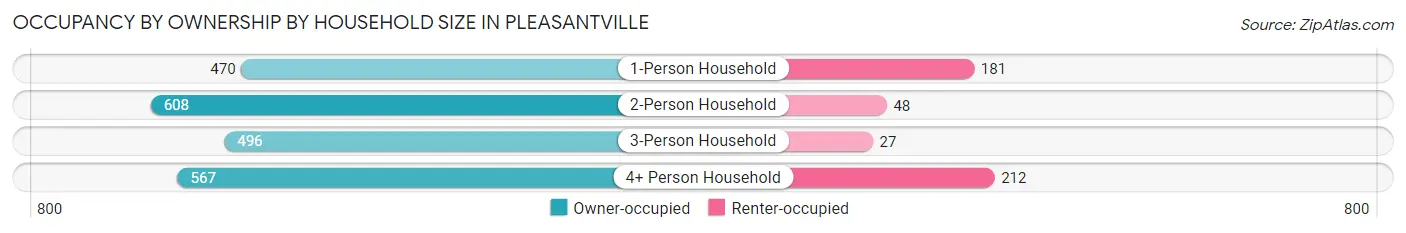
| Household Size | Owner-occupied | Renter-occupied |
| 1-Person Household | 470 (72.2%) | 181 (27.8%) |
| 2-Person Household | 608 (92.7%) | 48 (7.3%) |
| 3-Person Household | 496 (94.8%) | 27 (5.2%) |
| 4+ Person Household | 567 (72.8%) | 212 (27.2%) |
| Total Housing Units | 2,141 (82.1%) | 468 (17.9%) |
Occupancy by Educational Attainment in Pleasantville
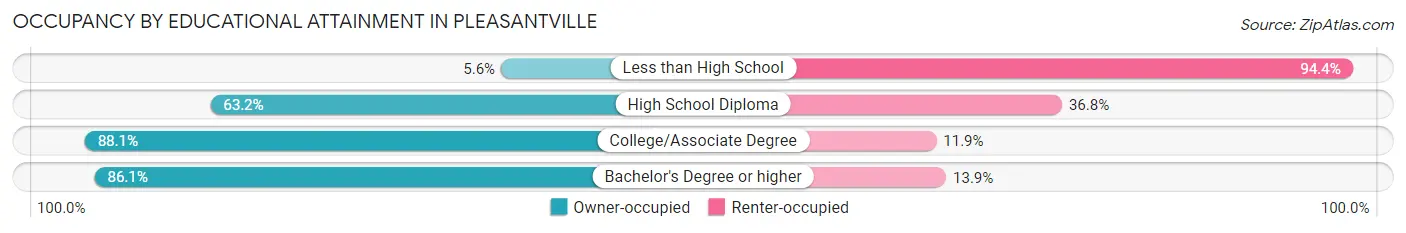
| Household Size | Owner-occupied | Renter-occupied |
| Less than High School | 4 (5.6%) | 68 (94.4%) |
| High School Diploma | 144 (63.2%) | 84 (36.8%) |
| College/Associate Degree | 192 (88.1%) | 26 (11.9%) |
| Bachelor's Degree or higher | 1,801 (86.1%) | 290 (13.9%) |
Occupancy by Age of Householder in Pleasantville
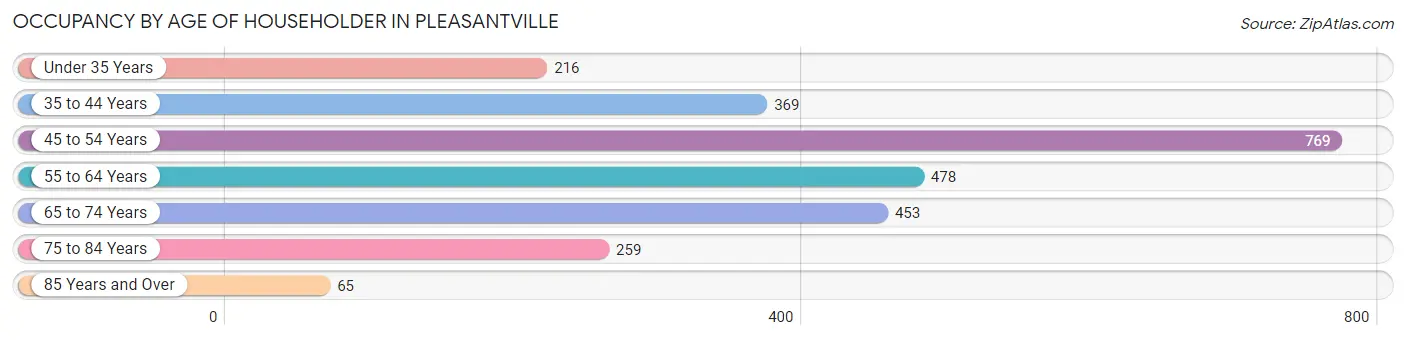
| Age Bracket | # Households | % Households |
| Under 35 Years | 216 | 8.3% |
| 35 to 44 Years | 369 | 14.1% |
| 45 to 54 Years | 769 | 29.5% |
| 55 to 64 Years | 478 | 18.3% |
| 65 to 74 Years | 453 | 17.4% |
| 75 to 84 Years | 259 | 9.9% |
| 85 Years and Over | 65 | 2.5% |
| Total | 2,609 | 100.0% |
Housing Finances in Pleasantville
Median Income by Occupancy in Pleasantville
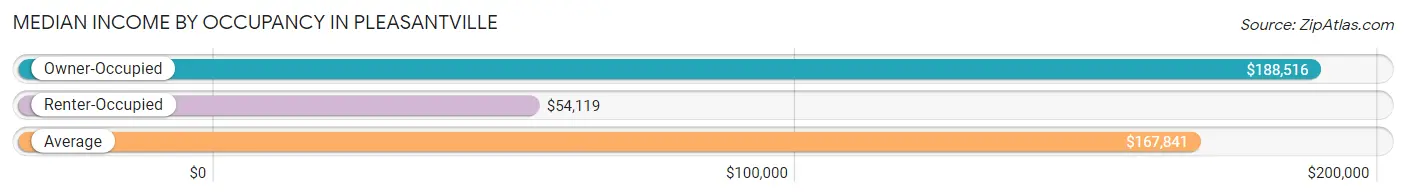
| Occupancy Type | # Households | Median Income |
| Owner-Occupied | 2,141 (82.1%) | $188,516 |
| Renter-Occupied | 468 (17.9%) | $54,119 |
| Average | 2,609 (100.0%) | $167,841 |
Occupancy by Householder Income Bracket in Pleasantville
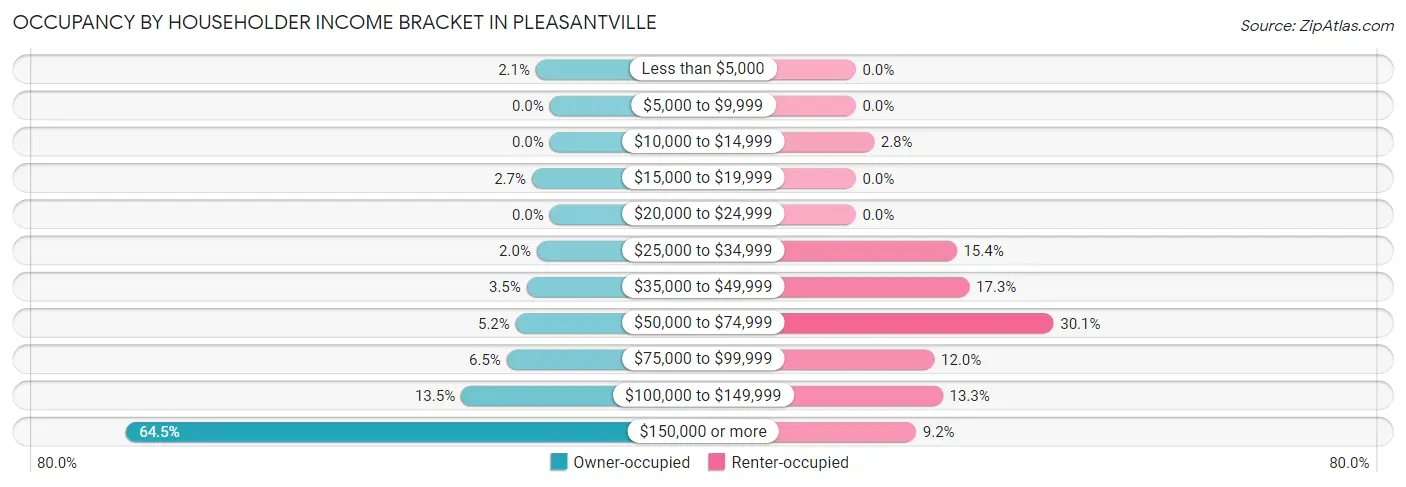
| Income Bracket | Owner-occupied | Renter-occupied |
| Less than $5,000 | 45 (2.1%) | 0 (0.0%) |
| $5,000 to $9,999 | 0 (0.0%) | 0 (0.0%) |
| $10,000 to $14,999 | 0 (0.0%) | 13 (2.8%) |
| $15,000 to $19,999 | 58 (2.7%) | 0 (0.0%) |
| $20,000 to $24,999 | 0 (0.0%) | 0 (0.0%) |
| $25,000 to $34,999 | 42 (2.0%) | 72 (15.4%) |
| $35,000 to $49,999 | 75 (3.5%) | 81 (17.3%) |
| $50,000 to $74,999 | 111 (5.2%) | 141 (30.1%) |
| $75,000 to $99,999 | 140 (6.5%) | 56 (12.0%) |
| $100,000 to $149,999 | 289 (13.5%) | 62 (13.3%) |
| $150,000 or more | 1,381 (64.5%) | 43 (9.2%) |
| Total | 2,141 (100.0%) | 468 (100.0%) |
Monthly Housing Cost Tiers in Pleasantville
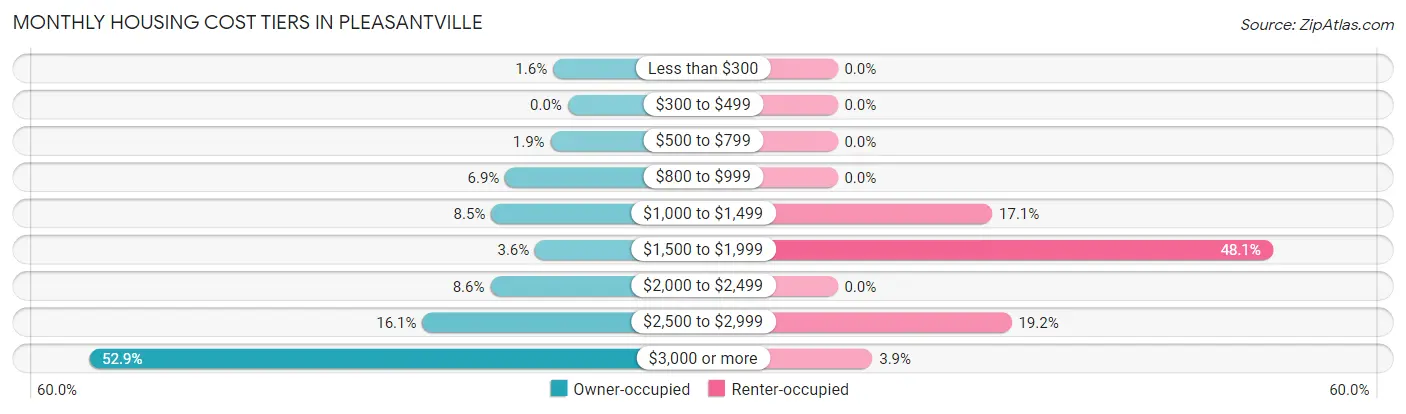
| Monthly Cost | Owner-occupied | Renter-occupied |
| Less than $300 | 35 (1.6%) | 0 (0.0%) |
| $300 to $499 | 0 (0.0%) | 0 (0.0%) |
| $500 to $799 | 41 (1.9%) | 0 (0.0%) |
| $800 to $999 | 148 (6.9%) | 0 (0.0%) |
| $1,000 to $1,499 | 181 (8.5%) | 80 (17.1%) |
| $1,500 to $1,999 | 77 (3.6%) | 225 (48.1%) |
| $2,000 to $2,499 | 183 (8.6%) | 0 (0.0%) |
| $2,500 to $2,999 | 344 (16.1%) | 90 (19.2%) |
| $3,000 or more | 1,132 (52.9%) | 18 (3.8%) |
| Total | 2,141 (100.0%) | 468 (100.0%) |
Physical Housing Characteristics in Pleasantville
Housing Structures in Pleasantville
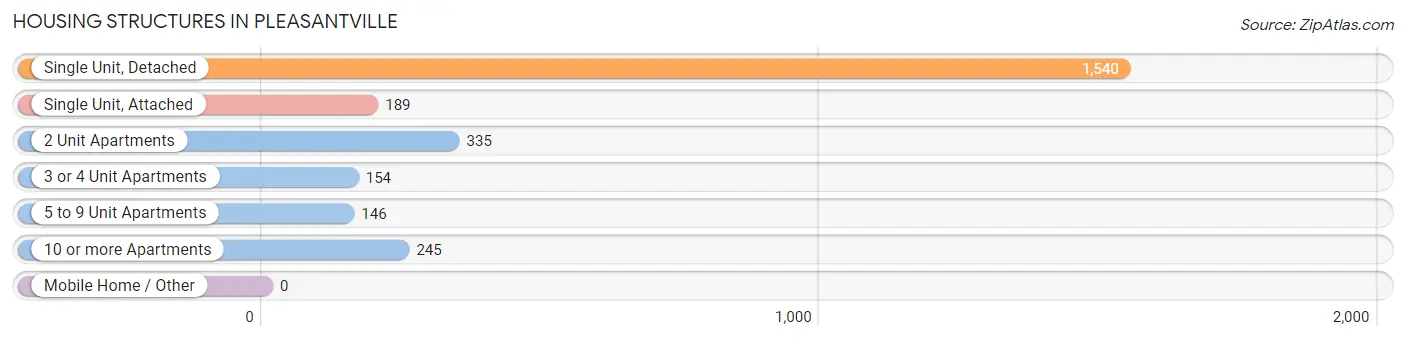
| Structure Type | # Housing Units | % Housing Units |
| Single Unit, Detached | 1,540 | 59.0% |
| Single Unit, Attached | 189 | 7.2% |
| 2 Unit Apartments | 335 | 12.8% |
| 3 or 4 Unit Apartments | 154 | 5.9% |
| 5 to 9 Unit Apartments | 146 | 5.6% |
| 10 or more Apartments | 245 | 9.4% |
| Mobile Home / Other | 0 | 0.0% |
| Total | 2,609 | 100.0% |
Housing Structures by Occupancy in Pleasantville
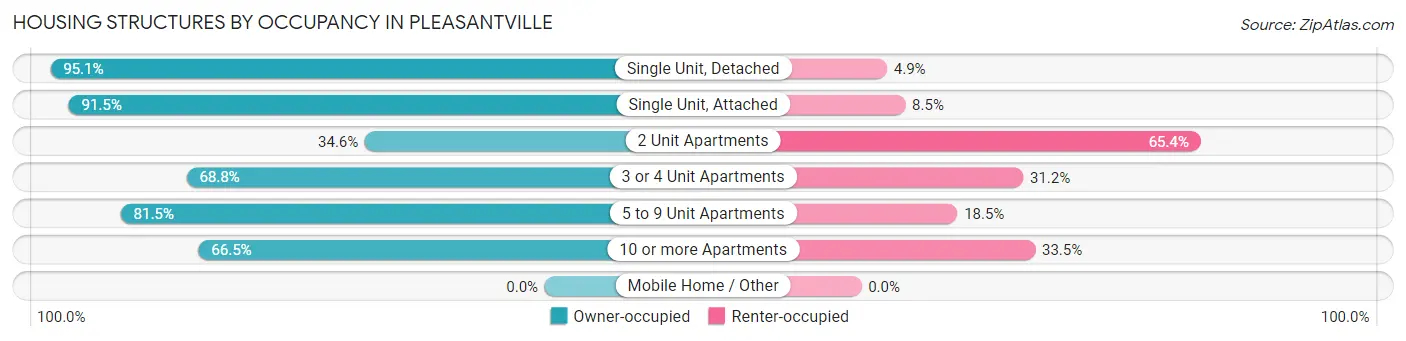
| Structure Type | Owner-occupied | Renter-occupied |
| Single Unit, Detached | 1,464 (95.1%) | 76 (4.9%) |
| Single Unit, Attached | 173 (91.5%) | 16 (8.5%) |
| 2 Unit Apartments | 116 (34.6%) | 219 (65.4%) |
| 3 or 4 Unit Apartments | 106 (68.8%) | 48 (31.2%) |
| 5 to 9 Unit Apartments | 119 (81.5%) | 27 (18.5%) |
| 10 or more Apartments | 163 (66.5%) | 82 (33.5%) |
| Mobile Home / Other | 0 (0.0%) | 0 (0.0%) |
| Total | 2,141 (82.1%) | 468 (17.9%) |
Housing Structures by Number of Rooms in Pleasantville
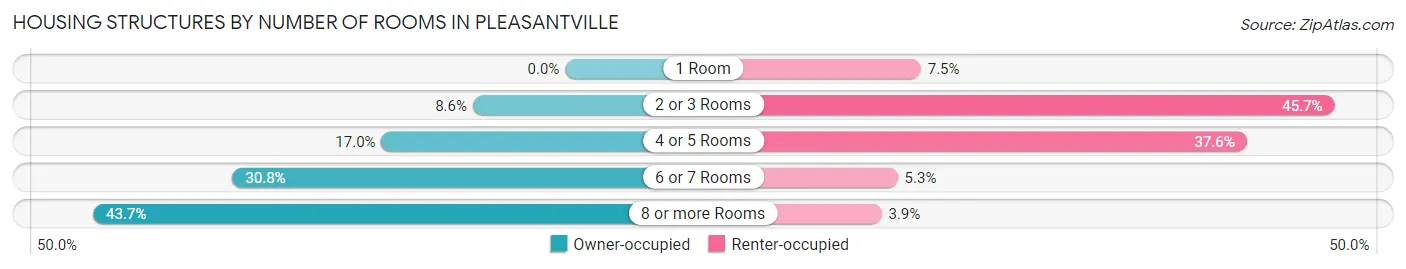
| Number of Rooms | Owner-occupied | Renter-occupied |
| 1 Room | 0 (0.0%) | 35 (7.5%) |
| 2 or 3 Rooms | 183 (8.6%) | 214 (45.7%) |
| 4 or 5 Rooms | 364 (17.0%) | 176 (37.6%) |
| 6 or 7 Rooms | 659 (30.8%) | 25 (5.3%) |
| 8 or more Rooms | 935 (43.7%) | 18 (3.8%) |
| Total | 2,141 (100.0%) | 468 (100.0%) |
Housing Structure by Heating Type in Pleasantville
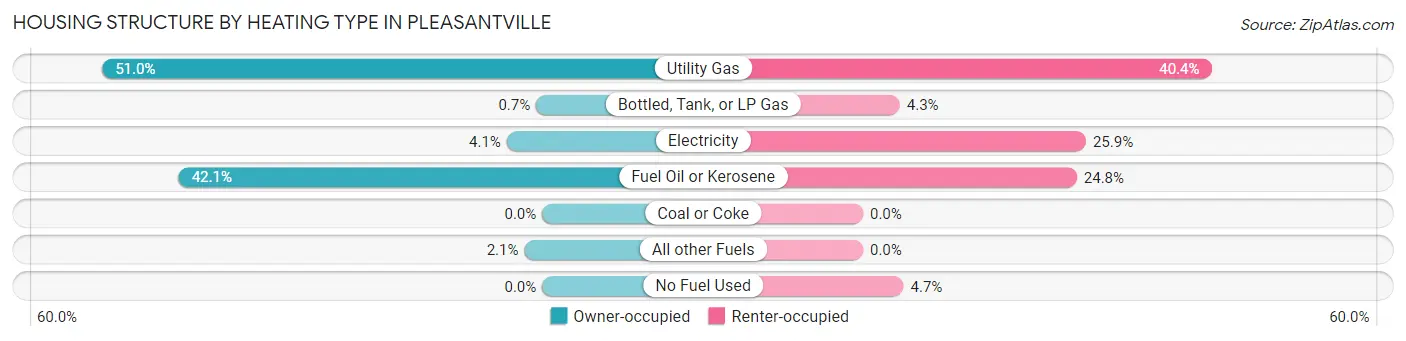
| Heating Type | Owner-occupied | Renter-occupied |
| Utility Gas | 1,092 (51.0%) | 189 (40.4%) |
| Bottled, Tank, or LP Gas | 15 (0.7%) | 20 (4.3%) |
| Electricity | 88 (4.1%) | 121 (25.9%) |
| Fuel Oil or Kerosene | 902 (42.1%) | 116 (24.8%) |
| Coal or Coke | 0 (0.0%) | 0 (0.0%) |
| All other Fuels | 44 (2.1%) | 0 (0.0%) |
| No Fuel Used | 0 (0.0%) | 22 (4.7%) |
| Total | 2,141 (100.0%) | 468 (100.0%) |
Household Vehicle Usage in Pleasantville
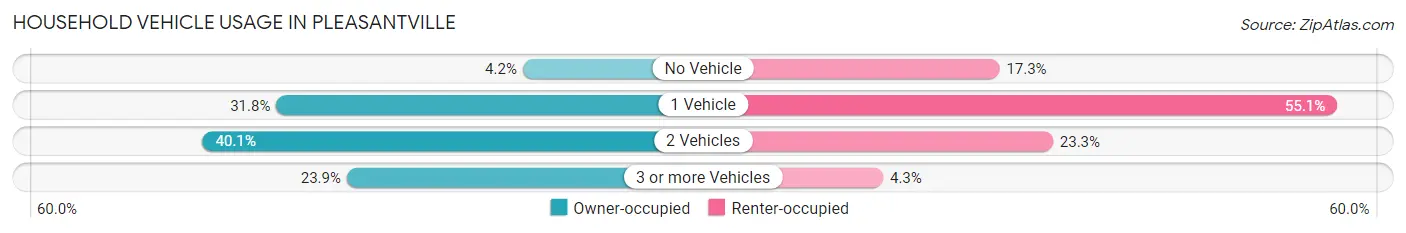
| Vehicles per Household | Owner-occupied | Renter-occupied |
| No Vehicle | 90 (4.2%) | 81 (17.3%) |
| 1 Vehicle | 681 (31.8%) | 258 (55.1%) |
| 2 Vehicles | 858 (40.1%) | 109 (23.3%) |
| 3 or more Vehicles | 512 (23.9%) | 20 (4.3%) |
| Total | 2,141 (100.0%) | 468 (100.0%) |
Real Estate & Mortgages in Pleasantville
Real Estate and Mortgage Overview in Pleasantville
| Characteristic | Without Mortgage | With Mortgage |
| Housing Units | 938 | 1,203 |
| Median Property Value | $766,000 | $776,200 |
| Median Household Income | $178,125 | $870 |
| Monthly Housing Costs | $1,501 | $954 |
| Real Estate Taxes | $10,001 | $59 |
Property Value by Mortgage Status in Pleasantville
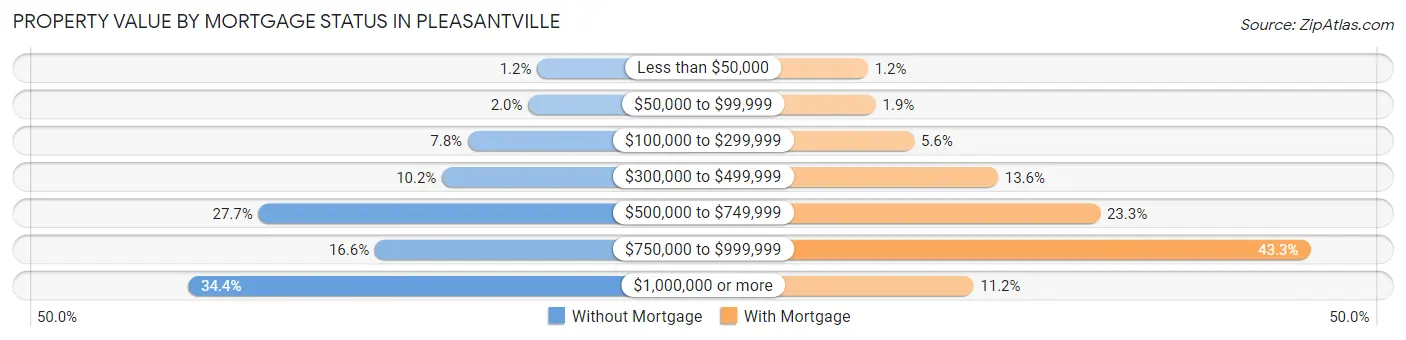
| Property Value | Without Mortgage | With Mortgage |
| Less than $50,000 | 11 (1.2%) | 14 (1.2%) |
| $50,000 to $99,999 | 19 (2.0%) | 23 (1.9%) |
| $100,000 to $299,999 | 73 (7.8%) | 67 (5.6%) |
| $300,000 to $499,999 | 96 (10.2%) | 163 (13.6%) |
| $500,000 to $749,999 | 260 (27.7%) | 280 (23.3%) |
| $750,000 to $999,999 | 156 (16.6%) | 521 (43.3%) |
| $1,000,000 or more | 323 (34.4%) | 135 (11.2%) |
| Total | 938 (100.0%) | 1,203 (100.0%) |
Household Income by Mortgage Status in Pleasantville
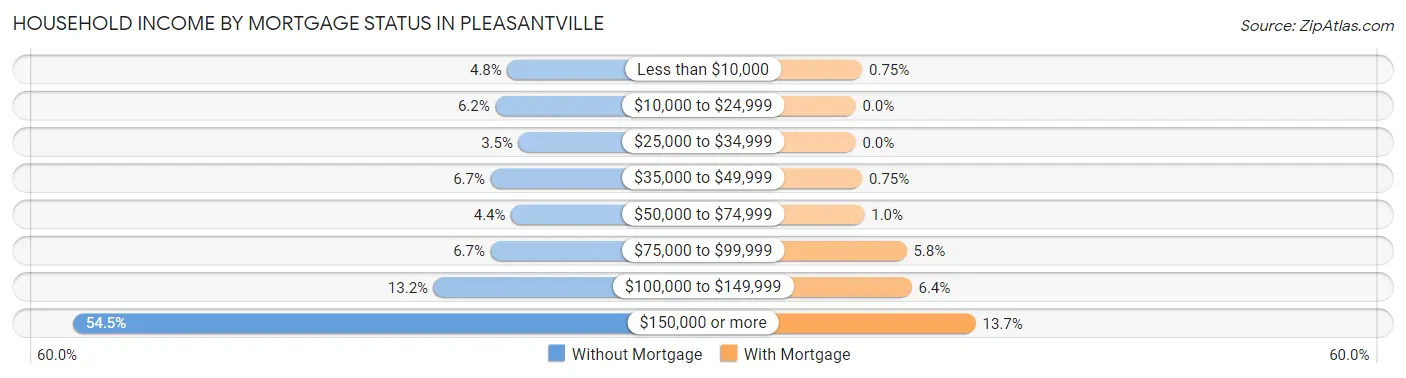
| Household Income | Without Mortgage | With Mortgage |
| Less than $10,000 | 45 (4.8%) | 9 (0.7%) |
| $10,000 to $24,999 | 58 (6.2%) | 0 (0.0%) |
| $25,000 to $34,999 | 33 (3.5%) | 0 (0.0%) |
| $35,000 to $49,999 | 63 (6.7%) | 9 (0.7%) |
| $50,000 to $74,999 | 41 (4.4%) | 12 (1.0%) |
| $75,000 to $99,999 | 63 (6.7%) | 70 (5.8%) |
| $100,000 to $149,999 | 124 (13.2%) | 77 (6.4%) |
| $150,000 or more | 511 (54.5%) | 165 (13.7%) |
| Total | 938 (100.0%) | 1,203 (100.0%) |
Property Value to Household Income Ratio in Pleasantville
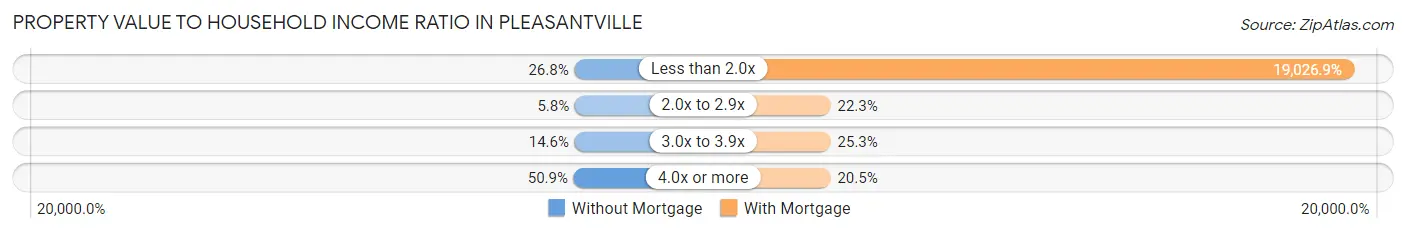
| Value-to-Income Ratio | Without Mortgage | With Mortgage |
| Less than 2.0x | 251 (26.8%) | 228,893 (19,026.8%) |
| 2.0x to 2.9x | 54 (5.8%) | 268 (22.3%) |
| 3.0x to 3.9x | 137 (14.6%) | 304 (25.3%) |
| 4.0x or more | 477 (50.8%) | 247 (20.5%) |
| Total | 938 (100.0%) | 1,203 (100.0%) |
Real Estate Taxes by Mortgage Status in Pleasantville
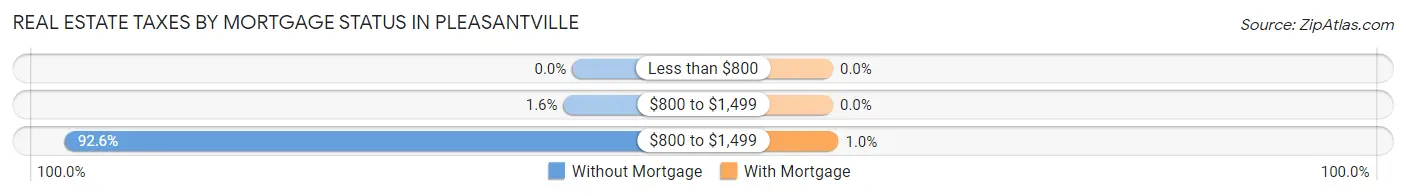
| Property Taxes | Without Mortgage | With Mortgage |
| Less than $800 | 0 (0.0%) | 0 (0.0%) |
| $800 to $1,499 | 15 (1.6%) | 0 (0.0%) |
| $800 to $1,499 | 869 (92.6%) | 12 (1.0%) |
| Total | 938 (100.0%) | 1,203 (100.0%) |
Health & Disability in Pleasantville
Health Insurance Coverage by Age in Pleasantville
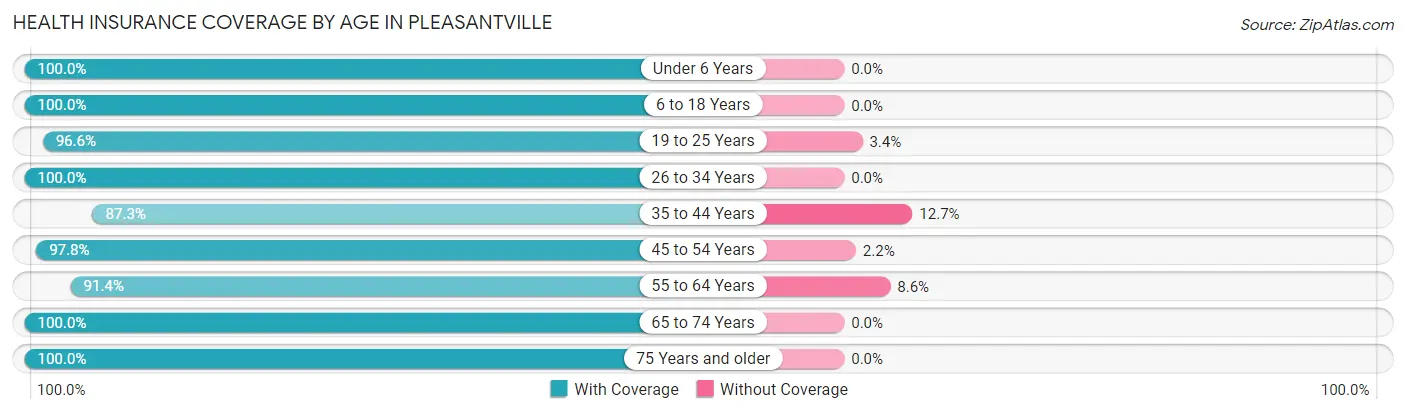
| Age Bracket | With Coverage | Without Coverage |
| Under 6 Years | 386 (100.0%) | 0 (0.0%) |
| 6 to 18 Years | 1,510 (100.0%) | 0 (0.0%) |
| 19 to 25 Years | 371 (96.6%) | 13 (3.4%) |
| 26 to 34 Years | 491 (100.0%) | 0 (0.0%) |
| 35 to 44 Years | 839 (87.3%) | 122 (12.7%) |
| 45 to 54 Years | 1,440 (97.8%) | 32 (2.2%) |
| 55 to 64 Years | 724 (91.4%) | 68 (8.6%) |
| 65 to 74 Years | 776 (100.0%) | 0 (0.0%) |
| 75 Years and older | 452 (100.0%) | 0 (0.0%) |
| Total | 6,989 (96.8%) | 235 (3.3%) |
Health Insurance Coverage by Citizenship Status in Pleasantville
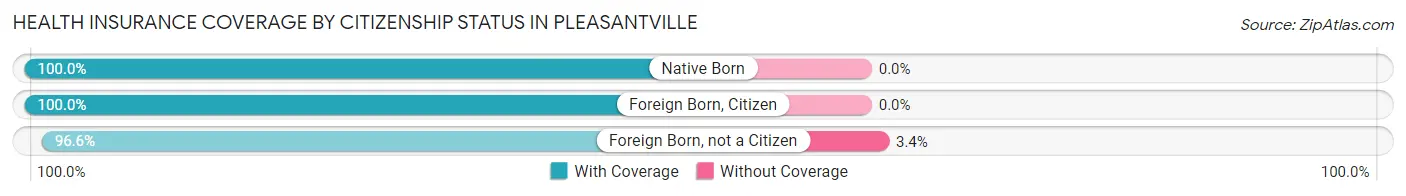
| Citizenship Status | With Coverage | Without Coverage |
| Native Born | 386 (100.0%) | 0 (0.0%) |
| Foreign Born, Citizen | 1,510 (100.0%) | 0 (0.0%) |
| Foreign Born, not a Citizen | 371 (96.6%) | 13 (3.4%) |
Health Insurance Coverage by Household Income in Pleasantville
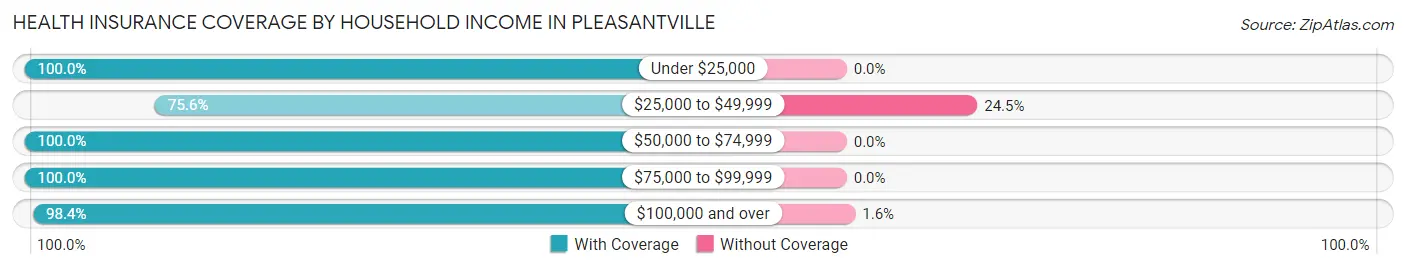
| Household Income | With Coverage | Without Coverage |
| Under $25,000 | 135 (100.0%) | 0 (0.0%) |
| $25,000 to $49,999 | 445 (75.5%) | 144 (24.4%) |
| $50,000 to $74,999 | 403 (100.0%) | 0 (0.0%) |
| $75,000 to $99,999 | 382 (100.0%) | 0 (0.0%) |
| $100,000 and over | 5,585 (98.4%) | 91 (1.6%) |
Public vs Private Health Insurance Coverage by Age in Pleasantville
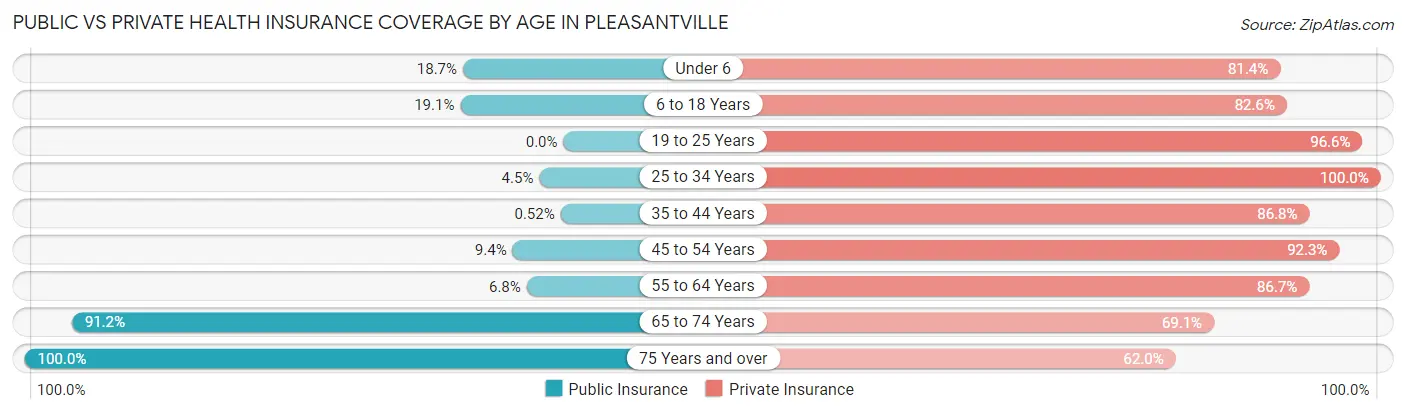
| Age Bracket | Public Insurance | Private Insurance |
| Under 6 | 72 (18.6%) | 314 (81.4%) |
| 6 to 18 Years | 289 (19.1%) | 1,247 (82.6%) |
| 19 to 25 Years | 0 (0.0%) | 371 (96.6%) |
| 25 to 34 Years | 22 (4.5%) | 491 (100.0%) |
| 35 to 44 Years | 5 (0.5%) | 834 (86.8%) |
| 45 to 54 Years | 139 (9.4%) | 1,359 (92.3%) |
| 55 to 64 Years | 54 (6.8%) | 687 (86.7%) |
| 65 to 74 Years | 708 (91.2%) | 536 (69.1%) |
| 75 Years and over | 452 (100.0%) | 280 (62.0%) |
| Total | 1,741 (24.1%) | 6,119 (84.7%) |
Disability Status by Sex by Age in Pleasantville
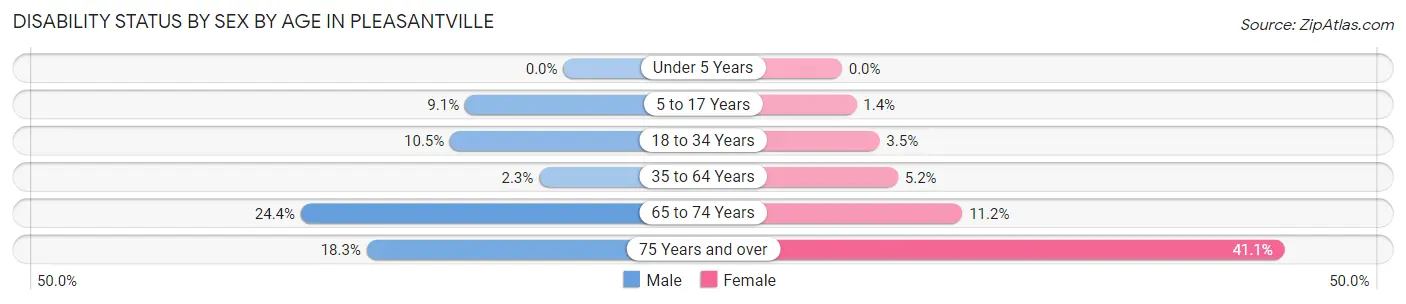
| Age Bracket | Male | Female |
| Under 5 Years | 0 (0.0%) | 0 (0.0%) |
| 5 to 17 Years | 64 (9.1%) | 9 (1.3%) |
| 18 to 34 Years | 60 (10.5%) | 17 (3.5%) |
| 35 to 64 Years | 34 (2.2%) | 89 (5.2%) |
| 65 to 74 Years | 115 (24.4%) | 34 (11.2%) |
| 75 Years and over | 23 (18.2%) | 134 (41.1%) |
Disability Class by Sex by Age in Pleasantville
Disability Class: Hearing Difficulty
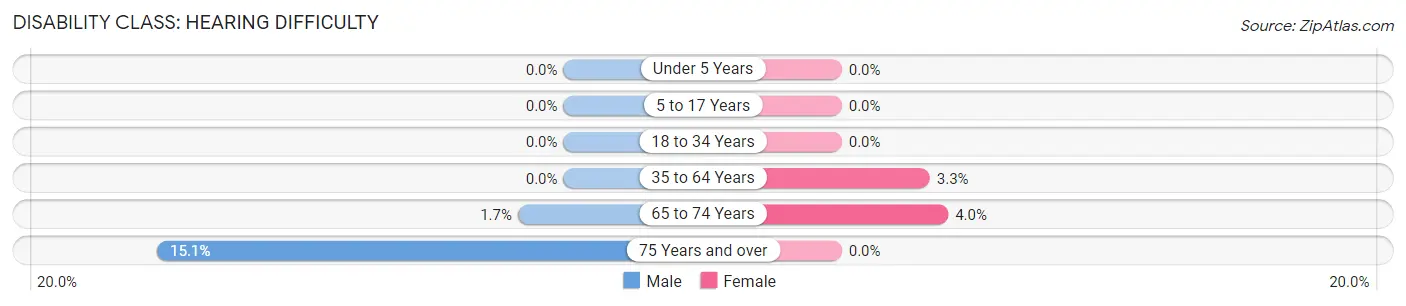
| Age Bracket | Male | Female |
| Under 5 Years | 0 (0.0%) | 0 (0.0%) |
| 5 to 17 Years | 0 (0.0%) | 0 (0.0%) |
| 18 to 34 Years | 0 (0.0%) | 0 (0.0%) |
| 35 to 64 Years | 0 (0.0%) | 56 (3.3%) |
| 65 to 74 Years | 8 (1.7%) | 12 (4.0%) |
| 75 Years and over | 19 (15.1%) | 0 (0.0%) |
Disability Class: Vision Difficulty
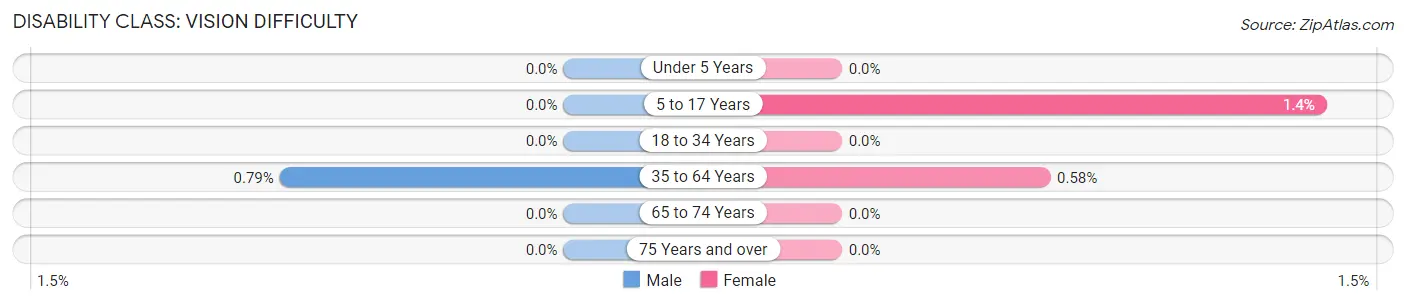
| Age Bracket | Male | Female |
| Under 5 Years | 0 (0.0%) | 0 (0.0%) |
| 5 to 17 Years | 0 (0.0%) | 9 (1.3%) |
| 18 to 34 Years | 0 (0.0%) | 0 (0.0%) |
| 35 to 64 Years | 12 (0.8%) | 10 (0.6%) |
| 65 to 74 Years | 0 (0.0%) | 0 (0.0%) |
| 75 Years and over | 0 (0.0%) | 0 (0.0%) |
Disability Class: Cognitive Difficulty
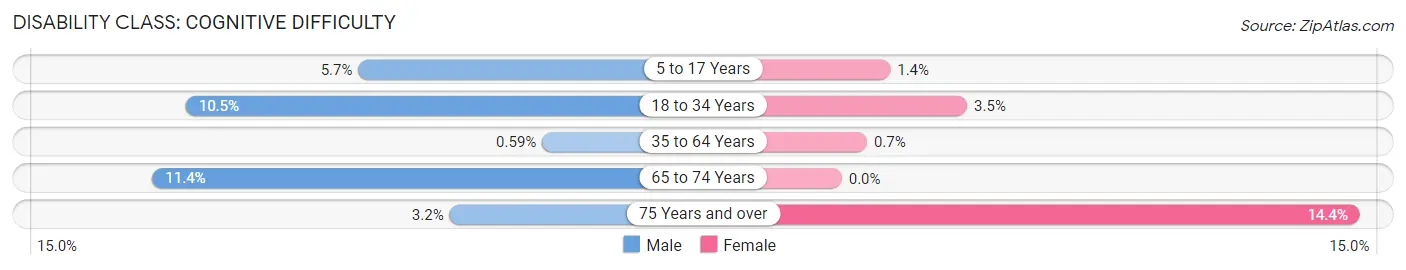
| Age Bracket | Male | Female |
| 5 to 17 Years | 40 (5.7%) | 9 (1.3%) |
| 18 to 34 Years | 60 (10.5%) | 17 (3.5%) |
| 35 to 64 Years | 9 (0.6%) | 12 (0.7%) |
| 65 to 74 Years | 54 (11.4%) | 0 (0.0%) |
| 75 Years and over | 4 (3.2%) | 47 (14.4%) |
Disability Class: Ambulatory Difficulty
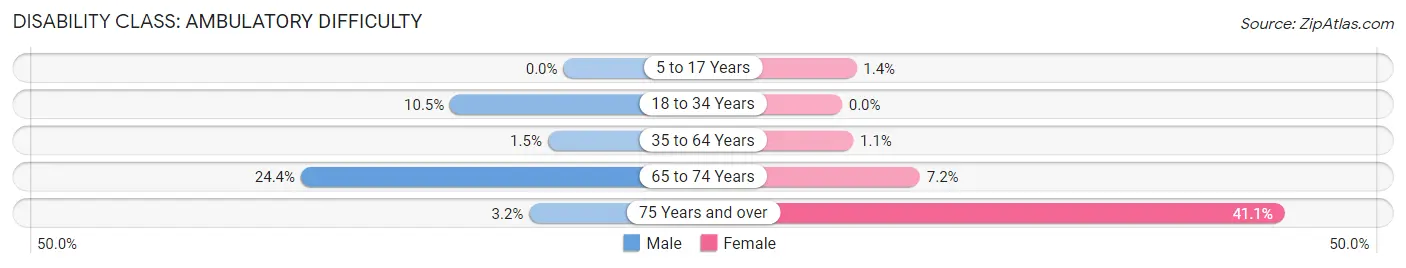
| Age Bracket | Male | Female |
| 5 to 17 Years | 0 (0.0%) | 9 (1.3%) |
| 18 to 34 Years | 60 (10.5%) | 0 (0.0%) |
| 35 to 64 Years | 22 (1.5%) | 18 (1.1%) |
| 65 to 74 Years | 115 (24.4%) | 22 (7.2%) |
| 75 Years and over | 4 (3.2%) | 134 (41.1%) |
Disability Class: Self-Care Difficulty
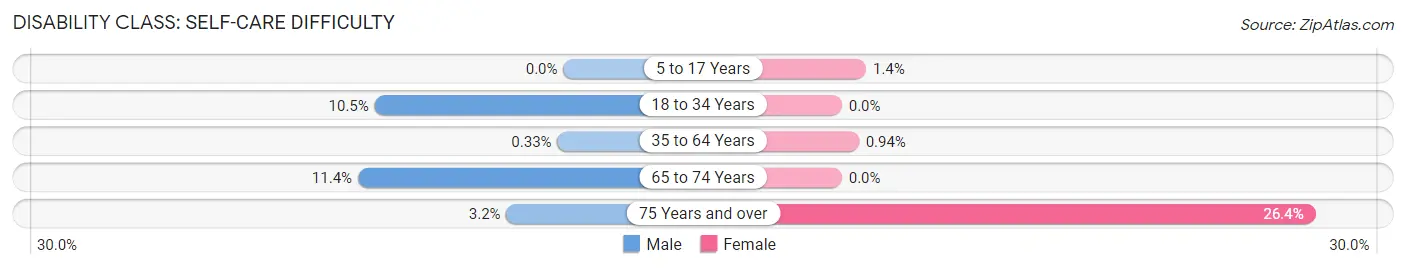
| Age Bracket | Male | Female |
| 5 to 17 Years | 0 (0.0%) | 9 (1.3%) |
| 18 to 34 Years | 60 (10.5%) | 0 (0.0%) |
| 35 to 64 Years | 5 (0.3%) | 16 (0.9%) |
| 65 to 74 Years | 54 (11.4%) | 0 (0.0%) |
| 75 Years and over | 4 (3.2%) | 86 (26.4%) |
Technology Access in Pleasantville
Computing Device Access in Pleasantville
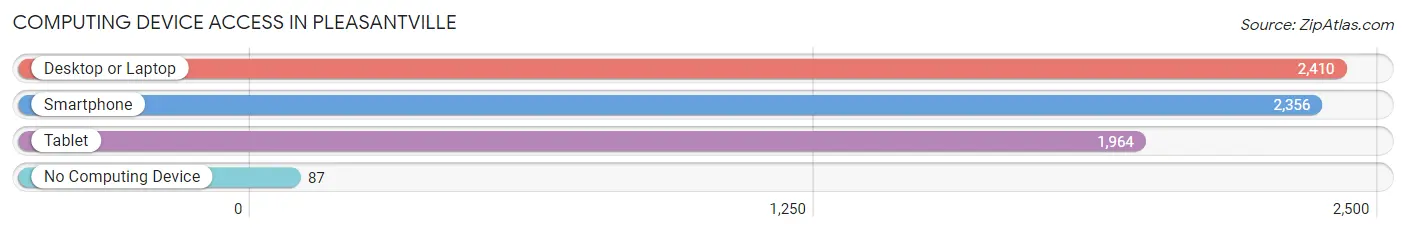
| Device Type | # Households | % Households |
| Desktop or Laptop | 2,410 | 92.4% |
| Smartphone | 2,356 | 90.3% |
| Tablet | 1,964 | 75.3% |
| No Computing Device | 87 | 3.3% |
| Total | 2,609 | 100.0% |
Internet Access in Pleasantville
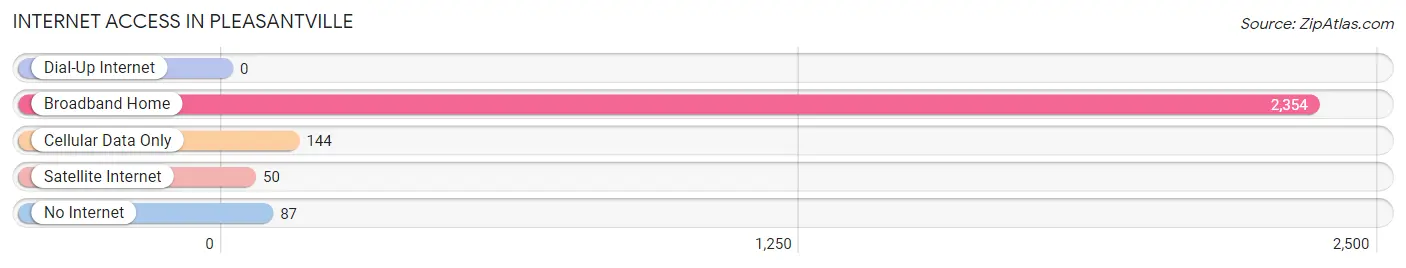
| Internet Type | # Households | % Households |
| Dial-Up Internet | 0 | 0.0% |
| Broadband Home | 2,354 | 90.2% |
| Cellular Data Only | 144 | 5.5% |
| Satellite Internet | 50 | 1.9% |
| No Internet | 87 | 3.3% |
| Total | 2,609 | 100.0% |
Pleasantville Summary
Pleasantville is a village located in the town of Mount Pleasant in Westchester County, New York. It is located about 30 miles north of New York City and is part of the New York metropolitan area. The village has a population of 7,019 as of the 2010 census.
History
The area that is now Pleasantville was originally inhabited by the Mohegan Indians. The first European settlers arrived in the area in the late 17th century. The village was originally known as "The Crossroads" because of its location at the intersection of the Albany Post Road and the Saw Mill River Road. In 1837, the village was renamed Pleasantville after the Pleasant family, who had settled in the area in the early 19th century.
In the late 19th century, Pleasantville became a popular summer resort destination for wealthy New Yorkers. The village was home to several large resorts, including the Pleasantville Hotel, the Pleasantville Inn, and the Pleasantville House. The resorts attracted many famous guests, including President Grover Cleveland and Mark Twain.
In the early 20th century, Pleasantville began to transition from a resort town to a residential community. The village was incorporated in 1922 and the first village president was elected in 1923.
Geography
Pleasantville is located at 41°7'25" North, 73°47'25" West (41.123611, -73.790278). The village is situated in the town of Mount Pleasant, which is located in Westchester County, New York. The village is located about 30 miles north of New York City.
The village has a total area of 1.2 square miles, all of which is land. The village is located in the Hudson Valley region of New York and is bordered by the Saw Mill River to the east and the Bronx River to the west.
Economy
The economy of Pleasantville is largely based on the service industry. The village is home to several restaurants, retail stores, and professional services. The village is also home to several corporate offices, including the headquarters of Reader's Digest and the Pleasantville branch of the Westchester County Bank.
The village is also home to several educational institutions, including Pace University, the Pleasantville campus of Westchester Community College, and the Pleasantville campus of the State University of New York.
Demographics
As of the 2010 census, the village had a population of 7,019. The racial makeup of the village was 87.2% White, 5.3% African American, 0.2% Native American, 3.2% Asian, 0.1% Pacific Islander, 1.7% from other races, and 2.3% from two or more races. Hispanic or Latino of any race were 6.2% of the population.
The median household income in the village was $76,944 and the median family income was $90,917. The per capita income for the village was $35,945. About 4.2% of families and 6.2% of the population were below the poverty line, including 8.2% of those under age 18 and 4.2% of those age 65 or over.
Common Questions
What is Per Capita Income in Pleasantville?
Per Capita income in Pleasantville is $80,691.
What is the Median Family Income in Pleasantville?
Median Family Income in Pleasantville is $229,682.
What is the Median Household income in Pleasantville?
Median Household Income in Pleasantville is $167,841.
What is Income or Wage Gap in Pleasantville?
Income or Wage Gap in Pleasantville is 20.8%.
Women in Pleasantville earn 79.2 cents for every dollar earned by a man.
What is Inequality or Gini Index in Pleasantville?
Inequality or Gini Index in Pleasantville is 0.47.
What is the Total Population of Pleasantville?
Total Population of Pleasantville is 7,430.
What is the Total Male Population of Pleasantville?
Total Male Population of Pleasantville is 3,827.
What is the Total Female Population of Pleasantville?
Total Female Population of Pleasantville is 3,603.
What is the Ratio of Males per 100 Females in Pleasantville?
There are 106.22 Males per 100 Females in Pleasantville.
What is the Ratio of Females per 100 Males in Pleasantville?
There are 94.15 Females per 100 Males in Pleasantville.
What is the Median Population Age in Pleasantville?
Median Population Age in Pleasantville is 42.3 Years.
What is the Average Family Size in Pleasantville
Average Family Size in Pleasantville is 3.3 People.
What is the Average Household Size in Pleasantville
Average Household Size in Pleasantville is 2.8 People.
How Large is the Labor Force in Pleasantville?
There are 3,988 People in the Labor Forcein in Pleasantville.
What is the Percentage of People in the Labor Force in Pleasantville?
67.7% of People are in the Labor Force in Pleasantville.
What is the Unemployment Rate in Pleasantville?
Unemployment Rate in Pleasantville is 5.8%.