Kensington, NY Map & Demographics
Kensington Map
Kensington Overview
$93,447
PER CAPITA INCOME
$250,001
AVG FAMILY INCOME
$210,000
AVG HOUSEHOLD INCOME
63.4%
WAGE / INCOME GAP [ % ]
36.6¢/ $1
WAGE / INCOME GAP [ $ ]
0.51
INEQUALITY / GINI INDEX
1,445
TOTAL POPULATION
669
MALE POPULATION
776
FEMALE POPULATION
86.21
MALES / 100 FEMALES
115.99
FEMALES / 100 MALES
44.1
MEDIAN AGE
3.6
AVG FAMILY SIZE
3.2
AVG HOUSEHOLD SIZE
609
LABOR FORCE [ PEOPLE ]
54.6%
PERCENT IN LABOR FORCE
4.4%
UNEMPLOYMENT RATE
Income in Kensington
Income Overview in Kensington
Per Capita Income in Kensington is $93,447, while median incomes of families and households are $250,001 and $210,000 respectively.
| Characteristic | Number | Measure |
| Per Capita Income | 1,445 | $93,447 |
| Median Family Income | 372 | $250,001 |
| Mean Family Income | 372 | $321,202 |
| Median Household Income | 458 | $210,000 |
| Mean Household Income | 458 | $294,685 |
| Income Deficit | 372 | $0 |
| Wage / Income Gap (%) | 1,445 | 63.37% |
| Wage / Income Gap ($) | 1,445 | 36.63¢ per $1 |
| Gini / Inequality Index | 1,445 | 0.51 |
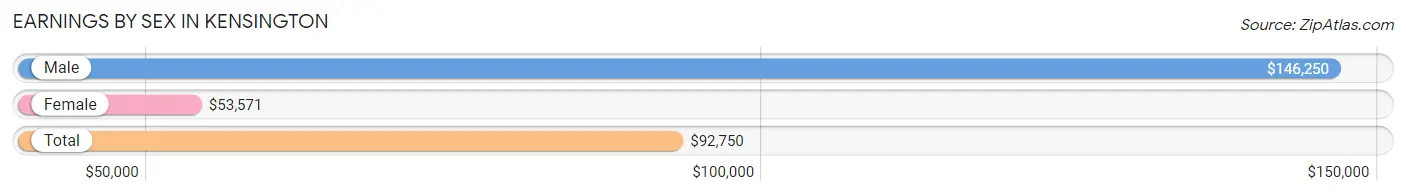
Earnings by Sex in Kensington
Average Earnings in Kensington are $92,750, $146,250 for men and $53,571 for women, a difference of 63.4%.
| Sex | Number | Average Earnings |
| Male | 332 (52.2%) | $146,250 |
| Female | 304 (47.8%) | $53,571 |
| Total | 636 (100.0%) | $92,750 |
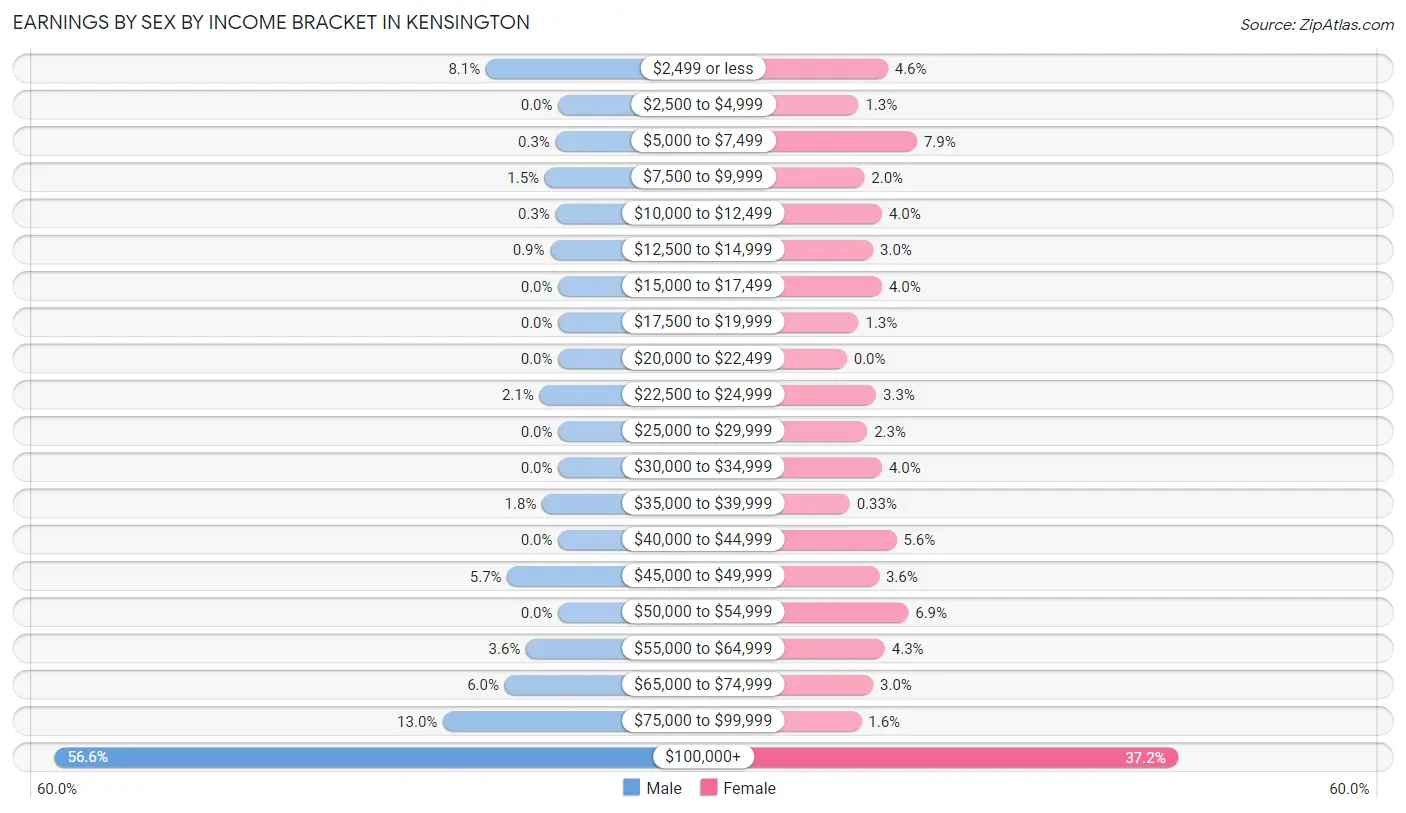
Earnings by Sex by Income Bracket in Kensington
The most common earnings brackets in Kensington are $100,000+ for men (188 | 56.6%) and $100,000+ for women (113 | 37.2%).
| Income | Male | Female |
| $2,499 or less | 27 (8.1%) | 14 (4.6%) |
| $2,500 to $4,999 | 0 (0.0%) | 4 (1.3%) |
| $5,000 to $7,499 | 1 (0.3%) | 24 (7.9%) |
| $7,500 to $9,999 | 5 (1.5%) | 6 (2.0%) |
| $10,000 to $12,499 | 1 (0.3%) | 12 (4.0%) |
| $12,500 to $14,999 | 3 (0.9%) | 9 (3.0%) |
| $15,000 to $17,499 | 0 (0.0%) | 12 (4.0%) |
| $17,500 to $19,999 | 0 (0.0%) | 4 (1.3%) |
| $20,000 to $22,499 | 0 (0.0%) | 0 (0.0%) |
| $22,500 to $24,999 | 7 (2.1%) | 10 (3.3%) |
| $25,000 to $29,999 | 0 (0.0%) | 7 (2.3%) |
| $30,000 to $34,999 | 0 (0.0%) | 12 (4.0%) |
| $35,000 to $39,999 | 6 (1.8%) | 1 (0.3%) |
| $40,000 to $44,999 | 0 (0.0%) | 17 (5.6%) |
| $45,000 to $49,999 | 19 (5.7%) | 11 (3.6%) |
| $50,000 to $54,999 | 0 (0.0%) | 21 (6.9%) |
| $55,000 to $64,999 | 12 (3.6%) | 13 (4.3%) |
| $65,000 to $74,999 | 20 (6.0%) | 9 (3.0%) |
| $75,000 to $99,999 | 43 (13.0%) | 5 (1.6%) |
| $100,000+ | 188 (56.6%) | 113 (37.2%) |
| Total | 332 (100.0%) | 304 (100.0%) |
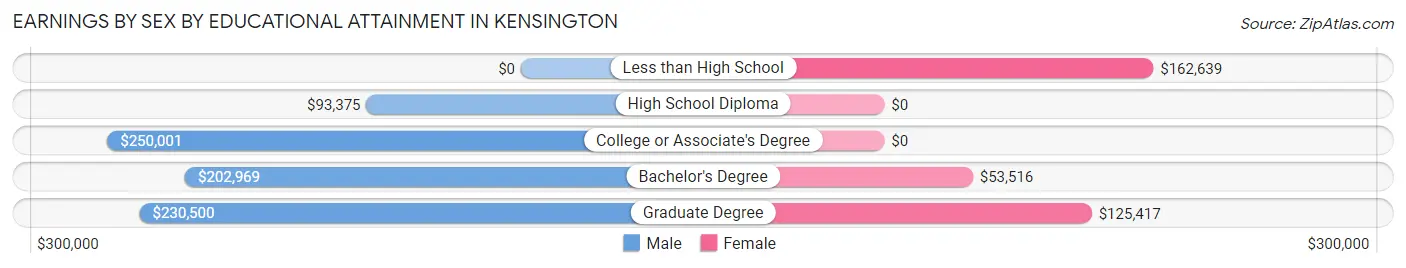
Earnings by Sex by Educational Attainment in Kensington
Average earnings in Kensington are $185,000 for men and $56,042 for women, a difference of 69.7%. Men with an educational attainment of college or associate's degree enjoy the highest average annual earnings of $250,001, while those with high school diploma education earn the least with $93,375. Women with an educational attainment of less than high school earn the most with the average annual earnings of $162,639, while those with bachelor's degree education have the smallest earnings of $53,516.
| Educational Attainment | Male Income | Female Income |
| Less than High School | - | - |
| High School Diploma | $93,375 | $0 |
| College or Associate's Degree | $250,001 | $0 |
| Bachelor's Degree | $202,969 | $53,516 |
| Graduate Degree | $230,500 | $125,417 |
| Total | $185,000 | $56,042 |
Family Income in Kensington
Family Income Brackets in Kensington
According to the Kensington family income data, there are 231 families falling into the $200,000+ income range, which is the most common income bracket and makes up 62.1% of all families.
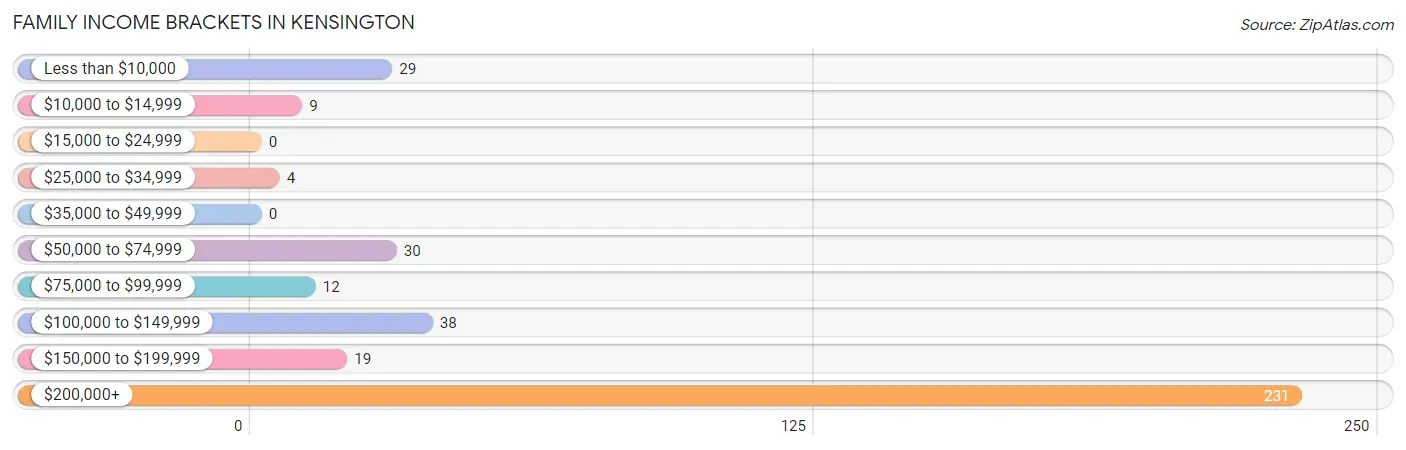
| Income Bracket | # Families | % Families |
| Less than $10,000 | 29 | 7.8% |
| $10,000 to $14,999 | 9 | 2.4% |
| $15,000 to $24,999 | 0 | 0.0% |
| $25,000 to $34,999 | 4 | 1.1% |
| $35,000 to $49,999 | 0 | 0.0% |
| $50,000 to $74,999 | 30 | 8.1% |
| $75,000 to $99,999 | 12 | 3.2% |
| $100,000 to $149,999 | 38 | 10.2% |
| $150,000 to $199,999 | 19 | 5.1% |
| $200,000+ | 231 | 62.1% |
Family Income by Famaliy Size in Kensington
3-person families (61 | 16.4%) account for the highest median family income in Kensington with $250,001 per family, while 2-person families (138 | 37.1%) have the highest median income of $115,625 per family member.
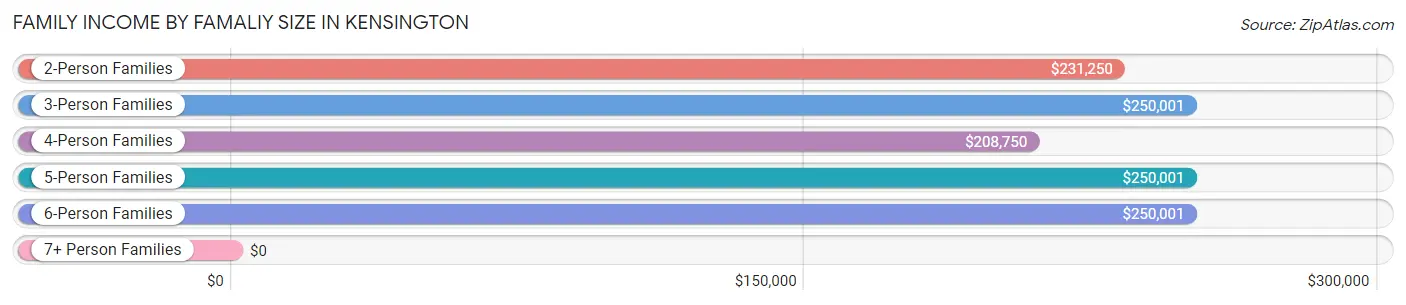
| Income Bracket | # Families | Median Income |
| 2-Person Families | 138 (37.1%) | $231,250 |
| 3-Person Families | 61 (16.4%) | $250,001 |
| 4-Person Families | 78 (21.0%) | $208,750 |
| 5-Person Families | 23 (6.2%) | $250,001 |
| 6-Person Families | 66 (17.7%) | $250,001 |
| 7+ Person Families | 6 (1.6%) | $0 |
| Total | 372 (100.0%) | $250,001 |
Family Income by Number of Earners in Kensington
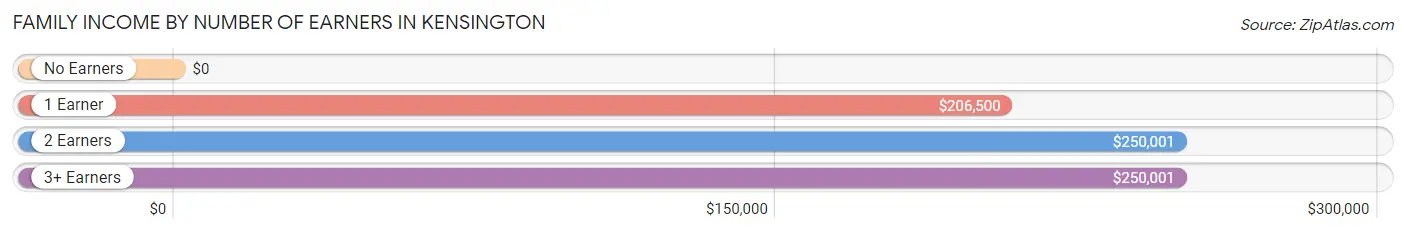
| Number of Earners | # Families | Median Income |
| No Earners | 54 (14.5%) | $0 |
| 1 Earner | 120 (32.3%) | $206,500 |
| 2 Earners | 163 (43.8%) | $250,001 |
| 3+ Earners | 35 (9.4%) | $250,001 |
| Total | 372 (100.0%) | $250,001 |
Household Income in Kensington
Household Income Brackets in Kensington
With 249 households falling in the category, the $200,000+ income range is the most frequent in Kensington, accounting for 54.4% of all households. In contrast, only 4 households (0.9%) fall into the $25,000 to $34,999 income bracket, making it the least populous group.
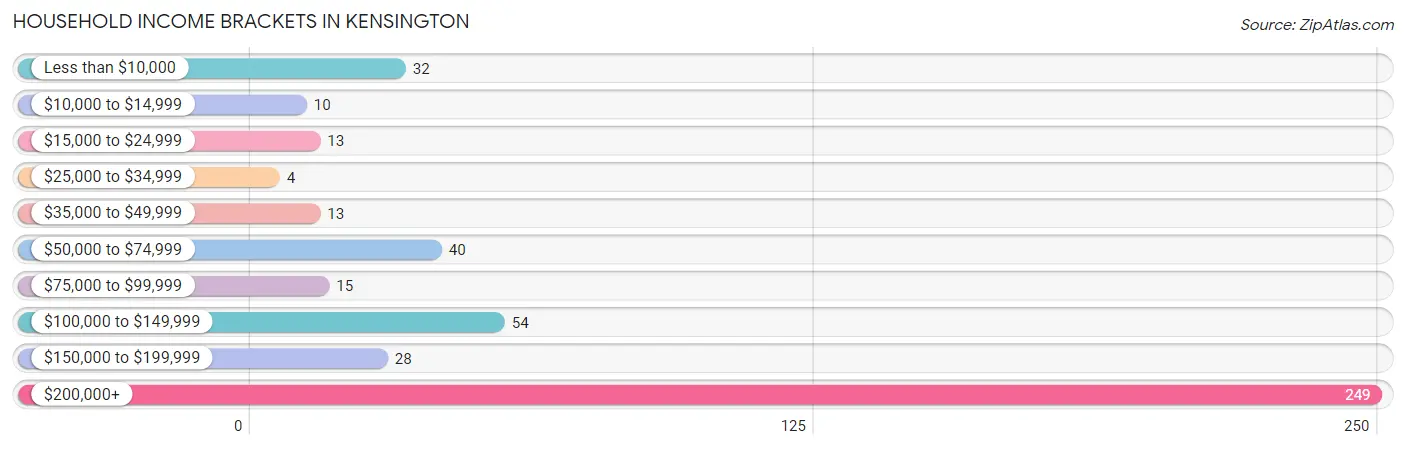
| Income Bracket | # Households | % Households |
| Less than $10,000 | 32 | 7.0% |
| $10,000 to $14,999 | 10 | 2.2% |
| $15,000 to $24,999 | 13 | 2.8% |
| $25,000 to $34,999 | 4 | 0.9% |
| $35,000 to $49,999 | 13 | 2.8% |
| $50,000 to $74,999 | 40 | 8.7% |
| $75,000 to $99,999 | 15 | 3.3% |
| $100,000 to $149,999 | 54 | 11.8% |
| $150,000 to $199,999 | 28 | 6.1% |
| $200,000+ | 249 | 54.4% |
Household Income by Householder Age in Kensington
The median household income in Kensington is $210,000, with the highest median household income of $231,250 found in the 45 to 64 years age bracket for the primary householder. A total of 176 households (38.4%) fall into this category.
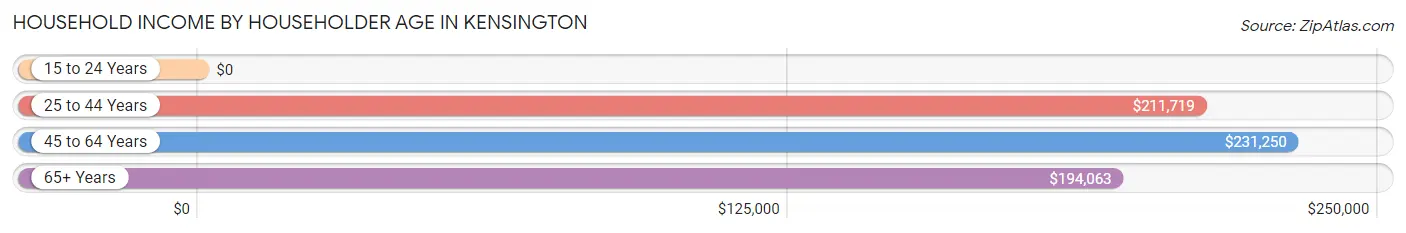
| Income Bracket | # Households | Median Income |
| 15 to 24 Years | 0 (0.0%) | $0 |
| 25 to 44 Years | 81 (17.7%) | $211,719 |
| 45 to 64 Years | 176 (38.4%) | $231,250 |
| 65+ Years | 201 (43.9%) | $194,063 |
| Total | 458 (100.0%) | $210,000 |
Poverty in Kensington
Income Below Poverty by Sex and Age in Kensington
With 7.0% poverty level for males and 9.0% for females among the residents of Kensington, 75 year old and over males and 18 to 24 year old females are the most vulnerable to poverty, with 25 males (29.8%) and 12 females (29.3%) in their respective age groups living below the poverty level.
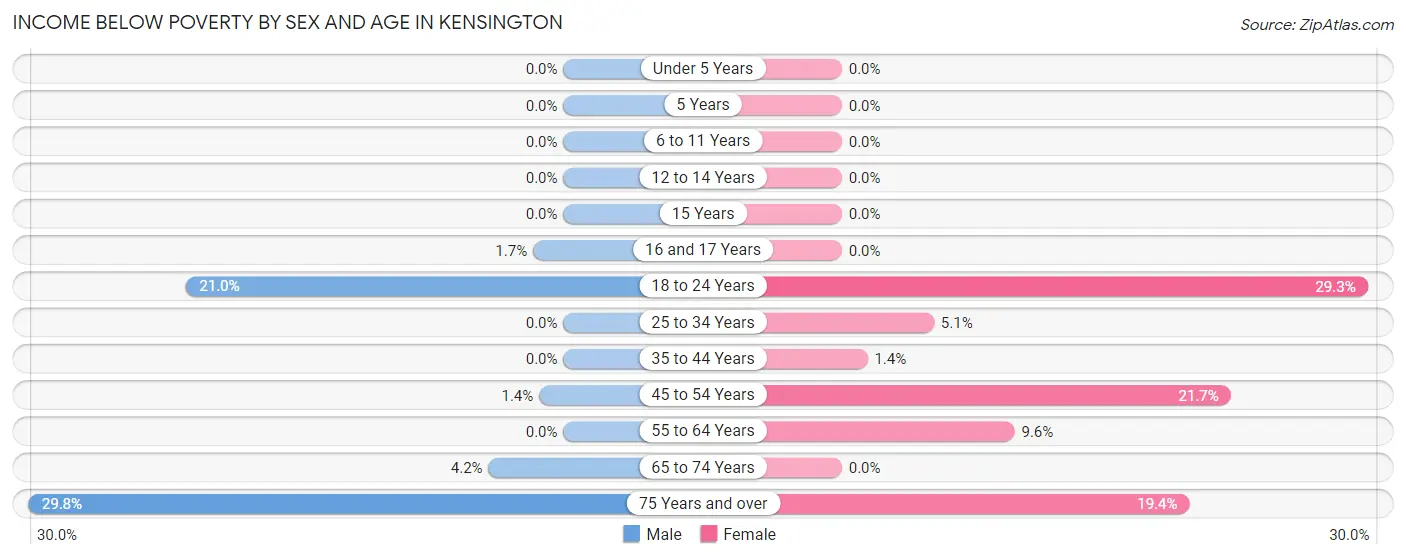
| Age Bracket | Male | Female |
| Under 5 Years | 0 (0.0%) | 0 (0.0%) |
| 5 Years | 0 (0.0%) | 0 (0.0%) |
| 6 to 11 Years | 0 (0.0%) | 0 (0.0%) |
| 12 to 14 Years | 0 (0.0%) | 0 (0.0%) |
| 15 Years | 0 (0.0%) | 0 (0.0%) |
| 16 and 17 Years | 1 (1.7%) | 0 (0.0%) |
| 18 to 24 Years | 17 (21.0%) | 12 (29.3%) |
| 25 to 34 Years | 0 (0.0%) | 2 (5.1%) |
| 35 to 44 Years | 0 (0.0%) | 1 (1.4%) |
| 45 to 54 Years | 1 (1.3%) | 21 (21.6%) |
| 55 to 64 Years | 0 (0.0%) | 10 (9.6%) |
| 65 to 74 Years | 3 (4.2%) | 0 (0.0%) |
| 75 Years and over | 25 (29.8%) | 24 (19.4%) |
| Total | 47 (7.0%) | 70 (9.0%) |
Income Above Poverty by Sex and Age in Kensington
According to the poverty statistics in Kensington, males aged under 5 years and females aged under 5 years are the age groups that are most secure financially, with 100.0% of males and 100.0% of females in these age groups living above the poverty line.
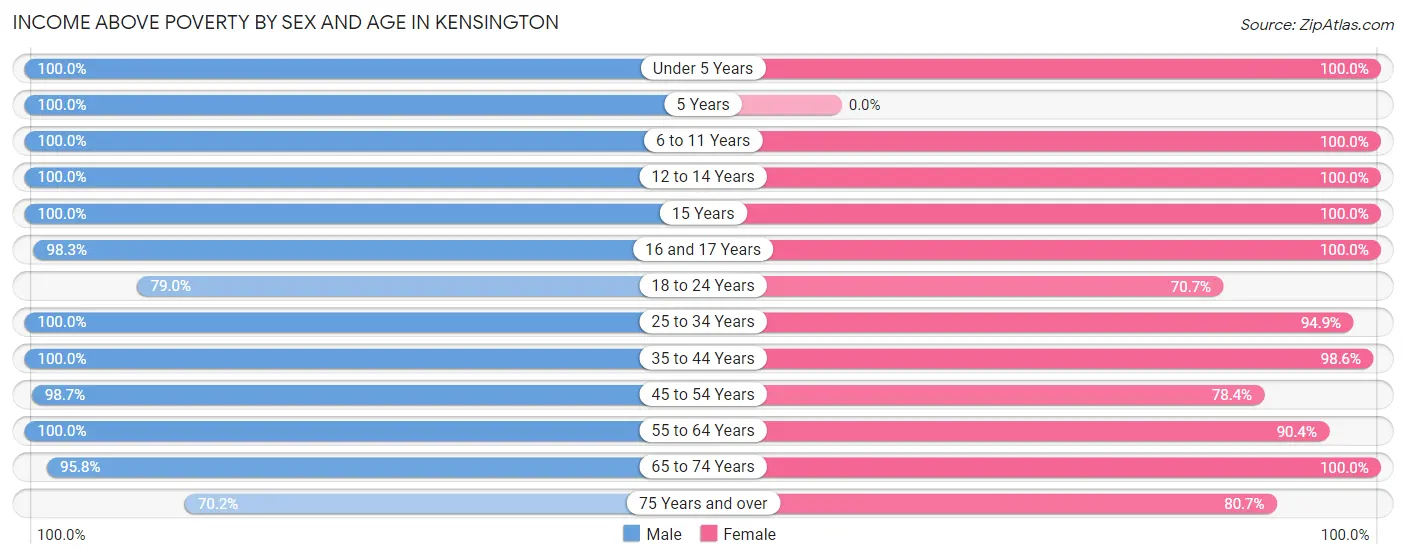
| Age Bracket | Male | Female |
| Under 5 Years | 28 (100.0%) | 71 (100.0%) |
| 5 Years | 2 (100.0%) | 0 (0.0%) |
| 6 to 11 Years | 31 (100.0%) | 124 (100.0%) |
| 12 to 14 Years | 23 (100.0%) | 28 (100.0%) |
| 15 Years | 19 (100.0%) | 4 (100.0%) |
| 16 and 17 Years | 58 (98.3%) | 10 (100.0%) |
| 18 to 24 Years | 64 (79.0%) | 29 (70.7%) |
| 25 to 34 Years | 37 (100.0%) | 37 (94.9%) |
| 35 to 44 Years | 67 (100.0%) | 69 (98.6%) |
| 45 to 54 Years | 73 (98.7%) | 76 (78.3%) |
| 55 to 64 Years | 92 (100.0%) | 94 (90.4%) |
| 65 to 74 Years | 69 (95.8%) | 64 (100.0%) |
| 75 Years and over | 59 (70.2%) | 100 (80.6%) |
| Total | 622 (93.0%) | 706 (91.0%) |
Income Below Poverty Among Married-Couple Families in Kensington
The poverty statistics for married-couple families in Kensington show that 7.5% or 25 of the total 335 families live below the poverty line. Families with no children have the highest poverty rate of 14.7%, comprising of 25 families. On the other hand, families with 1 or 2 children have the lowest poverty rate of 0.0%, which includes 0 families.
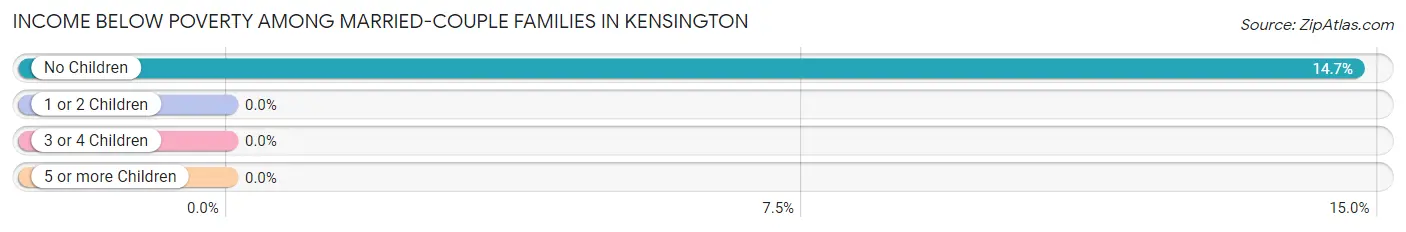
| Children | Above Poverty | Below Poverty |
| No Children | 145 (85.3%) | 25 (14.7%) |
| 1 or 2 Children | 97 (100.0%) | 0 (0.0%) |
| 3 or 4 Children | 68 (100.0%) | 0 (0.0%) |
| 5 or more Children | 0 (0.0%) | 0 (0.0%) |
| Total | 310 (92.5%) | 25 (7.5%) |
Income Below Poverty Among Single-Parent Households in Kensington
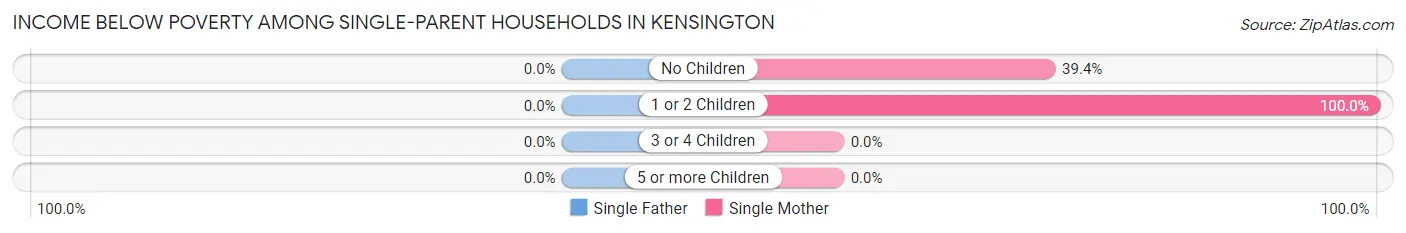
| Children | Single Father | Single Mother |
| No Children | 0 (0.0%) | 13 (39.4%) |
| 1 or 2 Children | 0 (0.0%) | 4 (100.0%) |
| 3 or 4 Children | 0 (0.0%) | 0 (0.0%) |
| 5 or more Children | 0 (0.0%) | 0 (0.0%) |
| Total | 0 (0.0%) | 17 (46.0%) |
Income Below Poverty Among Married-Couple vs Single-Parent Households in Kensington
The poverty data for Kensington shows that 25 of the married-couple family households (7.5%) and 17 of the single-parent households (46.0%) are living below the poverty level. Within the married-couple family households, those with no children have the highest poverty rate, with 25 households (14.7%) falling below the poverty line. Among the single-parent households, those with 1 or 2 children have the highest poverty rate, with 4 household (100.0%) living below poverty.
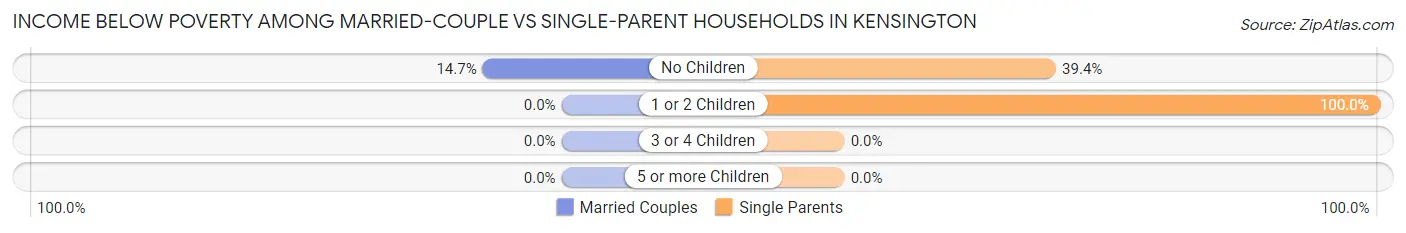
| Children | Married-Couple Families | Single-Parent Households |
| No Children | 25 (14.7%) | 13 (39.4%) |
| 1 or 2 Children | 0 (0.0%) | 4 (100.0%) |
| 3 or 4 Children | 0 (0.0%) | 0 (0.0%) |
| 5 or more Children | 0 (0.0%) | 0 (0.0%) |
| Total | 25 (7.5%) | 17 (46.0%) |
Race in Kensington
The most populous races in Kensington are White / Caucasian (1,114 | 77.1%), Asian (320 | 22.2%), and Hispanic or Latino (62 | 4.3%).
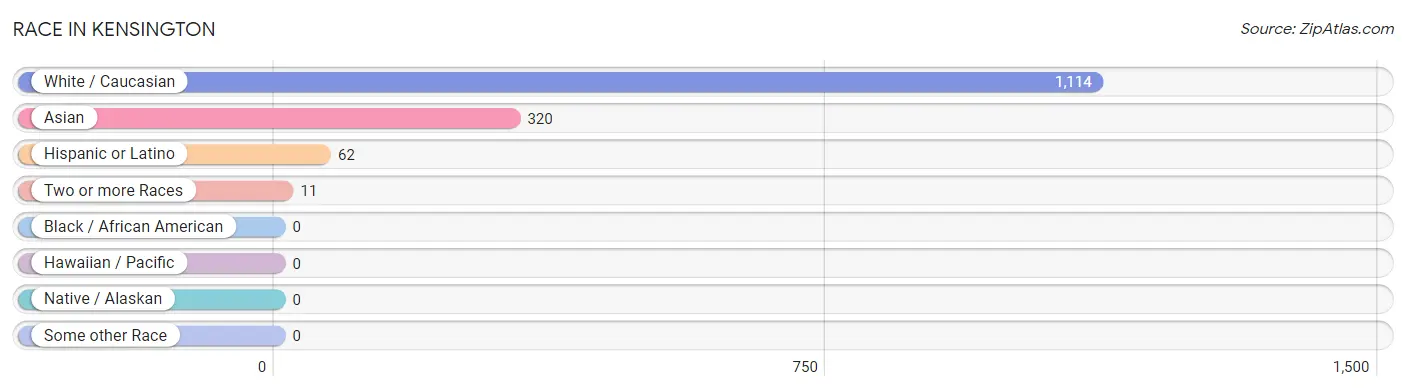
| Race | # Population | % Population |
| Asian | 320 | 22.2% |
| Black / African American | 0 | 0.0% |
| Hawaiian / Pacific | 0 | 0.0% |
| Hispanic or Latino | 62 | 4.3% |
| Native / Alaskan | 0 | 0.0% |
| White / Caucasian | 1,114 | 77.1% |
| Two or more Races | 11 | 0.8% |
| Some other Race | 0 | 0.0% |
| Total | 1,445 | 100.0% |
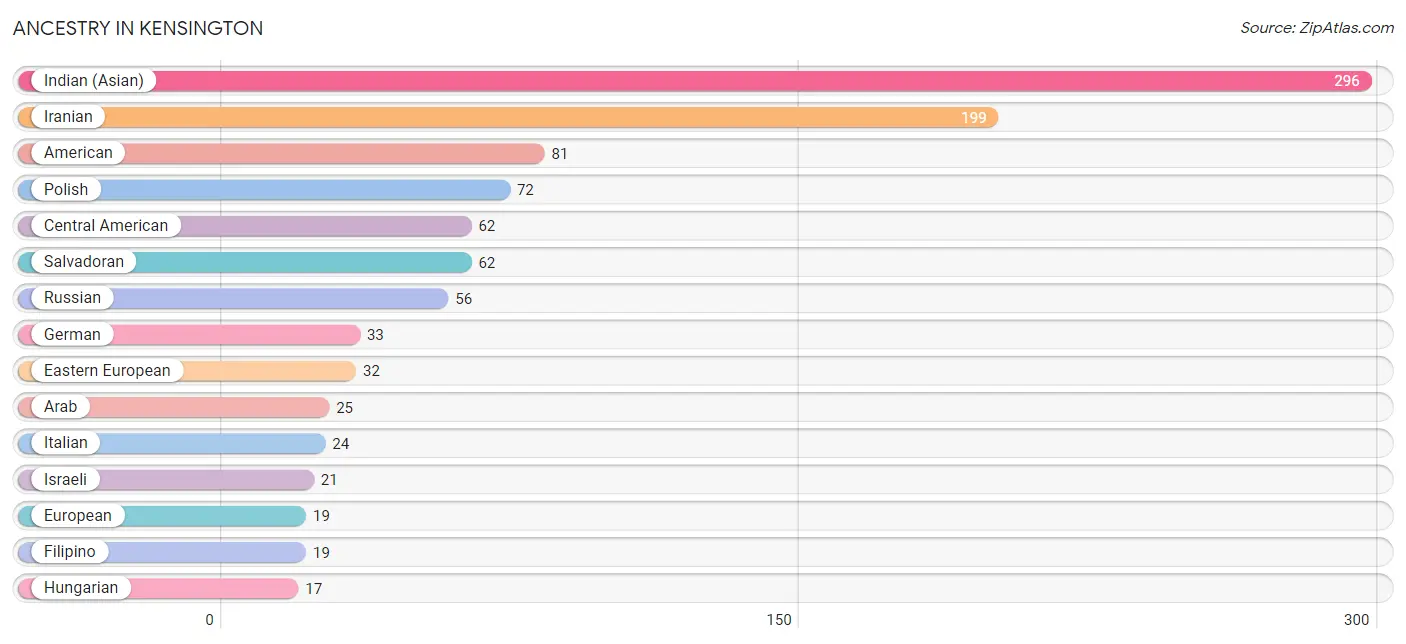
Ancestry in Kensington
The most populous ancestries reported in Kensington are Indian (Asian) (296 | 20.5%), Iranian (199 | 13.8%), American (81 | 5.6%), Polish (72 | 5.0%), and Central American (62 | 4.3%), together accounting for 49.1% of all Kensington residents.
| Ancestry | # Population | % Population |
| American | 81 | 5.6% |
| Arab | 25 | 1.7% |
| Austrian | 14 | 1.0% |
| Belgian | 15 | 1.0% |
| Brazilian | 5 | 0.4% |
| British | 11 | 0.8% |
| Canadian | 11 | 0.8% |
| Central American | 62 | 4.3% |
| Czechoslovakian | 5 | 0.4% |
| Eastern European | 32 | 2.2% |
| European | 19 | 1.3% |
| Filipino | 19 | 1.3% |
| French | 4 | 0.3% |
| German | 33 | 2.3% |
| Hungarian | 17 | 1.2% |
| Indian (Asian) | 296 | 20.5% |
| Iranian | 199 | 13.8% |
| Iraqi | 5 | 0.4% |
| Irish | 7 | 0.5% |
| Israeli | 21 | 1.5% |
| Italian | 24 | 1.7% |
| Lithuanian | 9 | 0.6% |
| Moroccan | 4 | 0.3% |
| Polish | 72 | 5.0% |
| Russian | 56 | 3.9% |
| Salvadoran | 62 | 4.3% |
| Scottish | 17 | 1.2% |
| Sri Lankan | 3 | 0.2% |
| Thai | 6 | 0.4% |
| Turkish | 5 | 0.4% |
| Ukrainian | 13 | 0.9% | View All 31 Rows |
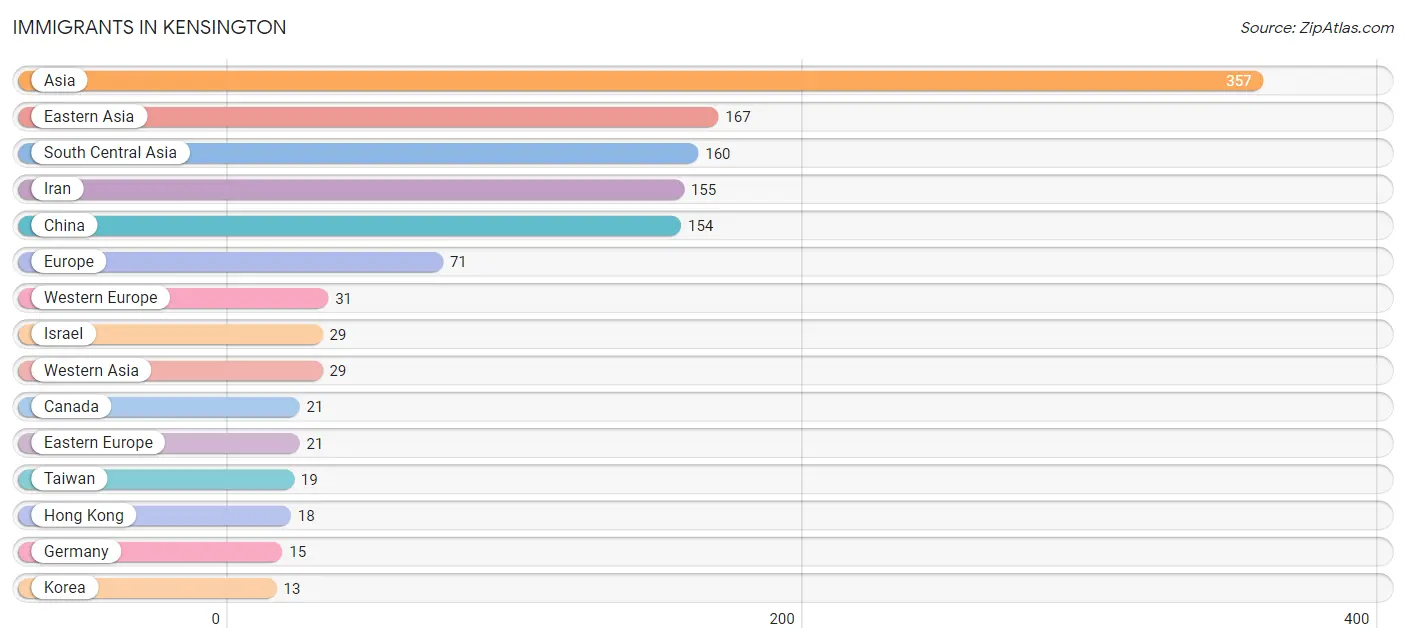
Immigrants in Kensington
The most numerous immigrant groups reported in Kensington came from Asia (357 | 24.7%), Eastern Asia (167 | 11.6%), South Central Asia (160 | 11.1%), Iran (155 | 10.7%), and China (154 | 10.7%), together accounting for 68.7% of all Kensington residents.
| Immigration Origin | # Population | % Population |
| Africa | 12 | 0.8% |
| Asia | 357 | 24.7% |
| Australia | 3 | 0.2% |
| Belgium | 10 | 0.7% |
| Brazil | 4 | 0.3% |
| Canada | 21 | 1.5% |
| Central America | 6 | 0.4% |
| China | 154 | 10.7% |
| Czechoslovakia | 2 | 0.1% |
| Eastern Asia | 167 | 11.6% |
| Eastern Europe | 21 | 1.5% |
| El Salvador | 6 | 0.4% |
| Europe | 71 | 4.9% |
| France | 6 | 0.4% |
| Germany | 15 | 1.0% |
| Hong Kong | 18 | 1.3% |
| India | 5 | 0.4% |
| Iran | 155 | 10.7% |
| Israel | 29 | 2.0% |
| Italy | 8 | 0.5% |
| Korea | 13 | 0.9% |
| Latin America | 10 | 0.7% |
| Northern Europe | 11 | 0.8% |
| Oceania | 3 | 0.2% |
| Poland | 13 | 0.9% |
| Scotland | 4 | 0.3% |
| South Africa | 12 | 0.8% |
| South America | 4 | 0.3% |
| South Central Asia | 160 | 11.1% |
| South Eastern Asia | 1 | 0.1% |
| Southern Europe | 8 | 0.5% |
| Taiwan | 19 | 1.3% |
| Ukraine | 6 | 0.4% |
| Vietnam | 1 | 0.1% |
| Western Asia | 29 | 2.0% |
| Western Europe | 31 | 2.1% | View All 36 Rows |
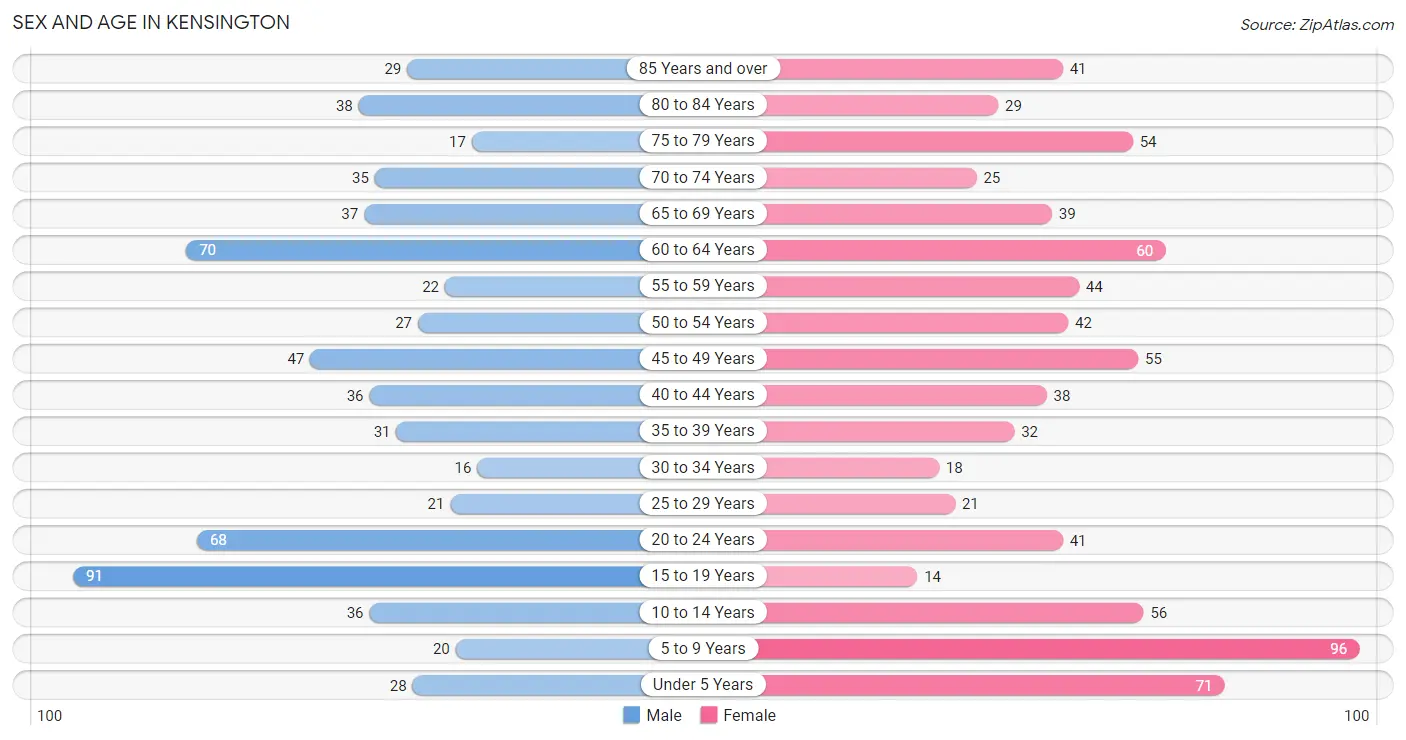
Sex and Age in Kensington
Sex and Age in Kensington
The most populous age groups in Kensington are 15 to 19 Years (91 | 13.6%) for men and 5 to 9 Years (96 | 12.4%) for women.
| Age Bracket | Male | Female |
| Under 5 Years | 28 (4.2%) | 71 (9.1%) |
| 5 to 9 Years | 20 (3.0%) | 96 (12.4%) |
| 10 to 14 Years | 36 (5.4%) | 56 (7.2%) |
| 15 to 19 Years | 91 (13.6%) | 14 (1.8%) |
| 20 to 24 Years | 68 (10.2%) | 41 (5.3%) |
| 25 to 29 Years | 21 (3.1%) | 21 (2.7%) |
| 30 to 34 Years | 16 (2.4%) | 18 (2.3%) |
| 35 to 39 Years | 31 (4.6%) | 32 (4.1%) |
| 40 to 44 Years | 36 (5.4%) | 38 (4.9%) |
| 45 to 49 Years | 47 (7.0%) | 55 (7.1%) |
| 50 to 54 Years | 27 (4.0%) | 42 (5.4%) |
| 55 to 59 Years | 22 (3.3%) | 44 (5.7%) |
| 60 to 64 Years | 70 (10.5%) | 60 (7.7%) |
| 65 to 69 Years | 37 (5.5%) | 39 (5.0%) |
| 70 to 74 Years | 35 (5.2%) | 25 (3.2%) |
| 75 to 79 Years | 17 (2.5%) | 54 (7.0%) |
| 80 to 84 Years | 38 (5.7%) | 29 (3.7%) |
| 85 Years and over | 29 (4.3%) | 41 (5.3%) |
| Total | 669 (100.0%) | 776 (100.0%) |
Families and Households in Kensington
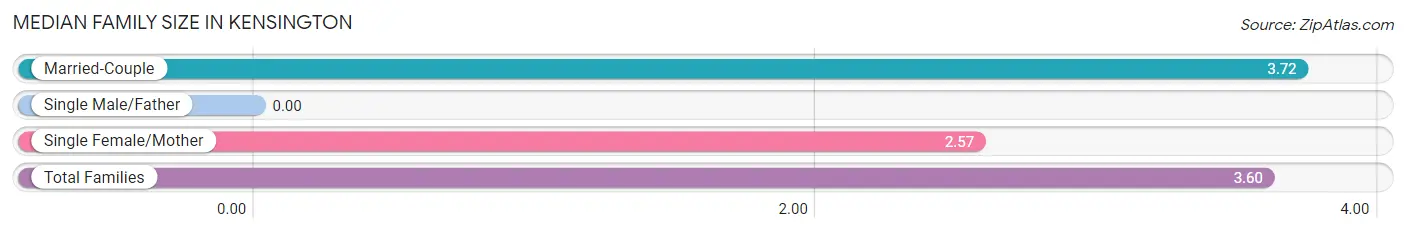
Median Family Size in Kensington
| Family Type | # Families | Family Size |
| Married-Couple | 335 (90.0%) | 3.72 |
| Single Male/Father | 0 (0.0%) | - |
| Single Female/Mother | 37 (10.0%) | 2.57 |
| Total Families | 372 (100.0%) | 3.60 |
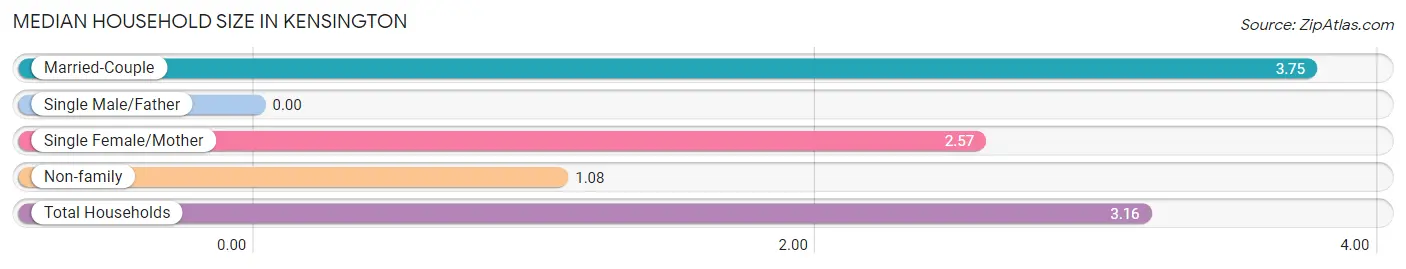
Median Household Size in Kensington
| Household Type | # Households | Household Size |
| Married-Couple | 335 (73.1%) | 3.75 |
| Single Male/Father | 0 (0.0%) | - |
| Single Female/Mother | 37 (8.1%) | 2.57 |
| Non-family | 86 (18.8%) | 1.08 |
| Total Households | 458 (100.0%) | 3.16 |
Household Size by Marriage Status in Kensington
Out of a total of 458 households in Kensington, 372 (81.2%) are family households, while 86 (18.8%) are nonfamily households. The most numerous type of family households are 2-person households, comprising 138, and the most common type of nonfamily households are 1-person households, comprising 81.
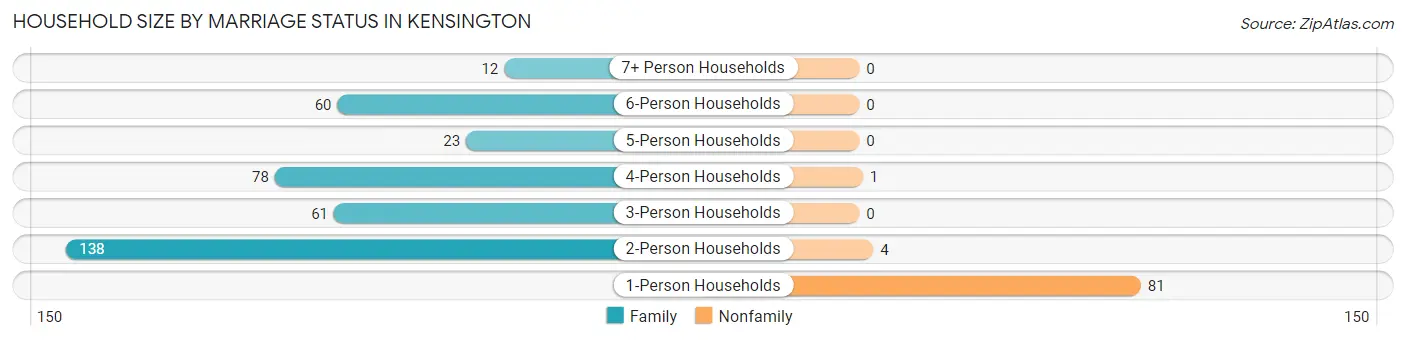
| Household Size | Family Households | Nonfamily Households |
| 1-Person Households | - | 81 (17.7%) |
| 2-Person Households | 138 (30.1%) | 4 (0.9%) |
| 3-Person Households | 61 (13.3%) | 0 (0.0%) |
| 4-Person Households | 78 (17.0%) | 1 (0.2%) |
| 5-Person Households | 23 (5.0%) | 0 (0.0%) |
| 6-Person Households | 60 (13.1%) | 0 (0.0%) |
| 7+ Person Households | 12 (2.6%) | 0 (0.0%) |
| Total | 372 (81.2%) | 86 (18.8%) |
Female Fertility in Kensington
Fertility by Age in Kensington
Average fertility rate in Kensington is 114.0 births per 1,000 women. Women in the age bracket of 35 to 50 years have the highest fertility rate with 162.0 births per 1,000 women. Women in the age bracket of 35 to 50 years acount for 85.2% of all women with births.
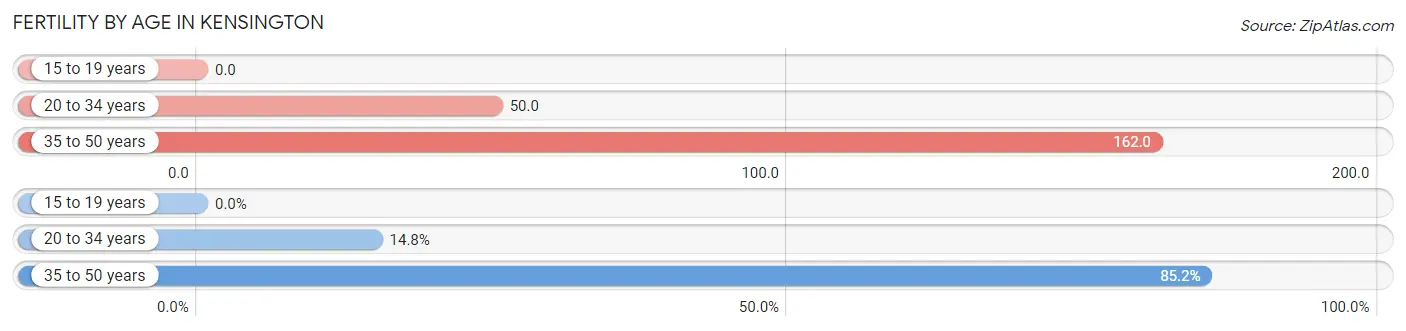
| Age Bracket | Women with Births | Births / 1,000 Women |
| 15 to 19 years | 0 (0.0%) | 0.0 |
| 20 to 34 years | 4 (14.8%) | 50.0 |
| 35 to 50 years | 23 (85.2%) | 162.0 |
| Total | 27 (100.0%) | 114.0 |
Fertility by Age by Marriage Status in Kensington
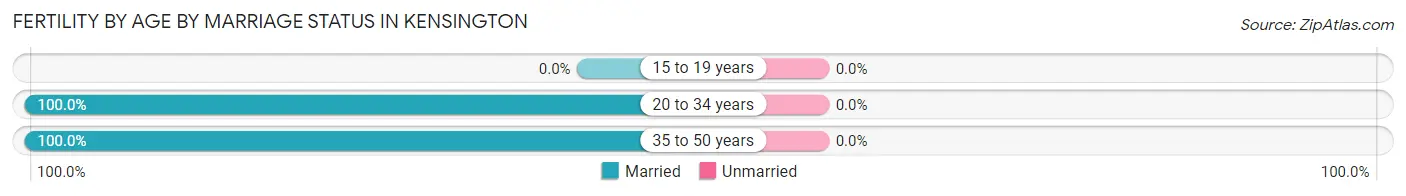
| Age Bracket | Married | Unmarried |
| 15 to 19 years | 0 (0.0%) | 0 (0.0%) |
| 20 to 34 years | 4 (100.0%) | 0 (0.0%) |
| 35 to 50 years | 23 (100.0%) | 0 (0.0%) |
| Total | 27 (100.0%) | 0 (0.0%) |
Fertility by Education in Kensington
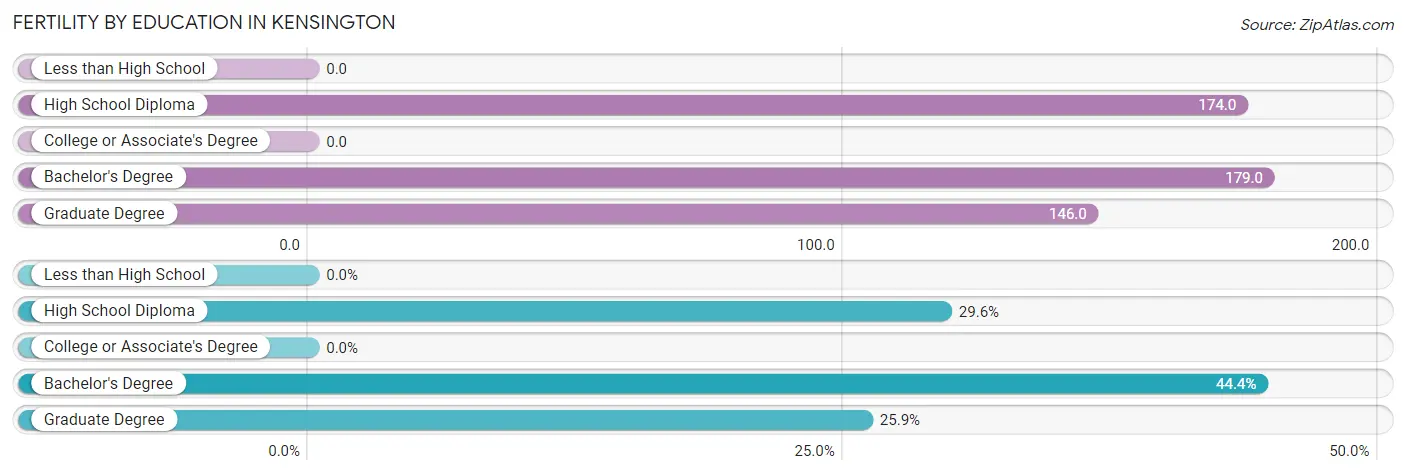
| Educational Attainment | Women with Births | Births / 1,000 Women |
| Less than High School | 0 (0.0%) | 0.0 |
| High School Diploma | 8 (29.6%) | 174.0 |
| College or Associate's Degree | 0 (0.0%) | 0.0 |
| Bachelor's Degree | 12 (44.4%) | 179.0 |
| Graduate Degree | 7 (25.9%) | 146.0 |
| Total | 27 (100.0%) | 114.0 |
Fertility by Education by Marriage Status in Kensington
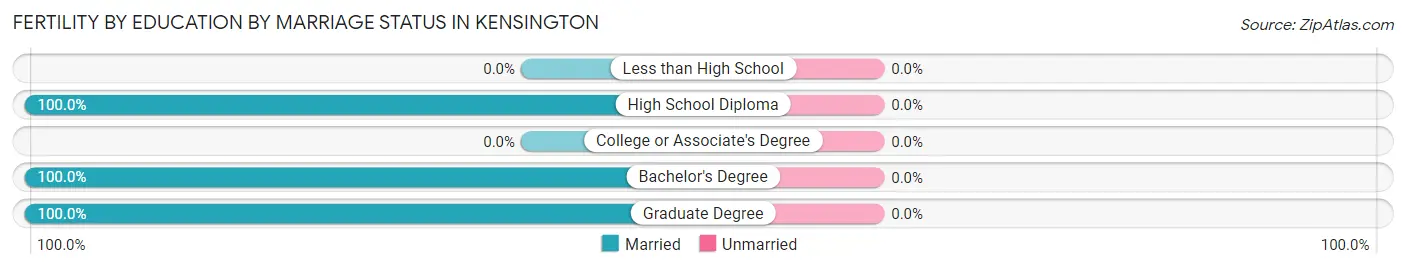
| Educational Attainment | Married | Unmarried |
| Less than High School | 0 (0.0%) | 0 (0.0%) |
| High School Diploma | 8 (100.0%) | 0 (0.0%) |
| College or Associate's Degree | 0 (0.0%) | 0 (0.0%) |
| Bachelor's Degree | 12 (100.0%) | 0 (0.0%) |
| Graduate Degree | 7 (100.0%) | 0 (0.0%) |
| Total | 27 (100.0%) | 0 (0.0%) |
Employment Characteristics in Kensington
Employment by Class of Employer in Kensington
Among the 578 employed individuals in Kensington, private company employees (314 | 54.3%), self-employed (incorporated) (87 | 15.0%), and not-for-profit organizations (71 | 12.3%) make up the most common classes of employment.
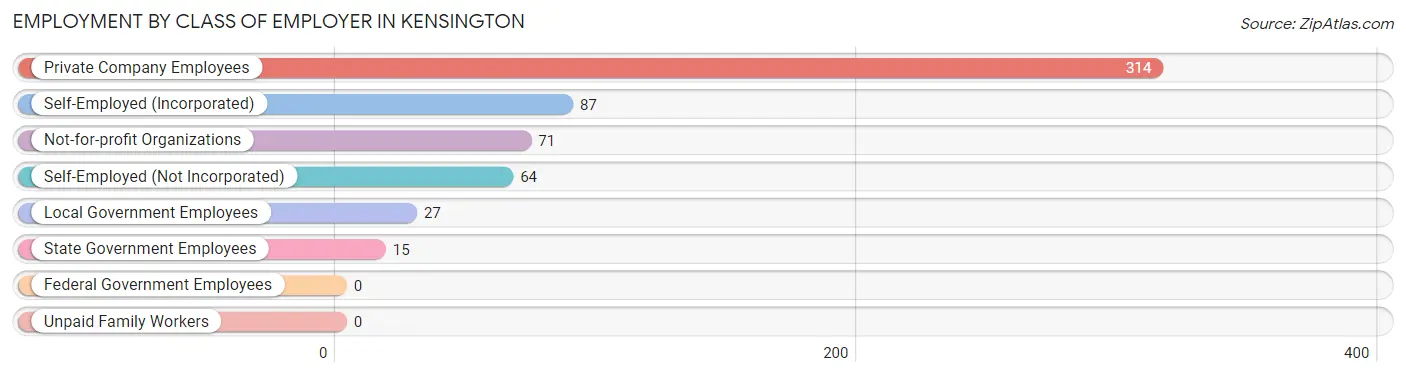
| Employer Class | # Employees | % Employees |
| Private Company Employees | 314 | 54.3% |
| Self-Employed (Incorporated) | 87 | 15.0% |
| Self-Employed (Not Incorporated) | 64 | 11.1% |
| Not-for-profit Organizations | 71 | 12.3% |
| Local Government Employees | 27 | 4.7% |
| State Government Employees | 15 | 2.6% |
| Federal Government Employees | 0 | 0.0% |
| Unpaid Family Workers | 0 | 0.0% |
| Total | 578 | 100.0% |
Employment Status by Age in Kensington
According to the labor force statistics for Kensington, out of the total population over 16 years of age (1,115), 54.6% or 609 individuals are in the labor force, with 4.4% or 27 of them unemployed. The age group with the highest labor force participation rate is 55 to 59 years, with 92.4% or 61 individuals in the labor force. Within the labor force, the 20 to 24 years age range has the highest percentage of unemployed individuals, with 28.9% or 22 of them being unemployed.
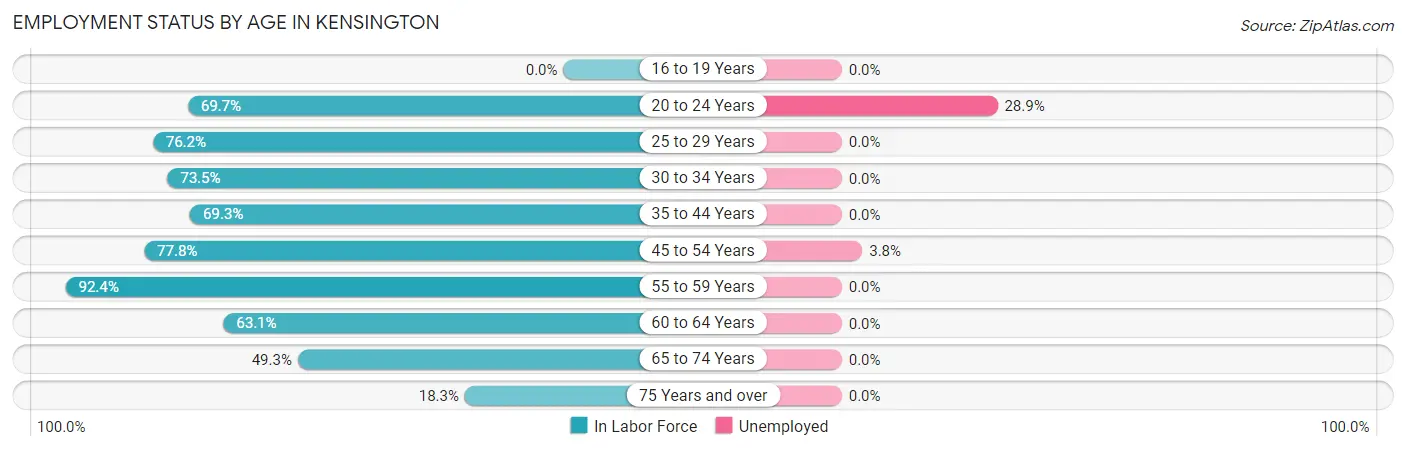
| Age Bracket | In Labor Force | Unemployed |
| 16 to 19 Years | 0 (0.0%) | 0 (0.0%) |
| 20 to 24 Years | 76 (69.7%) | 22 (28.9%) |
| 25 to 29 Years | 32 (76.2%) | 0 (0.0%) |
| 30 to 34 Years | 25 (73.5%) | 0 (0.0%) |
| 35 to 44 Years | 95 (69.3%) | 0 (0.0%) |
| 45 to 54 Years | 133 (77.8%) | 5 (3.8%) |
| 55 to 59 Years | 61 (92.4%) | 0 (0.0%) |
| 60 to 64 Years | 82 (63.1%) | 0 (0.0%) |
| 65 to 74 Years | 67 (49.3%) | 0 (0.0%) |
| 75 Years and over | 38 (18.3%) | 0 (0.0%) |
| Total | 609 (54.6%) | 27 (4.4%) |
Employment Status by Educational Attainment in Kensington
According to labor force statistics for Kensington, 73.8% of individuals (428) out of the total population between 25 and 64 years of age (580) are in the labor force, with 1.2% or 5 of them being unemployed. The group with the highest labor force participation rate are those with the educational attainment of less than high school, with 89.3% or 25 individuals in the labor force. Within the labor force, individuals with college / associate degree education have the highest percentage of unemployment, with 11.1% or 5 of them being unemployed.
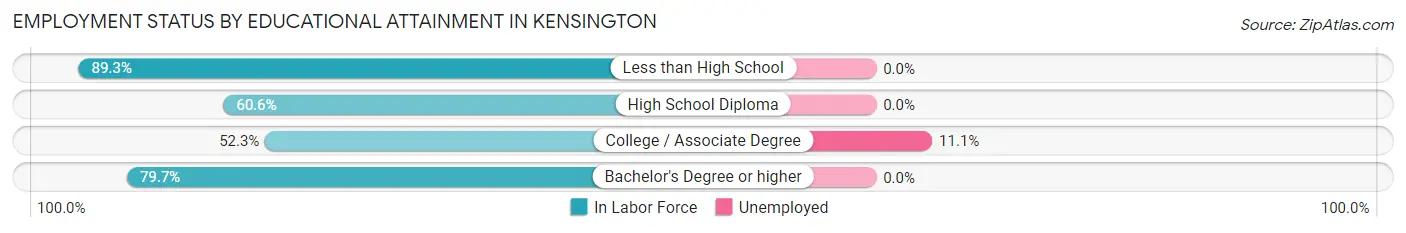
| Educational Attainment | In Labor Force | Unemployed |
| Less than High School | 25 (89.3%) | 0 (0.0%) |
| High School Diploma | 43 (60.6%) | 0 (0.0%) |
| College / Associate Degree | 45 (52.3%) | 10 (11.1%) |
| Bachelor's Degree or higher | 315 (79.7%) | 0 (0.0%) |
| Total | 428 (73.8%) | 7 (1.2%) |
Employment Occupations by Sex in Kensington
Management, Business, Science and Arts Occupations
The most common Management, Business, Science and Arts occupations in Kensington are Management (126 | 21.6%), Community & Social Service (65 | 11.2%), Health Diagnosing & Treating (65 | 11.2%), Health Technologists (62 | 10.6%), and Business & Financial (58 | 10.0%).
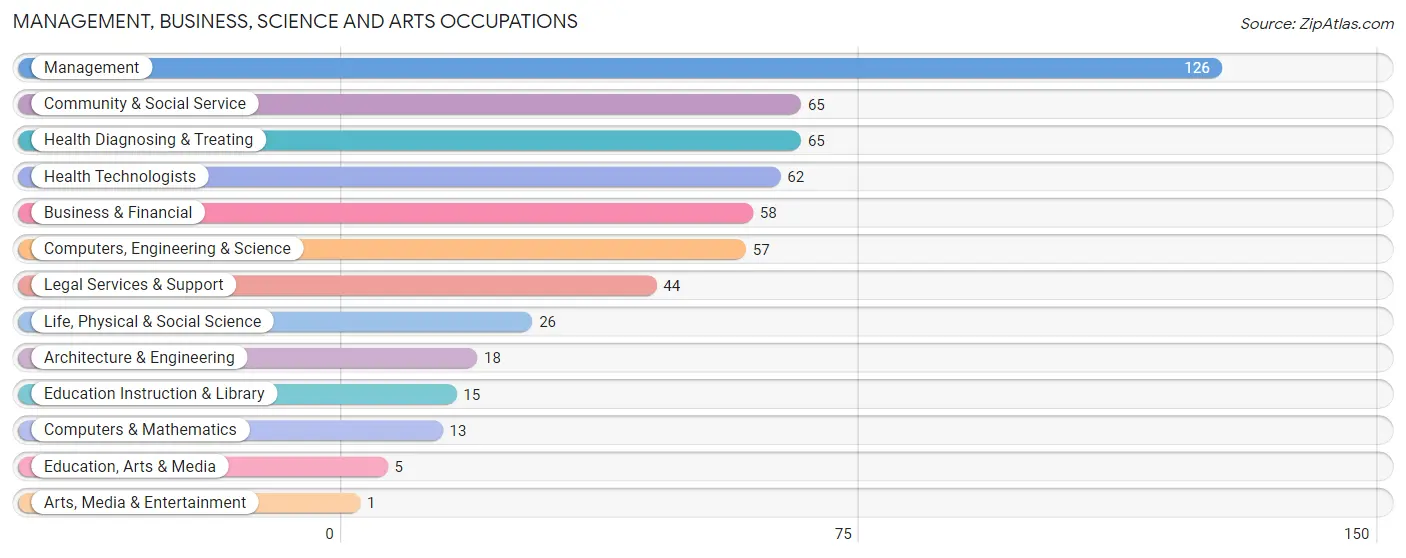
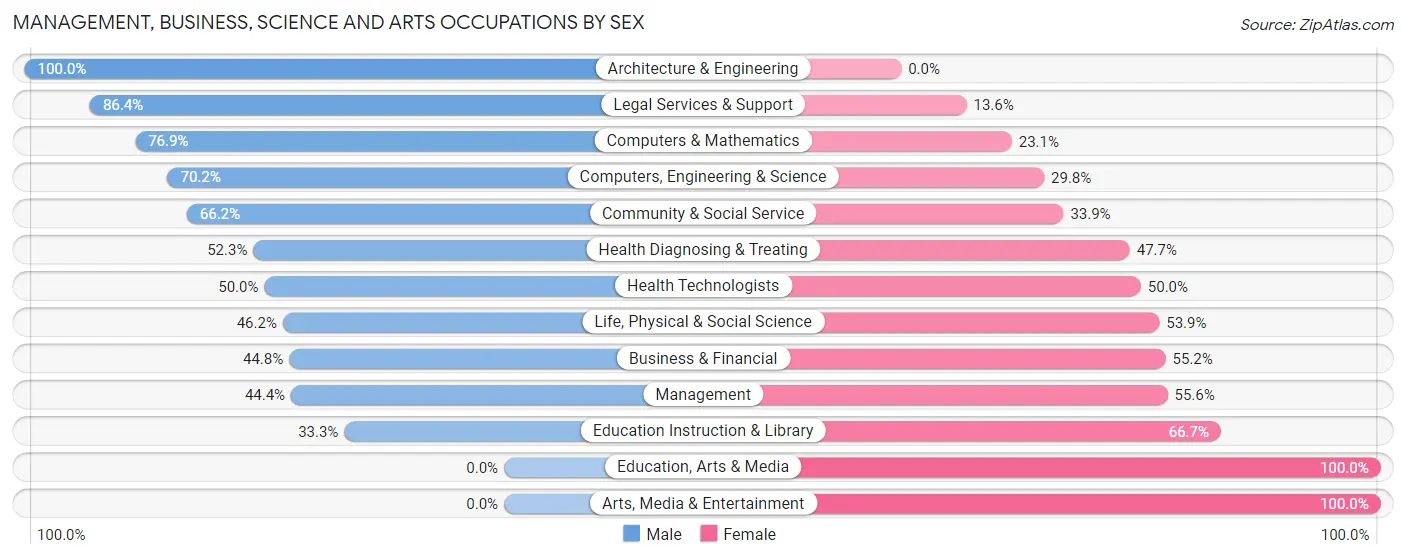
Management, Business, Science and Arts Occupations by Sex
Within the Management, Business, Science and Arts occupations in Kensington, the most male-oriented occupations are Architecture & Engineering (100.0%), Legal Services & Support (86.4%), and Computers & Mathematics (76.9%), while the most female-oriented occupations are Education, Arts & Media (100.0%), Arts, Media & Entertainment (100.0%), and Education Instruction & Library (66.7%).
| Occupation | Male | Female |
| Management | 56 (44.4%) | 70 (55.6%) |
| Business & Financial | 26 (44.8%) | 32 (55.2%) |
| Computers, Engineering & Science | 40 (70.2%) | 17 (29.8%) |
| Computers & Mathematics | 10 (76.9%) | 3 (23.1%) |
| Architecture & Engineering | 18 (100.0%) | 0 (0.0%) |
| Life, Physical & Social Science | 12 (46.2%) | 14 (53.8%) |
| Community & Social Service | 43 (66.1%) | 22 (33.9%) |
| Education, Arts & Media | 0 (0.0%) | 5 (100.0%) |
| Legal Services & Support | 38 (86.4%) | 6 (13.6%) |
| Education Instruction & Library | 5 (33.3%) | 10 (66.7%) |
| Arts, Media & Entertainment | 0 (0.0%) | 1 (100.0%) |
| Health Diagnosing & Treating | 34 (52.3%) | 31 (47.7%) |
| Health Technologists | 31 (50.0%) | 31 (50.0%) |
| Total (Category) | 199 (53.6%) | 172 (46.4%) |
| Total (Overall) | 292 (50.2%) | 290 (49.8%) |
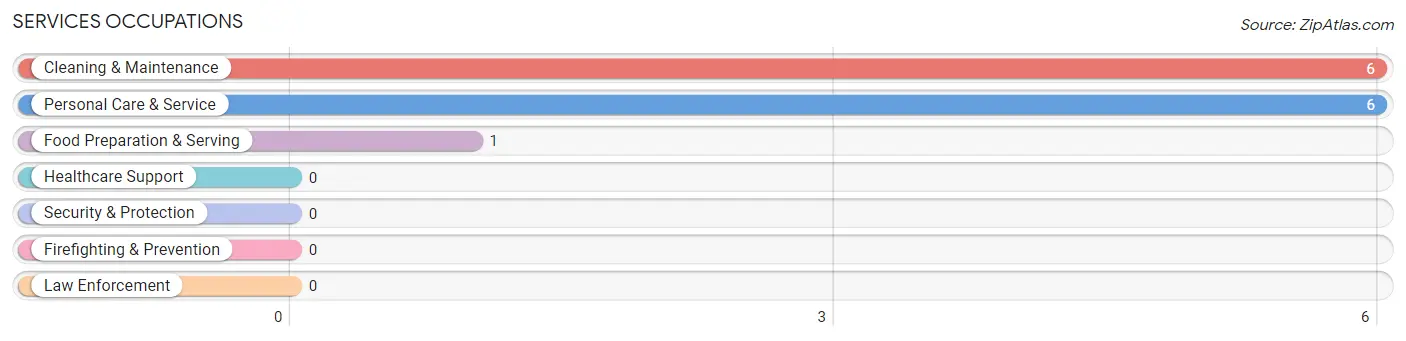
Services Occupations
The most common Services occupations in Kensington are Cleaning & Maintenance (6 | 1.0%), Personal Care & Service (6 | 1.0%), and Food Preparation & Serving (1 | 0.2%).
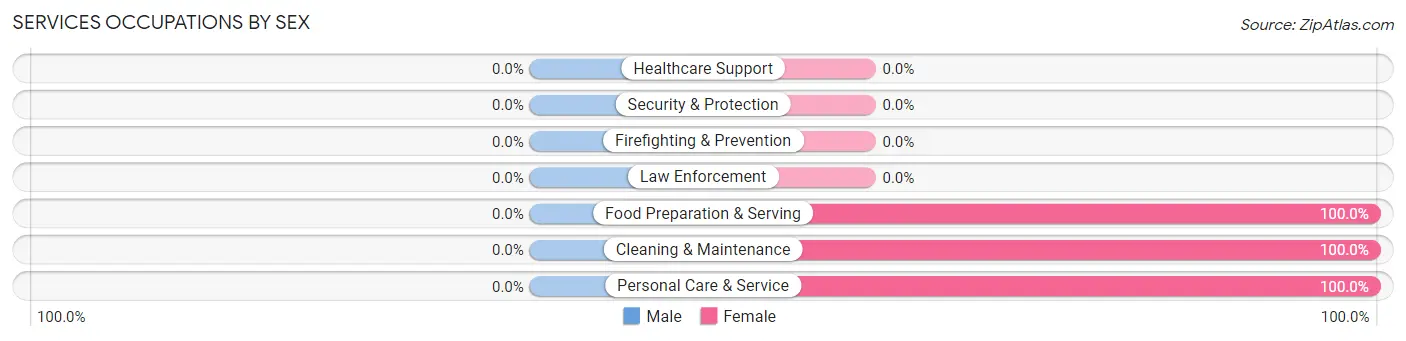
Services Occupations by Sex
| Occupation | Male | Female |
| Healthcare Support | 0 (0.0%) | 0 (0.0%) |
| Security & Protection | 0 (0.0%) | 0 (0.0%) |
| Firefighting & Prevention | 0 (0.0%) | 0 (0.0%) |
| Law Enforcement | 0 (0.0%) | 0 (0.0%) |
| Food Preparation & Serving | 0 (0.0%) | 1 (100.0%) |
| Cleaning & Maintenance | 0 (0.0%) | 6 (100.0%) |
| Personal Care & Service | 0 (0.0%) | 6 (100.0%) |
| Total (Category) | 0 (0.0%) | 13 (100.0%) |
| Total (Overall) | 292 (50.2%) | 290 (49.8%) |
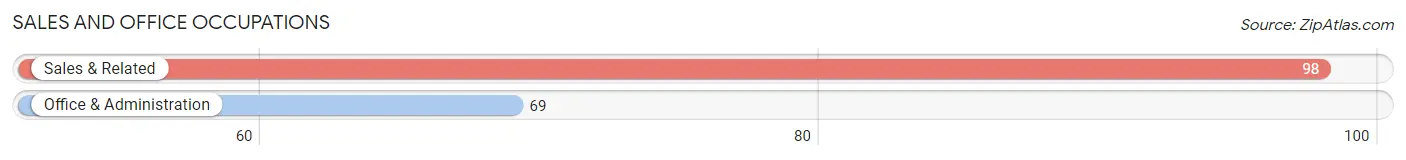
Sales and Office Occupations
The most common Sales and Office occupations in Kensington are Sales & Related (98 | 16.8%), and Office & Administration (69 | 11.9%).
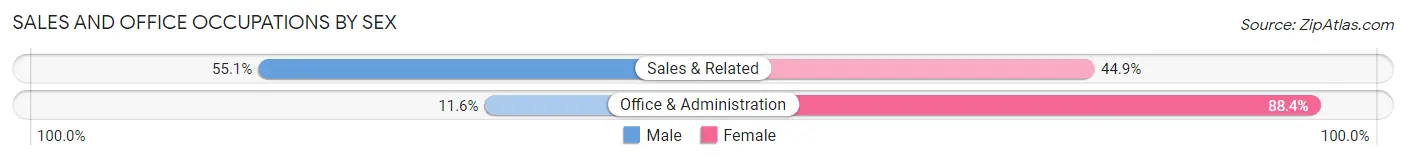
Sales and Office Occupations by Sex
| Occupation | Male | Female |
| Sales & Related | 54 (55.1%) | 44 (44.9%) |
| Office & Administration | 8 (11.6%) | 61 (88.4%) |
| Total (Category) | 62 (37.1%) | 105 (62.9%) |
| Total (Overall) | 292 (50.2%) | 290 (49.8%) |
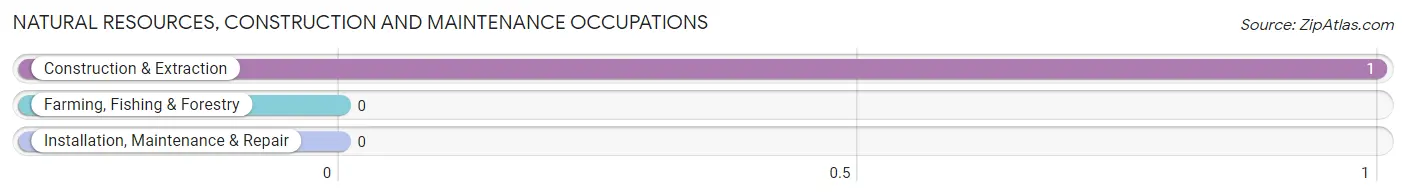
Natural Resources, Construction and Maintenance Occupations
The most common Natural Resources, Construction and Maintenance occupations in Kensington are , and Construction & Extraction (1 | 0.2%).
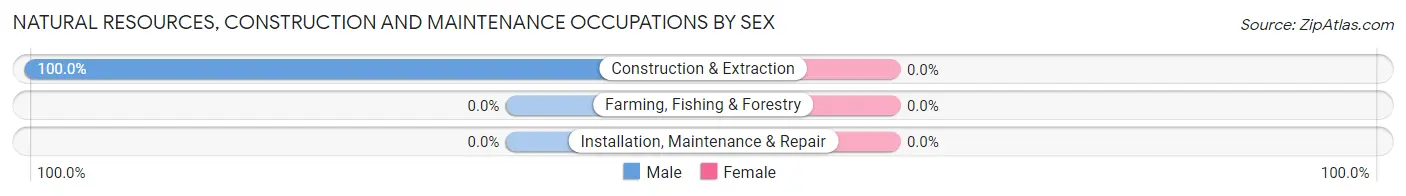
Natural Resources, Construction and Maintenance Occupations by Sex
| Occupation | Male | Female |
| Farming, Fishing & Forestry | 0 (0.0%) | 0 (0.0%) |
| Construction & Extraction | 1 (100.0%) | 0 (0.0%) |
| Installation, Maintenance & Repair | 0 (0.0%) | 0 (0.0%) |
| Total (Category) | 1 (100.0%) | 0 (0.0%) |
| Total (Overall) | 292 (50.2%) | 290 (49.8%) |
Production, Transportation and Moving Occupations
The most common Production, Transportation and Moving occupations in Kensington are Production (14 | 2.4%), Transportation (10 | 1.7%), and Material Moving (6 | 1.0%).
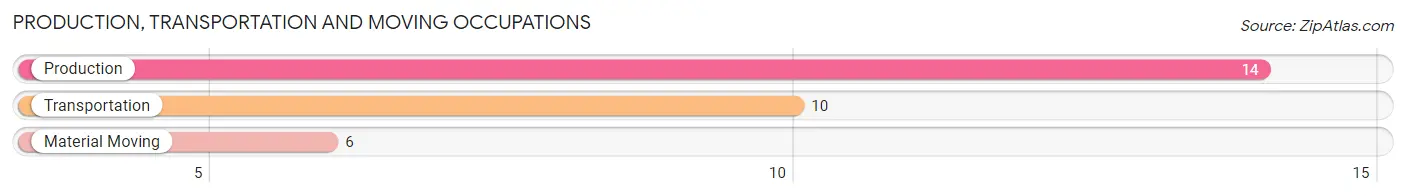
Production, Transportation and Moving Occupations by Sex
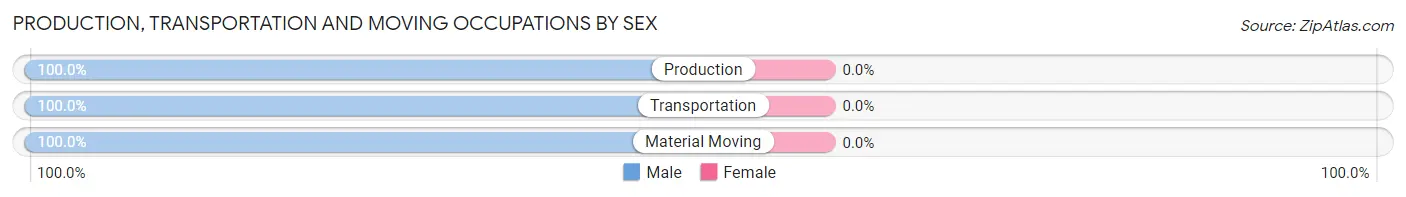
| Occupation | Male | Female |
| Production | 14 (100.0%) | 0 (0.0%) |
| Transportation | 10 (100.0%) | 0 (0.0%) |
| Material Moving | 6 (100.0%) | 0 (0.0%) |
| Total (Category) | 30 (100.0%) | 0 (0.0%) |
| Total (Overall) | 292 (50.2%) | 290 (49.8%) |
Employment Industries by Sex in Kensington
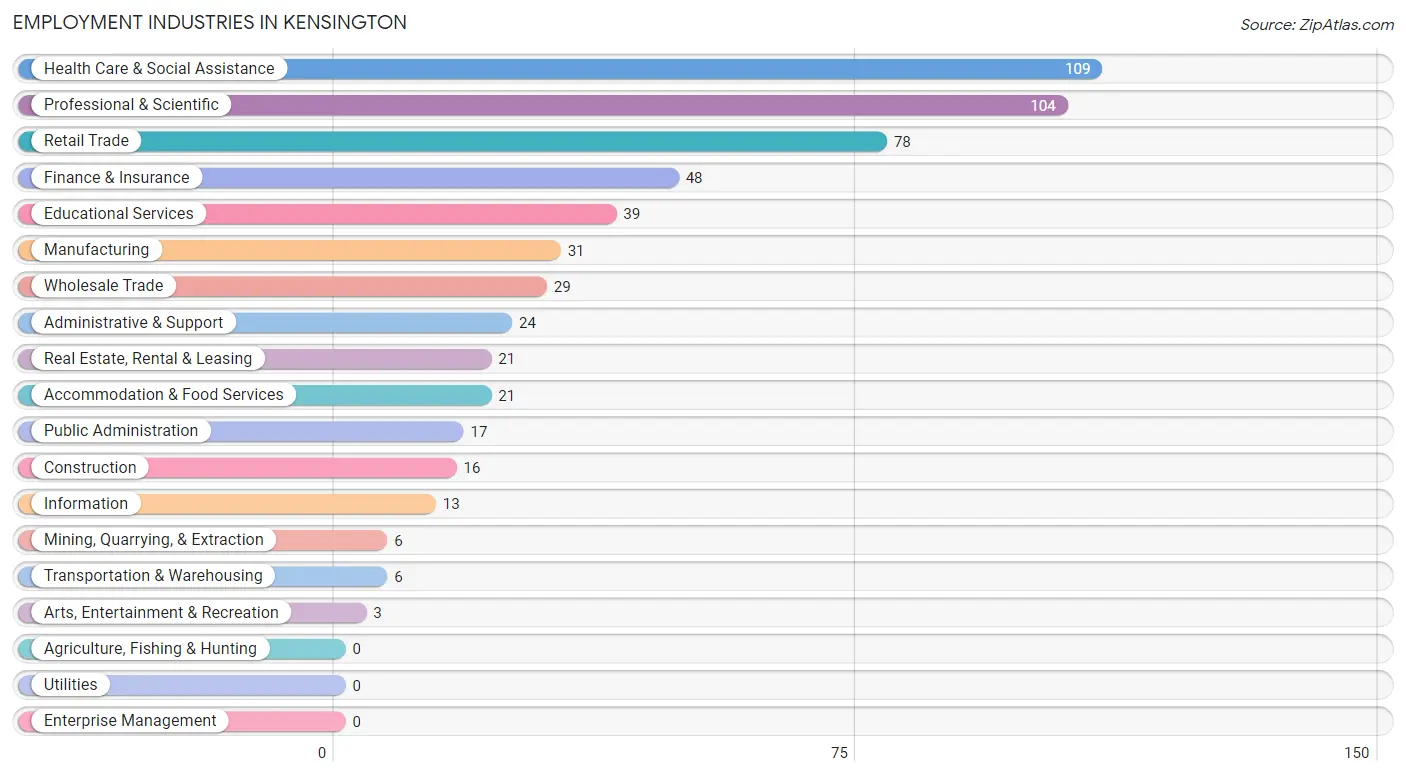
Employment Industries in Kensington
The major employment industries in Kensington include Health Care & Social Assistance (109 | 18.7%), Professional & Scientific (104 | 17.9%), Retail Trade (78 | 13.4%), Finance & Insurance (48 | 8.3%), and Educational Services (39 | 6.7%).
Employment Industries by Sex in Kensington
The Kensington industries that see more men than women are Mining, Quarrying, & Extraction (100.0%), Information (100.0%), and Construction (87.5%), whereas the industries that tend to have a higher number of women are Transportation & Warehousing (100.0%), Arts, Entertainment & Recreation (100.0%), and Educational Services (87.2%).
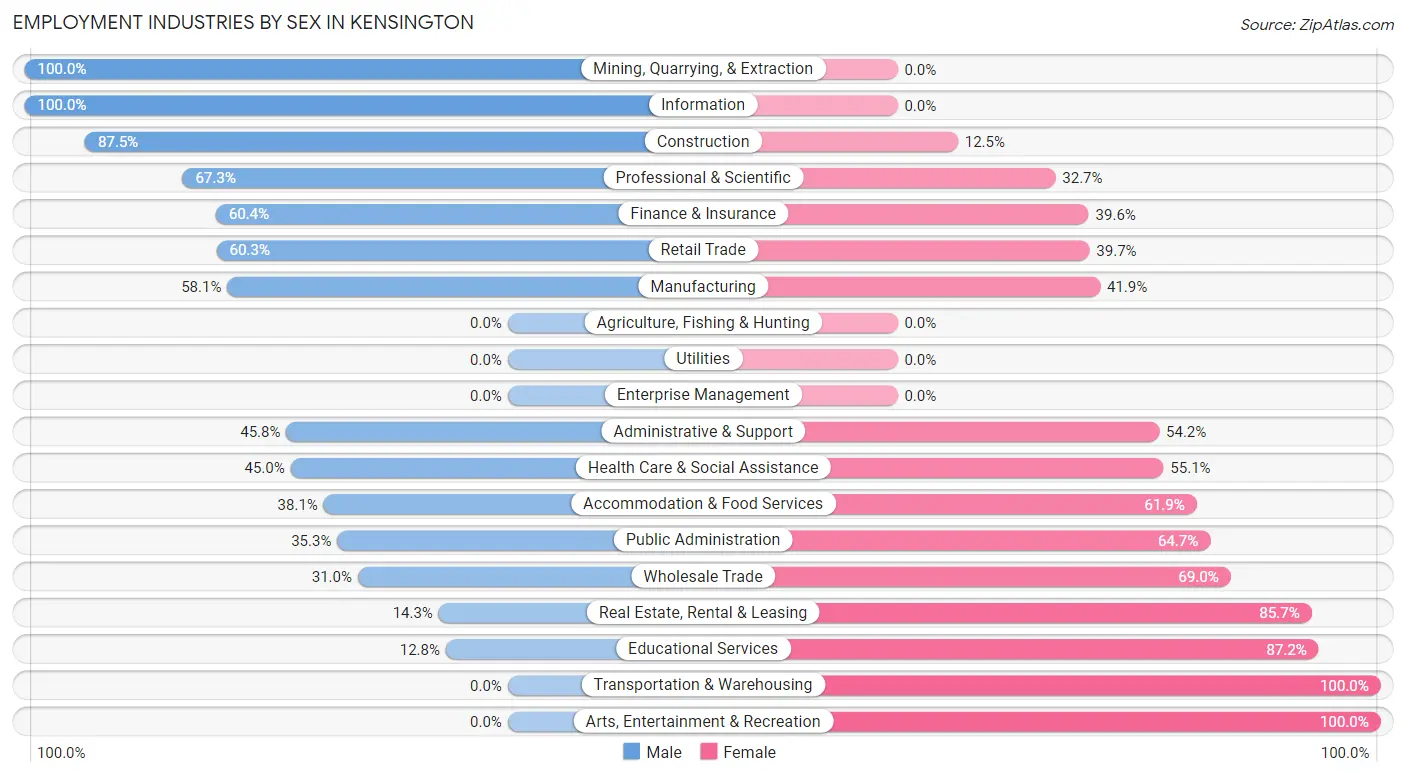
| Industry | Male | Female |
| Agriculture, Fishing & Hunting | 0 (0.0%) | 0 (0.0%) |
| Mining, Quarrying, & Extraction | 6 (100.0%) | 0 (0.0%) |
| Construction | 14 (87.5%) | 2 (12.5%) |
| Manufacturing | 18 (58.1%) | 13 (41.9%) |
| Wholesale Trade | 9 (31.0%) | 20 (69.0%) |
| Retail Trade | 47 (60.3%) | 31 (39.7%) |
| Transportation & Warehousing | 0 (0.0%) | 6 (100.0%) |
| Utilities | 0 (0.0%) | 0 (0.0%) |
| Information | 13 (100.0%) | 0 (0.0%) |
| Finance & Insurance | 29 (60.4%) | 19 (39.6%) |
| Real Estate, Rental & Leasing | 3 (14.3%) | 18 (85.7%) |
| Professional & Scientific | 70 (67.3%) | 34 (32.7%) |
| Enterprise Management | 0 (0.0%) | 0 (0.0%) |
| Administrative & Support | 11 (45.8%) | 13 (54.2%) |
| Educational Services | 5 (12.8%) | 34 (87.2%) |
| Health Care & Social Assistance | 49 (45.0%) | 60 (55.0%) |
| Arts, Entertainment & Recreation | 0 (0.0%) | 3 (100.0%) |
| Accommodation & Food Services | 8 (38.1%) | 13 (61.9%) |
| Public Administration | 6 (35.3%) | 11 (64.7%) |
| Total | 292 (50.2%) | 290 (49.8%) |
Education in Kensington
School Enrollment in Kensington
The most common levels of schooling among the 419 students in Kensington are elementary school (111 | 26.5%), high school (100 | 23.9%), and middle school (84 | 20.1%).
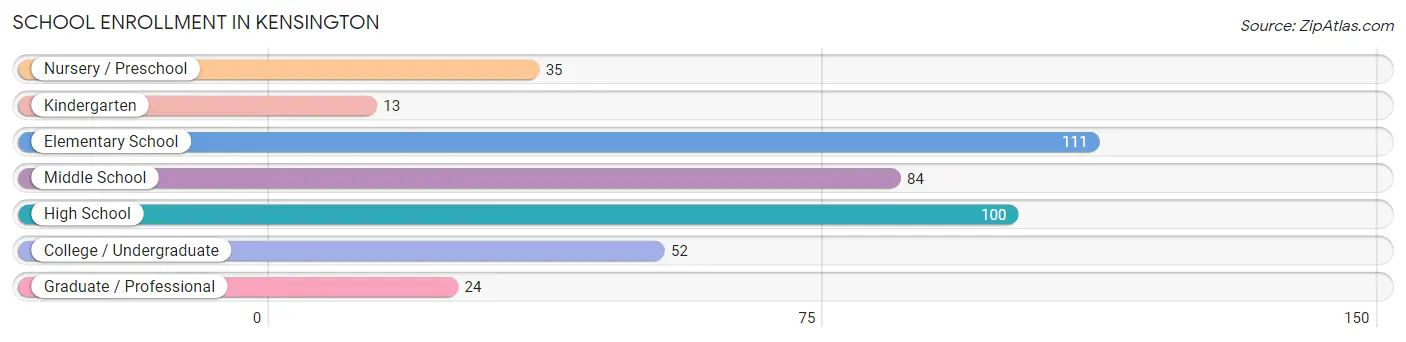
| School Level | # Students | % Students |
| Nursery / Preschool | 35 | 8.4% |
| Kindergarten | 13 | 3.1% |
| Elementary School | 111 | 26.5% |
| Middle School | 84 | 20.1% |
| High School | 100 | 23.9% |
| College / Undergraduate | 52 | 12.4% |
| Graduate / Professional | 24 | 5.7% |
| Total | 419 | 100.0% |
School Enrollment by Age by Funding Source in Kensington
Out of a total of 419 students who are enrolled in schools in Kensington, 183 (43.7%) attend a private institution, while the remaining 236 (56.3%) are enrolled in public schools. The age group of 25 to 34 year olds has the highest likelihood of being enrolled in private schools, with 9 (100.0% in the age bracket) enrolled. Conversely, the age group of 18 to 19 year olds has the lowest likelihood of being enrolled in a private school, with 13 (100.0% in the age bracket) attending a public institution.
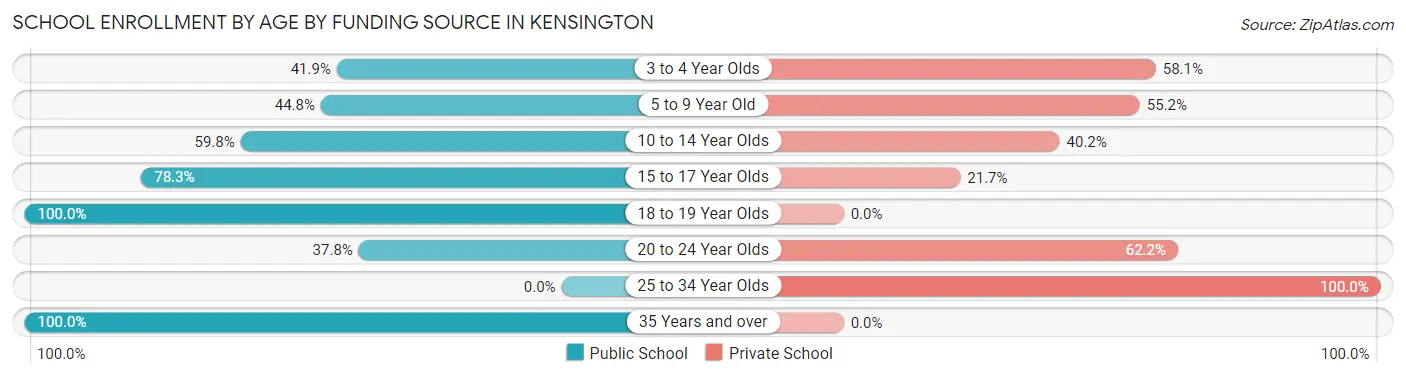
| Age Bracket | Public School | Private School |
| 3 to 4 Year Olds | 18 (41.9%) | 25 (58.1%) |
| 5 to 9 Year Old | 52 (44.8%) | 64 (55.2%) |
| 10 to 14 Year Olds | 55 (59.8%) | 37 (40.2%) |
| 15 to 17 Year Olds | 72 (78.3%) | 20 (21.7%) |
| 18 to 19 Year Olds | 13 (100.0%) | 0 (0.0%) |
| 20 to 24 Year Olds | 17 (37.8%) | 28 (62.2%) |
| 25 to 34 Year Olds | 0 (0.0%) | 9 (100.0%) |
| 35 Years and over | 9 (100.0%) | 0 (0.0%) |
| Total | 236 (56.3%) | 183 (43.7%) |
Educational Attainment by Field of Study in Kensington
Business (122 | 16.7%), social sciences (92 | 12.6%), literature & languages (69 | 9.4%), education (59 | 8.1%), and bio, nature & agricultural (54 | 7.4%) are the most common fields of study among 732 individuals in Kensington who have obtained a bachelor's degree or higher.
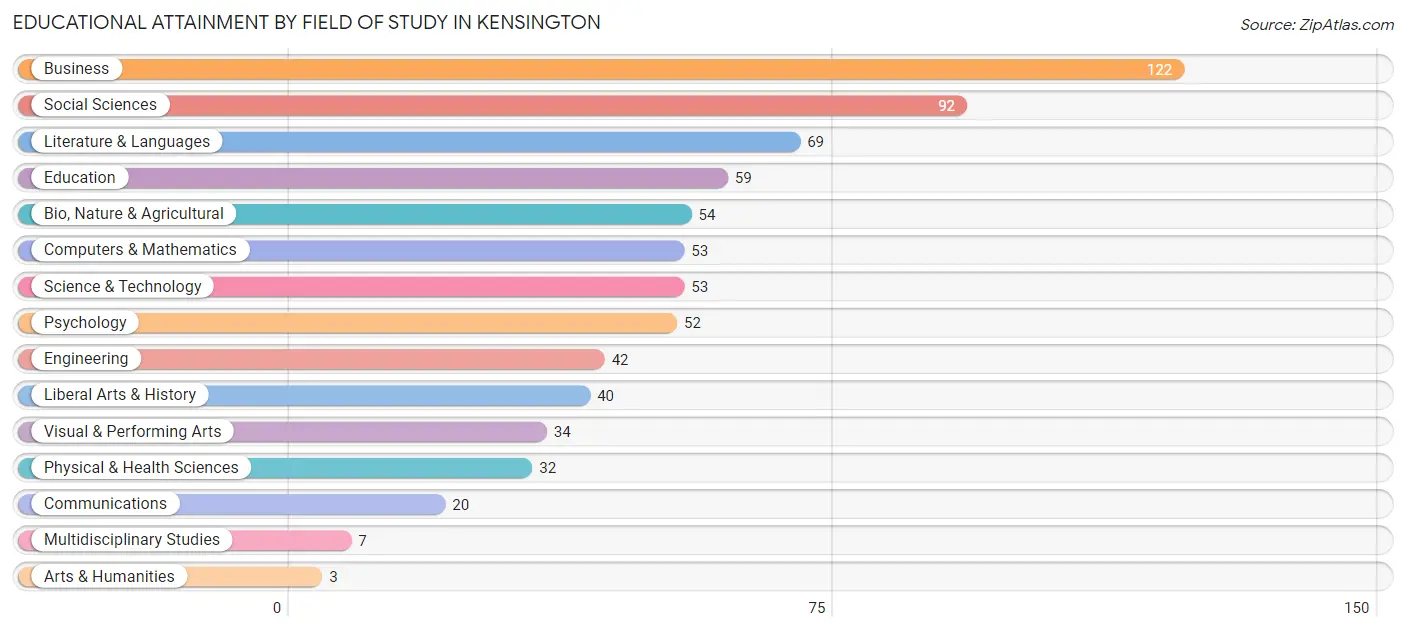
| Field of Study | # Graduates | % Graduates |
| Computers & Mathematics | 53 | 7.2% |
| Bio, Nature & Agricultural | 54 | 7.4% |
| Physical & Health Sciences | 32 | 4.4% |
| Psychology | 52 | 7.1% |
| Social Sciences | 92 | 12.6% |
| Engineering | 42 | 5.7% |
| Multidisciplinary Studies | 7 | 1.0% |
| Science & Technology | 53 | 7.2% |
| Business | 122 | 16.7% |
| Education | 59 | 8.1% |
| Literature & Languages | 69 | 9.4% |
| Liberal Arts & History | 40 | 5.5% |
| Visual & Performing Arts | 34 | 4.6% |
| Communications | 20 | 2.7% |
| Arts & Humanities | 3 | 0.4% |
| Total | 732 | 100.0% |
Transportation & Commute in Kensington
Vehicle Availability by Sex in Kensington
The most prevalent vehicle ownership categories in Kensington are males with 2 vehicles (129, accounting for 44.3%) and females with 2 vehicles (129, making up 45.0%).
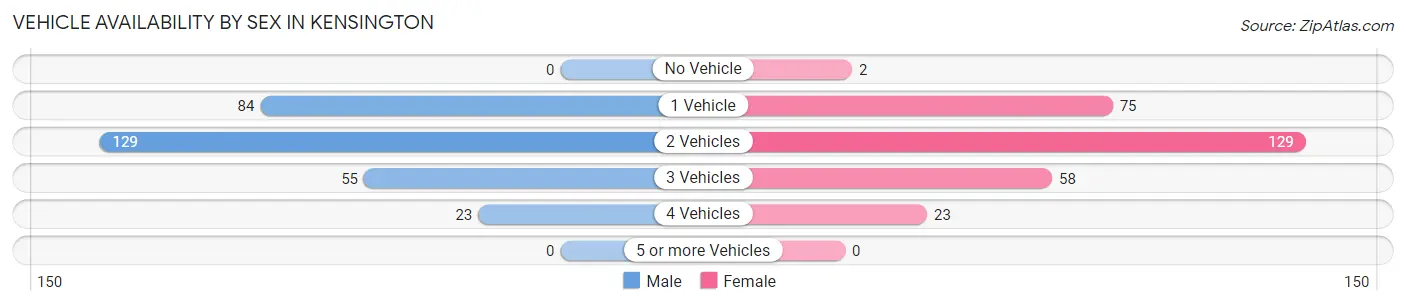
| Vehicles Available | Male | Female |
| No Vehicle | 0 (0.0%) | 2 (0.7%) |
| 1 Vehicle | 84 (28.9%) | 75 (26.1%) |
| 2 Vehicles | 129 (44.3%) | 129 (45.0%) |
| 3 Vehicles | 55 (18.9%) | 58 (20.2%) |
| 4 Vehicles | 23 (7.9%) | 23 (8.0%) |
| 5 or more Vehicles | 0 (0.0%) | 0 (0.0%) |
| Total | 291 (100.0%) | 287 (100.0%) |
Commute Time in Kensington
The most frequently occuring commute durations in Kensington are 60 to 89 minutes (133 commuters, 31.2%), 5 to 9 minutes (52 commuters, 12.2%), and 15 to 19 minutes (37 commuters, 8.7%).
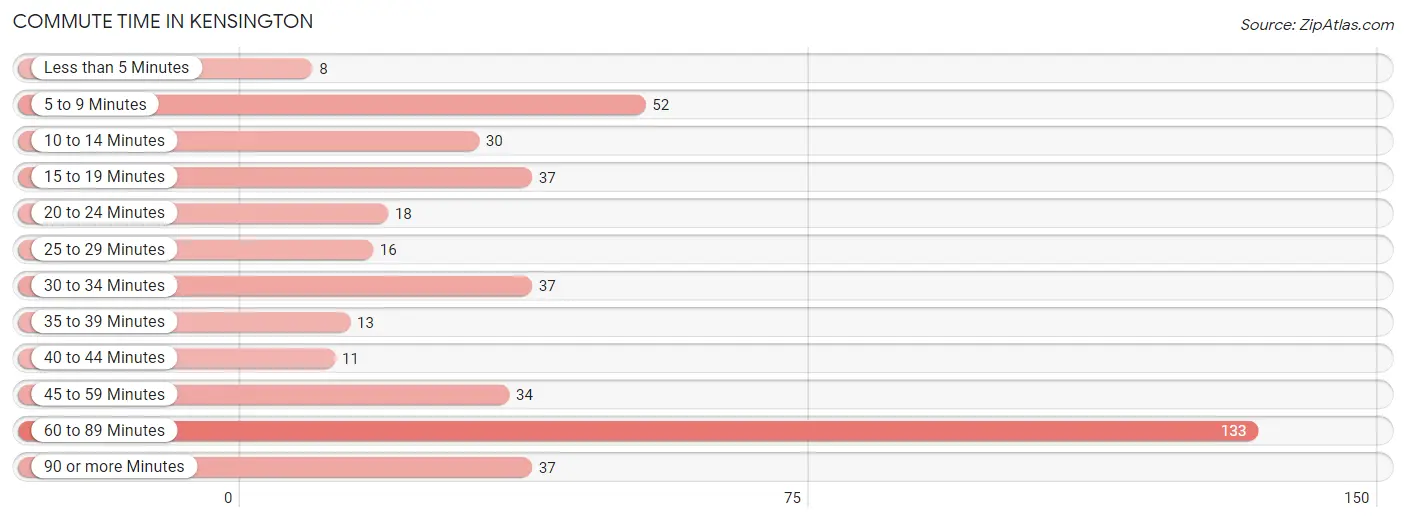
| Commute Time | # Commuters | % Commuters |
| Less than 5 Minutes | 8 | 1.9% |
| 5 to 9 Minutes | 52 | 12.2% |
| 10 to 14 Minutes | 30 | 7.0% |
| 15 to 19 Minutes | 37 | 8.7% |
| 20 to 24 Minutes | 18 | 4.2% |
| 25 to 29 Minutes | 16 | 3.8% |
| 30 to 34 Minutes | 37 | 8.7% |
| 35 to 39 Minutes | 13 | 3.0% |
| 40 to 44 Minutes | 11 | 2.6% |
| 45 to 59 Minutes | 34 | 8.0% |
| 60 to 89 Minutes | 133 | 31.2% |
| 90 or more Minutes | 37 | 8.7% |
Commute Time by Sex in Kensington
The most common commute times in Kensington are 60 to 89 minutes (82 commuters, 36.3%) for males and 60 to 89 minutes (51 commuters, 25.5%) for females.
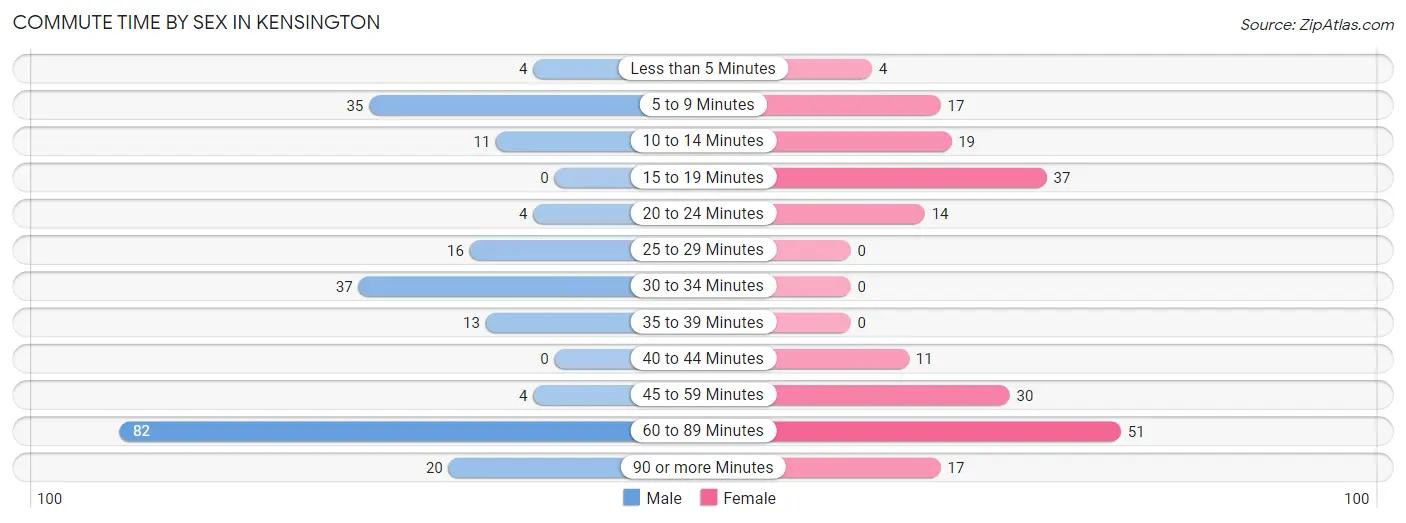
| Commute Time | Male | Female |
| Less than 5 Minutes | 4 (1.8%) | 4 (2.0%) |
| 5 to 9 Minutes | 35 (15.5%) | 17 (8.5%) |
| 10 to 14 Minutes | 11 (4.9%) | 19 (9.5%) |
| 15 to 19 Minutes | 0 (0.0%) | 37 (18.5%) |
| 20 to 24 Minutes | 4 (1.8%) | 14 (7.0%) |
| 25 to 29 Minutes | 16 (7.1%) | 0 (0.0%) |
| 30 to 34 Minutes | 37 (16.4%) | 0 (0.0%) |
| 35 to 39 Minutes | 13 (5.8%) | 0 (0.0%) |
| 40 to 44 Minutes | 0 (0.0%) | 11 (5.5%) |
| 45 to 59 Minutes | 4 (1.8%) | 30 (15.0%) |
| 60 to 89 Minutes | 82 (36.3%) | 51 (25.5%) |
| 90 or more Minutes | 20 (8.8%) | 17 (8.5%) |
Time of Departure to Work by Sex in Kensington
The most frequent times of departure to work in Kensington are 8:00 AM to 8:29 AM (40, 17.7%) for males and 7:00 AM to 7:29 AM (37, 18.5%) for females.
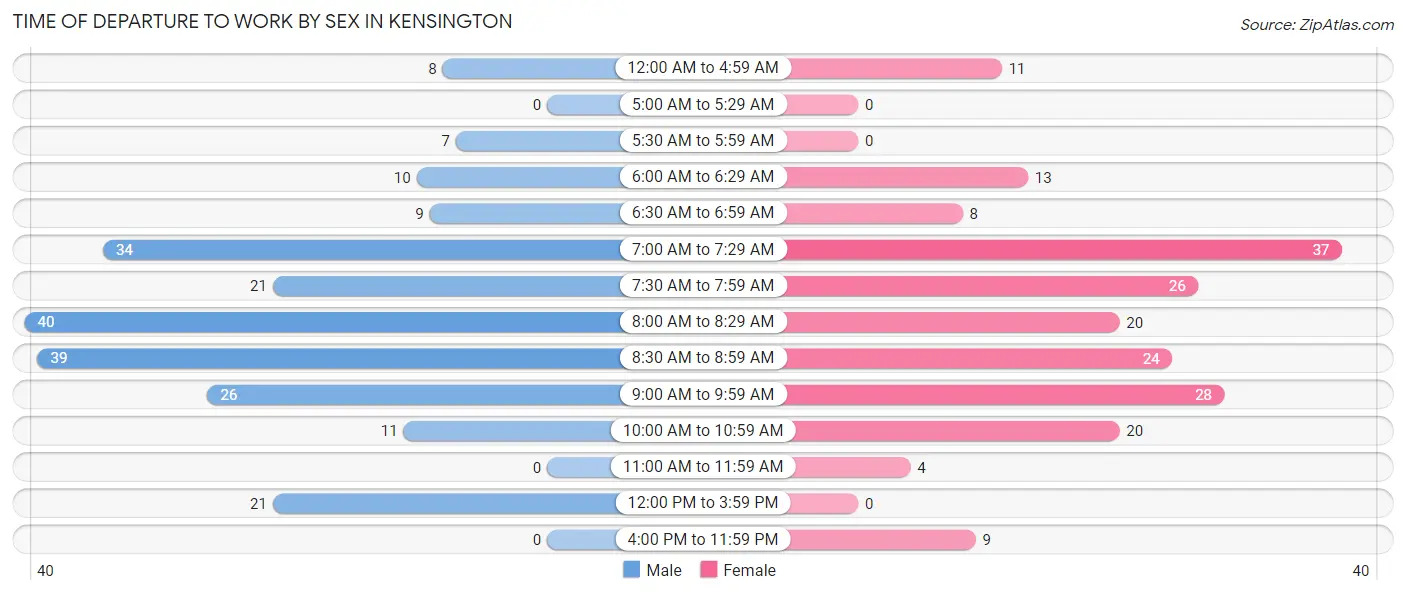
| Time of Departure | Male | Female |
| 12:00 AM to 4:59 AM | 8 (3.5%) | 11 (5.5%) |
| 5:00 AM to 5:29 AM | 0 (0.0%) | 0 (0.0%) |
| 5:30 AM to 5:59 AM | 7 (3.1%) | 0 (0.0%) |
| 6:00 AM to 6:29 AM | 10 (4.4%) | 13 (6.5%) |
| 6:30 AM to 6:59 AM | 9 (4.0%) | 8 (4.0%) |
| 7:00 AM to 7:29 AM | 34 (15.0%) | 37 (18.5%) |
| 7:30 AM to 7:59 AM | 21 (9.3%) | 26 (13.0%) |
| 8:00 AM to 8:29 AM | 40 (17.7%) | 20 (10.0%) |
| 8:30 AM to 8:59 AM | 39 (17.3%) | 24 (12.0%) |
| 9:00 AM to 9:59 AM | 26 (11.5%) | 28 (14.0%) |
| 10:00 AM to 10:59 AM | 11 (4.9%) | 20 (10.0%) |
| 11:00 AM to 11:59 AM | 0 (0.0%) | 4 (2.0%) |
| 12:00 PM to 3:59 PM | 21 (9.3%) | 0 (0.0%) |
| 4:00 PM to 11:59 PM | 0 (0.0%) | 9 (4.5%) |
| Total | 226 (100.0%) | 200 (100.0%) |
Housing Occupancy in Kensington
Occupancy by Ownership in Kensington
Of the total 458 dwellings in Kensington, owner-occupied units account for 447 (97.6%), while renter-occupied units make up 11 (2.4%).
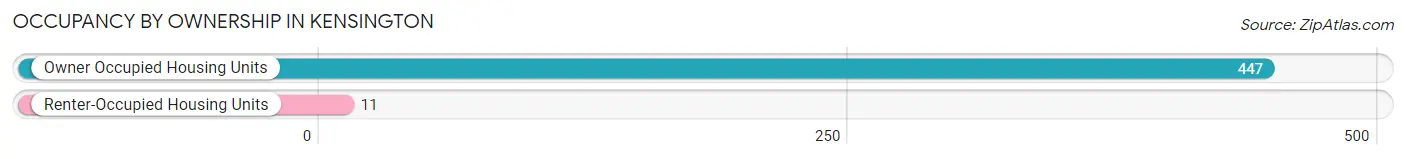
| Occupancy | # Housing Units | % Housing Units |
| Owner Occupied Housing Units | 447 | 97.6% |
| Renter-Occupied Housing Units | 11 | 2.4% |
| Total Occupied Housing Units | 458 | 100.0% |
Occupancy by Household Size in Kensington
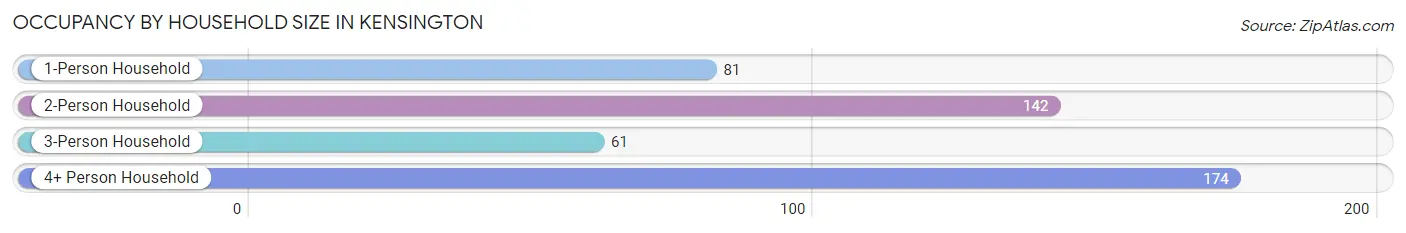
| Household Size | # Housing Units | % Housing Units |
| 1-Person Household | 81 | 17.7% |
| 2-Person Household | 142 | 31.0% |
| 3-Person Household | 61 | 13.3% |
| 4+ Person Household | 174 | 38.0% |
| Total Housing Units | 458 | 100.0% |
Occupancy by Ownership by Household Size in Kensington
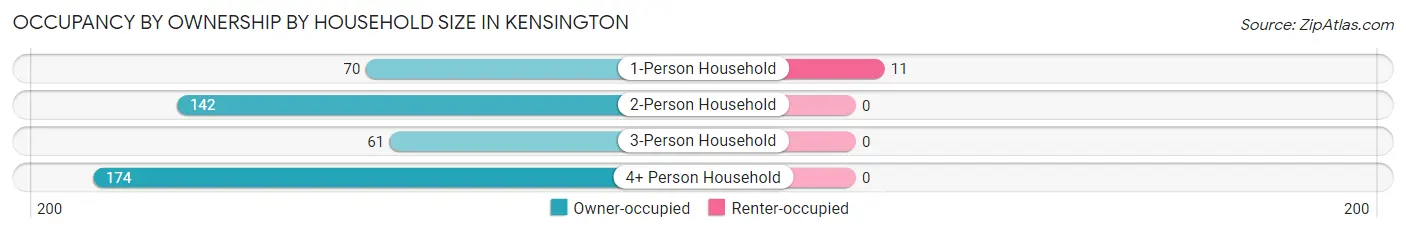
| Household Size | Owner-occupied | Renter-occupied |
| 1-Person Household | 70 (86.4%) | 11 (13.6%) |
| 2-Person Household | 142 (100.0%) | 0 (0.0%) |
| 3-Person Household | 61 (100.0%) | 0 (0.0%) |
| 4+ Person Household | 174 (100.0%) | 0 (0.0%) |
| Total Housing Units | 447 (97.6%) | 11 (2.4%) |
Occupancy by Educational Attainment in Kensington
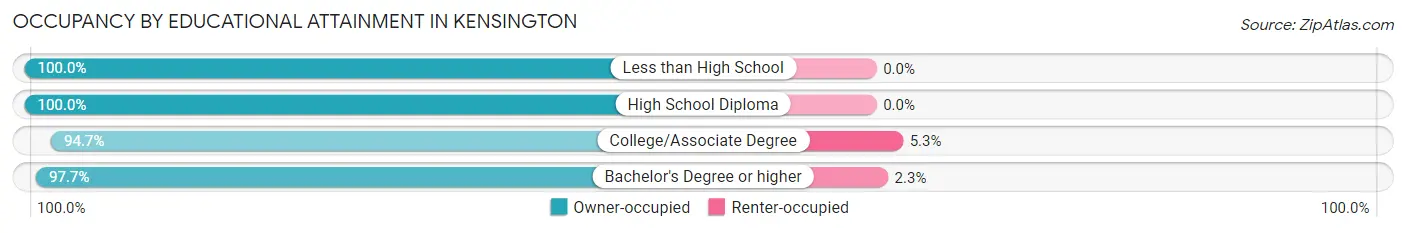
| Household Size | Owner-occupied | Renter-occupied |
| Less than High School | 15 (100.0%) | 0 (0.0%) |
| High School Diploma | 35 (100.0%) | 0 (0.0%) |
| College/Associate Degree | 54 (94.7%) | 3 (5.3%) |
| Bachelor's Degree or higher | 343 (97.7%) | 8 (2.3%) |
Occupancy by Age of Householder in Kensington
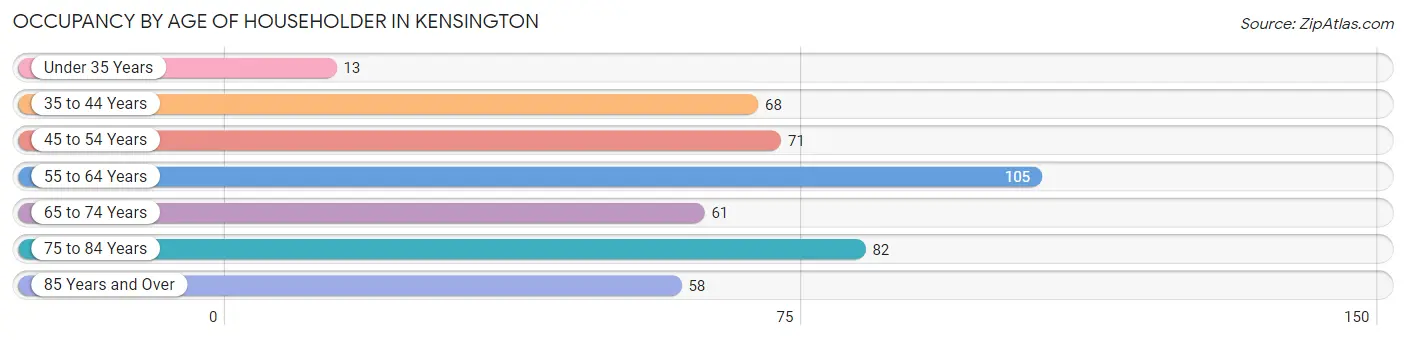
| Age Bracket | # Households | % Households |
| Under 35 Years | 13 | 2.8% |
| 35 to 44 Years | 68 | 14.8% |
| 45 to 54 Years | 71 | 15.5% |
| 55 to 64 Years | 105 | 22.9% |
| 65 to 74 Years | 61 | 13.3% |
| 75 to 84 Years | 82 | 17.9% |
| 85 Years and Over | 58 | 12.7% |
| Total | 458 | 100.0% |
Housing Finances in Kensington
Median Income by Occupancy in Kensington
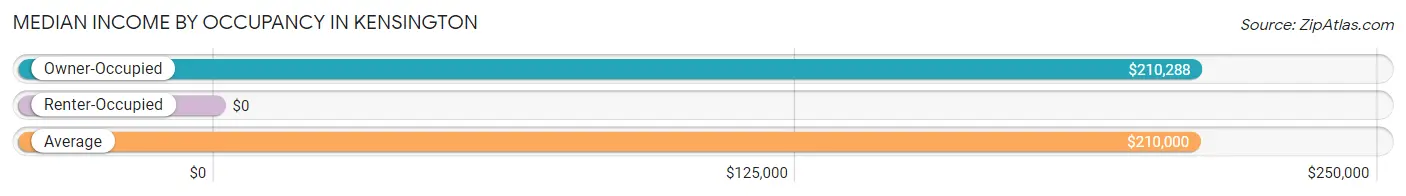
| Occupancy Type | # Households | Median Income |
| Owner-Occupied | 447 (97.6%) | $210,288 |
| Renter-Occupied | 11 (2.4%) | $0 |
| Average | 458 (100.0%) | $210,000 |
Occupancy by Householder Income Bracket in Kensington
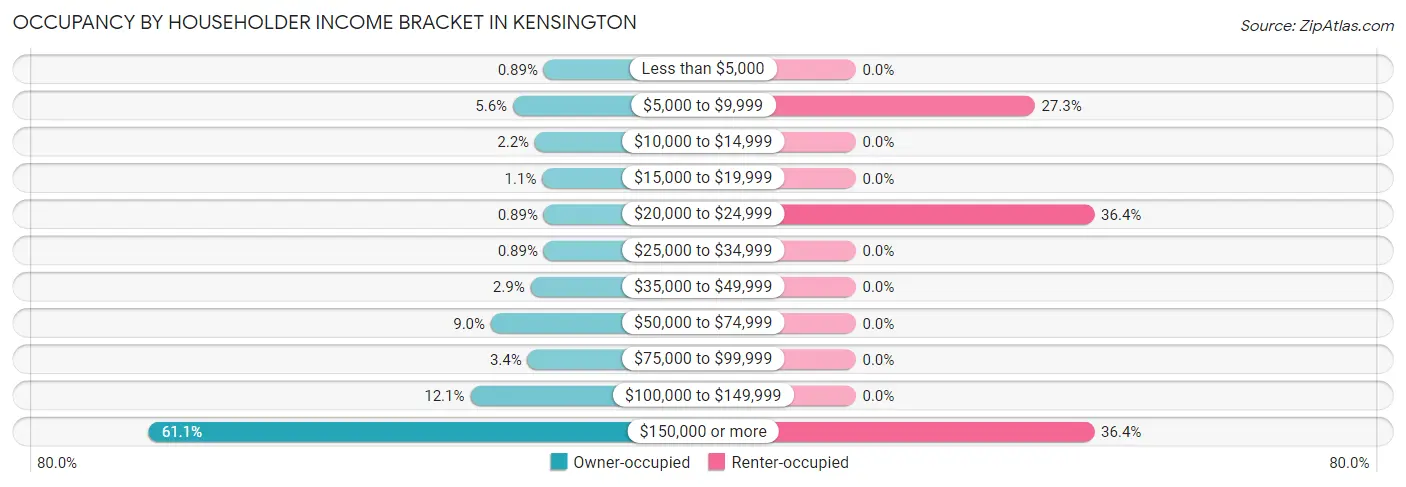
| Income Bracket | Owner-occupied | Renter-occupied |
| Less than $5,000 | 4 (0.9%) | 0 (0.0%) |
| $5,000 to $9,999 | 25 (5.6%) | 3 (27.3%) |
| $10,000 to $14,999 | 10 (2.2%) | 0 (0.0%) |
| $15,000 to $19,999 | 5 (1.1%) | 0 (0.0%) |
| $20,000 to $24,999 | 4 (0.9%) | 4 (36.4%) |
| $25,000 to $34,999 | 4 (0.9%) | 0 (0.0%) |
| $35,000 to $49,999 | 13 (2.9%) | 0 (0.0%) |
| $50,000 to $74,999 | 40 (8.9%) | 0 (0.0%) |
| $75,000 to $99,999 | 15 (3.4%) | 0 (0.0%) |
| $100,000 to $149,999 | 54 (12.1%) | 0 (0.0%) |
| $150,000 or more | 273 (61.1%) | 4 (36.4%) |
| Total | 447 (100.0%) | 11 (100.0%) |
Monthly Housing Cost Tiers in Kensington
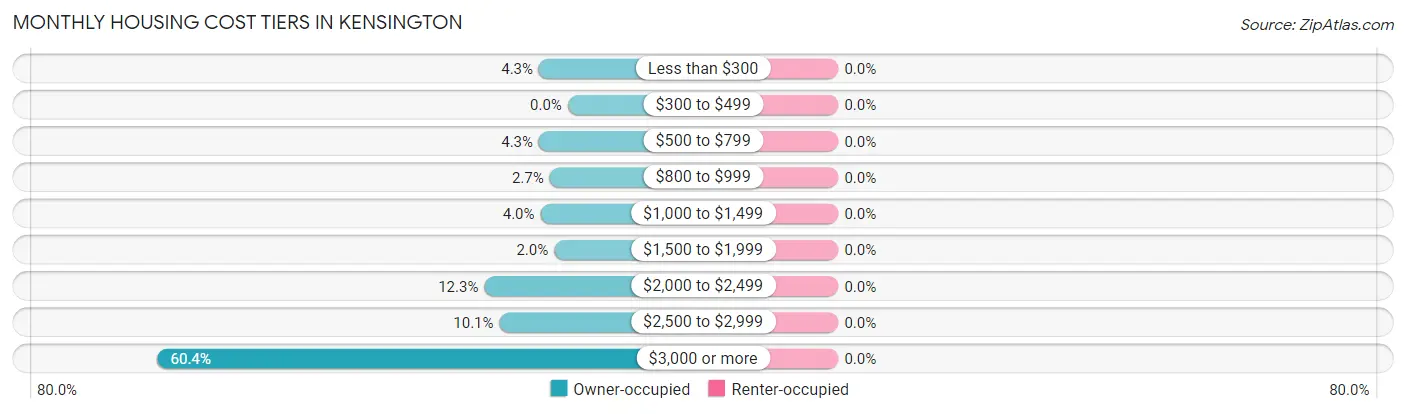
| Monthly Cost | Owner-occupied | Renter-occupied |
| Less than $300 | 19 (4.3%) | 0 (0.0%) |
| $300 to $499 | 0 (0.0%) | 0 (0.0%) |
| $500 to $799 | 19 (4.3%) | 0 (0.0%) |
| $800 to $999 | 12 (2.7%) | 0 (0.0%) |
| $1,000 to $1,499 | 18 (4.0%) | 0 (0.0%) |
| $1,500 to $1,999 | 9 (2.0%) | 0 (0.0%) |
| $2,000 to $2,499 | 55 (12.3%) | 0 (0.0%) |
| $2,500 to $2,999 | 45 (10.1%) | 0 (0.0%) |
| $3,000 or more | 270 (60.4%) | 0 (0.0%) |
| Total | 447 (100.0%) | 11 (100.0%) |
Physical Housing Characteristics in Kensington
Housing Structures in Kensington
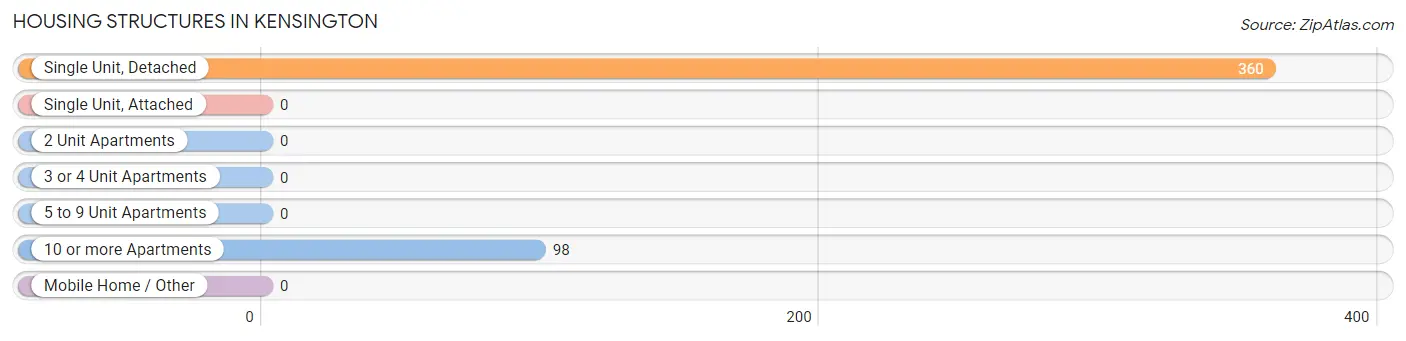
| Structure Type | # Housing Units | % Housing Units |
| Single Unit, Detached | 360 | 78.6% |
| Single Unit, Attached | 0 | 0.0% |
| 2 Unit Apartments | 0 | 0.0% |
| 3 or 4 Unit Apartments | 0 | 0.0% |
| 5 to 9 Unit Apartments | 0 | 0.0% |
| 10 or more Apartments | 98 | 21.4% |
| Mobile Home / Other | 0 | 0.0% |
| Total | 458 | 100.0% |
Housing Structures by Occupancy in Kensington
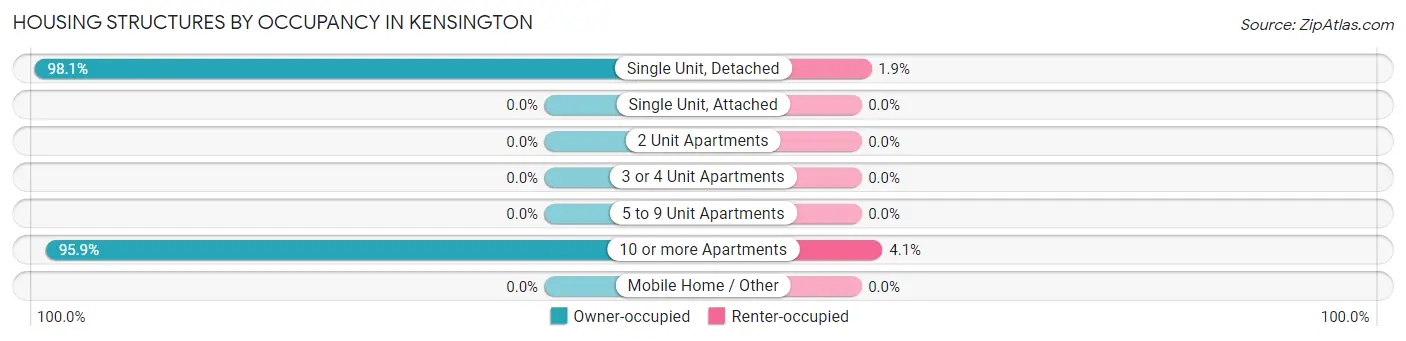
| Structure Type | Owner-occupied | Renter-occupied |
| Single Unit, Detached | 353 (98.1%) | 7 (1.9%) |
| Single Unit, Attached | 0 (0.0%) | 0 (0.0%) |
| 2 Unit Apartments | 0 (0.0%) | 0 (0.0%) |
| 3 or 4 Unit Apartments | 0 (0.0%) | 0 (0.0%) |
| 5 to 9 Unit Apartments | 0 (0.0%) | 0 (0.0%) |
| 10 or more Apartments | 94 (95.9%) | 4 (4.1%) |
| Mobile Home / Other | 0 (0.0%) | 0 (0.0%) |
| Total | 447 (97.6%) | 11 (2.4%) |
Housing Structures by Number of Rooms in Kensington
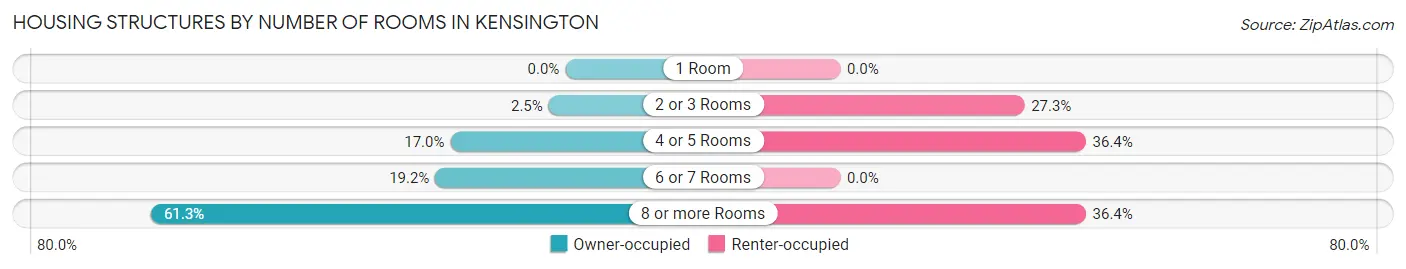
| Number of Rooms | Owner-occupied | Renter-occupied |
| 1 Room | 0 (0.0%) | 0 (0.0%) |
| 2 or 3 Rooms | 11 (2.5%) | 3 (27.3%) |
| 4 or 5 Rooms | 76 (17.0%) | 4 (36.4%) |
| 6 or 7 Rooms | 86 (19.2%) | 0 (0.0%) |
| 8 or more Rooms | 274 (61.3%) | 4 (36.4%) |
| Total | 447 (100.0%) | 11 (100.0%) |
Housing Structure by Heating Type in Kensington
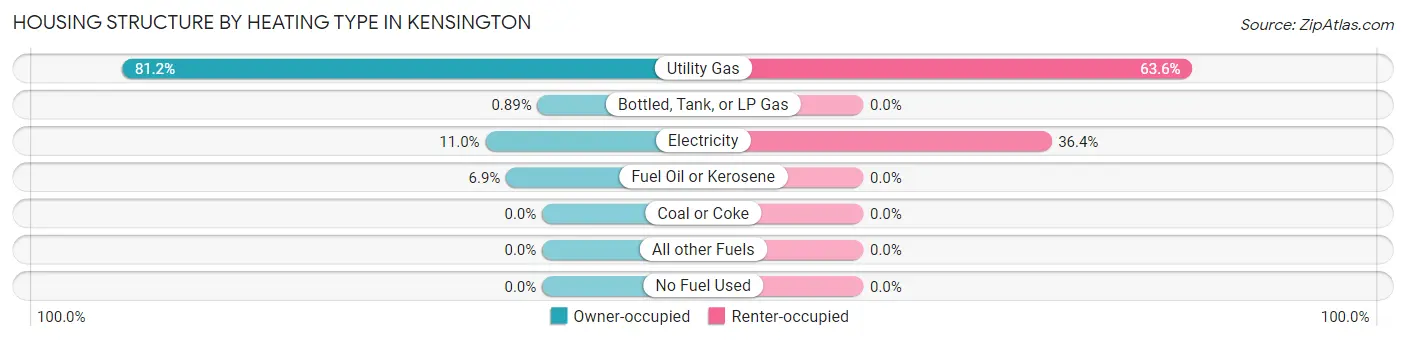
| Heating Type | Owner-occupied | Renter-occupied |
| Utility Gas | 363 (81.2%) | 7 (63.6%) |
| Bottled, Tank, or LP Gas | 4 (0.9%) | 0 (0.0%) |
| Electricity | 49 (11.0%) | 4 (36.4%) |
| Fuel Oil or Kerosene | 31 (6.9%) | 0 (0.0%) |
| Coal or Coke | 0 (0.0%) | 0 (0.0%) |
| All other Fuels | 0 (0.0%) | 0 (0.0%) |
| No Fuel Used | 0 (0.0%) | 0 (0.0%) |
| Total | 447 (100.0%) | 11 (100.0%) |
Household Vehicle Usage in Kensington
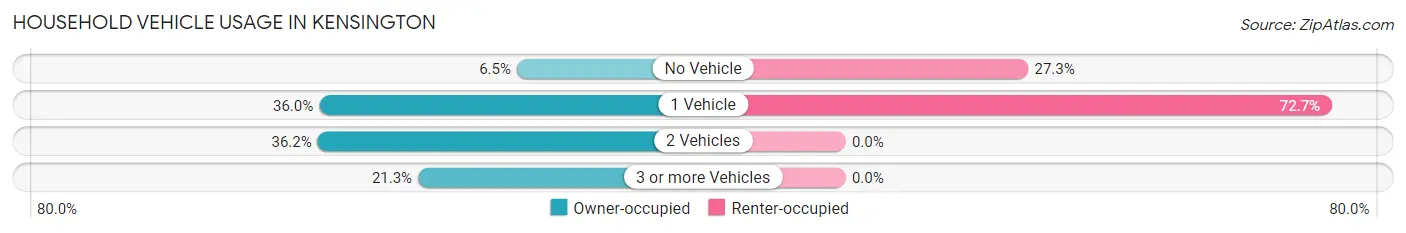
| Vehicles per Household | Owner-occupied | Renter-occupied |
| No Vehicle | 29 (6.5%) | 3 (27.3%) |
| 1 Vehicle | 161 (36.0%) | 8 (72.7%) |
| 2 Vehicles | 162 (36.2%) | 0 (0.0%) |
| 3 or more Vehicles | 95 (21.2%) | 0 (0.0%) |
| Total | 447 (100.0%) | 11 (100.0%) |
Real Estate & Mortgages in Kensington
Real Estate and Mortgage Overview in Kensington
| Characteristic | Without Mortgage | With Mortgage |
| Housing Units | 276 | 171 |
| Median Property Value | $1,184,200 | $1,643,400 |
| Median Household Income | $195,000 | $117 |
| Monthly Housing Costs | $1,501 | $168 |
| Real Estate Taxes | $10,001 | $3 |
Property Value by Mortgage Status in Kensington
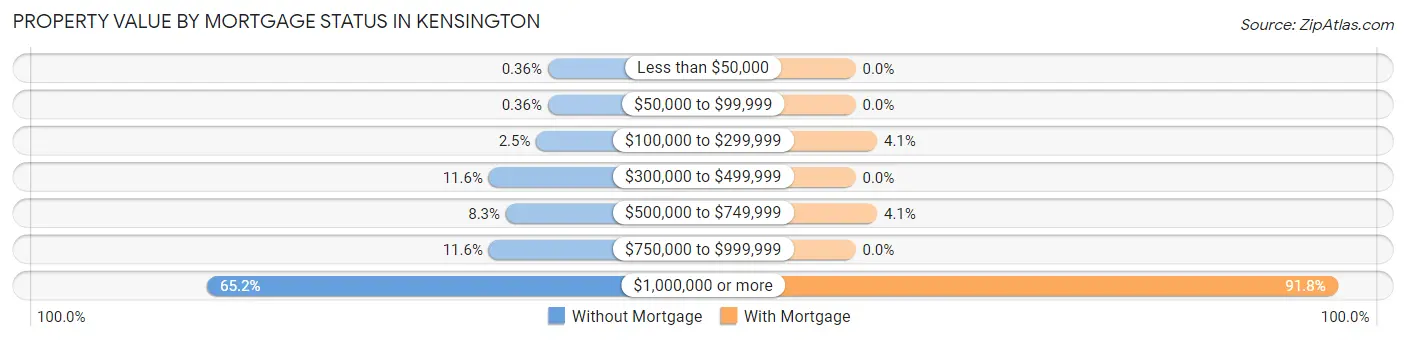
| Property Value | Without Mortgage | With Mortgage |
| Less than $50,000 | 1 (0.4%) | 0 (0.0%) |
| $50,000 to $99,999 | 1 (0.4%) | 0 (0.0%) |
| $100,000 to $299,999 | 7 (2.5%) | 7 (4.1%) |
| $300,000 to $499,999 | 32 (11.6%) | 0 (0.0%) |
| $500,000 to $749,999 | 23 (8.3%) | 7 (4.1%) |
| $750,000 to $999,999 | 32 (11.6%) | 0 (0.0%) |
| $1,000,000 or more | 180 (65.2%) | 157 (91.8%) |
| Total | 276 (100.0%) | 171 (100.0%) |
Household Income by Mortgage Status in Kensington
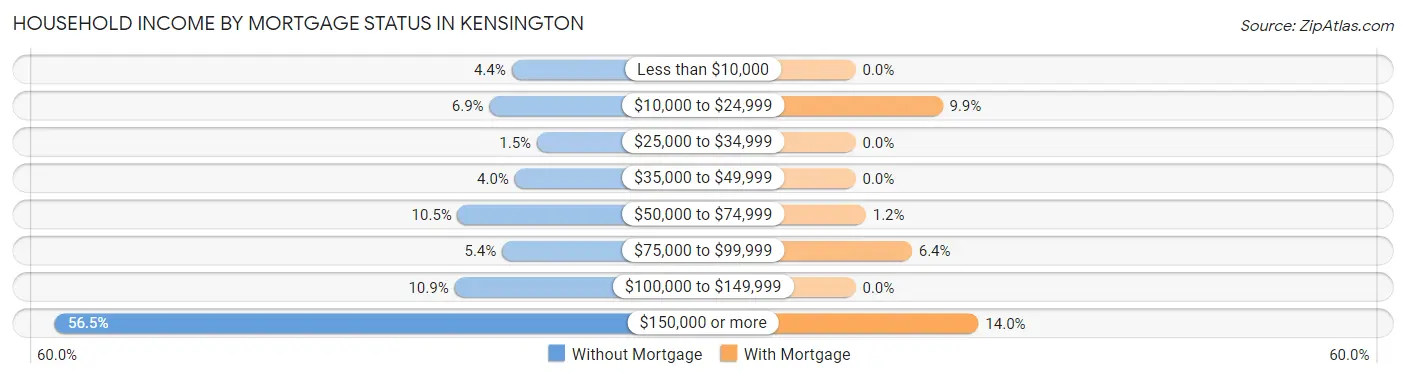
| Household Income | Without Mortgage | With Mortgage |
| Less than $10,000 | 12 (4.3%) | 0 (0.0%) |
| $10,000 to $24,999 | 19 (6.9%) | 17 (9.9%) |
| $25,000 to $34,999 | 4 (1.5%) | 0 (0.0%) |
| $35,000 to $49,999 | 11 (4.0%) | 0 (0.0%) |
| $50,000 to $74,999 | 29 (10.5%) | 2 (1.2%) |
| $75,000 to $99,999 | 15 (5.4%) | 11 (6.4%) |
| $100,000 to $149,999 | 30 (10.9%) | 0 (0.0%) |
| $150,000 or more | 156 (56.5%) | 24 (14.0%) |
| Total | 276 (100.0%) | 171 (100.0%) |
Property Value to Household Income Ratio in Kensington
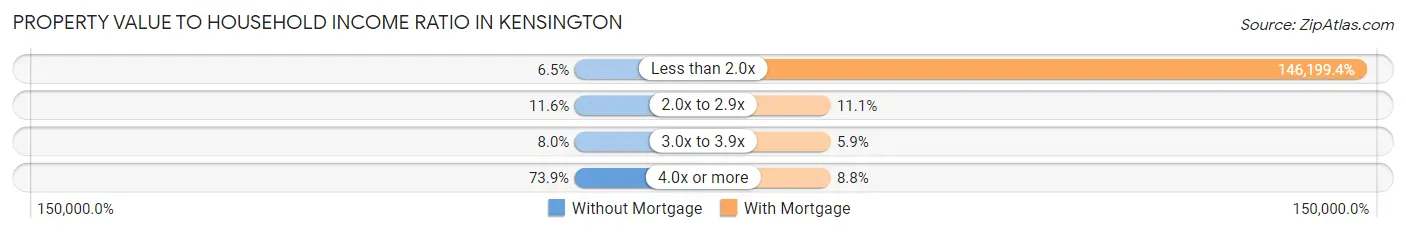
| Value-to-Income Ratio | Without Mortgage | With Mortgage |
| Less than 2.0x | 18 (6.5%) | 250,001 (146,199.4%) |
| 2.0x to 2.9x | 32 (11.6%) | 19 (11.1%) |
| 3.0x to 3.9x | 22 (8.0%) | 10 (5.9%) |
| 4.0x or more | 204 (73.9%) | 15 (8.8%) |
| Total | 276 (100.0%) | 171 (100.0%) |
Real Estate Taxes by Mortgage Status in Kensington
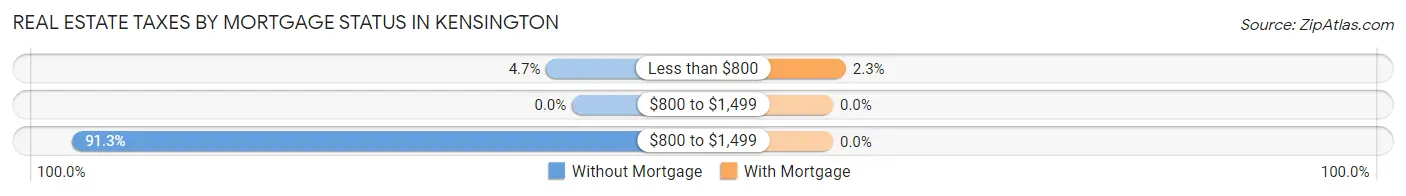
| Property Taxes | Without Mortgage | With Mortgage |
| Less than $800 | 13 (4.7%) | 4 (2.3%) |
| $800 to $1,499 | 0 (0.0%) | 0 (0.0%) |
| $800 to $1,499 | 252 (91.3%) | 0 (0.0%) |
| Total | 276 (100.0%) | 171 (100.0%) |
Health & Disability in Kensington
Health Insurance Coverage by Age in Kensington
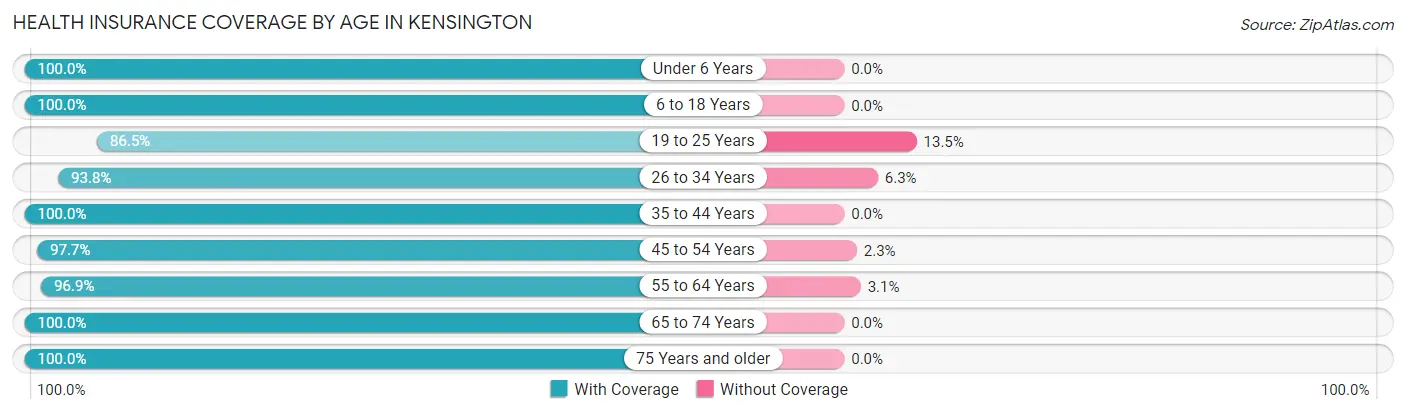
| Age Bracket | With Coverage | Without Coverage |
| Under 6 Years | 101 (100.0%) | 0 (0.0%) |
| 6 to 18 Years | 306 (100.0%) | 0 (0.0%) |
| 19 to 25 Years | 109 (86.5%) | 17 (13.5%) |
| 26 to 34 Years | 60 (93.8%) | 4 (6.2%) |
| 35 to 44 Years | 137 (100.0%) | 0 (0.0%) |
| 45 to 54 Years | 167 (97.7%) | 4 (2.3%) |
| 55 to 64 Years | 190 (96.9%) | 6 (3.1%) |
| 65 to 74 Years | 136 (100.0%) | 0 (0.0%) |
| 75 Years and older | 208 (100.0%) | 0 (0.0%) |
| Total | 1,414 (97.9%) | 31 (2.1%) |
Health Insurance Coverage by Citizenship Status in Kensington
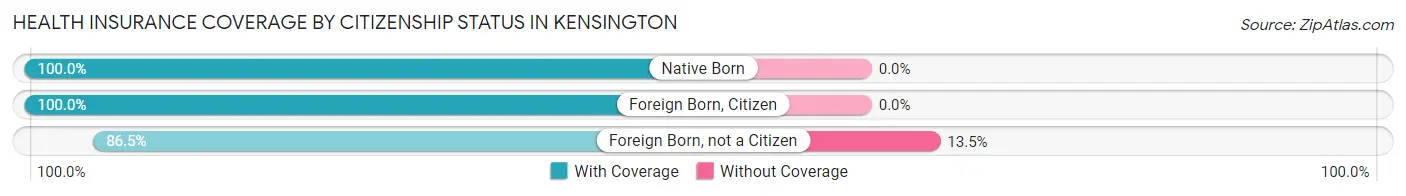
| Citizenship Status | With Coverage | Without Coverage |
| Native Born | 101 (100.0%) | 0 (0.0%) |
| Foreign Born, Citizen | 306 (100.0%) | 0 (0.0%) |
| Foreign Born, not a Citizen | 109 (86.5%) | 17 (13.5%) |
Health Insurance Coverage by Household Income in Kensington
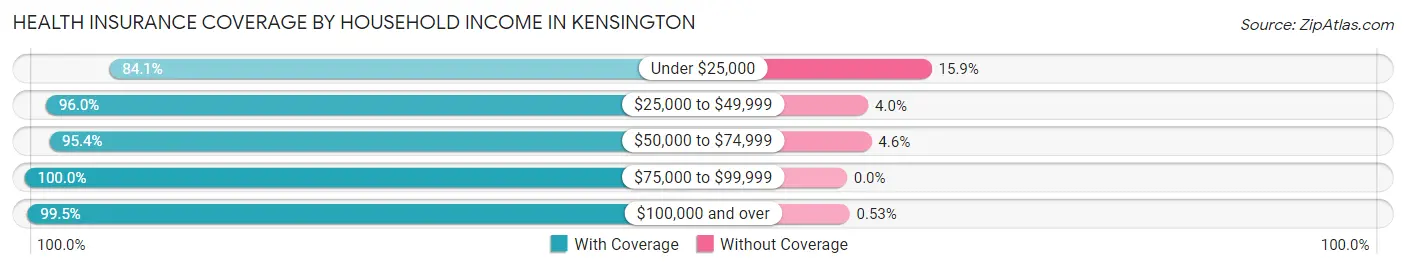
| Household Income | With Coverage | Without Coverage |
| Under $25,000 | 90 (84.1%) | 17 (15.9%) |
| $25,000 to $49,999 | 24 (96.0%) | 1 (4.0%) |
| $50,000 to $74,999 | 145 (95.4%) | 7 (4.6%) |
| $75,000 to $99,999 | 27 (100.0%) | 0 (0.0%) |
| $100,000 and over | 1,128 (99.5%) | 6 (0.5%) |
Public vs Private Health Insurance Coverage by Age in Kensington
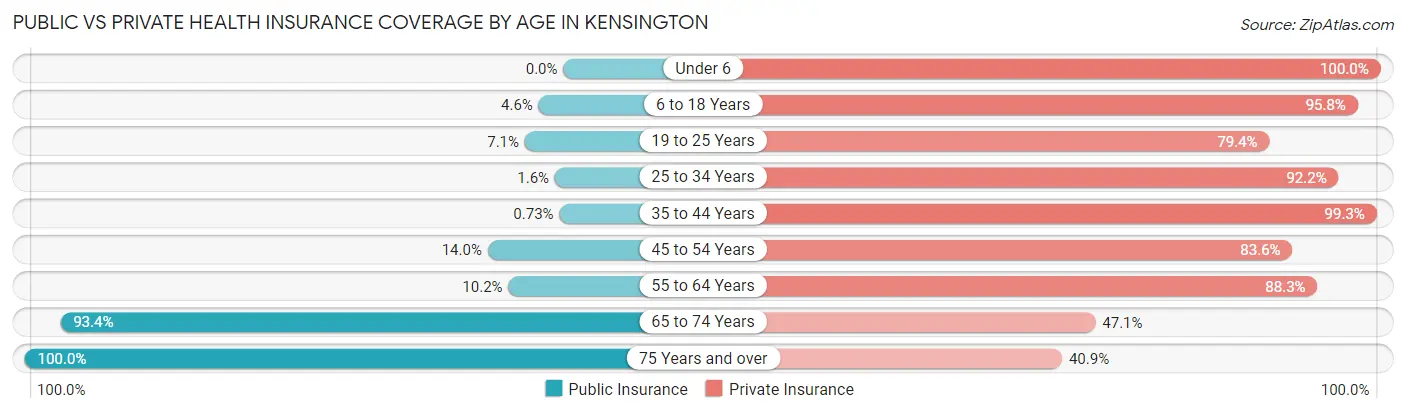
| Age Bracket | Public Insurance | Private Insurance |
| Under 6 | 0 (0.0%) | 101 (100.0%) |
| 6 to 18 Years | 14 (4.6%) | 293 (95.8%) |
| 19 to 25 Years | 9 (7.1%) | 100 (79.4%) |
| 25 to 34 Years | 1 (1.6%) | 59 (92.2%) |
| 35 to 44 Years | 1 (0.7%) | 136 (99.3%) |
| 45 to 54 Years | 24 (14.0%) | 143 (83.6%) |
| 55 to 64 Years | 20 (10.2%) | 173 (88.3%) |
| 65 to 74 Years | 127 (93.4%) | 64 (47.1%) |
| 75 Years and over | 208 (100.0%) | 85 (40.9%) |
| Total | 404 (28.0%) | 1,154 (79.9%) |
Disability Status by Sex by Age in Kensington
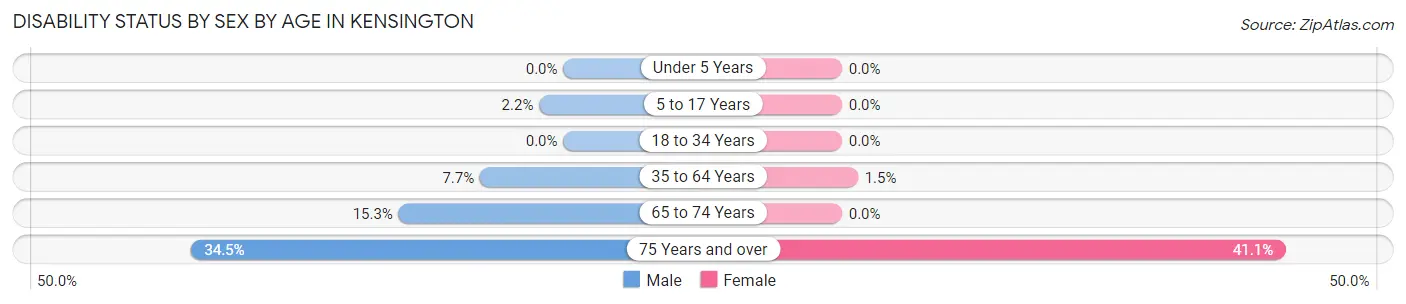
| Age Bracket | Male | Female |
| Under 5 Years | 0 (0.0%) | 0 (0.0%) |
| 5 to 17 Years | 3 (2.2%) | 0 (0.0%) |
| 18 to 34 Years | 0 (0.0%) | 0 (0.0%) |
| 35 to 64 Years | 18 (7.7%) | 4 (1.5%) |
| 65 to 74 Years | 11 (15.3%) | 0 (0.0%) |
| 75 Years and over | 29 (34.5%) | 51 (41.1%) |
Disability Class by Sex by Age in Kensington
Disability Class: Hearing Difficulty
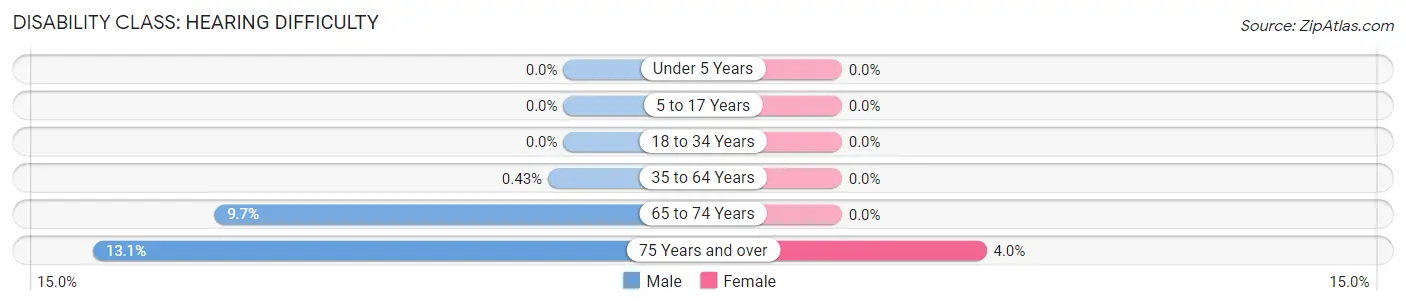
| Age Bracket | Male | Female |
| Under 5 Years | 0 (0.0%) | 0 (0.0%) |
| 5 to 17 Years | 0 (0.0%) | 0 (0.0%) |
| 18 to 34 Years | 0 (0.0%) | 0 (0.0%) |
| 35 to 64 Years | 1 (0.4%) | 0 (0.0%) |
| 65 to 74 Years | 7 (9.7%) | 0 (0.0%) |
| 75 Years and over | 11 (13.1%) | 5 (4.0%) |
Disability Class: Vision Difficulty
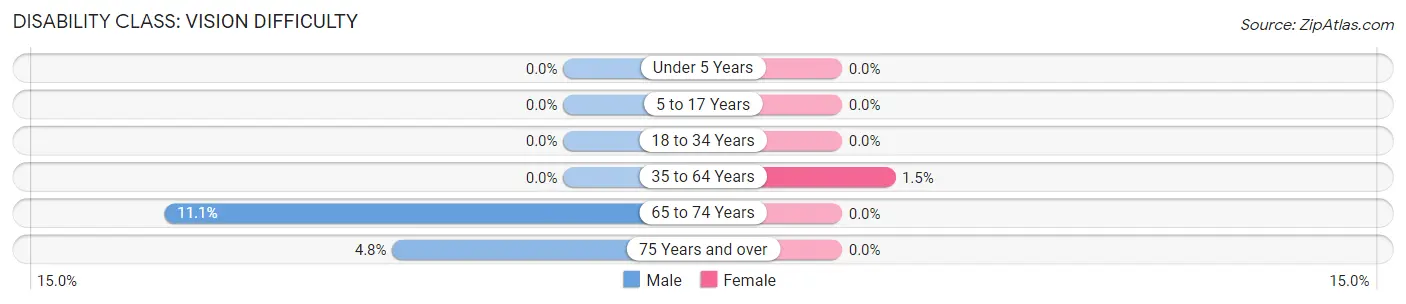
| Age Bracket | Male | Female |
| Under 5 Years | 0 (0.0%) | 0 (0.0%) |
| 5 to 17 Years | 0 (0.0%) | 0 (0.0%) |
| 18 to 34 Years | 0 (0.0%) | 0 (0.0%) |
| 35 to 64 Years | 0 (0.0%) | 4 (1.5%) |
| 65 to 74 Years | 8 (11.1%) | 0 (0.0%) |
| 75 Years and over | 4 (4.8%) | 0 (0.0%) |
Disability Class: Cognitive Difficulty
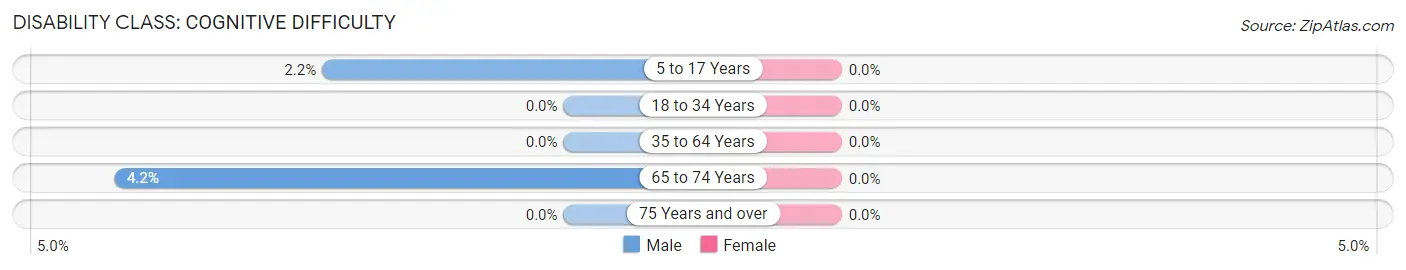
| Age Bracket | Male | Female |
| 5 to 17 Years | 3 (2.2%) | 0 (0.0%) |
| 18 to 34 Years | 0 (0.0%) | 0 (0.0%) |
| 35 to 64 Years | 0 (0.0%) | 0 (0.0%) |
| 65 to 74 Years | 3 (4.2%) | 0 (0.0%) |
| 75 Years and over | 0 (0.0%) | 0 (0.0%) |
Disability Class: Ambulatory Difficulty
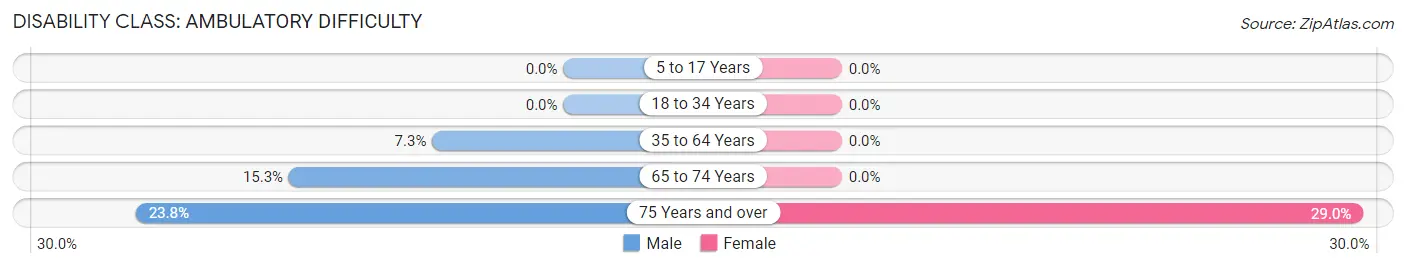
| Age Bracket | Male | Female |
| 5 to 17 Years | 0 (0.0%) | 0 (0.0%) |
| 18 to 34 Years | 0 (0.0%) | 0 (0.0%) |
| 35 to 64 Years | 17 (7.3%) | 0 (0.0%) |
| 65 to 74 Years | 11 (15.3%) | 0 (0.0%) |
| 75 Years and over | 20 (23.8%) | 36 (29.0%) |
Disability Class: Self-Care Difficulty
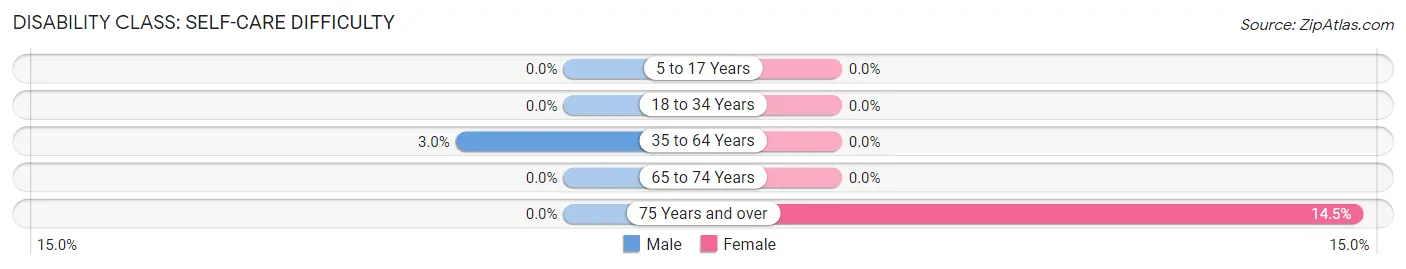
| Age Bracket | Male | Female |
| 5 to 17 Years | 0 (0.0%) | 0 (0.0%) |
| 18 to 34 Years | 0 (0.0%) | 0 (0.0%) |
| 35 to 64 Years | 7 (3.0%) | 0 (0.0%) |
| 65 to 74 Years | 0 (0.0%) | 0 (0.0%) |
| 75 Years and over | 0 (0.0%) | 18 (14.5%) |
Technology Access in Kensington
Computing Device Access in Kensington
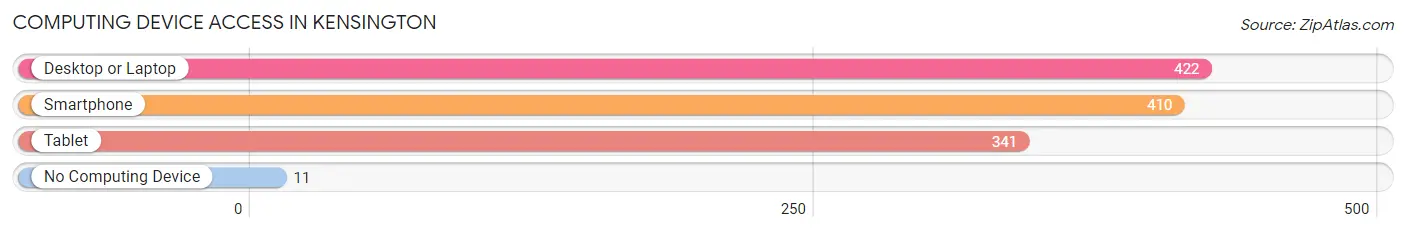
| Device Type | # Households | % Households |
| Desktop or Laptop | 422 | 92.1% |
| Smartphone | 410 | 89.5% |
| Tablet | 341 | 74.5% |
| No Computing Device | 11 | 2.4% |
| Total | 458 | 100.0% |
Internet Access in Kensington
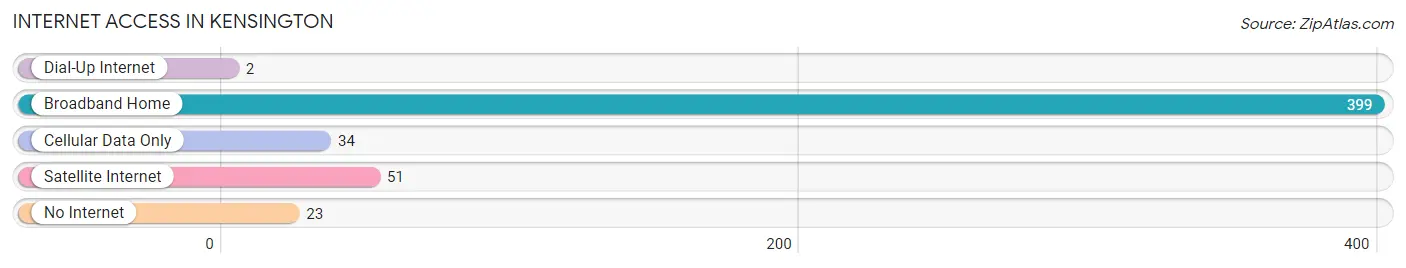
| Internet Type | # Households | % Households |
| Dial-Up Internet | 2 | 0.4% |
| Broadband Home | 399 | 87.1% |
| Cellular Data Only | 34 | 7.4% |
| Satellite Internet | 51 | 11.1% |
| No Internet | 23 | 5.0% |
| Total | 458 | 100.0% |
Kensington Summary
Kensington is a small hamlet located in the town of Hempstead in Nassau County, New York. It is situated on the south shore of Long Island, approximately 25 miles east of New York City. The hamlet is bordered by the hamlets of Baldwin, Freeport, and Roosevelt. The population of Kensington was 4,845 at the 2010 census.
History
Kensington was originally part of the town of Hempstead, which was established in 1644. The area was first settled by Europeans in the late 1600s, and the hamlet was officially established in 1873. The name Kensington was chosen to honor the Duke of Kensington, who was a friend of the original settlers.
The hamlet was primarily a farming community until the early 1900s, when it began to develop into a residential area. The first post office was established in 1887, and the first school was built in 1895. The hamlet continued to grow throughout the 20th century, and by the 1950s it had become a popular suburban community.
Geography
Kensington is located at 40°38'25"N 73°35'45"W (40.640278, -73.595833). It is situated on the south shore of Long Island, approximately 25 miles east of New York City. The hamlet is bordered by the hamlets of Baldwin, Freeport, and Roosevelt.
The total area of Kensington is 1.2 square miles, all of which is land. The terrain is mostly flat, with some rolling hills. The highest point in the hamlet is approximately 50 feet above sea level.
Economy
Kensington is primarily a residential community, and the majority of its residents are employed in the nearby cities of New York and Long Island. The hamlet does have some small businesses, including a few restaurants, retail stores, and professional services.
Demographics
As of the 2010 census, there were 4,845 people, 1,845 households, and 1,323 families residing in Kensington. The population density was 4,037.7 people per square mile. The racial makeup of the hamlet was 57.3% White, 28.2% African American, 0.3% Native American, 5.2% Asian, 0.1% Pacific Islander, 5.2% from other races, and 3.7% from two or more races. Hispanic or Latino of any race were 11.3% of the population.
The median income for a household in Kensington was $63,958, and the median income for a family was $76,944. The per capita income for the hamlet was $30,945. About 6.2% of families and 8.2% of the population were below the poverty line, including 10.2% of those under age 18 and 5.2% of those age 65 or over.
Common Questions
What is Per Capita Income in Kensington?
Per Capita income in Kensington is $93,447.
What is the Median Family Income in Kensington?
Median Family Income in Kensington is $250,001.
What is the Median Household income in Kensington?
Median Household Income in Kensington is $210,000.
What is Income or Wage Gap in Kensington?
Income or Wage Gap in Kensington is 63.4%.
Women in Kensington earn 36.6 cents for every dollar earned by a man.
What is Inequality or Gini Index in Kensington?
Inequality or Gini Index in Kensington is 0.51.
What is the Total Population of Kensington?
Total Population of Kensington is 1,445.
What is the Total Male Population of Kensington?
Total Male Population of Kensington is 669.
What is the Total Female Population of Kensington?
Total Female Population of Kensington is 776.
What is the Ratio of Males per 100 Females in Kensington?
There are 86.21 Males per 100 Females in Kensington.
What is the Ratio of Females per 100 Males in Kensington?
There are 115.99 Females per 100 Males in Kensington.
What is the Median Population Age in Kensington?
Median Population Age in Kensington is 44.1 Years.
What is the Average Family Size in Kensington
Average Family Size in Kensington is 3.6 People.
What is the Average Household Size in Kensington
Average Household Size in Kensington is 3.2 People.
How Large is the Labor Force in Kensington?
There are 609 People in the Labor Forcein in Kensington.
What is the Percentage of People in the Labor Force in Kensington?
54.6% of People are in the Labor Force in Kensington.
What is the Unemployment Rate in Kensington?
Unemployment Rate in Kensington is 4.4%.