Springs, NY Map & Demographics
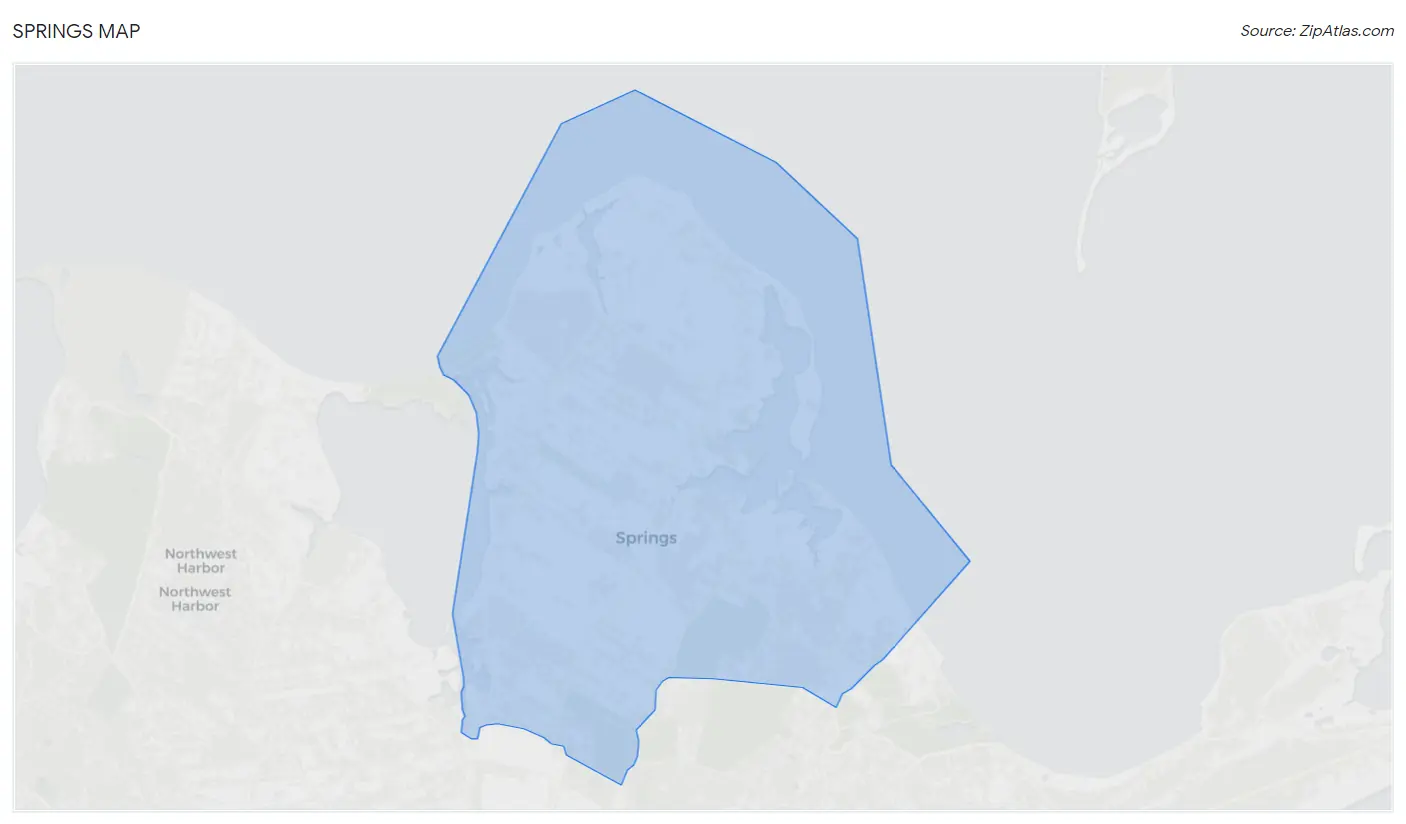
Springs Map
Springs Overview
$67,636
PER CAPITA INCOME
$162,306
AVG FAMILY INCOME
$132,837
AVG HOUSEHOLD INCOME
44.8%
WAGE / INCOME GAP [ % ]
55.2¢/ $1
WAGE / INCOME GAP [ $ ]
0.48
INEQUALITY / GINI INDEX
9,162
TOTAL POPULATION
4,189
MALE POPULATION
4,973
FEMALE POPULATION
84.23
MALES / 100 FEMALES
118.72
FEMALES / 100 MALES
45.1
MEDIAN AGE
3.2
AVG FAMILY SIZE
2.6
AVG HOUSEHOLD SIZE
5,206
LABOR FORCE [ PEOPLE ]
67.7%
PERCENT IN LABOR FORCE
1.6%
UNEMPLOYMENT RATE
Income in Springs
Income Overview in Springs
Per Capita Income in Springs is $67,636, while median incomes of families and households are $162,306 and $132,837 respectively.
| Characteristic | Number | Measure |
| Per Capita Income | 9,162 | $67,636 |
| Median Family Income | 2,497 | $162,306 |
| Mean Family Income | 2,497 | $199,255 |
| Median Household Income | 3,526 | $132,837 |
| Mean Household Income | 3,526 | $171,194 |
| Income Deficit | 2,497 | $0 |
| Wage / Income Gap (%) | 9,162 | 44.76% |
| Wage / Income Gap ($) | 9,162 | 55.24¢ per $1 |
| Gini / Inequality Index | 9,162 | 0.48 |
Earnings by Sex in Springs
Average Earnings in Springs are $51,783, $69,080 for men and $38,159 for women, a difference of 44.8%.
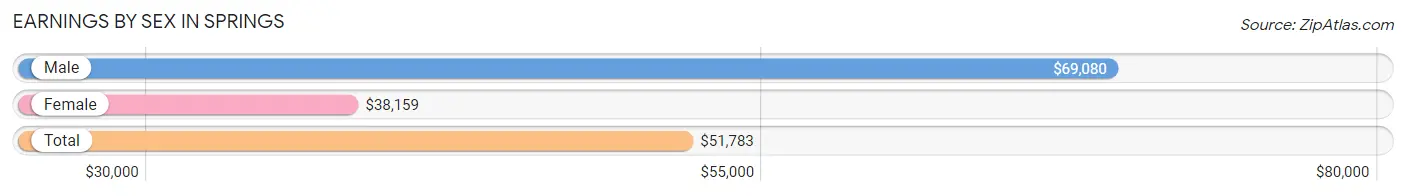
| Sex | Number | Average Earnings |
| Male | 2,826 (49.2%) | $69,080 |
| Female | 2,918 (50.8%) | $38,159 |
| Total | 5,744 (100.0%) | $51,783 |
Earnings by Sex by Income Bracket in Springs
The most common earnings brackets in Springs are $100,000+ for men (956 | 33.8%) and $100,000+ for women (455 | 15.6%).
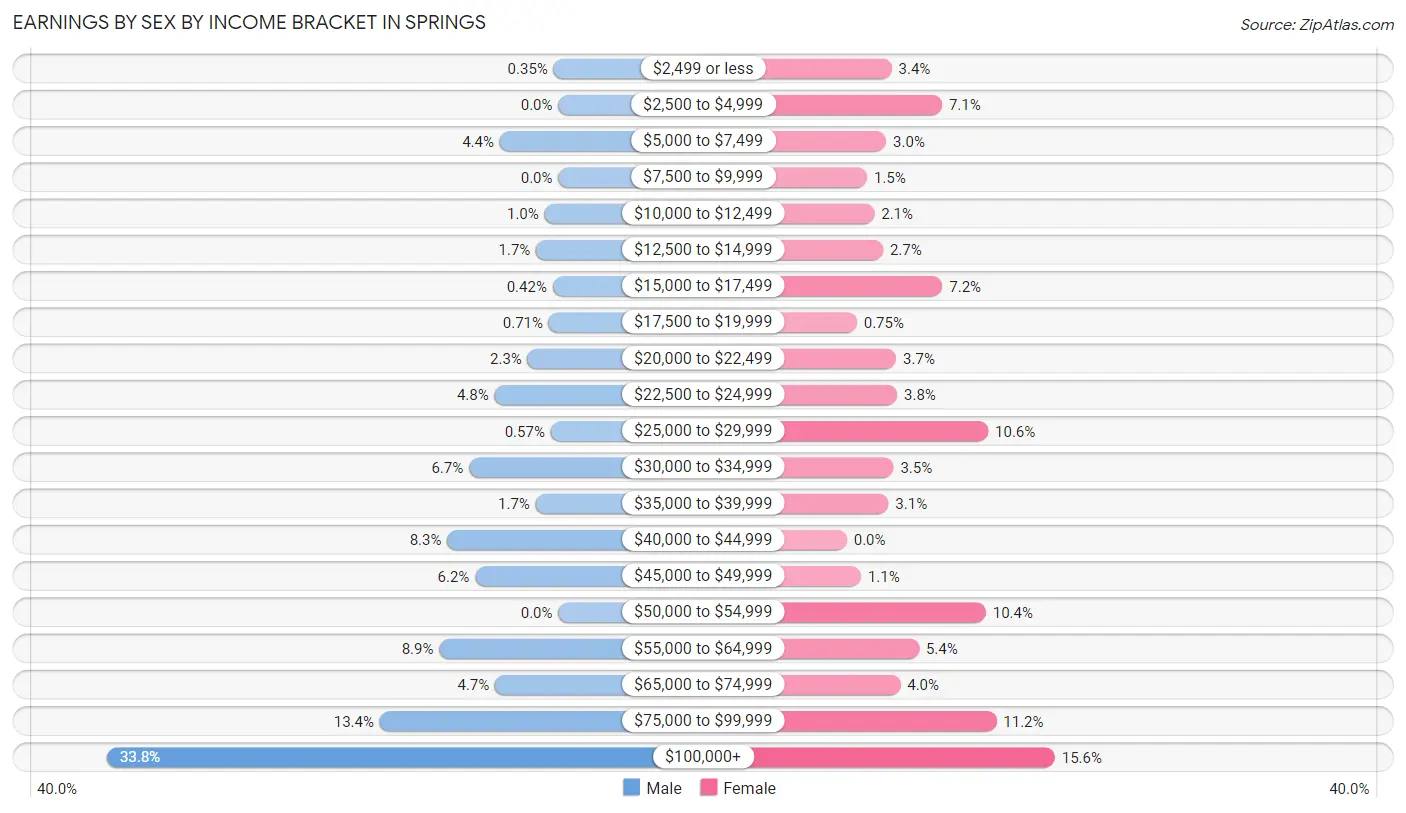
| Income | Male | Female |
| $2,499 or less | 10 (0.4%) | 98 (3.4%) |
| $2,500 to $4,999 | 0 (0.0%) | 208 (7.1%) |
| $5,000 to $7,499 | 124 (4.4%) | 86 (2.9%) |
| $7,500 to $9,999 | 0 (0.0%) | 44 (1.5%) |
| $10,000 to $12,499 | 29 (1.0%) | 60 (2.1%) |
| $12,500 to $14,999 | 47 (1.7%) | 79 (2.7%) |
| $15,000 to $17,499 | 12 (0.4%) | 209 (7.2%) |
| $17,500 to $19,999 | 20 (0.7%) | 22 (0.7%) |
| $20,000 to $22,499 | 65 (2.3%) | 108 (3.7%) |
| $22,500 to $24,999 | 135 (4.8%) | 110 (3.8%) |
| $25,000 to $29,999 | 16 (0.6%) | 309 (10.6%) |
| $30,000 to $34,999 | 189 (6.7%) | 102 (3.5%) |
| $35,000 to $39,999 | 48 (1.7%) | 91 (3.1%) |
| $40,000 to $44,999 | 235 (8.3%) | 0 (0.0%) |
| $45,000 to $49,999 | 176 (6.2%) | 31 (1.1%) |
| $50,000 to $54,999 | 0 (0.0%) | 304 (10.4%) |
| $55,000 to $64,999 | 252 (8.9%) | 158 (5.4%) |
| $65,000 to $74,999 | 134 (4.7%) | 117 (4.0%) |
| $75,000 to $99,999 | 378 (13.4%) | 327 (11.2%) |
| $100,000+ | 956 (33.8%) | 455 (15.6%) |
| Total | 2,826 (100.0%) | 2,918 (100.0%) |
Earnings by Sex by Educational Attainment in Springs
Average earnings in Springs are $76,382 for men and $46,250 for women, a difference of 39.5%. Men with an educational attainment of graduate degree enjoy the highest average annual earnings of $152,215, while those with less than high school education earn the least with $31,250. Women with an educational attainment of graduate degree earn the most with the average annual earnings of $69,265, while those with high school diploma education have the smallest earnings of $22,584.
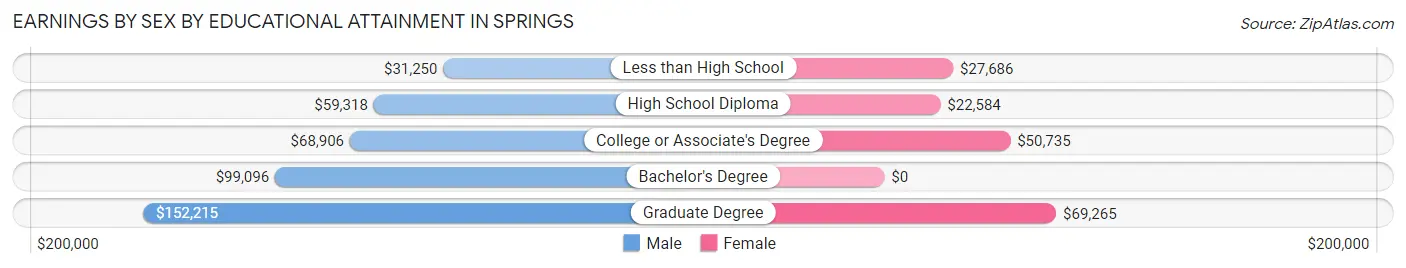
| Educational Attainment | Male Income | Female Income |
| Less than High School | $31,250 | $27,686 |
| High School Diploma | $59,318 | $22,584 |
| College or Associate's Degree | $68,906 | $50,735 |
| Bachelor's Degree | $99,096 | $0 |
| Graduate Degree | $152,215 | $69,265 |
| Total | $76,382 | $46,250 |
Family Income in Springs
Family Income Brackets in Springs
According to the Springs family income data, there are 916 families falling into the $200,000+ income range, which is the most common income bracket and makes up 36.7% of all families.
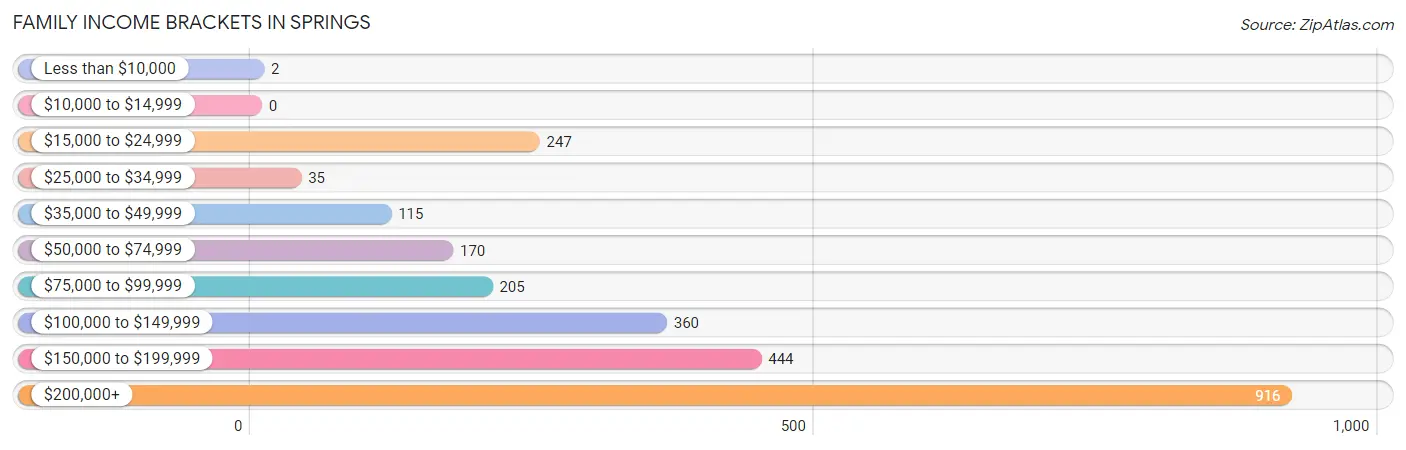
| Income Bracket | # Families | % Families |
| Less than $10,000 | 2 | 0.1% |
| $10,000 to $14,999 | 0 | 0.0% |
| $15,000 to $24,999 | 247 | 9.9% |
| $25,000 to $34,999 | 35 | 1.4% |
| $35,000 to $49,999 | 115 | 4.6% |
| $50,000 to $74,999 | 170 | 6.8% |
| $75,000 to $99,999 | 205 | 8.2% |
| $100,000 to $149,999 | 360 | 14.4% |
| $150,000 to $199,999 | 444 | 17.8% |
| $200,000+ | 916 | 36.7% |
Family Income by Famaliy Size in Springs
3-person families (567 | 22.7%) account for the highest median family income in Springs with $250,001 per family, while 2-person families (1,155 | 46.3%) have the highest median income of $84,482 per family member.
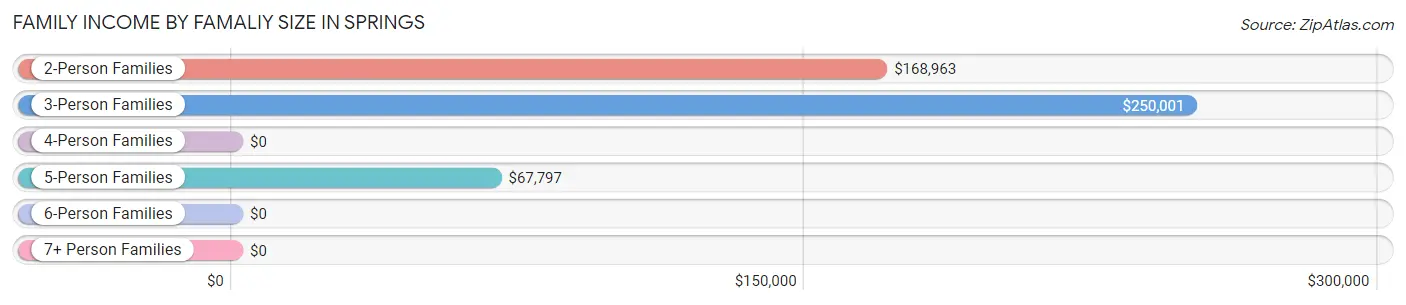
| Income Bracket | # Families | Median Income |
| 2-Person Families | 1,155 (46.3%) | $168,963 |
| 3-Person Families | 567 (22.7%) | $250,001 |
| 4-Person Families | 457 (18.3%) | $0 |
| 5-Person Families | 267 (10.7%) | $67,797 |
| 6-Person Families | 0 (0.0%) | $0 |
| 7+ Person Families | 51 (2.0%) | $0 |
| Total | 2,497 (100.0%) | $162,306 |
Family Income by Number of Earners in Springs
The median family income in Springs is $162,306, with families comprising 3+ earners (586) having the highest median family income of $222,917, while families with no earners (194) have the lowest median family income of $71,765, accounting for 23.5% and 7.8% of families, respectively.
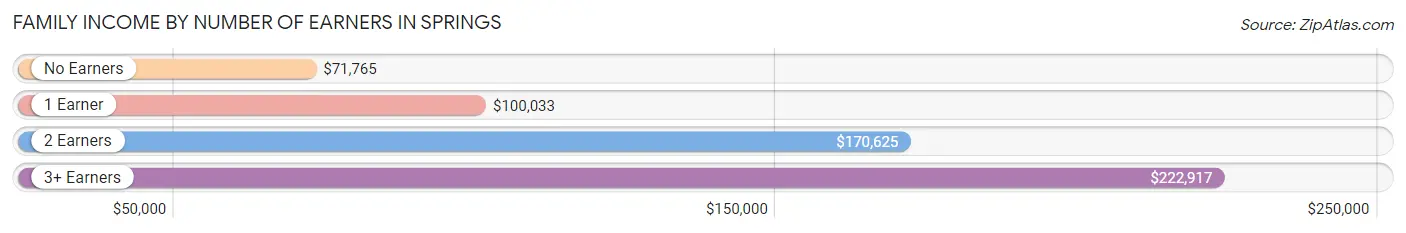
| Number of Earners | # Families | Median Income |
| No Earners | 194 (7.8%) | $71,765 |
| 1 Earner | 727 (29.1%) | $100,033 |
| 2 Earners | 990 (39.7%) | $170,625 |
| 3+ Earners | 586 (23.5%) | $222,917 |
| Total | 2,497 (100.0%) | $162,306 |
Household Income in Springs
Household Income Brackets in Springs
With 1,044 households falling in the category, the $200,000+ income range is the most frequent in Springs, accounting for 29.6% of all households. In contrast, only 21 households (0.6%) fall into the $10,000 to $14,999 income bracket, making it the least populous group.
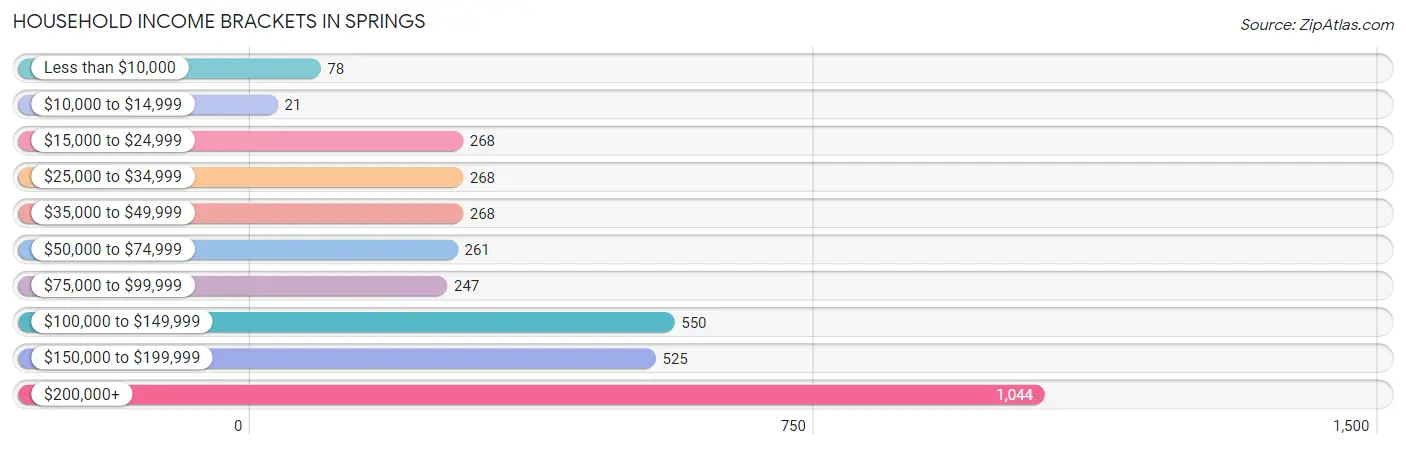
| Income Bracket | # Households | % Households |
| Less than $10,000 | 78 | 2.2% |
| $10,000 to $14,999 | 21 | 0.6% |
| $15,000 to $24,999 | 268 | 7.6% |
| $25,000 to $34,999 | 268 | 7.6% |
| $35,000 to $49,999 | 268 | 7.6% |
| $50,000 to $74,999 | 261 | 7.4% |
| $75,000 to $99,999 | 247 | 7.0% |
| $100,000 to $149,999 | 550 | 15.6% |
| $150,000 to $199,999 | 525 | 14.9% |
| $200,000+ | 1,044 | 29.6% |
Household Income by Householder Age in Springs
The median household income in Springs is $132,837, with the highest median household income of $161,315 found in the 45 to 64 years age bracket for the primary householder. A total of 1,377 households (39.1%) fall into this category.
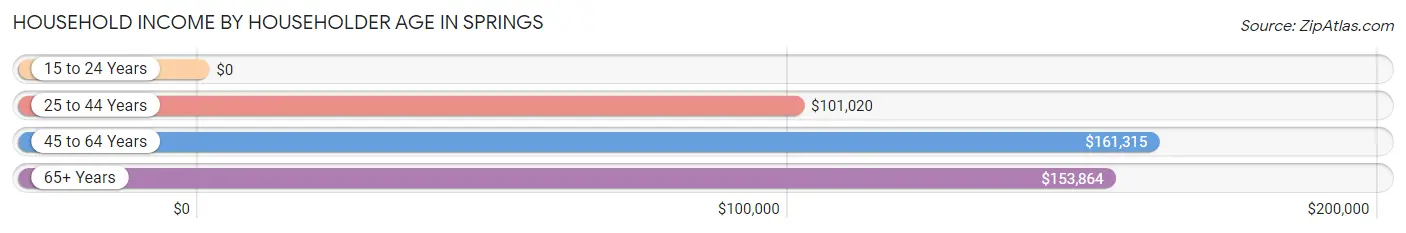
| Income Bracket | # Households | Median Income |
| 15 to 24 Years | 0 (0.0%) | $0 |
| 25 to 44 Years | 893 (25.3%) | $101,020 |
| 45 to 64 Years | 1,377 (39.1%) | $161,315 |
| 65+ Years | 1,256 (35.6%) | $153,864 |
| Total | 3,526 (100.0%) | $132,837 |
Poverty in Springs
Income Below Poverty by Sex and Age in Springs
With 10.9% poverty level for males and 15.9% for females among the residents of Springs, 6 to 11 year old males and 5 year old females are the most vulnerable to poverty, with 152 males (66.7%) and 126 females (75.0%) in their respective age groups living below the poverty level.
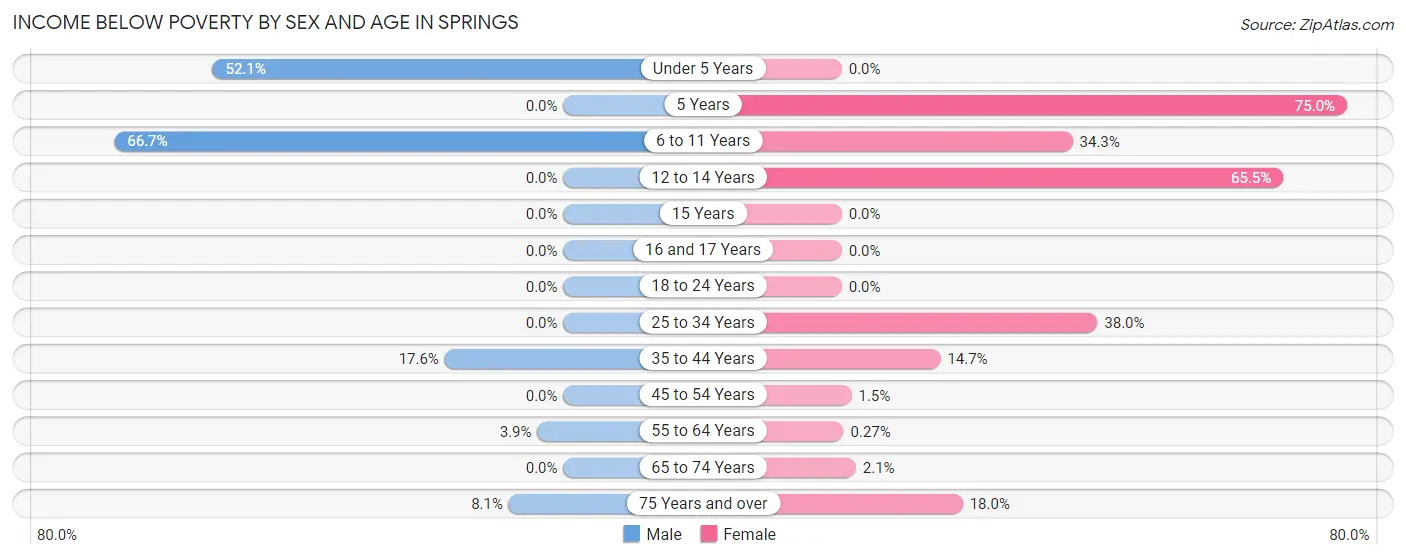
| Age Bracket | Male | Female |
| Under 5 Years | 138 (52.1%) | 0 (0.0%) |
| 5 Years | 0 (0.0%) | 126 (75.0%) |
| 6 to 11 Years | 152 (66.7%) | 98 (34.3%) |
| 12 to 14 Years | 0 (0.0%) | 230 (65.5%) |
| 15 Years | 0 (0.0%) | 0 (0.0%) |
| 16 and 17 Years | 0 (0.0%) | 0 (0.0%) |
| 18 to 24 Years | 0 (0.0%) | 0 (0.0%) |
| 25 to 34 Years | 0 (0.0%) | 167 (38.0%) |
| 35 to 44 Years | 105 (17.6%) | 87 (14.6%) |
| 45 to 54 Years | 0 (0.0%) | 9 (1.5%) |
| 55 to 64 Years | 26 (3.9%) | 2 (0.3%) |
| 65 to 74 Years | 0 (0.0%) | 13 (2.1%) |
| 75 Years and over | 37 (8.1%) | 58 (18.0%) |
| Total | 458 (10.9%) | 790 (15.9%) |
Income Above Poverty by Sex and Age in Springs
According to the poverty statistics in Springs, males aged 15 years and females aged under 5 years are the age groups that are most secure financially, with 100.0% of males and 100.0% of females in these age groups living above the poverty line.
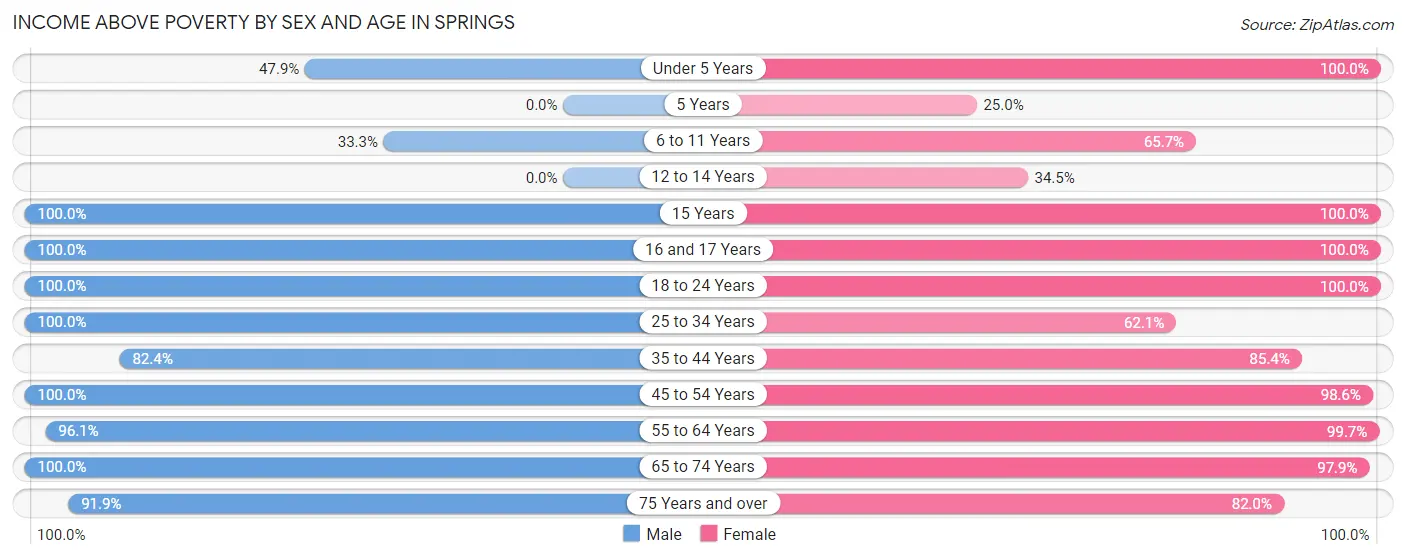
| Age Bracket | Male | Female |
| Under 5 Years | 127 (47.9%) | 152 (100.0%) |
| 5 Years | 0 (0.0%) | 42 (25.0%) |
| 6 to 11 Years | 76 (33.3%) | 188 (65.7%) |
| 12 to 14 Years | 0 (0.0%) | 121 (34.5%) |
| 15 Years | 9 (100.0%) | 13 (100.0%) |
| 16 and 17 Years | 32 (100.0%) | 145 (100.0%) |
| 18 to 24 Years | 250 (100.0%) | 522 (100.0%) |
| 25 to 34 Years | 500 (100.0%) | 273 (62.1%) |
| 35 to 44 Years | 491 (82.4%) | 507 (85.4%) |
| 45 to 54 Years | 601 (100.0%) | 613 (98.6%) |
| 55 to 64 Years | 647 (96.1%) | 732 (99.7%) |
| 65 to 74 Years | 578 (100.0%) | 610 (97.9%) |
| 75 Years and over | 420 (91.9%) | 265 (82.0%) |
| Total | 3,731 (89.1%) | 4,183 (84.1%) |
Income Below Poverty Among Married-Couple Families in Springs
The poverty statistics for married-couple families in Springs show that 4.5% or 87 of the total 1,940 families live below the poverty line. Families with 3 or 4 children have the highest poverty rate of 66.9%, comprising of 87 families. On the other hand, families with no children have the lowest poverty rate of 0.0%, which includes 0 families.
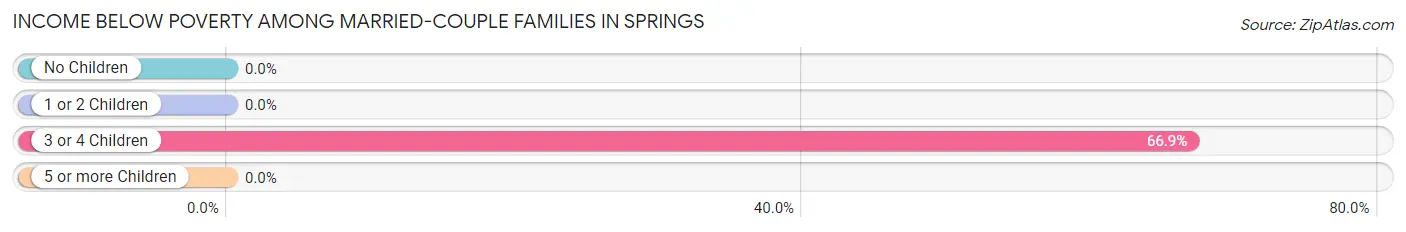
| Children | Above Poverty | Below Poverty |
| No Children | 1,374 (100.0%) | 0 (0.0%) |
| 1 or 2 Children | 436 (100.0%) | 0 (0.0%) |
| 3 or 4 Children | 43 (33.1%) | 87 (66.9%) |
| 5 or more Children | 0 (0.0%) | 0 (0.0%) |
| Total | 1,853 (95.5%) | 87 (4.5%) |
Income Below Poverty Among Single-Parent Households in Springs
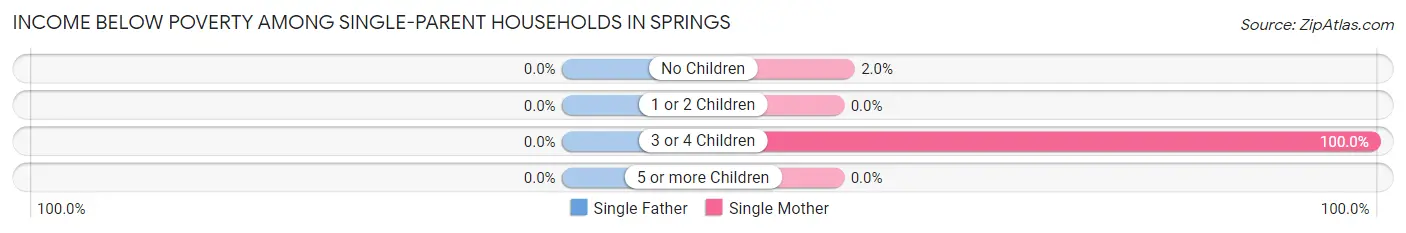
| Children | Single Father | Single Mother |
| No Children | 0 (0.0%) | 2 (2.0%) |
| 1 or 2 Children | 0 (0.0%) | 0 (0.0%) |
| 3 or 4 Children | 0 (0.0%) | 160 (100.0%) |
| 5 or more Children | 0 (0.0%) | 0 (0.0%) |
| Total | 0 (0.0%) | 162 (52.9%) |
Income Below Poverty Among Married-Couple vs Single-Parent Households in Springs
The poverty data for Springs shows that 87 of the married-couple family households (4.5%) and 162 of the single-parent households (29.1%) are living below the poverty level. Within the married-couple family households, those with 3 or 4 children have the highest poverty rate, with 87 households (66.9%) falling below the poverty line. Among the single-parent households, those with 3 or 4 children have the highest poverty rate, with 160 household (100.0%) living below poverty.
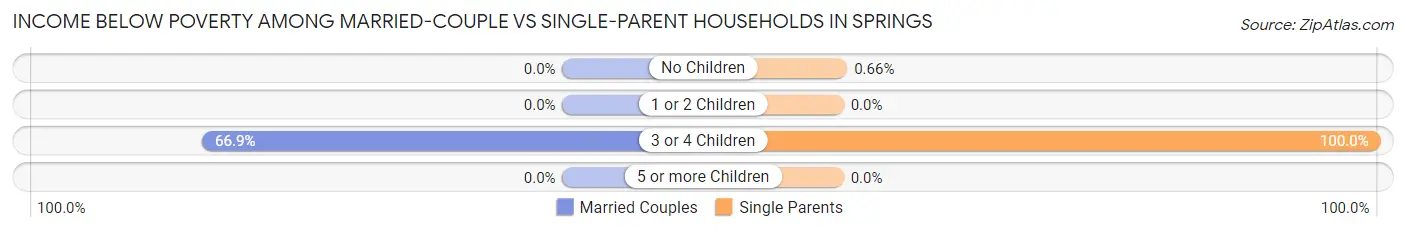
| Children | Married-Couple Families | Single-Parent Households |
| No Children | 0 (0.0%) | 2 (0.7%) |
| 1 or 2 Children | 0 (0.0%) | 0 (0.0%) |
| 3 or 4 Children | 87 (66.9%) | 160 (100.0%) |
| 5 or more Children | 0 (0.0%) | 0 (0.0%) |
| Total | 87 (4.5%) | 162 (29.1%) |
Race in Springs
The most populous races in Springs are White / Caucasian (6,618 | 72.2%), Hispanic or Latino (2,954 | 32.2%), and Two or more Races (1,356 | 14.8%).
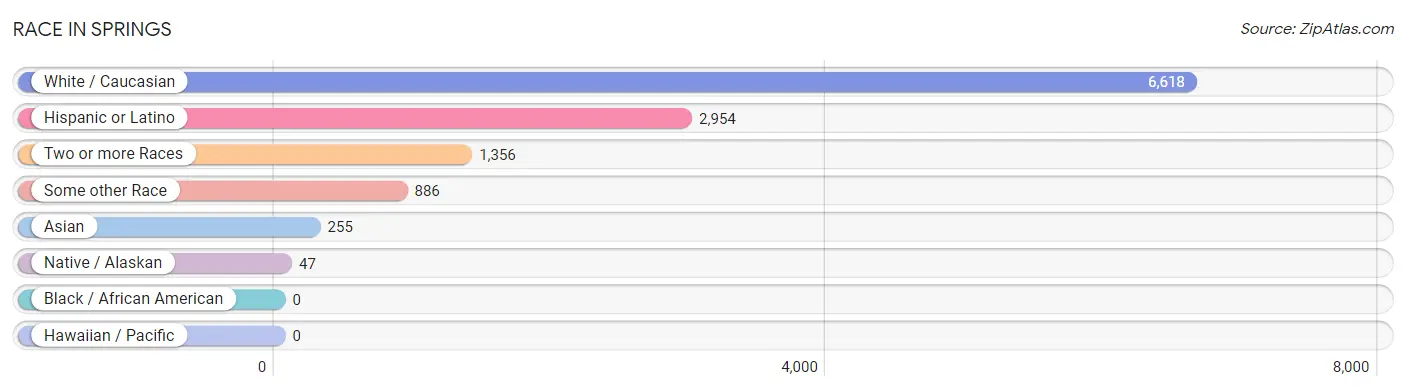
| Race | # Population | % Population |
| Asian | 255 | 2.8% |
| Black / African American | 0 | 0.0% |
| Hawaiian / Pacific | 0 | 0.0% |
| Hispanic or Latino | 2,954 | 32.2% |
| Native / Alaskan | 47 | 0.5% |
| White / Caucasian | 6,618 | 72.2% |
| Two or more Races | 1,356 | 14.8% |
| Some other Race | 886 | 9.7% |
| Total | 9,162 | 100.0% |
Ancestry in Springs
The most populous ancestries reported in Springs are South American (2,612 | 28.5%), Ecuadorian (2,281 | 24.9%), Irish (1,171 | 12.8%), Italian (1,168 | 12.8%), and German (896 | 9.8%), together accounting for 88.7% of all Springs residents.
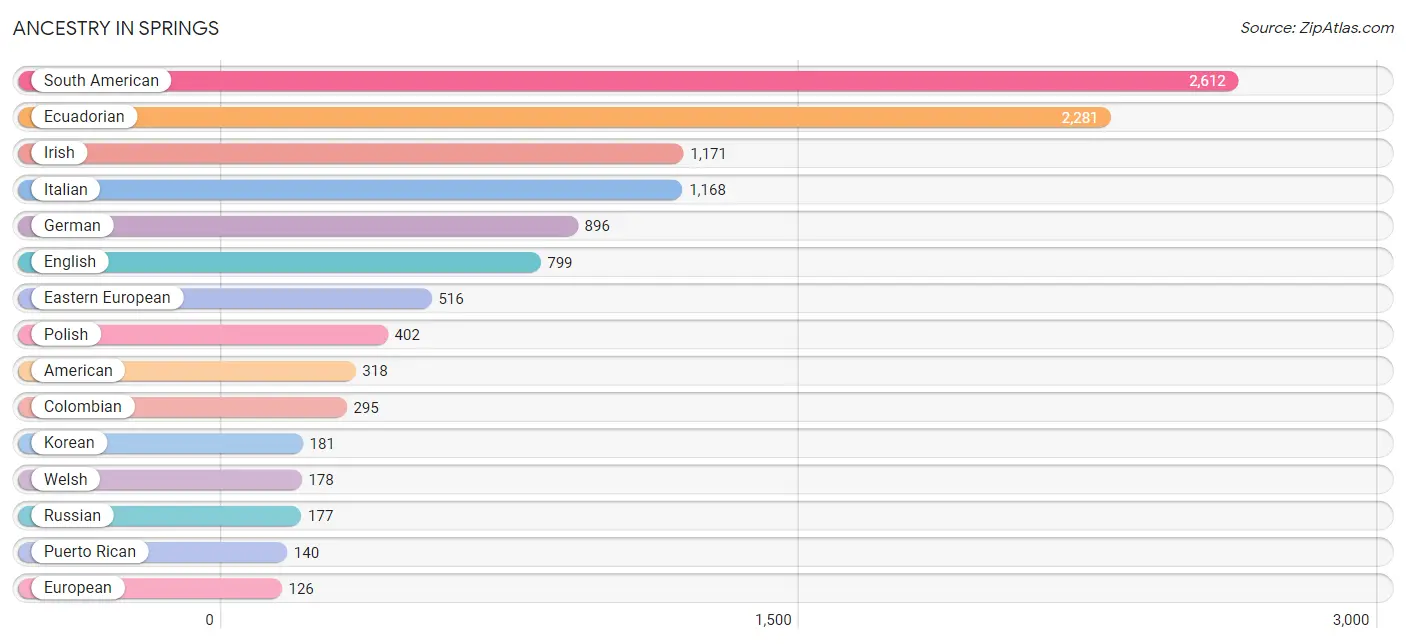
| Ancestry | # Population | % Population |
| Albanian | 66 | 0.7% |
| American | 318 | 3.5% |
| Arab | 15 | 0.2% |
| Argentinean | 17 | 0.2% |
| Austrian | 111 | 1.2% |
| Brazilian | 36 | 0.4% |
| British | 37 | 0.4% |
| Central American | 27 | 0.3% |
| Chilean | 19 | 0.2% |
| Colombian | 295 | 3.2% |
| Czech | 31 | 0.3% |
| Danish | 11 | 0.1% |
| Dutch | 70 | 0.8% |
| Eastern European | 516 | 5.6% |
| Ecuadorian | 2,281 | 24.9% |
| English | 799 | 8.7% |
| European | 126 | 1.4% |
| Finnish | 76 | 0.8% |
| French | 37 | 0.4% |
| French Canadian | 22 | 0.2% |
| German | 896 | 9.8% |
| Greek | 32 | 0.4% |
| Irish | 1,171 | 12.8% |
| Italian | 1,168 | 12.8% |
| Korean | 181 | 2.0% |
| Lebanese | 15 | 0.2% |
| Lithuanian | 49 | 0.5% |
| Mexican | 43 | 0.5% |
| Northern European | 21 | 0.2% |
| Norwegian | 44 | 0.5% |
| Panamanian | 27 | 0.3% |
| Polish | 402 | 4.4% |
| Portuguese | 73 | 0.8% |
| Puerto Rican | 140 | 1.5% |
| Romanian | 39 | 0.4% |
| Russian | 177 | 1.9% |
| Scottish | 96 | 1.1% |
| Slavic | 10 | 0.1% |
| Slovak | 14 | 0.2% |
| South American | 2,612 | 28.5% |
| South American Indian | 45 | 0.5% |
| Sri Lankan | 62 | 0.7% |
| Swedish | 13 | 0.1% |
| Swiss | 30 | 0.3% |
| Thai | 12 | 0.1% |
| Ukrainian | 59 | 0.6% |
| Welsh | 178 | 1.9% | View All 47 Rows |
Immigrants in Springs
The most numerous immigrant groups reported in Springs came from Latin America (1,633 | 17.8%), South America (1,600 | 17.5%), Ecuador (1,377 | 15.0%), Europe (484 | 5.3%), and Asia (230 | 2.5%), together accounting for 58.1% of all Springs residents.
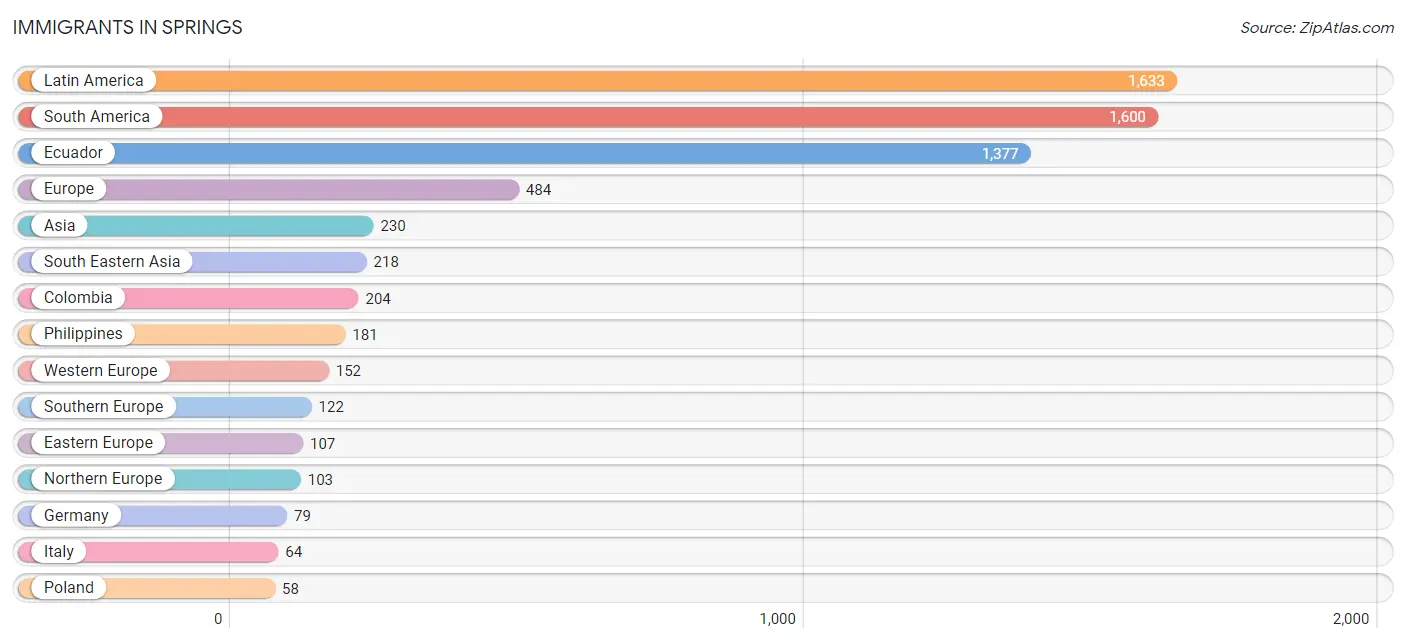
| Immigration Origin | # Population | % Population |
| Africa | 15 | 0.2% |
| Asia | 230 | 2.5% |
| Austria | 37 | 0.4% |
| Canada | 32 | 0.4% |
| Central America | 33 | 0.4% |
| Chile | 19 | 0.2% |
| Colombia | 204 | 2.2% |
| Eastern Europe | 107 | 1.2% |
| Ecuador | 1,377 | 15.0% |
| Europe | 484 | 5.3% |
| France | 36 | 0.4% |
| Germany | 79 | 0.9% |
| India | 12 | 0.1% |
| Ireland | 19 | 0.2% |
| Italy | 64 | 0.7% |
| Latin America | 1,633 | 17.8% |
| Mexico | 6 | 0.1% |
| Northern Europe | 103 | 1.1% |
| Panama | 27 | 0.3% |
| Philippines | 181 | 2.0% |
| Poland | 58 | 0.6% |
| Portugal | 58 | 0.6% |
| Romania | 20 | 0.2% |
| South Africa | 15 | 0.2% |
| South America | 1,600 | 17.5% |
| South Central Asia | 12 | 0.1% |
| South Eastern Asia | 218 | 2.4% |
| Southern Europe | 122 | 1.3% |
| Vietnam | 37 | 0.4% |
| Western Europe | 152 | 1.7% | View All 30 Rows |
Sex and Age in Springs
Sex and Age in Springs
The most populous age groups in Springs are 55 to 59 Years (409 | 9.8%) for men and 60 to 64 Years (572 | 11.5%) for women.
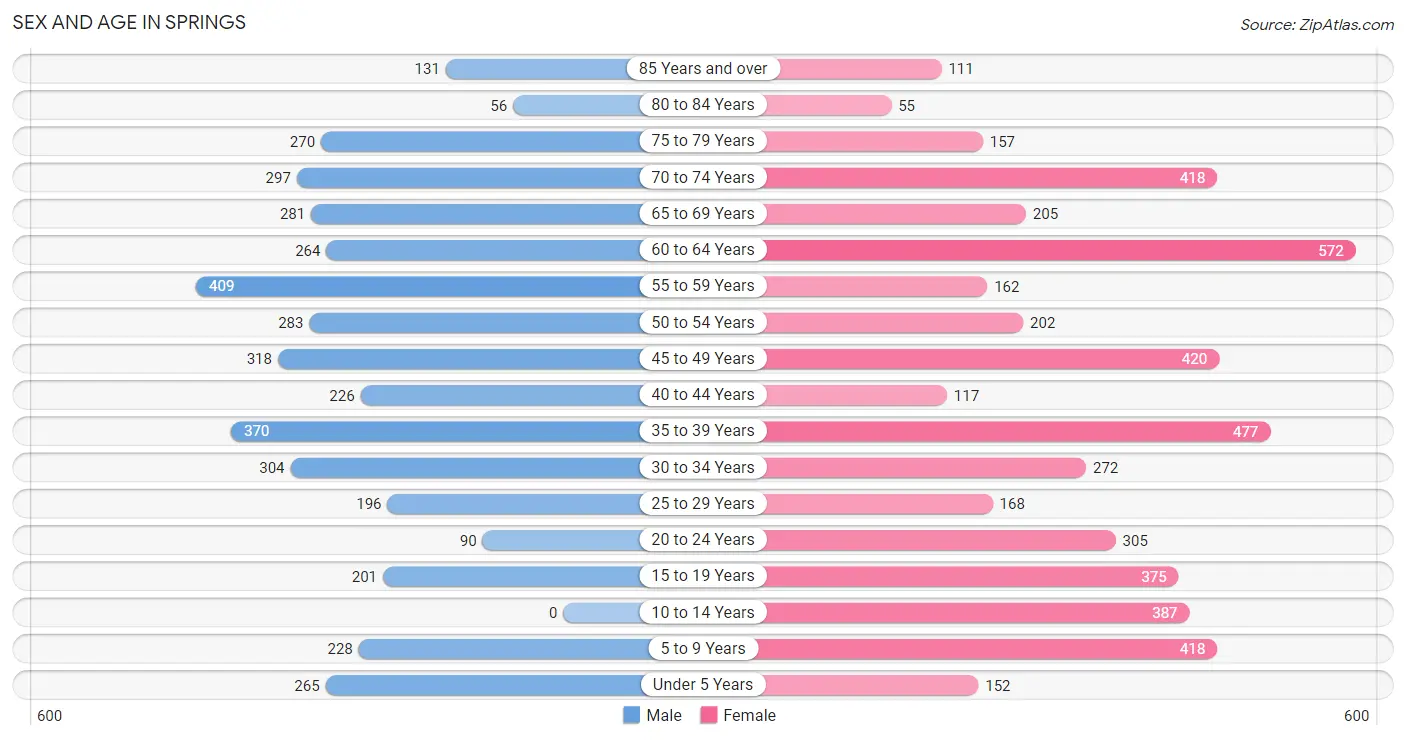
| Age Bracket | Male | Female |
| Under 5 Years | 265 (6.3%) | 152 (3.1%) |
| 5 to 9 Years | 228 (5.4%) | 418 (8.4%) |
| 10 to 14 Years | 0 (0.0%) | 387 (7.8%) |
| 15 to 19 Years | 201 (4.8%) | 375 (7.5%) |
| 20 to 24 Years | 90 (2.1%) | 305 (6.1%) |
| 25 to 29 Years | 196 (4.7%) | 168 (3.4%) |
| 30 to 34 Years | 304 (7.3%) | 272 (5.5%) |
| 35 to 39 Years | 370 (8.8%) | 477 (9.6%) |
| 40 to 44 Years | 226 (5.4%) | 117 (2.4%) |
| 45 to 49 Years | 318 (7.6%) | 420 (8.5%) |
| 50 to 54 Years | 283 (6.8%) | 202 (4.1%) |
| 55 to 59 Years | 409 (9.8%) | 162 (3.3%) |
| 60 to 64 Years | 264 (6.3%) | 572 (11.5%) |
| 65 to 69 Years | 281 (6.7%) | 205 (4.1%) |
| 70 to 74 Years | 297 (7.1%) | 418 (8.4%) |
| 75 to 79 Years | 270 (6.5%) | 157 (3.2%) |
| 80 to 84 Years | 56 (1.3%) | 55 (1.1%) |
| 85 Years and over | 131 (3.1%) | 111 (2.2%) |
| Total | 4,189 (100.0%) | 4,973 (100.0%) |
Families and Households in Springs
Median Family Size in Springs
The median family size in Springs is 3.19 persons per family, with single female/mother families (306 | 12.2%) accounting for the largest median family size of 3.97 persons per family. On the other hand, married-couple families (1,940 | 77.7%) represent the smallest median family size with 3.05 persons per family.
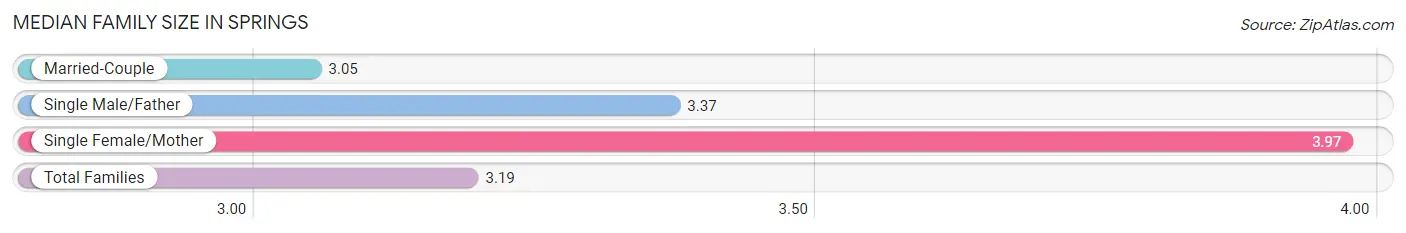
| Family Type | # Families | Family Size |
| Married-Couple | 1,940 (77.7%) | 3.05 |
| Single Male/Father | 251 (10.1%) | 3.37 |
| Single Female/Mother | 306 (12.2%) | 3.97 |
| Total Families | 2,497 (100.0%) | 3.19 |
Median Household Size in Springs
The median household size in Springs is 2.60 persons per household, with single female/mother households (306 | 8.7%) accounting for the largest median household size of 4.05 persons per household. non-family households (1,029 | 29.2%) represent the smallest median household size with 1.13 persons per household.
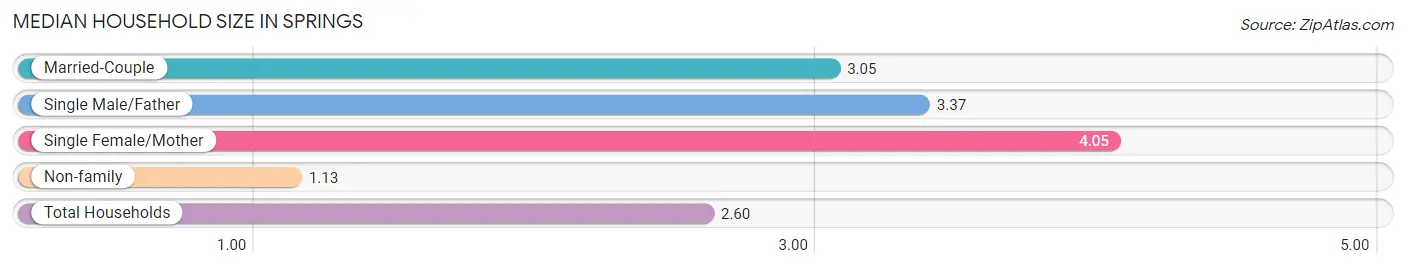
| Household Type | # Households | Household Size |
| Married-Couple | 1,940 (55.0%) | 3.05 |
| Single Male/Father | 251 (7.1%) | 3.37 |
| Single Female/Mother | 306 (8.7%) | 4.05 |
| Non-family | 1,029 (29.2%) | 1.13 |
| Total Households | 3,526 (100.0%) | 2.60 |
Household Size by Marriage Status in Springs
Out of a total of 3,526 households in Springs, 2,497 (70.8%) are family households, while 1,029 (29.2%) are nonfamily households. The most numerous type of family households are 2-person households, comprising 1,144, and the most common type of nonfamily households are 1-person households, comprising 886.
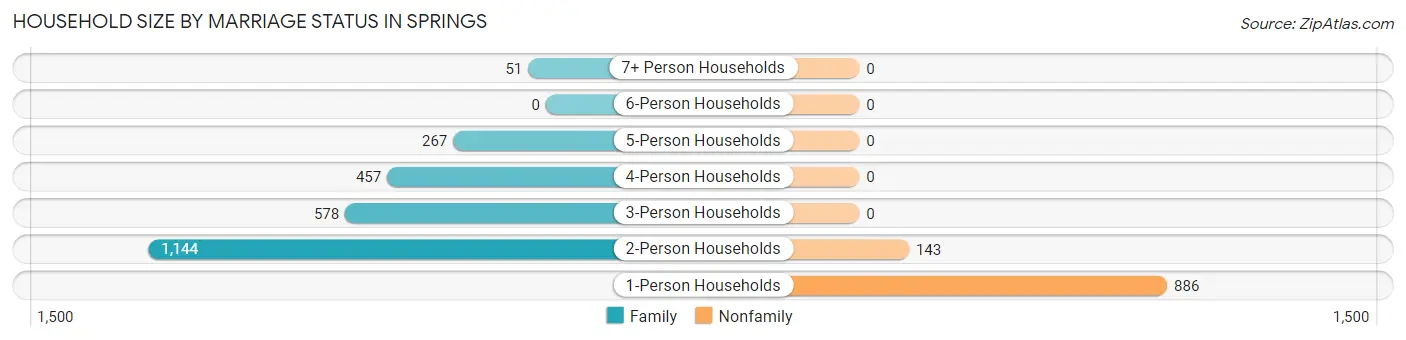
| Household Size | Family Households | Nonfamily Households |
| 1-Person Households | - | 886 (25.1%) |
| 2-Person Households | 1,144 (32.4%) | 143 (4.1%) |
| 3-Person Households | 578 (16.4%) | 0 (0.0%) |
| 4-Person Households | 457 (13.0%) | 0 (0.0%) |
| 5-Person Households | 267 (7.6%) | 0 (0.0%) |
| 6-Person Households | 0 (0.0%) | 0 (0.0%) |
| 7+ Person Households | 51 (1.5%) | 0 (0.0%) |
| Total | 2,497 (70.8%) | 1,029 (29.2%) |
Female Fertility in Springs
Fertility by Age in Springs
Average fertility rate in Springs is 15.0 births per 1,000 women. Women in the age bracket of 35 to 50 years have the highest fertility rate with 32.0 births per 1,000 women. Women in the age bracket of 35 to 50 years acount for 100.0% of all women with births.
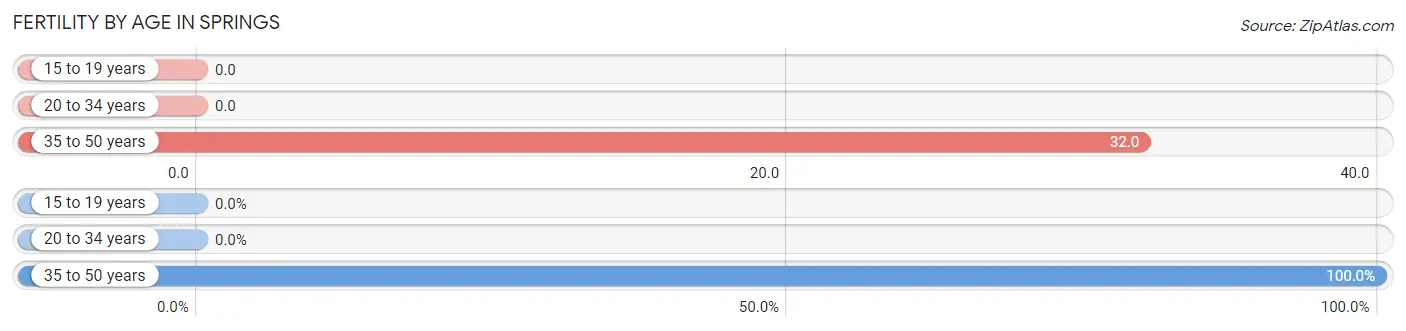
| Age Bracket | Women with Births | Births / 1,000 Women |
| 15 to 19 years | 0 (0.0%) | 0.0 |
| 20 to 34 years | 0 (0.0%) | 0.0 |
| 35 to 50 years | 34 (100.0%) | 32.0 |
| Total | 34 (100.0%) | 15.0 |
Fertility by Age by Marriage Status in Springs
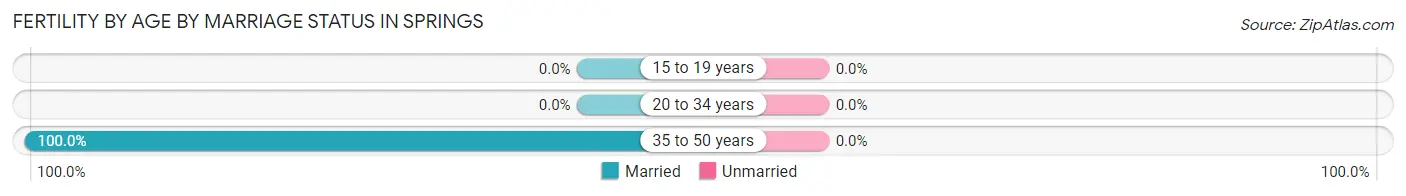
| Age Bracket | Married | Unmarried |
| 15 to 19 years | 0 (0.0%) | 0 (0.0%) |
| 20 to 34 years | 0 (0.0%) | 0 (0.0%) |
| 35 to 50 years | 34 (100.0%) | 0 (0.0%) |
| Total | 34 (100.0%) | 0 (0.0%) |
Fertility by Education in Springs
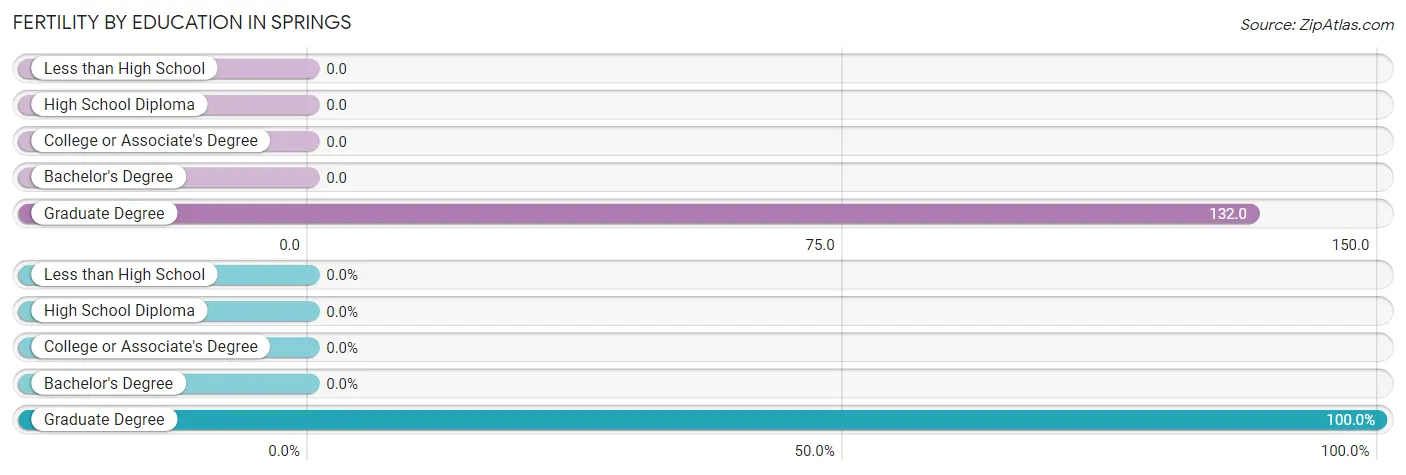
| Educational Attainment | Women with Births | Births / 1,000 Women |
| Less than High School | 0 (0.0%) | 0.0 |
| High School Diploma | 0 (0.0%) | 0.0 |
| College or Associate's Degree | 0 (0.0%) | 0.0 |
| Bachelor's Degree | 0 (0.0%) | 0.0 |
| Graduate Degree | 34 (100.0%) | 132.0 |
| Total | 34 (100.0%) | 15.0 |
Fertility by Education by Marriage Status in Springs
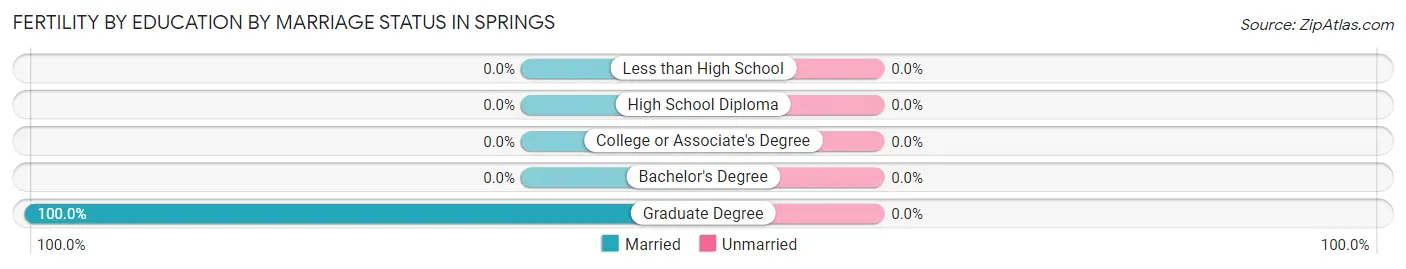
| Educational Attainment | Married | Unmarried |
| Less than High School | 0 (0.0%) | 0 (0.0%) |
| High School Diploma | 0 (0.0%) | 0 (0.0%) |
| College or Associate's Degree | 0 (0.0%) | 0 (0.0%) |
| Bachelor's Degree | 0 (0.0%) | 0 (0.0%) |
| Graduate Degree | 34 (100.0%) | 0 (0.0%) |
| Total | 34 (100.0%) | 0 (0.0%) |
Employment Characteristics in Springs
Employment by Class of Employer in Springs
Among the 5,054 employed individuals in Springs, private company employees (2,815 | 55.7%), not-for-profit organizations (674 | 13.3%), and self-employed (not incorporated) (603 | 11.9%) make up the most common classes of employment.
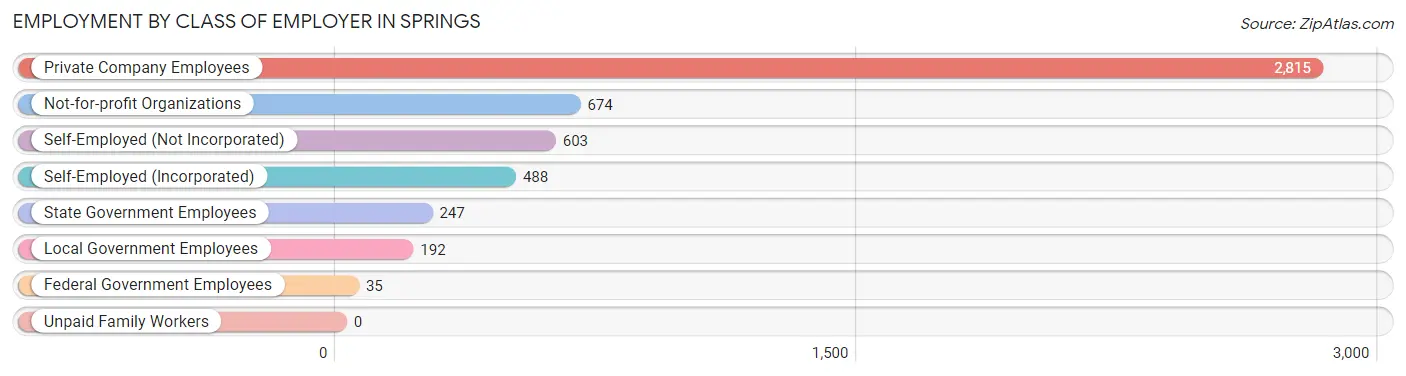
| Employer Class | # Employees | % Employees |
| Private Company Employees | 2,815 | 55.7% |
| Self-Employed (Incorporated) | 488 | 9.7% |
| Self-Employed (Not Incorporated) | 603 | 11.9% |
| Not-for-profit Organizations | 674 | 13.3% |
| Local Government Employees | 192 | 3.8% |
| State Government Employees | 247 | 4.9% |
| Federal Government Employees | 35 | 0.7% |
| Unpaid Family Workers | 0 | 0.0% |
| Total | 5,054 | 100.0% |
Employment Status by Age in Springs
According to the labor force statistics for Springs, out of the total population over 16 years of age (7,690), 67.7% or 5,206 individuals are in the labor force, with 1.6% or 83 of them unemployed. The age group with the highest labor force participation rate is 45 to 54 years, with 94.2% or 1,152 individuals in the labor force. Within the labor force, the 35 to 44 years age range has the highest percentage of unemployed individuals, with 6.1% or 57 of them being unemployed.
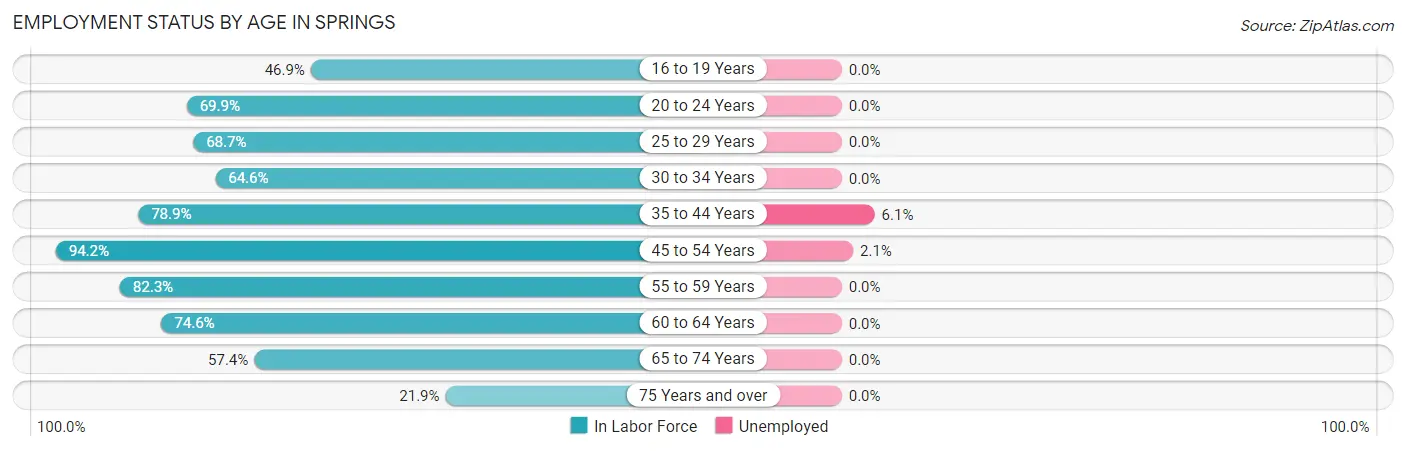
| Age Bracket | In Labor Force | Unemployed |
| 16 to 19 Years | 260 (46.9%) | 0 (0.0%) |
| 20 to 24 Years | 276 (69.9%) | 0 (0.0%) |
| 25 to 29 Years | 250 (68.7%) | 0 (0.0%) |
| 30 to 34 Years | 372 (64.6%) | 0 (0.0%) |
| 35 to 44 Years | 939 (78.9%) | 57 (6.1%) |
| 45 to 54 Years | 1,152 (94.2%) | 24 (2.1%) |
| 55 to 59 Years | 470 (82.3%) | 0 (0.0%) |
| 60 to 64 Years | 624 (74.6%) | 0 (0.0%) |
| 65 to 74 Years | 689 (57.4%) | 0 (0.0%) |
| 75 Years and over | 171 (21.9%) | 0 (0.0%) |
| Total | 5,206 (67.7%) | 83 (1.6%) |
Employment Status by Educational Attainment in Springs
According to labor force statistics for Springs, 80.0% of individuals (3,808) out of the total population between 25 and 64 years of age (4,760) are in the labor force, with 2.1% or 80 of them being unemployed. The group with the highest labor force participation rate are those with the educational attainment of bachelor's degree or higher, with 85.3% or 1,982 individuals in the labor force. Within the labor force, individuals with high school diploma education have the highest percentage of unemployment, with 7.3% or 57 of them being unemployed.
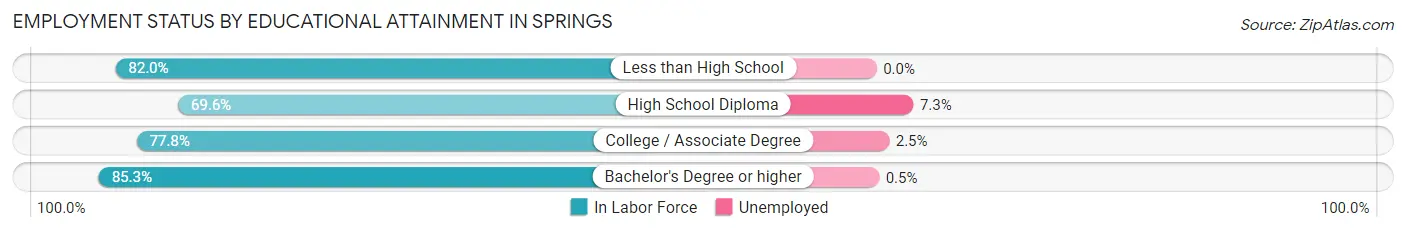
| Educational Attainment | In Labor Force | Unemployed |
| Less than High School | 445 (82.0%) | 0 (0.0%) |
| High School Diploma | 785 (69.6%) | 82 (7.3%) |
| College / Associate Degree | 595 (77.8%) | 19 (2.5%) |
| Bachelor's Degree or higher | 1,982 (85.3%) | 12 (0.5%) |
| Total | 3,808 (80.0%) | 100 (2.1%) |
Employment Occupations by Sex in Springs
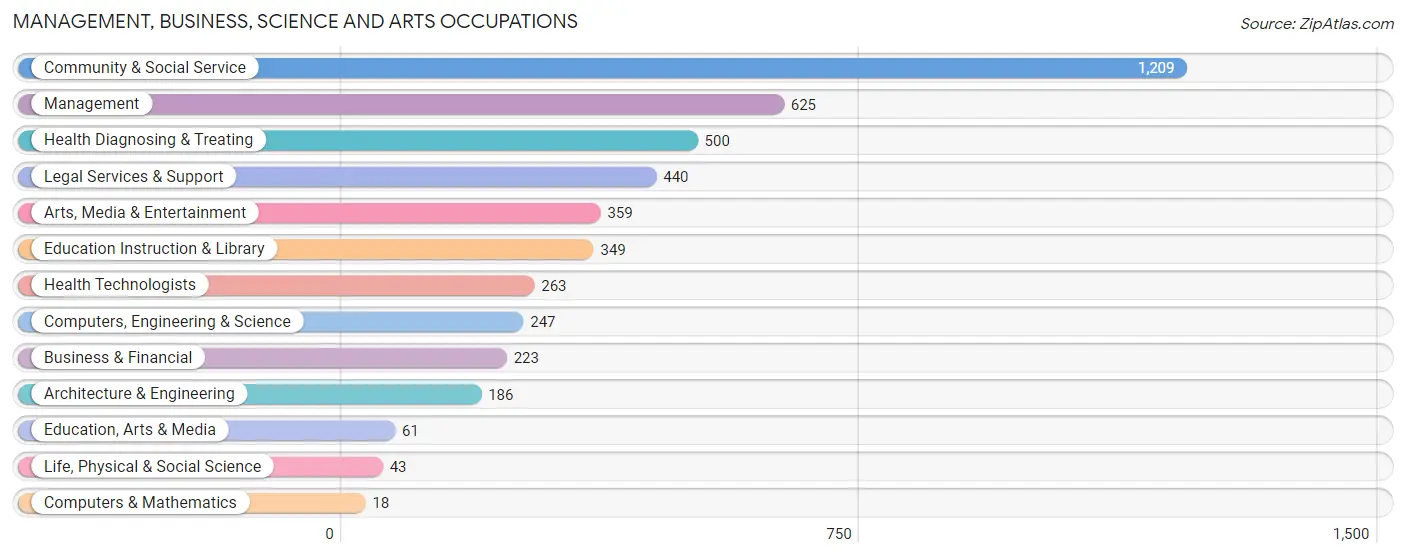
Management, Business, Science and Arts Occupations
The most common Management, Business, Science and Arts occupations in Springs are Community & Social Service (1,209 | 23.6%), Management (625 | 12.2%), Health Diagnosing & Treating (500 | 9.8%), Legal Services & Support (440 | 8.6%), and Arts, Media & Entertainment (359 | 7.0%).
Management, Business, Science and Arts Occupations by Sex
Within the Management, Business, Science and Arts occupations in Springs, the most male-oriented occupations are Architecture & Engineering (68.8%), Management (60.0%), and Legal Services & Support (57.1%), while the most female-oriented occupations are Computers & Mathematics (100.0%), Life, Physical & Social Science (100.0%), and Education, Arts & Media (100.0%).
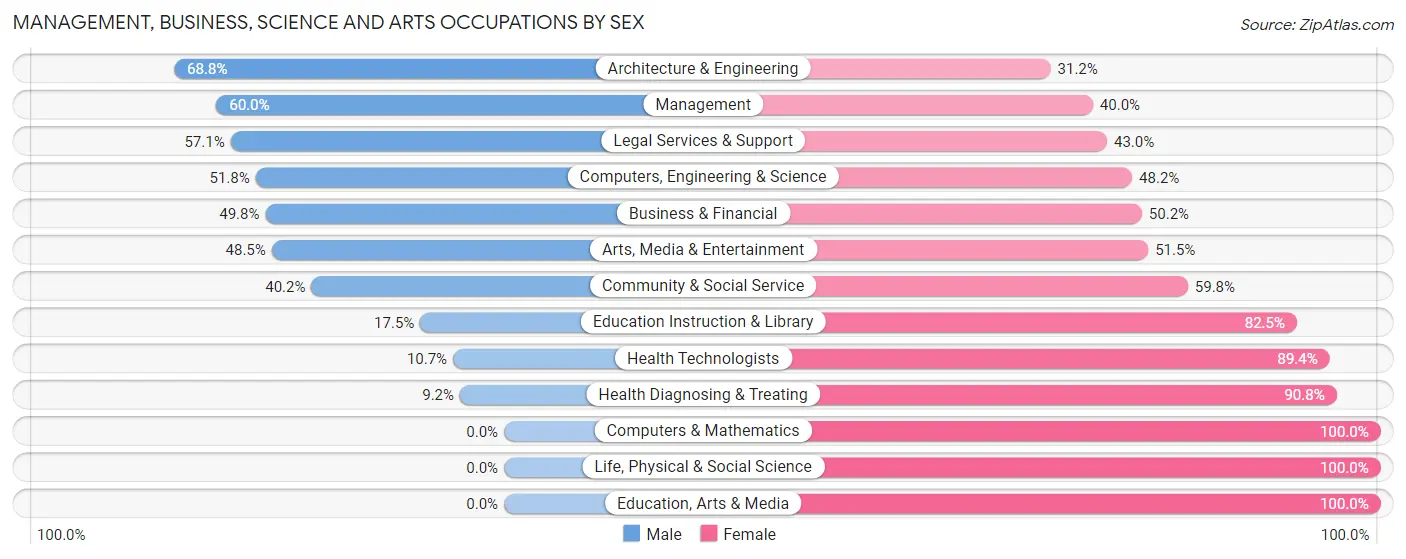
| Occupation | Male | Female |
| Management | 375 (60.0%) | 250 (40.0%) |
| Business & Financial | 111 (49.8%) | 112 (50.2%) |
| Computers, Engineering & Science | 128 (51.8%) | 119 (48.2%) |
| Computers & Mathematics | 0 (0.0%) | 18 (100.0%) |
| Architecture & Engineering | 128 (68.8%) | 58 (31.2%) |
| Life, Physical & Social Science | 0 (0.0%) | 43 (100.0%) |
| Community & Social Service | 486 (40.2%) | 723 (59.8%) |
| Education, Arts & Media | 0 (0.0%) | 61 (100.0%) |
| Legal Services & Support | 251 (57.1%) | 189 (42.9%) |
| Education Instruction & Library | 61 (17.5%) | 288 (82.5%) |
| Arts, Media & Entertainment | 174 (48.5%) | 185 (51.5%) |
| Health Diagnosing & Treating | 46 (9.2%) | 454 (90.8%) |
| Health Technologists | 28 (10.6%) | 235 (89.3%) |
| Total (Category) | 1,146 (40.9%) | 1,658 (59.1%) |
| Total (Overall) | 2,798 (54.6%) | 2,324 (45.4%) |
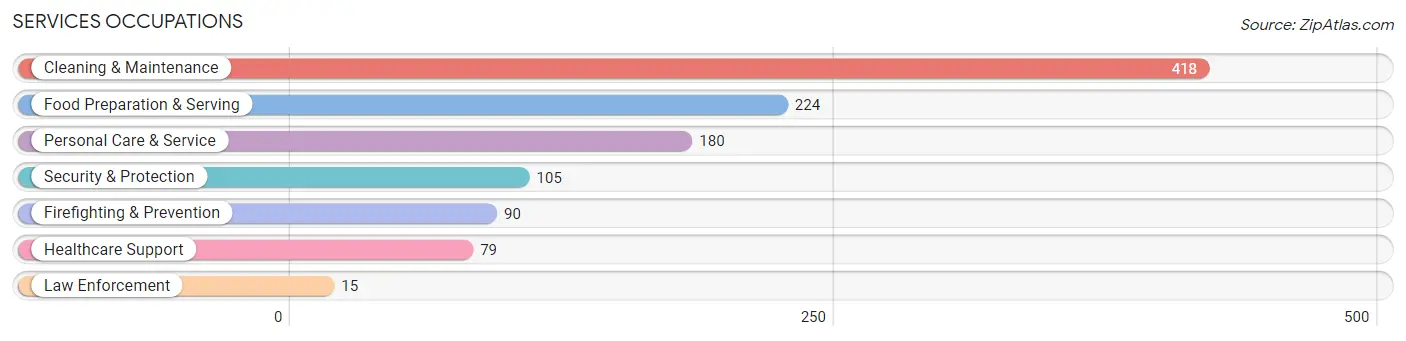
Services Occupations
The most common Services occupations in Springs are Cleaning & Maintenance (418 | 8.2%), Food Preparation & Serving (224 | 4.4%), Personal Care & Service (180 | 3.5%), Security & Protection (105 | 2.1%), and Firefighting & Prevention (90 | 1.8%).
Services Occupations by Sex
Within the Services occupations in Springs, the most male-oriented occupations are Law Enforcement (100.0%), Food Preparation & Serving (87.1%), and Personal Care & Service (86.1%), while the most female-oriented occupations are Healthcare Support (100.0%), Firefighting & Prevention (100.0%), and Security & Protection (85.7%).
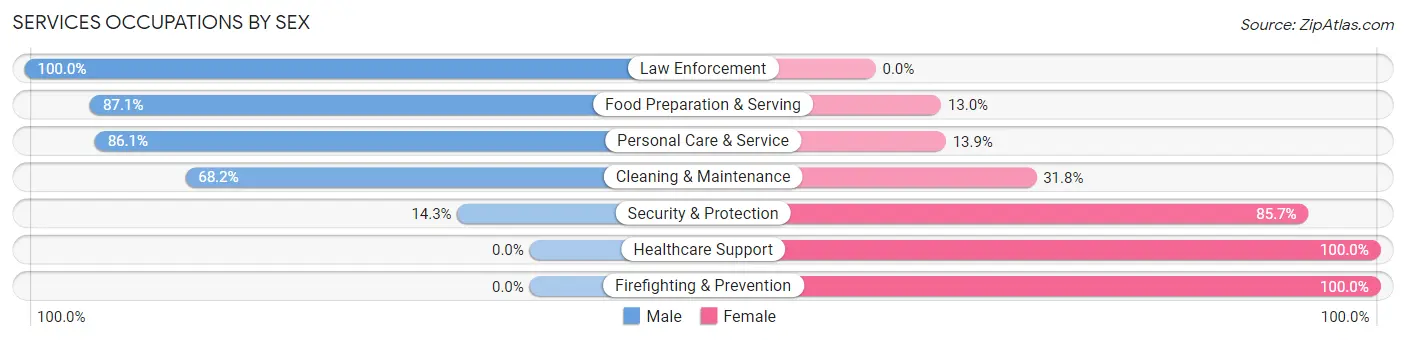
| Occupation | Male | Female |
| Healthcare Support | 0 (0.0%) | 79 (100.0%) |
| Security & Protection | 15 (14.3%) | 90 (85.7%) |
| Firefighting & Prevention | 0 (0.0%) | 90 (100.0%) |
| Law Enforcement | 15 (100.0%) | 0 (0.0%) |
| Food Preparation & Serving | 195 (87.1%) | 29 (13.0%) |
| Cleaning & Maintenance | 285 (68.2%) | 133 (31.8%) |
| Personal Care & Service | 155 (86.1%) | 25 (13.9%) |
| Total (Category) | 650 (64.6%) | 356 (35.4%) |
| Total (Overall) | 2,798 (54.6%) | 2,324 (45.4%) |
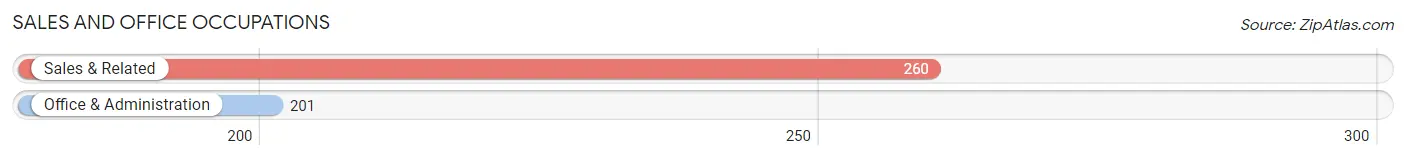
Sales and Office Occupations
The most common Sales and Office occupations in Springs are Sales & Related (260 | 5.1%), and Office & Administration (201 | 3.9%).
Sales and Office Occupations by Sex
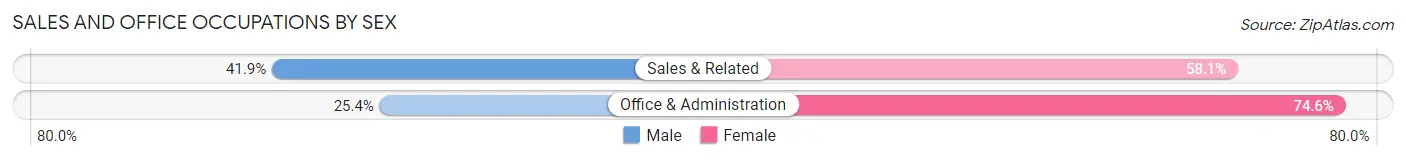
| Occupation | Male | Female |
| Sales & Related | 109 (41.9%) | 151 (58.1%) |
| Office & Administration | 51 (25.4%) | 150 (74.6%) |
| Total (Category) | 160 (34.7%) | 301 (65.3%) |
| Total (Overall) | 2,798 (54.6%) | 2,324 (45.4%) |
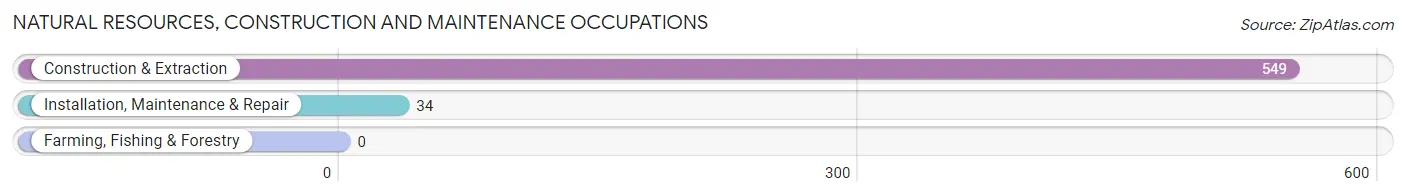
Natural Resources, Construction and Maintenance Occupations
The most common Natural Resources, Construction and Maintenance occupations in Springs are Construction & Extraction (549 | 10.7%), and Installation, Maintenance & Repair (34 | 0.7%).
Natural Resources, Construction and Maintenance Occupations by Sex
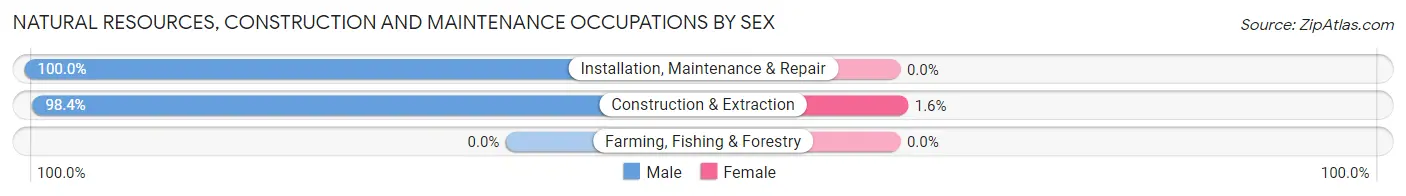
| Occupation | Male | Female |
| Farming, Fishing & Forestry | 0 (0.0%) | 0 (0.0%) |
| Construction & Extraction | 540 (98.4%) | 9 (1.6%) |
| Installation, Maintenance & Repair | 34 (100.0%) | 0 (0.0%) |
| Total (Category) | 574 (98.5%) | 9 (1.5%) |
| Total (Overall) | 2,798 (54.6%) | 2,324 (45.4%) |
Production, Transportation and Moving Occupations
The most common Production, Transportation and Moving occupations in Springs are Material Moving (118 | 2.3%), Production (116 | 2.3%), and Transportation (34 | 0.7%).
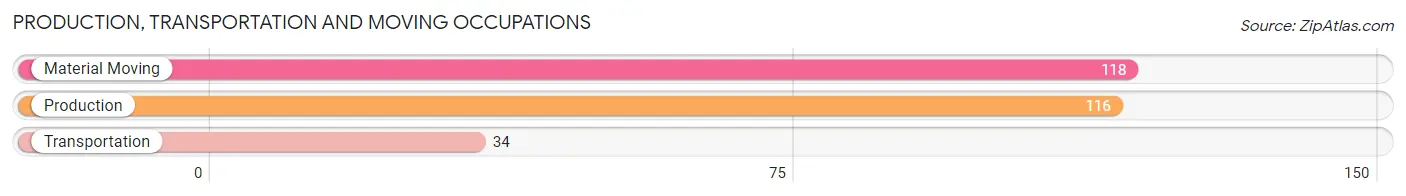
Production, Transportation and Moving Occupations by Sex
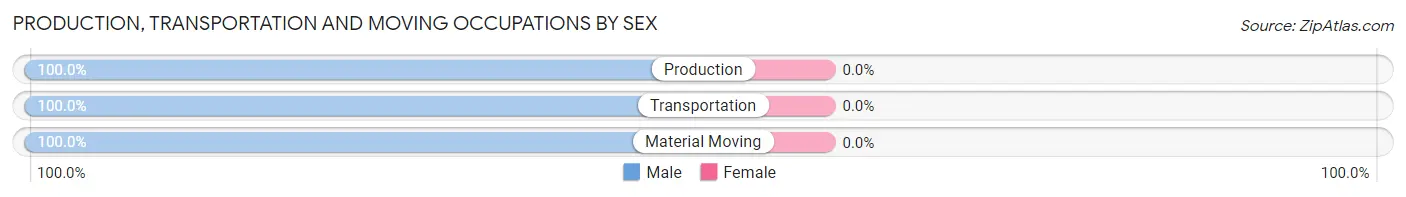
| Occupation | Male | Female |
| Production | 116 (100.0%) | 0 (0.0%) |
| Transportation | 34 (100.0%) | 0 (0.0%) |
| Material Moving | 118 (100.0%) | 0 (0.0%) |
| Total (Category) | 268 (100.0%) | 0 (0.0%) |
| Total (Overall) | 2,798 (54.6%) | 2,324 (45.4%) |
Employment Industries by Sex in Springs
Employment Industries in Springs
The major employment industries in Springs include Professional & Scientific (934 | 18.2%), Construction (684 | 13.4%), Educational Services (592 | 11.6%), Health Care & Social Assistance (551 | 10.8%), and Retail Trade (405 | 7.9%).
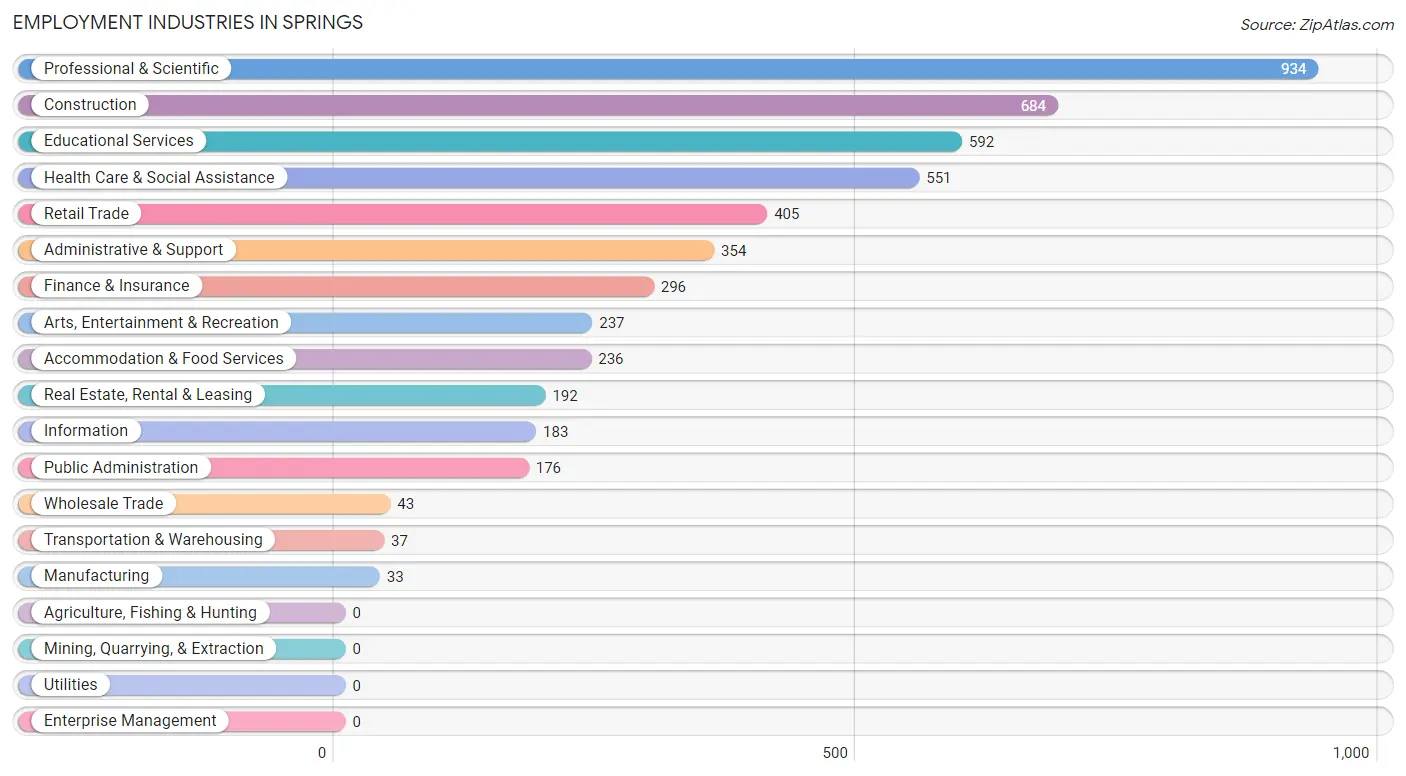
Employment Industries by Sex in Springs
The Springs industries that see more men than women are Wholesale Trade (100.0%), Transportation & Warehousing (100.0%), and Construction (94.3%), whereas the industries that tend to have a higher number of women are Finance & Insurance (86.8%), Health Care & Social Assistance (73.7%), and Public Administration (60.8%).
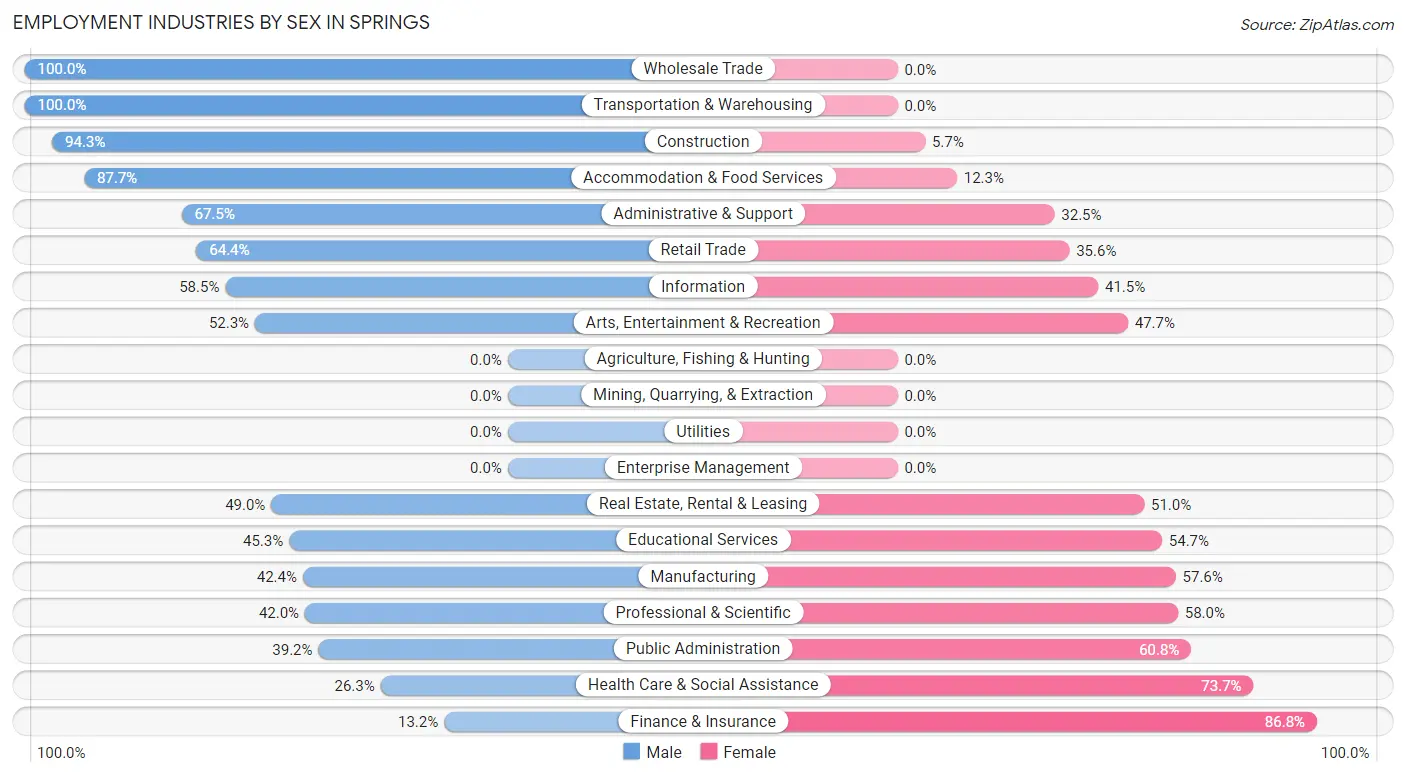
| Industry | Male | Female |
| Agriculture, Fishing & Hunting | 0 (0.0%) | 0 (0.0%) |
| Mining, Quarrying, & Extraction | 0 (0.0%) | 0 (0.0%) |
| Construction | 645 (94.3%) | 39 (5.7%) |
| Manufacturing | 14 (42.4%) | 19 (57.6%) |
| Wholesale Trade | 43 (100.0%) | 0 (0.0%) |
| Retail Trade | 261 (64.4%) | 144 (35.6%) |
| Transportation & Warehousing | 37 (100.0%) | 0 (0.0%) |
| Utilities | 0 (0.0%) | 0 (0.0%) |
| Information | 107 (58.5%) | 76 (41.5%) |
| Finance & Insurance | 39 (13.2%) | 257 (86.8%) |
| Real Estate, Rental & Leasing | 94 (49.0%) | 98 (51.0%) |
| Professional & Scientific | 392 (42.0%) | 542 (58.0%) |
| Enterprise Management | 0 (0.0%) | 0 (0.0%) |
| Administrative & Support | 239 (67.5%) | 115 (32.5%) |
| Educational Services | 268 (45.3%) | 324 (54.7%) |
| Health Care & Social Assistance | 145 (26.3%) | 406 (73.7%) |
| Arts, Entertainment & Recreation | 124 (52.3%) | 113 (47.7%) |
| Accommodation & Food Services | 207 (87.7%) | 29 (12.3%) |
| Public Administration | 69 (39.2%) | 107 (60.8%) |
| Total | 2,798 (54.6%) | 2,324 (45.4%) |
Education in Springs
School Enrollment in Springs
The most common levels of schooling among the 1,695 students in Springs are college / undergraduate (488 | 28.8%), elementary school (440 | 26.0%), and high school (257 | 15.2%).
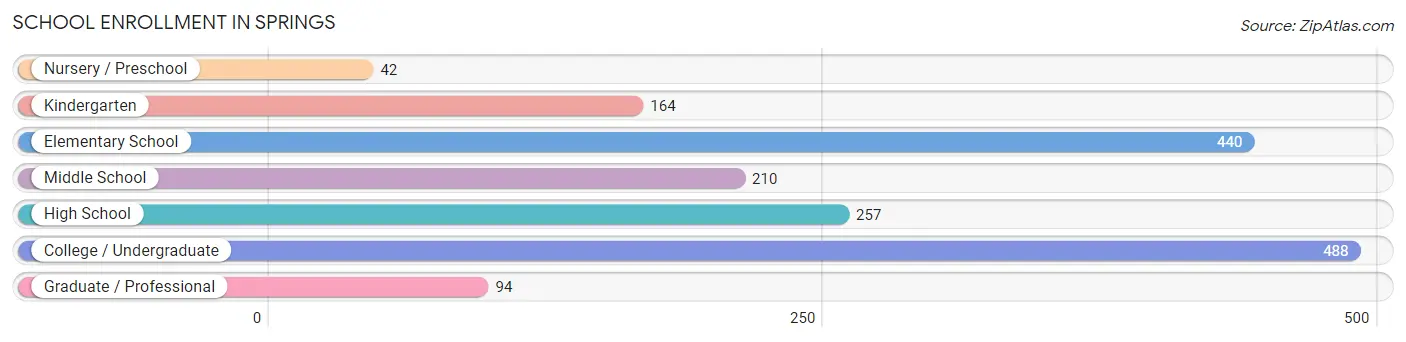
| School Level | # Students | % Students |
| Nursery / Preschool | 42 | 2.5% |
| Kindergarten | 164 | 9.7% |
| Elementary School | 440 | 26.0% |
| Middle School | 210 | 12.4% |
| High School | 257 | 15.2% |
| College / Undergraduate | 488 | 28.8% |
| Graduate / Professional | 94 | 5.6% |
| Total | 1,695 | 100.0% |
School Enrollment by Age by Funding Source in Springs
Out of a total of 1,695 students who are enrolled in schools in Springs, 339 (20.0%) attend a private institution, while the remaining 1,356 (80.0%) are enrolled in public schools. The age group of 18 to 19 year olds has the highest likelihood of being enrolled in private schools, with 140 (51.3% in the age bracket) enrolled. Conversely, the age group of 10 to 14 year olds has the lowest likelihood of being enrolled in a private school, with 255 (100.0% in the age bracket) attending a public institution.
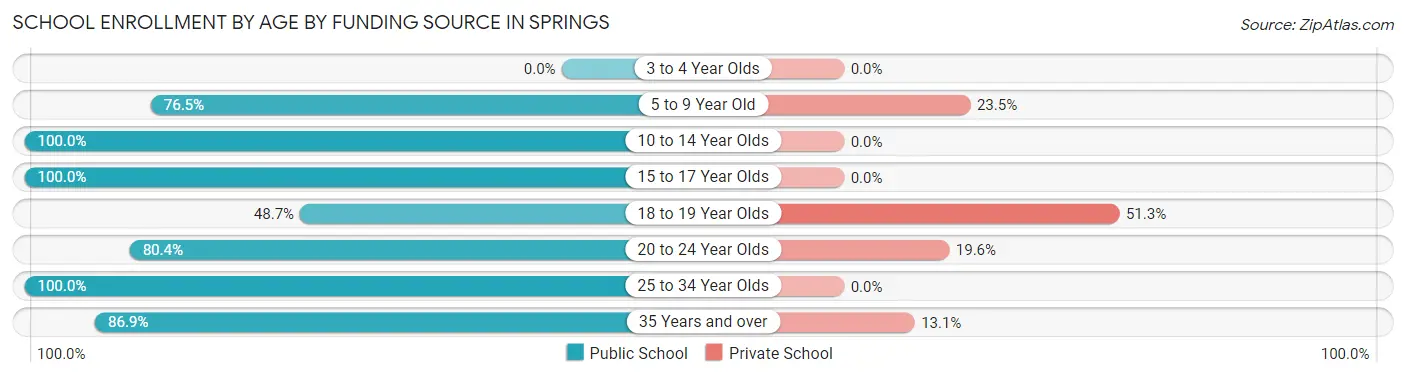
| Age Bracket | Public School | Private School |
| 3 to 4 Year Olds | 0 (0.0%) | 0 (0.0%) |
| 5 to 9 Year Old | 494 (76.5%) | 152 (23.5%) |
| 10 to 14 Year Olds | 255 (100.0%) | 0 (0.0%) |
| 15 to 17 Year Olds | 199 (100.0%) | 0 (0.0%) |
| 18 to 19 Year Olds | 133 (48.7%) | 140 (51.3%) |
| 20 to 24 Year Olds | 119 (80.4%) | 29 (19.6%) |
| 25 to 34 Year Olds | 37 (100.0%) | 0 (0.0%) |
| 35 Years and over | 119 (86.9%) | 18 (13.1%) |
| Total | 1,356 (80.0%) | 339 (20.0%) |
Educational Attainment by Field of Study in Springs
Social sciences (751 | 18.0%), business (510 | 12.2%), literature & languages (444 | 10.6%), visual & performing arts (427 | 10.2%), and liberal arts & history (312 | 7.5%) are the most common fields of study among 4,168 individuals in Springs who have obtained a bachelor's degree or higher.
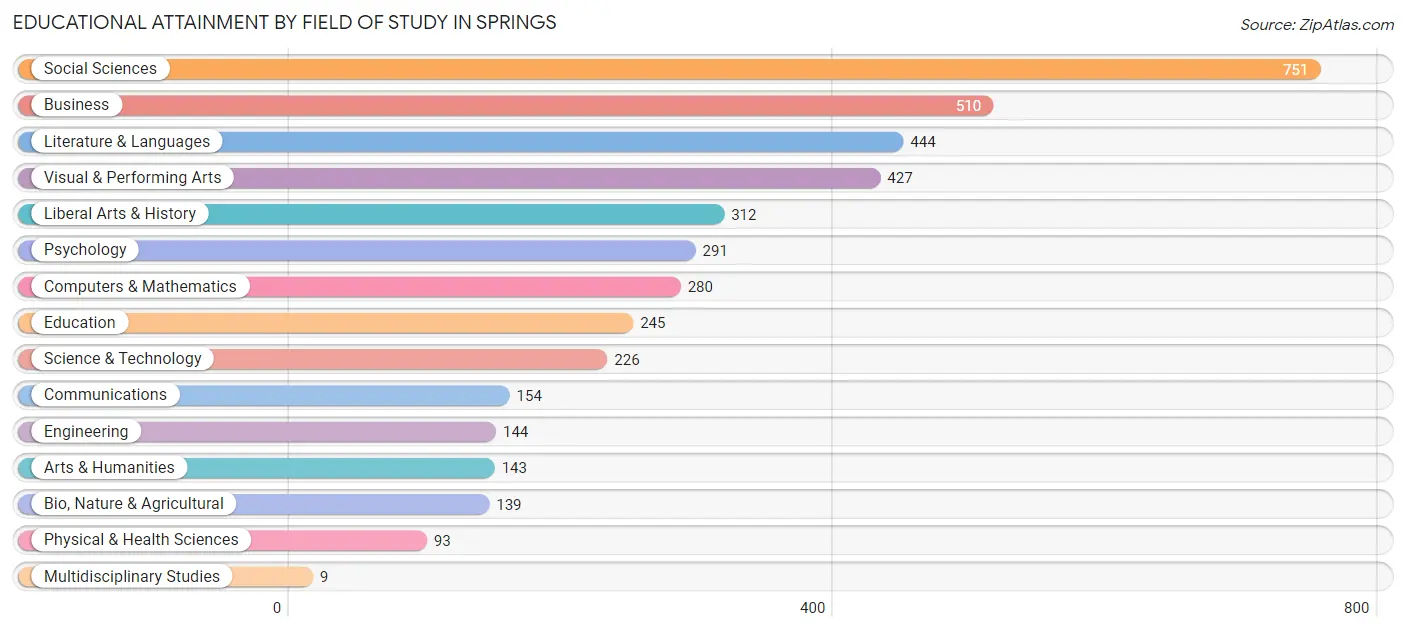
| Field of Study | # Graduates | % Graduates |
| Computers & Mathematics | 280 | 6.7% |
| Bio, Nature & Agricultural | 139 | 3.3% |
| Physical & Health Sciences | 93 | 2.2% |
| Psychology | 291 | 7.0% |
| Social Sciences | 751 | 18.0% |
| Engineering | 144 | 3.5% |
| Multidisciplinary Studies | 9 | 0.2% |
| Science & Technology | 226 | 5.4% |
| Business | 510 | 12.2% |
| Education | 245 | 5.9% |
| Literature & Languages | 444 | 10.6% |
| Liberal Arts & History | 312 | 7.5% |
| Visual & Performing Arts | 427 | 10.2% |
| Communications | 154 | 3.7% |
| Arts & Humanities | 143 | 3.4% |
| Total | 4,168 | 100.0% |
Transportation & Commute in Springs
Vehicle Availability by Sex in Springs
The most prevalent vehicle ownership categories in Springs are males with 2 vehicles (1,241, accounting for 44.4%) and females with 2 vehicles (1,019, making up 55.0%).
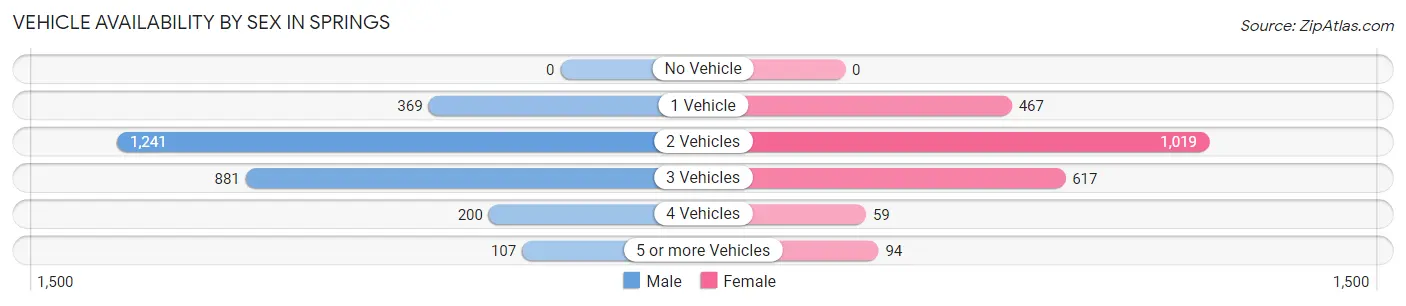
| Vehicles Available | Male | Female |
| No Vehicle | 0 (0.0%) | 0 (0.0%) |
| 1 Vehicle | 369 (13.2%) | 467 (20.7%) |
| 2 Vehicles | 1,241 (44.4%) | 1,019 (45.2%) |
| 3 Vehicles | 881 (31.5%) | 617 (27.4%) |
| 4 Vehicles | 200 (7.1%) | 59 (2.6%) |
| 5 or more Vehicles | 107 (3.8%) | 94 (4.2%) |
| Total | 2,798 (100.0%) | 2,256 (100.0%) |
Commute Time in Springs
The most frequently occuring commute durations in Springs are 15 to 19 minutes (1,158 commuters, 30.8%), 10 to 14 minutes (766 commuters, 20.4%), and 20 to 24 minutes (372 commuters, 9.9%).
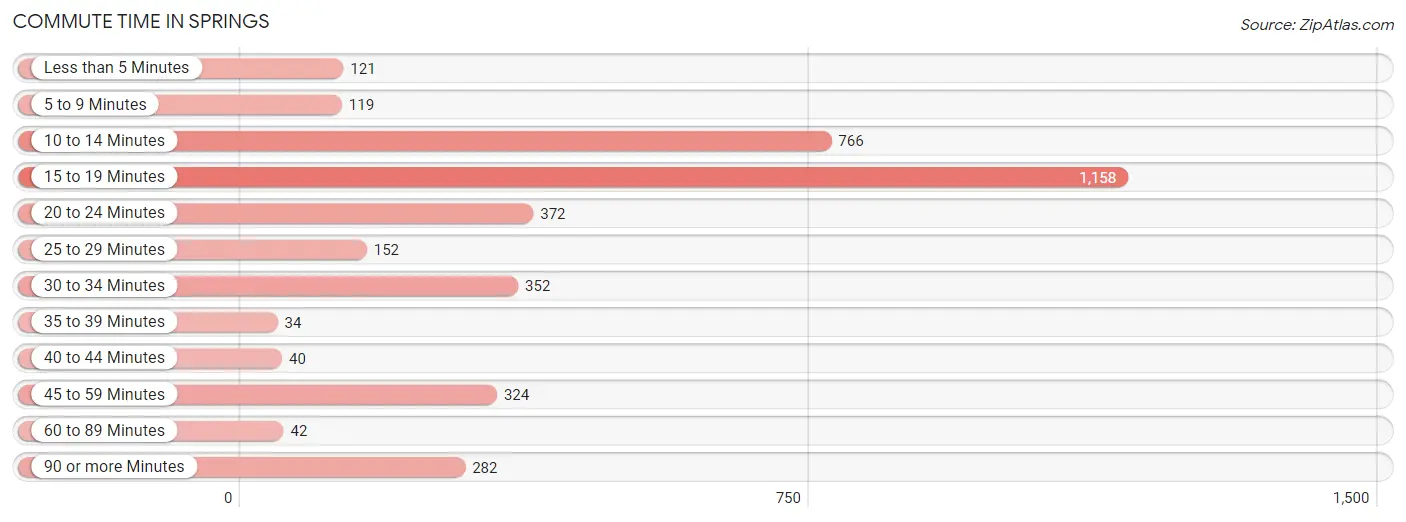
| Commute Time | # Commuters | % Commuters |
| Less than 5 Minutes | 121 | 3.2% |
| 5 to 9 Minutes | 119 | 3.2% |
| 10 to 14 Minutes | 766 | 20.4% |
| 15 to 19 Minutes | 1,158 | 30.8% |
| 20 to 24 Minutes | 372 | 9.9% |
| 25 to 29 Minutes | 152 | 4.0% |
| 30 to 34 Minutes | 352 | 9.4% |
| 35 to 39 Minutes | 34 | 0.9% |
| 40 to 44 Minutes | 40 | 1.1% |
| 45 to 59 Minutes | 324 | 8.6% |
| 60 to 89 Minutes | 42 | 1.1% |
| 90 or more Minutes | 282 | 7.5% |
Commute Time by Sex in Springs
The most common commute times in Springs are 15 to 19 minutes (624 commuters, 28.4%) for males and 15 to 19 minutes (534 commuters, 34.1%) for females.
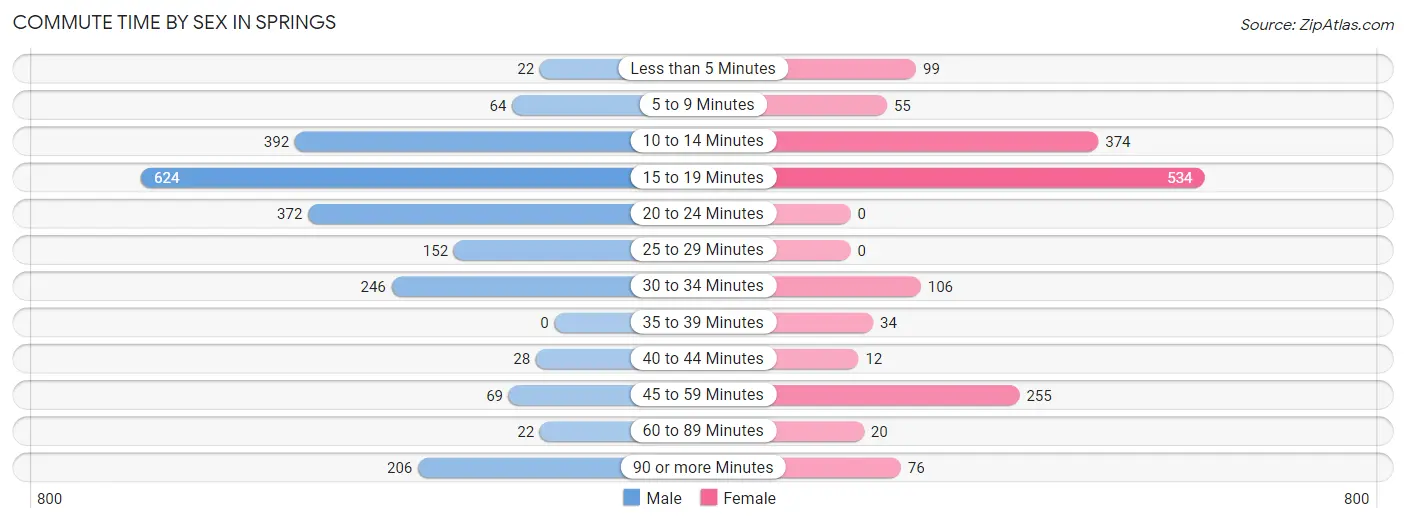
| Commute Time | Male | Female |
| Less than 5 Minutes | 22 (1.0%) | 99 (6.3%) |
| 5 to 9 Minutes | 64 (2.9%) | 55 (3.5%) |
| 10 to 14 Minutes | 392 (17.8%) | 374 (23.9%) |
| 15 to 19 Minutes | 624 (28.4%) | 534 (34.1%) |
| 20 to 24 Minutes | 372 (16.9%) | 0 (0.0%) |
| 25 to 29 Minutes | 152 (6.9%) | 0 (0.0%) |
| 30 to 34 Minutes | 246 (11.2%) | 106 (6.8%) |
| 35 to 39 Minutes | 0 (0.0%) | 34 (2.2%) |
| 40 to 44 Minutes | 28 (1.3%) | 12 (0.8%) |
| 45 to 59 Minutes | 69 (3.1%) | 255 (16.3%) |
| 60 to 89 Minutes | 22 (1.0%) | 20 (1.3%) |
| 90 or more Minutes | 206 (9.4%) | 76 (4.9%) |
Time of Departure to Work by Sex in Springs
The most frequent times of departure to work in Springs are 7:30 AM to 7:59 AM (503, 22.9%) for males and 8:00 AM to 8:29 AM (397, 25.4%) for females.
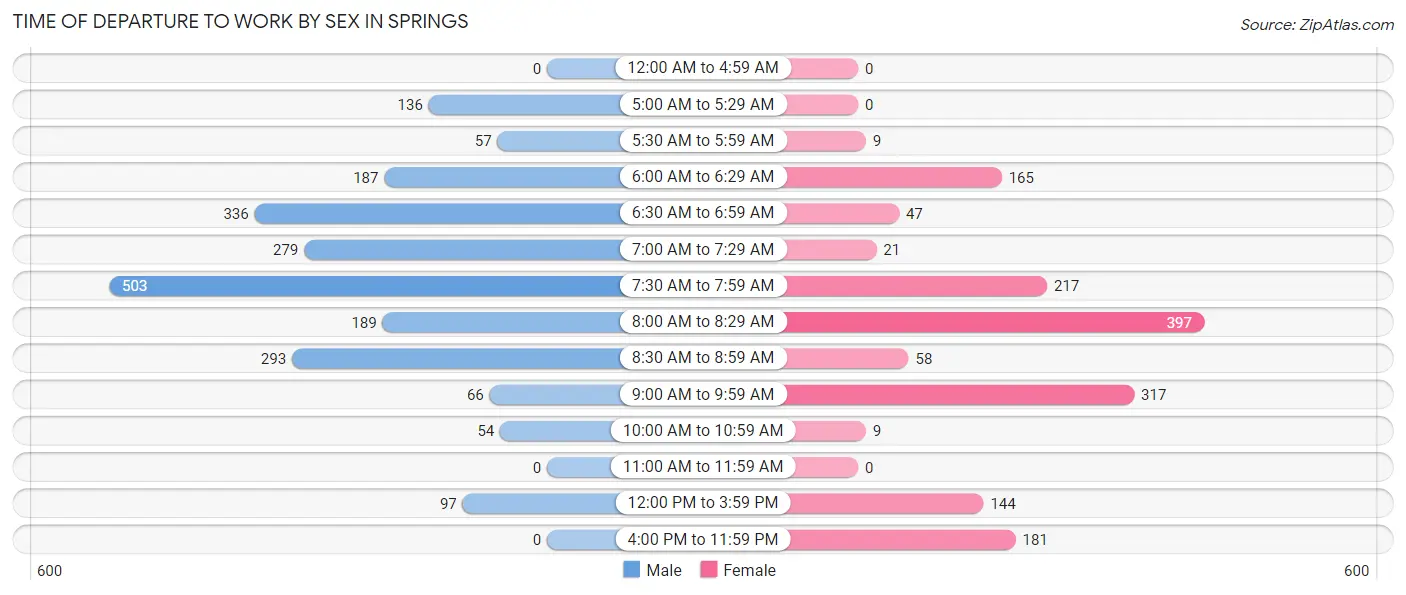
| Time of Departure | Male | Female |
| 12:00 AM to 4:59 AM | 0 (0.0%) | 0 (0.0%) |
| 5:00 AM to 5:29 AM | 136 (6.2%) | 0 (0.0%) |
| 5:30 AM to 5:59 AM | 57 (2.6%) | 9 (0.6%) |
| 6:00 AM to 6:29 AM | 187 (8.5%) | 165 (10.5%) |
| 6:30 AM to 6:59 AM | 336 (15.3%) | 47 (3.0%) |
| 7:00 AM to 7:29 AM | 279 (12.7%) | 21 (1.3%) |
| 7:30 AM to 7:59 AM | 503 (22.9%) | 217 (13.9%) |
| 8:00 AM to 8:29 AM | 189 (8.6%) | 397 (25.4%) |
| 8:30 AM to 8:59 AM | 293 (13.3%) | 58 (3.7%) |
| 9:00 AM to 9:59 AM | 66 (3.0%) | 317 (20.3%) |
| 10:00 AM to 10:59 AM | 54 (2.5%) | 9 (0.6%) |
| 11:00 AM to 11:59 AM | 0 (0.0%) | 0 (0.0%) |
| 12:00 PM to 3:59 PM | 97 (4.4%) | 144 (9.2%) |
| 4:00 PM to 11:59 PM | 0 (0.0%) | 181 (11.6%) |
| Total | 2,197 (100.0%) | 1,565 (100.0%) |
Housing Occupancy in Springs
Occupancy by Ownership in Springs
Of the total 3,526 dwellings in Springs, owner-occupied units account for 2,810 (79.7%), while renter-occupied units make up 716 (20.3%).
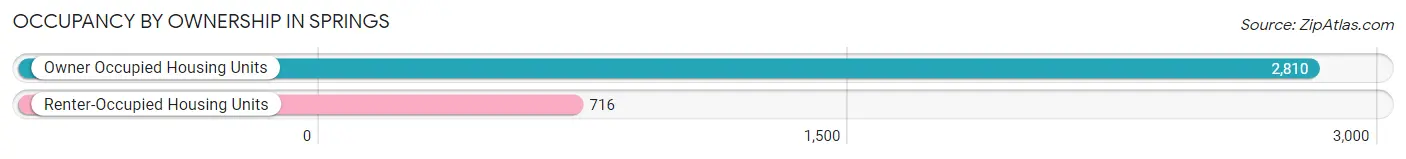
| Occupancy | # Housing Units | % Housing Units |
| Owner Occupied Housing Units | 2,810 | 79.7% |
| Renter-Occupied Housing Units | 716 | 20.3% |
| Total Occupied Housing Units | 3,526 | 100.0% |
Occupancy by Household Size in Springs
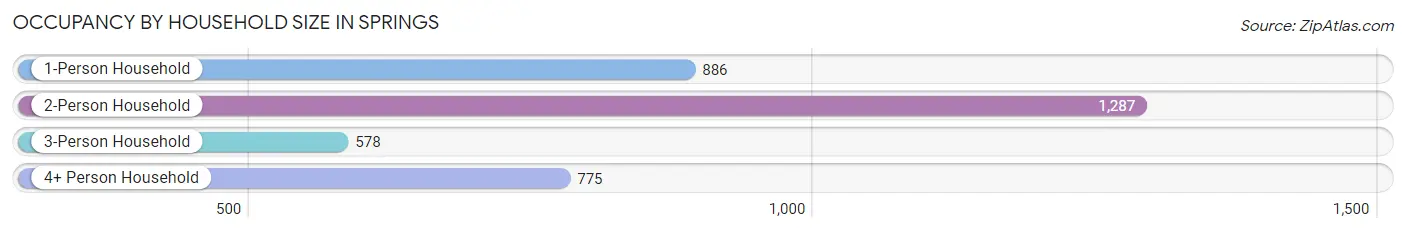
| Household Size | # Housing Units | % Housing Units |
| 1-Person Household | 886 | 25.1% |
| 2-Person Household | 1,287 | 36.5% |
| 3-Person Household | 578 | 16.4% |
| 4+ Person Household | 775 | 22.0% |
| Total Housing Units | 3,526 | 100.0% |
Occupancy by Ownership by Household Size in Springs
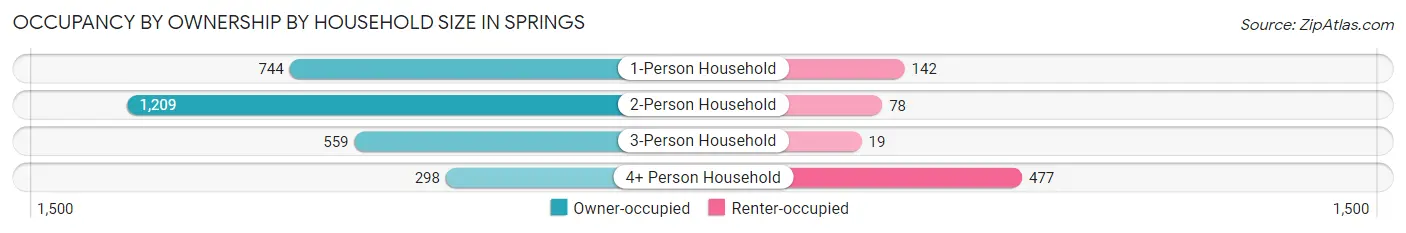
| Household Size | Owner-occupied | Renter-occupied |
| 1-Person Household | 744 (84.0%) | 142 (16.0%) |
| 2-Person Household | 1,209 (93.9%) | 78 (6.1%) |
| 3-Person Household | 559 (96.7%) | 19 (3.3%) |
| 4+ Person Household | 298 (38.5%) | 477 (61.6%) |
| Total Housing Units | 2,810 (79.7%) | 716 (20.3%) |
Occupancy by Educational Attainment in Springs
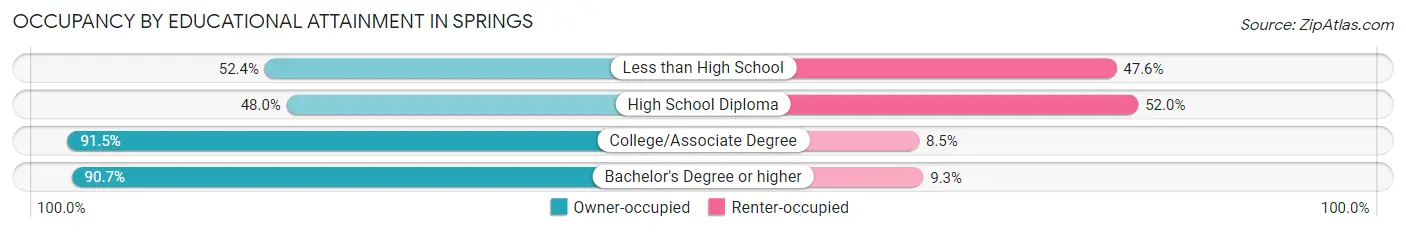
| Household Size | Owner-occupied | Renter-occupied |
| Less than High School | 88 (52.4%) | 80 (47.6%) |
| High School Diploma | 367 (48.0%) | 397 (52.0%) |
| College/Associate Degree | 366 (91.5%) | 34 (8.5%) |
| Bachelor's Degree or higher | 1,989 (90.7%) | 205 (9.3%) |
Occupancy by Age of Householder in Springs
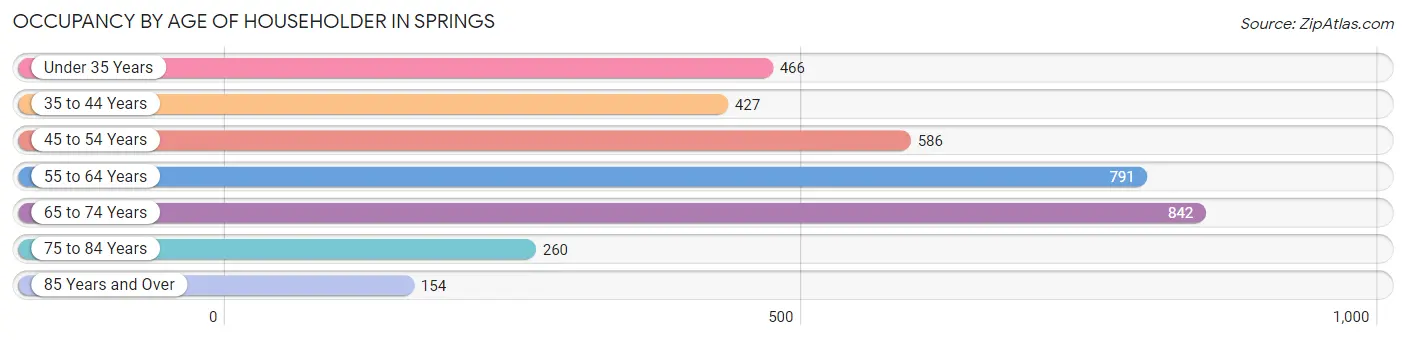
| Age Bracket | # Households | % Households |
| Under 35 Years | 466 | 13.2% |
| 35 to 44 Years | 427 | 12.1% |
| 45 to 54 Years | 586 | 16.6% |
| 55 to 64 Years | 791 | 22.4% |
| 65 to 74 Years | 842 | 23.9% |
| 75 to 84 Years | 260 | 7.4% |
| 85 Years and Over | 154 | 4.4% |
| Total | 3,526 | 100.0% |
Housing Finances in Springs
Median Income by Occupancy in Springs
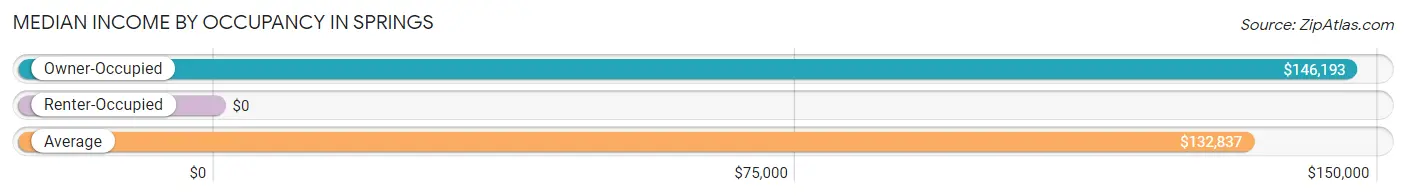
| Occupancy Type | # Households | Median Income |
| Owner-Occupied | 2,810 (79.7%) | $146,193 |
| Renter-Occupied | 716 (20.3%) | $0 |
| Average | 3,526 (100.0%) | $132,837 |
Occupancy by Householder Income Bracket in Springs
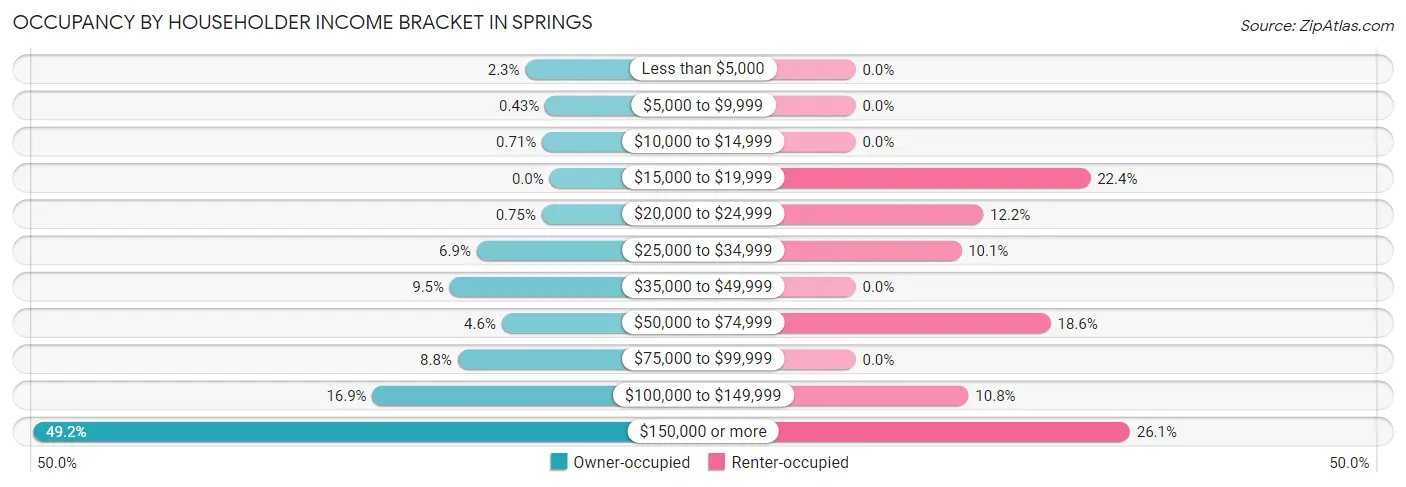
| Income Bracket | Owner-occupied | Renter-occupied |
| Less than $5,000 | 65 (2.3%) | 0 (0.0%) |
| $5,000 to $9,999 | 12 (0.4%) | 0 (0.0%) |
| $10,000 to $14,999 | 20 (0.7%) | 0 (0.0%) |
| $15,000 to $19,999 | 0 (0.0%) | 160 (22.4%) |
| $20,000 to $24,999 | 21 (0.7%) | 87 (12.1%) |
| $25,000 to $34,999 | 195 (6.9%) | 72 (10.1%) |
| $35,000 to $49,999 | 267 (9.5%) | 0 (0.0%) |
| $50,000 to $74,999 | 128 (4.6%) | 133 (18.6%) |
| $75,000 to $99,999 | 246 (8.7%) | 0 (0.0%) |
| $100,000 to $149,999 | 474 (16.9%) | 77 (10.7%) |
| $150,000 or more | 1,382 (49.2%) | 187 (26.1%) |
| Total | 2,810 (100.0%) | 716 (100.0%) |
Monthly Housing Cost Tiers in Springs
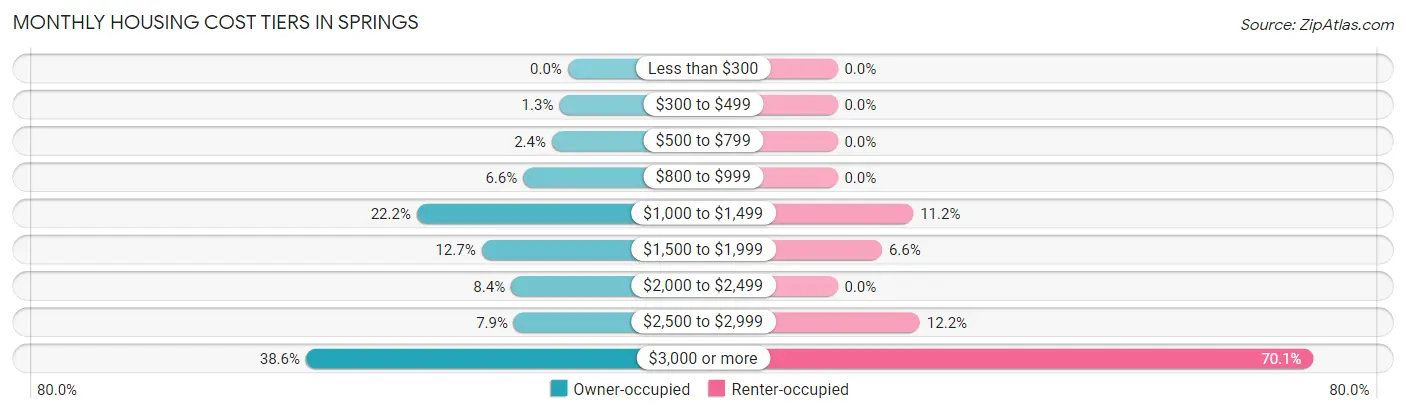
| Monthly Cost | Owner-occupied | Renter-occupied |
| Less than $300 | 0 (0.0%) | 0 (0.0%) |
| $300 to $499 | 35 (1.3%) | 0 (0.0%) |
| $500 to $799 | 66 (2.4%) | 0 (0.0%) |
| $800 to $999 | 185 (6.6%) | 0 (0.0%) |
| $1,000 to $1,499 | 625 (22.2%) | 80 (11.2%) |
| $1,500 to $1,999 | 357 (12.7%) | 47 (6.6%) |
| $2,000 to $2,499 | 235 (8.4%) | 0 (0.0%) |
| $2,500 to $2,999 | 223 (7.9%) | 87 (12.1%) |
| $3,000 or more | 1,084 (38.6%) | 502 (70.1%) |
| Total | 2,810 (100.0%) | 716 (100.0%) |
Physical Housing Characteristics in Springs
Housing Structures in Springs
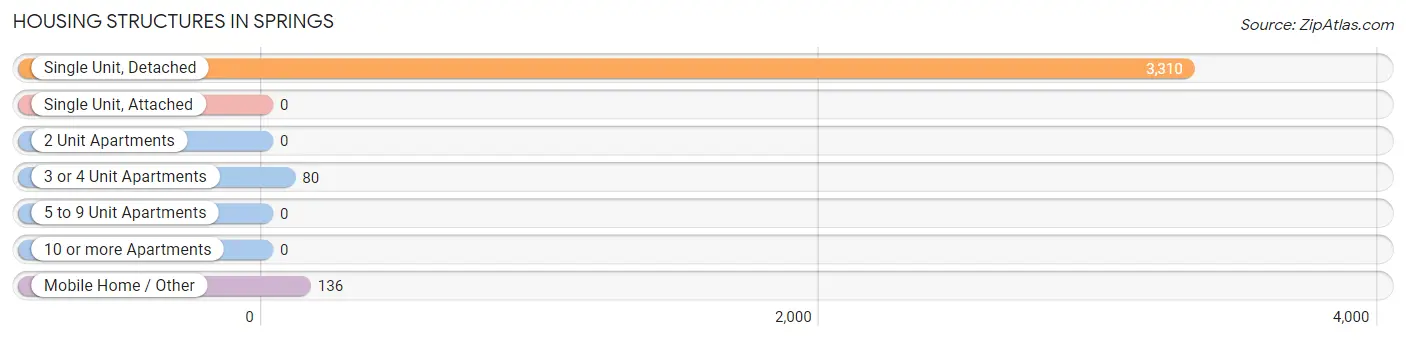
| Structure Type | # Housing Units | % Housing Units |
| Single Unit, Detached | 3,310 | 93.9% |
| Single Unit, Attached | 0 | 0.0% |
| 2 Unit Apartments | 0 | 0.0% |
| 3 or 4 Unit Apartments | 80 | 2.3% |
| 5 to 9 Unit Apartments | 0 | 0.0% |
| 10 or more Apartments | 0 | 0.0% |
| Mobile Home / Other | 136 | 3.9% |
| Total | 3,526 | 100.0% |
Housing Structures by Occupancy in Springs
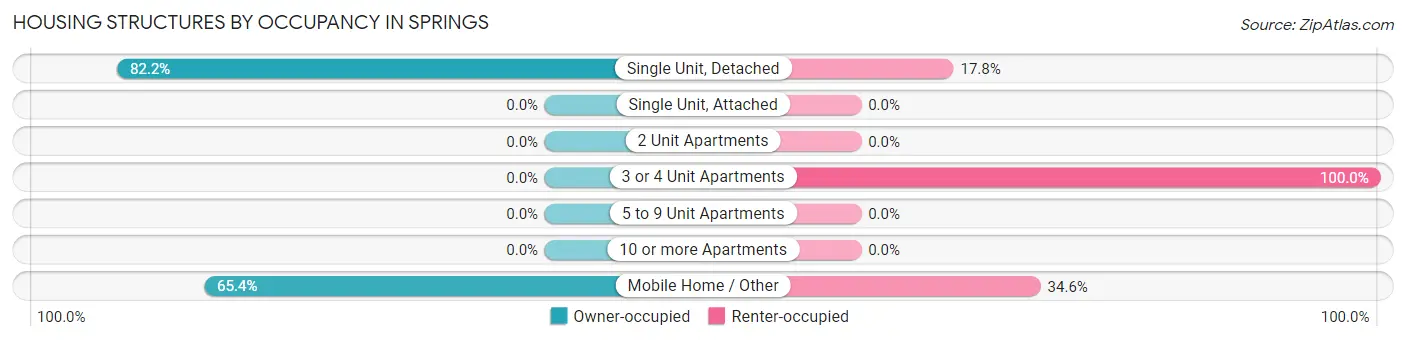
| Structure Type | Owner-occupied | Renter-occupied |
| Single Unit, Detached | 2,721 (82.2%) | 589 (17.8%) |
| Single Unit, Attached | 0 (0.0%) | 0 (0.0%) |
| 2 Unit Apartments | 0 (0.0%) | 0 (0.0%) |
| 3 or 4 Unit Apartments | 0 (0.0%) | 80 (100.0%) |
| 5 to 9 Unit Apartments | 0 (0.0%) | 0 (0.0%) |
| 10 or more Apartments | 0 (0.0%) | 0 (0.0%) |
| Mobile Home / Other | 89 (65.4%) | 47 (34.6%) |
| Total | 2,810 (79.7%) | 716 (20.3%) |
Housing Structures by Number of Rooms in Springs
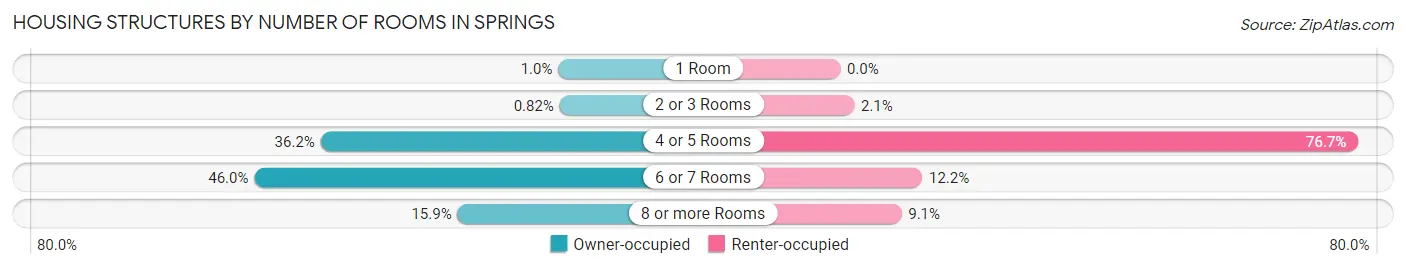
| Number of Rooms | Owner-occupied | Renter-occupied |
| 1 Room | 29 (1.0%) | 0 (0.0%) |
| 2 or 3 Rooms | 23 (0.8%) | 15 (2.1%) |
| 4 or 5 Rooms | 1,017 (36.2%) | 549 (76.7%) |
| 6 or 7 Rooms | 1,293 (46.0%) | 87 (12.1%) |
| 8 or more Rooms | 448 (15.9%) | 65 (9.1%) |
| Total | 2,810 (100.0%) | 716 (100.0%) |
Housing Structure by Heating Type in Springs
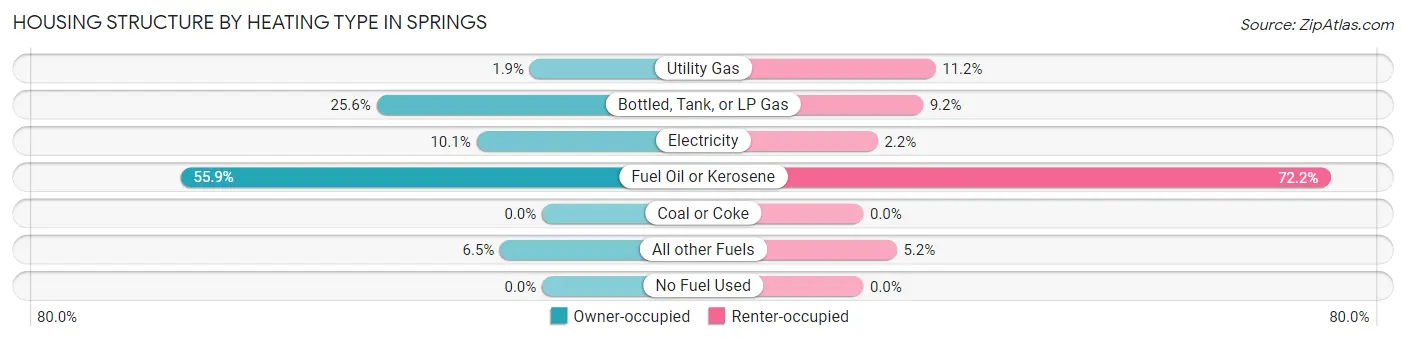
| Heating Type | Owner-occupied | Renter-occupied |
| Utility Gas | 53 (1.9%) | 80 (11.2%) |
| Bottled, Tank, or LP Gas | 719 (25.6%) | 66 (9.2%) |
| Electricity | 285 (10.1%) | 16 (2.2%) |
| Fuel Oil or Kerosene | 1,571 (55.9%) | 517 (72.2%) |
| Coal or Coke | 0 (0.0%) | 0 (0.0%) |
| All other Fuels | 182 (6.5%) | 37 (5.2%) |
| No Fuel Used | 0 (0.0%) | 0 (0.0%) |
| Total | 2,810 (100.0%) | 716 (100.0%) |
Household Vehicle Usage in Springs
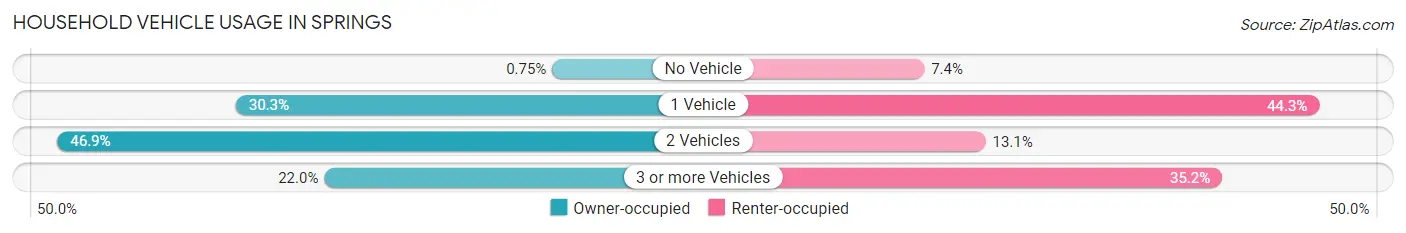
| Vehicles per Household | Owner-occupied | Renter-occupied |
| No Vehicle | 21 (0.7%) | 53 (7.4%) |
| 1 Vehicle | 851 (30.3%) | 317 (44.3%) |
| 2 Vehicles | 1,319 (46.9%) | 94 (13.1%) |
| 3 or more Vehicles | 619 (22.0%) | 252 (35.2%) |
| Total | 2,810 (100.0%) | 716 (100.0%) |
Real Estate & Mortgages in Springs
Real Estate and Mortgage Overview in Springs
| Characteristic | Without Mortgage | With Mortgage |
| Housing Units | 1,175 | 1,635 |
| Median Property Value | $857,600 | $822,500 |
| Median Household Income | $117,604 | $891 |
| Monthly Housing Costs | $1,164 | $1,084 |
| Real Estate Taxes | $7,357 | $0 |
Property Value by Mortgage Status in Springs
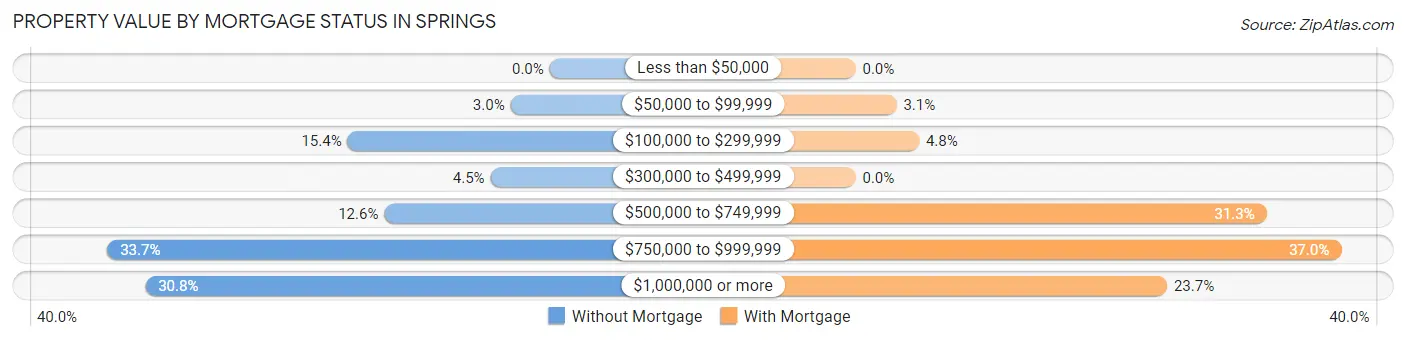
| Property Value | Without Mortgage | With Mortgage |
| Less than $50,000 | 0 (0.0%) | 0 (0.0%) |
| $50,000 to $99,999 | 35 (3.0%) | 51 (3.1%) |
| $100,000 to $299,999 | 181 (15.4%) | 79 (4.8%) |
| $300,000 to $499,999 | 53 (4.5%) | 0 (0.0%) |
| $500,000 to $749,999 | 148 (12.6%) | 512 (31.3%) |
| $750,000 to $999,999 | 396 (33.7%) | 605 (37.0%) |
| $1,000,000 or more | 362 (30.8%) | 388 (23.7%) |
| Total | 1,175 (100.0%) | 1,635 (100.0%) |
Household Income by Mortgage Status in Springs
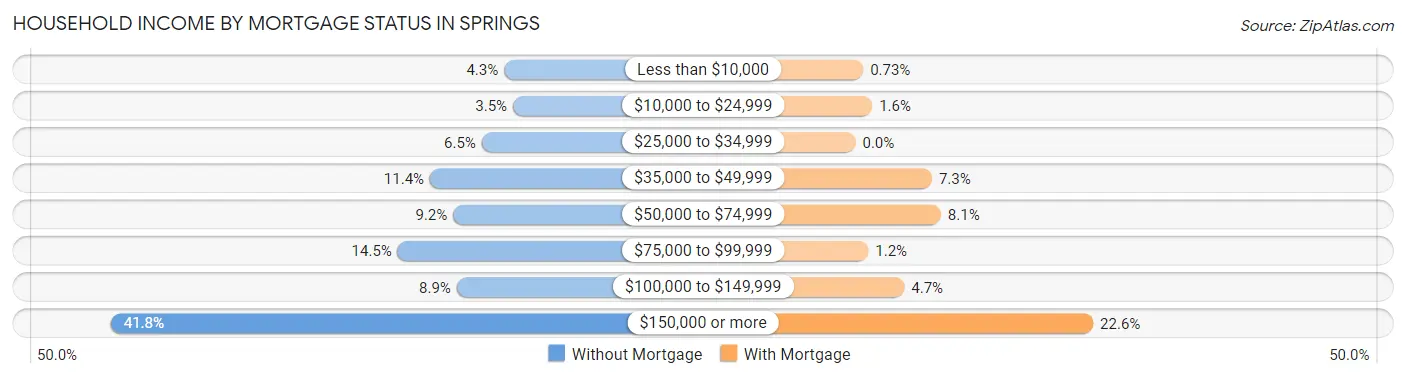
| Household Income | Without Mortgage | With Mortgage |
| Less than $10,000 | 51 (4.3%) | 12 (0.7%) |
| $10,000 to $24,999 | 41 (3.5%) | 26 (1.6%) |
| $25,000 to $34,999 | 76 (6.5%) | 0 (0.0%) |
| $35,000 to $49,999 | 134 (11.4%) | 119 (7.3%) |
| $50,000 to $74,999 | 108 (9.2%) | 133 (8.1%) |
| $75,000 to $99,999 | 170 (14.5%) | 20 (1.2%) |
| $100,000 to $149,999 | 104 (8.8%) | 76 (4.6%) |
| $150,000 or more | 491 (41.8%) | 370 (22.6%) |
| Total | 1,175 (100.0%) | 1,635 (100.0%) |
Property Value to Household Income Ratio in Springs
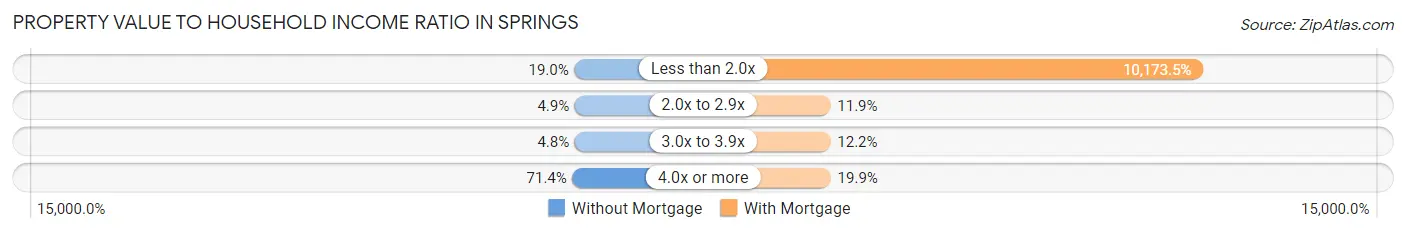
| Value-to-Income Ratio | Without Mortgage | With Mortgage |
| Less than 2.0x | 223 (19.0%) | 166,336 (10,173.5%) |
| 2.0x to 2.9x | 57 (4.9%) | 195 (11.9%) |
| 3.0x to 3.9x | 56 (4.8%) | 200 (12.2%) |
| 4.0x or more | 839 (71.4%) | 325 (19.9%) |
| Total | 1,175 (100.0%) | 1,635 (100.0%) |
Real Estate Taxes by Mortgage Status in Springs
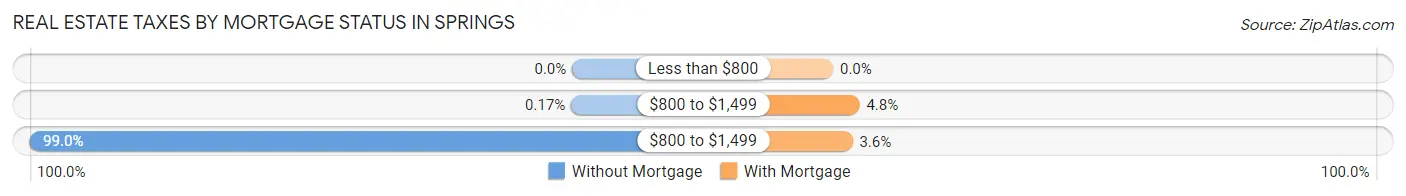
| Property Taxes | Without Mortgage | With Mortgage |
| Less than $800 | 0 (0.0%) | 0 (0.0%) |
| $800 to $1,499 | 2 (0.2%) | 79 (4.8%) |
| $800 to $1,499 | 1,163 (99.0%) | 58 (3.5%) |
| Total | 1,175 (100.0%) | 1,635 (100.0%) |
Health & Disability in Springs
Health Insurance Coverage by Age in Springs
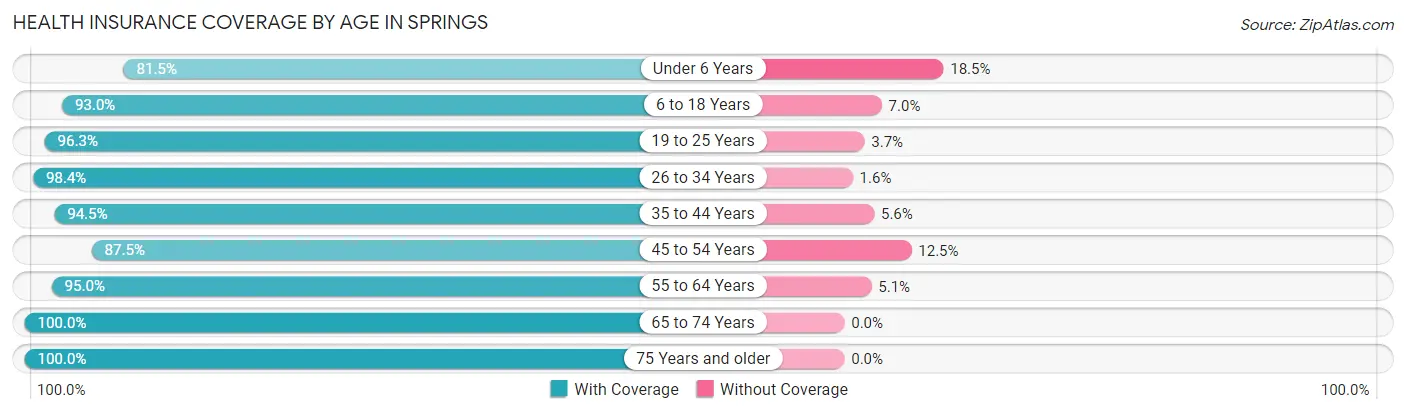
| Age Bracket | With Coverage | Without Coverage |
| Under 6 Years | 477 (81.5%) | 108 (18.5%) |
| 6 to 18 Years | 1,028 (93.0%) | 77 (7.0%) |
| 19 to 25 Years | 747 (96.3%) | 29 (3.7%) |
| 26 to 34 Years | 881 (98.4%) | 14 (1.6%) |
| 35 to 44 Years | 1,124 (94.5%) | 66 (5.6%) |
| 45 to 54 Years | 1,070 (87.5%) | 153 (12.5%) |
| 55 to 64 Years | 1,336 (95.0%) | 71 (5.1%) |
| 65 to 74 Years | 1,201 (100.0%) | 0 (0.0%) |
| 75 Years and older | 780 (100.0%) | 0 (0.0%) |
| Total | 8,644 (94.4%) | 518 (5.7%) |
Health Insurance Coverage by Citizenship Status in Springs
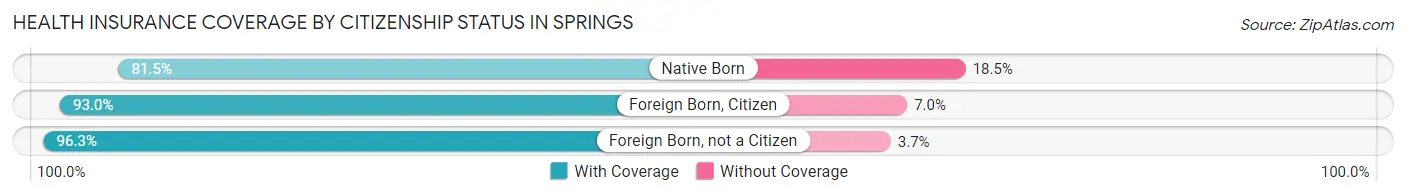
| Citizenship Status | With Coverage | Without Coverage |
| Native Born | 477 (81.5%) | 108 (18.5%) |
| Foreign Born, Citizen | 1,028 (93.0%) | 77 (7.0%) |
| Foreign Born, not a Citizen | 747 (96.3%) | 29 (3.7%) |
Health Insurance Coverage by Household Income in Springs
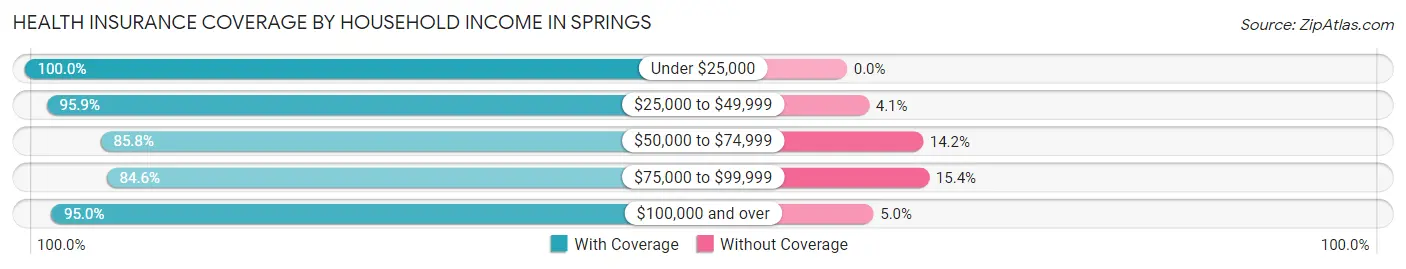
| Household Income | With Coverage | Without Coverage |
| Under $25,000 | 1,214 (100.0%) | 0 (0.0%) |
| $25,000 to $49,999 | 814 (95.9%) | 35 (4.1%) |
| $50,000 to $74,999 | 735 (85.8%) | 122 (14.2%) |
| $75,000 to $99,999 | 418 (84.6%) | 76 (15.4%) |
| $100,000 and over | 5,463 (95.0%) | 285 (5.0%) |
Public vs Private Health Insurance Coverage by Age in Springs
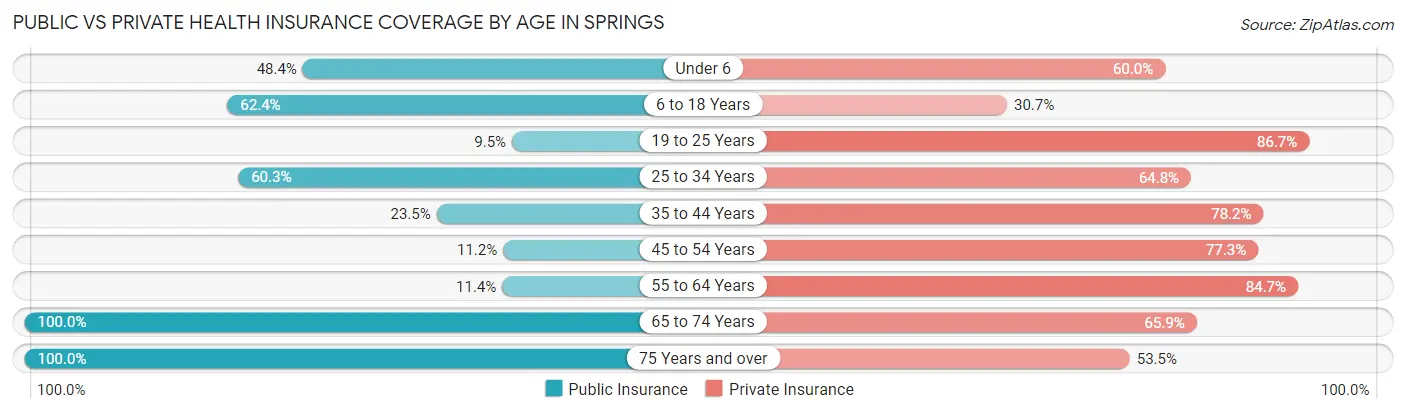
| Age Bracket | Public Insurance | Private Insurance |
| Under 6 | 283 (48.4%) | 351 (60.0%) |
| 6 to 18 Years | 689 (62.4%) | 339 (30.7%) |
| 19 to 25 Years | 74 (9.5%) | 673 (86.7%) |
| 25 to 34 Years | 540 (60.3%) | 580 (64.8%) |
| 35 to 44 Years | 280 (23.5%) | 931 (78.2%) |
| 45 to 54 Years | 137 (11.2%) | 945 (77.3%) |
| 55 to 64 Years | 160 (11.4%) | 1,191 (84.7%) |
| 65 to 74 Years | 1,201 (100.0%) | 791 (65.9%) |
| 75 Years and over | 780 (100.0%) | 417 (53.5%) |
| Total | 4,144 (45.2%) | 6,218 (67.9%) |
Disability Status by Sex by Age in Springs
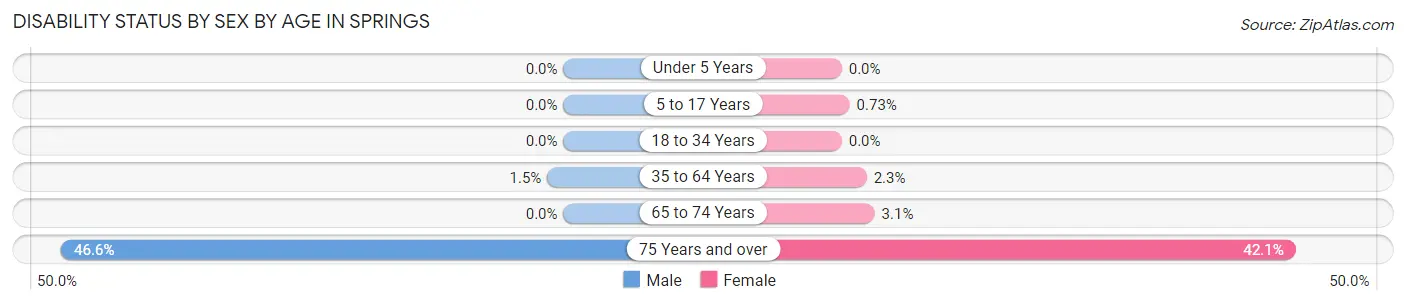
| Age Bracket | Male | Female |
| Under 5 Years | 0 (0.0%) | 0 (0.0%) |
| 5 to 17 Years | 0 (0.0%) | 7 (0.7%) |
| 18 to 34 Years | 0 (0.0%) | 0 (0.0%) |
| 35 to 64 Years | 28 (1.5%) | 45 (2.3%) |
| 65 to 74 Years | 0 (0.0%) | 19 (3.0%) |
| 75 Years and over | 213 (46.6%) | 136 (42.1%) |
Disability Class by Sex by Age in Springs
Disability Class: Hearing Difficulty
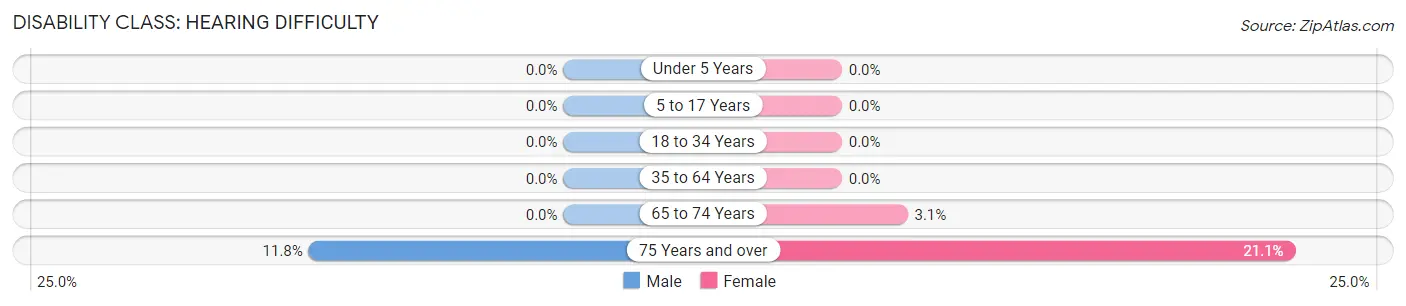
| Age Bracket | Male | Female |
| Under 5 Years | 0 (0.0%) | 0 (0.0%) |
| 5 to 17 Years | 0 (0.0%) | 0 (0.0%) |
| 18 to 34 Years | 0 (0.0%) | 0 (0.0%) |
| 35 to 64 Years | 0 (0.0%) | 0 (0.0%) |
| 65 to 74 Years | 0 (0.0%) | 19 (3.0%) |
| 75 Years and over | 54 (11.8%) | 68 (21.0%) |
Disability Class: Vision Difficulty
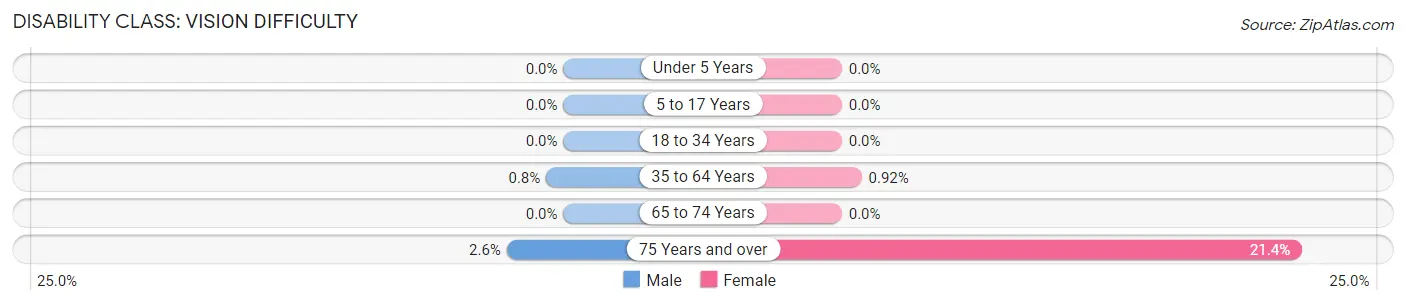
| Age Bracket | Male | Female |
| Under 5 Years | 0 (0.0%) | 0 (0.0%) |
| 5 to 17 Years | 0 (0.0%) | 0 (0.0%) |
| 18 to 34 Years | 0 (0.0%) | 0 (0.0%) |
| 35 to 64 Years | 15 (0.8%) | 18 (0.9%) |
| 65 to 74 Years | 0 (0.0%) | 0 (0.0%) |
| 75 Years and over | 12 (2.6%) | 69 (21.4%) |
Disability Class: Cognitive Difficulty
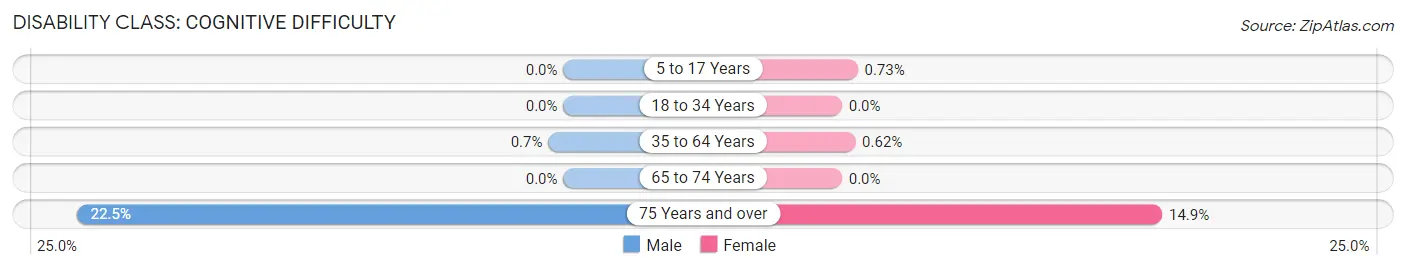
| Age Bracket | Male | Female |
| 5 to 17 Years | 0 (0.0%) | 7 (0.7%) |
| 18 to 34 Years | 0 (0.0%) | 0 (0.0%) |
| 35 to 64 Years | 13 (0.7%) | 12 (0.6%) |
| 65 to 74 Years | 0 (0.0%) | 0 (0.0%) |
| 75 Years and over | 103 (22.5%) | 48 (14.9%) |
Disability Class: Ambulatory Difficulty
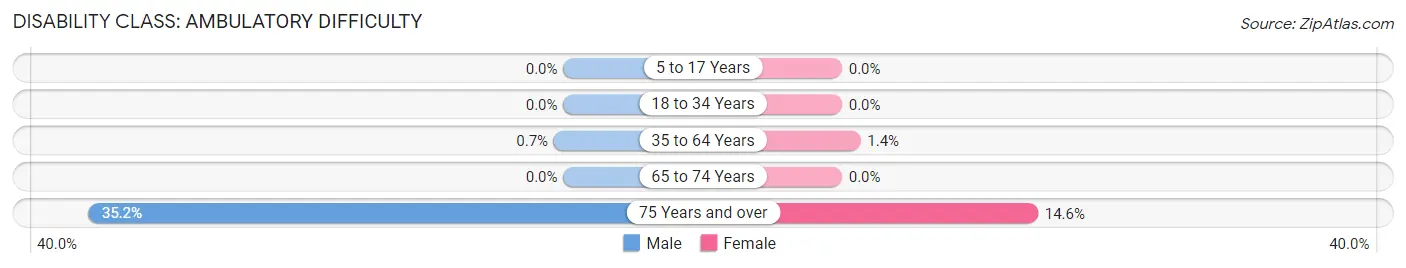
| Age Bracket | Male | Female |
| 5 to 17 Years | 0 (0.0%) | 0 (0.0%) |
| 18 to 34 Years | 0 (0.0%) | 0 (0.0%) |
| 35 to 64 Years | 13 (0.7%) | 27 (1.4%) |
| 65 to 74 Years | 0 (0.0%) | 0 (0.0%) |
| 75 Years and over | 161 (35.2%) | 47 (14.5%) |
Disability Class: Self-Care Difficulty
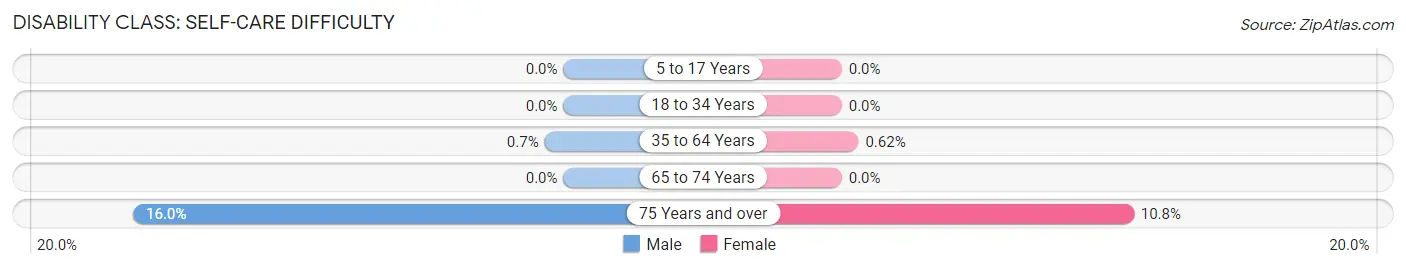
| Age Bracket | Male | Female |
| 5 to 17 Years | 0 (0.0%) | 0 (0.0%) |
| 18 to 34 Years | 0 (0.0%) | 0 (0.0%) |
| 35 to 64 Years | 13 (0.7%) | 12 (0.6%) |
| 65 to 74 Years | 0 (0.0%) | 0 (0.0%) |
| 75 Years and over | 73 (16.0%) | 35 (10.8%) |
Technology Access in Springs
Computing Device Access in Springs
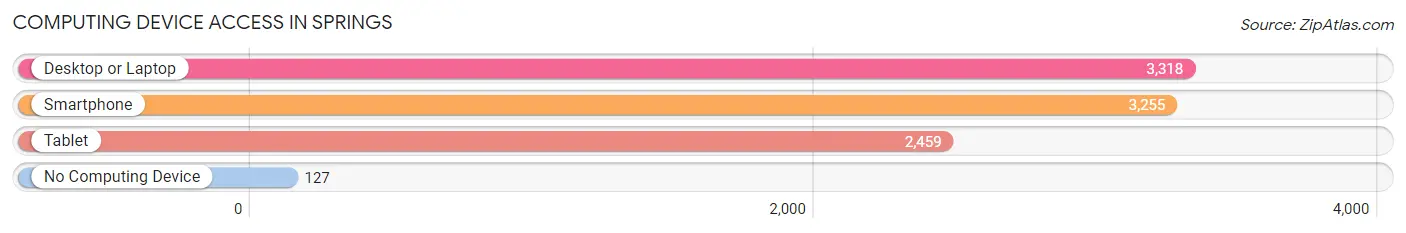
| Device Type | # Households | % Households |
| Desktop or Laptop | 3,318 | 94.1% |
| Smartphone | 3,255 | 92.3% |
| Tablet | 2,459 | 69.7% |
| No Computing Device | 127 | 3.6% |
| Total | 3,526 | 100.0% |
Internet Access in Springs
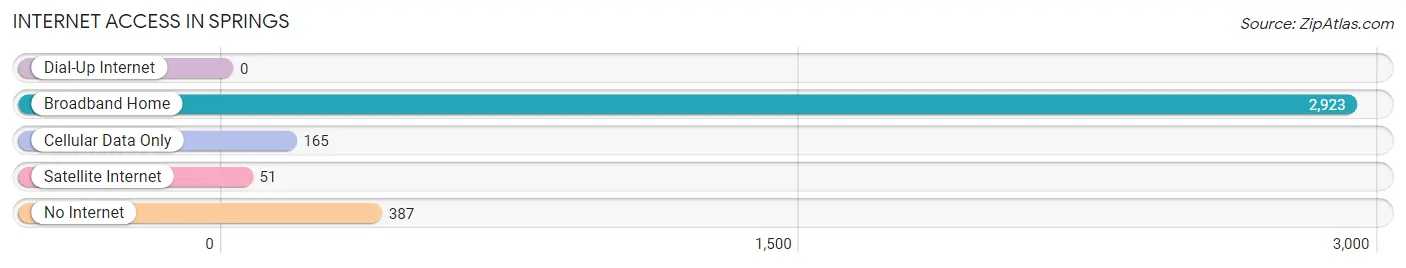
| Internet Type | # Households | % Households |
| Dial-Up Internet | 0 | 0.0% |
| Broadband Home | 2,923 | 82.9% |
| Cellular Data Only | 165 | 4.7% |
| Satellite Internet | 51 | 1.5% |
| No Internet | 387 | 11.0% |
| Total | 3,526 | 100.0% |
Springs Summary
Springs is a hamlet located in the Town of East Hampton in Suffolk County, New York. It is located on the eastern end of Long Island, approximately 90 miles east of New York City. The hamlet is bordered by the hamlets of East Hampton, Amagansett, and Wainscott.
History
Springs was originally inhabited by the Montaukett Native American tribe. The area was first settled by Europeans in the late 17th century. The hamlet was originally known as “Fosters Meadow” and was part of the larger settlement of East Hampton. In 1763, the area was renamed “Springs” after the numerous freshwater springs in the area.
In the late 19th century, Springs became a popular summer destination for wealthy New Yorkers. The area was home to several large estates, including the estate of artist Jackson Pollock. In the early 20th century, Springs became a popular destination for artists and writers, including Willem de Kooning, Jackson Pollock, and Norman Mailer.
Geography
Springs is located on the eastern end of Long Island, approximately 90 miles east of New York City. The hamlet is bordered by the hamlets of East Hampton, Amagansett, and Wainscott. The area is characterized by rolling hills, woodlands, and freshwater springs. The hamlet is located on the Atlantic Ocean and is home to several beaches, including Accabonac Harbor Beach, Gardiner’s Bay Beach, and Napeague Beach.
Economy
Springs is primarily a residential community, with a small commercial district located in the center of the hamlet. The commercial district includes several restaurants, shops, and galleries. The hamlet is also home to several small businesses, including a marina, a boatyard, and a fishing charter service.
Demographics
As of the 2010 census, the population of Springs was 2,867. The median household income was $77,813, and the median age was 44. The population was predominantly white (90.2%), with a small percentage of African Americans (2.2%) and Hispanics (2.7%).
Conclusion
Springs is a small hamlet located on the eastern end of Long Island, approximately 90 miles east of New York City. The hamlet was originally inhabited by the Montaukett Native American tribe and was later settled by Europeans in the late 17th century. In the late 19th century, Springs became a popular summer destination for wealthy New Yorkers, and in the early 20th century, it became a popular destination for artists and writers. The hamlet is primarily a residential community, with a small commercial district located in the center of the hamlet. As of the 2010 census, the population of Springs was 2,867. The median household income was $77,813, and the median age was 44.
Common Questions
What is Per Capita Income in Springs?
Per Capita income in Springs is $67,636.
What is the Median Family Income in Springs?
Median Family Income in Springs is $162,306.
What is the Median Household income in Springs?
Median Household Income in Springs is $132,837.
What is Income or Wage Gap in Springs?
Income or Wage Gap in Springs is 44.8%.
Women in Springs earn 55.2 cents for every dollar earned by a man.
What is Inequality or Gini Index in Springs?
Inequality or Gini Index in Springs is 0.48.
What is the Total Population of Springs?
Total Population of Springs is 9,162.
What is the Total Male Population of Springs?
Total Male Population of Springs is 4,189.
What is the Total Female Population of Springs?
Total Female Population of Springs is 4,973.
What is the Ratio of Males per 100 Females in Springs?
There are 84.23 Males per 100 Females in Springs.
What is the Ratio of Females per 100 Males in Springs?
There are 118.72 Females per 100 Males in Springs.
What is the Median Population Age in Springs?
Median Population Age in Springs is 45.1 Years.
What is the Average Family Size in Springs
Average Family Size in Springs is 3.2 People.
What is the Average Household Size in Springs
Average Household Size in Springs is 2.6 People.
How Large is the Labor Force in Springs?
There are 5,206 People in the Labor Forcein in Springs.
What is the Percentage of People in the Labor Force in Springs?
67.7% of People are in the Labor Force in Springs.
What is the Unemployment Rate in Springs?
Unemployment Rate in Springs is 1.6%.