Quiogue, NY Map & Demographics
Quiogue Map
Quiogue Overview
$73,909
PER CAPITA INCOME
$121,985
AVG FAMILY INCOME
$110,547
AVG HOUSEHOLD INCOME
75.7%
WAGE / INCOME GAP [ % ]
24.3¢/ $1
WAGE / INCOME GAP [ $ ]
0.61
INEQUALITY / GINI INDEX
787
TOTAL POPULATION
390
MALE POPULATION
397
FEMALE POPULATION
98.24
MALES / 100 FEMALES
101.79
FEMALES / 100 MALES
44.8
MEDIAN AGE
3.4
AVG FAMILY SIZE
2.7
AVG HOUSEHOLD SIZE
473
LABOR FORCE [ PEOPLE ]
79.0%
PERCENT IN LABOR FORCE
8.0%
UNEMPLOYMENT RATE
Income in Quiogue
Income Overview in Quiogue
Per Capita Income in Quiogue is $73,909, while median incomes of families and households are $121,985 and $110,547 respectively.
| Characteristic | Number | Measure |
| Per Capita Income | 787 | $73,909 |
| Median Family Income | 193 | $121,985 |
| Mean Family Income | 193 | $254,576 |
| Median Household Income | 295 | $110,547 |
| Mean Household Income | 295 | $193,846 |
| Income Deficit | 193 | $0 |
| Wage / Income Gap (%) | 787 | 75.72% |
| Wage / Income Gap ($) | 787 | 24.28¢ per $1 |
| Gini / Inequality Index | 787 | 0.61 |
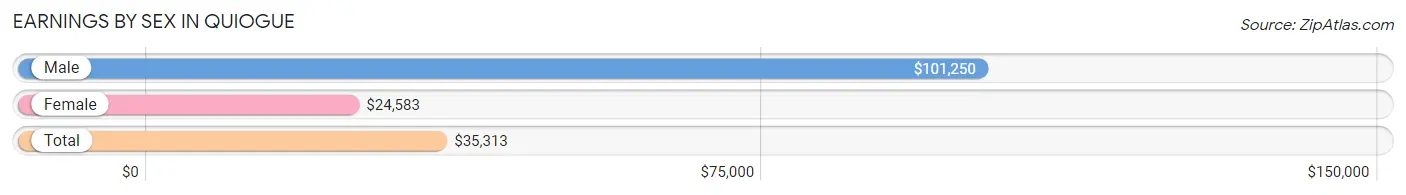
Earnings by Sex in Quiogue
Average Earnings in Quiogue are $35,313, $101,250 for men and $24,583 for women, a difference of 75.7%.
| Sex | Number | Average Earnings |
| Male | 272 (53.7%) | $101,250 |
| Female | 234 (46.3%) | $24,583 |
| Total | 506 (100.0%) | $35,313 |
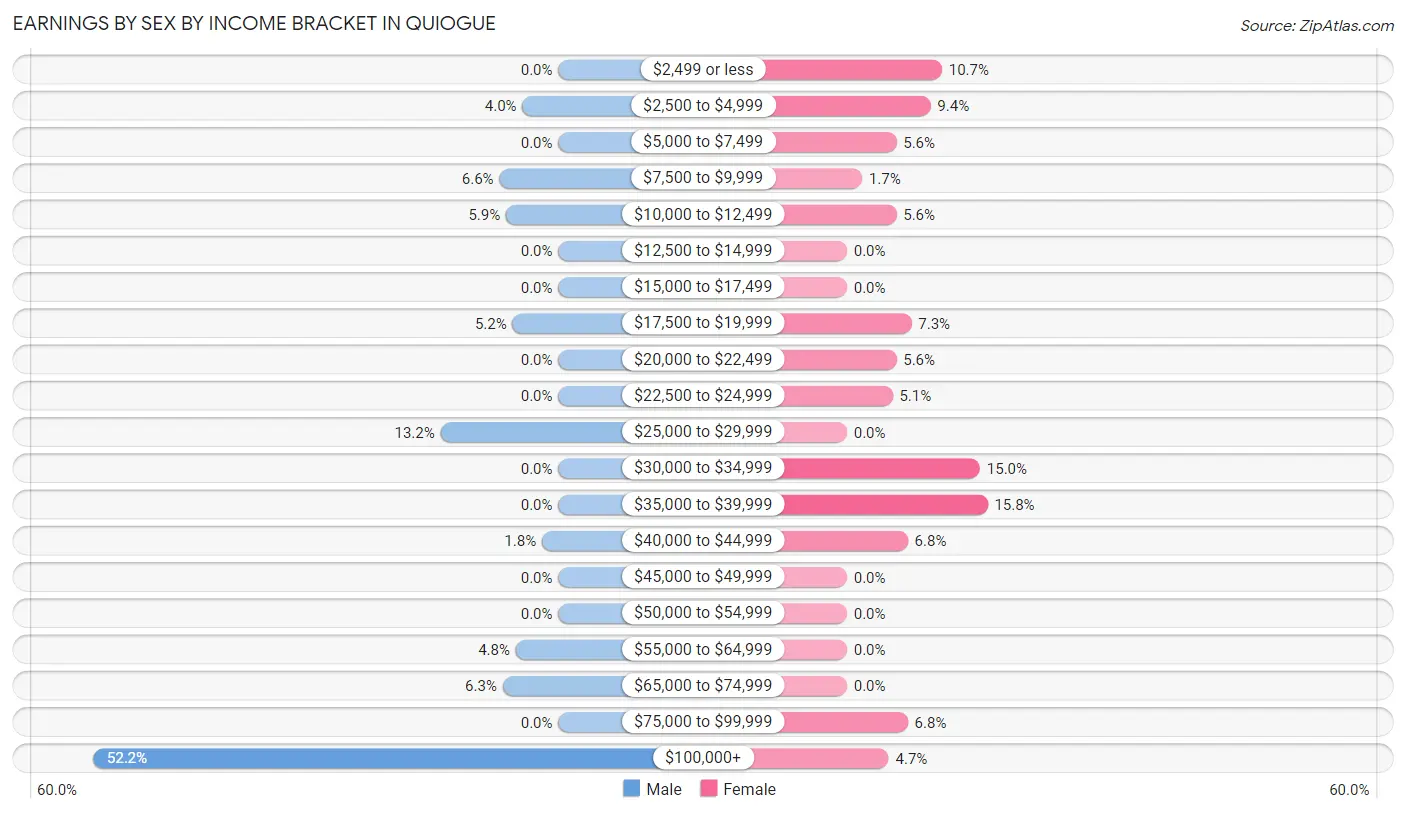
Earnings by Sex by Income Bracket in Quiogue
The most common earnings brackets in Quiogue are $100,000+ for men (142 | 52.2%) and $35,000 to $39,999 for women (37 | 15.8%).
| Income | Male | Female |
| $2,499 or less | 0 (0.0%) | 25 (10.7%) |
| $2,500 to $4,999 | 11 (4.0%) | 22 (9.4%) |
| $5,000 to $7,499 | 0 (0.0%) | 13 (5.6%) |
| $7,500 to $9,999 | 18 (6.6%) | 4 (1.7%) |
| $10,000 to $12,499 | 16 (5.9%) | 13 (5.6%) |
| $12,500 to $14,999 | 0 (0.0%) | 0 (0.0%) |
| $15,000 to $17,499 | 0 (0.0%) | 0 (0.0%) |
| $17,500 to $19,999 | 14 (5.1%) | 17 (7.3%) |
| $20,000 to $22,499 | 0 (0.0%) | 13 (5.6%) |
| $22,500 to $24,999 | 0 (0.0%) | 12 (5.1%) |
| $25,000 to $29,999 | 36 (13.2%) | 0 (0.0%) |
| $30,000 to $34,999 | 0 (0.0%) | 35 (15.0%) |
| $35,000 to $39,999 | 0 (0.0%) | 37 (15.8%) |
| $40,000 to $44,999 | 5 (1.8%) | 16 (6.8%) |
| $45,000 to $49,999 | 0 (0.0%) | 0 (0.0%) |
| $50,000 to $54,999 | 0 (0.0%) | 0 (0.0%) |
| $55,000 to $64,999 | 13 (4.8%) | 0 (0.0%) |
| $65,000 to $74,999 | 17 (6.2%) | 0 (0.0%) |
| $75,000 to $99,999 | 0 (0.0%) | 16 (6.8%) |
| $100,000+ | 142 (52.2%) | 11 (4.7%) |
| Total | 272 (100.0%) | 234 (100.0%) |
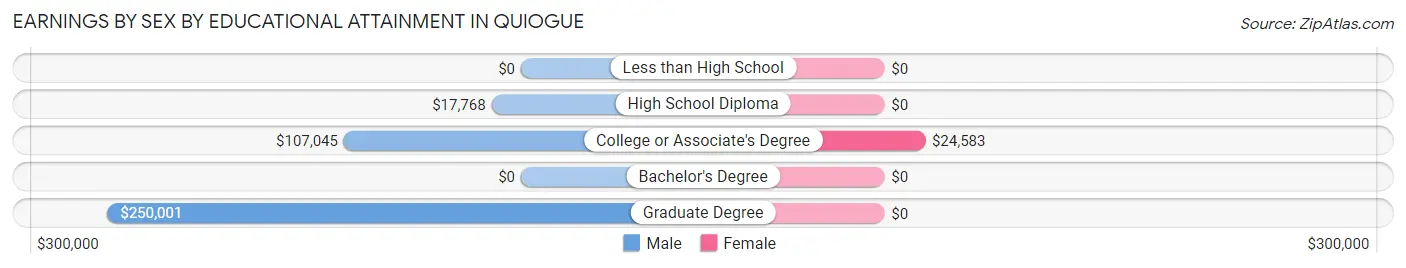
Earnings by Sex by Educational Attainment in Quiogue
Average earnings in Quiogue are $102,396 for men and $30,703 for women, a difference of 70.0%. Men with an educational attainment of graduate degree enjoy the highest average annual earnings of $250,001, while those with high school diploma education earn the least with $17,768. Women with an educational attainment of college or associate's degree earn the most with the average annual earnings of $24,583, while those with college or associate's degree education have the smallest earnings of $24,583.
| Educational Attainment | Male Income | Female Income |
| Less than High School | - | - |
| High School Diploma | $17,768 | $0 |
| College or Associate's Degree | $107,045 | $24,583 |
| Bachelor's Degree | - | - |
| Graduate Degree | $250,001 | $0 |
| Total | $102,396 | $30,703 |
Family Income in Quiogue
Family Income Brackets in Quiogue
According to the Quiogue family income data, there are 42 families falling into the $150,000 to $199,999 income range, which is the most common income bracket and makes up 21.8% of all families.
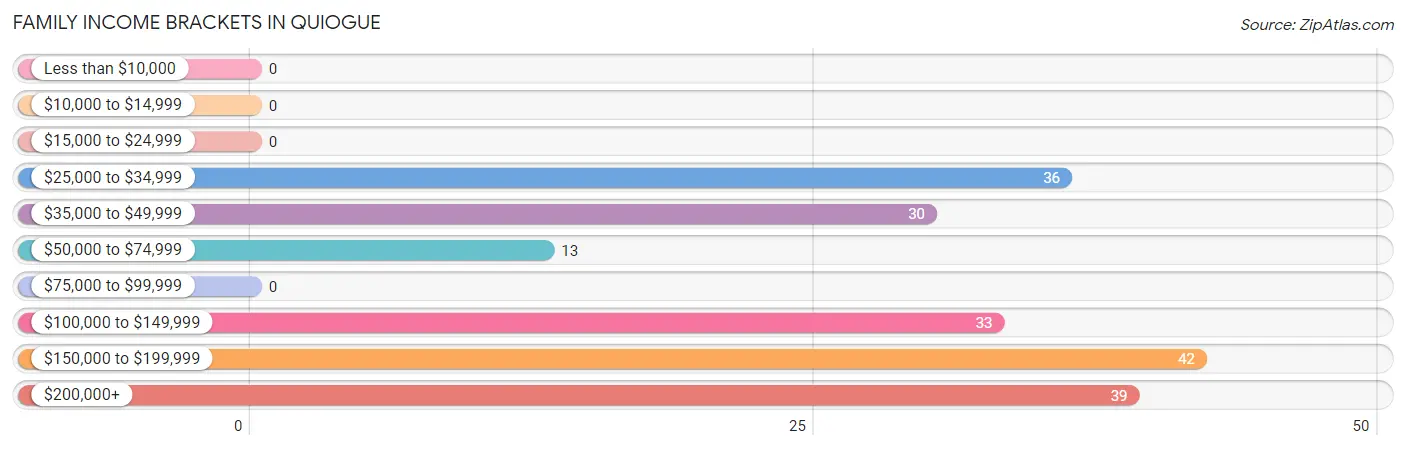
| Income Bracket | # Families | % Families |
| Less than $10,000 | 0 | 0.0% |
| $10,000 to $14,999 | 0 | 0.0% |
| $15,000 to $24,999 | 0 | 0.0% |
| $25,000 to $34,999 | 36 | 18.7% |
| $35,000 to $49,999 | 30 | 15.5% |
| $50,000 to $74,999 | 13 | 6.7% |
| $75,000 to $99,999 | 0 | 0.0% |
| $100,000 to $149,999 | 33 | 17.1% |
| $150,000 to $199,999 | 42 | 21.8% |
| $200,000+ | 39 | 20.2% |
Family Income by Famaliy Size in Quiogue
4-person families (59 | 30.6%) account for the highest median family income in Quiogue with $186,685 per family, while 4-person families (59 | 30.6%) have the highest median income of $46,671 per family member.
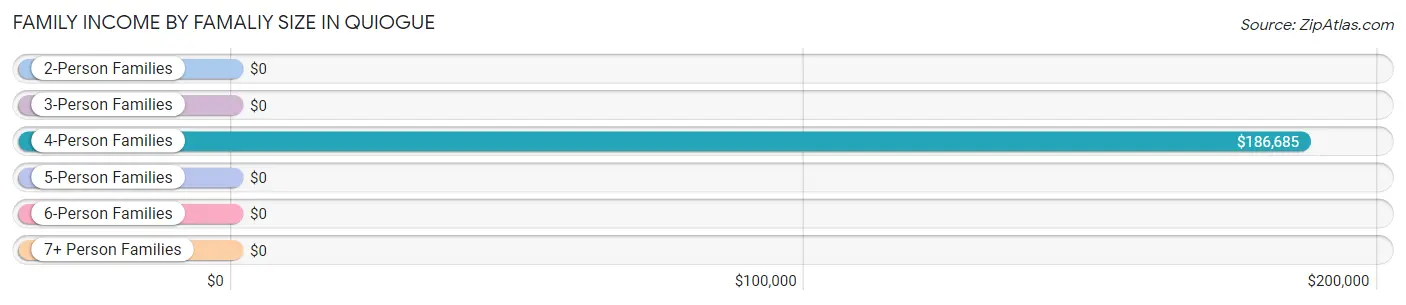
| Income Bracket | # Families | Median Income |
| 2-Person Families | 43 (22.3%) | $0 |
| 3-Person Families | 70 (36.3%) | $0 |
| 4-Person Families | 59 (30.6%) | $186,685 |
| 5-Person Families | 16 (8.3%) | $0 |
| 6-Person Families | 5 (2.6%) | $0 |
| 7+ Person Families | 0 (0.0%) | $0 |
| Total | 193 (100.0%) | $121,985 |
Family Income by Number of Earners in Quiogue
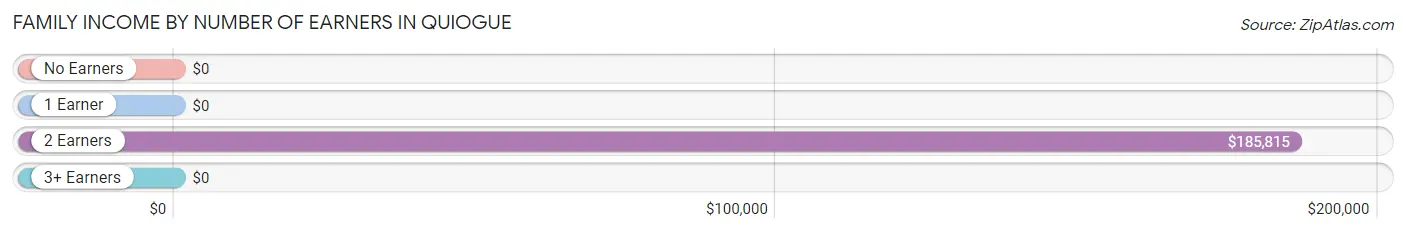
| Number of Earners | # Families | Median Income |
| No Earners | 0 (0.0%) | $0 |
| 1 Earner | 65 (33.7%) | $0 |
| 2 Earners | 75 (38.9%) | $185,815 |
| 3+ Earners | 53 (27.5%) | $0 |
| Total | 193 (100.0%) | $121,985 |
Household Income in Quiogue
Household Income Brackets in Quiogue
With 65 households falling in the category, the $100,000 to $149,999 income range is the most frequent in Quiogue, accounting for 22.0% of all households.
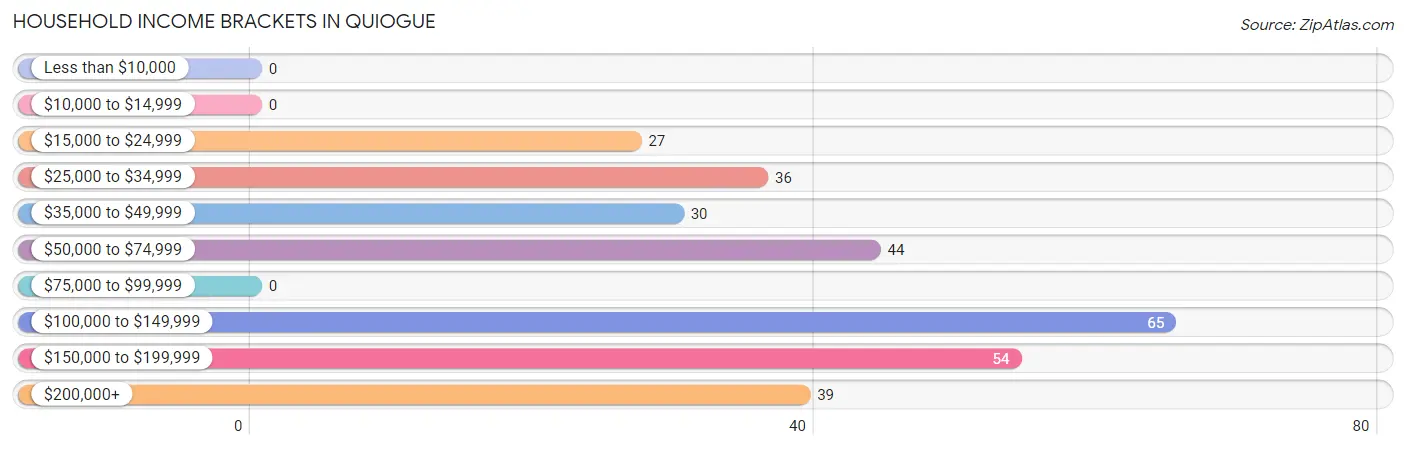
| Income Bracket | # Households | % Households |
| Less than $10,000 | 0 | 0.0% |
| $10,000 to $14,999 | 0 | 0.0% |
| $15,000 to $24,999 | 27 | 9.2% |
| $25,000 to $34,999 | 36 | 12.2% |
| $35,000 to $49,999 | 30 | 10.2% |
| $50,000 to $74,999 | 44 | 14.9% |
| $75,000 to $99,999 | 0 | 0.0% |
| $100,000 to $149,999 | 65 | 22.0% |
| $150,000 to $199,999 | 54 | 18.3% |
| $200,000+ | 39 | 13.2% |
Household Income by Householder Age in Quiogue
The median household income in Quiogue is $110,547, with the highest median household income of $111,449 found in the 45 to 64 years age bracket for the primary householder. A total of 183 households (62.0%) fall into this category.
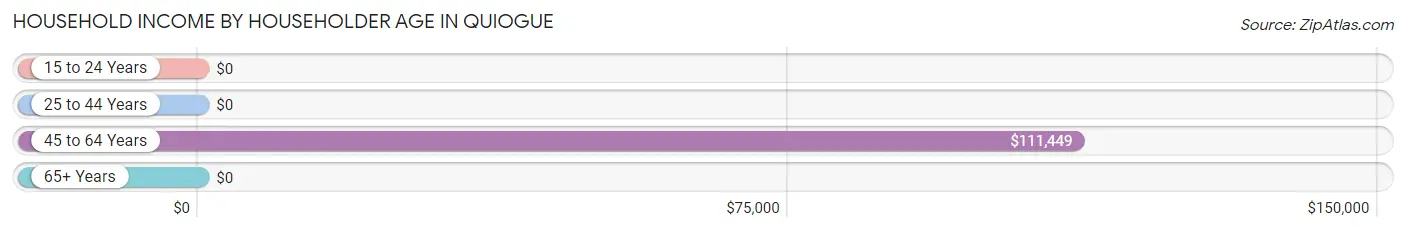
| Income Bracket | # Households | Median Income |
| 15 to 24 Years | 0 (0.0%) | $0 |
| 25 to 44 Years | 48 (16.3%) | $0 |
| 45 to 64 Years | 183 (62.0%) | $111,449 |
| 65+ Years | 64 (21.7%) | $0 |
| Total | 295 (100.0%) | $110,547 |
Poverty in Quiogue
Income Below Poverty by Sex and Age in Quiogue
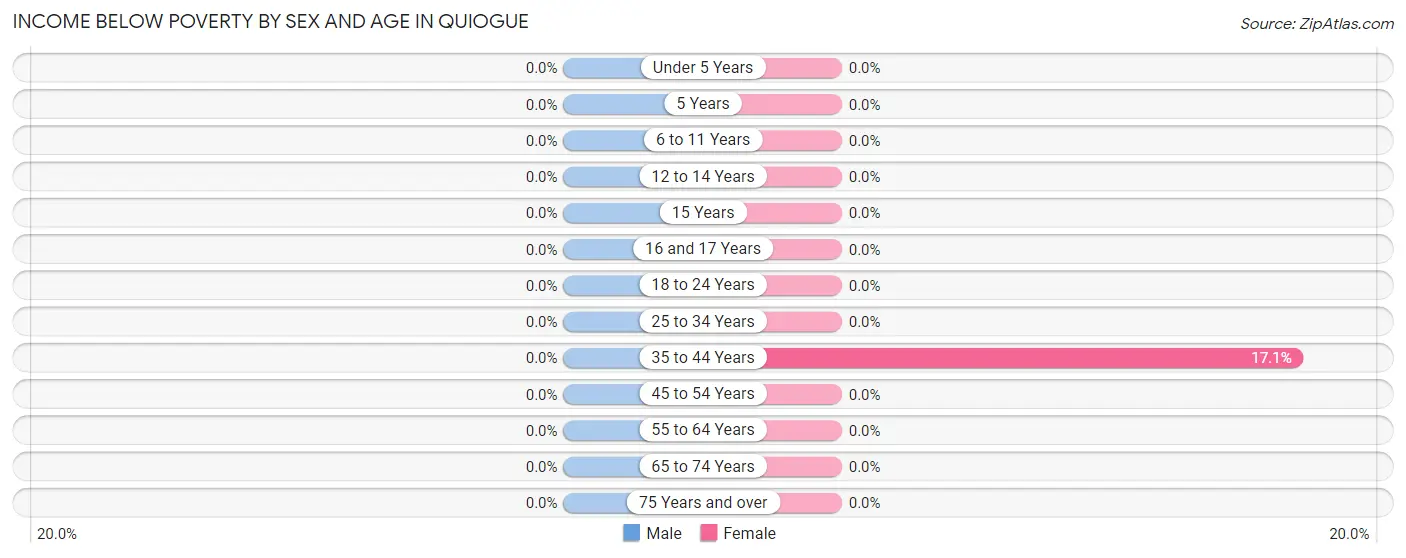
| Age Bracket | Male | Female |
| Under 5 Years | 0 (0.0%) | 0 (0.0%) |
| 5 Years | 0 (0.0%) | 0 (0.0%) |
| 6 to 11 Years | 0 (0.0%) | 0 (0.0%) |
| 12 to 14 Years | 0 (0.0%) | 0 (0.0%) |
| 15 Years | 0 (0.0%) | 0 (0.0%) |
| 16 and 17 Years | 0 (0.0%) | 0 (0.0%) |
| 18 to 24 Years | 0 (0.0%) | 0 (0.0%) |
| 25 to 34 Years | 0 (0.0%) | 0 (0.0%) |
| 35 to 44 Years | 0 (0.0%) | 12 (17.1%) |
| 45 to 54 Years | 0 (0.0%) | 0 (0.0%) |
| 55 to 64 Years | 0 (0.0%) | 0 (0.0%) |
| 65 to 74 Years | 0 (0.0%) | 0 (0.0%) |
| 75 Years and over | 0 (0.0%) | 0 (0.0%) |
| Total | 0 (0.0%) | 12 (3.0%) |
Income Above Poverty by Sex and Age in Quiogue
According to the poverty statistics in Quiogue, males aged 6 to 11 years and females aged under 5 years are the age groups that are most secure financially, with 100.0% of males and 100.0% of females in these age groups living above the poverty line.
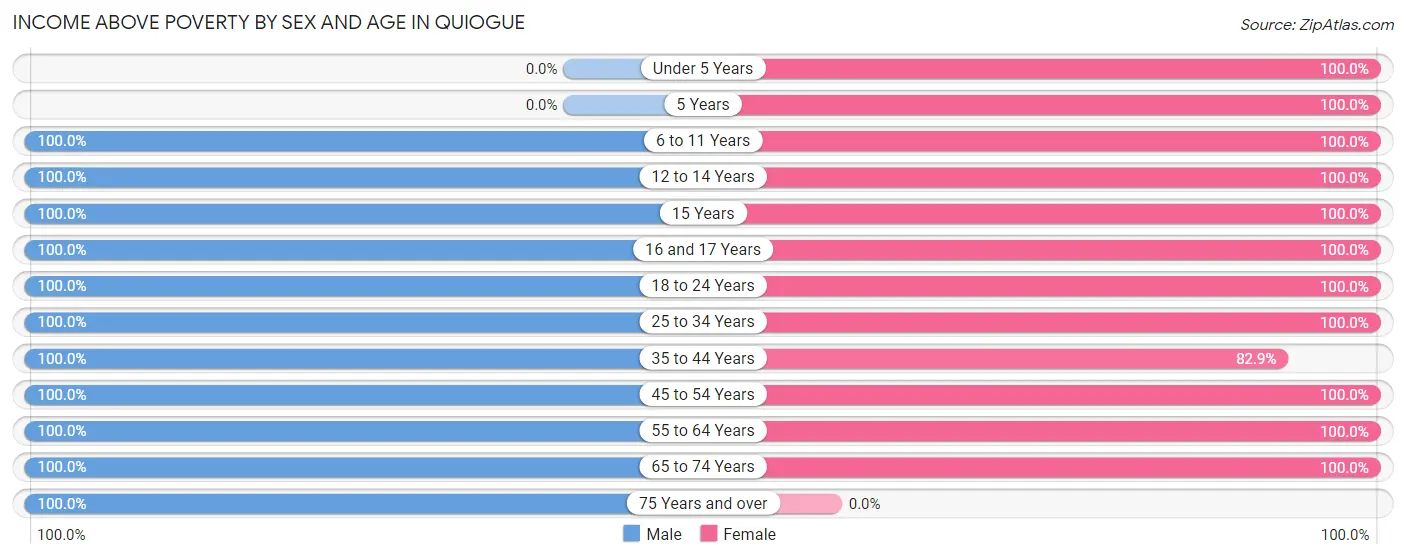
| Age Bracket | Male | Female |
| Under 5 Years | 0 (0.0%) | 9 (100.0%) |
| 5 Years | 0 (0.0%) | 14 (100.0%) |
| 6 to 11 Years | 30 (100.0%) | 58 (100.0%) |
| 12 to 14 Years | 12 (100.0%) | 22 (100.0%) |
| 15 Years | 27 (100.0%) | 16 (100.0%) |
| 16 and 17 Years | 11 (100.0%) | 13 (100.0%) |
| 18 to 24 Years | 16 (100.0%) | 44 (100.0%) |
| 25 to 34 Years | 18 (100.0%) | 13 (100.0%) |
| 35 to 44 Years | 30 (100.0%) | 58 (82.9%) |
| 45 to 54 Years | 141 (100.0%) | 51 (100.0%) |
| 55 to 64 Years | 65 (100.0%) | 46 (100.0%) |
| 65 to 74 Years | 24 (100.0%) | 41 (100.0%) |
| 75 Years and over | 16 (100.0%) | 0 (0.0%) |
| Total | 390 (100.0%) | 385 (97.0%) |
Income Below Poverty Among Married-Couple Families in Quiogue
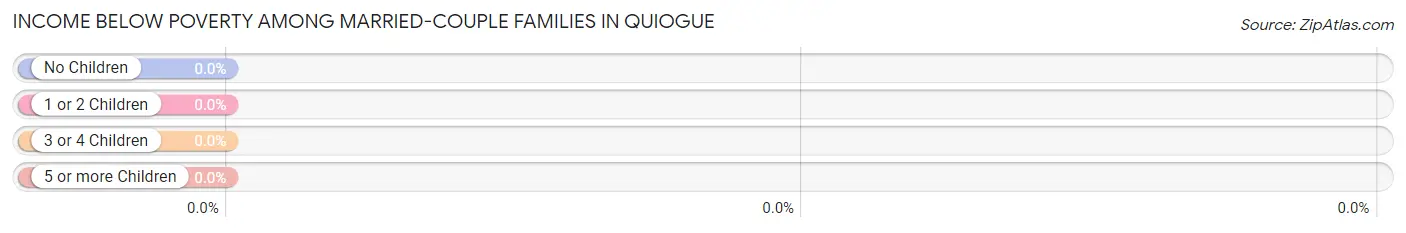
| Children | Above Poverty | Below Poverty |
| No Children | 66 (100.0%) | 0 (0.0%) |
| 1 or 2 Children | 93 (100.0%) | 0 (0.0%) |
| 3 or 4 Children | 9 (100.0%) | 0 (0.0%) |
| 5 or more Children | 0 (0.0%) | 0 (0.0%) |
| Total | 168 (100.0%) | 0 (0.0%) |
Income Below Poverty Among Single-Parent Households in Quiogue
| Children | Single Father | Single Mother |
| No Children | 0 (0.0%) | 0 (0.0%) |
| 1 or 2 Children | 0 (0.0%) | 0 (0.0%) |
| 3 or 4 Children | 0 (0.0%) | 0 (0.0%) |
| 5 or more Children | 0 (0.0%) | 0 (0.0%) |
| Total | 0 (0.0%) | 0 (0.0%) |
Income Below Poverty Among Married-Couple vs Single-Parent Households in Quiogue
| Children | Married-Couple Families | Single-Parent Households |
| No Children | 0 (0.0%) | 0 (0.0%) |
| 1 or 2 Children | 0 (0.0%) | 0 (0.0%) |
| 3 or 4 Children | 0 (0.0%) | 0 (0.0%) |
| 5 or more Children | 0 (0.0%) | 0 (0.0%) |
| Total | 0 (0.0%) | 0 (0.0%) |
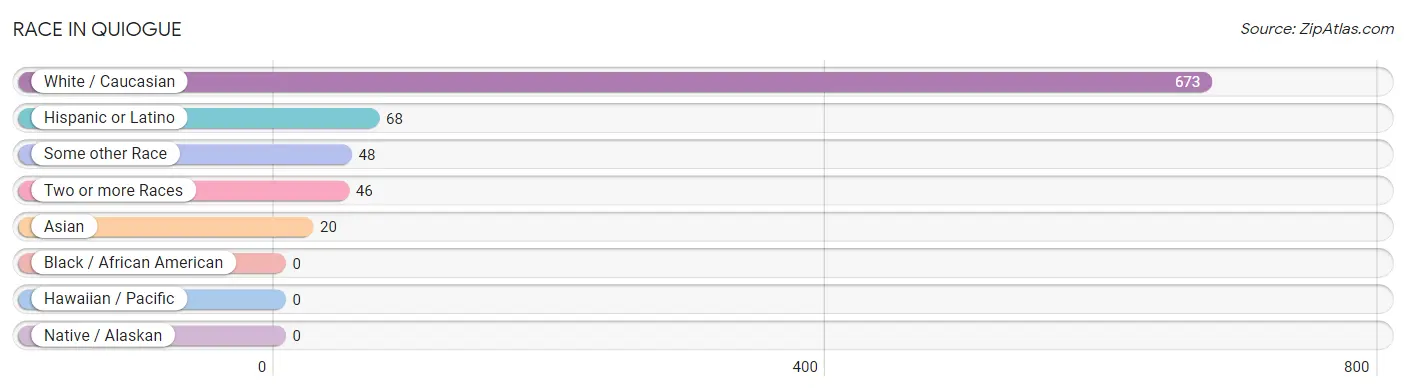
Race in Quiogue
The most populous races in Quiogue are White / Caucasian (673 | 85.5%), Hispanic or Latino (68 | 8.6%), and Some other Race (48 | 6.1%).
| Race | # Population | % Population |
| Asian | 20 | 2.5% |
| Black / African American | 0 | 0.0% |
| Hawaiian / Pacific | 0 | 0.0% |
| Hispanic or Latino | 68 | 8.6% |
| Native / Alaskan | 0 | 0.0% |
| White / Caucasian | 673 | 85.5% |
| Two or more Races | 46 | 5.8% |
| Some other Race | 48 | 6.1% |
| Total | 787 | 100.0% |
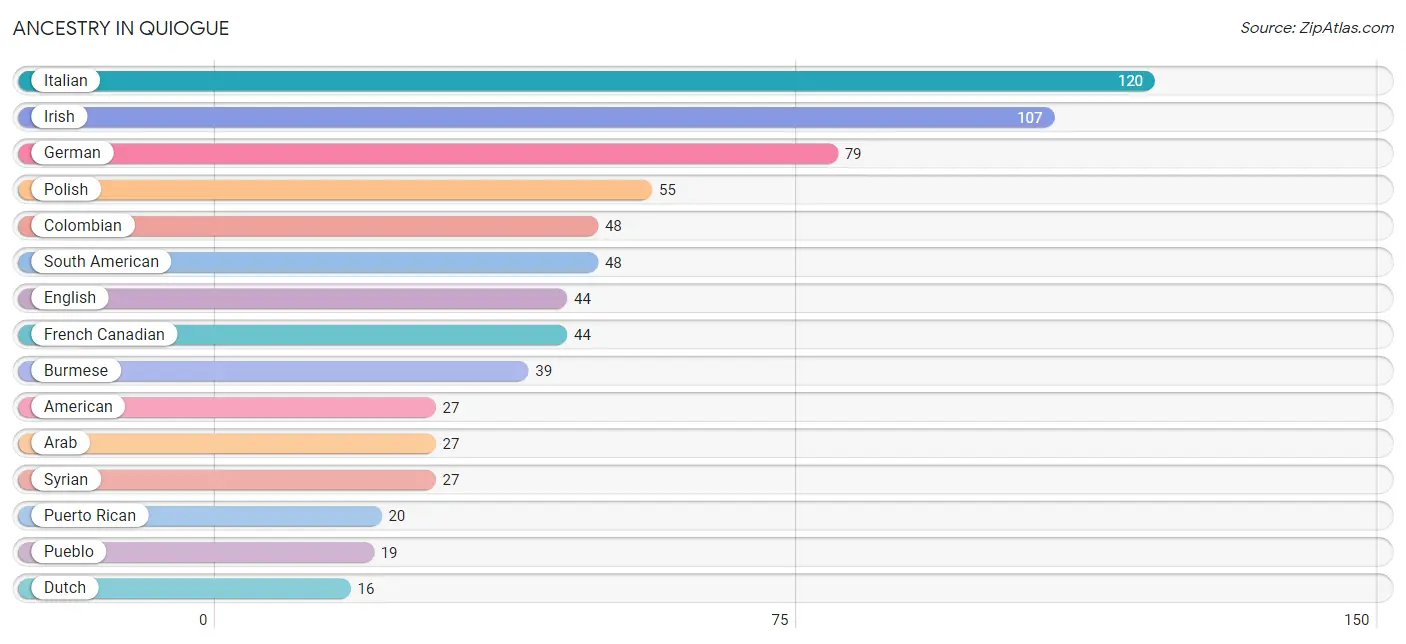
Ancestry in Quiogue
The most populous ancestries reported in Quiogue are Italian (120 | 15.2%), Irish (107 | 13.6%), German (79 | 10.0%), Polish (55 | 7.0%), and Colombian (48 | 6.1%), together accounting for 52.0% of all Quiogue residents.
| Ancestry | # Population | % Population |
| American | 27 | 3.4% |
| Arab | 27 | 3.4% |
| Armenian | 13 | 1.7% |
| British | 4 | 0.5% |
| Burmese | 39 | 5.0% |
| Colombian | 48 | 6.1% |
| Dutch | 16 | 2.0% |
| English | 44 | 5.6% |
| European | 15 | 1.9% |
| French Canadian | 44 | 5.6% |
| German | 79 | 10.0% |
| Indian (Asian) | 8 | 1.0% |
| Irish | 107 | 13.6% |
| Italian | 120 | 15.2% |
| Polish | 55 | 7.0% |
| Pueblo | 19 | 2.4% |
| Puerto Rican | 20 | 2.5% |
| Russian | 5 | 0.6% |
| South American | 48 | 6.1% |
| Syrian | 27 | 3.4% | View All 20 Rows |
Immigrants in Quiogue
The most numerous immigrant groups reported in Quiogue came from Colombia (48 | 6.1%), Latin America (48 | 6.1%), South America (48 | 6.1%), Eastern Europe (38 | 4.8%), and Europe (38 | 4.8%), together accounting for 28.0% of all Quiogue residents.
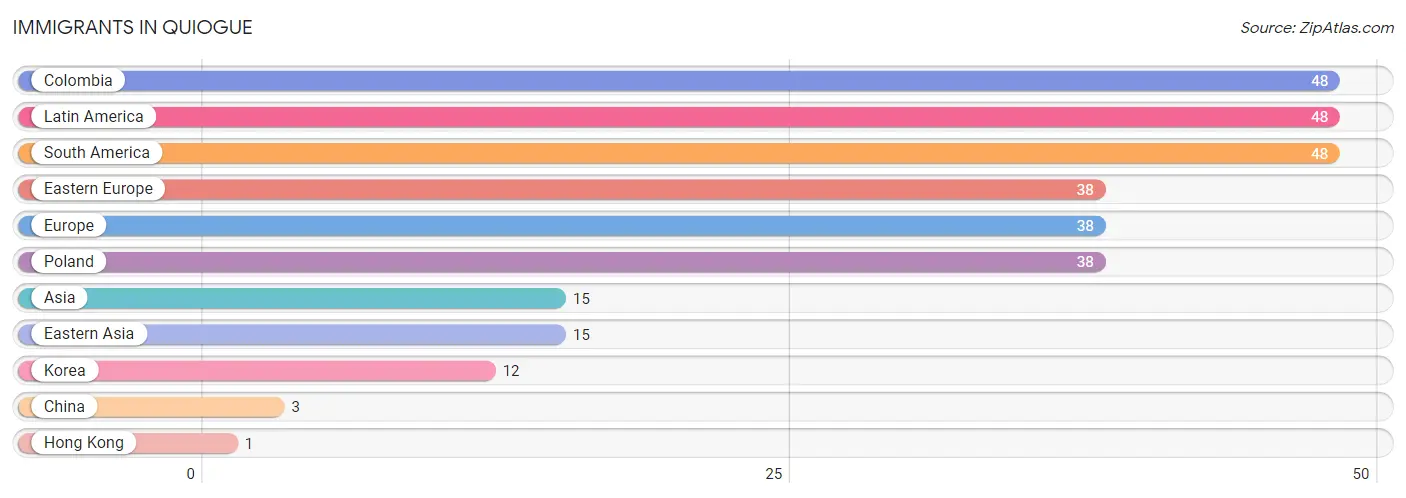
| Immigration Origin | # Population | % Population |
| Asia | 15 | 1.9% |
| China | 3 | 0.4% |
| Colombia | 48 | 6.1% |
| Eastern Asia | 15 | 1.9% |
| Eastern Europe | 38 | 4.8% |
| Europe | 38 | 4.8% |
| Hong Kong | 1 | 0.1% |
| Korea | 12 | 1.5% |
| Latin America | 48 | 6.1% |
| Poland | 38 | 4.8% |
| South America | 48 | 6.1% | View All 11 Rows |
Sex and Age in Quiogue
Sex and Age in Quiogue
The most populous age groups in Quiogue are 45 to 49 Years (97 | 24.9%) for men and 40 to 44 Years (60 | 15.1%) for women.
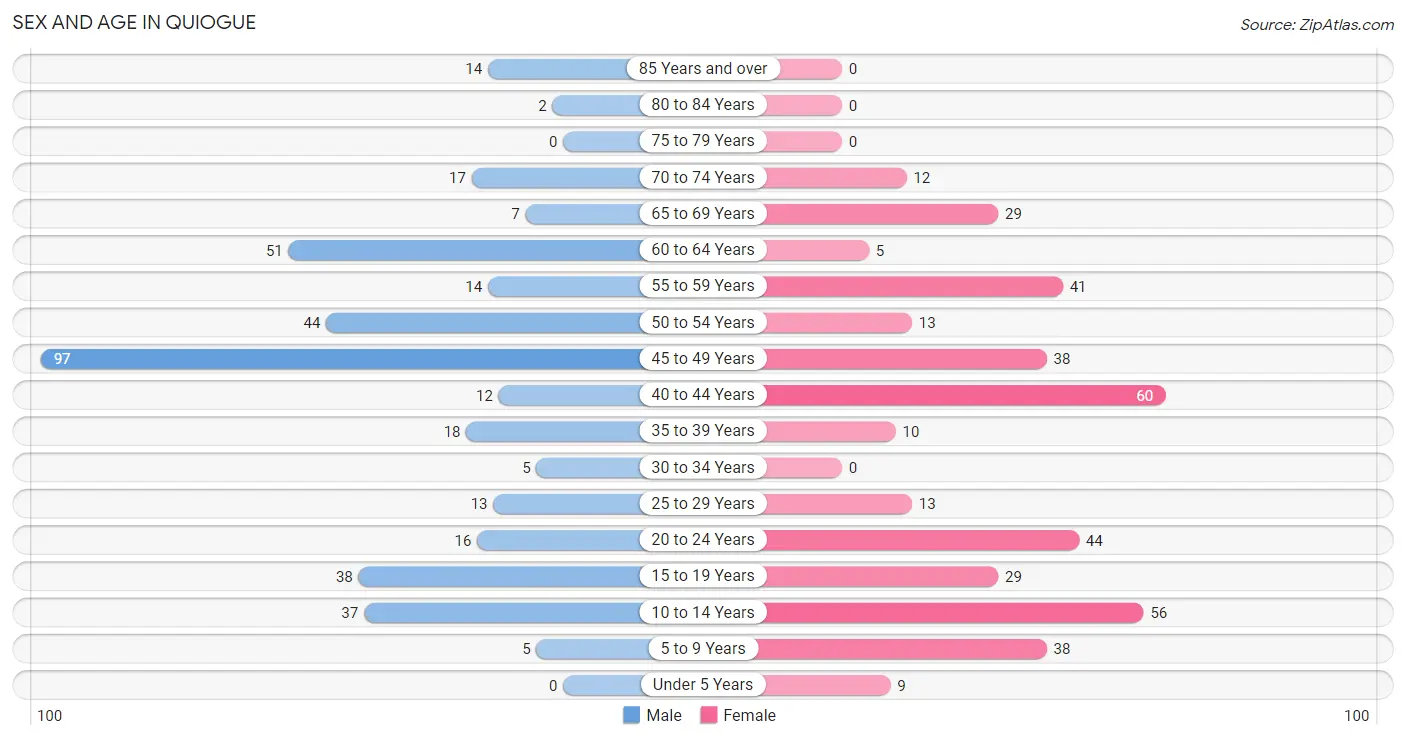
| Age Bracket | Male | Female |
| Under 5 Years | 0 (0.0%) | 9 (2.3%) |
| 5 to 9 Years | 5 (1.3%) | 38 (9.6%) |
| 10 to 14 Years | 37 (9.5%) | 56 (14.1%) |
| 15 to 19 Years | 38 (9.7%) | 29 (7.3%) |
| 20 to 24 Years | 16 (4.1%) | 44 (11.1%) |
| 25 to 29 Years | 13 (3.3%) | 13 (3.3%) |
| 30 to 34 Years | 5 (1.3%) | 0 (0.0%) |
| 35 to 39 Years | 18 (4.6%) | 10 (2.5%) |
| 40 to 44 Years | 12 (3.1%) | 60 (15.1%) |
| 45 to 49 Years | 97 (24.9%) | 38 (9.6%) |
| 50 to 54 Years | 44 (11.3%) | 13 (3.3%) |
| 55 to 59 Years | 14 (3.6%) | 41 (10.3%) |
| 60 to 64 Years | 51 (13.1%) | 5 (1.3%) |
| 65 to 69 Years | 7 (1.8%) | 29 (7.3%) |
| 70 to 74 Years | 17 (4.4%) | 12 (3.0%) |
| 75 to 79 Years | 0 (0.0%) | 0 (0.0%) |
| 80 to 84 Years | 2 (0.5%) | 0 (0.0%) |
| 85 Years and over | 14 (3.6%) | 0 (0.0%) |
| Total | 390 (100.0%) | 397 (100.0%) |
Families and Households in Quiogue
Median Family Size in Quiogue
The median family size in Quiogue is 3.40 persons per family, with single male/father families (12 | 6.2%) accounting for the largest median family size of 5.42 persons per family. On the other hand, married-couple families (168 | 87.1%) represent the smallest median family size with 3.24 persons per family.
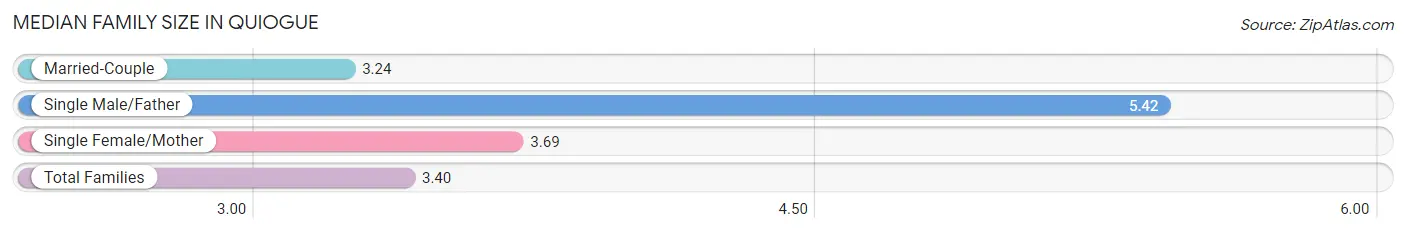
| Family Type | # Families | Family Size |
| Married-Couple | 168 (87.1%) | 3.24 |
| Single Male/Father | 12 (6.2%) | 5.42 |
| Single Female/Mother | 13 (6.7%) | 3.69 |
| Total Families | 193 (100.0%) | 3.40 |
Median Household Size in Quiogue
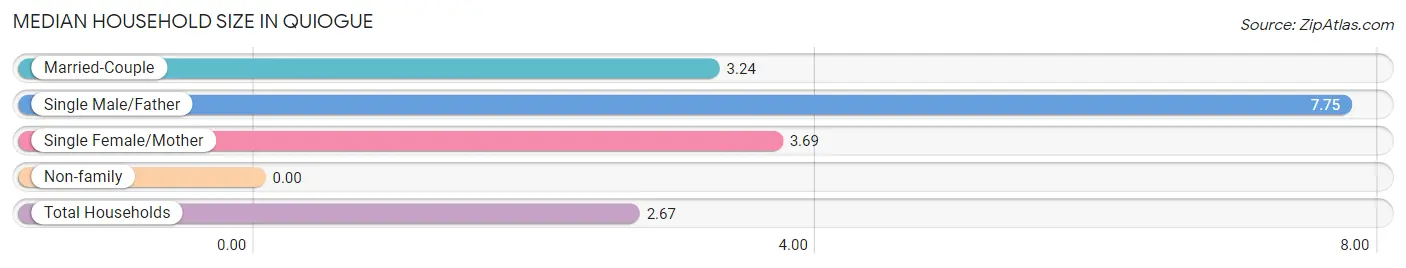
| Household Type | # Households | Household Size |
| Married-Couple | 168 (57.0%) | 3.24 |
| Single Male/Father | 12 (4.1%) | 7.75 |
| Single Female/Mother | 13 (4.4%) | 3.69 |
| Non-family | 102 (34.6%) | - |
| Total Households | 295 (100.0%) | 2.67 |
Household Size by Marriage Status in Quiogue
Out of a total of 295 households in Quiogue, 193 (65.4%) are family households, while 102 (34.6%) are nonfamily households. The most numerous type of family households are 3-person households, comprising 70, and the most common type of nonfamily households are 1-person households, comprising 102.
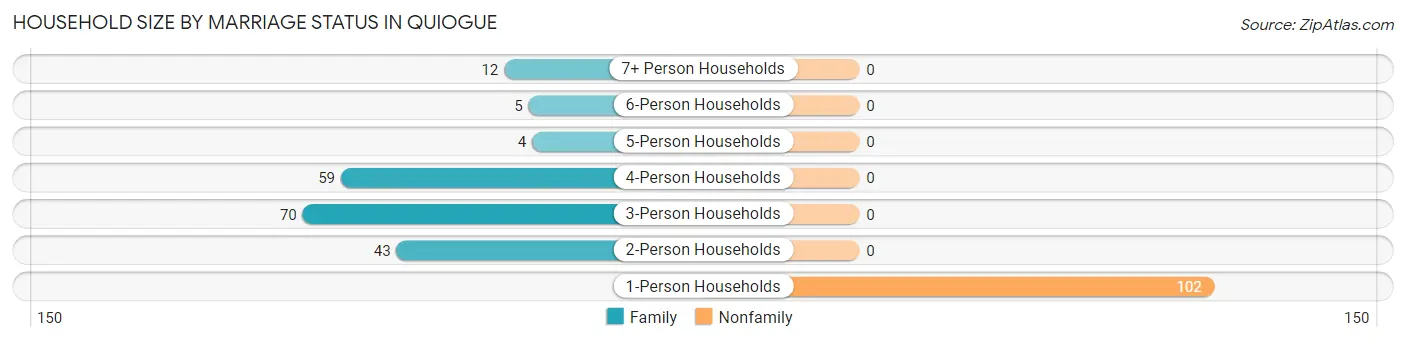
| Household Size | Family Households | Nonfamily Households |
| 1-Person Households | - | 102 (34.6%) |
| 2-Person Households | 43 (14.6%) | 0 (0.0%) |
| 3-Person Households | 70 (23.7%) | 0 (0.0%) |
| 4-Person Households | 59 (20.0%) | 0 (0.0%) |
| 5-Person Households | 4 (1.4%) | 0 (0.0%) |
| 6-Person Households | 5 (1.7%) | 0 (0.0%) |
| 7+ Person Households | 12 (4.1%) | 0 (0.0%) |
| Total | 193 (65.4%) | 102 (34.6%) |
Female Fertility in Quiogue
Fertility by Age in Quiogue
Average fertility rate in Quiogue is 82.0 births per 1,000 women. Women in the age bracket of 20 to 34 years have the highest fertility rate with 281.0 births per 1,000 women. Women in the age bracket of 20 to 34 years acount for 100.0% of all women with births.
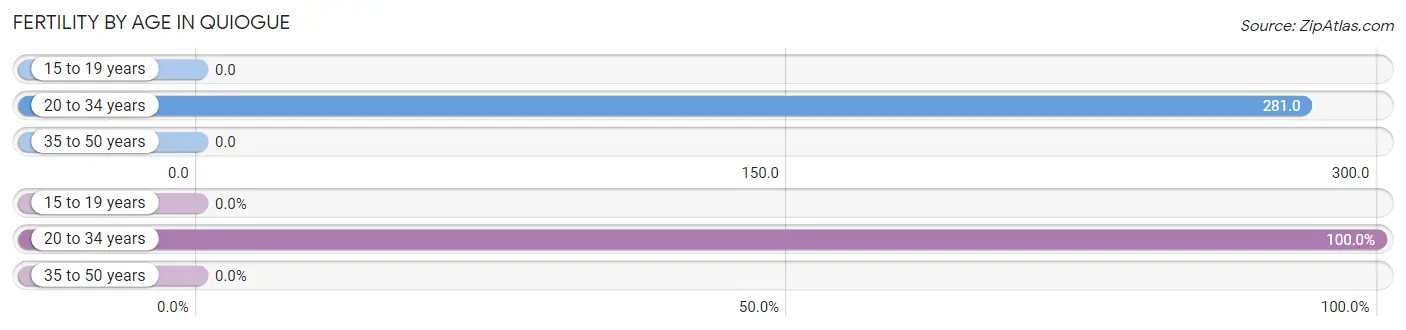
| Age Bracket | Women with Births | Births / 1,000 Women |
| 15 to 19 years | 0 (0.0%) | 0.0 |
| 20 to 34 years | 16 (100.0%) | 281.0 |
| 35 to 50 years | 0 (0.0%) | 0.0 |
| Total | 16 (100.0%) | 82.0 |
Fertility by Age by Marriage Status in Quiogue
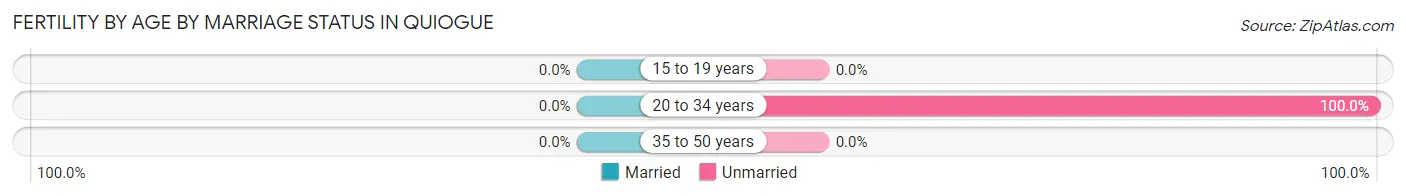
| Age Bracket | Married | Unmarried |
| 15 to 19 years | 0 (0.0%) | 0 (0.0%) |
| 20 to 34 years | 0 (0.0%) | 16 (100.0%) |
| 35 to 50 years | 0 (0.0%) | 0 (0.0%) |
| Total | 0 (0.0%) | 16 (100.0%) |
Fertility by Education in Quiogue
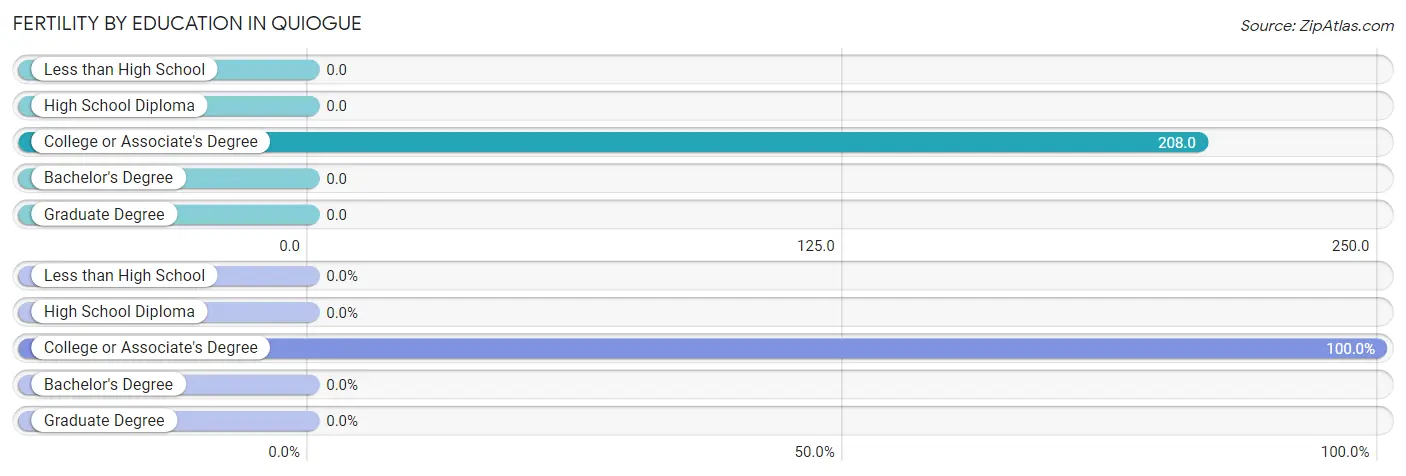
| Educational Attainment | Women with Births | Births / 1,000 Women |
| Less than High School | 0 (0.0%) | 0.0 |
| High School Diploma | 0 (0.0%) | 0.0 |
| College or Associate's Degree | 16 (100.0%) | 208.0 |
| Bachelor's Degree | 0 (0.0%) | 0.0 |
| Graduate Degree | 0 (0.0%) | 0.0 |
| Total | 16 (100.0%) | 82.0 |
Fertility by Education by Marriage Status in Quiogue
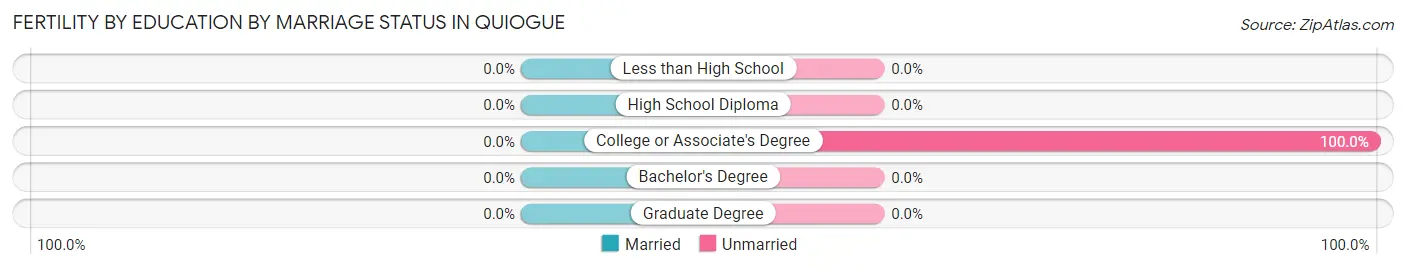
| Educational Attainment | Married | Unmarried |
| Less than High School | 0 (0.0%) | 0 (0.0%) |
| High School Diploma | 0 (0.0%) | 0 (0.0%) |
| College or Associate's Degree | 0 (0.0%) | 16 (100.0%) |
| Bachelor's Degree | 0 (0.0%) | 0 (0.0%) |
| Graduate Degree | 0 (0.0%) | 0 (0.0%) |
| Total | 0 (0.0%) | 16 (100.0%) |
Employment Characteristics in Quiogue
Employment by Class of Employer in Quiogue
Among the 435 employed individuals in Quiogue, private company employees (295 | 67.8%), federal government employees (60 | 13.8%), and local government employees (34 | 7.8%) make up the most common classes of employment.
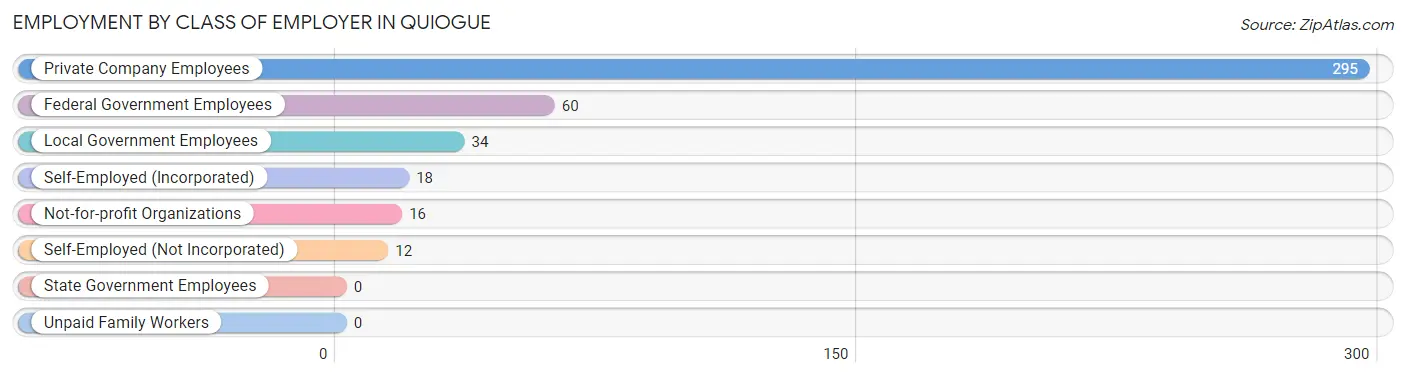
| Employer Class | # Employees | % Employees |
| Private Company Employees | 295 | 67.8% |
| Self-Employed (Incorporated) | 18 | 4.1% |
| Self-Employed (Not Incorporated) | 12 | 2.8% |
| Not-for-profit Organizations | 16 | 3.7% |
| Local Government Employees | 34 | 7.8% |
| State Government Employees | 0 | 0.0% |
| Federal Government Employees | 60 | 13.8% |
| Unpaid Family Workers | 0 | 0.0% |
| Total | 435 | 100.0% |
Employment Status by Age in Quiogue
According to the labor force statistics for Quiogue, out of the total population over 16 years of age (599), 79.0% or 473 individuals are in the labor force, with 8.0% or 38 of them unemployed. The age group with the highest labor force participation rate is 20 to 24 years, with 100.0% or 60 individuals in the labor force. Within the labor force, the 20 to 24 years age range has the highest percentage of unemployed individuals, with 63.3% or 38 of them being unemployed.
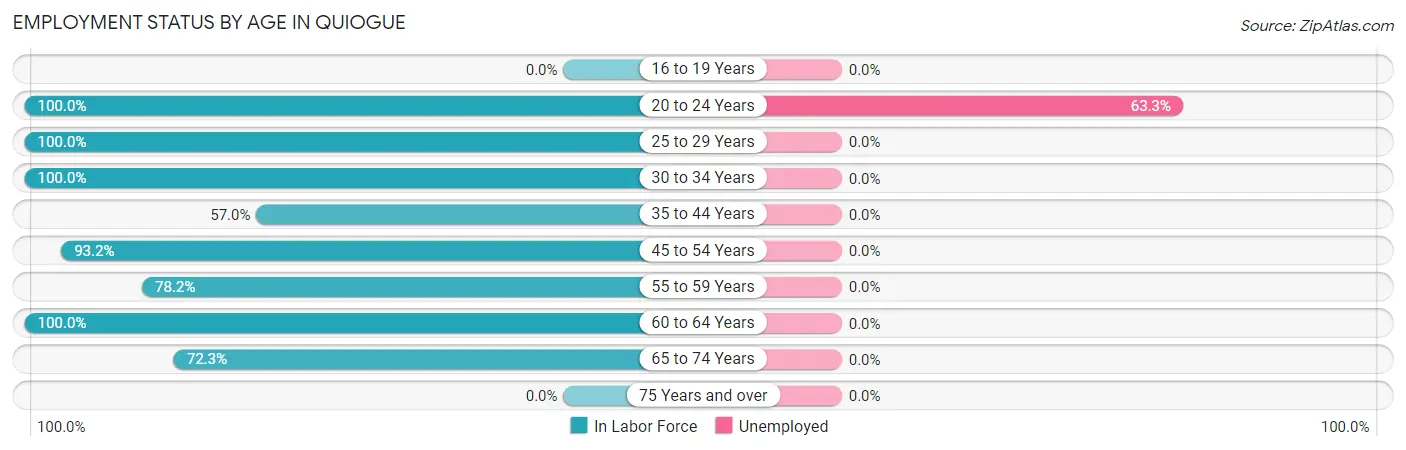
| Age Bracket | In Labor Force | Unemployed |
| 16 to 19 Years | 0 (0.0%) | 0 (0.0%) |
| 20 to 24 Years | 60 (100.0%) | 38 (63.3%) |
| 25 to 29 Years | 26 (100.0%) | 0 (0.0%) |
| 30 to 34 Years | 5 (100.0%) | 0 (0.0%) |
| 35 to 44 Years | 57 (57.0%) | 0 (0.0%) |
| 45 to 54 Years | 179 (93.2%) | 0 (0.0%) |
| 55 to 59 Years | 43 (78.2%) | 0 (0.0%) |
| 60 to 64 Years | 56 (100.0%) | 0 (0.0%) |
| 65 to 74 Years | 47 (72.3%) | 0 (0.0%) |
| 75 Years and over | 0 (0.0%) | 0 (0.0%) |
| Total | 473 (79.0%) | 38 (8.0%) |
Employment Status by Educational Attainment in Quiogue
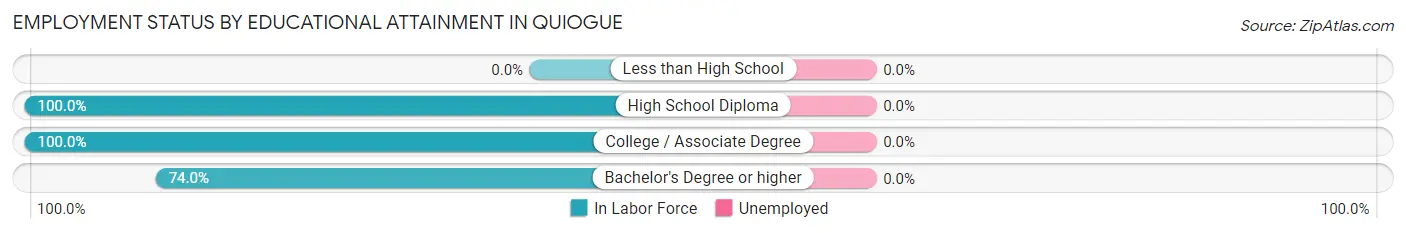
| Educational Attainment | In Labor Force | Unemployed |
| Less than High School | 0 (0.0%) | 0 (0.0%) |
| High School Diploma | 54 (100.0%) | 0 (0.0%) |
| College / Associate Degree | 118 (100.0%) | 0 (0.0%) |
| Bachelor's Degree or higher | 194 (74.0%) | 0 (0.0%) |
| Total | 366 (84.3%) | 0 (0.0%) |
Employment Occupations by Sex in Quiogue
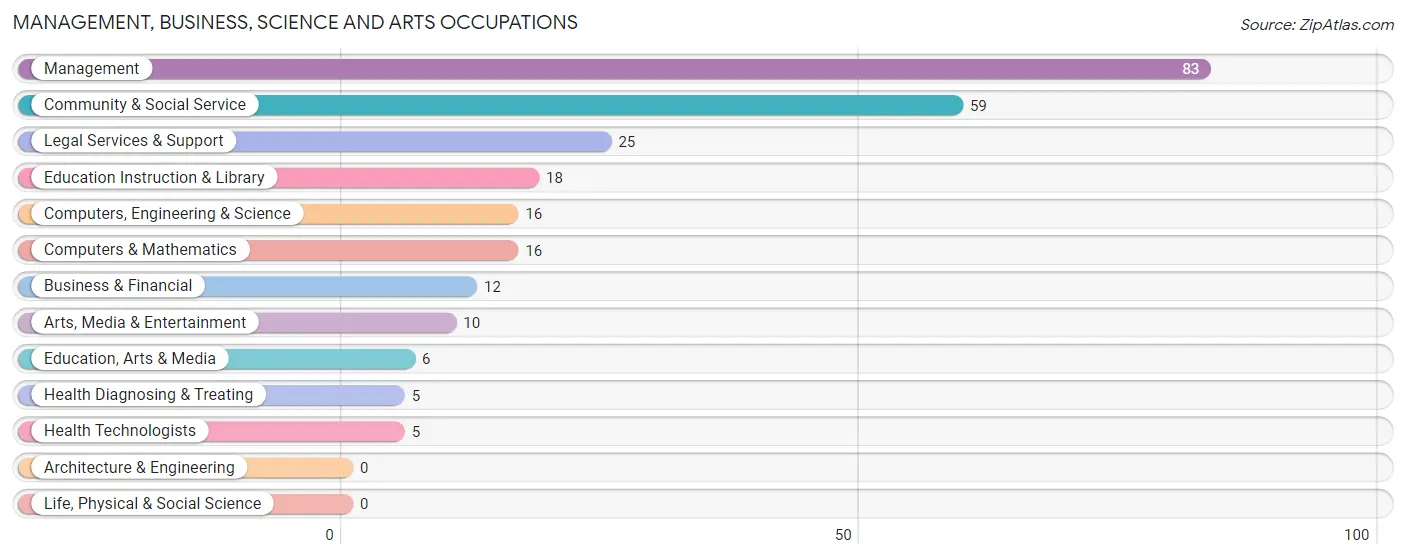
Management, Business, Science and Arts Occupations
The most common Management, Business, Science and Arts occupations in Quiogue are Management (83 | 19.1%), Community & Social Service (59 | 13.6%), Legal Services & Support (25 | 5.8%), Education Instruction & Library (18 | 4.1%), and Computers, Engineering & Science (16 | 3.7%).
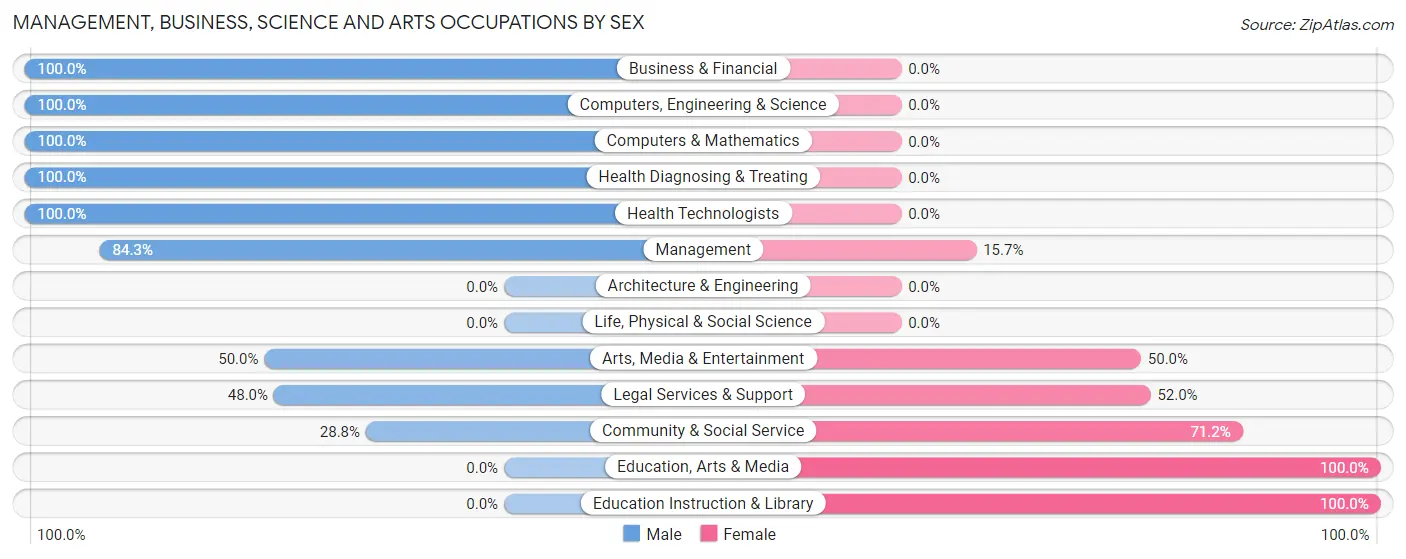
Management, Business, Science and Arts Occupations by Sex
Within the Management, Business, Science and Arts occupations in Quiogue, the most male-oriented occupations are Business & Financial (100.0%), Computers, Engineering & Science (100.0%), and Computers & Mathematics (100.0%), while the most female-oriented occupations are Education, Arts & Media (100.0%), Education Instruction & Library (100.0%), and Community & Social Service (71.2%).
| Occupation | Male | Female |
| Management | 70 (84.3%) | 13 (15.7%) |
| Business & Financial | 12 (100.0%) | 0 (0.0%) |
| Computers, Engineering & Science | 16 (100.0%) | 0 (0.0%) |
| Computers & Mathematics | 16 (100.0%) | 0 (0.0%) |
| Architecture & Engineering | 0 (0.0%) | 0 (0.0%) |
| Life, Physical & Social Science | 0 (0.0%) | 0 (0.0%) |
| Community & Social Service | 17 (28.8%) | 42 (71.2%) |
| Education, Arts & Media | 0 (0.0%) | 6 (100.0%) |
| Legal Services & Support | 12 (48.0%) | 13 (52.0%) |
| Education Instruction & Library | 0 (0.0%) | 18 (100.0%) |
| Arts, Media & Entertainment | 5 (50.0%) | 5 (50.0%) |
| Health Diagnosing & Treating | 5 (100.0%) | 0 (0.0%) |
| Health Technologists | 5 (100.0%) | 0 (0.0%) |
| Total (Category) | 120 (68.6%) | 55 (31.4%) |
| Total (Overall) | 261 (60.0%) | 174 (40.0%) |
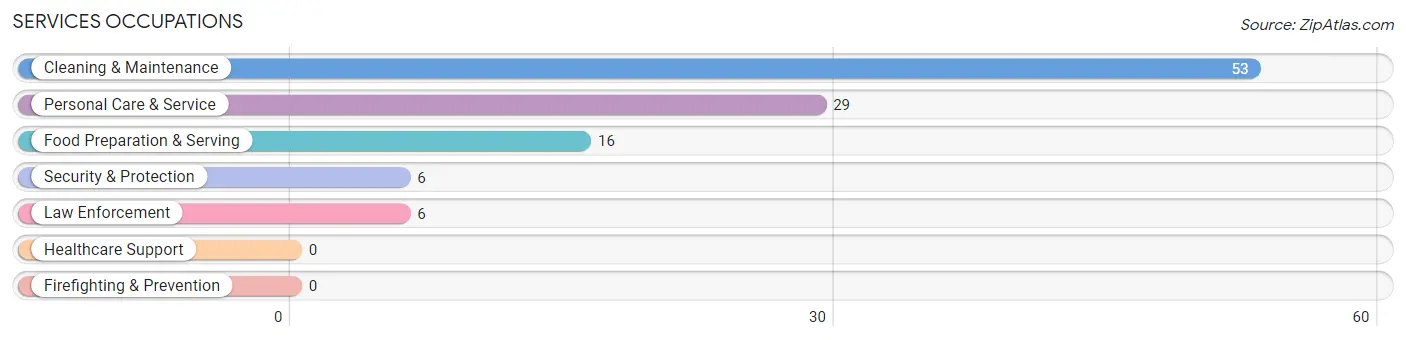
Services Occupations
The most common Services occupations in Quiogue are Cleaning & Maintenance (53 | 12.2%), Personal Care & Service (29 | 6.7%), Food Preparation & Serving (16 | 3.7%), Security & Protection (6 | 1.4%), and Law Enforcement (6 | 1.4%).
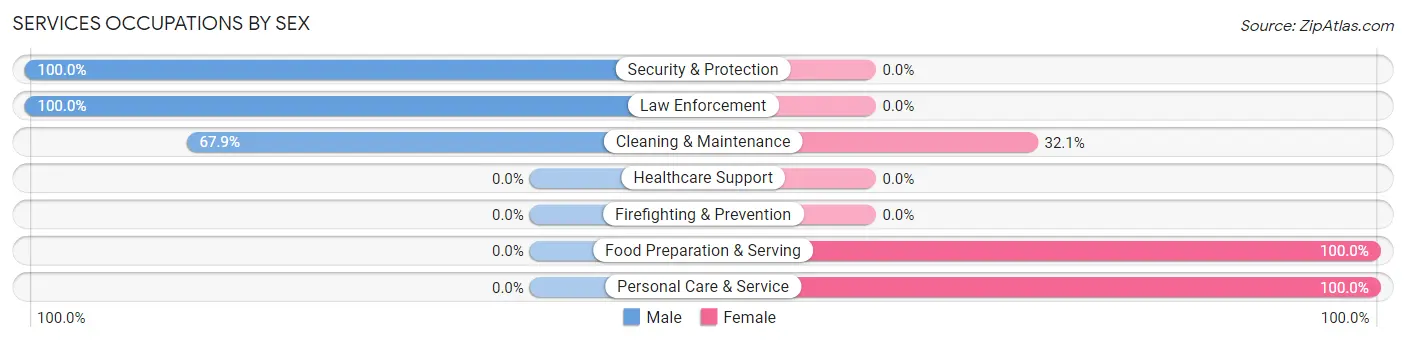
Services Occupations by Sex
Within the Services occupations in Quiogue, the most male-oriented occupations are Security & Protection (100.0%), Law Enforcement (100.0%), and Cleaning & Maintenance (67.9%), while the most female-oriented occupations are Food Preparation & Serving (100.0%), Personal Care & Service (100.0%), and Cleaning & Maintenance (32.1%).
| Occupation | Male | Female |
| Healthcare Support | 0 (0.0%) | 0 (0.0%) |
| Security & Protection | 6 (100.0%) | 0 (0.0%) |
| Firefighting & Prevention | 0 (0.0%) | 0 (0.0%) |
| Law Enforcement | 6 (100.0%) | 0 (0.0%) |
| Food Preparation & Serving | 0 (0.0%) | 16 (100.0%) |
| Cleaning & Maintenance | 36 (67.9%) | 17 (32.1%) |
| Personal Care & Service | 0 (0.0%) | 29 (100.0%) |
| Total (Category) | 42 (40.4%) | 62 (59.6%) |
| Total (Overall) | 261 (60.0%) | 174 (40.0%) |
Sales and Office Occupations
The most common Sales and Office occupations in Quiogue are Office & Administration (53 | 12.2%), and Sales & Related (4 | 0.9%).
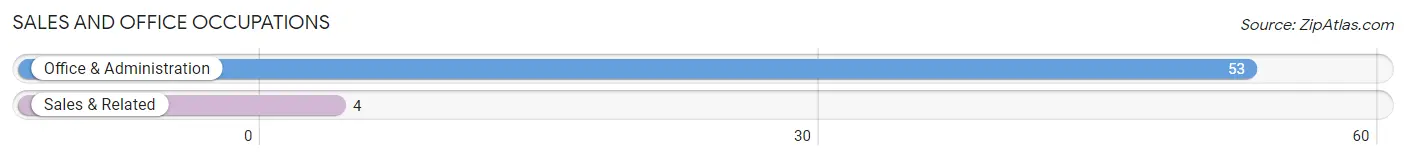
Sales and Office Occupations by Sex
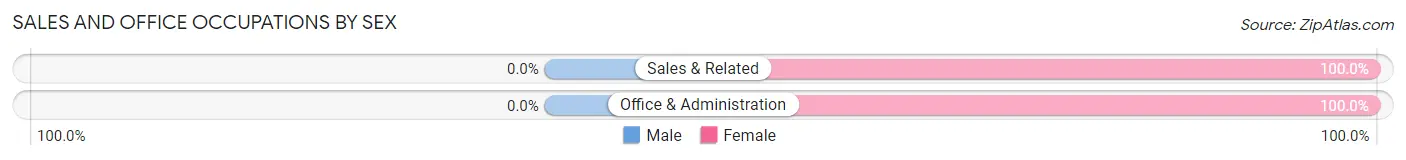
| Occupation | Male | Female |
| Sales & Related | 0 (0.0%) | 4 (100.0%) |
| Office & Administration | 0 (0.0%) | 53 (100.0%) |
| Total (Category) | 0 (0.0%) | 57 (100.0%) |
| Total (Overall) | 261 (60.0%) | 174 (40.0%) |
Natural Resources, Construction and Maintenance Occupations
The most common Natural Resources, Construction and Maintenance occupations in Quiogue are Construction & Extraction (45 | 10.3%), and Installation, Maintenance & Repair (44 | 10.1%).
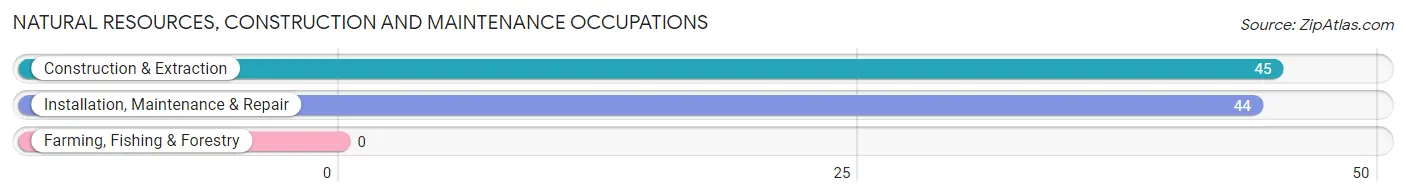
Natural Resources, Construction and Maintenance Occupations by Sex
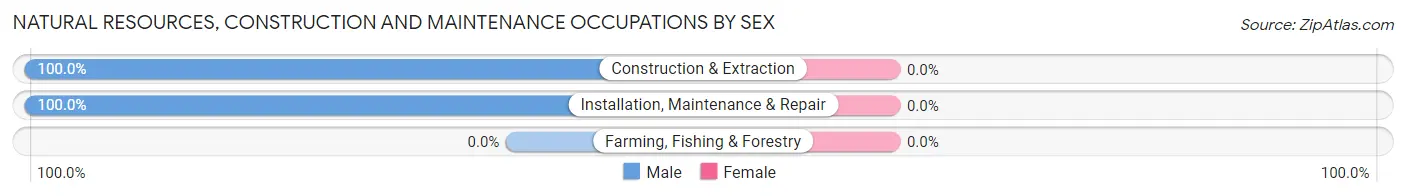
| Occupation | Male | Female |
| Farming, Fishing & Forestry | 0 (0.0%) | 0 (0.0%) |
| Construction & Extraction | 45 (100.0%) | 0 (0.0%) |
| Installation, Maintenance & Repair | 44 (100.0%) | 0 (0.0%) |
| Total (Category) | 89 (100.0%) | 0 (0.0%) |
| Total (Overall) | 261 (60.0%) | 174 (40.0%) |
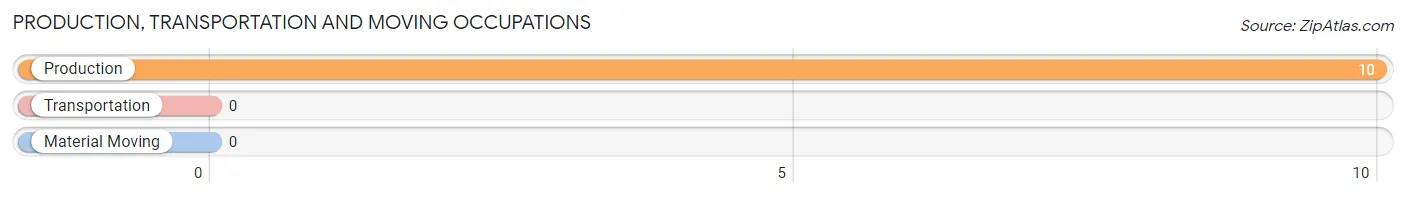
Production, Transportation and Moving Occupations
The most common Production, Transportation and Moving occupations in Quiogue are , and Production (10 | 2.3%).
Production, Transportation and Moving Occupations by Sex
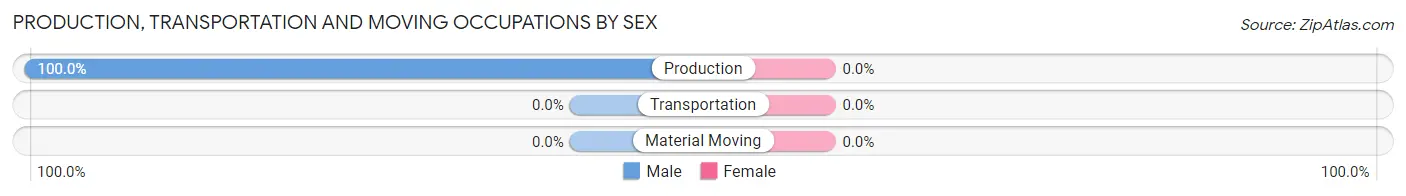
| Occupation | Male | Female |
| Production | 10 (100.0%) | 0 (0.0%) |
| Transportation | 0 (0.0%) | 0 (0.0%) |
| Material Moving | 0 (0.0%) | 0 (0.0%) |
| Total (Category) | 10 (100.0%) | 0 (0.0%) |
| Total (Overall) | 261 (60.0%) | 174 (40.0%) |
Employment Industries by Sex in Quiogue
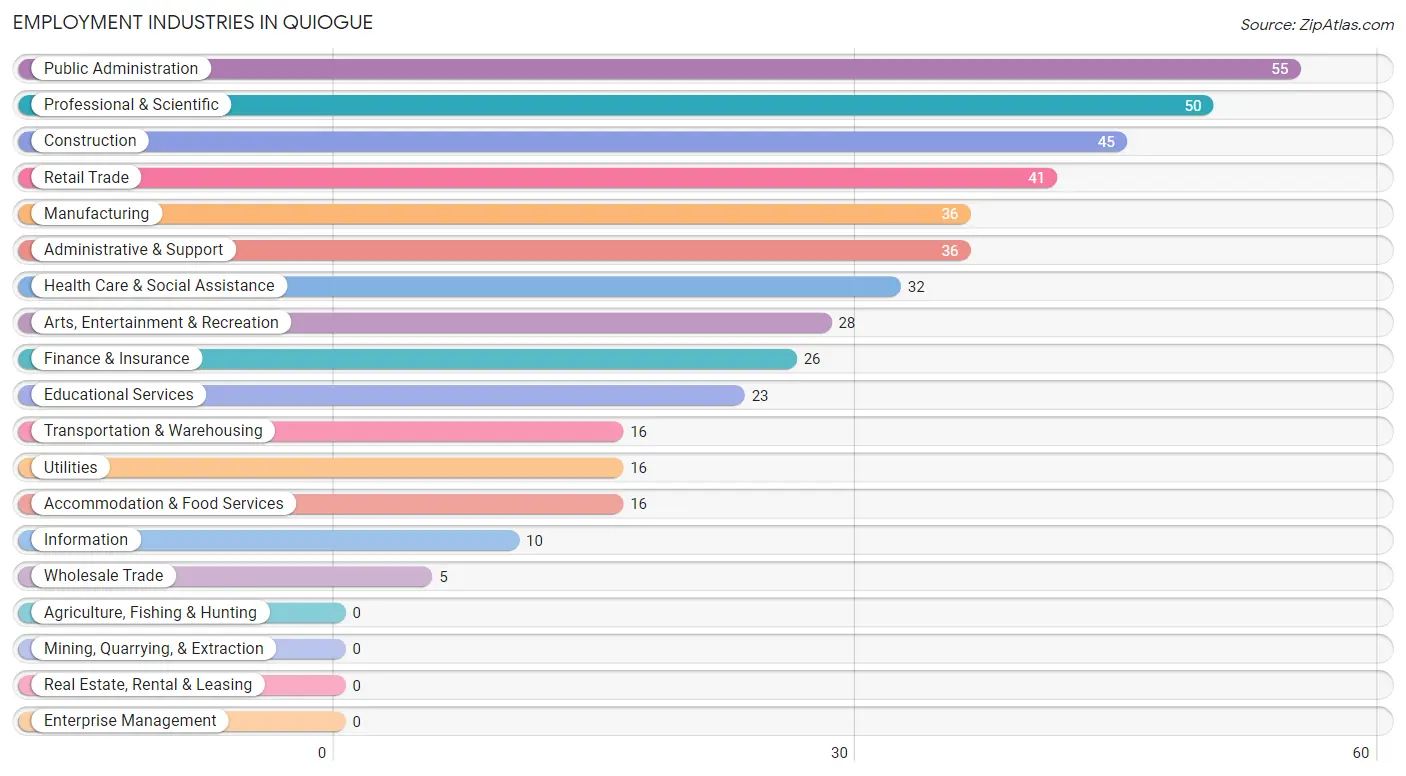
Employment Industries in Quiogue
The major employment industries in Quiogue include Public Administration (55 | 12.6%), Professional & Scientific (50 | 11.5%), Construction (45 | 10.3%), Retail Trade (41 | 9.4%), and Manufacturing (36 | 8.3%).
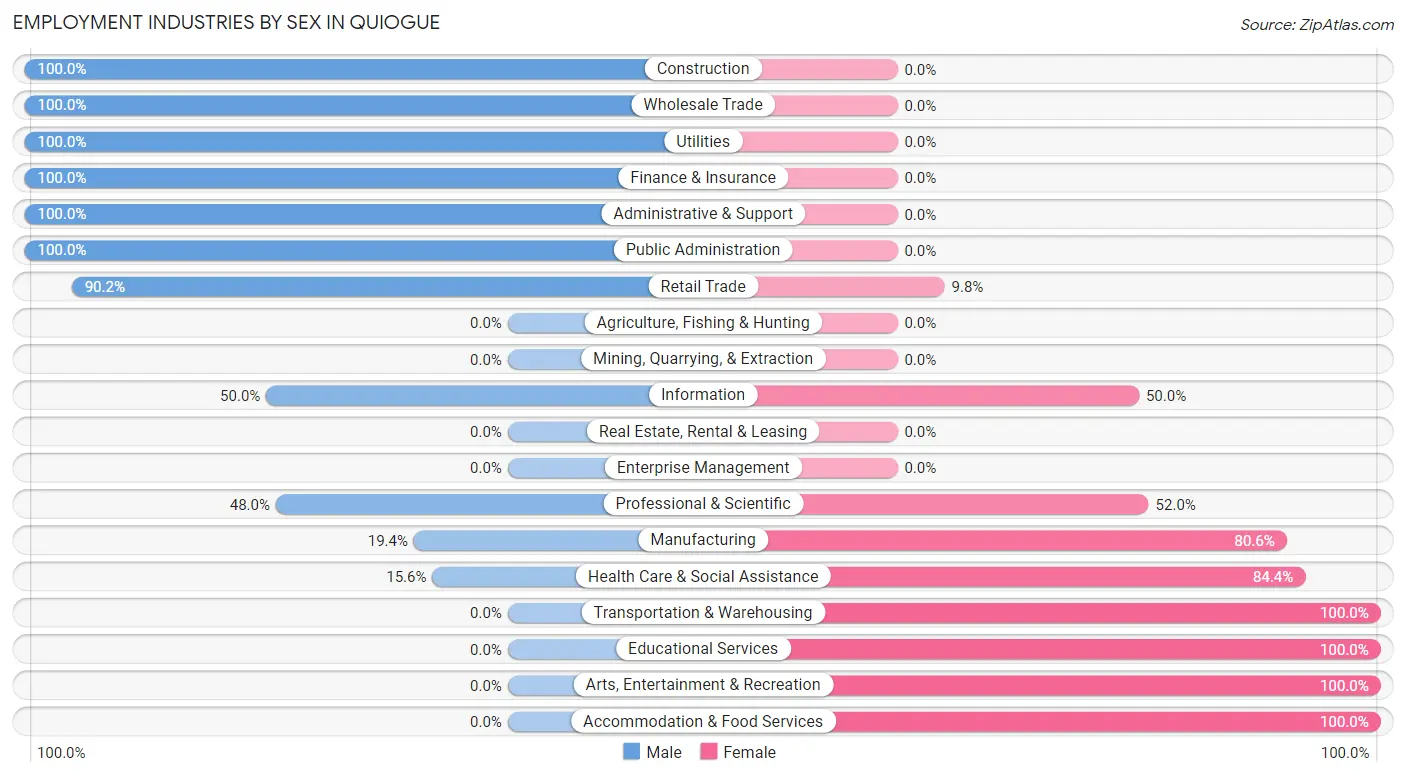
Employment Industries by Sex in Quiogue
The Quiogue industries that see more men than women are Construction (100.0%), Wholesale Trade (100.0%), and Utilities (100.0%), whereas the industries that tend to have a higher number of women are Transportation & Warehousing (100.0%), Educational Services (100.0%), and Arts, Entertainment & Recreation (100.0%).
| Industry | Male | Female |
| Agriculture, Fishing & Hunting | 0 (0.0%) | 0 (0.0%) |
| Mining, Quarrying, & Extraction | 0 (0.0%) | 0 (0.0%) |
| Construction | 45 (100.0%) | 0 (0.0%) |
| Manufacturing | 7 (19.4%) | 29 (80.6%) |
| Wholesale Trade | 5 (100.0%) | 0 (0.0%) |
| Retail Trade | 37 (90.2%) | 4 (9.8%) |
| Transportation & Warehousing | 0 (0.0%) | 16 (100.0%) |
| Utilities | 16 (100.0%) | 0 (0.0%) |
| Information | 5 (50.0%) | 5 (50.0%) |
| Finance & Insurance | 26 (100.0%) | 0 (0.0%) |
| Real Estate, Rental & Leasing | 0 (0.0%) | 0 (0.0%) |
| Professional & Scientific | 24 (48.0%) | 26 (52.0%) |
| Enterprise Management | 0 (0.0%) | 0 (0.0%) |
| Administrative & Support | 36 (100.0%) | 0 (0.0%) |
| Educational Services | 0 (0.0%) | 23 (100.0%) |
| Health Care & Social Assistance | 5 (15.6%) | 27 (84.4%) |
| Arts, Entertainment & Recreation | 0 (0.0%) | 28 (100.0%) |
| Accommodation & Food Services | 0 (0.0%) | 16 (100.0%) |
| Public Administration | 55 (100.0%) | 0 (0.0%) |
| Total | 261 (60.0%) | 174 (40.0%) |
Education in Quiogue
School Enrollment in Quiogue
The most common levels of schooling among the 283 students in Quiogue are middle school (80 | 28.3%), high school (67 | 23.7%), and college / undergraduate (66 | 23.3%).
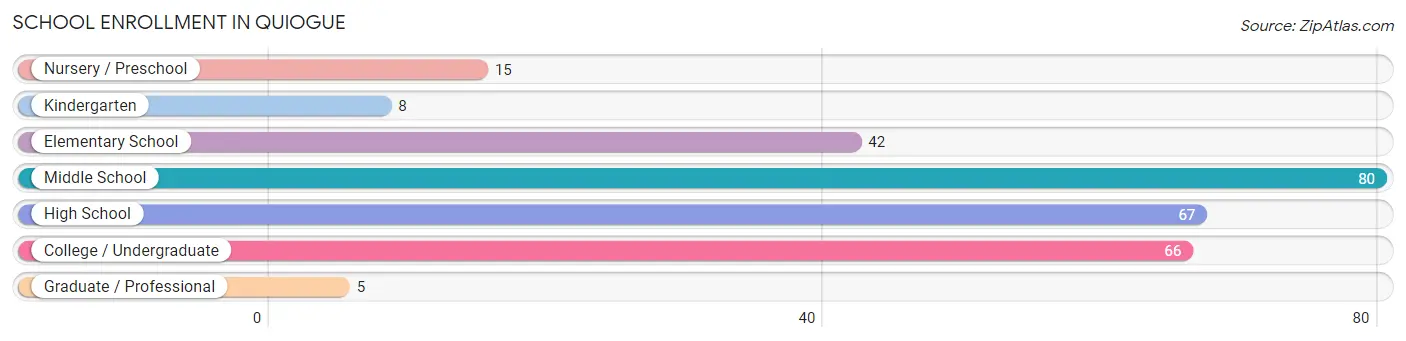
| School Level | # Students | % Students |
| Nursery / Preschool | 15 | 5.3% |
| Kindergarten | 8 | 2.8% |
| Elementary School | 42 | 14.8% |
| Middle School | 80 | 28.3% |
| High School | 67 | 23.7% |
| College / Undergraduate | 66 | 23.3% |
| Graduate / Professional | 5 | 1.8% |
| Total | 283 | 100.0% |
School Enrollment by Age by Funding Source in Quiogue
Out of a total of 283 students who are enrolled in schools in Quiogue, 44 (15.5%) attend a private institution, while the remaining 239 (84.5%) are enrolled in public schools. The age group of 25 to 34 year olds has the highest likelihood of being enrolled in private schools, with 5 (100.0% in the age bracket) enrolled. Conversely, the age group of 3 to 4 year olds has the lowest likelihood of being enrolled in a private school, with 9 (100.0% in the age bracket) attending a public institution.
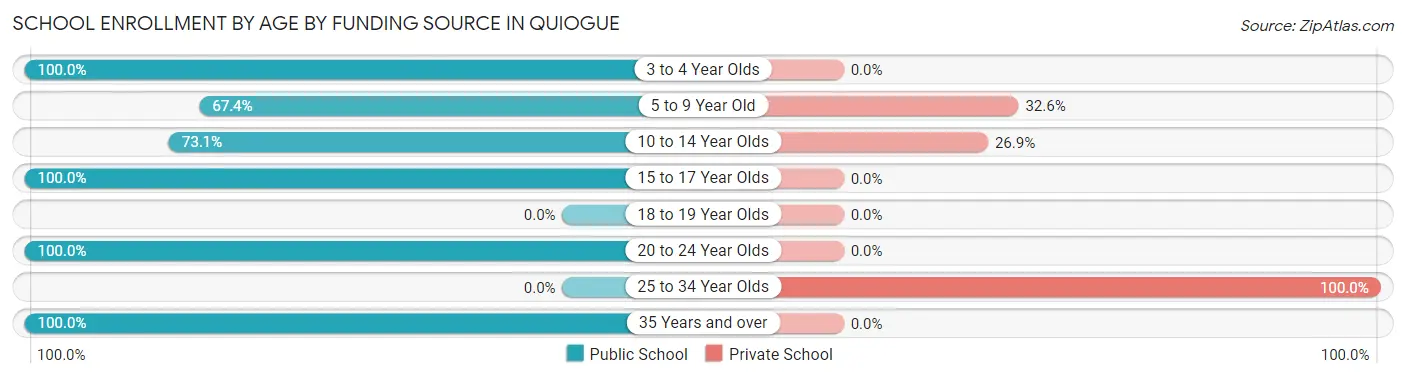
| Age Bracket | Public School | Private School |
| 3 to 4 Year Olds | 9 (100.0%) | 0 (0.0%) |
| 5 to 9 Year Old | 29 (67.4%) | 14 (32.6%) |
| 10 to 14 Year Olds | 68 (73.1%) | 25 (26.9%) |
| 15 to 17 Year Olds | 67 (100.0%) | 0 (0.0%) |
| 18 to 19 Year Olds | 0 (0.0%) | 0 (0.0%) |
| 20 to 24 Year Olds | 22 (100.0%) | 0 (0.0%) |
| 25 to 34 Year Olds | 0 (0.0%) | 5 (100.0%) |
| 35 Years and over | 44 (100.0%) | 0 (0.0%) |
| Total | 239 (84.5%) | 44 (15.5%) |
Educational Attainment by Field of Study in Quiogue
Business (72 | 25.9%), communications (49 | 17.6%), psychology (36 | 13.0%), physical & health sciences (25 | 9.0%), and visual & performing arts (25 | 9.0%) are the most common fields of study among 278 individuals in Quiogue who have obtained a bachelor's degree or higher.
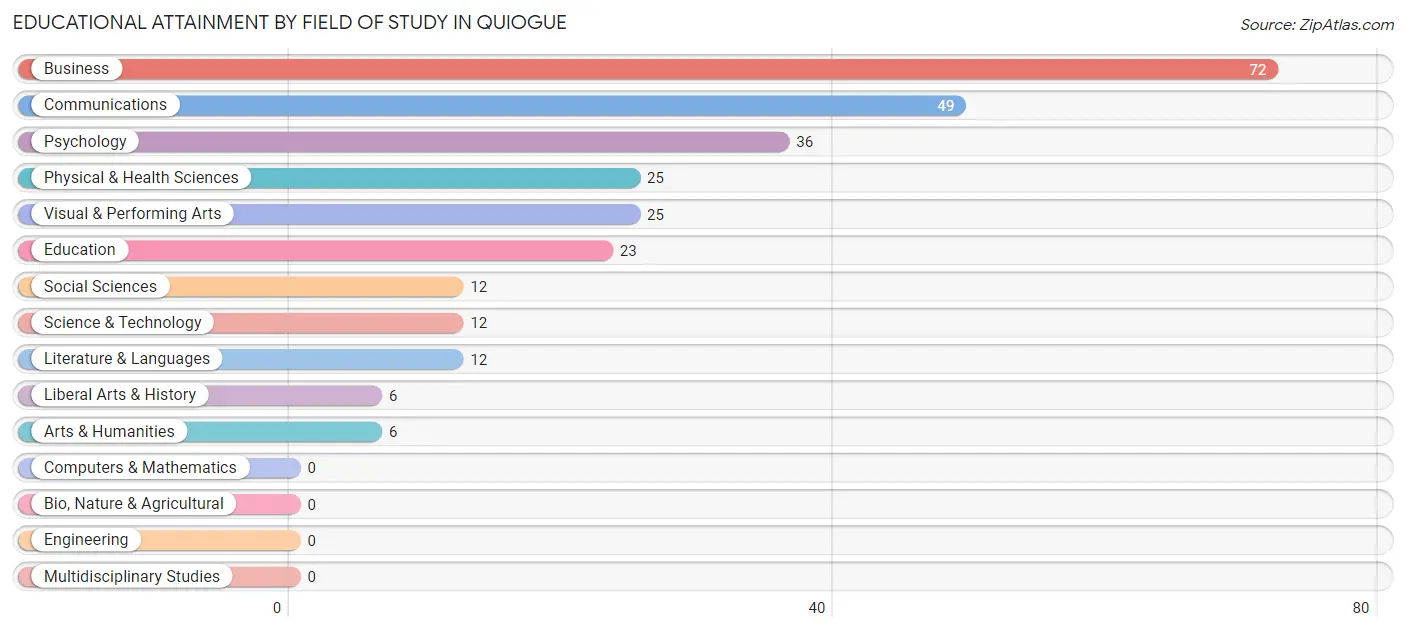
| Field of Study | # Graduates | % Graduates |
| Computers & Mathematics | 0 | 0.0% |
| Bio, Nature & Agricultural | 0 | 0.0% |
| Physical & Health Sciences | 25 | 9.0% |
| Psychology | 36 | 13.0% |
| Social Sciences | 12 | 4.3% |
| Engineering | 0 | 0.0% |
| Multidisciplinary Studies | 0 | 0.0% |
| Science & Technology | 12 | 4.3% |
| Business | 72 | 25.9% |
| Education | 23 | 8.3% |
| Literature & Languages | 12 | 4.3% |
| Liberal Arts & History | 6 | 2.2% |
| Visual & Performing Arts | 25 | 9.0% |
| Communications | 49 | 17.6% |
| Arts & Humanities | 6 | 2.2% |
| Total | 278 | 100.0% |
Transportation & Commute in Quiogue
Vehicle Availability by Sex in Quiogue
The most prevalent vehicle ownership categories in Quiogue are males with 3 vehicles (99, accounting for 37.9%) and females with 3 vehicles (95, making up 56.9%).
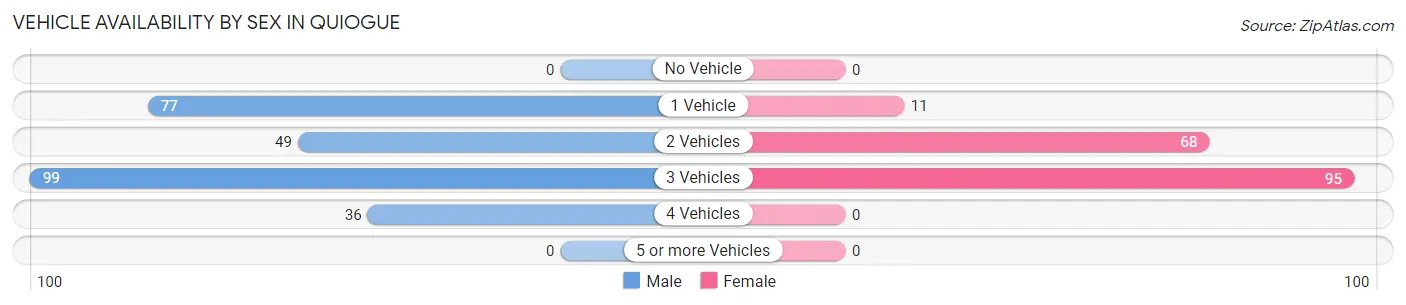
| Vehicles Available | Male | Female |
| No Vehicle | 0 (0.0%) | 0 (0.0%) |
| 1 Vehicle | 77 (29.5%) | 11 (6.3%) |
| 2 Vehicles | 49 (18.8%) | 68 (39.1%) |
| 3 Vehicles | 99 (37.9%) | 95 (54.6%) |
| 4 Vehicles | 36 (13.8%) | 0 (0.0%) |
| 5 or more Vehicles | 0 (0.0%) | 0 (0.0%) |
| Total | 261 (100.0%) | 174 (100.0%) |
Commute Time in Quiogue
The most frequently occuring commute durations in Quiogue are 10 to 14 minutes (96 commuters, 23.6%), 45 to 59 minutes (60 commuters, 14.7%), and less than 5 minutes (47 commuters, 11.6%).
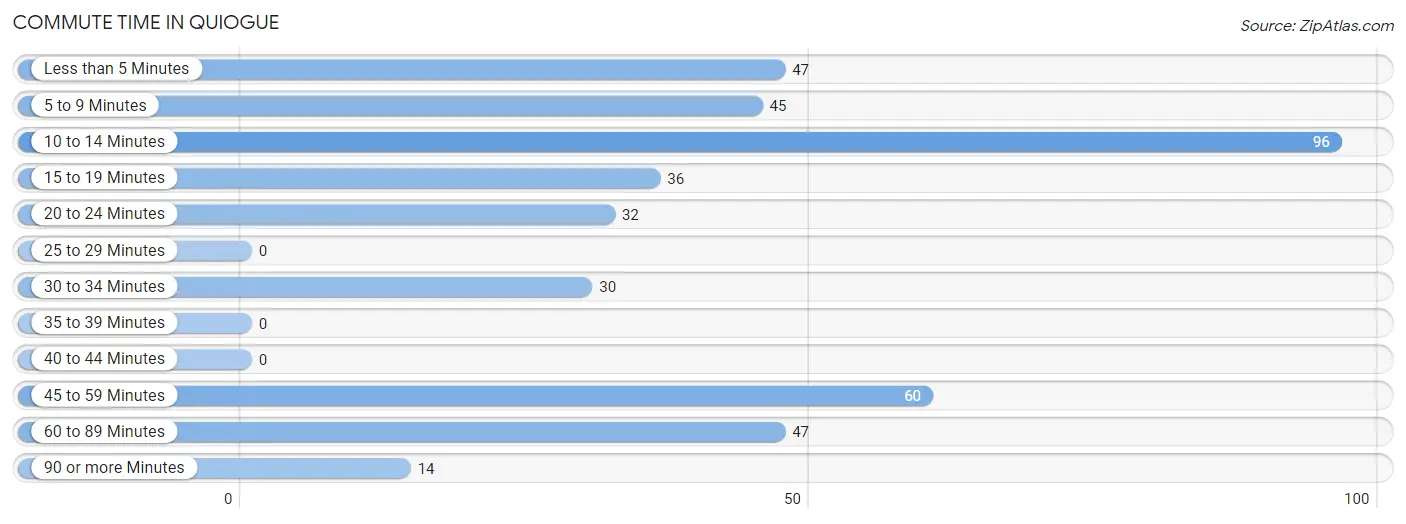
| Commute Time | # Commuters | % Commuters |
| Less than 5 Minutes | 47 | 11.6% |
| 5 to 9 Minutes | 45 | 11.1% |
| 10 to 14 Minutes | 96 | 23.6% |
| 15 to 19 Minutes | 36 | 8.8% |
| 20 to 24 Minutes | 32 | 7.9% |
| 25 to 29 Minutes | 0 | 0.0% |
| 30 to 34 Minutes | 30 | 7.4% |
| 35 to 39 Minutes | 0 | 0.0% |
| 40 to 44 Minutes | 0 | 0.0% |
| 45 to 59 Minutes | 60 | 14.7% |
| 60 to 89 Minutes | 47 | 11.6% |
| 90 or more Minutes | 14 | 3.4% |
Commute Time by Sex in Quiogue
The most common commute times in Quiogue are 10 to 14 minutes (77 commuters, 32.5%) for males and 5 to 9 minutes (45 commuters, 26.5%) for females.
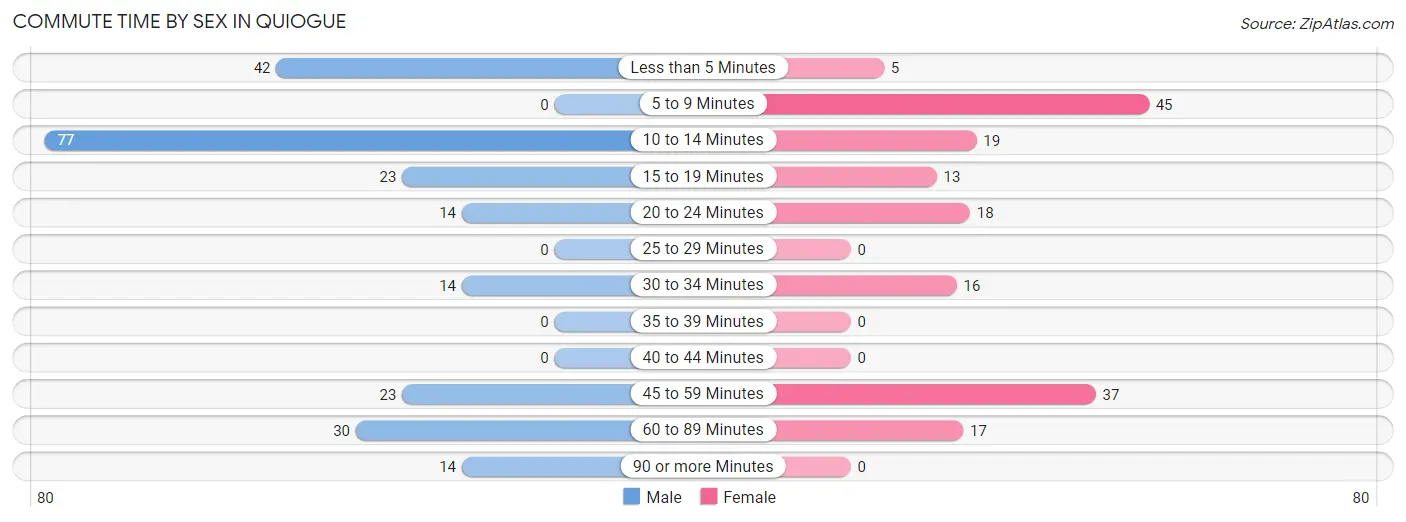
| Commute Time | Male | Female |
| Less than 5 Minutes | 42 (17.7%) | 5 (2.9%) |
| 5 to 9 Minutes | 0 (0.0%) | 45 (26.5%) |
| 10 to 14 Minutes | 77 (32.5%) | 19 (11.2%) |
| 15 to 19 Minutes | 23 (9.7%) | 13 (7.6%) |
| 20 to 24 Minutes | 14 (5.9%) | 18 (10.6%) |
| 25 to 29 Minutes | 0 (0.0%) | 0 (0.0%) |
| 30 to 34 Minutes | 14 (5.9%) | 16 (9.4%) |
| 35 to 39 Minutes | 0 (0.0%) | 0 (0.0%) |
| 40 to 44 Minutes | 0 (0.0%) | 0 (0.0%) |
| 45 to 59 Minutes | 23 (9.7%) | 37 (21.8%) |
| 60 to 89 Minutes | 30 (12.7%) | 17 (10.0%) |
| 90 or more Minutes | 14 (5.9%) | 0 (0.0%) |
Time of Departure to Work by Sex in Quiogue
The most frequent times of departure to work in Quiogue are 7:00 AM to 7:29 AM (118, 49.8%) for males and 9:00 AM to 9:59 AM (45, 26.5%) for females.
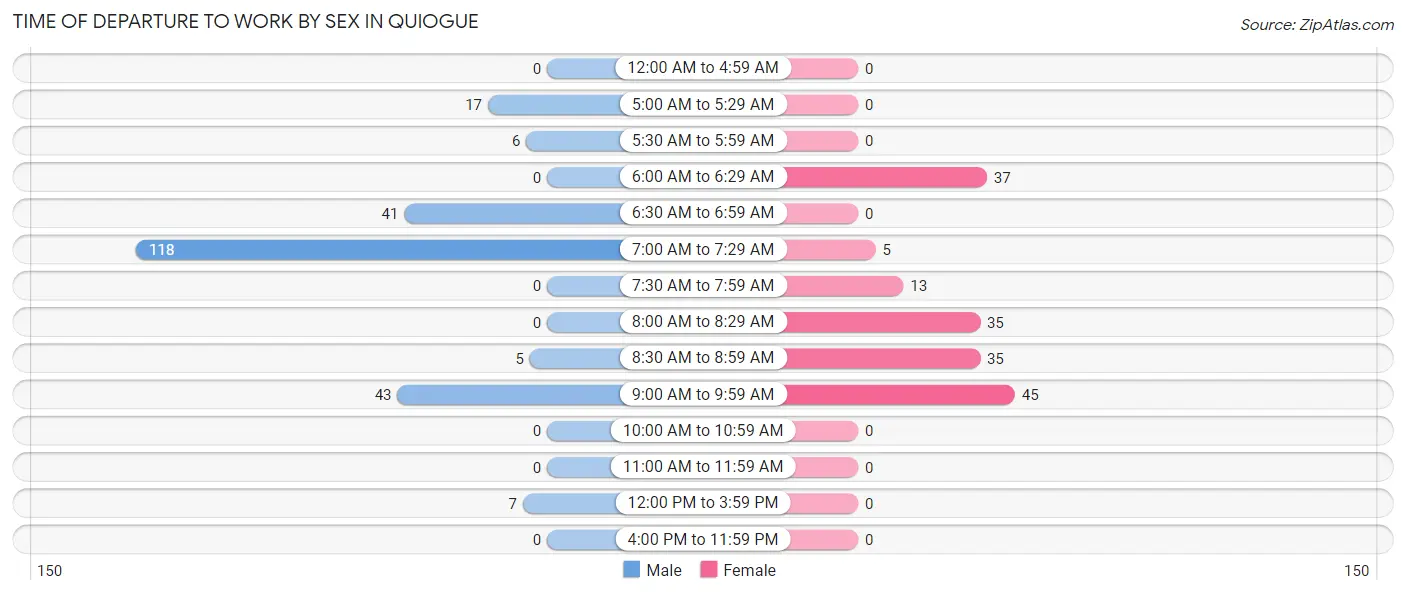
| Time of Departure | Male | Female |
| 12:00 AM to 4:59 AM | 0 (0.0%) | 0 (0.0%) |
| 5:00 AM to 5:29 AM | 17 (7.2%) | 0 (0.0%) |
| 5:30 AM to 5:59 AM | 6 (2.5%) | 0 (0.0%) |
| 6:00 AM to 6:29 AM | 0 (0.0%) | 37 (21.8%) |
| 6:30 AM to 6:59 AM | 41 (17.3%) | 0 (0.0%) |
| 7:00 AM to 7:29 AM | 118 (49.8%) | 5 (2.9%) |
| 7:30 AM to 7:59 AM | 0 (0.0%) | 13 (7.6%) |
| 8:00 AM to 8:29 AM | 0 (0.0%) | 35 (20.6%) |
| 8:30 AM to 8:59 AM | 5 (2.1%) | 35 (20.6%) |
| 9:00 AM to 9:59 AM | 43 (18.1%) | 45 (26.5%) |
| 10:00 AM to 10:59 AM | 0 (0.0%) | 0 (0.0%) |
| 11:00 AM to 11:59 AM | 0 (0.0%) | 0 (0.0%) |
| 12:00 PM to 3:59 PM | 7 (2.9%) | 0 (0.0%) |
| 4:00 PM to 11:59 PM | 0 (0.0%) | 0 (0.0%) |
| Total | 237 (100.0%) | 170 (100.0%) |
Housing Occupancy in Quiogue
Occupancy by Ownership in Quiogue
Of the total 295 dwellings in Quiogue, owner-occupied units account for 190 (64.4%), while renter-occupied units make up 105 (35.6%).
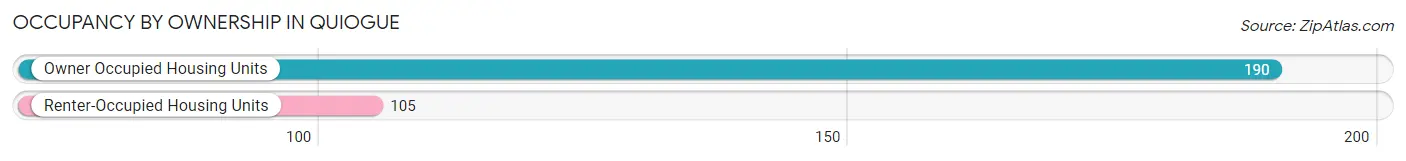
| Occupancy | # Housing Units | % Housing Units |
| Owner Occupied Housing Units | 190 | 64.4% |
| Renter-Occupied Housing Units | 105 | 35.6% |
| Total Occupied Housing Units | 295 | 100.0% |
Occupancy by Household Size in Quiogue
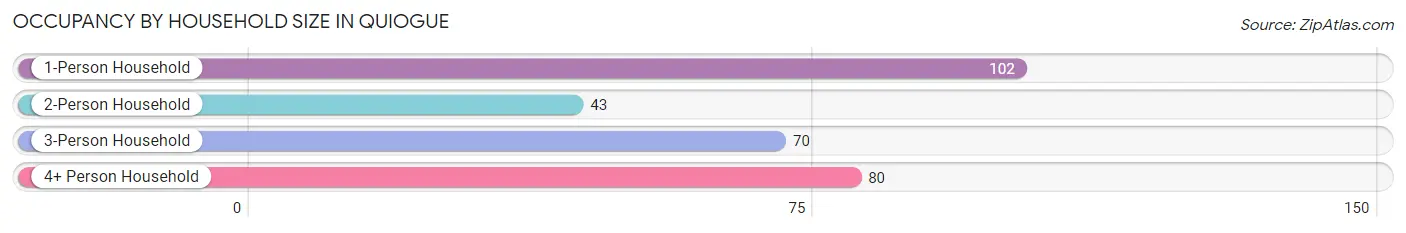
| Household Size | # Housing Units | % Housing Units |
| 1-Person Household | 102 | 34.6% |
| 2-Person Household | 43 | 14.6% |
| 3-Person Household | 70 | 23.7% |
| 4+ Person Household | 80 | 27.1% |
| Total Housing Units | 295 | 100.0% |
Occupancy by Ownership by Household Size in Quiogue
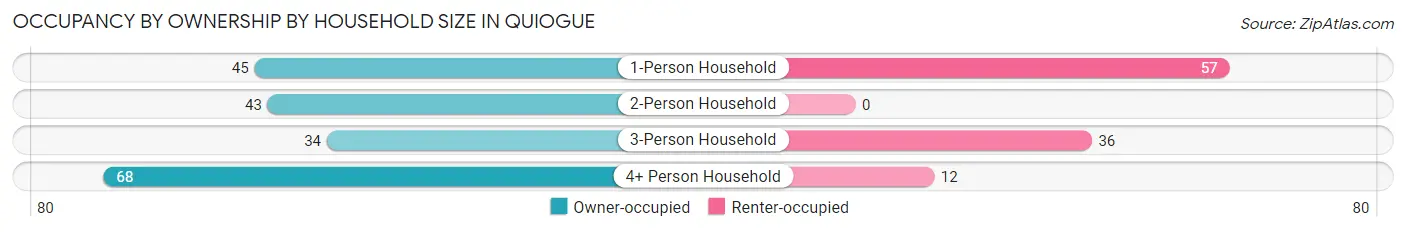
| Household Size | Owner-occupied | Renter-occupied |
| 1-Person Household | 45 (44.1%) | 57 (55.9%) |
| 2-Person Household | 43 (100.0%) | 0 (0.0%) |
| 3-Person Household | 34 (48.6%) | 36 (51.4%) |
| 4+ Person Household | 68 (85.0%) | 12 (15.0%) |
| Total Housing Units | 190 (64.4%) | 105 (35.6%) |
Occupancy by Educational Attainment in Quiogue
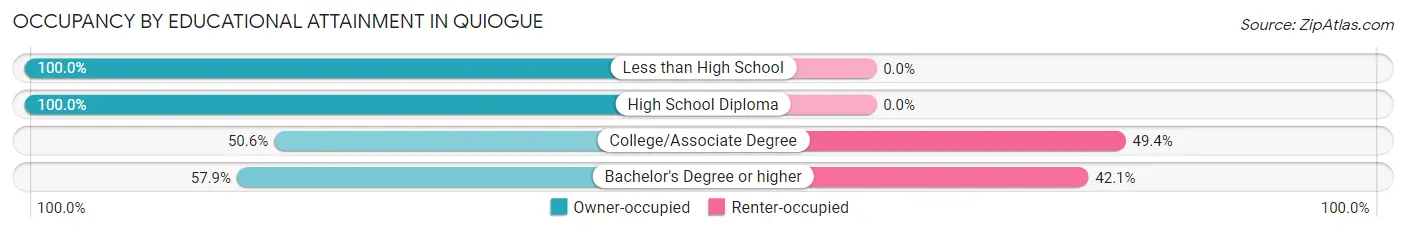
| Household Size | Owner-occupied | Renter-occupied |
| Less than High School | 13 (100.0%) | 0 (0.0%) |
| High School Diploma | 48 (100.0%) | 0 (0.0%) |
| College/Associate Degree | 45 (50.6%) | 44 (49.4%) |
| Bachelor's Degree or higher | 84 (57.9%) | 61 (42.1%) |
Occupancy by Age of Householder in Quiogue
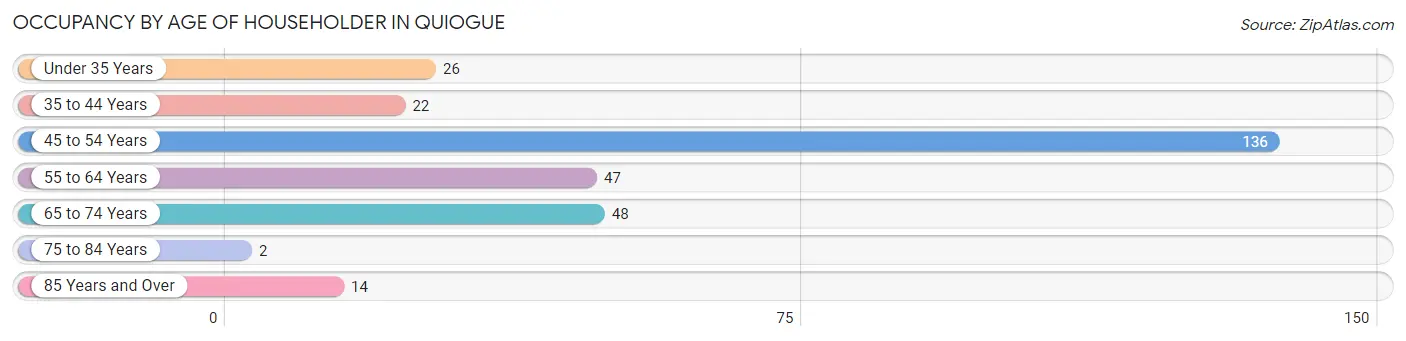
| Age Bracket | # Households | % Households |
| Under 35 Years | 26 | 8.8% |
| 35 to 44 Years | 22 | 7.5% |
| 45 to 54 Years | 136 | 46.1% |
| 55 to 64 Years | 47 | 15.9% |
| 65 to 74 Years | 48 | 16.3% |
| 75 to 84 Years | 2 | 0.7% |
| 85 Years and Over | 14 | 4.8% |
| Total | 295 | 100.0% |
Housing Finances in Quiogue
Median Income by Occupancy in Quiogue
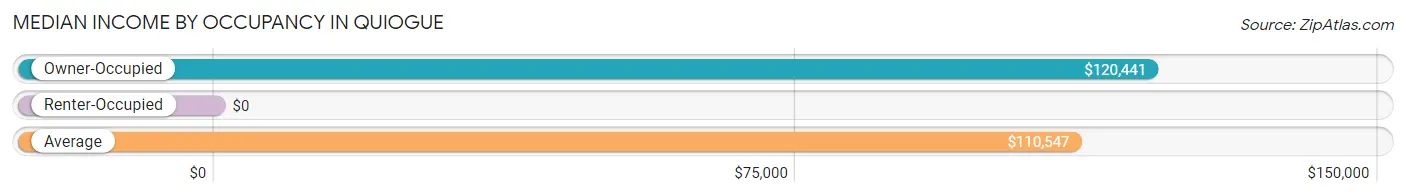
| Occupancy Type | # Households | Median Income |
| Owner-Occupied | 190 (64.4%) | $120,441 |
| Renter-Occupied | 105 (35.6%) | $0 |
| Average | 295 (100.0%) | $110,547 |
Occupancy by Householder Income Bracket in Quiogue
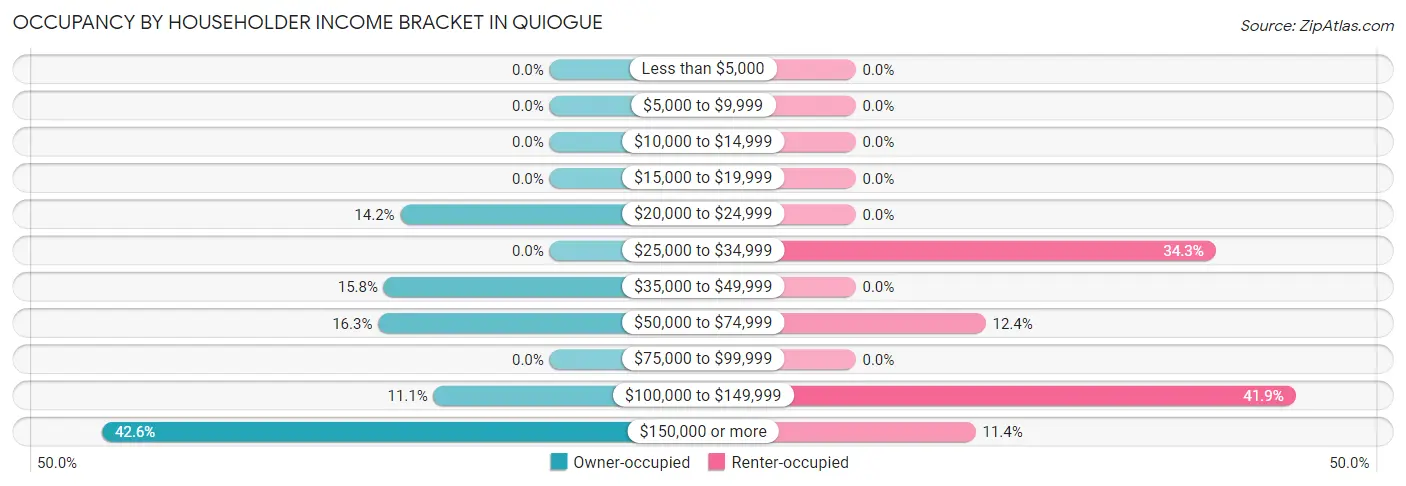
| Income Bracket | Owner-occupied | Renter-occupied |
| Less than $5,000 | 0 (0.0%) | 0 (0.0%) |
| $5,000 to $9,999 | 0 (0.0%) | 0 (0.0%) |
| $10,000 to $14,999 | 0 (0.0%) | 0 (0.0%) |
| $15,000 to $19,999 | 0 (0.0%) | 0 (0.0%) |
| $20,000 to $24,999 | 27 (14.2%) | 0 (0.0%) |
| $25,000 to $34,999 | 0 (0.0%) | 36 (34.3%) |
| $35,000 to $49,999 | 30 (15.8%) | 0 (0.0%) |
| $50,000 to $74,999 | 31 (16.3%) | 13 (12.4%) |
| $75,000 to $99,999 | 0 (0.0%) | 0 (0.0%) |
| $100,000 to $149,999 | 21 (11.1%) | 44 (41.9%) |
| $150,000 or more | 81 (42.6%) | 12 (11.4%) |
| Total | 190 (100.0%) | 105 (100.0%) |
Monthly Housing Cost Tiers in Quiogue
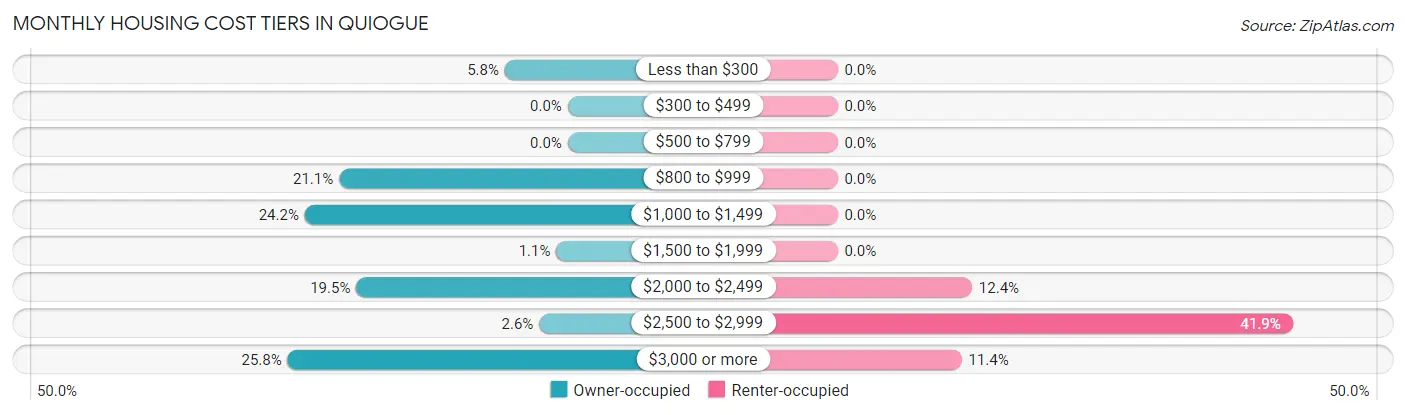
| Monthly Cost | Owner-occupied | Renter-occupied |
| Less than $300 | 11 (5.8%) | 0 (0.0%) |
| $300 to $499 | 0 (0.0%) | 0 (0.0%) |
| $500 to $799 | 0 (0.0%) | 0 (0.0%) |
| $800 to $999 | 40 (21.0%) | 0 (0.0%) |
| $1,000 to $1,499 | 46 (24.2%) | 0 (0.0%) |
| $1,500 to $1,999 | 2 (1.1%) | 0 (0.0%) |
| $2,000 to $2,499 | 37 (19.5%) | 13 (12.4%) |
| $2,500 to $2,999 | 5 (2.6%) | 44 (41.9%) |
| $3,000 or more | 49 (25.8%) | 12 (11.4%) |
| Total | 190 (100.0%) | 105 (100.0%) |
Physical Housing Characteristics in Quiogue
Housing Structures in Quiogue
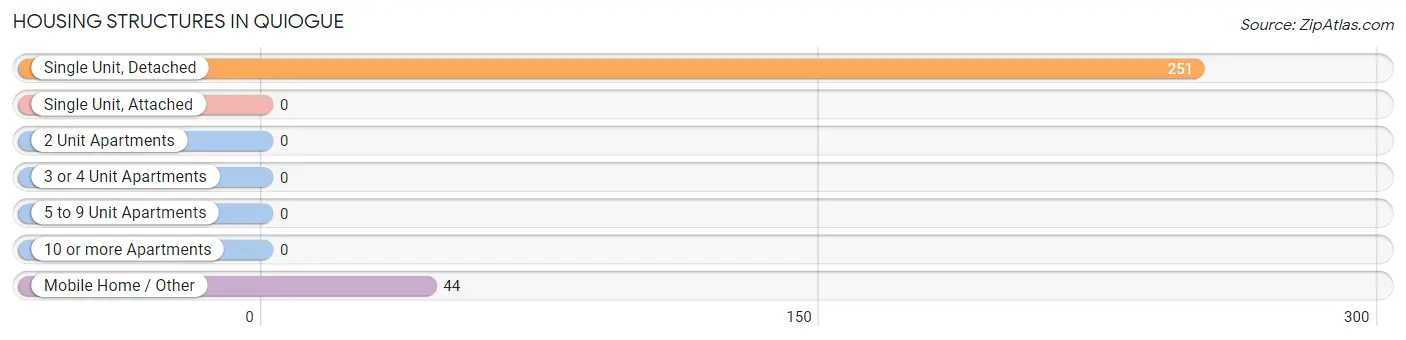
| Structure Type | # Housing Units | % Housing Units |
| Single Unit, Detached | 251 | 85.1% |
| Single Unit, Attached | 0 | 0.0% |
| 2 Unit Apartments | 0 | 0.0% |
| 3 or 4 Unit Apartments | 0 | 0.0% |
| 5 to 9 Unit Apartments | 0 | 0.0% |
| 10 or more Apartments | 0 | 0.0% |
| Mobile Home / Other | 44 | 14.9% |
| Total | 295 | 100.0% |
Housing Structures by Occupancy in Quiogue
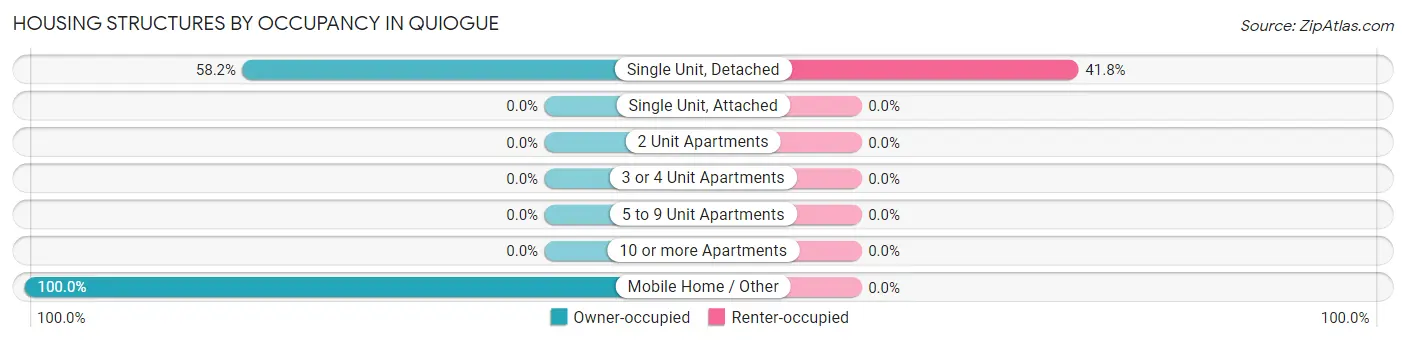
| Structure Type | Owner-occupied | Renter-occupied |
| Single Unit, Detached | 146 (58.2%) | 105 (41.8%) |
| Single Unit, Attached | 0 (0.0%) | 0 (0.0%) |
| 2 Unit Apartments | 0 (0.0%) | 0 (0.0%) |
| 3 or 4 Unit Apartments | 0 (0.0%) | 0 (0.0%) |
| 5 to 9 Unit Apartments | 0 (0.0%) | 0 (0.0%) |
| 10 or more Apartments | 0 (0.0%) | 0 (0.0%) |
| Mobile Home / Other | 44 (100.0%) | 0 (0.0%) |
| Total | 190 (64.4%) | 105 (35.6%) |
Housing Structures by Number of Rooms in Quiogue
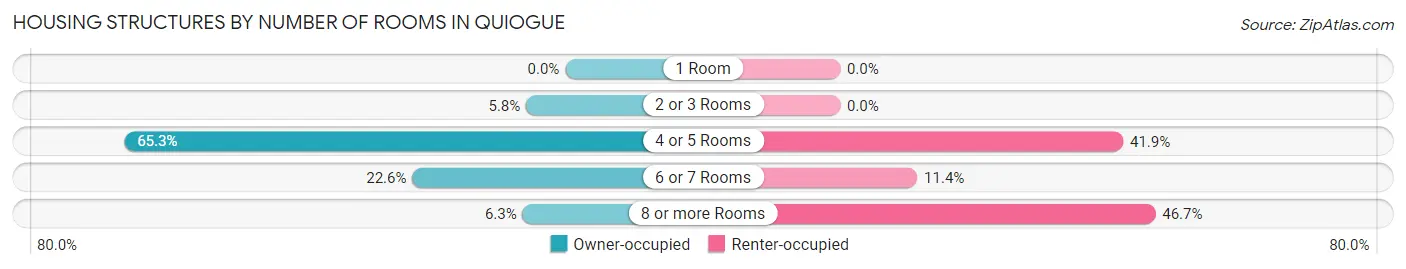
| Number of Rooms | Owner-occupied | Renter-occupied |
| 1 Room | 0 (0.0%) | 0 (0.0%) |
| 2 or 3 Rooms | 11 (5.8%) | 0 (0.0%) |
| 4 or 5 Rooms | 124 (65.3%) | 44 (41.9%) |
| 6 or 7 Rooms | 43 (22.6%) | 12 (11.4%) |
| 8 or more Rooms | 12 (6.3%) | 49 (46.7%) |
| Total | 190 (100.0%) | 105 (100.0%) |
Housing Structure by Heating Type in Quiogue
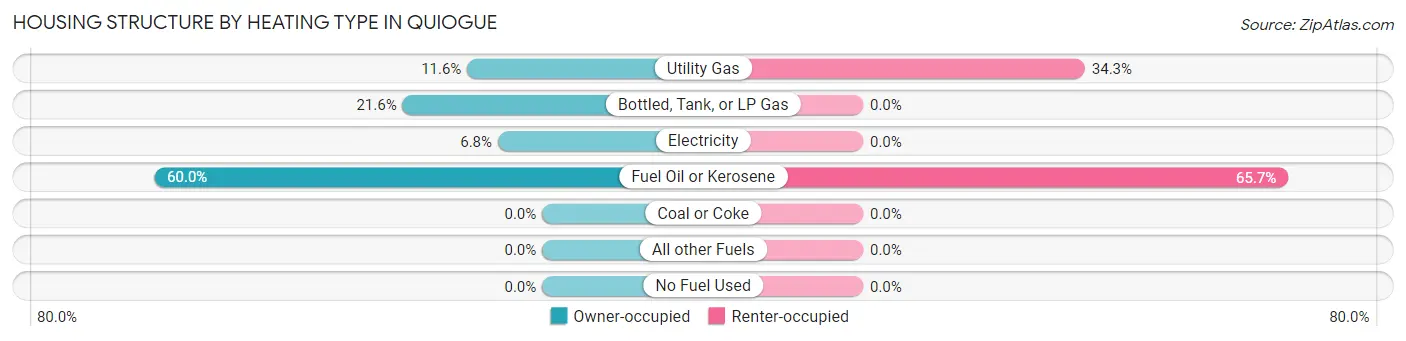
| Heating Type | Owner-occupied | Renter-occupied |
| Utility Gas | 22 (11.6%) | 36 (34.3%) |
| Bottled, Tank, or LP Gas | 41 (21.6%) | 0 (0.0%) |
| Electricity | 13 (6.8%) | 0 (0.0%) |
| Fuel Oil or Kerosene | 114 (60.0%) | 69 (65.7%) |
| Coal or Coke | 0 (0.0%) | 0 (0.0%) |
| All other Fuels | 0 (0.0%) | 0 (0.0%) |
| No Fuel Used | 0 (0.0%) | 0 (0.0%) |
| Total | 190 (100.0%) | 105 (100.0%) |
Household Vehicle Usage in Quiogue
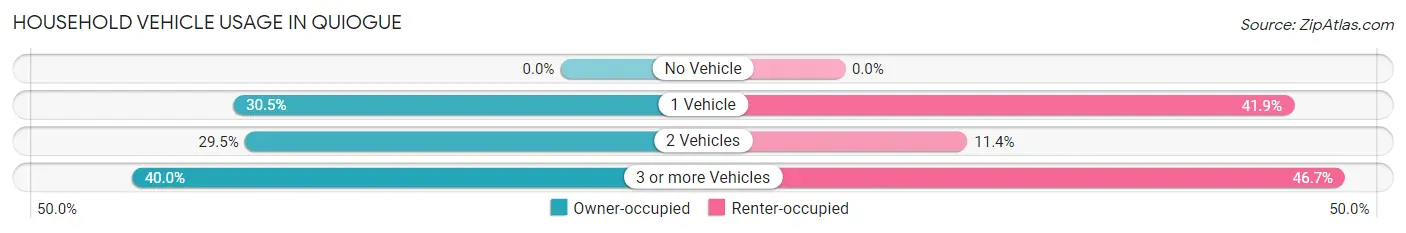
| Vehicles per Household | Owner-occupied | Renter-occupied |
| No Vehicle | 0 (0.0%) | 0 (0.0%) |
| 1 Vehicle | 58 (30.5%) | 44 (41.9%) |
| 2 Vehicles | 56 (29.5%) | 12 (11.4%) |
| 3 or more Vehicles | 76 (40.0%) | 49 (46.7%) |
| Total | 190 (100.0%) | 105 (100.0%) |
Real Estate & Mortgages in Quiogue
Real Estate and Mortgage Overview in Quiogue
| Characteristic | Without Mortgage | With Mortgage |
| Housing Units | 103 | 87 |
| Median Property Value | - | - |
| Median Household Income | $64,519 | $54 |
| Monthly Housing Costs | $1,107 | $49 |
| Real Estate Taxes | $6,597 | $0 |
Property Value by Mortgage Status in Quiogue
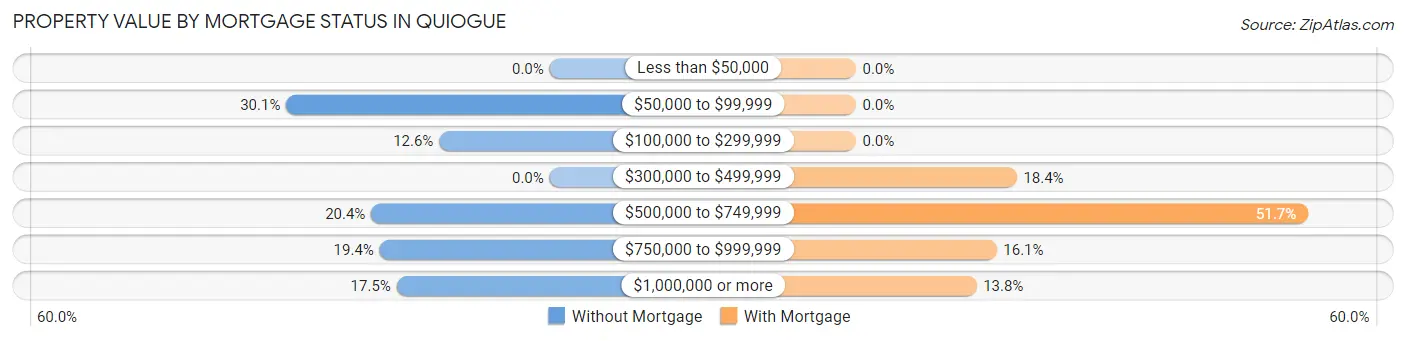
| Property Value | Without Mortgage | With Mortgage |
| Less than $50,000 | 0 (0.0%) | 0 (0.0%) |
| $50,000 to $99,999 | 31 (30.1%) | 0 (0.0%) |
| $100,000 to $299,999 | 13 (12.6%) | 0 (0.0%) |
| $300,000 to $499,999 | 0 (0.0%) | 16 (18.4%) |
| $500,000 to $749,999 | 21 (20.4%) | 45 (51.7%) |
| $750,000 to $999,999 | 20 (19.4%) | 14 (16.1%) |
| $1,000,000 or more | 18 (17.5%) | 12 (13.8%) |
| Total | 103 (100.0%) | 87 (100.0%) |
Household Income by Mortgage Status in Quiogue
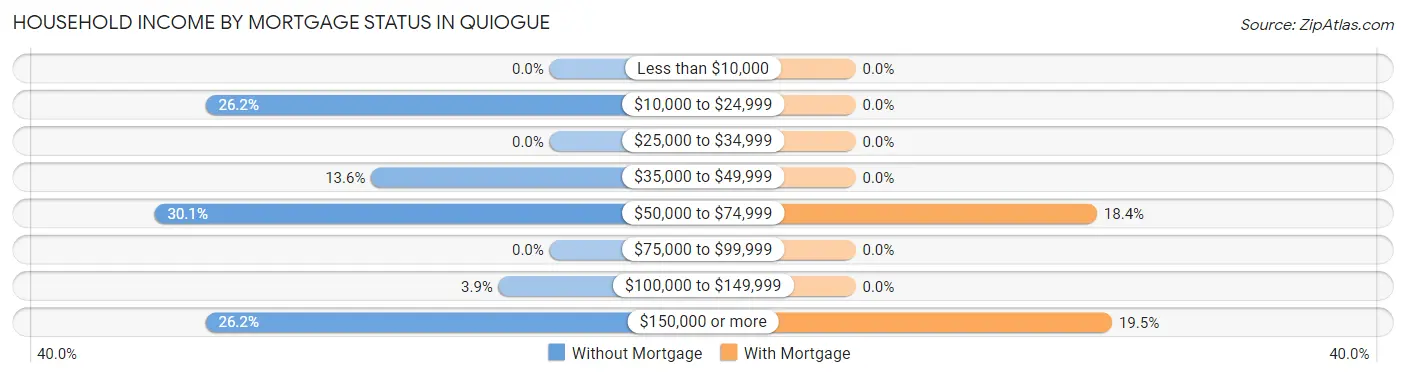
| Household Income | Without Mortgage | With Mortgage |
| Less than $10,000 | 0 (0.0%) | 0 (0.0%) |
| $10,000 to $24,999 | 27 (26.2%) | 0 (0.0%) |
| $25,000 to $34,999 | 0 (0.0%) | 0 (0.0%) |
| $35,000 to $49,999 | 14 (13.6%) | 0 (0.0%) |
| $50,000 to $74,999 | 31 (30.1%) | 16 (18.4%) |
| $75,000 to $99,999 | 0 (0.0%) | 0 (0.0%) |
| $100,000 to $149,999 | 4 (3.9%) | 0 (0.0%) |
| $150,000 or more | 27 (26.2%) | 17 (19.5%) |
| Total | 103 (100.0%) | 87 (100.0%) |
Property Value to Household Income Ratio in Quiogue
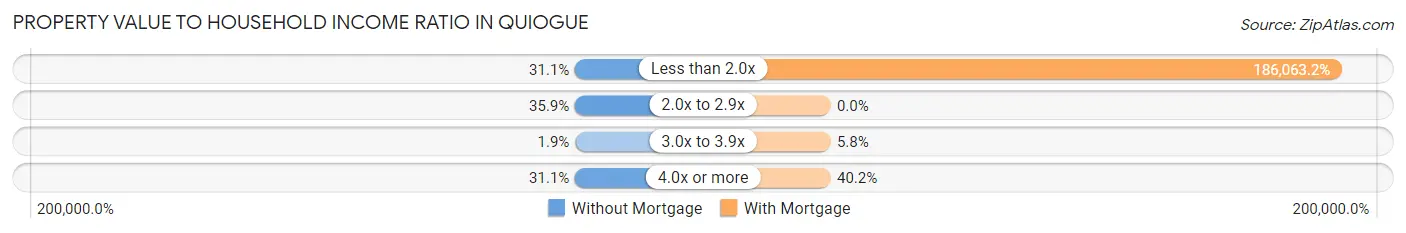
| Value-to-Income Ratio | Without Mortgage | With Mortgage |
| Less than 2.0x | 32 (31.1%) | 161,875 (186,063.2%) |
| 2.0x to 2.9x | 37 (35.9%) | 0 (0.0%) |
| 3.0x to 3.9x | 2 (1.9%) | 5 (5.8%) |
| 4.0x or more | 32 (31.1%) | 35 (40.2%) |
| Total | 103 (100.0%) | 87 (100.0%) |
Real Estate Taxes by Mortgage Status in Quiogue
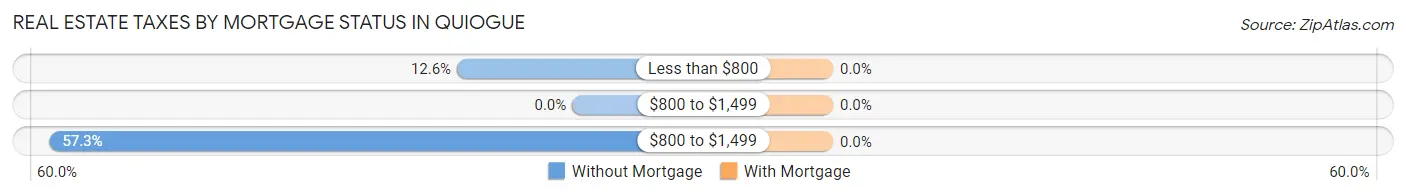
| Property Taxes | Without Mortgage | With Mortgage |
| Less than $800 | 13 (12.6%) | 0 (0.0%) |
| $800 to $1,499 | 0 (0.0%) | 0 (0.0%) |
| $800 to $1,499 | 59 (57.3%) | 0 (0.0%) |
| Total | 103 (100.0%) | 87 (100.0%) |
Health & Disability in Quiogue
Health Insurance Coverage by Age in Quiogue
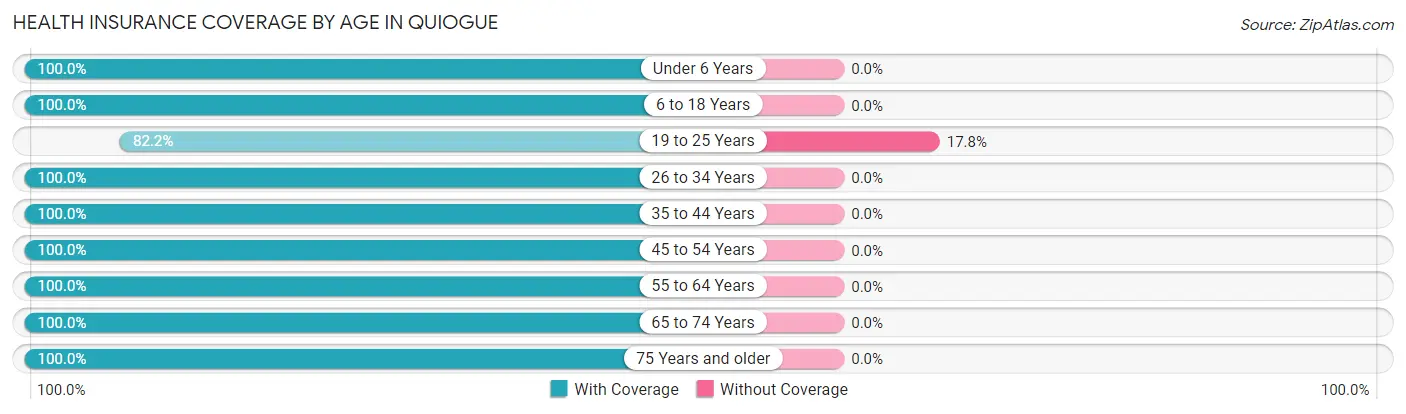
| Age Bracket | With Coverage | Without Coverage |
| Under 6 Years | 23 (100.0%) | 0 (0.0%) |
| 6 to 18 Years | 189 (100.0%) | 0 (0.0%) |
| 19 to 25 Years | 60 (82.2%) | 13 (17.8%) |
| 26 to 34 Years | 18 (100.0%) | 0 (0.0%) |
| 35 to 44 Years | 100 (100.0%) | 0 (0.0%) |
| 45 to 54 Years | 192 (100.0%) | 0 (0.0%) |
| 55 to 64 Years | 111 (100.0%) | 0 (0.0%) |
| 65 to 74 Years | 65 (100.0%) | 0 (0.0%) |
| 75 Years and older | 16 (100.0%) | 0 (0.0%) |
| Total | 774 (98.4%) | 13 (1.7%) |
Health Insurance Coverage by Citizenship Status in Quiogue
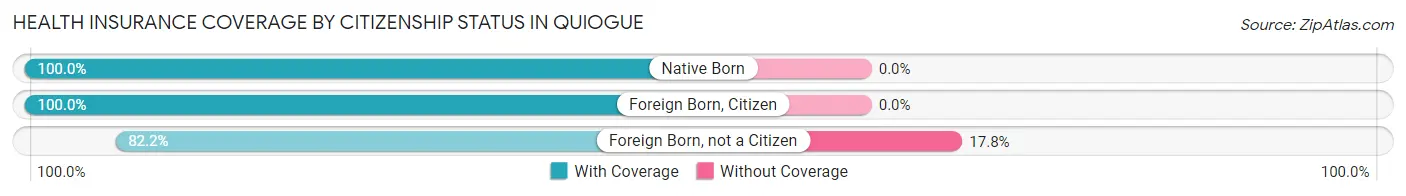
| Citizenship Status | With Coverage | Without Coverage |
| Native Born | 23 (100.0%) | 0 (0.0%) |
| Foreign Born, Citizen | 189 (100.0%) | 0 (0.0%) |
| Foreign Born, not a Citizen | 60 (82.2%) | 13 (17.8%) |
Health Insurance Coverage by Household Income in Quiogue
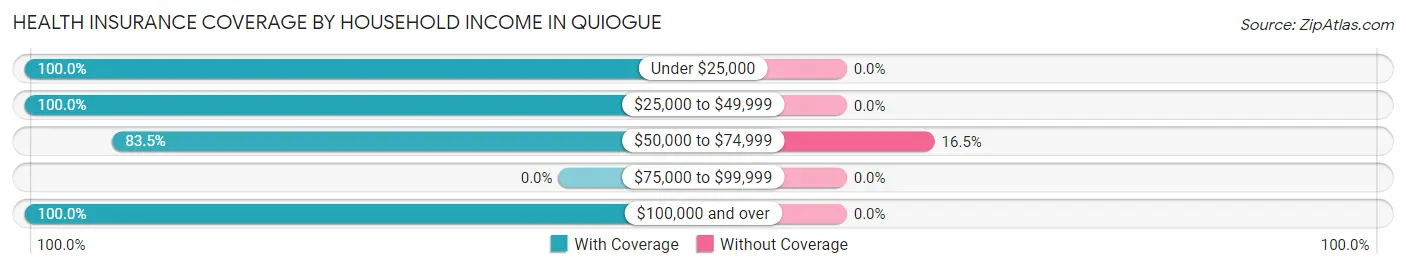
| Household Income | With Coverage | Without Coverage |
| Under $25,000 | 27 (100.0%) | 0 (0.0%) |
| $25,000 to $49,999 | 182 (100.0%) | 0 (0.0%) |
| $50,000 to $74,999 | 66 (83.5%) | 13 (16.5%) |
| $75,000 to $99,999 | 0 (0.0%) | 0 (0.0%) |
| $100,000 and over | 499 (100.0%) | 0 (0.0%) |
Public vs Private Health Insurance Coverage by Age in Quiogue
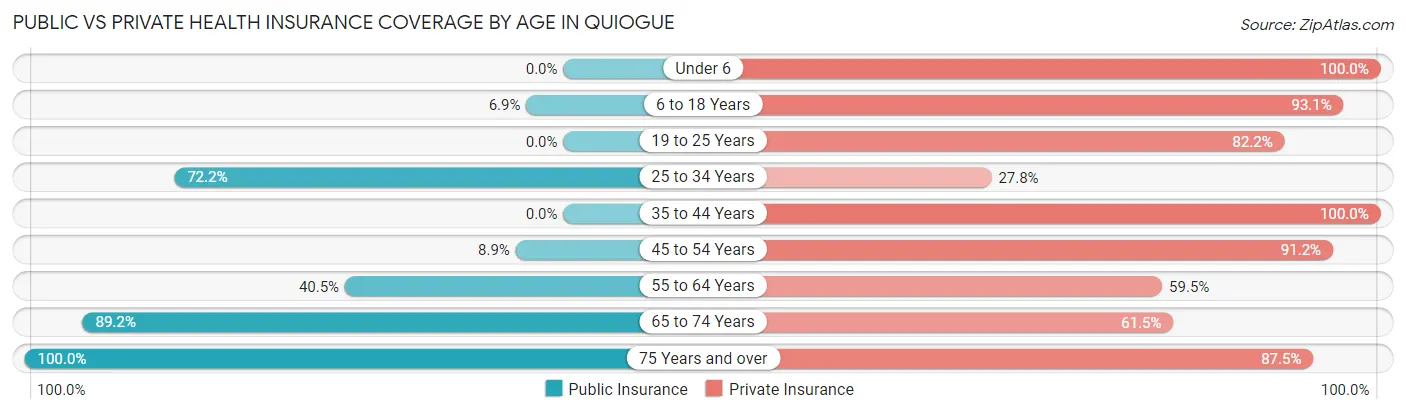
| Age Bracket | Public Insurance | Private Insurance |
| Under 6 | 0 (0.0%) | 23 (100.0%) |
| 6 to 18 Years | 13 (6.9%) | 176 (93.1%) |
| 19 to 25 Years | 0 (0.0%) | 60 (82.2%) |
| 25 to 34 Years | 13 (72.2%) | 5 (27.8%) |
| 35 to 44 Years | 0 (0.0%) | 100 (100.0%) |
| 45 to 54 Years | 17 (8.8%) | 175 (91.1%) |
| 55 to 64 Years | 45 (40.5%) | 66 (59.5%) |
| 65 to 74 Years | 58 (89.2%) | 40 (61.5%) |
| 75 Years and over | 16 (100.0%) | 14 (87.5%) |
| Total | 162 (20.6%) | 659 (83.7%) |
Disability Status by Sex by Age in Quiogue
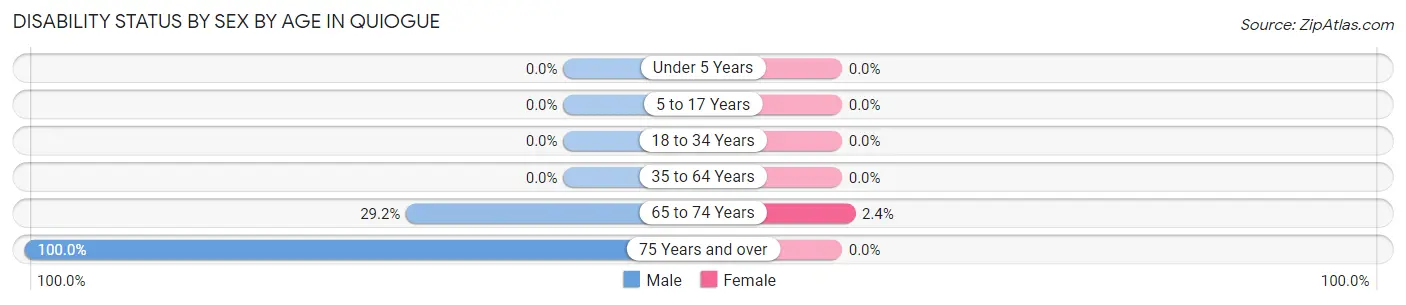
| Age Bracket | Male | Female |
| Under 5 Years | 0 (0.0%) | 0 (0.0%) |
| 5 to 17 Years | 0 (0.0%) | 0 (0.0%) |
| 18 to 34 Years | 0 (0.0%) | 0 (0.0%) |
| 35 to 64 Years | 0 (0.0%) | 0 (0.0%) |
| 65 to 74 Years | 7 (29.2%) | 1 (2.4%) |
| 75 Years and over | 16 (100.0%) | 0 (0.0%) |
Disability Class by Sex by Age in Quiogue
Disability Class: Hearing Difficulty
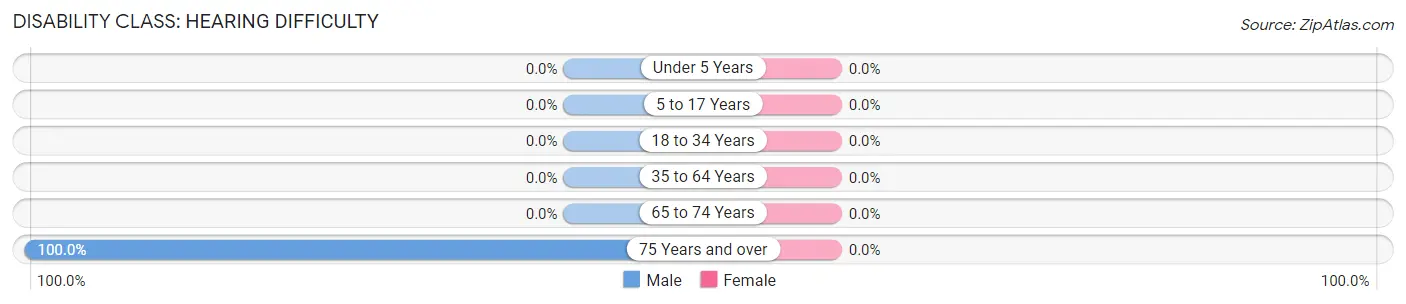
| Age Bracket | Male | Female |
| Under 5 Years | 0 (0.0%) | 0 (0.0%) |
| 5 to 17 Years | 0 (0.0%) | 0 (0.0%) |
| 18 to 34 Years | 0 (0.0%) | 0 (0.0%) |
| 35 to 64 Years | 0 (0.0%) | 0 (0.0%) |
| 65 to 74 Years | 0 (0.0%) | 0 (0.0%) |
| 75 Years and over | 16 (100.0%) | 0 (0.0%) |
Disability Class: Vision Difficulty
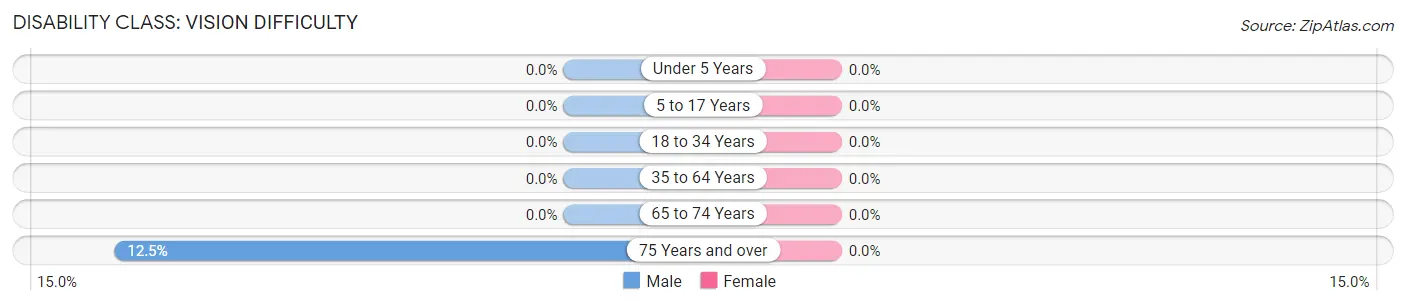
| Age Bracket | Male | Female |
| Under 5 Years | 0 (0.0%) | 0 (0.0%) |
| 5 to 17 Years | 0 (0.0%) | 0 (0.0%) |
| 18 to 34 Years | 0 (0.0%) | 0 (0.0%) |
| 35 to 64 Years | 0 (0.0%) | 0 (0.0%) |
| 65 to 74 Years | 0 (0.0%) | 0 (0.0%) |
| 75 Years and over | 2 (12.5%) | 0 (0.0%) |
Disability Class: Cognitive Difficulty
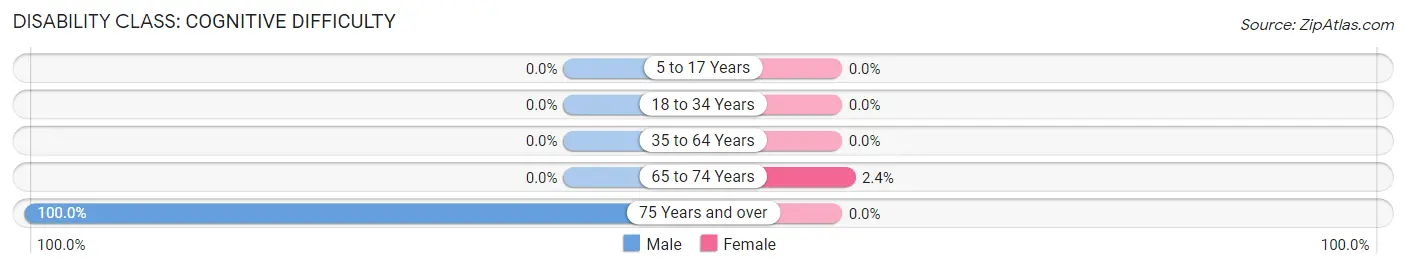
| Age Bracket | Male | Female |
| 5 to 17 Years | 0 (0.0%) | 0 (0.0%) |
| 18 to 34 Years | 0 (0.0%) | 0 (0.0%) |
| 35 to 64 Years | 0 (0.0%) | 0 (0.0%) |
| 65 to 74 Years | 0 (0.0%) | 1 (2.4%) |
| 75 Years and over | 16 (100.0%) | 0 (0.0%) |
Disability Class: Ambulatory Difficulty
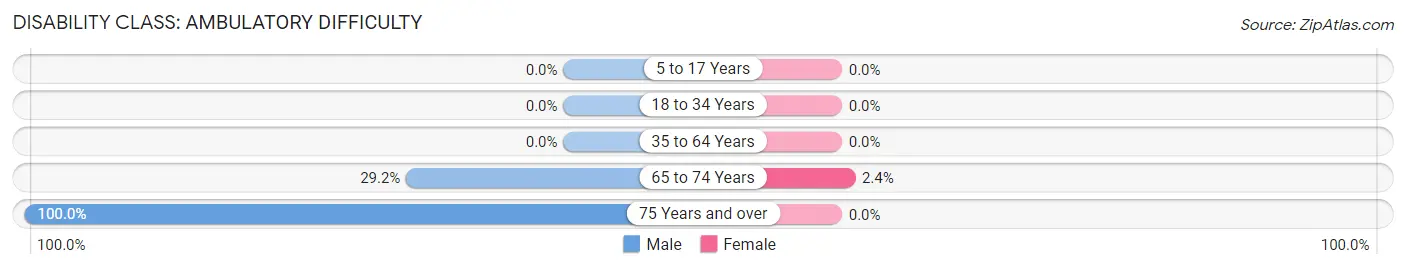
| Age Bracket | Male | Female |
| 5 to 17 Years | 0 (0.0%) | 0 (0.0%) |
| 18 to 34 Years | 0 (0.0%) | 0 (0.0%) |
| 35 to 64 Years | 0 (0.0%) | 0 (0.0%) |
| 65 to 74 Years | 7 (29.2%) | 1 (2.4%) |
| 75 Years and over | 16 (100.0%) | 0 (0.0%) |
Disability Class: Self-Care Difficulty
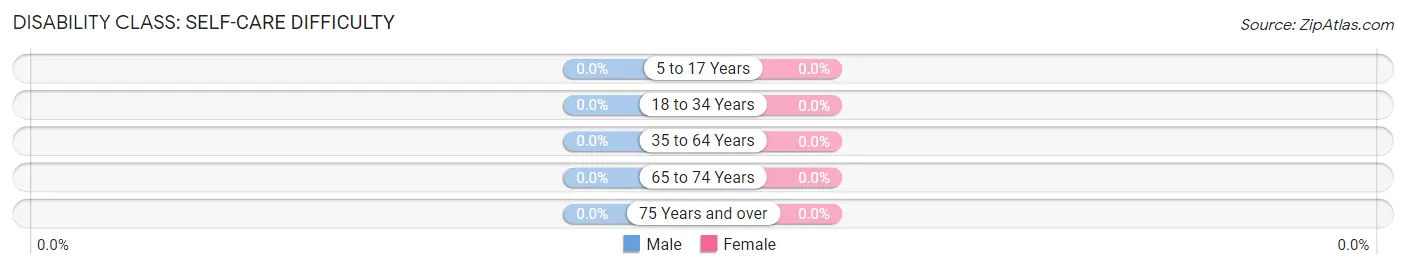
| Age Bracket | Male | Female |
| 5 to 17 Years | 0 (0.0%) | 0 (0.0%) |
| 18 to 34 Years | 0 (0.0%) | 0 (0.0%) |
| 35 to 64 Years | 0 (0.0%) | 0 (0.0%) |
| 65 to 74 Years | 0 (0.0%) | 0 (0.0%) |
| 75 Years and over | 0 (0.0%) | 0 (0.0%) |
Technology Access in Quiogue
Computing Device Access in Quiogue
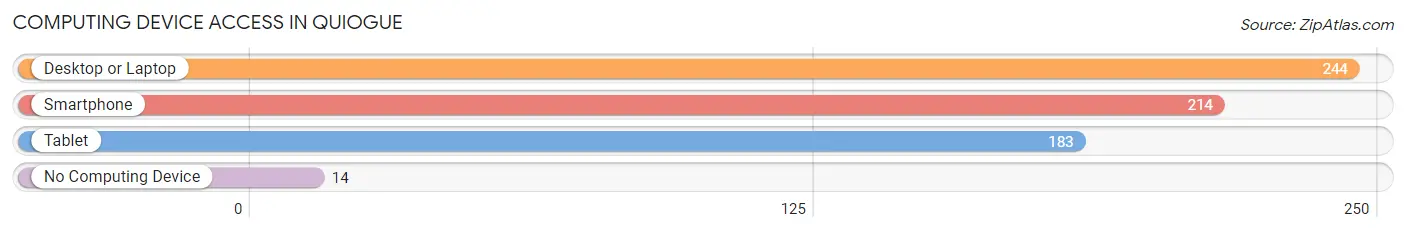
| Device Type | # Households | % Households |
| Desktop or Laptop | 244 | 82.7% |
| Smartphone | 214 | 72.5% |
| Tablet | 183 | 62.0% |
| No Computing Device | 14 | 4.8% |
| Total | 295 | 100.0% |
Internet Access in Quiogue
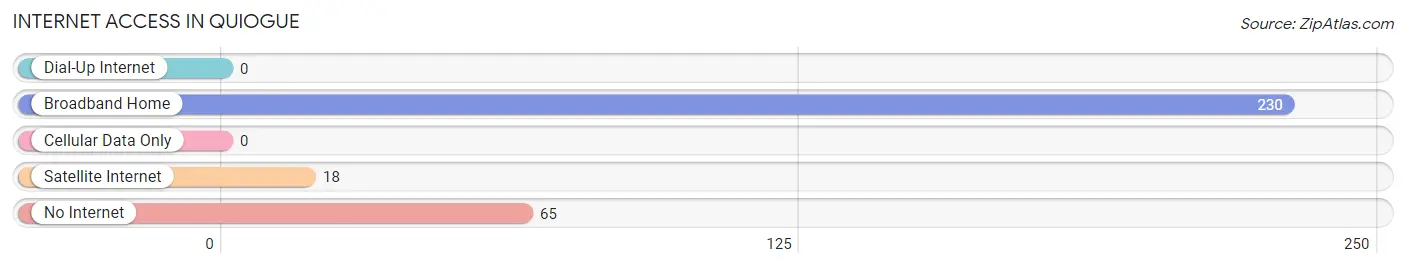
| Internet Type | # Households | % Households |
| Dial-Up Internet | 0 | 0.0% |
| Broadband Home | 230 | 78.0% |
| Cellular Data Only | 0 | 0.0% |
| Satellite Internet | 18 | 6.1% |
| No Internet | 65 | 22.0% |
| Total | 295 | 100.0% |
Quiogue Summary
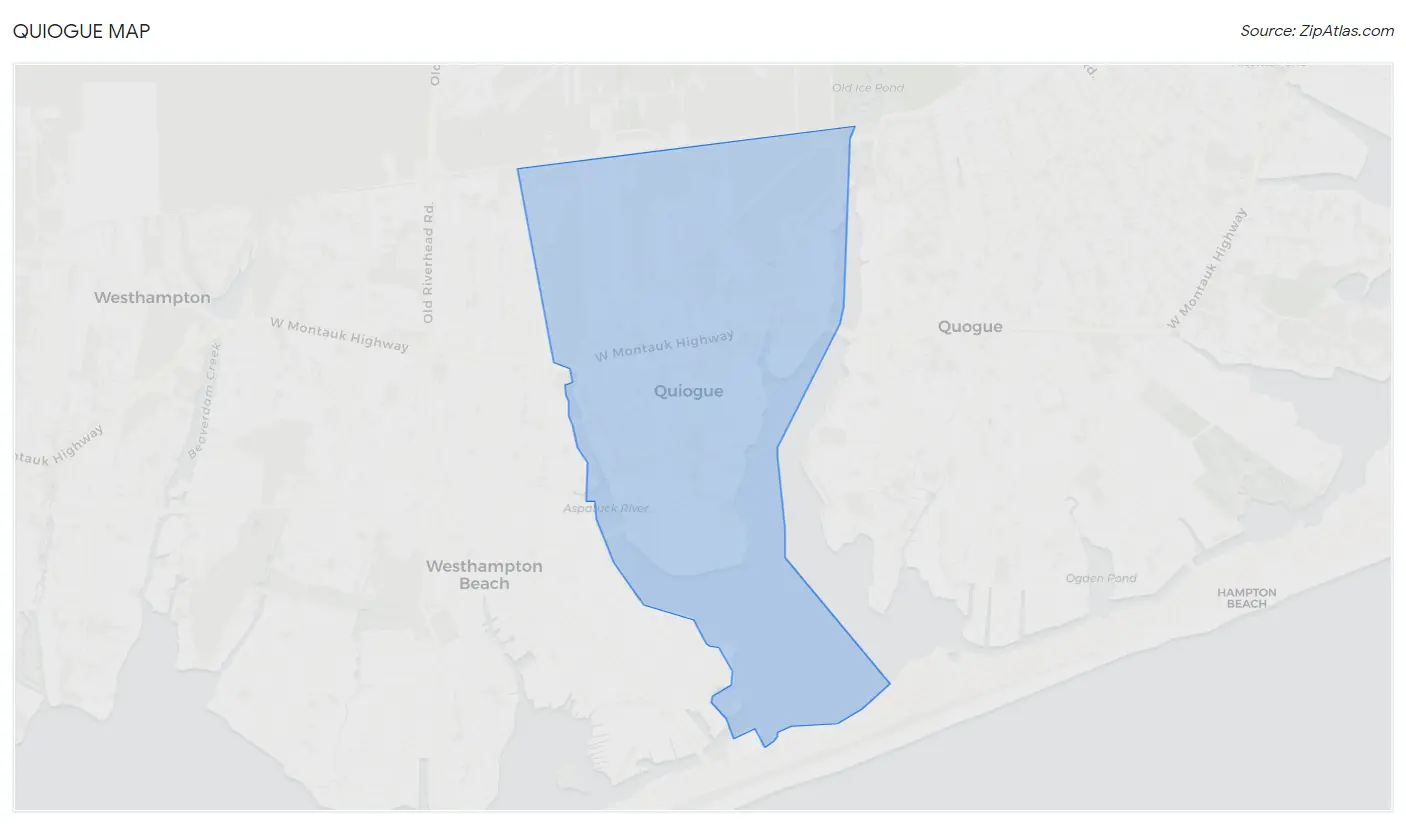
Quiogue is a hamlet located in the Town of Southampton in Suffolk County, New York. It is situated on the south shore of Long Island, approximately 80 miles east of New York City. Quiogue is bordered by the hamlets of Westhampton Beach to the west, East Quogue to the east, and Hampton Bays to the south.
History
The area now known as Quiogue was originally inhabited by the Shinnecock Native American tribe. The first European settlers arrived in the area in the late 1600s, and the hamlet was officially established in 1703. The name Quiogue is derived from the Shinnecock word for “place of refuge”.
In the late 1800s, Quiogue became a popular summer destination for wealthy New Yorkers. The area was home to several large estates, including the estate of William K. Vanderbilt, which was later converted into a golf course.
Geography
Quiogue is located on the south shore of Long Island, approximately 80 miles east of New York City. It is bordered by the hamlets of Westhampton Beach to the west, East Quogue to the east, and Hampton Bays to the south. The hamlet is situated on a peninsula that juts out into the Atlantic Ocean.
The area is characterized by its sandy beaches, rolling hills, and wooded areas. Quiogue is home to several parks, including Quiogue Wildlife Refuge, which is a popular spot for bird watching.
Economy
The economy of Quiogue is largely driven by tourism. The hamlet is home to several popular beaches, including Quiogue Beach and Quogue Beach Club. The area is also home to several golf courses, including the William K. Vanderbilt Golf Course.
In addition to tourism, Quiogue is home to several small businesses, including restaurants, shops, and art galleries. The hamlet is also home to several wineries, including the Wölffer Estate Vineyard.
Demographics
As of the 2010 census, Quiogue had a population of 1,845. The population is predominantly white (94.3%), with a small percentage of African Americans (2.2%) and Hispanics (2.2%). The median household income is $90,938, and the median home value is $717,500.
Quiogue is a small, close-knit community. The hamlet is home to several churches, including the Quiogue United Methodist Church and the Quiogue Presbyterian Church. The hamlet is also home to several civic organizations, including the Quiogue Historical Society and the Quiogue Civic Association.
Common Questions
What is Per Capita Income in Quiogue?
Per Capita income in Quiogue is $73,909.
What is the Median Family Income in Quiogue?
Median Family Income in Quiogue is $121,985.
What is the Median Household income in Quiogue?
Median Household Income in Quiogue is $110,547.
What is Income or Wage Gap in Quiogue?
Income or Wage Gap in Quiogue is 75.7%.
Women in Quiogue earn 24.3 cents for every dollar earned by a man.
What is Inequality or Gini Index in Quiogue?
Inequality or Gini Index in Quiogue is 0.61.
What is the Total Population of Quiogue?
Total Population of Quiogue is 787.
What is the Total Male Population of Quiogue?
Total Male Population of Quiogue is 390.
What is the Total Female Population of Quiogue?
Total Female Population of Quiogue is 397.
What is the Ratio of Males per 100 Females in Quiogue?
There are 98.24 Males per 100 Females in Quiogue.
What is the Ratio of Females per 100 Males in Quiogue?
There are 101.79 Females per 100 Males in Quiogue.
What is the Median Population Age in Quiogue?
Median Population Age in Quiogue is 44.8 Years.
What is the Average Family Size in Quiogue
Average Family Size in Quiogue is 3.4 People.
What is the Average Household Size in Quiogue
Average Household Size in Quiogue is 2.7 People.
How Large is the Labor Force in Quiogue?
There are 473 People in the Labor Forcein in Quiogue.
What is the Percentage of People in the Labor Force in Quiogue?
79.0% of People are in the Labor Force in Quiogue.
What is the Unemployment Rate in Quiogue?
Unemployment Rate in Quiogue is 8.0%.