Lloyd Harbor, NY Map & Demographics
Lloyd Harbor Map
Lloyd Harbor Overview
$123,386
PER CAPITA INCOME
$250,001
AVG FAMILY INCOME
$233,007
AVG HOUSEHOLD INCOME
50.9%
WAGE / INCOME GAP [ % ]
49.1¢/ $1
WAGE / INCOME GAP [ $ ]
$17,945
FAMILY INCOME DEFICIT
0.53
INEQUALITY / GINI INDEX
3,572
TOTAL POPULATION
1,934
MALE POPULATION
1,638
FEMALE POPULATION
118.07
MALES / 100 FEMALES
84.69
FEMALES / 100 MALES
46.4
MEDIAN AGE
3.3
AVG FAMILY SIZE
3.0
AVG HOUSEHOLD SIZE
1,540
LABOR FORCE [ PEOPLE ]
55.4%
PERCENT IN LABOR FORCE
0.4%
UNEMPLOYMENT RATE
Income in Lloyd Harbor
Income Overview in Lloyd Harbor
Per Capita Income in Lloyd Harbor is $123,386, while median incomes of families and households are $250,001 and $233,007 respectively.
| Characteristic | Number | Measure |
| Per Capita Income | 3,572 | $123,386 |
| Median Family Income | 1,016 | $250,001 |
| Mean Family Income | 1,016 | $403,790 |
| Median Household Income | 1,167 | $233,007 |
| Mean Household Income | 1,167 | $372,238 |
| Income Deficit | 1,016 | $17,945 |
| Wage / Income Gap (%) | 3,572 | 50.89% |
| Wage / Income Gap ($) | 3,572 | 49.11¢ per $1 |
| Gini / Inequality Index | 3,572 | 0.53 |
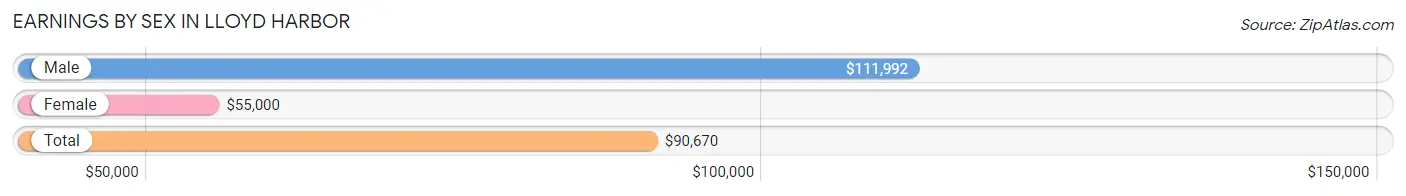
Earnings by Sex in Lloyd Harbor
Average Earnings in Lloyd Harbor are $90,670, $111,992 for men and $55,000 for women, a difference of 50.9%.
| Sex | Number | Average Earnings |
| Male | 1,139 (66.9%) | $111,992 |
| Female | 564 (33.1%) | $55,000 |
| Total | 1,703 (100.0%) | $90,670 |
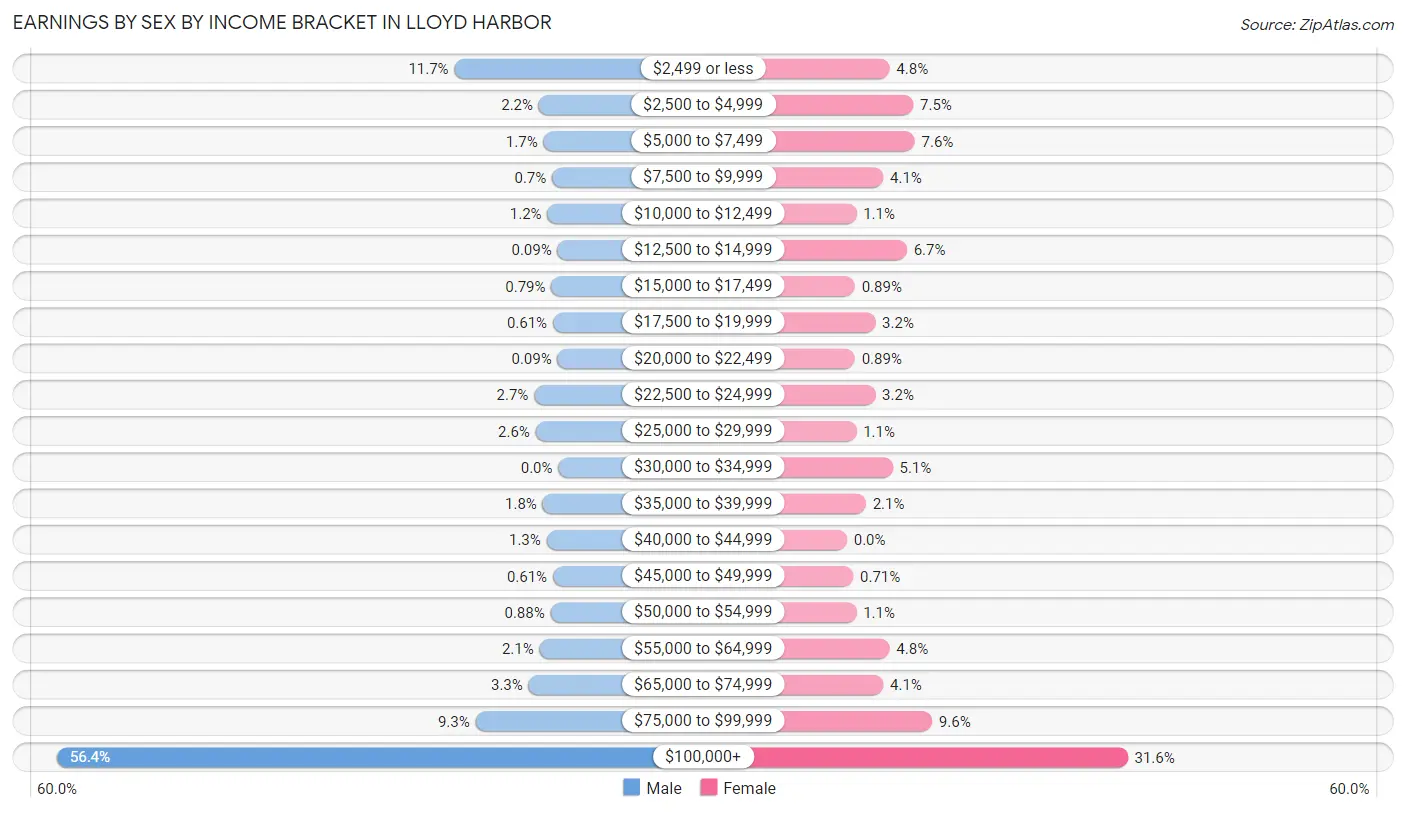
Earnings by Sex by Income Bracket in Lloyd Harbor
The most common earnings brackets in Lloyd Harbor are $100,000+ for men (642 | 56.4%) and $100,000+ for women (178 | 31.6%).
| Income | Male | Female |
| $2,499 or less | 133 (11.7%) | 27 (4.8%) |
| $2,500 to $4,999 | 25 (2.2%) | 42 (7.4%) |
| $5,000 to $7,499 | 19 (1.7%) | 43 (7.6%) |
| $7,500 to $9,999 | 8 (0.7%) | 23 (4.1%) |
| $10,000 to $12,499 | 14 (1.2%) | 6 (1.1%) |
| $12,500 to $14,999 | 1 (0.1%) | 38 (6.7%) |
| $15,000 to $17,499 | 9 (0.8%) | 5 (0.9%) |
| $17,500 to $19,999 | 7 (0.6%) | 18 (3.2%) |
| $20,000 to $22,499 | 1 (0.1%) | 5 (0.9%) |
| $22,500 to $24,999 | 31 (2.7%) | 18 (3.2%) |
| $25,000 to $29,999 | 29 (2.5%) | 6 (1.1%) |
| $30,000 to $34,999 | 0 (0.0%) | 29 (5.1%) |
| $35,000 to $39,999 | 20 (1.8%) | 12 (2.1%) |
| $40,000 to $44,999 | 15 (1.3%) | 0 (0.0%) |
| $45,000 to $49,999 | 7 (0.6%) | 4 (0.7%) |
| $50,000 to $54,999 | 10 (0.9%) | 6 (1.1%) |
| $55,000 to $64,999 | 24 (2.1%) | 27 (4.8%) |
| $65,000 to $74,999 | 38 (3.3%) | 23 (4.1%) |
| $75,000 to $99,999 | 106 (9.3%) | 54 (9.6%) |
| $100,000+ | 642 (56.4%) | 178 (31.6%) |
| Total | 1,139 (100.0%) | 564 (100.0%) |
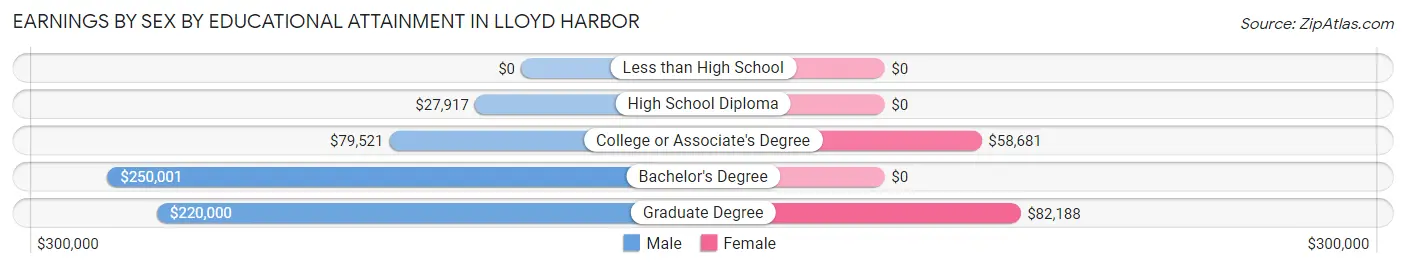
Earnings by Sex by Educational Attainment in Lloyd Harbor
Average earnings in Lloyd Harbor are $178,611 for men and $68,942 for women, a difference of 61.4%. Men with an educational attainment of bachelor's degree enjoy the highest average annual earnings of $250,001, while those with high school diploma education earn the least with $27,917. Women with an educational attainment of graduate degree earn the most with the average annual earnings of $82,188, while those with college or associate's degree education have the smallest earnings of $58,681.
| Educational Attainment | Male Income | Female Income |
| Less than High School | - | - |
| High School Diploma | $27,917 | $0 |
| College or Associate's Degree | $79,521 | $58,681 |
| Bachelor's Degree | $250,001 | $0 |
| Graduate Degree | $220,000 | $82,188 |
| Total | $178,611 | $68,942 |
Family Income in Lloyd Harbor
Family Income Brackets in Lloyd Harbor
According to the Lloyd Harbor family income data, there are 607 families falling into the $200,000+ income range, which is the most common income bracket and makes up 59.7% of all families.
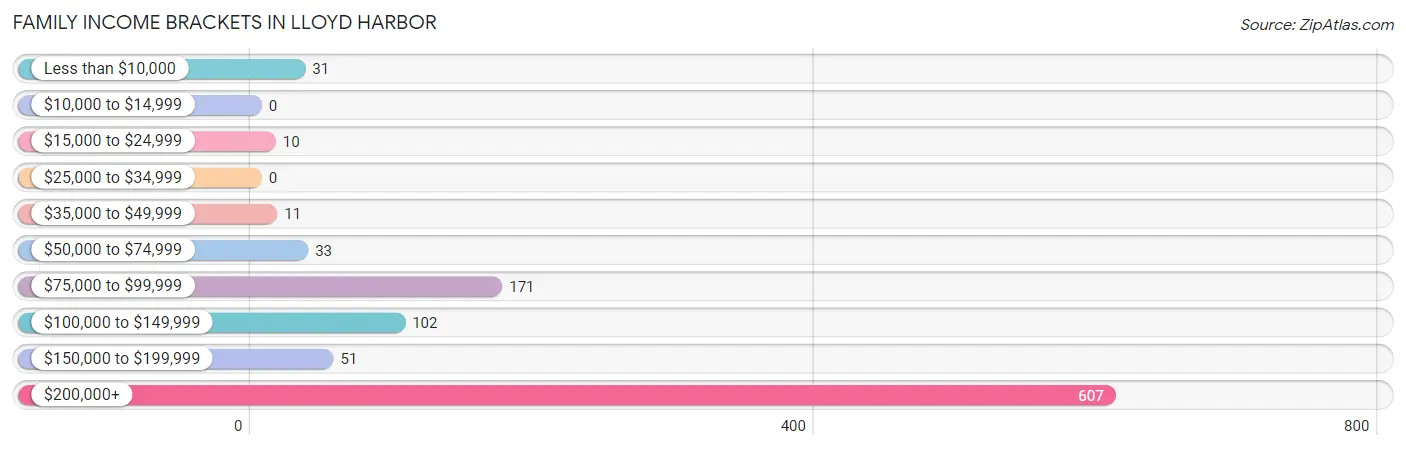
| Income Bracket | # Families | % Families |
| Less than $10,000 | 31 | 3.1% |
| $10,000 to $14,999 | 0 | 0.0% |
| $15,000 to $24,999 | 10 | 1.0% |
| $25,000 to $34,999 | 0 | 0.0% |
| $35,000 to $49,999 | 11 | 1.1% |
| $50,000 to $74,999 | 33 | 3.2% |
| $75,000 to $99,999 | 171 | 16.8% |
| $100,000 to $149,999 | 102 | 10.0% |
| $150,000 to $199,999 | 51 | 5.0% |
| $200,000+ | 607 | 59.7% |
Family Income by Famaliy Size in Lloyd Harbor
3-person families (107 | 10.5%) account for the highest median family income in Lloyd Harbor with $250,001 per family, while 3-person families (107 | 10.5%) have the highest median income of $83,334 per family member.
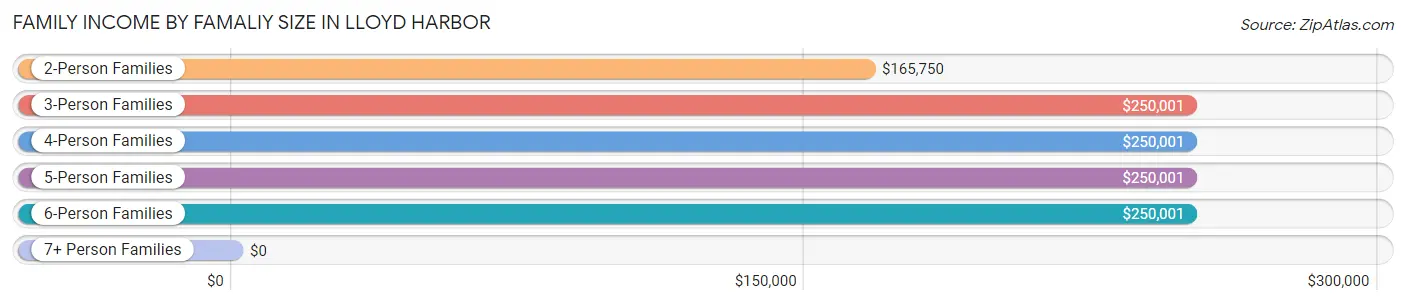
| Income Bracket | # Families | Median Income |
| 2-Person Families | 477 (46.9%) | $165,750 |
| 3-Person Families | 107 (10.5%) | $250,001 |
| 4-Person Families | 250 (24.6%) | $250,001 |
| 5-Person Families | 148 (14.6%) | $250,001 |
| 6-Person Families | 27 (2.7%) | $250,001 |
| 7+ Person Families | 7 (0.7%) | $0 |
| Total | 1,016 (100.0%) | $250,001 |
Family Income by Number of Earners in Lloyd Harbor
The median family income in Lloyd Harbor is $250,001, with families comprising 2 earners (327) having the highest median family income of $250,001, while families with no earners (106) have the lowest median family income of $107,083, accounting for 32.2% and 10.4% of families, respectively.
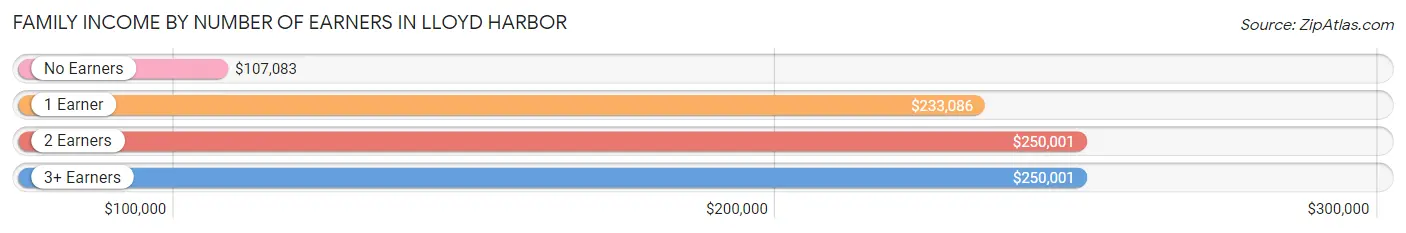
| Number of Earners | # Families | Median Income |
| No Earners | 106 (10.4%) | $107,083 |
| 1 Earner | 473 (46.6%) | $233,086 |
| 2 Earners | 327 (32.2%) | $250,001 |
| 3+ Earners | 110 (10.8%) | $250,001 |
| Total | 1,016 (100.0%) | $250,001 |
Household Income in Lloyd Harbor
Household Income Brackets in Lloyd Harbor
With 651 households falling in the category, the $200,000+ income range is the most frequent in Lloyd Harbor, accounting for 55.8% of all households.
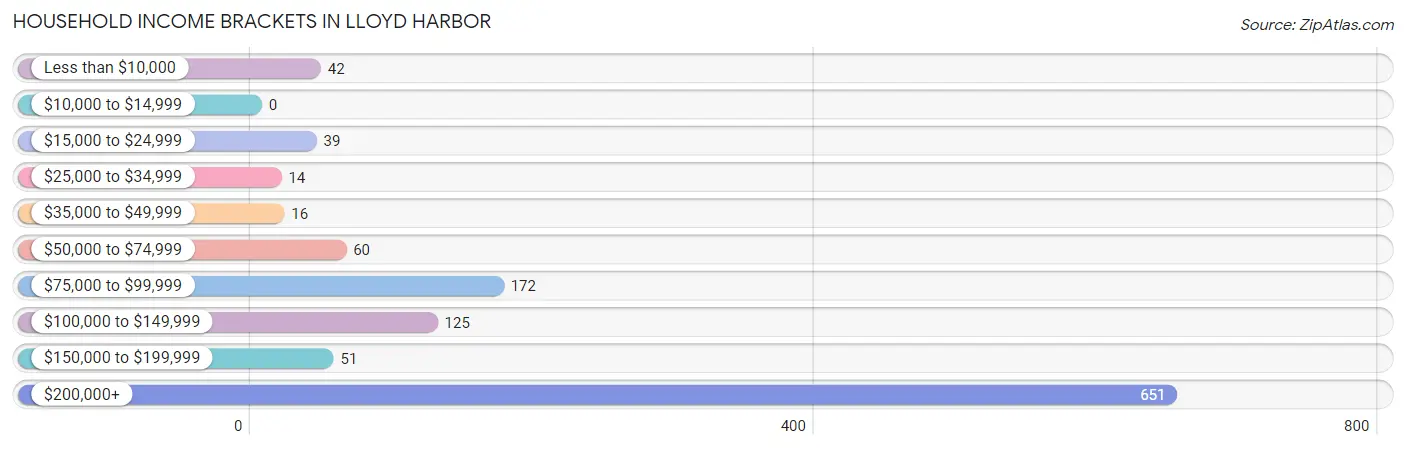
| Income Bracket | # Households | % Households |
| Less than $10,000 | 42 | 3.6% |
| $10,000 to $14,999 | 0 | 0.0% |
| $15,000 to $24,999 | 39 | 3.3% |
| $25,000 to $34,999 | 14 | 1.2% |
| $35,000 to $49,999 | 16 | 1.4% |
| $50,000 to $74,999 | 60 | 5.1% |
| $75,000 to $99,999 | 172 | 14.7% |
| $100,000 to $149,999 | 125 | 10.7% |
| $150,000 to $199,999 | 51 | 4.4% |
| $200,000+ | 651 | 55.8% |
Household Income by Householder Age in Lloyd Harbor
The median household income in Lloyd Harbor is $233,007, with the highest median household income of $250,001 found in the 45 to 64 years age bracket for the primary householder. A total of 538 households (46.1%) fall into this category.
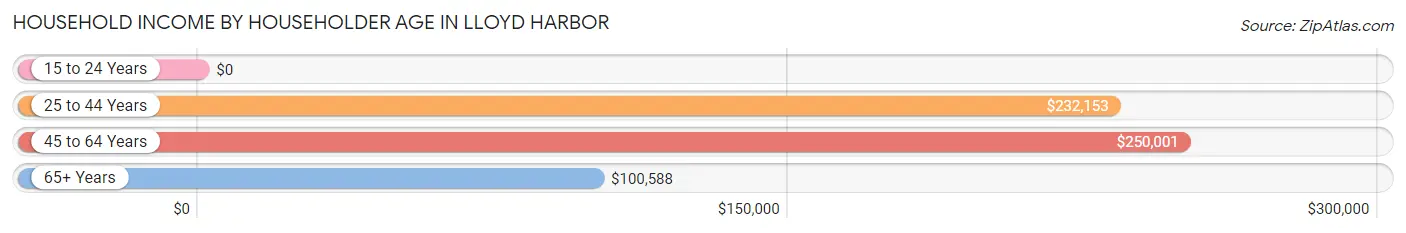
| Income Bracket | # Households | Median Income |
| 15 to 24 Years | 0 (0.0%) | $0 |
| 25 to 44 Years | 173 (14.8%) | $232,153 |
| 45 to 64 Years | 538 (46.1%) | $250,001 |
| 65+ Years | 456 (39.1%) | $100,588 |
| Total | 1,167 (100.0%) | $233,007 |
Poverty in Lloyd Harbor
Income Below Poverty by Sex and Age in Lloyd Harbor
With 4.0% poverty level for males and 5.0% for females among the residents of Lloyd Harbor, 12 to 14 year old males and 18 to 24 year old females are the most vulnerable to poverty, with 13 males (15.7%) and 43 females (47.8%) in their respective age groups living below the poverty level.
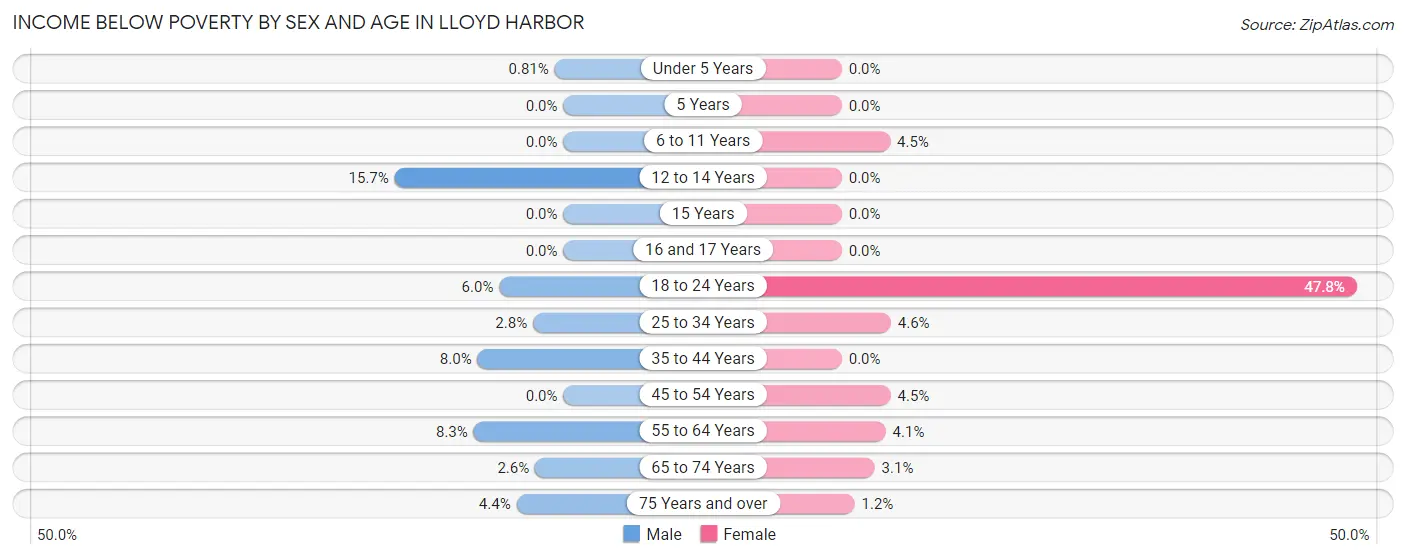
| Age Bracket | Male | Female |
| Under 5 Years | 1 (0.8%) | 0 (0.0%) |
| 5 Years | 0 (0.0%) | 0 (0.0%) |
| 6 to 11 Years | 0 (0.0%) | 6 (4.5%) |
| 12 to 14 Years | 13 (15.7%) | 0 (0.0%) |
| 15 Years | 0 (0.0%) | 0 (0.0%) |
| 16 and 17 Years | 0 (0.0%) | 0 (0.0%) |
| 18 to 24 Years | 10 (5.9%) | 43 (47.8%) |
| 25 to 34 Years | 2 (2.8%) | 3 (4.5%) |
| 35 to 44 Years | 11 (8.0%) | 0 (0.0%) |
| 45 to 54 Years | 0 (0.0%) | 11 (4.5%) |
| 55 to 64 Years | 30 (8.3%) | 12 (4.1%) |
| 65 to 74 Years | 6 (2.6%) | 4 (3.0%) |
| 75 Years and over | 5 (4.3%) | 3 (1.2%) |
| Total | 78 (4.0%) | 82 (5.0%) |
Income Above Poverty by Sex and Age in Lloyd Harbor
According to the poverty statistics in Lloyd Harbor, males aged 5 years and females aged under 5 years are the age groups that are most secure financially, with 100.0% of males and 100.0% of females in these age groups living above the poverty line.
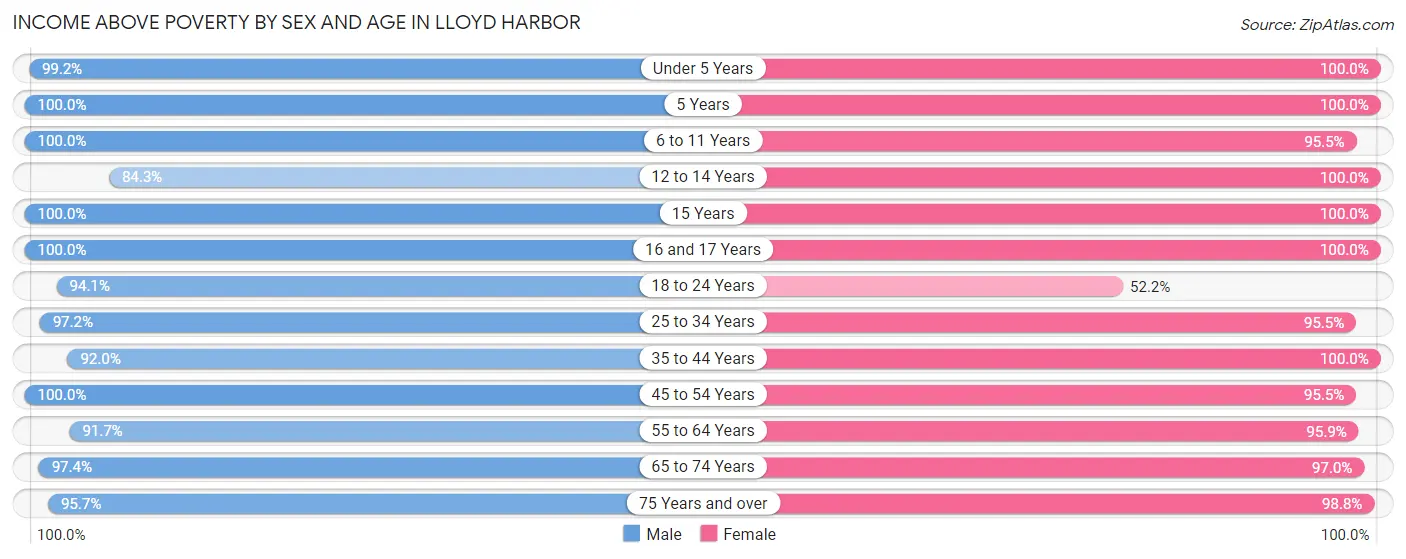
| Age Bracket | Male | Female |
| Under 5 Years | 123 (99.2%) | 26 (100.0%) |
| 5 Years | 7 (100.0%) | 14 (100.0%) |
| 6 to 11 Years | 246 (100.0%) | 128 (95.5%) |
| 12 to 14 Years | 70 (84.3%) | 94 (100.0%) |
| 15 Years | 37 (100.0%) | 27 (100.0%) |
| 16 and 17 Years | 67 (100.0%) | 74 (100.0%) |
| 18 to 24 Years | 158 (94.1%) | 47 (52.2%) |
| 25 to 34 Years | 69 (97.2%) | 63 (95.5%) |
| 35 to 44 Years | 127 (92.0%) | 189 (100.0%) |
| 45 to 54 Years | 290 (100.0%) | 232 (95.5%) |
| 55 to 64 Years | 330 (91.7%) | 283 (95.9%) |
| 65 to 74 Years | 222 (97.4%) | 127 (97.0%) |
| 75 Years and over | 110 (95.7%) | 250 (98.8%) |
| Total | 1,856 (96.0%) | 1,554 (95.0%) |
Income Below Poverty Among Married-Couple Families in Lloyd Harbor
The poverty statistics for married-couple families in Lloyd Harbor show that 3.5% or 31 of the total 883 families live below the poverty line. Families with no children have the highest poverty rate of 4.9%, comprising of 23 families. On the other hand, families with 1 or 2 children have the lowest poverty rate of 1.1%, which includes 3 families.
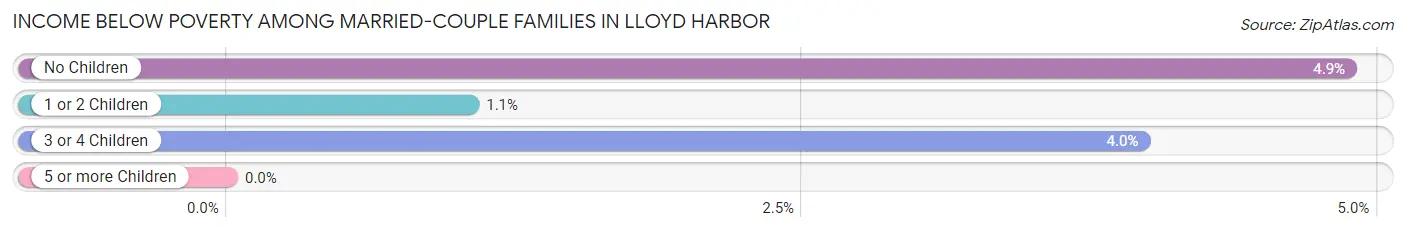
| Children | Above Poverty | Below Poverty |
| No Children | 449 (95.1%) | 23 (4.9%) |
| 1 or 2 Children | 282 (99.0%) | 3 (1.1%) |
| 3 or 4 Children | 121 (96.0%) | 5 (4.0%) |
| 5 or more Children | 0 (0.0%) | 0 (0.0%) |
| Total | 852 (96.5%) | 31 (3.5%) |
Income Below Poverty Among Single-Parent Households in Lloyd Harbor
| Children | Single Father | Single Mother |
| No Children | 0 (0.0%) | 0 (0.0%) |
| 1 or 2 Children | 0 (0.0%) | 0 (0.0%) |
| 3 or 4 Children | 0 (0.0%) | 0 (0.0%) |
| 5 or more Children | 0 (0.0%) | 0 (0.0%) |
| Total | 0 (0.0%) | 0 (0.0%) |
Income Below Poverty Among Married-Couple vs Single-Parent Households in Lloyd Harbor
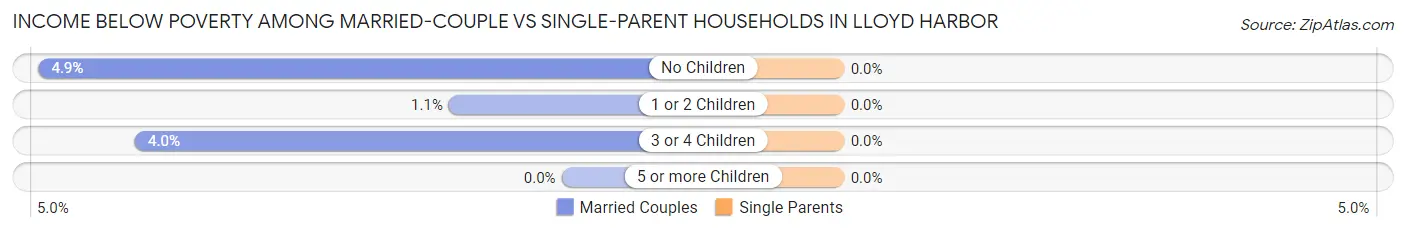
| Children | Married-Couple Families | Single-Parent Households |
| No Children | 23 (4.9%) | 0 (0.0%) |
| 1 or 2 Children | 3 (1.1%) | 0 (0.0%) |
| 3 or 4 Children | 5 (4.0%) | 0 (0.0%) |
| 5 or more Children | 0 (0.0%) | 0 (0.0%) |
| Total | 31 (3.5%) | 0 (0.0%) |
Race in Lloyd Harbor
The most populous races in Lloyd Harbor are White / Caucasian (3,150 | 88.2%), Two or more Races (178 | 5.0%), and Hispanic or Latino (144 | 4.0%).
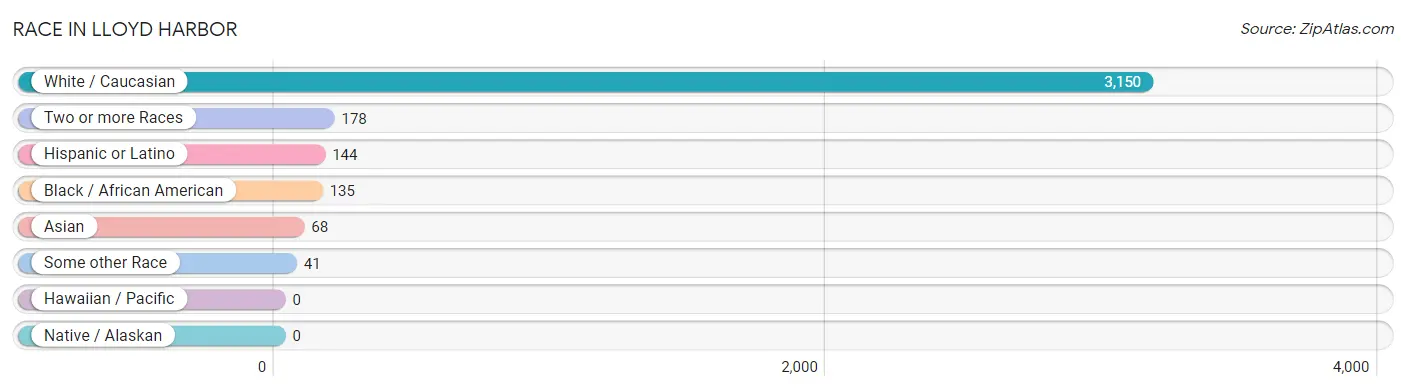
| Race | # Population | % Population |
| Asian | 68 | 1.9% |
| Black / African American | 135 | 3.8% |
| Hawaiian / Pacific | 0 | 0.0% |
| Hispanic or Latino | 144 | 4.0% |
| Native / Alaskan | 0 | 0.0% |
| White / Caucasian | 3,150 | 88.2% |
| Two or more Races | 178 | 5.0% |
| Some other Race | 41 | 1.1% |
| Total | 3,572 | 100.0% |
Ancestry in Lloyd Harbor
The most populous ancestries reported in Lloyd Harbor are Italian (758 | 21.2%), Irish (678 | 19.0%), German (416 | 11.7%), English (251 | 7.0%), and Norwegian (151 | 4.2%), together accounting for 63.1% of all Lloyd Harbor residents.
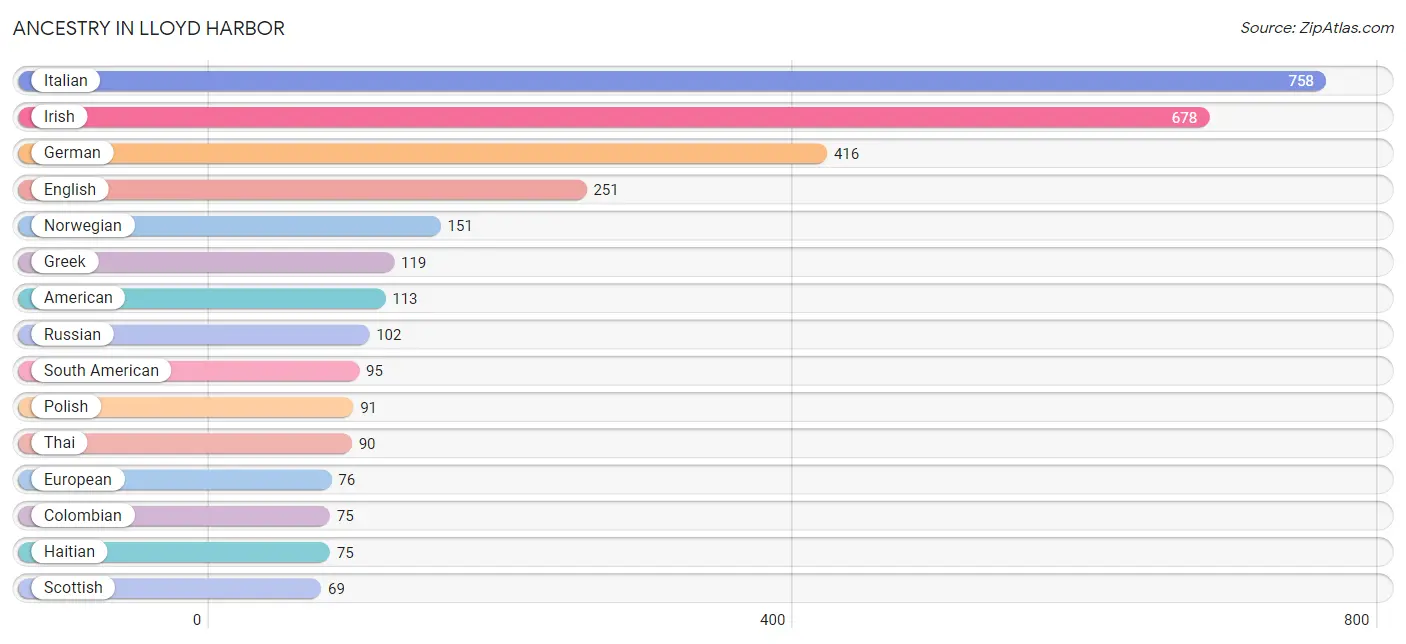
| Ancestry | # Population | % Population |
| American | 113 | 3.2% |
| Arab | 12 | 0.3% |
| Argentinean | 20 | 0.6% |
| Armenian | 22 | 0.6% |
| Austrian | 38 | 1.1% |
| Belgian | 21 | 0.6% |
| Brazilian | 8 | 0.2% |
| British | 13 | 0.4% |
| Burmese | 12 | 0.3% |
| Canadian | 13 | 0.4% |
| Colombian | 75 | 2.1% |
| Cuban | 26 | 0.7% |
| Czech | 5 | 0.1% |
| Danish | 24 | 0.7% |
| Dominican | 5 | 0.1% |
| Dutch | 16 | 0.4% |
| Eastern European | 30 | 0.8% |
| English | 251 | 7.0% |
| European | 76 | 2.1% |
| French | 22 | 0.6% |
| German | 416 | 11.7% |
| Greek | 119 | 3.3% |
| Guyanese | 1 | 0.0% |
| Haitian | 75 | 2.1% |
| Hungarian | 23 | 0.6% |
| Indian (Asian) | 20 | 0.6% |
| Iranian | 7 | 0.2% |
| Irish | 678 | 19.0% |
| Italian | 758 | 21.2% |
| Korean | 25 | 0.7% |
| Latvian | 8 | 0.2% |
| Lebanese | 6 | 0.2% |
| Lithuanian | 14 | 0.4% |
| Maltese | 23 | 0.6% |
| Mexican | 9 | 0.3% |
| Mexican American Indian | 3 | 0.1% |
| Northern European | 14 | 0.4% |
| Norwegian | 151 | 4.2% |
| Polish | 91 | 2.5% |
| Portuguese | 8 | 0.2% |
| Puerto Rican | 5 | 0.1% |
| Romanian | 6 | 0.2% |
| Russian | 102 | 2.9% |
| Scotch-Irish | 6 | 0.2% |
| Scottish | 69 | 1.9% |
| Slavic | 20 | 0.6% |
| Slovak | 5 | 0.1% |
| South American | 95 | 2.7% |
| Spaniard | 3 | 0.1% |
| Swedish | 43 | 1.2% |
| Swiss | 6 | 0.2% |
| Syrian | 6 | 0.2% |
| Thai | 90 | 2.5% |
| Ukrainian | 24 | 0.7% |
| Welsh | 22 | 0.6% | View All 55 Rows |
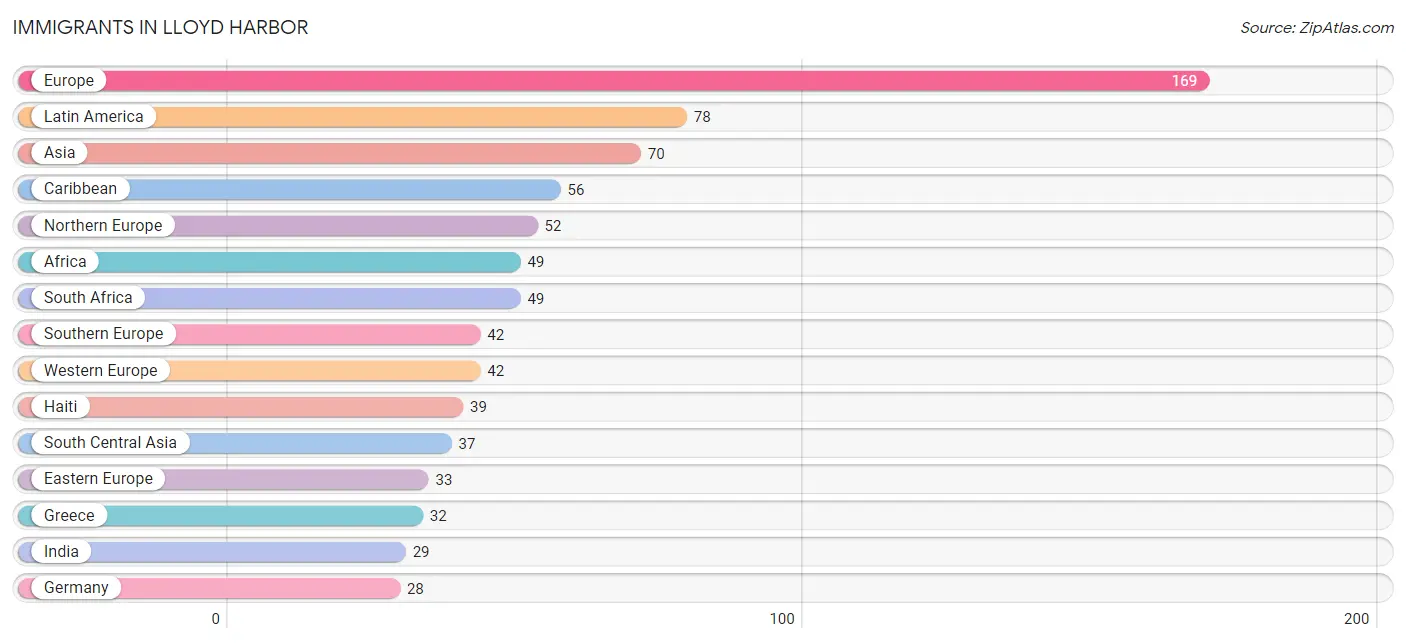
Immigrants in Lloyd Harbor
The most numerous immigrant groups reported in Lloyd Harbor came from Europe (169 | 4.7%), Latin America (78 | 2.2%), Asia (70 | 2.0%), Caribbean (56 | 1.6%), and Northern Europe (52 | 1.5%), together accounting for 11.9% of all Lloyd Harbor residents.
| Immigration Origin | # Population | % Population |
| Africa | 49 | 1.4% |
| Asia | 70 | 2.0% |
| Belgium | 8 | 0.2% |
| Brazil | 12 | 0.3% |
| Canada | 9 | 0.3% |
| Caribbean | 56 | 1.6% |
| Central America | 10 | 0.3% |
| China | 8 | 0.2% |
| Cuba | 12 | 0.3% |
| Dominican Republic | 5 | 0.1% |
| Eastern Asia | 20 | 0.6% |
| Eastern Europe | 33 | 0.9% |
| England | 11 | 0.3% |
| Europe | 169 | 4.7% |
| France | 6 | 0.2% |
| Germany | 28 | 0.8% |
| Greece | 32 | 0.9% |
| Haiti | 39 | 1.1% |
| Hungary | 6 | 0.2% |
| India | 29 | 0.8% |
| Ireland | 9 | 0.3% |
| Korea | 12 | 0.3% |
| Latin America | 78 | 2.2% |
| Mexico | 10 | 0.3% |
| Northern Europe | 52 | 1.5% |
| Norway | 5 | 0.1% |
| Philippines | 7 | 0.2% |
| Russia | 7 | 0.2% |
| Scotland | 15 | 0.4% |
| South Africa | 49 | 1.4% |
| South America | 12 | 0.3% |
| South Central Asia | 37 | 1.0% |
| South Eastern Asia | 8 | 0.2% |
| Southern Europe | 42 | 1.2% |
| Spain | 10 | 0.3% |
| Thailand | 1 | 0.0% |
| Turkey | 5 | 0.1% |
| Ukraine | 20 | 0.6% |
| Uzbekistan | 8 | 0.2% |
| Western Asia | 5 | 0.1% |
| Western Europe | 42 | 1.2% | View All 41 Rows |
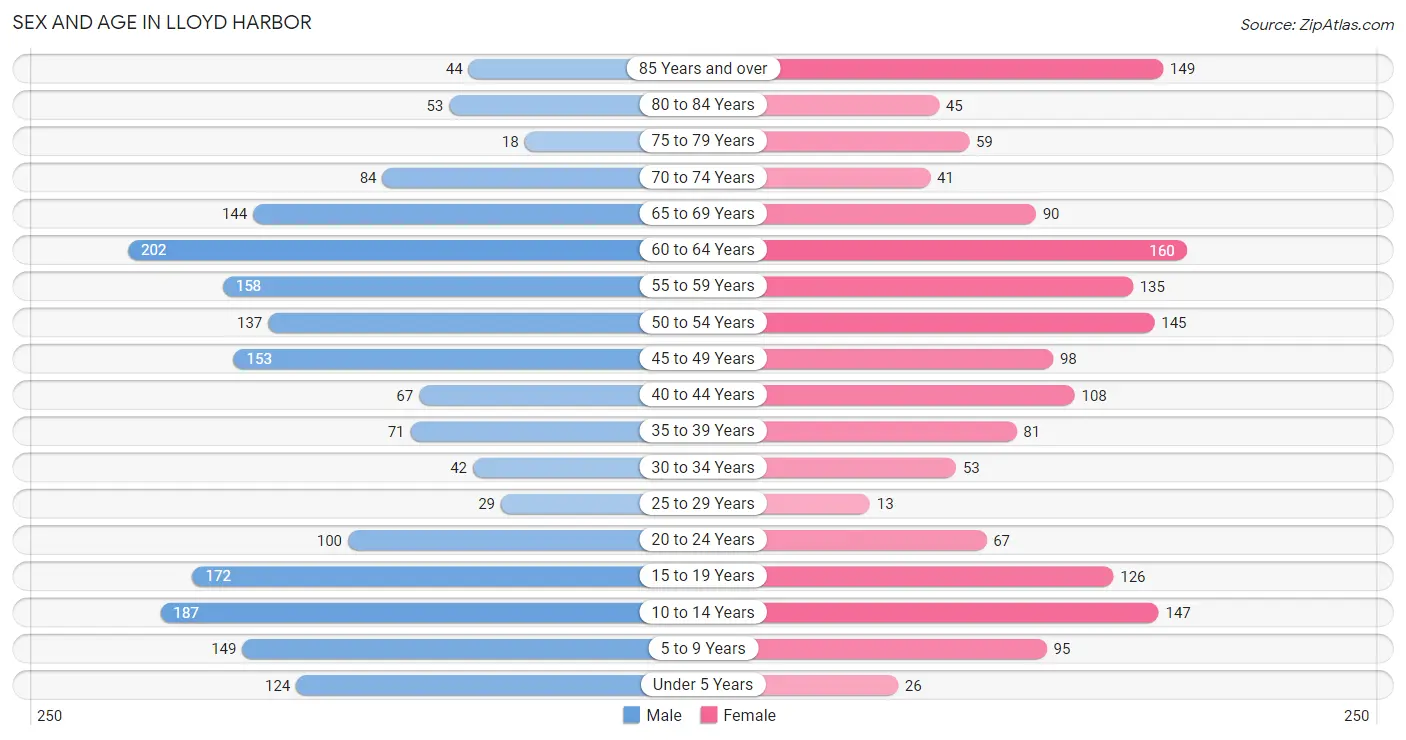
Sex and Age in Lloyd Harbor
Sex and Age in Lloyd Harbor
The most populous age groups in Lloyd Harbor are 60 to 64 Years (202 | 10.4%) for men and 60 to 64 Years (160 | 9.8%) for women.
| Age Bracket | Male | Female |
| Under 5 Years | 124 (6.4%) | 26 (1.6%) |
| 5 to 9 Years | 149 (7.7%) | 95 (5.8%) |
| 10 to 14 Years | 187 (9.7%) | 147 (9.0%) |
| 15 to 19 Years | 172 (8.9%) | 126 (7.7%) |
| 20 to 24 Years | 100 (5.2%) | 67 (4.1%) |
| 25 to 29 Years | 29 (1.5%) | 13 (0.8%) |
| 30 to 34 Years | 42 (2.2%) | 53 (3.2%) |
| 35 to 39 Years | 71 (3.7%) | 81 (5.0%) |
| 40 to 44 Years | 67 (3.5%) | 108 (6.6%) |
| 45 to 49 Years | 153 (7.9%) | 98 (6.0%) |
| 50 to 54 Years | 137 (7.1%) | 145 (8.8%) |
| 55 to 59 Years | 158 (8.2%) | 135 (8.2%) |
| 60 to 64 Years | 202 (10.4%) | 160 (9.8%) |
| 65 to 69 Years | 144 (7.4%) | 90 (5.5%) |
| 70 to 74 Years | 84 (4.3%) | 41 (2.5%) |
| 75 to 79 Years | 18 (0.9%) | 59 (3.6%) |
| 80 to 84 Years | 53 (2.7%) | 45 (2.8%) |
| 85 Years and over | 44 (2.3%) | 149 (9.1%) |
| Total | 1,934 (100.0%) | 1,638 (100.0%) |
Families and Households in Lloyd Harbor
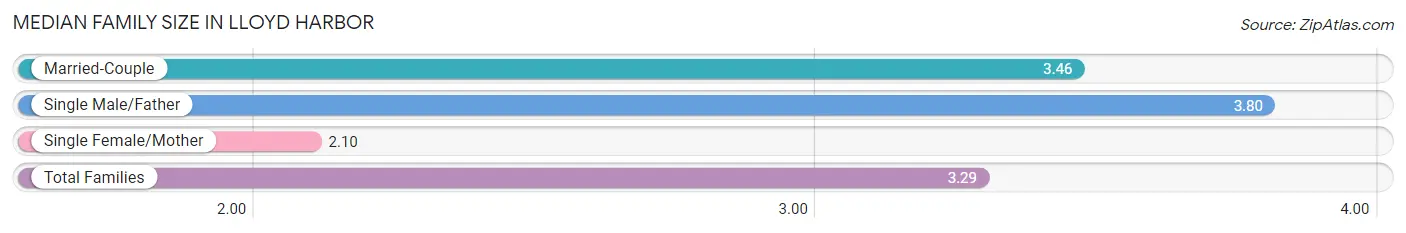
Median Family Size in Lloyd Harbor
The median family size in Lloyd Harbor is 3.29 persons per family, with single male/father families (5 | 0.5%) accounting for the largest median family size of 3.8 persons per family. On the other hand, single female/mother families (128 | 12.6%) represent the smallest median family size with 2.10 persons per family.
| Family Type | # Families | Family Size |
| Married-Couple | 883 (86.9%) | 3.46 |
| Single Male/Father | 5 (0.5%) | 3.80 |
| Single Female/Mother | 128 (12.6%) | 2.10 |
| Total Families | 1,016 (100.0%) | 3.29 |
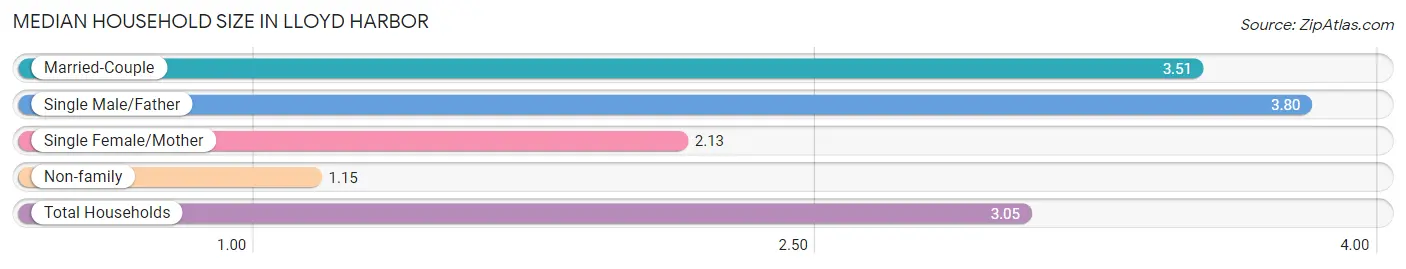
Median Household Size in Lloyd Harbor
The median household size in Lloyd Harbor is 3.05 persons per household, with single male/father households (5 | 0.4%) accounting for the largest median household size of 3.8 persons per household. non-family households (151 | 12.9%) represent the smallest median household size with 1.15 persons per household.
| Household Type | # Households | Household Size |
| Married-Couple | 883 (75.7%) | 3.51 |
| Single Male/Father | 5 (0.4%) | 3.80 |
| Single Female/Mother | 128 (11.0%) | 2.13 |
| Non-family | 151 (12.9%) | 1.15 |
| Total Households | 1,167 (100.0%) | 3.05 |
Household Size by Marriage Status in Lloyd Harbor
Out of a total of 1,167 households in Lloyd Harbor, 1,016 (87.1%) are family households, while 151 (12.9%) are nonfamily households. The most numerous type of family households are 2-person households, comprising 474, and the most common type of nonfamily households are 1-person households, comprising 131.
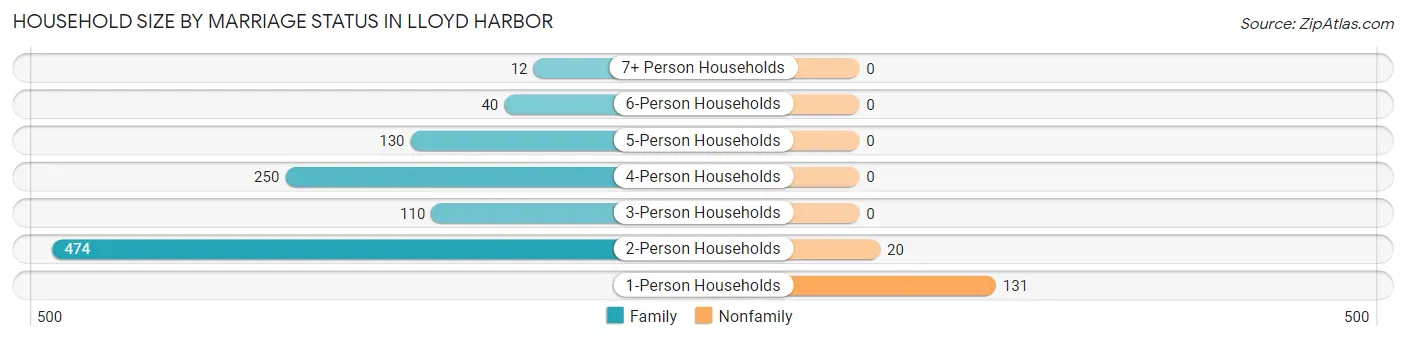
| Household Size | Family Households | Nonfamily Households |
| 1-Person Households | - | 131 (11.2%) |
| 2-Person Households | 474 (40.6%) | 20 (1.7%) |
| 3-Person Households | 110 (9.4%) | 0 (0.0%) |
| 4-Person Households | 250 (21.4%) | 0 (0.0%) |
| 5-Person Households | 130 (11.1%) | 0 (0.0%) |
| 6-Person Households | 40 (3.4%) | 0 (0.0%) |
| 7+ Person Households | 12 (1.0%) | 0 (0.0%) |
| Total | 1,016 (87.1%) | 151 (12.9%) |
Female Fertility in Lloyd Harbor
Fertility by Age in Lloyd Harbor
Average fertility rate in Lloyd Harbor is 40.0 births per 1,000 women. Women in the age bracket of 20 to 34 years have the highest fertility rate with 53.0 births per 1,000 women. Women in the age bracket of 35 to 50 years acount for 69.6% of all women with births.
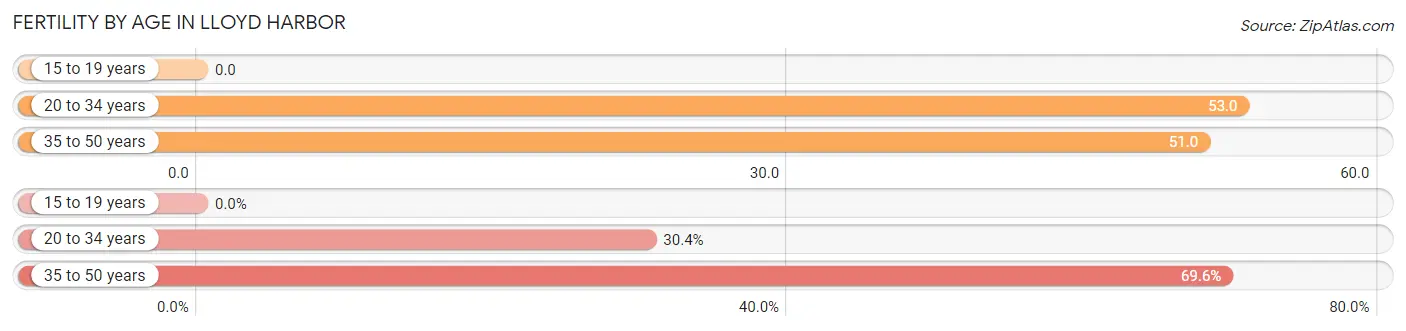
| Age Bracket | Women with Births | Births / 1,000 Women |
| 15 to 19 years | 0 (0.0%) | 0.0 |
| 20 to 34 years | 7 (30.4%) | 53.0 |
| 35 to 50 years | 16 (69.6%) | 51.0 |
| Total | 23 (100.0%) | 40.0 |
Fertility by Age by Marriage Status in Lloyd Harbor
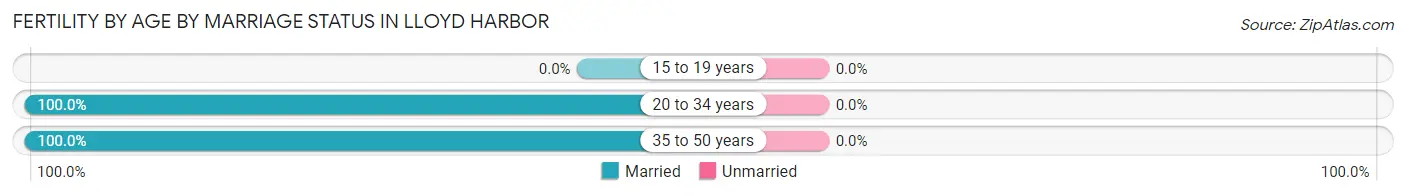
| Age Bracket | Married | Unmarried |
| 15 to 19 years | 0 (0.0%) | 0 (0.0%) |
| 20 to 34 years | 7 (100.0%) | 0 (0.0%) |
| 35 to 50 years | 16 (100.0%) | 0 (0.0%) |
| Total | 23 (100.0%) | 0 (0.0%) |
Fertility by Education in Lloyd Harbor
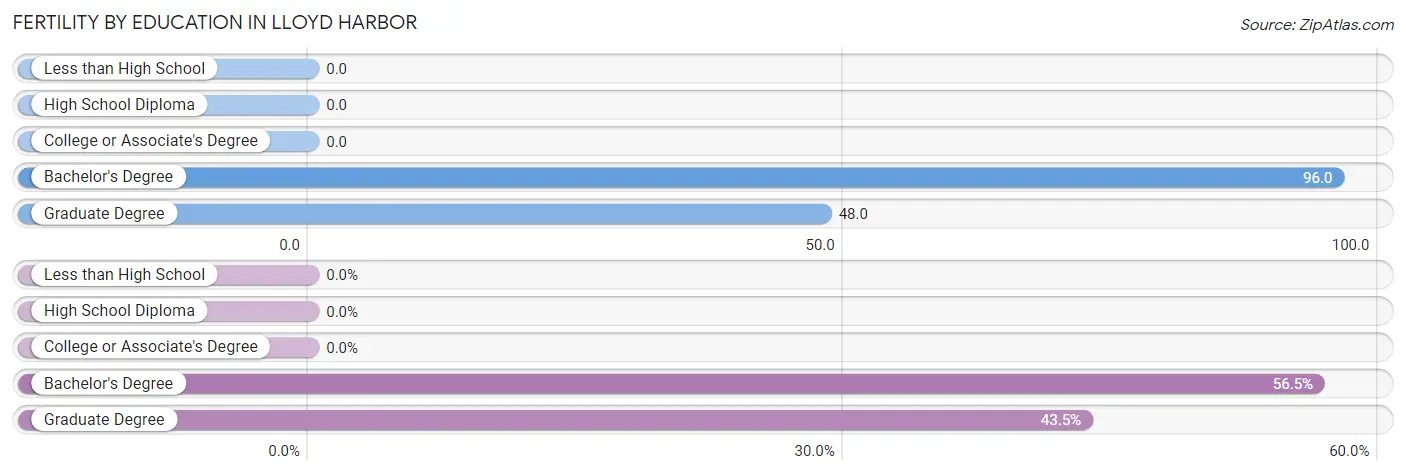
| Educational Attainment | Women with Births | Births / 1,000 Women |
| Less than High School | 0 (0.0%) | 0.0 |
| High School Diploma | 0 (0.0%) | 0.0 |
| College or Associate's Degree | 0 (0.0%) | 0.0 |
| Bachelor's Degree | 13 (56.5%) | 96.0 |
| Graduate Degree | 10 (43.5%) | 48.0 |
| Total | 23 (100.0%) | 40.0 |
Fertility by Education by Marriage Status in Lloyd Harbor
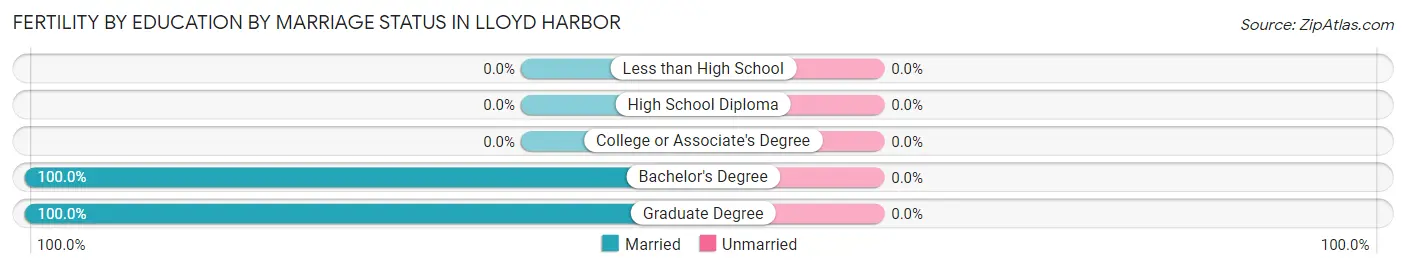
| Educational Attainment | Married | Unmarried |
| Less than High School | 0 (0.0%) | 0 (0.0%) |
| High School Diploma | 0 (0.0%) | 0 (0.0%) |
| College or Associate's Degree | 0 (0.0%) | 0 (0.0%) |
| Bachelor's Degree | 13 (100.0%) | 0 (0.0%) |
| Graduate Degree | 10 (100.0%) | 0 (0.0%) |
| Total | 23 (100.0%) | 0 (0.0%) |
Employment Characteristics in Lloyd Harbor
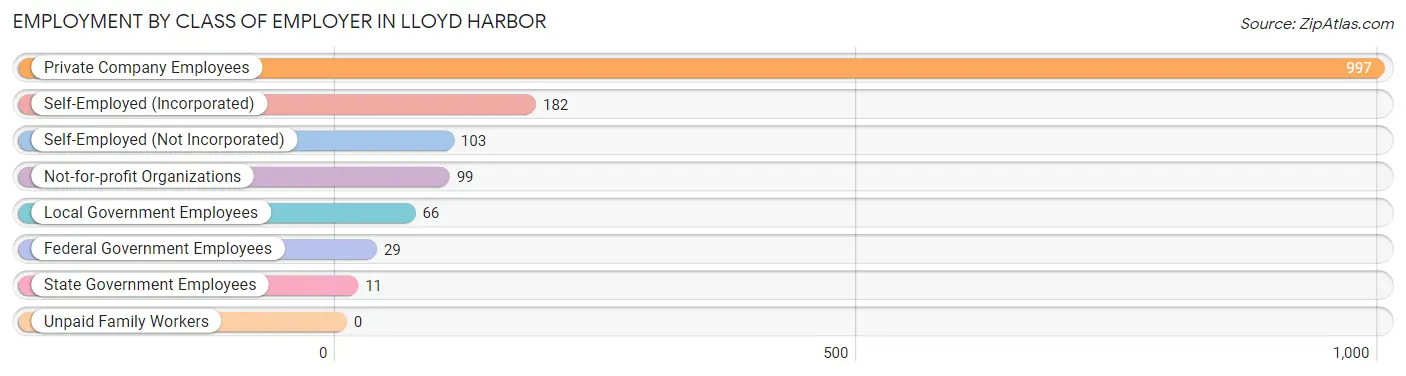
Employment by Class of Employer in Lloyd Harbor
Among the 1,487 employed individuals in Lloyd Harbor, private company employees (997 | 67.0%), self-employed (incorporated) (182 | 12.2%), and self-employed (not incorporated) (103 | 6.9%) make up the most common classes of employment.
| Employer Class | # Employees | % Employees |
| Private Company Employees | 997 | 67.0% |
| Self-Employed (Incorporated) | 182 | 12.2% |
| Self-Employed (Not Incorporated) | 103 | 6.9% |
| Not-for-profit Organizations | 99 | 6.7% |
| Local Government Employees | 66 | 4.4% |
| State Government Employees | 11 | 0.7% |
| Federal Government Employees | 29 | 1.9% |
| Unpaid Family Workers | 0 | 0.0% |
| Total | 1,487 | 100.0% |
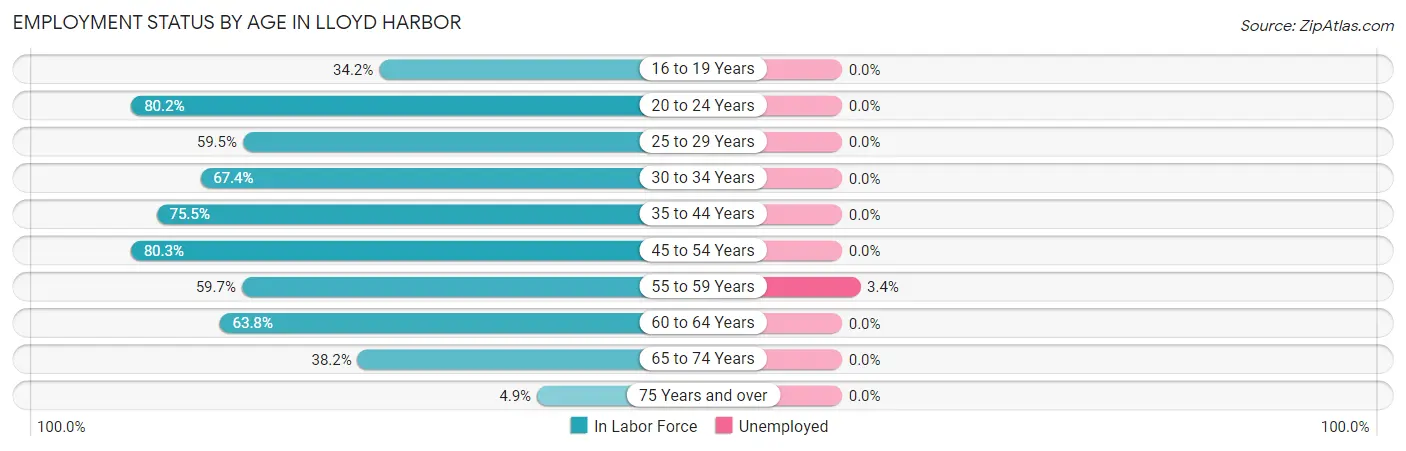
Employment Status by Age in Lloyd Harbor
According to the labor force statistics for Lloyd Harbor, out of the total population over 16 years of age (2,780), 55.4% or 1,540 individuals are in the labor force, with 0.4% or 6 of them unemployed. The age group with the highest labor force participation rate is 45 to 54 years, with 80.3% or 428 individuals in the labor force. Within the labor force, the 55 to 59 years age range has the highest percentage of unemployed individuals, with 3.4% or 6 of them being unemployed.
| Age Bracket | In Labor Force | Unemployed |
| 16 to 19 Years | 80 (34.2%) | 0 (0.0%) |
| 20 to 24 Years | 134 (80.2%) | 0 (0.0%) |
| 25 to 29 Years | 25 (59.5%) | 0 (0.0%) |
| 30 to 34 Years | 64 (67.4%) | 0 (0.0%) |
| 35 to 44 Years | 247 (75.5%) | 0 (0.0%) |
| 45 to 54 Years | 428 (80.3%) | 0 (0.0%) |
| 55 to 59 Years | 175 (59.7%) | 6 (3.4%) |
| 60 to 64 Years | 231 (63.8%) | 0 (0.0%) |
| 65 to 74 Years | 137 (38.2%) | 0 (0.0%) |
| 75 Years and over | 18 (4.9%) | 0 (0.0%) |
| Total | 1,540 (55.4%) | 6 (0.4%) |
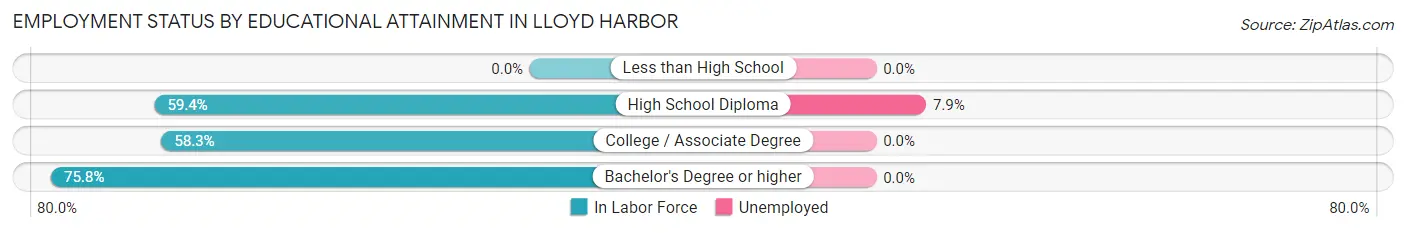
Employment Status by Educational Attainment in Lloyd Harbor
According to labor force statistics for Lloyd Harbor, 70.8% of individuals (1,170) out of the total population between 25 and 64 years of age (1,652) are in the labor force, with 0.5% or 6 of them being unemployed. The group with the highest labor force participation rate are those with the educational attainment of bachelor's degree or higher, with 75.8% or 932 individuals in the labor force. Within the labor force, individuals with high school diploma education have the highest percentage of unemployment, with 7.9% or 6 of them being unemployed.
| Educational Attainment | In Labor Force | Unemployed |
| Less than High School | 0 (0.0%) | 0 (0.0%) |
| High School Diploma | 76 (59.4%) | 10 (7.9%) |
| College / Associate Degree | 162 (58.3%) | 0 (0.0%) |
| Bachelor's Degree or higher | 932 (75.8%) | 0 (0.0%) |
| Total | 1,170 (70.8%) | 8 (0.5%) |
Employment Occupations by Sex in Lloyd Harbor
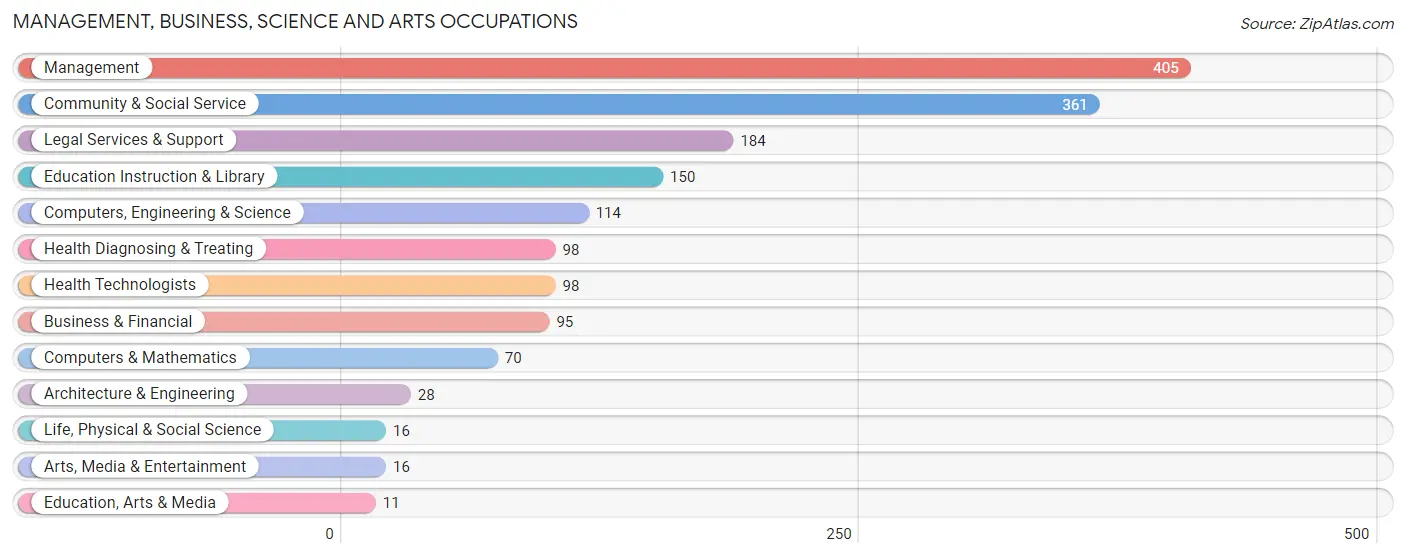
Management, Business, Science and Arts Occupations
The most common Management, Business, Science and Arts occupations in Lloyd Harbor are Management (405 | 26.4%), Community & Social Service (361 | 23.5%), Legal Services & Support (184 | 12.0%), Education Instruction & Library (150 | 9.8%), and Computers, Engineering & Science (114 | 7.4%).
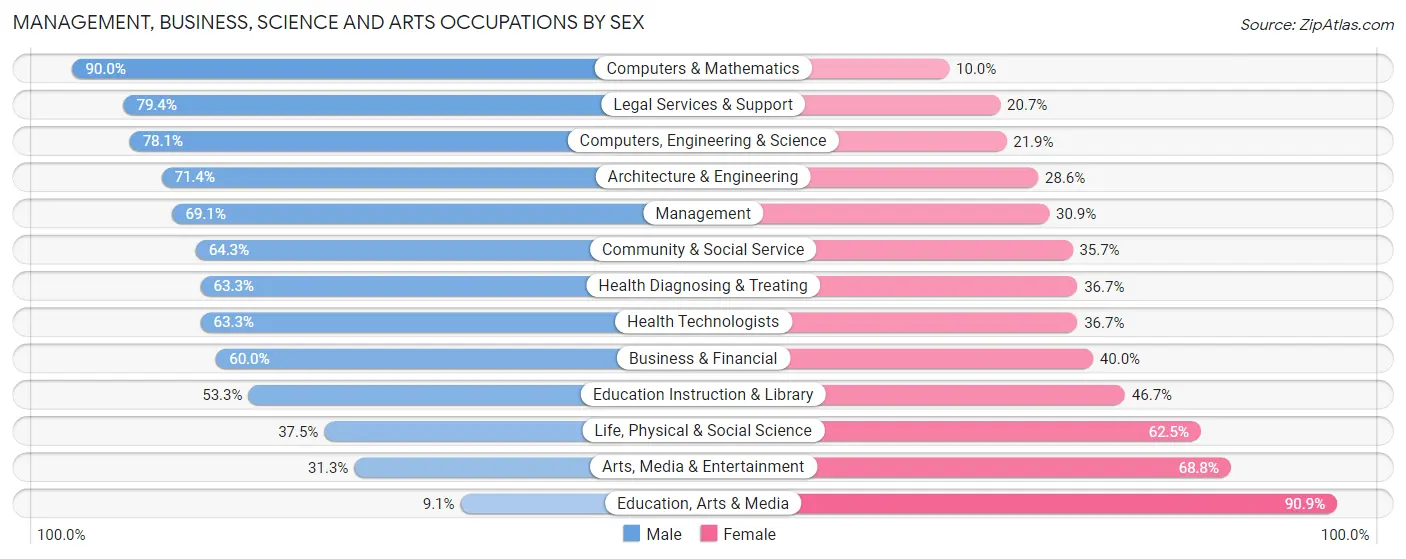
Management, Business, Science and Arts Occupations by Sex
Within the Management, Business, Science and Arts occupations in Lloyd Harbor, the most male-oriented occupations are Computers & Mathematics (90.0%), Legal Services & Support (79.3%), and Computers, Engineering & Science (78.1%), while the most female-oriented occupations are Education, Arts & Media (90.9%), Arts, Media & Entertainment (68.8%), and Life, Physical & Social Science (62.5%).
| Occupation | Male | Female |
| Management | 280 (69.1%) | 125 (30.9%) |
| Business & Financial | 57 (60.0%) | 38 (40.0%) |
| Computers, Engineering & Science | 89 (78.1%) | 25 (21.9%) |
| Computers & Mathematics | 63 (90.0%) | 7 (10.0%) |
| Architecture & Engineering | 20 (71.4%) | 8 (28.6%) |
| Life, Physical & Social Science | 6 (37.5%) | 10 (62.5%) |
| Community & Social Service | 232 (64.3%) | 129 (35.7%) |
| Education, Arts & Media | 1 (9.1%) | 10 (90.9%) |
| Legal Services & Support | 146 (79.3%) | 38 (20.6%) |
| Education Instruction & Library | 80 (53.3%) | 70 (46.7%) |
| Arts, Media & Entertainment | 5 (31.2%) | 11 (68.8%) |
| Health Diagnosing & Treating | 62 (63.3%) | 36 (36.7%) |
| Health Technologists | 62 (63.3%) | 36 (36.7%) |
| Total (Category) | 720 (67.1%) | 353 (32.9%) |
| Total (Overall) | 1,043 (68.0%) | 490 (32.0%) |
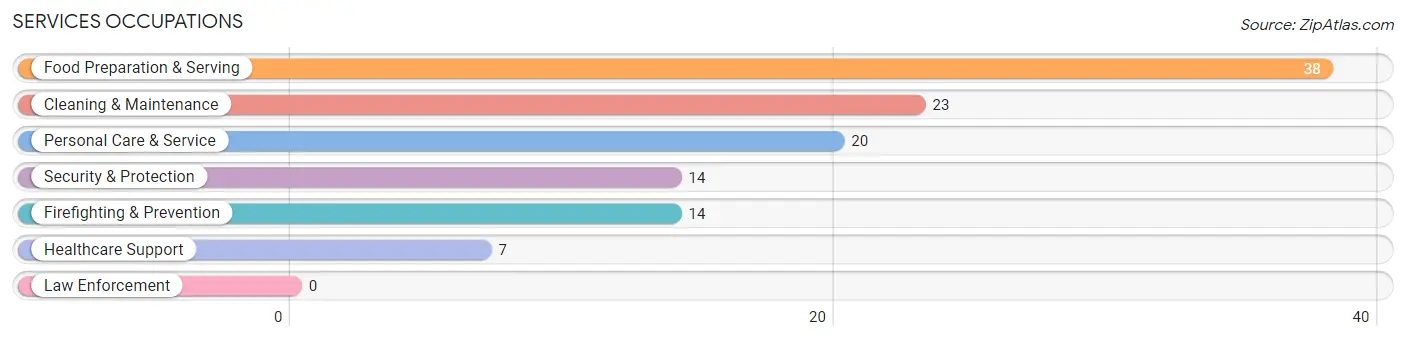
Services Occupations
The most common Services occupations in Lloyd Harbor are Food Preparation & Serving (38 | 2.5%), Cleaning & Maintenance (23 | 1.5%), Personal Care & Service (20 | 1.3%), Security & Protection (14 | 0.9%), and Firefighting & Prevention (14 | 0.9%).
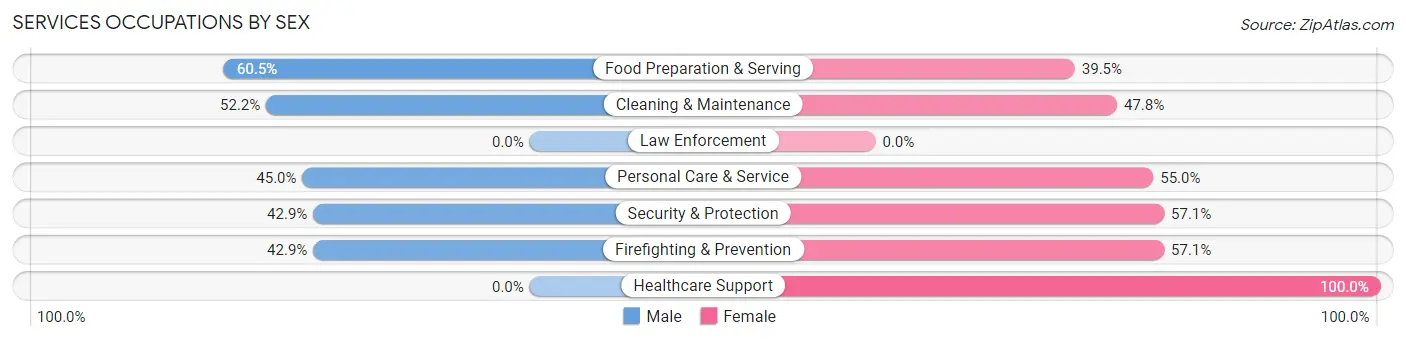
Services Occupations by Sex
Within the Services occupations in Lloyd Harbor, the most male-oriented occupations are Food Preparation & Serving (60.5%), Cleaning & Maintenance (52.2%), and Personal Care & Service (45.0%), while the most female-oriented occupations are Healthcare Support (100.0%), Security & Protection (57.1%), and Firefighting & Prevention (57.1%).
| Occupation | Male | Female |
| Healthcare Support | 0 (0.0%) | 7 (100.0%) |
| Security & Protection | 6 (42.9%) | 8 (57.1%) |
| Firefighting & Prevention | 6 (42.9%) | 8 (57.1%) |
| Law Enforcement | 0 (0.0%) | 0 (0.0%) |
| Food Preparation & Serving | 23 (60.5%) | 15 (39.5%) |
| Cleaning & Maintenance | 12 (52.2%) | 11 (47.8%) |
| Personal Care & Service | 9 (45.0%) | 11 (55.0%) |
| Total (Category) | 50 (49.0%) | 52 (51.0%) |
| Total (Overall) | 1,043 (68.0%) | 490 (32.0%) |
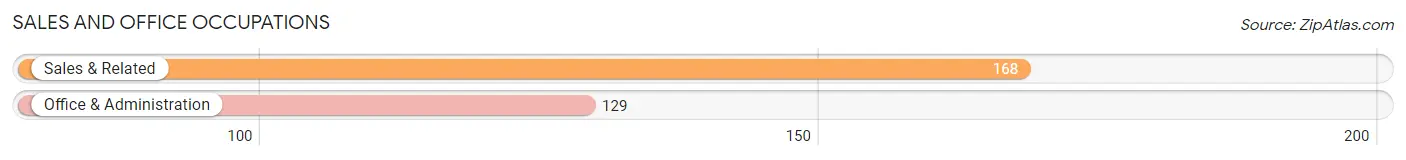
Sales and Office Occupations
The most common Sales and Office occupations in Lloyd Harbor are Sales & Related (168 | 11.0%), and Office & Administration (129 | 8.4%).
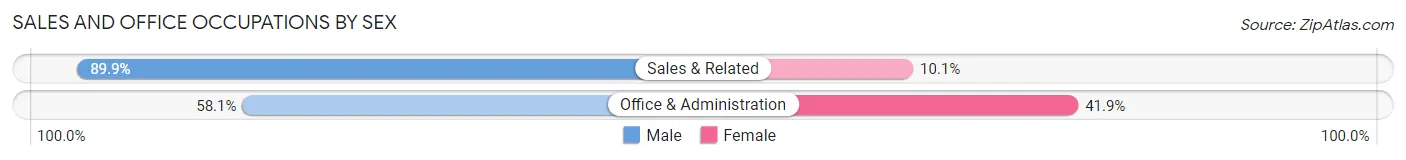
Sales and Office Occupations by Sex
| Occupation | Male | Female |
| Sales & Related | 151 (89.9%) | 17 (10.1%) |
| Office & Administration | 75 (58.1%) | 54 (41.9%) |
| Total (Category) | 226 (76.1%) | 71 (23.9%) |
| Total (Overall) | 1,043 (68.0%) | 490 (32.0%) |
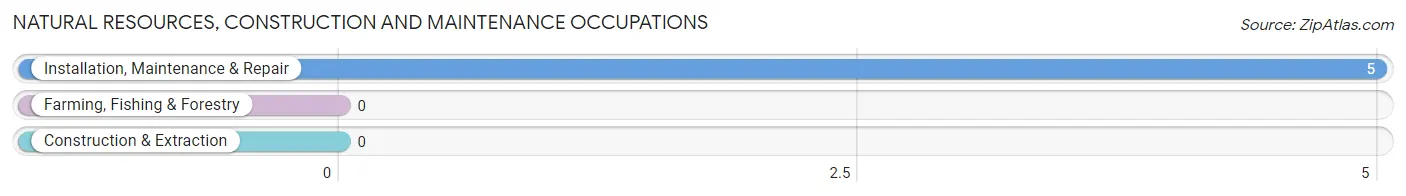
Natural Resources, Construction and Maintenance Occupations
The most common Natural Resources, Construction and Maintenance occupations in Lloyd Harbor are , and Installation, Maintenance & Repair (5 | 0.3%).
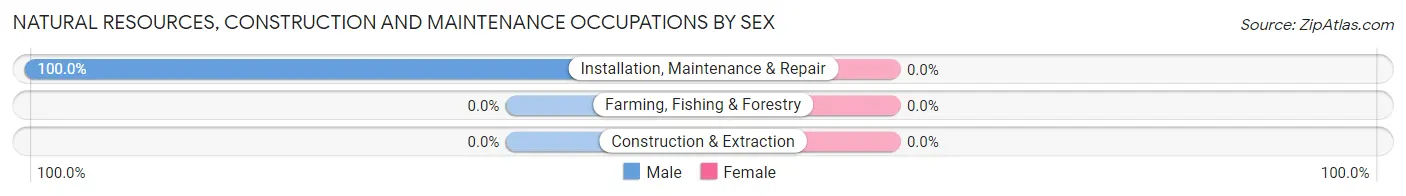
Natural Resources, Construction and Maintenance Occupations by Sex
| Occupation | Male | Female |
| Farming, Fishing & Forestry | 0 (0.0%) | 0 (0.0%) |
| Construction & Extraction | 0 (0.0%) | 0 (0.0%) |
| Installation, Maintenance & Repair | 5 (100.0%) | 0 (0.0%) |
| Total (Category) | 5 (100.0%) | 0 (0.0%) |
| Total (Overall) | 1,043 (68.0%) | 490 (32.0%) |
Production, Transportation and Moving Occupations
The most common Production, Transportation and Moving occupations in Lloyd Harbor are Production (28 | 1.8%), and Material Moving (28 | 1.8%).
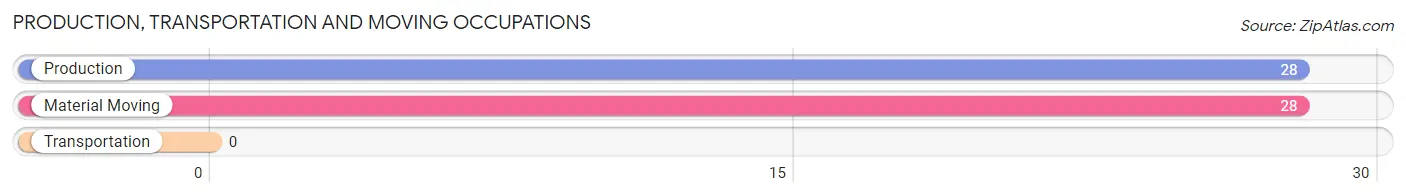
Production, Transportation and Moving Occupations by Sex
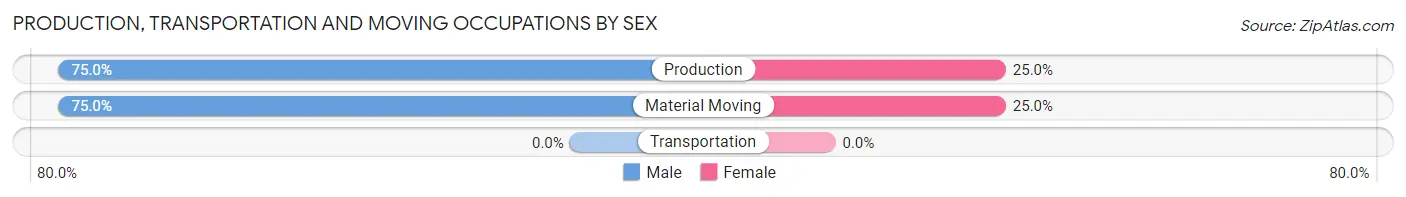
| Occupation | Male | Female |
| Production | 21 (75.0%) | 7 (25.0%) |
| Transportation | 0 (0.0%) | 0 (0.0%) |
| Material Moving | 21 (75.0%) | 7 (25.0%) |
| Total (Category) | 42 (75.0%) | 14 (25.0%) |
| Total (Overall) | 1,043 (68.0%) | 490 (32.0%) |
Employment Industries by Sex in Lloyd Harbor
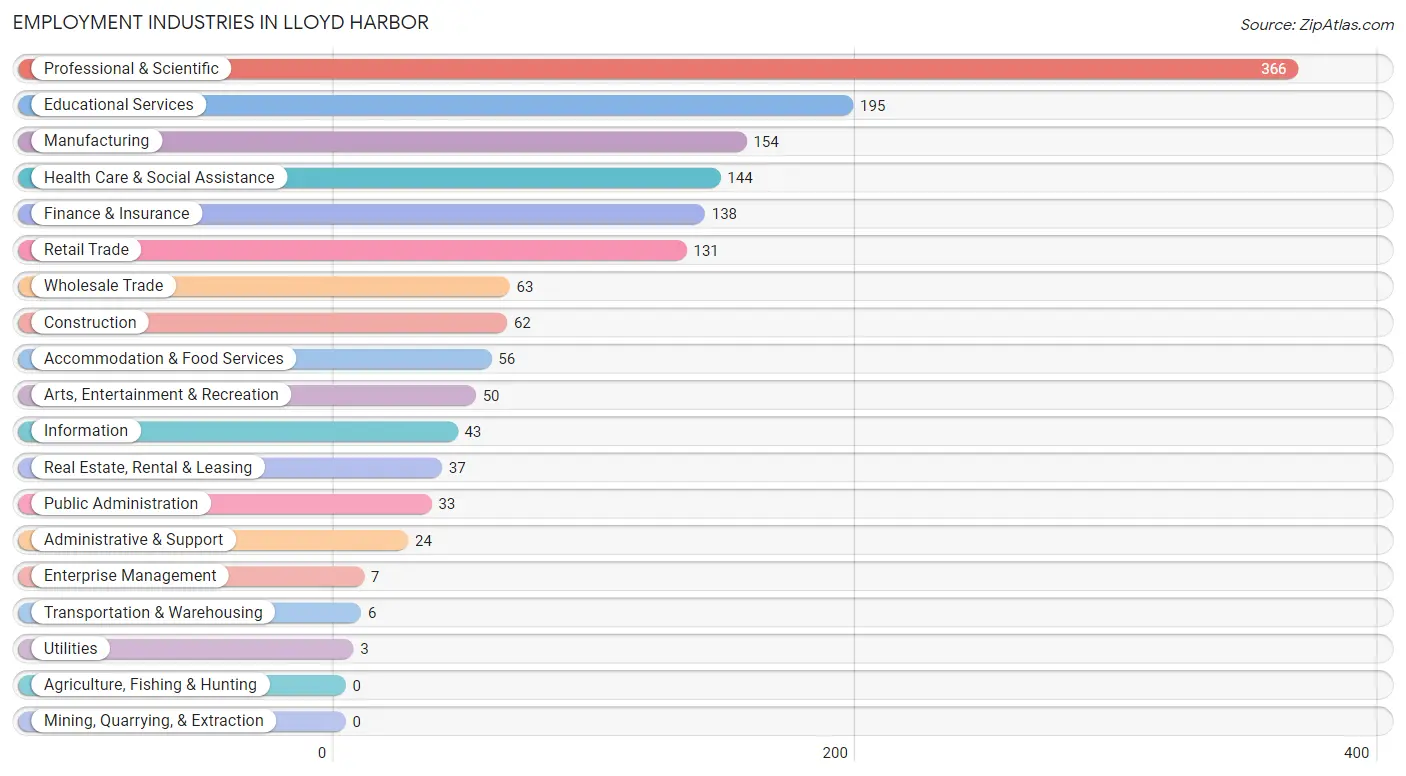
Employment Industries in Lloyd Harbor
The major employment industries in Lloyd Harbor include Professional & Scientific (366 | 23.9%), Educational Services (195 | 12.7%), Manufacturing (154 | 10.1%), Health Care & Social Assistance (144 | 9.4%), and Finance & Insurance (138 | 9.0%).
Employment Industries by Sex in Lloyd Harbor
The Lloyd Harbor industries that see more men than women are Construction (100.0%), Transportation & Warehousing (100.0%), and Utilities (100.0%), whereas the industries that tend to have a higher number of women are Educational Services (59.5%), Health Care & Social Assistance (45.8%), and Manufacturing (45.5%).
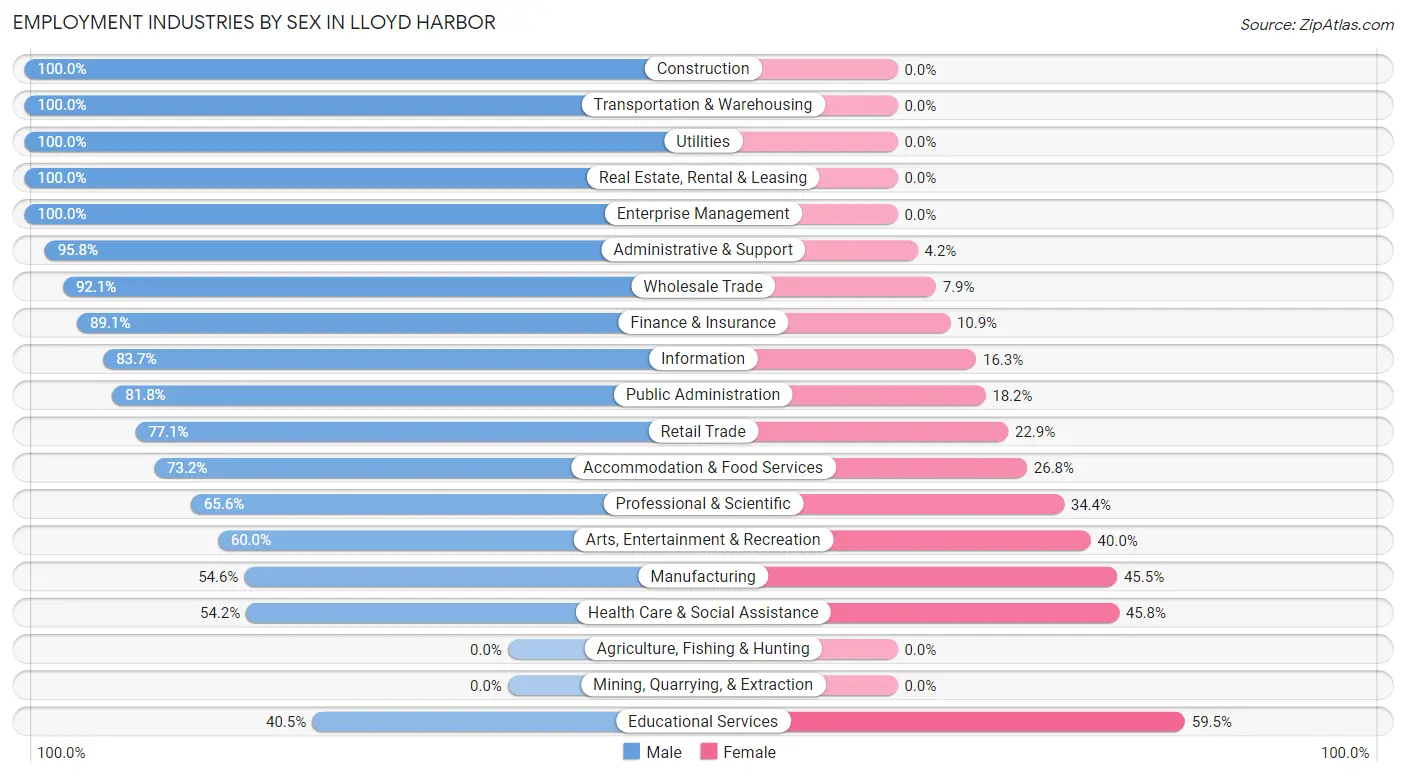
| Industry | Male | Female |
| Agriculture, Fishing & Hunting | 0 (0.0%) | 0 (0.0%) |
| Mining, Quarrying, & Extraction | 0 (0.0%) | 0 (0.0%) |
| Construction | 62 (100.0%) | 0 (0.0%) |
| Manufacturing | 84 (54.5%) | 70 (45.5%) |
| Wholesale Trade | 58 (92.1%) | 5 (7.9%) |
| Retail Trade | 101 (77.1%) | 30 (22.9%) |
| Transportation & Warehousing | 6 (100.0%) | 0 (0.0%) |
| Utilities | 3 (100.0%) | 0 (0.0%) |
| Information | 36 (83.7%) | 7 (16.3%) |
| Finance & Insurance | 123 (89.1%) | 15 (10.9%) |
| Real Estate, Rental & Leasing | 37 (100.0%) | 0 (0.0%) |
| Professional & Scientific | 240 (65.6%) | 126 (34.4%) |
| Enterprise Management | 7 (100.0%) | 0 (0.0%) |
| Administrative & Support | 23 (95.8%) | 1 (4.2%) |
| Educational Services | 79 (40.5%) | 116 (59.5%) |
| Health Care & Social Assistance | 78 (54.2%) | 66 (45.8%) |
| Arts, Entertainment & Recreation | 30 (60.0%) | 20 (40.0%) |
| Accommodation & Food Services | 41 (73.2%) | 15 (26.8%) |
| Public Administration | 27 (81.8%) | 6 (18.2%) |
| Total | 1,043 (68.0%) | 490 (32.0%) |
Education in Lloyd Harbor
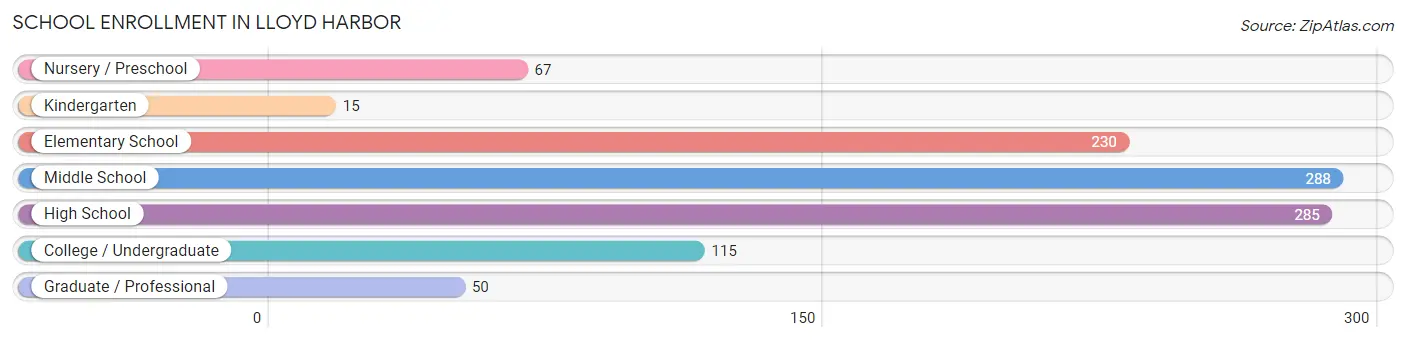
School Enrollment in Lloyd Harbor
The most common levels of schooling among the 1,050 students in Lloyd Harbor are middle school (288 | 27.4%), high school (285 | 27.1%), and elementary school (230 | 21.9%).
| School Level | # Students | % Students |
| Nursery / Preschool | 67 | 6.4% |
| Kindergarten | 15 | 1.4% |
| Elementary School | 230 | 21.9% |
| Middle School | 288 | 27.4% |
| High School | 285 | 27.1% |
| College / Undergraduate | 115 | 11.0% |
| Graduate / Professional | 50 | 4.8% |
| Total | 1,050 | 100.0% |
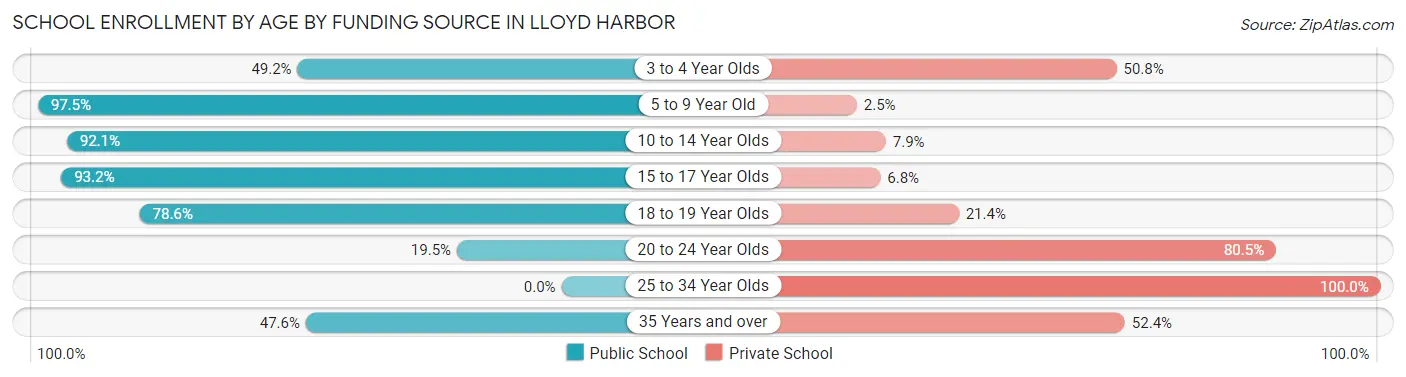
School Enrollment by Age by Funding Source in Lloyd Harbor
Out of a total of 1,050 students who are enrolled in schools in Lloyd Harbor, 197 (18.8%) attend a private institution, while the remaining 853 (81.2%) are enrolled in public schools. The age group of 25 to 34 year olds has the highest likelihood of being enrolled in private schools, with 19 (100.0% in the age bracket) enrolled. Conversely, the age group of 5 to 9 year old has the lowest likelihood of being enrolled in a private school, with 238 (97.5% in the age bracket) attending a public institution.
| Age Bracket | Public School | Private School |
| 3 to 4 Year Olds | 30 (49.2%) | 31 (50.8%) |
| 5 to 9 Year Old | 238 (97.5%) | 6 (2.5%) |
| 10 to 14 Year Olds | 293 (92.1%) | 25 (7.9%) |
| 15 to 17 Year Olds | 191 (93.2%) | 14 (6.8%) |
| 18 to 19 Year Olds | 66 (78.6%) | 18 (21.4%) |
| 20 to 24 Year Olds | 15 (19.5%) | 62 (80.5%) |
| 25 to 34 Year Olds | 0 (0.0%) | 19 (100.0%) |
| 35 Years and over | 20 (47.6%) | 22 (52.4%) |
| Total | 853 (81.2%) | 197 (18.8%) |
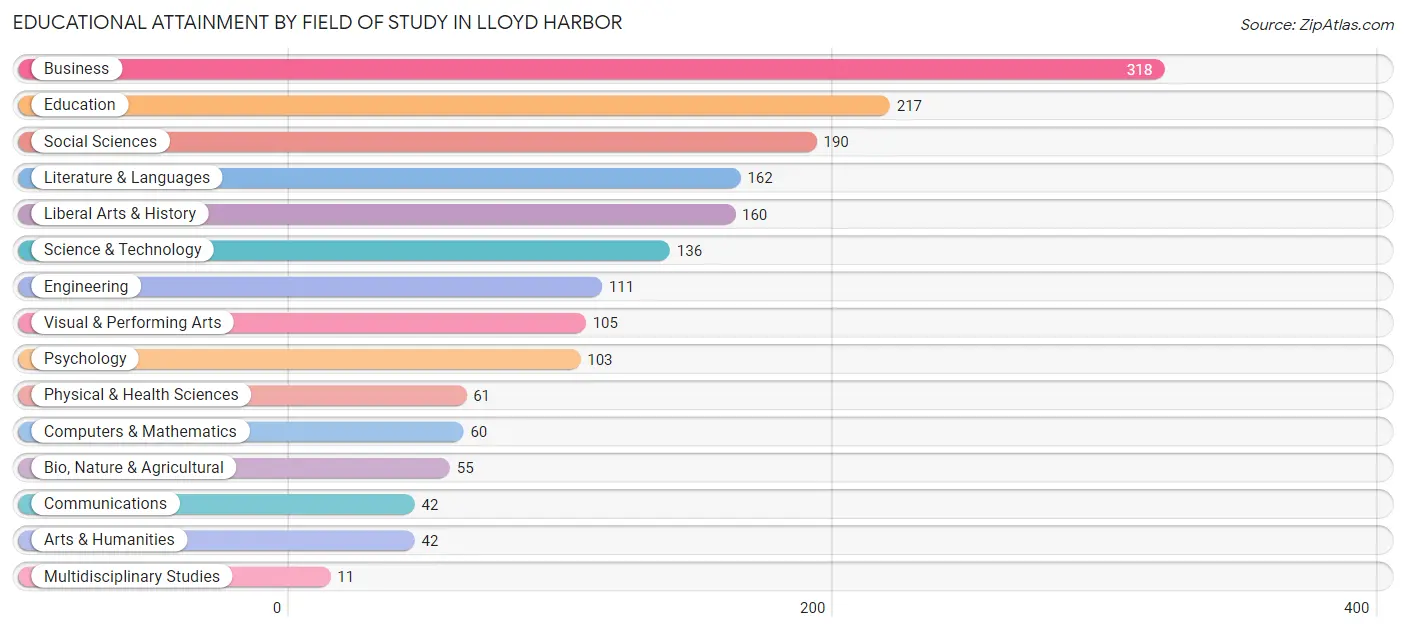
Educational Attainment by Field of Study in Lloyd Harbor
Business (318 | 17.9%), education (217 | 12.2%), social sciences (190 | 10.7%), literature & languages (162 | 9.1%), and liberal arts & history (160 | 9.0%) are the most common fields of study among 1,773 individuals in Lloyd Harbor who have obtained a bachelor's degree or higher.
| Field of Study | # Graduates | % Graduates |
| Computers & Mathematics | 60 | 3.4% |
| Bio, Nature & Agricultural | 55 | 3.1% |
| Physical & Health Sciences | 61 | 3.4% |
| Psychology | 103 | 5.8% |
| Social Sciences | 190 | 10.7% |
| Engineering | 111 | 6.3% |
| Multidisciplinary Studies | 11 | 0.6% |
| Science & Technology | 136 | 7.7% |
| Business | 318 | 17.9% |
| Education | 217 | 12.2% |
| Literature & Languages | 162 | 9.1% |
| Liberal Arts & History | 160 | 9.0% |
| Visual & Performing Arts | 105 | 5.9% |
| Communications | 42 | 2.4% |
| Arts & Humanities | 42 | 2.4% |
| Total | 1,773 | 100.0% |
Transportation & Commute in Lloyd Harbor
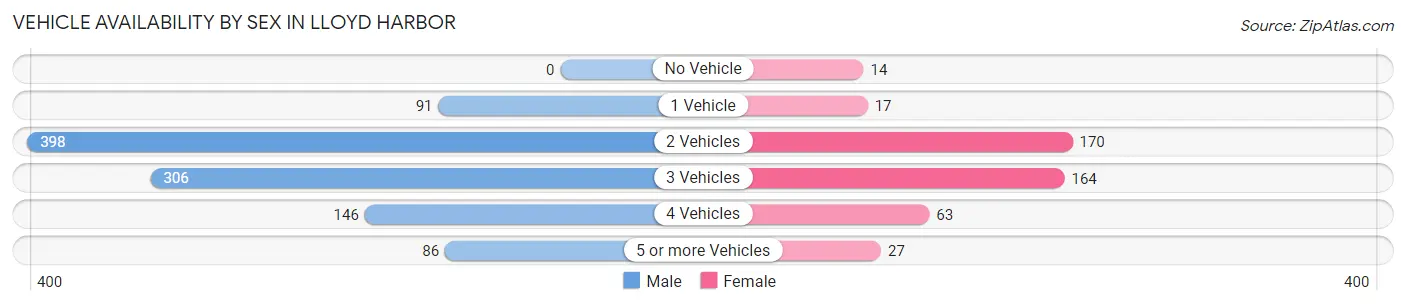
Vehicle Availability by Sex in Lloyd Harbor
The most prevalent vehicle ownership categories in Lloyd Harbor are males with 2 vehicles (398, accounting for 38.8%) and females with 2 vehicles (170, making up 87.5%).
| Vehicles Available | Male | Female |
| No Vehicle | 0 (0.0%) | 14 (3.1%) |
| 1 Vehicle | 91 (8.9%) | 17 (3.7%) |
| 2 Vehicles | 398 (38.8%) | 170 (37.4%) |
| 3 Vehicles | 306 (29.8%) | 164 (36.0%) |
| 4 Vehicles | 146 (14.2%) | 63 (13.9%) |
| 5 or more Vehicles | 86 (8.4%) | 27 (5.9%) |
| Total | 1,027 (100.0%) | 455 (100.0%) |
Commute Time in Lloyd Harbor
The most frequently occuring commute durations in Lloyd Harbor are 30 to 34 minutes (203 commuters, 18.2%), 90 or more minutes (168 commuters, 15.0%), and 20 to 24 minutes (119 commuters, 10.7%).
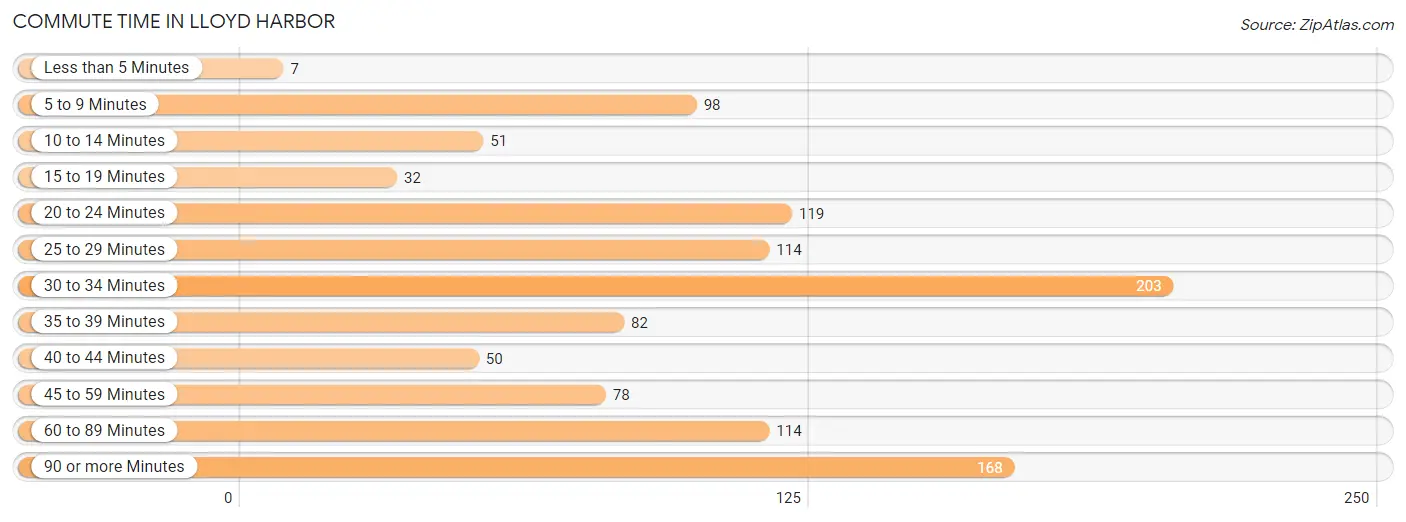
| Commute Time | # Commuters | % Commuters |
| Less than 5 Minutes | 7 | 0.6% |
| 5 to 9 Minutes | 98 | 8.8% |
| 10 to 14 Minutes | 51 | 4.6% |
| 15 to 19 Minutes | 32 | 2.9% |
| 20 to 24 Minutes | 119 | 10.7% |
| 25 to 29 Minutes | 114 | 10.2% |
| 30 to 34 Minutes | 203 | 18.2% |
| 35 to 39 Minutes | 82 | 7.3% |
| 40 to 44 Minutes | 50 | 4.5% |
| 45 to 59 Minutes | 78 | 7.0% |
| 60 to 89 Minutes | 114 | 10.2% |
| 90 or more Minutes | 168 | 15.0% |
Commute Time by Sex in Lloyd Harbor
The most common commute times in Lloyd Harbor are 30 to 34 minutes (157 commuters, 19.4%) for males and 30 to 34 minutes (46 commuters, 15.1%) for females.
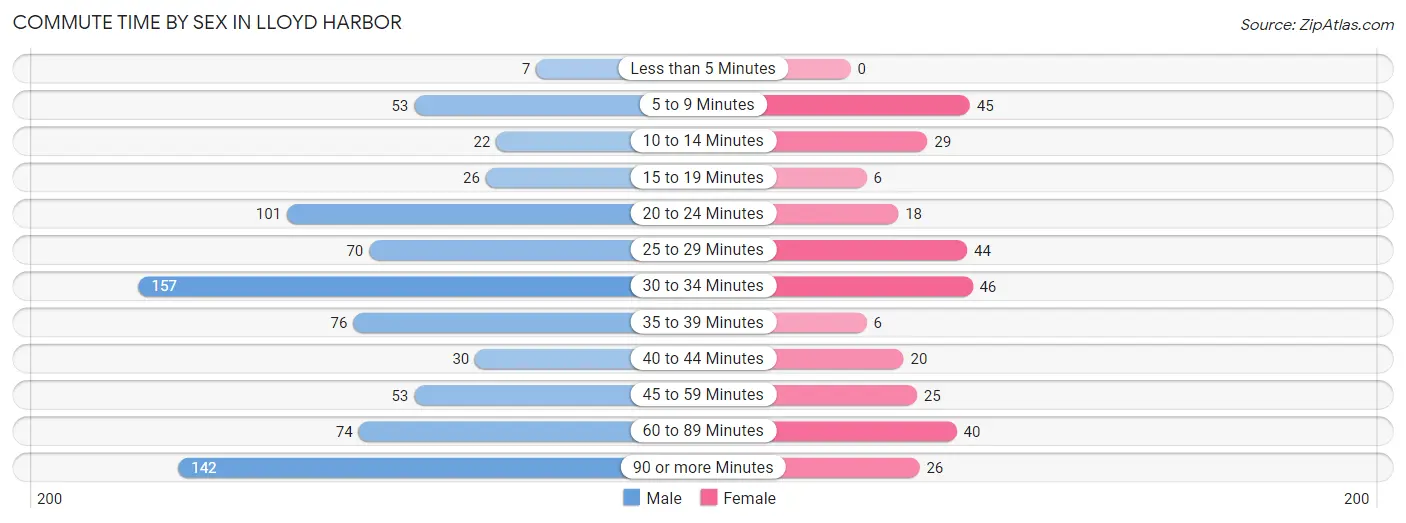
| Commute Time | Male | Female |
| Less than 5 Minutes | 7 (0.9%) | 0 (0.0%) |
| 5 to 9 Minutes | 53 (6.5%) | 45 (14.7%) |
| 10 to 14 Minutes | 22 (2.7%) | 29 (9.5%) |
| 15 to 19 Minutes | 26 (3.2%) | 6 (2.0%) |
| 20 to 24 Minutes | 101 (12.4%) | 18 (5.9%) |
| 25 to 29 Minutes | 70 (8.6%) | 44 (14.4%) |
| 30 to 34 Minutes | 157 (19.4%) | 46 (15.1%) |
| 35 to 39 Minutes | 76 (9.4%) | 6 (2.0%) |
| 40 to 44 Minutes | 30 (3.7%) | 20 (6.6%) |
| 45 to 59 Minutes | 53 (6.5%) | 25 (8.2%) |
| 60 to 89 Minutes | 74 (9.1%) | 40 (13.1%) |
| 90 or more Minutes | 142 (17.5%) | 26 (8.5%) |
Time of Departure to Work by Sex in Lloyd Harbor
The most frequent times of departure to work in Lloyd Harbor are 9:00 AM to 9:59 AM (142, 17.5%) for males and 8:30 AM to 8:59 AM (49, 16.1%) for females.
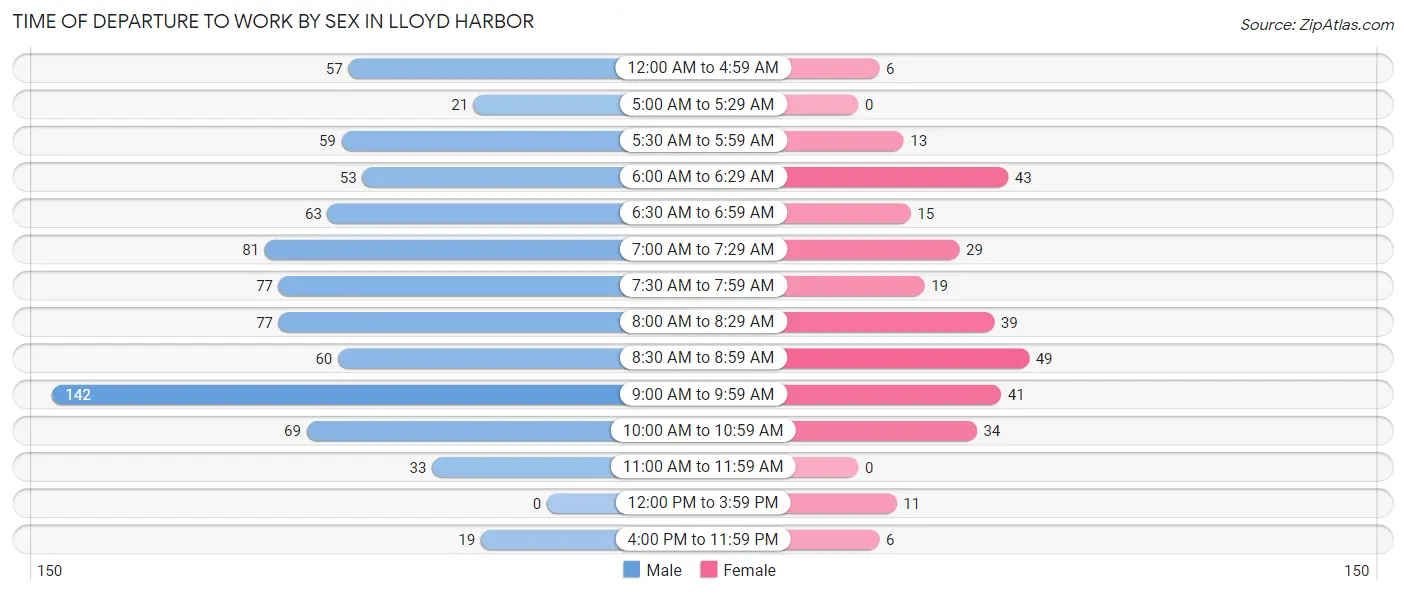
| Time of Departure | Male | Female |
| 12:00 AM to 4:59 AM | 57 (7.0%) | 6 (2.0%) |
| 5:00 AM to 5:29 AM | 21 (2.6%) | 0 (0.0%) |
| 5:30 AM to 5:59 AM | 59 (7.3%) | 13 (4.3%) |
| 6:00 AM to 6:29 AM | 53 (6.5%) | 43 (14.1%) |
| 6:30 AM to 6:59 AM | 63 (7.8%) | 15 (4.9%) |
| 7:00 AM to 7:29 AM | 81 (10.0%) | 29 (9.5%) |
| 7:30 AM to 7:59 AM | 77 (9.5%) | 19 (6.2%) |
| 8:00 AM to 8:29 AM | 77 (9.5%) | 39 (12.8%) |
| 8:30 AM to 8:59 AM | 60 (7.4%) | 49 (16.1%) |
| 9:00 AM to 9:59 AM | 142 (17.5%) | 41 (13.4%) |
| 10:00 AM to 10:59 AM | 69 (8.5%) | 34 (11.2%) |
| 11:00 AM to 11:59 AM | 33 (4.1%) | 0 (0.0%) |
| 12:00 PM to 3:59 PM | 0 (0.0%) | 11 (3.6%) |
| 4:00 PM to 11:59 PM | 19 (2.3%) | 6 (2.0%) |
| Total | 811 (100.0%) | 305 (100.0%) |
Housing Occupancy in Lloyd Harbor
Occupancy by Ownership in Lloyd Harbor
Of the total 1,167 dwellings in Lloyd Harbor, owner-occupied units account for 1,111 (95.2%), while renter-occupied units make up 56 (4.8%).
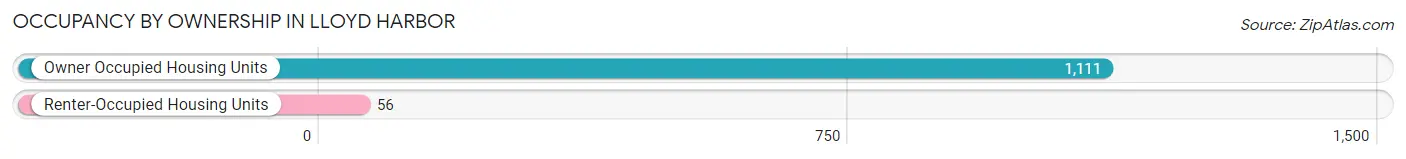
| Occupancy | # Housing Units | % Housing Units |
| Owner Occupied Housing Units | 1,111 | 95.2% |
| Renter-Occupied Housing Units | 56 | 4.8% |
| Total Occupied Housing Units | 1,167 | 100.0% |
Occupancy by Household Size in Lloyd Harbor
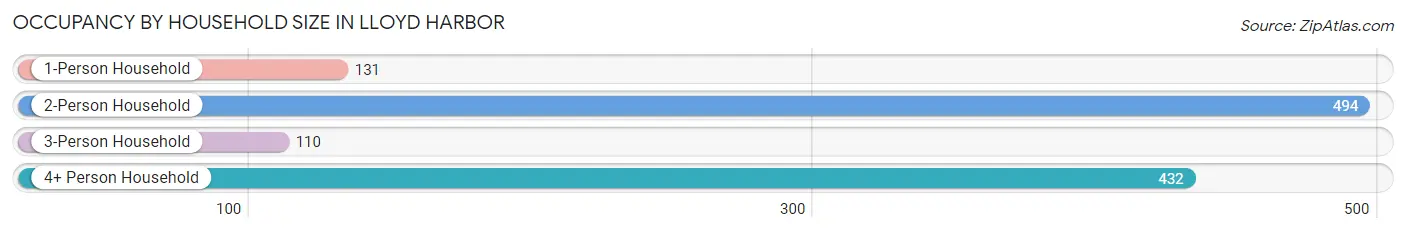
| Household Size | # Housing Units | % Housing Units |
| 1-Person Household | 131 | 11.2% |
| 2-Person Household | 494 | 42.3% |
| 3-Person Household | 110 | 9.4% |
| 4+ Person Household | 432 | 37.0% |
| Total Housing Units | 1,167 | 100.0% |
Occupancy by Ownership by Household Size in Lloyd Harbor
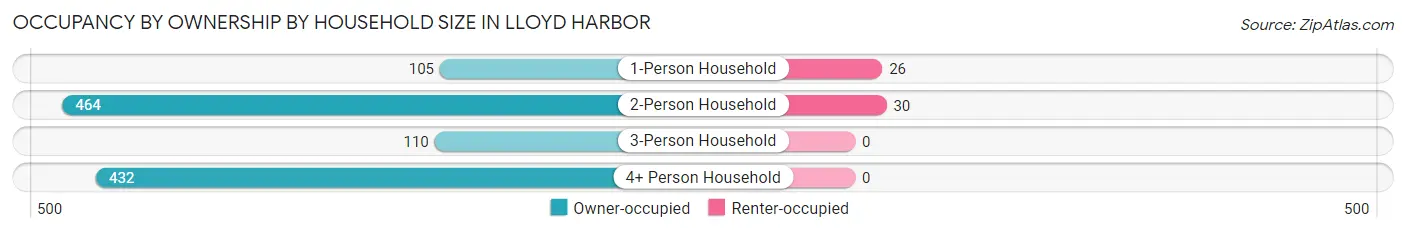
| Household Size | Owner-occupied | Renter-occupied |
| 1-Person Household | 105 (80.1%) | 26 (19.9%) |
| 2-Person Household | 464 (93.9%) | 30 (6.1%) |
| 3-Person Household | 110 (100.0%) | 0 (0.0%) |
| 4+ Person Household | 432 (100.0%) | 0 (0.0%) |
| Total Housing Units | 1,111 (95.2%) | 56 (4.8%) |
Occupancy by Educational Attainment in Lloyd Harbor
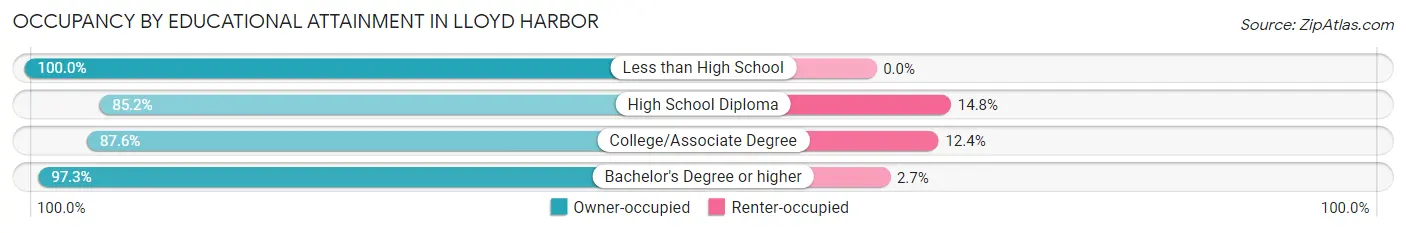
| Household Size | Owner-occupied | Renter-occupied |
| Less than High School | 101 (100.0%) | 0 (0.0%) |
| High School Diploma | 69 (85.2%) | 12 (14.8%) |
| College/Associate Degree | 156 (87.6%) | 22 (12.4%) |
| Bachelor's Degree or higher | 785 (97.3%) | 22 (2.7%) |
Occupancy by Age of Householder in Lloyd Harbor
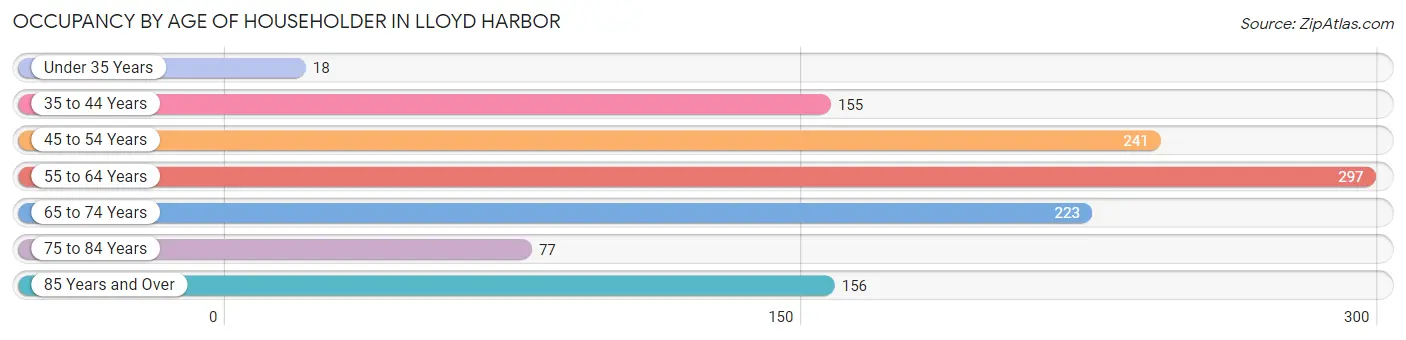
| Age Bracket | # Households | % Households |
| Under 35 Years | 18 | 1.5% |
| 35 to 44 Years | 155 | 13.3% |
| 45 to 54 Years | 241 | 20.6% |
| 55 to 64 Years | 297 | 25.5% |
| 65 to 74 Years | 223 | 19.1% |
| 75 to 84 Years | 77 | 6.6% |
| 85 Years and Over | 156 | 13.4% |
| Total | 1,167 | 100.0% |
Housing Finances in Lloyd Harbor
Median Income by Occupancy in Lloyd Harbor
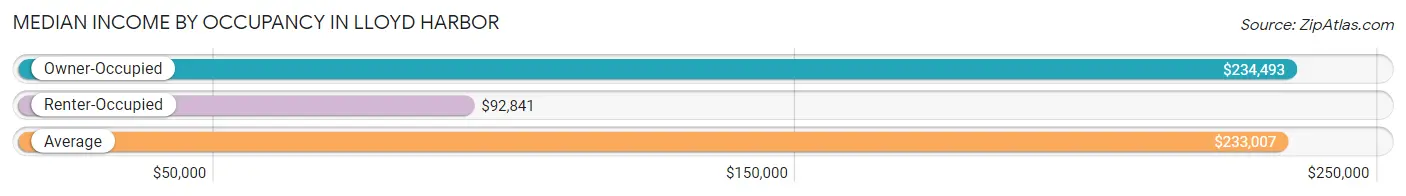
| Occupancy Type | # Households | Median Income |
| Owner-Occupied | 1,111 (95.2%) | $234,493 |
| Renter-Occupied | 56 (4.8%) | $92,841 |
| Average | 1,167 (100.0%) | $233,007 |
Occupancy by Householder Income Bracket in Lloyd Harbor
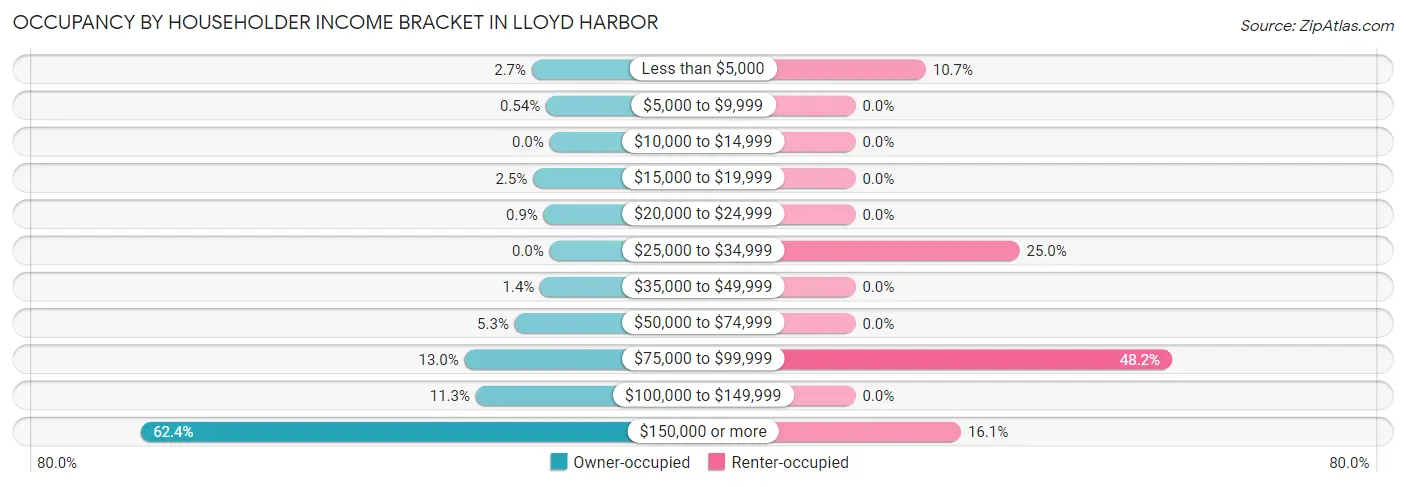
| Income Bracket | Owner-occupied | Renter-occupied |
| Less than $5,000 | 30 (2.7%) | 6 (10.7%) |
| $5,000 to $9,999 | 6 (0.5%) | 0 (0.0%) |
| $10,000 to $14,999 | 0 (0.0%) | 0 (0.0%) |
| $15,000 to $19,999 | 28 (2.5%) | 0 (0.0%) |
| $20,000 to $24,999 | 10 (0.9%) | 0 (0.0%) |
| $25,000 to $34,999 | 0 (0.0%) | 14 (25.0%) |
| $35,000 to $49,999 | 16 (1.4%) | 0 (0.0%) |
| $50,000 to $74,999 | 59 (5.3%) | 0 (0.0%) |
| $75,000 to $99,999 | 144 (13.0%) | 27 (48.2%) |
| $100,000 to $149,999 | 125 (11.3%) | 0 (0.0%) |
| $150,000 or more | 693 (62.4%) | 9 (16.1%) |
| Total | 1,111 (100.0%) | 56 (100.0%) |
Monthly Housing Cost Tiers in Lloyd Harbor
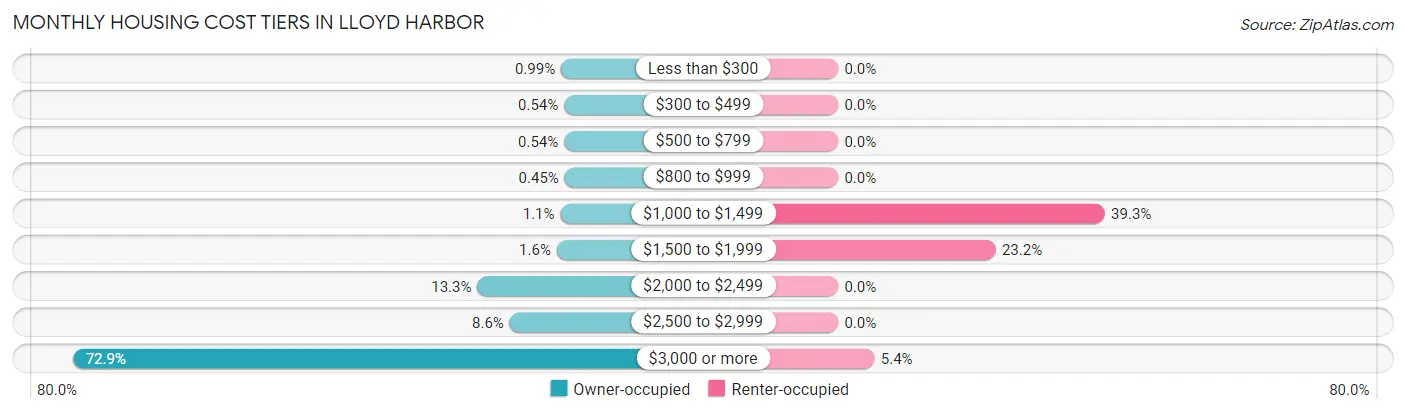
| Monthly Cost | Owner-occupied | Renter-occupied |
| Less than $300 | 11 (1.0%) | 0 (0.0%) |
| $300 to $499 | 6 (0.5%) | 0 (0.0%) |
| $500 to $799 | 6 (0.5%) | 0 (0.0%) |
| $800 to $999 | 5 (0.4%) | 0 (0.0%) |
| $1,000 to $1,499 | 12 (1.1%) | 22 (39.3%) |
| $1,500 to $1,999 | 18 (1.6%) | 13 (23.2%) |
| $2,000 to $2,499 | 148 (13.3%) | 0 (0.0%) |
| $2,500 to $2,999 | 95 (8.6%) | 0 (0.0%) |
| $3,000 or more | 810 (72.9%) | 3 (5.4%) |
| Total | 1,111 (100.0%) | 56 (100.0%) |
Physical Housing Characteristics in Lloyd Harbor
Housing Structures in Lloyd Harbor
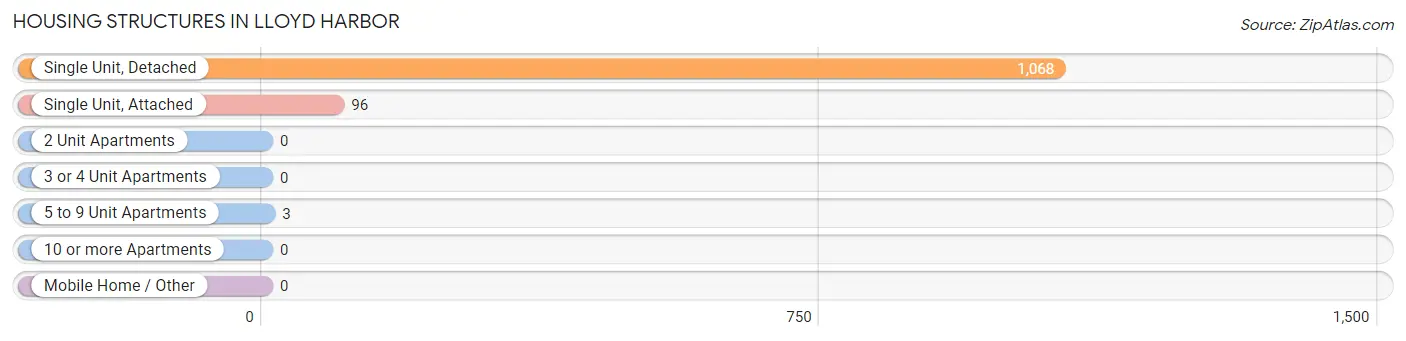
| Structure Type | # Housing Units | % Housing Units |
| Single Unit, Detached | 1,068 | 91.5% |
| Single Unit, Attached | 96 | 8.2% |
| 2 Unit Apartments | 0 | 0.0% |
| 3 or 4 Unit Apartments | 0 | 0.0% |
| 5 to 9 Unit Apartments | 3 | 0.3% |
| 10 or more Apartments | 0 | 0.0% |
| Mobile Home / Other | 0 | 0.0% |
| Total | 1,167 | 100.0% |
Housing Structures by Occupancy in Lloyd Harbor
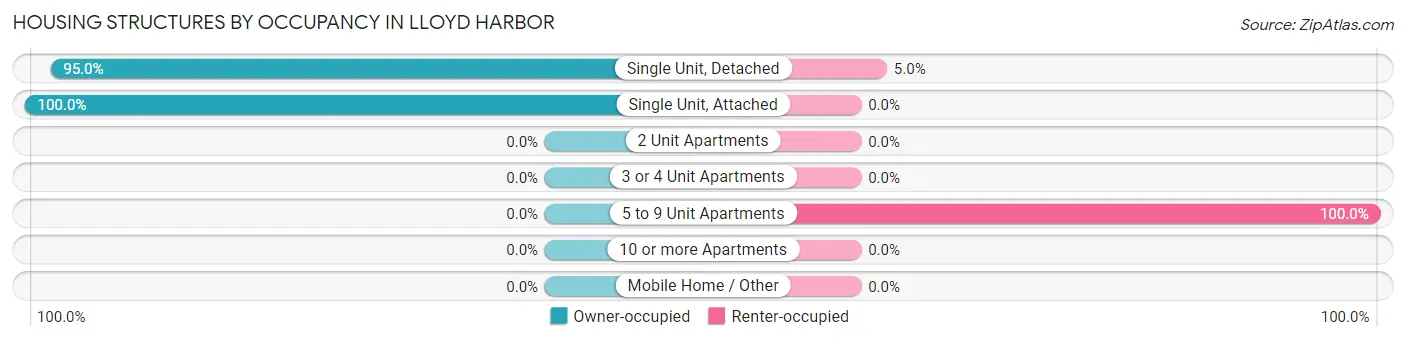
| Structure Type | Owner-occupied | Renter-occupied |
| Single Unit, Detached | 1,015 (95.0%) | 53 (5.0%) |
| Single Unit, Attached | 96 (100.0%) | 0 (0.0%) |
| 2 Unit Apartments | 0 (0.0%) | 0 (0.0%) |
| 3 or 4 Unit Apartments | 0 (0.0%) | 0 (0.0%) |
| 5 to 9 Unit Apartments | 0 (0.0%) | 3 (100.0%) |
| 10 or more Apartments | 0 (0.0%) | 0 (0.0%) |
| Mobile Home / Other | 0 (0.0%) | 0 (0.0%) |
| Total | 1,111 (95.2%) | 56 (4.8%) |
Housing Structures by Number of Rooms in Lloyd Harbor
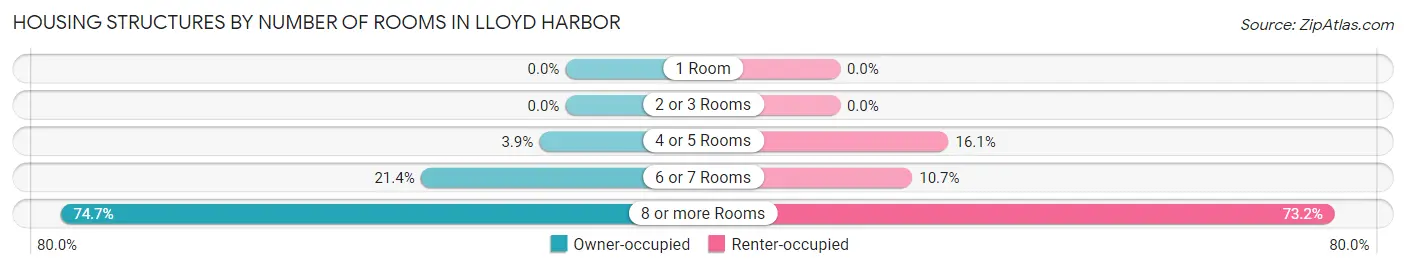
| Number of Rooms | Owner-occupied | Renter-occupied |
| 1 Room | 0 (0.0%) | 0 (0.0%) |
| 2 or 3 Rooms | 0 (0.0%) | 0 (0.0%) |
| 4 or 5 Rooms | 43 (3.9%) | 9 (16.1%) |
| 6 or 7 Rooms | 238 (21.4%) | 6 (10.7%) |
| 8 or more Rooms | 830 (74.7%) | 41 (73.2%) |
| Total | 1,111 (100.0%) | 56 (100.0%) |
Housing Structure by Heating Type in Lloyd Harbor
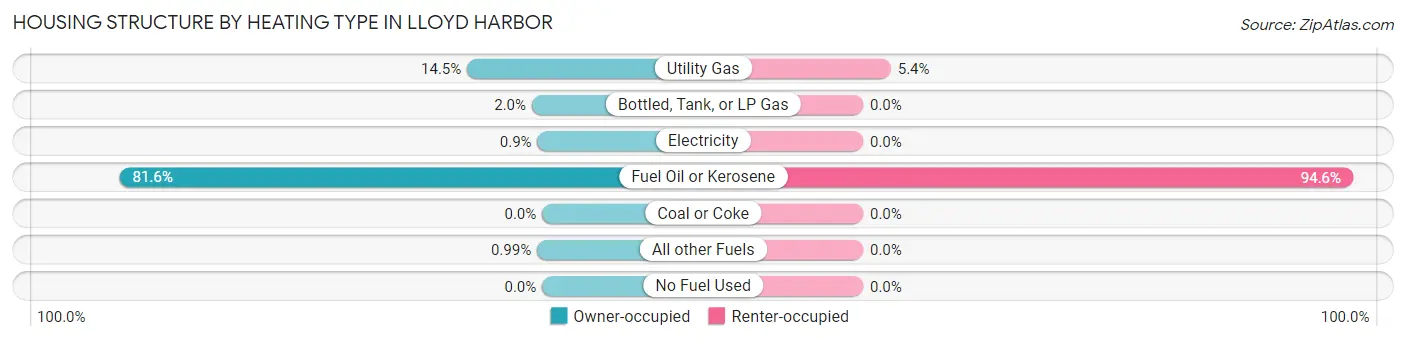
| Heating Type | Owner-occupied | Renter-occupied |
| Utility Gas | 161 (14.5%) | 3 (5.4%) |
| Bottled, Tank, or LP Gas | 22 (2.0%) | 0 (0.0%) |
| Electricity | 10 (0.9%) | 0 (0.0%) |
| Fuel Oil or Kerosene | 907 (81.6%) | 53 (94.6%) |
| Coal or Coke | 0 (0.0%) | 0 (0.0%) |
| All other Fuels | 11 (1.0%) | 0 (0.0%) |
| No Fuel Used | 0 (0.0%) | 0 (0.0%) |
| Total | 1,111 (100.0%) | 56 (100.0%) |
Household Vehicle Usage in Lloyd Harbor
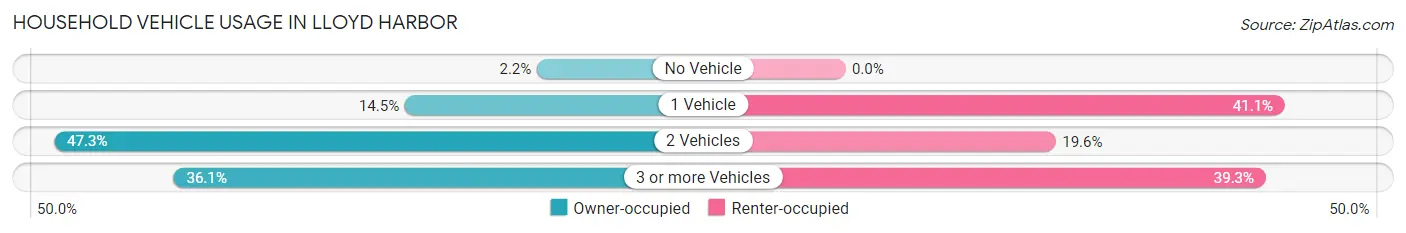
| Vehicles per Household | Owner-occupied | Renter-occupied |
| No Vehicle | 24 (2.2%) | 0 (0.0%) |
| 1 Vehicle | 161 (14.5%) | 23 (41.1%) |
| 2 Vehicles | 525 (47.2%) | 11 (19.6%) |
| 3 or more Vehicles | 401 (36.1%) | 22 (39.3%) |
| Total | 1,111 (100.0%) | 56 (100.0%) |
Real Estate & Mortgages in Lloyd Harbor
Real Estate and Mortgage Overview in Lloyd Harbor
| Characteristic | Without Mortgage | With Mortgage |
| Housing Units | 518 | 593 |
| Median Property Value | $1,259,800 | $1,641,500 |
| Median Household Income | $120,556 | $457 |
| Monthly Housing Costs | $1,501 | $575 |
| Real Estate Taxes | $10,001 | $0 |
Property Value by Mortgage Status in Lloyd Harbor
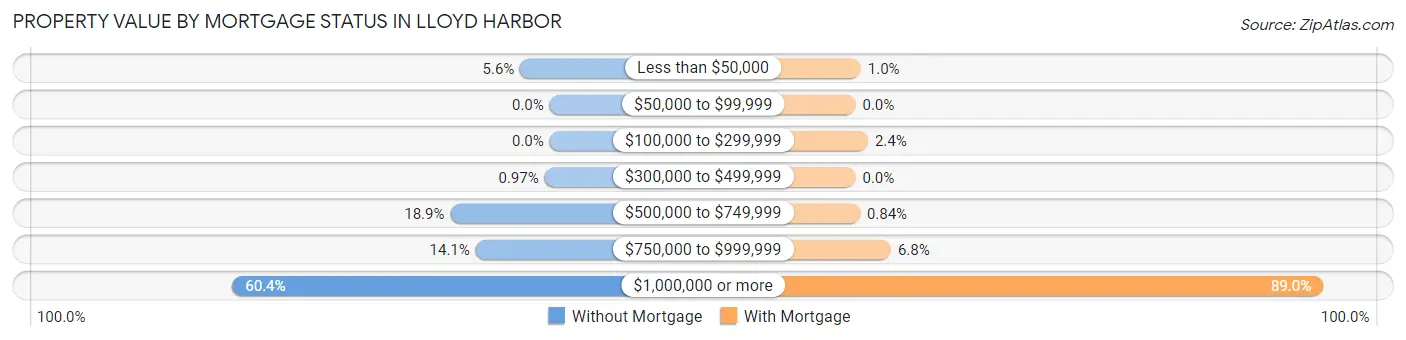
| Property Value | Without Mortgage | With Mortgage |
| Less than $50,000 | 29 (5.6%) | 6 (1.0%) |
| $50,000 to $99,999 | 0 (0.0%) | 0 (0.0%) |
| $100,000 to $299,999 | 0 (0.0%) | 14 (2.4%) |
| $300,000 to $499,999 | 5 (1.0%) | 0 (0.0%) |
| $500,000 to $749,999 | 98 (18.9%) | 5 (0.8%) |
| $750,000 to $999,999 | 73 (14.1%) | 40 (6.8%) |
| $1,000,000 or more | 313 (60.4%) | 528 (89.0%) |
| Total | 518 (100.0%) | 593 (100.0%) |
Household Income by Mortgage Status in Lloyd Harbor
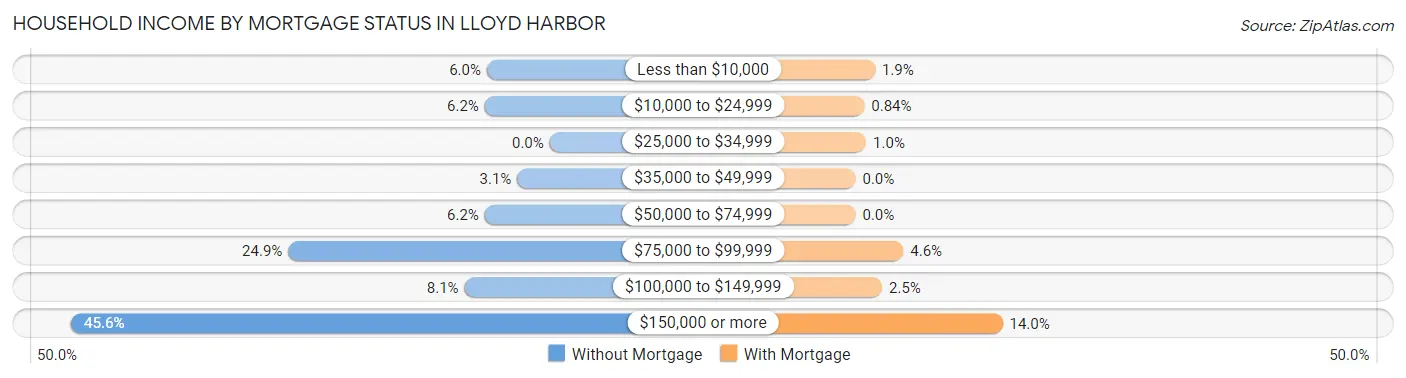
| Household Income | Without Mortgage | With Mortgage |
| Less than $10,000 | 31 (6.0%) | 11 (1.8%) |
| $10,000 to $24,999 | 32 (6.2%) | 5 (0.8%) |
| $25,000 to $34,999 | 0 (0.0%) | 6 (1.0%) |
| $35,000 to $49,999 | 16 (3.1%) | 0 (0.0%) |
| $50,000 to $74,999 | 32 (6.2%) | 0 (0.0%) |
| $75,000 to $99,999 | 129 (24.9%) | 27 (4.5%) |
| $100,000 to $149,999 | 42 (8.1%) | 15 (2.5%) |
| $150,000 or more | 236 (45.6%) | 83 (14.0%) |
| Total | 518 (100.0%) | 593 (100.0%) |
Property Value to Household Income Ratio in Lloyd Harbor
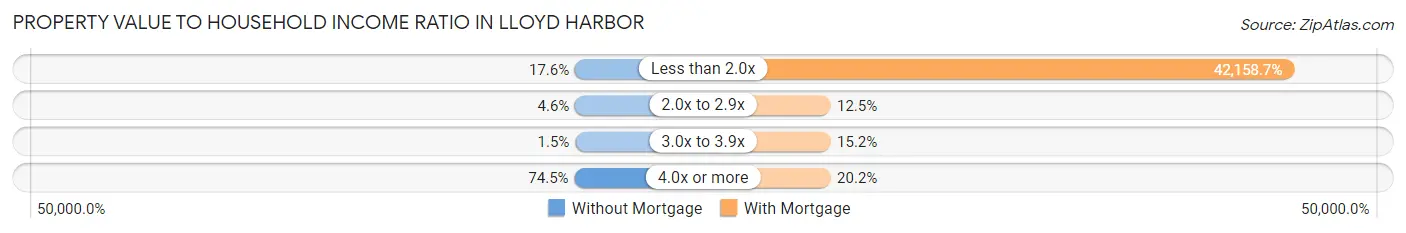
| Value-to-Income Ratio | Without Mortgage | With Mortgage |
| Less than 2.0x | 91 (17.6%) | 250,001 (42,158.7%) |
| 2.0x to 2.9x | 24 (4.6%) | 74 (12.5%) |
| 3.0x to 3.9x | 8 (1.5%) | 90 (15.2%) |
| 4.0x or more | 386 (74.5%) | 120 (20.2%) |
| Total | 518 (100.0%) | 593 (100.0%) |
Real Estate Taxes by Mortgage Status in Lloyd Harbor
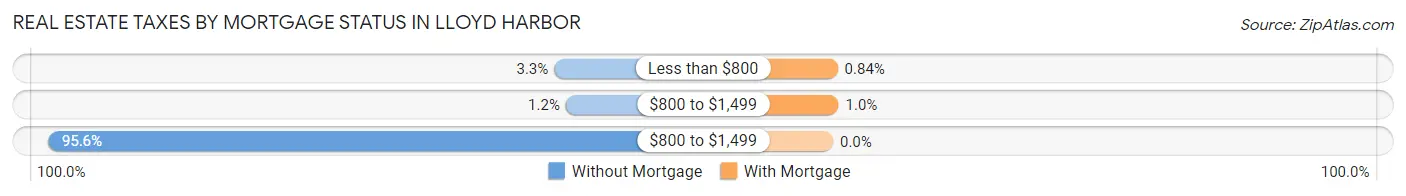
| Property Taxes | Without Mortgage | With Mortgage |
| Less than $800 | 17 (3.3%) | 5 (0.8%) |
| $800 to $1,499 | 6 (1.2%) | 6 (1.0%) |
| $800 to $1,499 | 495 (95.6%) | 0 (0.0%) |
| Total | 518 (100.0%) | 593 (100.0%) |
Health & Disability in Lloyd Harbor
Health Insurance Coverage by Age in Lloyd Harbor
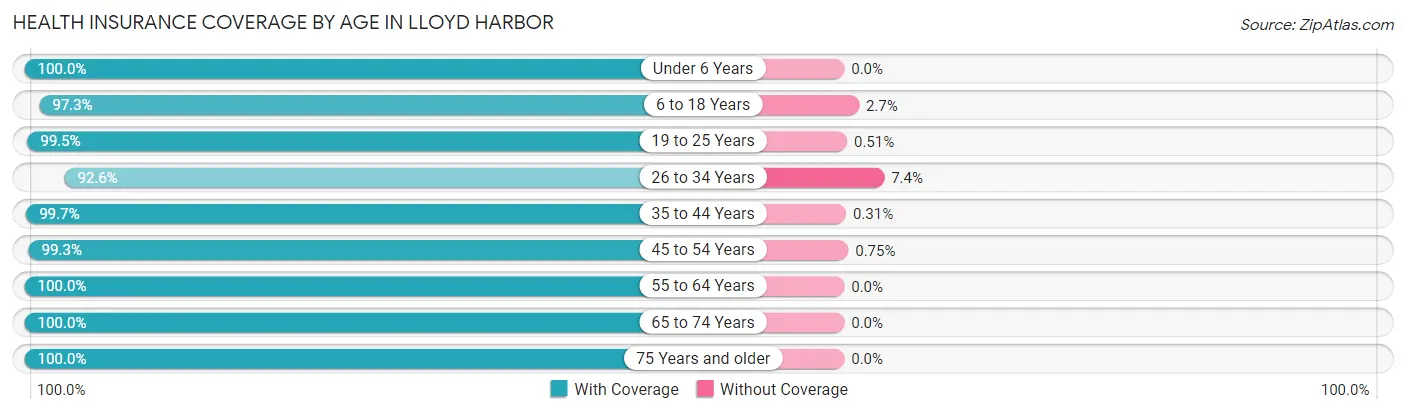
| Age Bracket | With Coverage | Without Coverage |
| Under 6 Years | 171 (100.0%) | 0 (0.0%) |
| 6 to 18 Years | 817 (97.3%) | 23 (2.7%) |
| 19 to 25 Years | 197 (99.5%) | 1 (0.5%) |
| 26 to 34 Years | 112 (92.6%) | 9 (7.4%) |
| 35 to 44 Years | 326 (99.7%) | 1 (0.3%) |
| 45 to 54 Years | 529 (99.3%) | 4 (0.7%) |
| 55 to 64 Years | 655 (100.0%) | 0 (0.0%) |
| 65 to 74 Years | 359 (100.0%) | 0 (0.0%) |
| 75 Years and older | 368 (100.0%) | 0 (0.0%) |
| Total | 3,534 (98.9%) | 38 (1.1%) |
Health Insurance Coverage by Citizenship Status in Lloyd Harbor
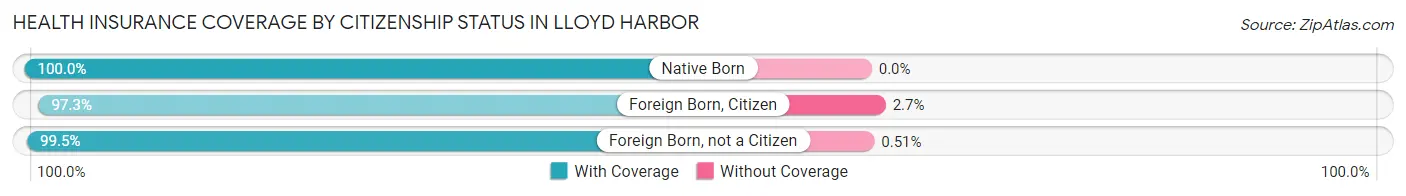
| Citizenship Status | With Coverage | Without Coverage |
| Native Born | 171 (100.0%) | 0 (0.0%) |
| Foreign Born, Citizen | 817 (97.3%) | 23 (2.7%) |
| Foreign Born, not a Citizen | 197 (99.5%) | 1 (0.5%) |
Health Insurance Coverage by Household Income in Lloyd Harbor
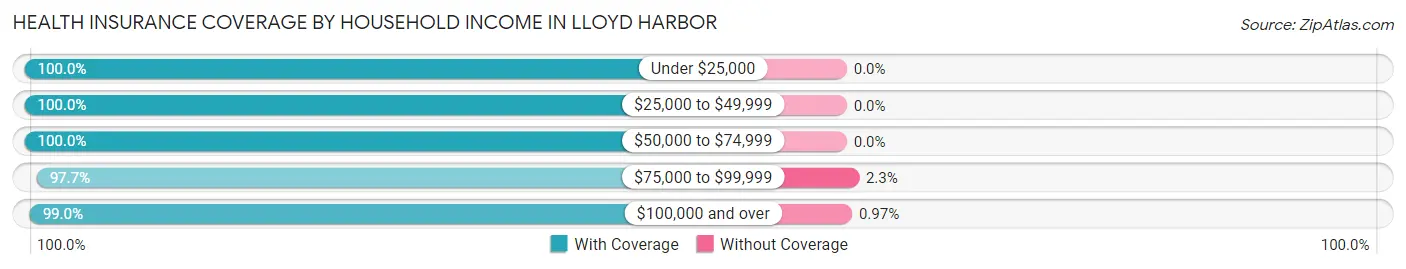
| Household Income | With Coverage | Without Coverage |
| Under $25,000 | 160 (100.0%) | 0 (0.0%) |
| $25,000 to $49,999 | 41 (100.0%) | 0 (0.0%) |
| $50,000 to $74,999 | 139 (100.0%) | 0 (0.0%) |
| $75,000 to $99,999 | 343 (97.7%) | 8 (2.3%) |
| $100,000 and over | 2,845 (99.0%) | 28 (1.0%) |
Public vs Private Health Insurance Coverage by Age in Lloyd Harbor
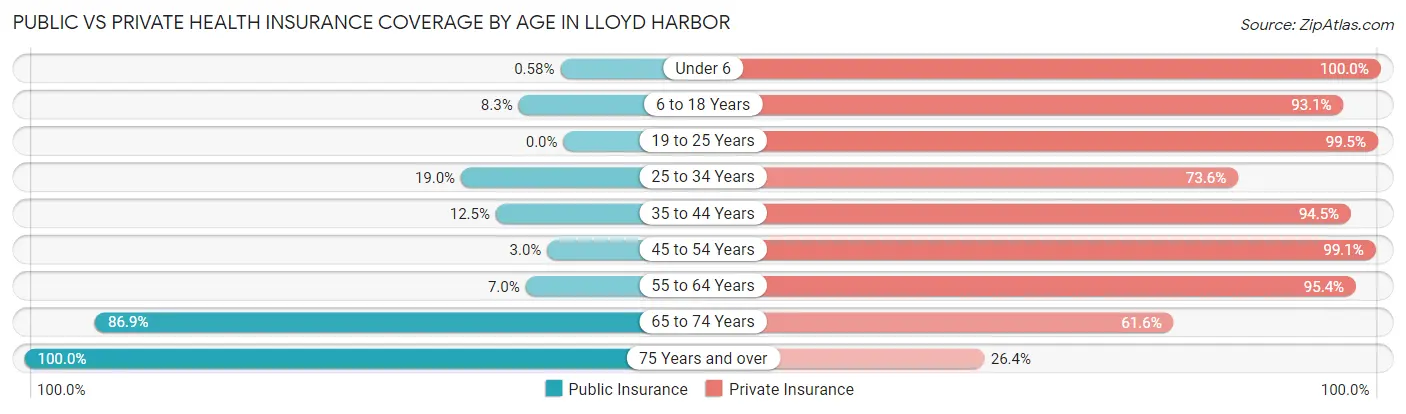
| Age Bracket | Public Insurance | Private Insurance |
| Under 6 | 1 (0.6%) | 171 (100.0%) |
| 6 to 18 Years | 70 (8.3%) | 782 (93.1%) |
| 19 to 25 Years | 0 (0.0%) | 197 (99.5%) |
| 25 to 34 Years | 23 (19.0%) | 89 (73.6%) |
| 35 to 44 Years | 41 (12.5%) | 309 (94.5%) |
| 45 to 54 Years | 16 (3.0%) | 528 (99.1%) |
| 55 to 64 Years | 46 (7.0%) | 625 (95.4%) |
| 65 to 74 Years | 312 (86.9%) | 221 (61.6%) |
| 75 Years and over | 368 (100.0%) | 97 (26.4%) |
| Total | 877 (24.5%) | 3,019 (84.5%) |
Disability Status by Sex by Age in Lloyd Harbor
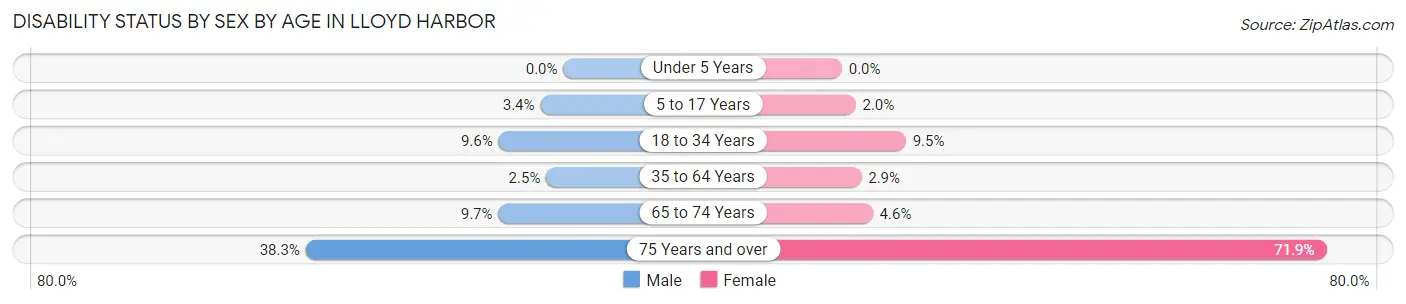
| Age Bracket | Male | Female |
| Under 5 Years | 0 (0.0%) | 0 (0.0%) |
| 5 to 17 Years | 15 (3.4%) | 7 (2.0%) |
| 18 to 34 Years | 23 (9.6%) | 15 (9.5%) |
| 35 to 64 Years | 20 (2.5%) | 21 (2.9%) |
| 65 to 74 Years | 22 (9.7%) | 6 (4.6%) |
| 75 Years and over | 44 (38.3%) | 182 (71.9%) |
Disability Class by Sex by Age in Lloyd Harbor
Disability Class: Hearing Difficulty
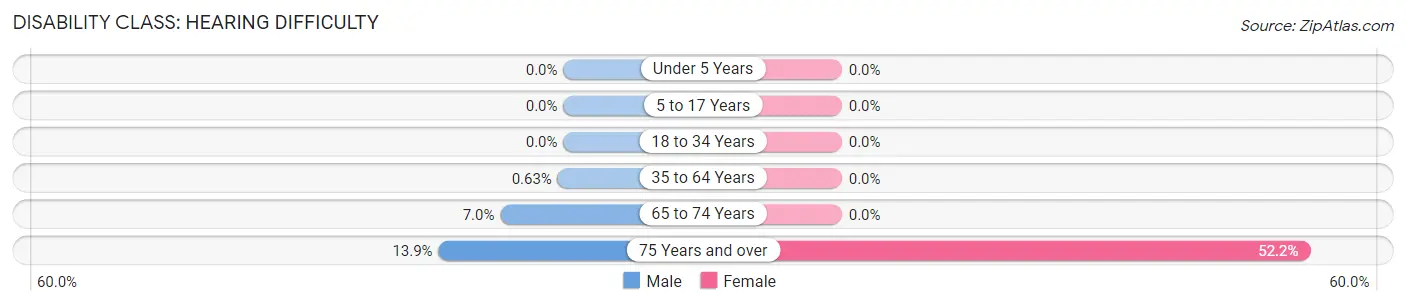
| Age Bracket | Male | Female |
| Under 5 Years | 0 (0.0%) | 0 (0.0%) |
| 5 to 17 Years | 0 (0.0%) | 0 (0.0%) |
| 18 to 34 Years | 0 (0.0%) | 0 (0.0%) |
| 35 to 64 Years | 5 (0.6%) | 0 (0.0%) |
| 65 to 74 Years | 16 (7.0%) | 0 (0.0%) |
| 75 Years and over | 16 (13.9%) | 132 (52.2%) |
Disability Class: Vision Difficulty
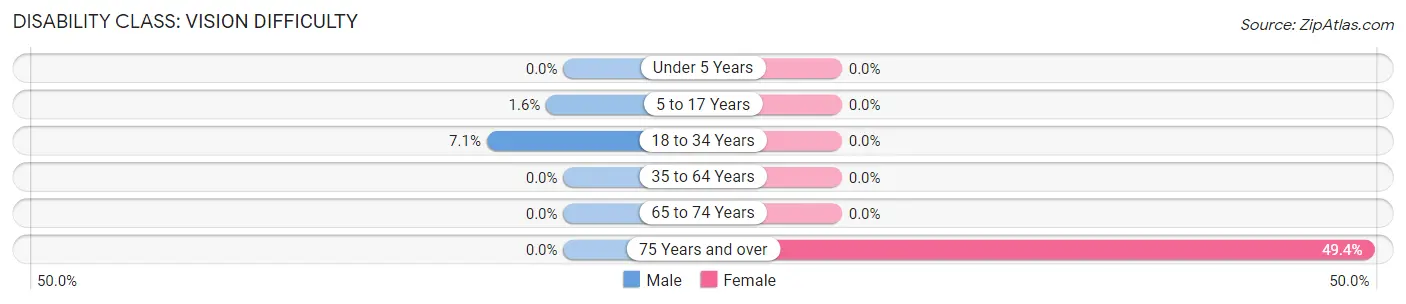
| Age Bracket | Male | Female |
| Under 5 Years | 0 (0.0%) | 0 (0.0%) |
| 5 to 17 Years | 7 (1.6%) | 0 (0.0%) |
| 18 to 34 Years | 17 (7.1%) | 0 (0.0%) |
| 35 to 64 Years | 0 (0.0%) | 0 (0.0%) |
| 65 to 74 Years | 0 (0.0%) | 0 (0.0%) |
| 75 Years and over | 0 (0.0%) | 125 (49.4%) |
Disability Class: Cognitive Difficulty
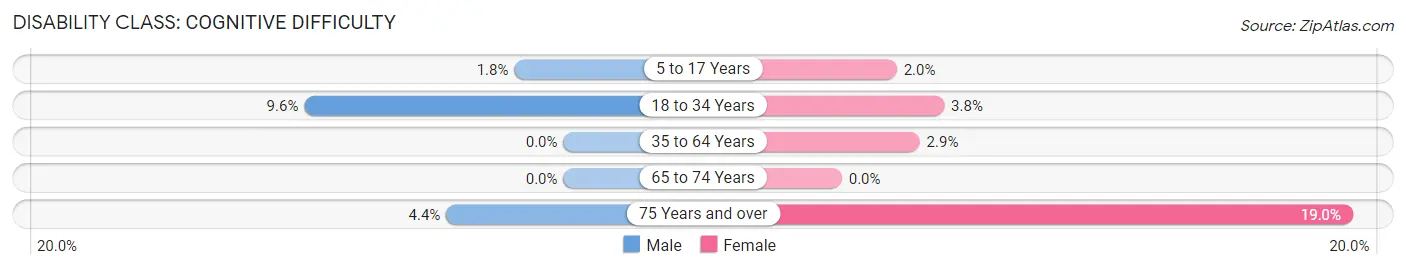
| Age Bracket | Male | Female |
| 5 to 17 Years | 8 (1.8%) | 7 (2.0%) |
| 18 to 34 Years | 23 (9.6%) | 6 (3.8%) |
| 35 to 64 Years | 0 (0.0%) | 21 (2.9%) |
| 65 to 74 Years | 0 (0.0%) | 0 (0.0%) |
| 75 Years and over | 5 (4.3%) | 48 (19.0%) |
Disability Class: Ambulatory Difficulty
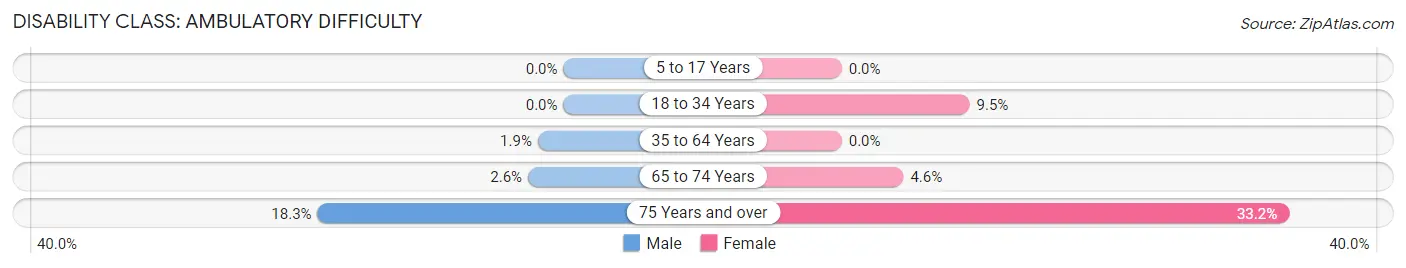
| Age Bracket | Male | Female |
| 5 to 17 Years | 0 (0.0%) | 0 (0.0%) |
| 18 to 34 Years | 0 (0.0%) | 15 (9.5%) |
| 35 to 64 Years | 15 (1.9%) | 0 (0.0%) |
| 65 to 74 Years | 6 (2.6%) | 6 (4.6%) |
| 75 Years and over | 21 (18.3%) | 84 (33.2%) |
Disability Class: Self-Care Difficulty
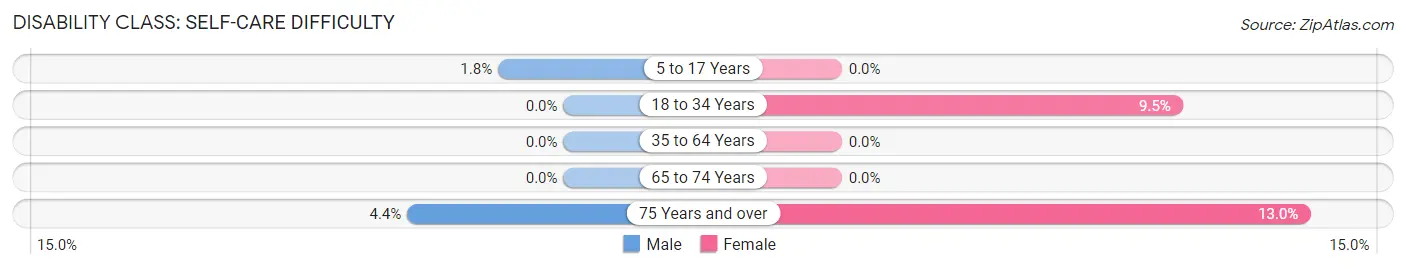
| Age Bracket | Male | Female |
| 5 to 17 Years | 8 (1.8%) | 0 (0.0%) |
| 18 to 34 Years | 0 (0.0%) | 15 (9.5%) |
| 35 to 64 Years | 0 (0.0%) | 0 (0.0%) |
| 65 to 74 Years | 0 (0.0%) | 0 (0.0%) |
| 75 Years and over | 5 (4.3%) | 33 (13.0%) |
Technology Access in Lloyd Harbor
Computing Device Access in Lloyd Harbor
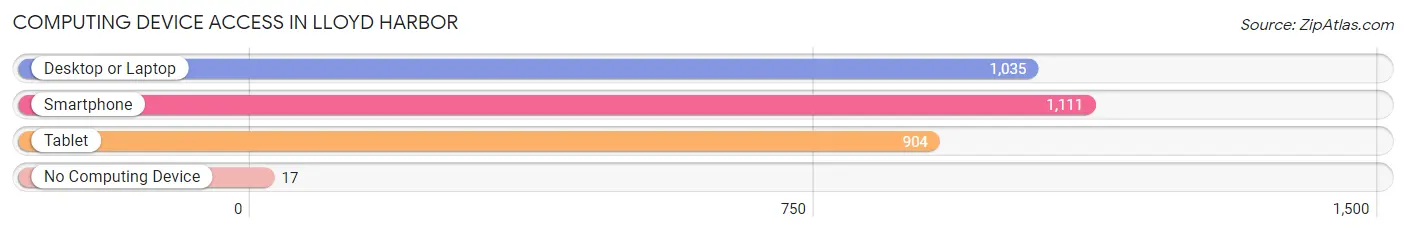
| Device Type | # Households | % Households |
| Desktop or Laptop | 1,035 | 88.7% |
| Smartphone | 1,111 | 95.2% |
| Tablet | 904 | 77.5% |
| No Computing Device | 17 | 1.5% |
| Total | 1,167 | 100.0% |
Internet Access in Lloyd Harbor
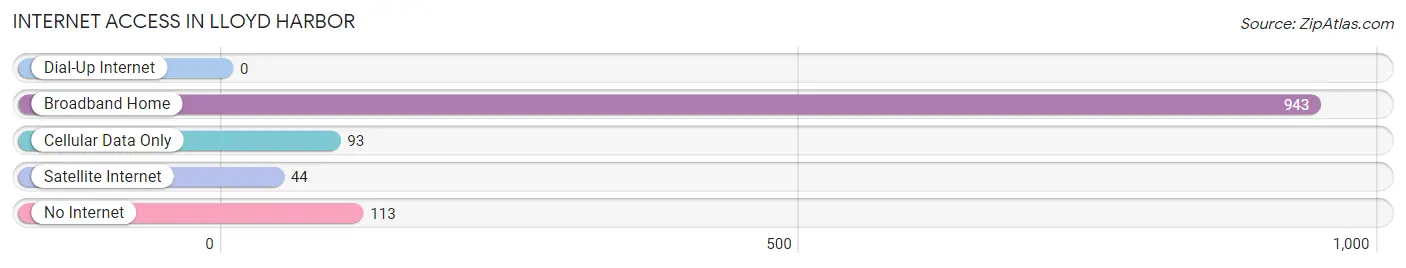
| Internet Type | # Households | % Households |
| Dial-Up Internet | 0 | 0.0% |
| Broadband Home | 943 | 80.8% |
| Cellular Data Only | 93 | 8.0% |
| Satellite Internet | 44 | 3.8% |
| No Internet | 113 | 9.7% |
| Total | 1,167 | 100.0% |
Lloyd Harbor Summary
Lloyd Harbor is a village located in the Town of Huntington in Suffolk County, New York. It is situated on the North Shore of Long Island, approximately 40 miles east of New York City. The village is bordered by Huntington Bay to the north, Lloyd Neck to the east, and Cold Spring Harbor to the south. As of the 2010 census, the population of Lloyd Harbor was 2,097.
History
The area now known as Lloyd Harbor was originally inhabited by the Matinecock Native American tribe. The Matinecock were a part of the Algonquin Nation and were known for their fishing and hunting skills. The first European settlers arrived in the area in the 1650s, and the area was officially established as the Town of Huntington in 1666.
In the late 19th century, the area began to attract wealthy New Yorkers who were looking for a place to escape the hustle and bustle of the city. The area was known for its beautiful scenery and seclusion, and many of these wealthy New Yorkers built large estates in the area.
In the early 20th century, the area began to attract more people, and the village of Lloyd Harbor was officially incorporated in 1925. The village was named after Henry Lloyd, who had purchased a large tract of land in the area in the late 19th century.
Geography
Lloyd Harbor is located at 40°54'N 73°25'W. It is situated on the North Shore of Long Island, approximately 40 miles east of New York City. The village is bordered by Huntington Bay to the north, Lloyd Neck to the east, and Cold Spring Harbor to the south.
The village has a total area of 4.2 square miles, of which 3.9 square miles is land and 0.3 square miles is water. The terrain is mostly flat, with some rolling hills.
Economy
The economy of Lloyd Harbor is largely based on tourism and real estate. The village is home to many wealthy New Yorkers who own large estates in the area. These estates are often rented out to tourists, providing a significant source of income for the village.
The village is also home to several small businesses, including restaurants, shops, and marinas. The village is also home to several yacht clubs, which attract many visitors to the area.
Demographics
As of the 2010 census, the population of Lloyd Harbor was 2,097. The racial makeup of the village was 94.3% White, 1.2% African American, 0.2% Native American, 2.2% Asian, 0.1% Pacific Islander, 0.7% from other races, and 1.3% from two or more races. Hispanic or Latino of any race were 3.2% of the population.
The median household income in the village was $150,000, and the median family income was $167,000. The per capita income for the village was $76,000. About 1.7% of families and 2.3% of the population were below the poverty line.
Common Questions
What is Per Capita Income in Lloyd Harbor?
Per Capita income in Lloyd Harbor is $123,386.
What is the Median Family Income in Lloyd Harbor?
Median Family Income in Lloyd Harbor is $250,001.
What is the Median Household income in Lloyd Harbor?
Median Household Income in Lloyd Harbor is $233,007.
What is Income or Wage Gap in Lloyd Harbor?
Income or Wage Gap in Lloyd Harbor is 50.9%.
Women in Lloyd Harbor earn 49.1 cents for every dollar earned by a man.
What is Family Income Deficit in Lloyd Harbor?
Family Income Deficit in Lloyd Harbor is $17,945.
Families that are below poverty line in Lloyd Harbor earn $17,945 less on average than the poverty threshold level.
What is Inequality or Gini Index in Lloyd Harbor?
Inequality or Gini Index in Lloyd Harbor is 0.53.
What is the Total Population of Lloyd Harbor?
Total Population of Lloyd Harbor is 3,572.
What is the Total Male Population of Lloyd Harbor?
Total Male Population of Lloyd Harbor is 1,934.
What is the Total Female Population of Lloyd Harbor?
Total Female Population of Lloyd Harbor is 1,638.
What is the Ratio of Males per 100 Females in Lloyd Harbor?
There are 118.07 Males per 100 Females in Lloyd Harbor.
What is the Ratio of Females per 100 Males in Lloyd Harbor?
There are 84.69 Females per 100 Males in Lloyd Harbor.
What is the Median Population Age in Lloyd Harbor?
Median Population Age in Lloyd Harbor is 46.4 Years.
What is the Average Family Size in Lloyd Harbor
Average Family Size in Lloyd Harbor is 3.3 People.
What is the Average Household Size in Lloyd Harbor
Average Household Size in Lloyd Harbor is 3.0 People.
How Large is the Labor Force in Lloyd Harbor?
There are 1,540 People in the Labor Forcein in Lloyd Harbor.
What is the Percentage of People in the Labor Force in Lloyd Harbor?
55.4% of People are in the Labor Force in Lloyd Harbor.
What is the Unemployment Rate in Lloyd Harbor?
Unemployment Rate in Lloyd Harbor is 0.4%.