Port Washington North, NY Map & Demographics
Port Washington North Map
Port Washington North Overview
$95,612
PER CAPITA INCOME
$206,992
AVG FAMILY INCOME
$137,679
AVG HOUSEHOLD INCOME
39.6%
WAGE / INCOME GAP [ % ]
60.4¢/ $1
WAGE / INCOME GAP [ $ ]
0.51
INEQUALITY / GINI INDEX
3,169
TOTAL POPULATION
1,518
MALE POPULATION
1,651
FEMALE POPULATION
91.94
MALES / 100 FEMALES
108.76
FEMALES / 100 MALES
53.5
MEDIAN AGE
2.9
AVG FAMILY SIZE
2.1
AVG HOUSEHOLD SIZE
1,470
LABOR FORCE [ PEOPLE ]
56.7%
PERCENT IN LABOR FORCE
3.5%
UNEMPLOYMENT RATE
Income in Port Washington North
Income Overview in Port Washington North
Per Capita Income in Port Washington North is $95,612, while median incomes of families and households are $206,992 and $137,679 respectively.
| Characteristic | Number | Measure |
| Per Capita Income | 3,169 | $95,612 |
| Median Family Income | 849 | $206,992 |
| Mean Family Income | 849 | $283,493 |
| Median Household Income | 1,476 | $137,679 |
| Mean Household Income | 1,476 | $204,786 |
| Income Deficit | 849 | $0 |
| Wage / Income Gap (%) | 3,169 | 39.60% |
| Wage / Income Gap ($) | 3,169 | 60.40¢ per $1 |
| Gini / Inequality Index | 3,169 | 0.51 |
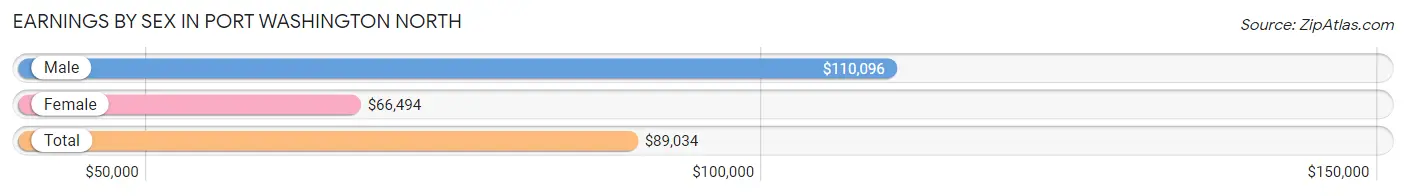
Earnings by Sex in Port Washington North
Average Earnings in Port Washington North are $89,034, $110,096 for men and $66,494 for women, a difference of 39.6%.
| Sex | Number | Average Earnings |
| Male | 797 (52.7%) | $110,096 |
| Female | 716 (47.3%) | $66,494 |
| Total | 1,513 (100.0%) | $89,034 |
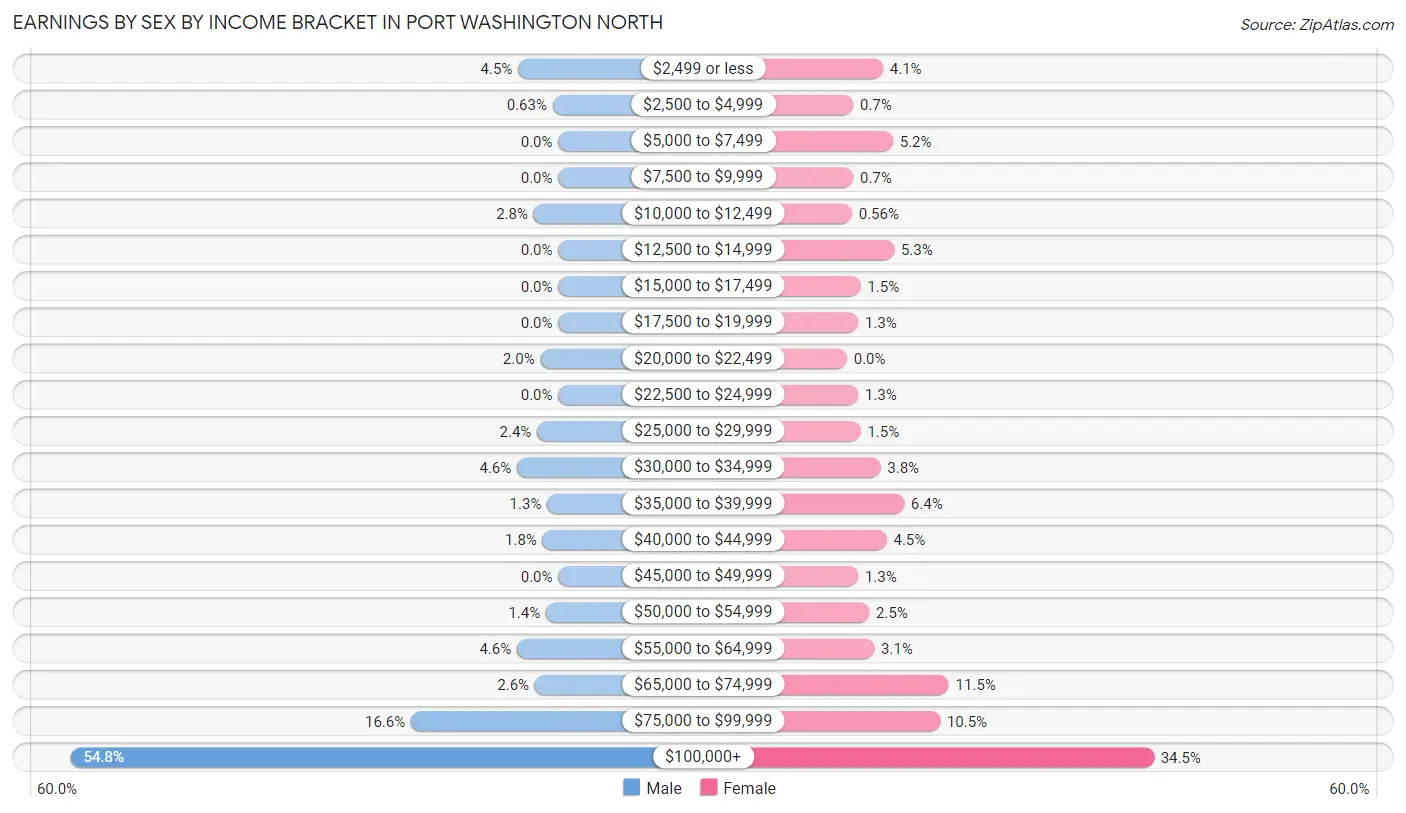
Earnings by Sex by Income Bracket in Port Washington North
The most common earnings brackets in Port Washington North are $100,000+ for men (437 | 54.8%) and $100,000+ for women (247 | 34.5%).
| Income | Male | Female |
| $2,499 or less | 36 (4.5%) | 29 (4.1%) |
| $2,500 to $4,999 | 5 (0.6%) | 5 (0.7%) |
| $5,000 to $7,499 | 0 (0.0%) | 37 (5.2%) |
| $7,500 to $9,999 | 0 (0.0%) | 5 (0.7%) |
| $10,000 to $12,499 | 22 (2.8%) | 4 (0.6%) |
| $12,500 to $14,999 | 0 (0.0%) | 38 (5.3%) |
| $15,000 to $17,499 | 0 (0.0%) | 11 (1.5%) |
| $17,500 to $19,999 | 0 (0.0%) | 9 (1.3%) |
| $20,000 to $22,499 | 16 (2.0%) | 0 (0.0%) |
| $22,500 to $24,999 | 0 (0.0%) | 9 (1.3%) |
| $25,000 to $29,999 | 19 (2.4%) | 11 (1.5%) |
| $30,000 to $34,999 | 37 (4.6%) | 27 (3.8%) |
| $35,000 to $39,999 | 10 (1.3%) | 46 (6.4%) |
| $40,000 to $44,999 | 14 (1.8%) | 32 (4.5%) |
| $45,000 to $49,999 | 0 (0.0%) | 9 (1.3%) |
| $50,000 to $54,999 | 11 (1.4%) | 18 (2.5%) |
| $55,000 to $64,999 | 37 (4.6%) | 22 (3.1%) |
| $65,000 to $74,999 | 21 (2.6%) | 82 (11.5%) |
| $75,000 to $99,999 | 132 (16.6%) | 75 (10.5%) |
| $100,000+ | 437 (54.8%) | 247 (34.5%) |
| Total | 797 (100.0%) | 716 (100.0%) |
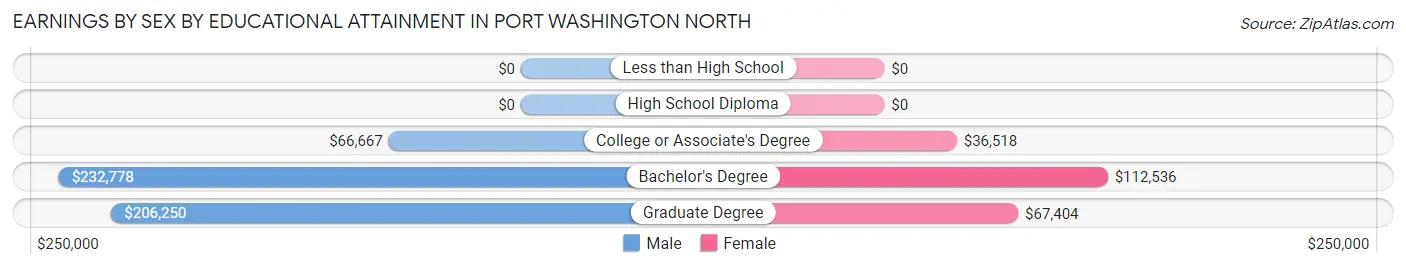
Earnings by Sex by Educational Attainment in Port Washington North
Average earnings in Port Washington North are $120,625 for men and $85,217 for women, a difference of 29.3%. Men with an educational attainment of bachelor's degree enjoy the highest average annual earnings of $232,778, while those with college or associate's degree education earn the least with $66,667. Women with an educational attainment of bachelor's degree earn the most with the average annual earnings of $112,536, while those with college or associate's degree education have the smallest earnings of $36,518.
| Educational Attainment | Male Income | Female Income |
| Less than High School | - | - |
| High School Diploma | - | - |
| College or Associate's Degree | $66,667 | $36,518 |
| Bachelor's Degree | $232,778 | $112,536 |
| Graduate Degree | $206,250 | $67,404 |
| Total | $120,625 | $85,217 |
Family Income in Port Washington North
Family Income Brackets in Port Washington North
According to the Port Washington North family income data, there are 450 families falling into the $200,000+ income range, which is the most common income bracket and makes up 53.0% of all families.
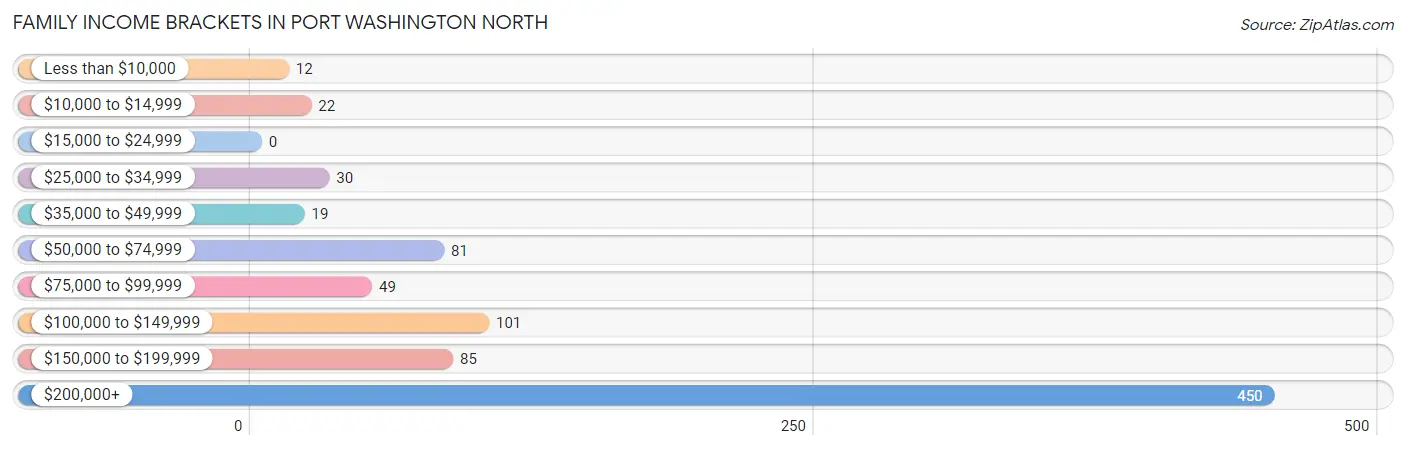
| Income Bracket | # Families | % Families |
| Less than $10,000 | 12 | 1.4% |
| $10,000 to $14,999 | 22 | 2.6% |
| $15,000 to $24,999 | 0 | 0.0% |
| $25,000 to $34,999 | 30 | 3.5% |
| $35,000 to $49,999 | 19 | 2.2% |
| $50,000 to $74,999 | 81 | 9.5% |
| $75,000 to $99,999 | 49 | 5.8% |
| $100,000 to $149,999 | 101 | 11.9% |
| $150,000 to $199,999 | 85 | 10.0% |
| $200,000+ | 450 | 53.0% |
Family Income by Famaliy Size in Port Washington North
3-person families (176 | 20.7%) account for the highest median family income in Port Washington North with $250,001 per family, while 3-person families (176 | 20.7%) have the highest median income of $83,334 per family member.
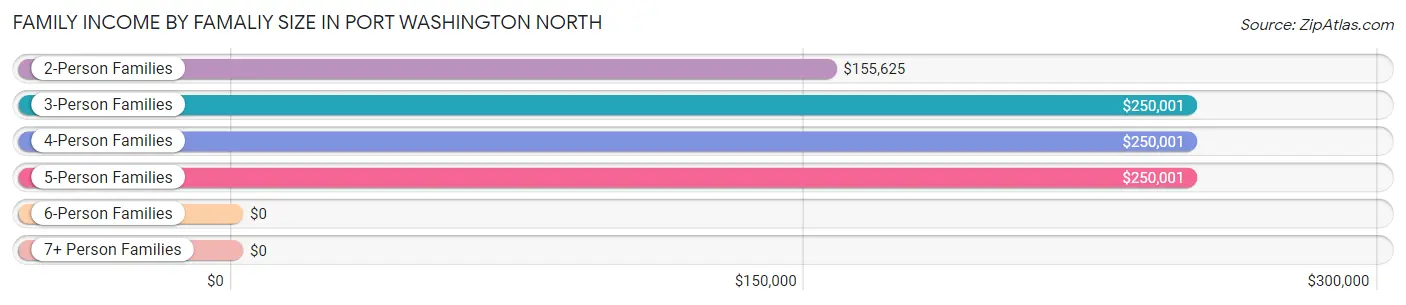
| Income Bracket | # Families | Median Income |
| 2-Person Families | 420 (49.5%) | $155,625 |
| 3-Person Families | 176 (20.7%) | $250,001 |
| 4-Person Families | 187 (22.0%) | $250,001 |
| 5-Person Families | 66 (7.8%) | $250,001 |
| 6-Person Families | 0 (0.0%) | $0 |
| 7+ Person Families | 0 (0.0%) | $0 |
| Total | 849 (100.0%) | $206,992 |
Family Income by Number of Earners in Port Washington North
The median family income in Port Washington North is $206,992, with families comprising 2 earners (365) having the highest median family income of $250,001, while families with no earners (208) have the lowest median family income of $64,811, accounting for 43.0% and 24.5% of families, respectively.
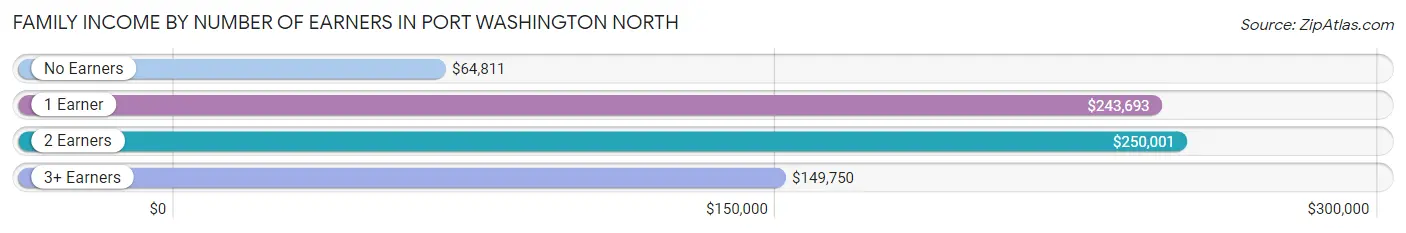
| Number of Earners | # Families | Median Income |
| No Earners | 208 (24.5%) | $64,811 |
| 1 Earner | 187 (22.0%) | $243,693 |
| 2 Earners | 365 (43.0%) | $250,001 |
| 3+ Earners | 89 (10.5%) | $149,750 |
| Total | 849 (100.0%) | $206,992 |
Household Income in Port Washington North
Household Income Brackets in Port Washington North
With 571 households falling in the category, the $200,000+ income range is the most frequent in Port Washington North, accounting for 38.7% of all households. In contrast, only 31 households (2.1%) fall into the $10,000 to $14,999 income bracket, making it the least populous group.
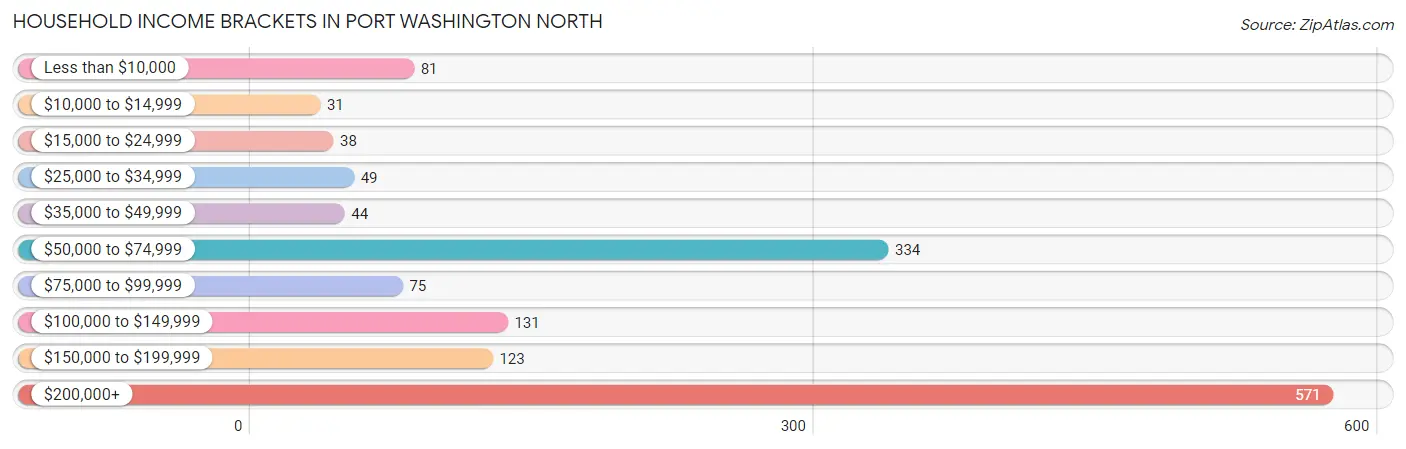
| Income Bracket | # Households | % Households |
| Less than $10,000 | 81 | 5.5% |
| $10,000 to $14,999 | 31 | 2.1% |
| $15,000 to $24,999 | 38 | 2.6% |
| $25,000 to $34,999 | 49 | 3.3% |
| $35,000 to $49,999 | 44 | 3.0% |
| $50,000 to $74,999 | 334 | 22.6% |
| $75,000 to $99,999 | 75 | 5.1% |
| $100,000 to $149,999 | 131 | 8.9% |
| $150,000 to $199,999 | 123 | 8.3% |
| $200,000+ | 571 | 38.7% |
Household Income by Householder Age in Port Washington North
The median household income in Port Washington North is $137,679, with the highest median household income of $250,001 found in the 25 to 44 years age bracket for the primary householder. A total of 174 households (11.8%) fall into this category.
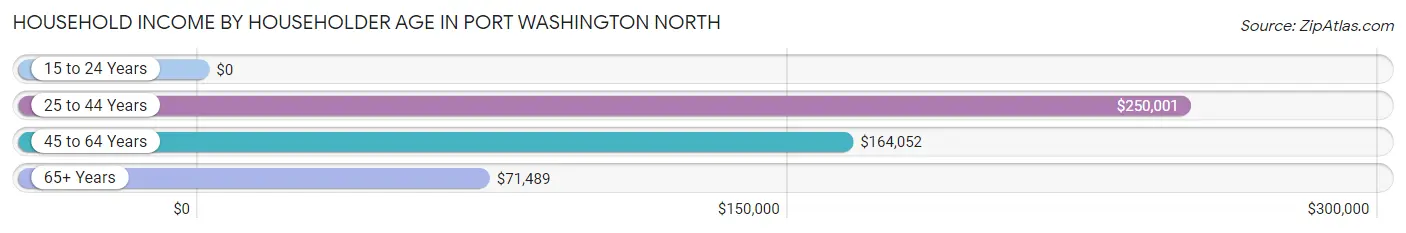
| Income Bracket | # Households | Median Income |
| 15 to 24 Years | 0 (0.0%) | $0 |
| 25 to 44 Years | 174 (11.8%) | $250,001 |
| 45 to 64 Years | 626 (42.4%) | $164,052 |
| 65+ Years | 676 (45.8%) | $71,489 |
| Total | 1,476 (100.0%) | $137,679 |
Poverty in Port Washington North
Income Below Poverty by Sex and Age in Port Washington North
With 6.2% poverty level for males and 6.3% for females among the residents of Port Washington North, 5 year old males and 75 year old and over females are the most vulnerable to poverty, with 20 males (30.3%) and 57 females (13.3%) in their respective age groups living below the poverty level.
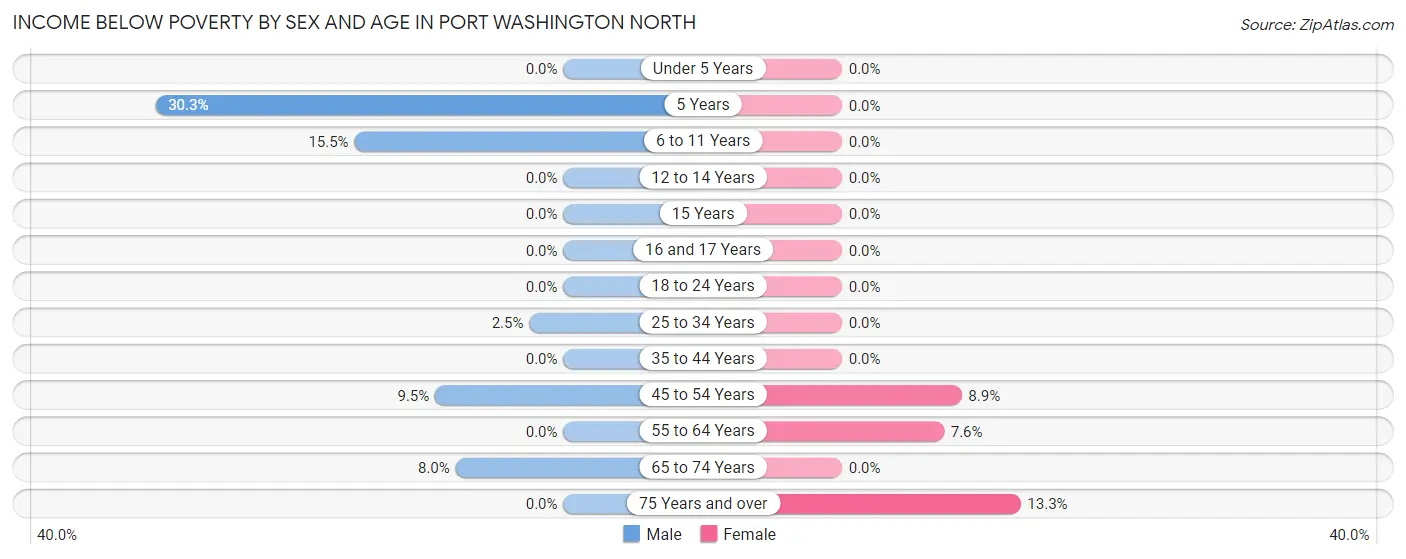
| Age Bracket | Male | Female |
| Under 5 Years | 0 (0.0%) | 0 (0.0%) |
| 5 Years | 20 (30.3%) | 0 (0.0%) |
| 6 to 11 Years | 38 (15.5%) | 0 (0.0%) |
| 12 to 14 Years | 0 (0.0%) | 0 (0.0%) |
| 15 Years | 0 (0.0%) | 0 (0.0%) |
| 16 and 17 Years | 0 (0.0%) | 0 (0.0%) |
| 18 to 24 Years | 0 (0.0%) | 0 (0.0%) |
| 25 to 34 Years | 2 (2.5%) | 0 (0.0%) |
| 35 to 44 Years | 0 (0.0%) | 0 (0.0%) |
| 45 to 54 Years | 22 (9.5%) | 23 (8.9%) |
| 55 to 64 Years | 0 (0.0%) | 24 (7.6%) |
| 65 to 74 Years | 12 (8.0%) | 0 (0.0%) |
| 75 Years and over | 0 (0.0%) | 57 (13.3%) |
| Total | 94 (6.2%) | 104 (6.3%) |
Income Above Poverty by Sex and Age in Port Washington North
According to the poverty statistics in Port Washington North, males aged under 5 years and females aged under 5 years are the age groups that are most secure financially, with 100.0% of males and 100.0% of females in these age groups living above the poverty line.
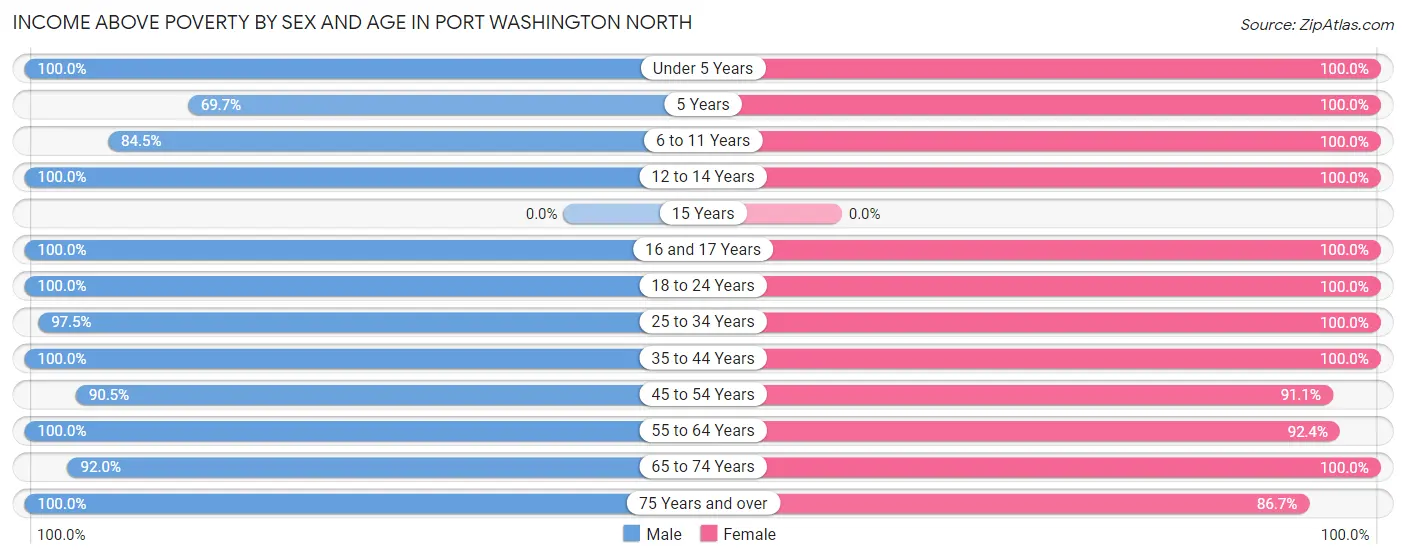
| Age Bracket | Male | Female |
| Under 5 Years | 19 (100.0%) | 55 (100.0%) |
| 5 Years | 46 (69.7%) | 21 (100.0%) |
| 6 to 11 Years | 207 (84.5%) | 87 (100.0%) |
| 12 to 14 Years | 52 (100.0%) | 22 (100.0%) |
| 15 Years | 0 (0.0%) | 0 (0.0%) |
| 16 and 17 Years | 25 (100.0%) | 20 (100.0%) |
| 18 to 24 Years | 55 (100.0%) | 65 (100.0%) |
| 25 to 34 Years | 77 (97.5%) | 62 (100.0%) |
| 35 to 44 Years | 132 (100.0%) | 144 (100.0%) |
| 45 to 54 Years | 209 (90.5%) | 236 (91.1%) |
| 55 to 64 Years | 179 (100.0%) | 293 (92.4%) |
| 65 to 74 Years | 138 (92.0%) | 160 (100.0%) |
| 75 Years and over | 285 (100.0%) | 373 (86.7%) |
| Total | 1,424 (93.8%) | 1,538 (93.7%) |
Income Below Poverty Among Married-Couple Families in Port Washington North
The poverty statistics for married-couple families in Port Washington North show that 4.3% or 34 of the total 794 families live below the poverty line. Families with 3 or 4 children have the highest poverty rate of 33.3%, comprising of 22 families. On the other hand, families with 1 or 2 children have the lowest poverty rate of 0.0%, which includes 0 families.
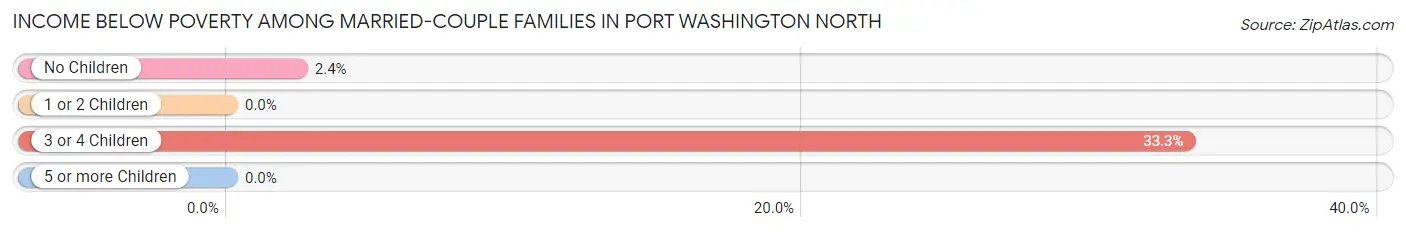
| Children | Above Poverty | Below Poverty |
| No Children | 482 (97.6%) | 12 (2.4%) |
| 1 or 2 Children | 234 (100.0%) | 0 (0.0%) |
| 3 or 4 Children | 44 (66.7%) | 22 (33.3%) |
| 5 or more Children | 0 (0.0%) | 0 (0.0%) |
| Total | 760 (95.7%) | 34 (4.3%) |
Income Below Poverty Among Single-Parent Households in Port Washington North
| Children | Single Father | Single Mother |
| No Children | 0 (0.0%) | 0 (0.0%) |
| 1 or 2 Children | 0 (0.0%) | 0 (0.0%) |
| 3 or 4 Children | 0 (0.0%) | 0 (0.0%) |
| 5 or more Children | 0 (0.0%) | 0 (0.0%) |
| Total | 0 (0.0%) | 0 (0.0%) |
Income Below Poverty Among Married-Couple vs Single-Parent Households in Port Washington North
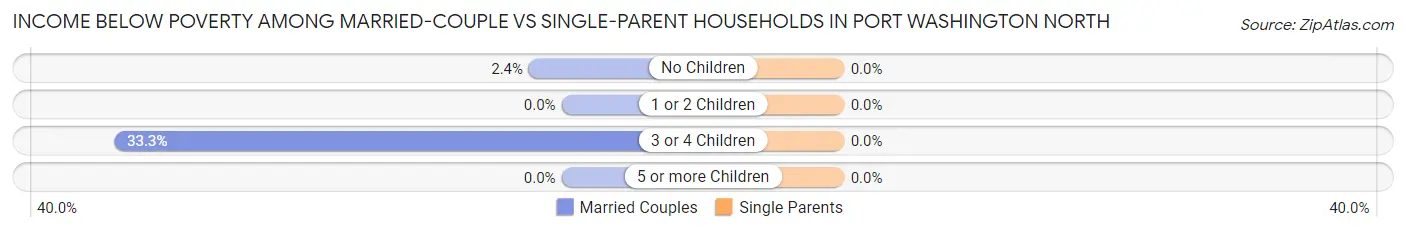
| Children | Married-Couple Families | Single-Parent Households |
| No Children | 12 (2.4%) | 0 (0.0%) |
| 1 or 2 Children | 0 (0.0%) | 0 (0.0%) |
| 3 or 4 Children | 22 (33.3%) | 0 (0.0%) |
| 5 or more Children | 0 (0.0%) | 0 (0.0%) |
| Total | 34 (4.3%) | 0 (0.0%) |
Race in Port Washington North
The most populous races in Port Washington North are White / Caucasian (2,672 | 84.3%), Asian (267 | 8.4%), and Black / African American (127 | 4.0%).
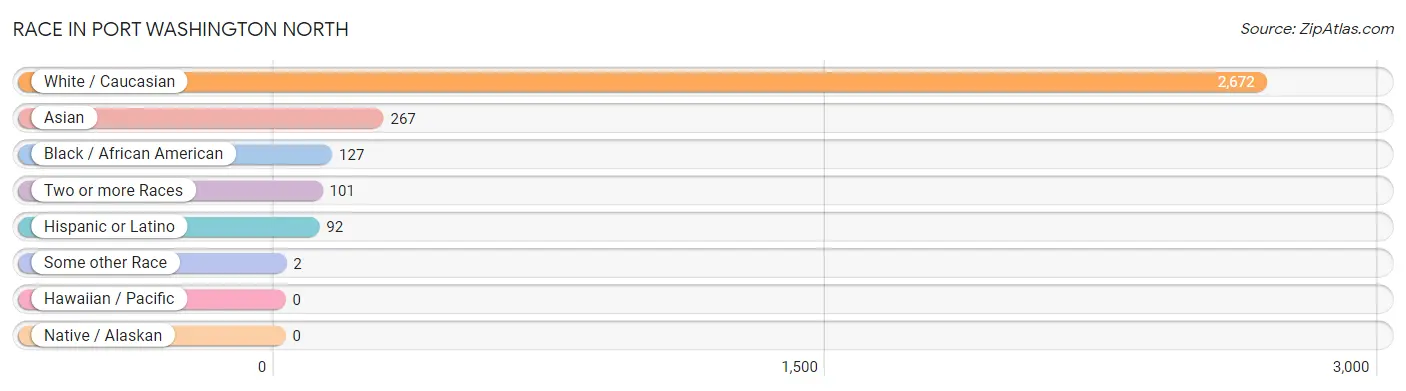
| Race | # Population | % Population |
| Asian | 267 | 8.4% |
| Black / African American | 127 | 4.0% |
| Hawaiian / Pacific | 0 | 0.0% |
| Hispanic or Latino | 92 | 2.9% |
| Native / Alaskan | 0 | 0.0% |
| White / Caucasian | 2,672 | 84.3% |
| Two or more Races | 101 | 3.2% |
| Some other Race | 2 | 0.1% |
| Total | 3,169 | 100.0% |
Ancestry in Port Washington North
The most populous ancestries reported in Port Washington North are Italian (640 | 20.2%), Irish (315 | 9.9%), German (310 | 9.8%), Eastern European (272 | 8.6%), and Polish (230 | 7.3%), together accounting for 55.8% of all Port Washington North residents.
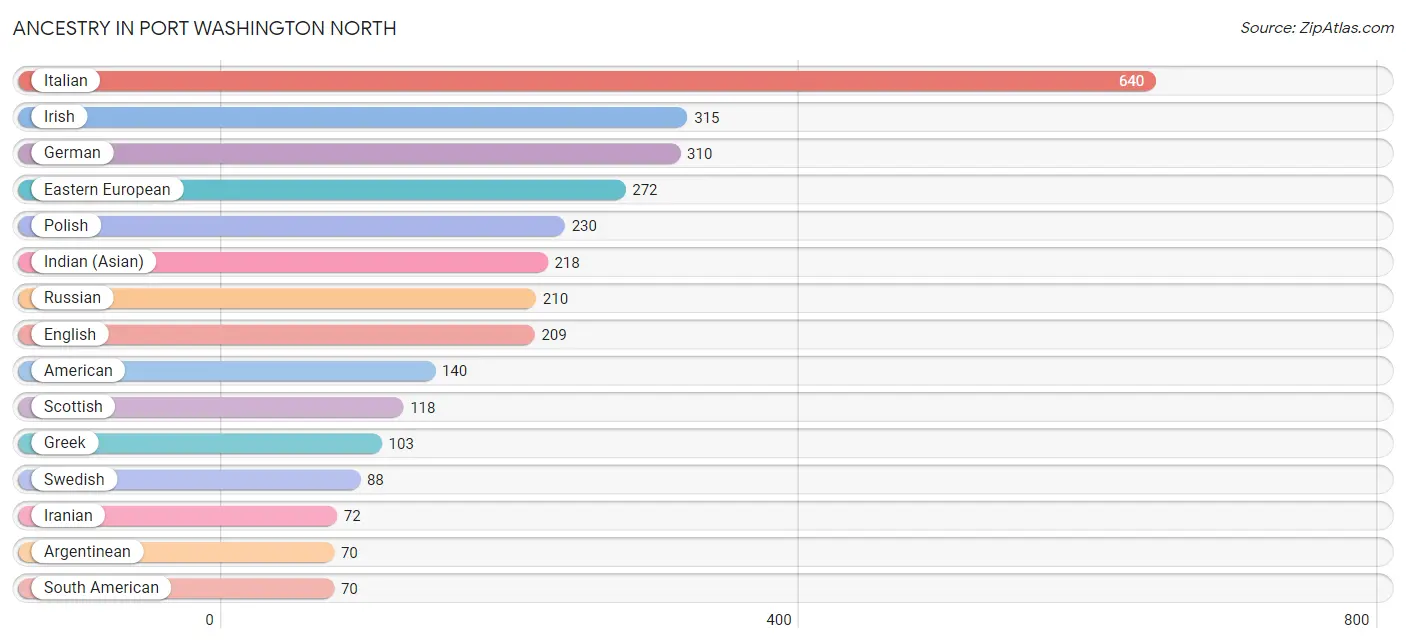
| Ancestry | # Population | % Population |
| African | 52 | 1.6% |
| American | 140 | 4.4% |
| Arab | 31 | 1.0% |
| Argentinean | 70 | 2.2% |
| Armenian | 40 | 1.3% |
| Brazilian | 11 | 0.4% |
| Czech | 9 | 0.3% |
| Dominican | 3 | 0.1% |
| Dutch | 22 | 0.7% |
| Eastern European | 272 | 8.6% |
| English | 209 | 6.6% |
| European | 59 | 1.9% |
| Filipino | 29 | 0.9% |
| French | 20 | 0.6% |
| German | 310 | 9.8% |
| Greek | 103 | 3.3% |
| Hungarian | 17 | 0.5% |
| Indian (Asian) | 218 | 6.9% |
| Iranian | 72 | 2.3% |
| Irish | 315 | 9.9% |
| Italian | 640 | 20.2% |
| Maltese | 9 | 0.3% |
| Polish | 230 | 7.3% |
| Puerto Rican | 2 | 0.1% |
| Russian | 210 | 6.6% |
| Scandinavian | 14 | 0.4% |
| Scottish | 118 | 3.7% |
| Slovak | 9 | 0.3% |
| South American | 70 | 2.2% |
| Spaniard | 15 | 0.5% |
| Subsaharan African | 52 | 1.6% |
| Swedish | 88 | 2.8% |
| Thai | 20 | 0.6% |
| Turkish | 16 | 0.5% |
| Ukrainian | 64 | 2.0% |
| Welsh | 69 | 2.2% | View All 36 Rows |
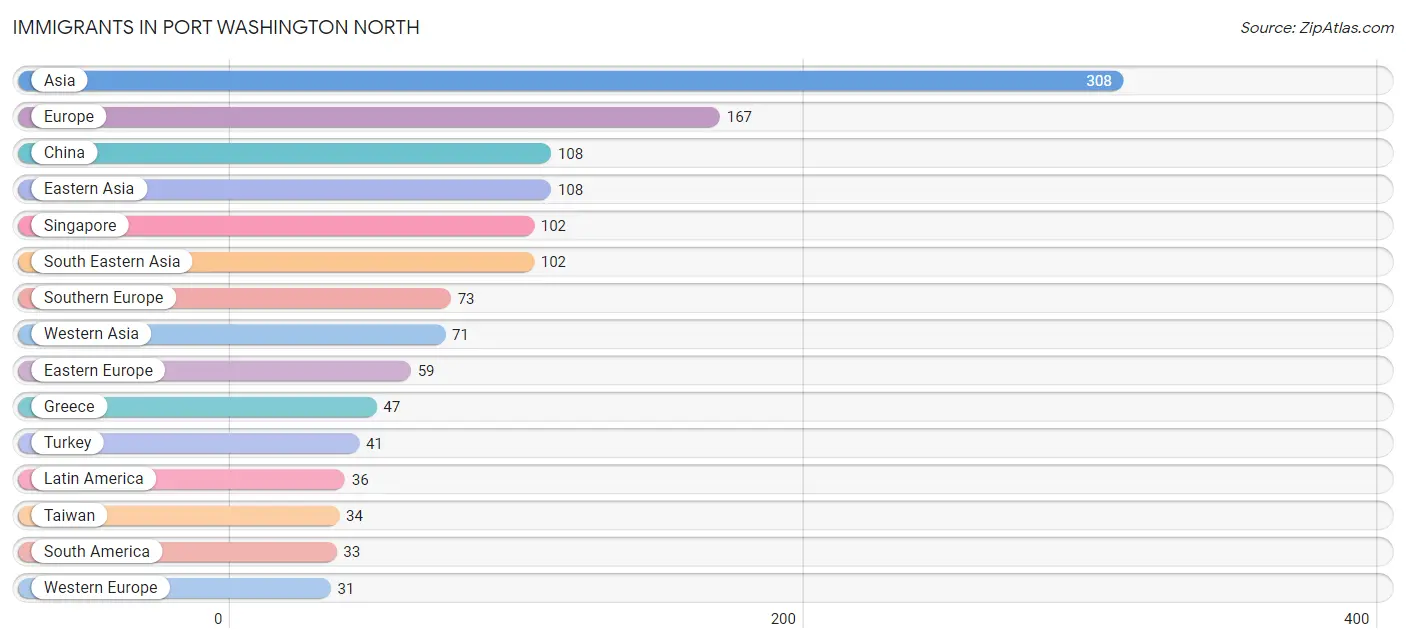
Immigrants in Port Washington North
The most numerous immigrant groups reported in Port Washington North came from Asia (308 | 9.7%), Europe (167 | 5.3%), China (108 | 3.4%), Eastern Asia (108 | 3.4%), and Singapore (102 | 3.2%), together accounting for 25.0% of all Port Washington North residents.
| Immigration Origin | # Population | % Population |
| Africa | 8 | 0.3% |
| Argentina | 22 | 0.7% |
| Asia | 308 | 9.7% |
| Australia | 9 | 0.3% |
| Belarus | 17 | 0.5% |
| Brazil | 11 | 0.4% |
| Caribbean | 3 | 0.1% |
| China | 108 | 3.4% |
| Dominican Republic | 3 | 0.1% |
| Eastern Asia | 108 | 3.4% |
| Eastern Europe | 59 | 1.9% |
| Europe | 167 | 5.3% |
| France | 20 | 0.6% |
| Germany | 11 | 0.4% |
| Greece | 47 | 1.5% |
| Hong Kong | 24 | 0.8% |
| India | 17 | 0.5% |
| Iran | 10 | 0.3% |
| Iraq | 10 | 0.3% |
| Israel | 12 | 0.4% |
| Italy | 18 | 0.6% |
| Jordan | 8 | 0.3% |
| Latin America | 36 | 1.1% |
| Lithuania | 14 | 0.4% |
| Northern Africa | 8 | 0.3% |
| Northern Europe | 4 | 0.1% |
| Oceania | 9 | 0.3% |
| Poland | 28 | 0.9% |
| Singapore | 102 | 3.2% |
| South America | 33 | 1.0% |
| South Central Asia | 27 | 0.9% |
| South Eastern Asia | 102 | 3.2% |
| Southern Europe | 73 | 2.3% |
| Taiwan | 34 | 1.1% |
| Turkey | 41 | 1.3% |
| Western Asia | 71 | 2.2% |
| Western Europe | 31 | 1.0% | View All 37 Rows |
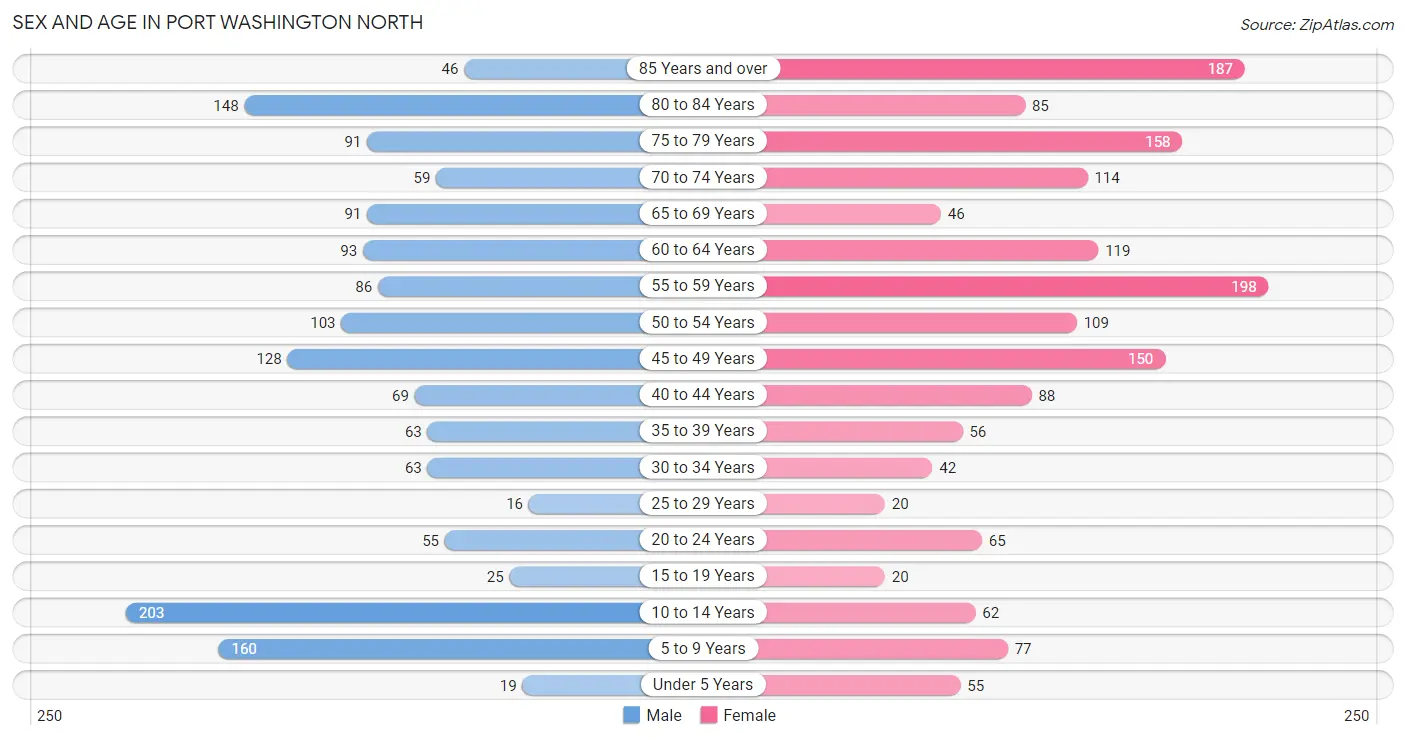
Sex and Age in Port Washington North
Sex and Age in Port Washington North
The most populous age groups in Port Washington North are 10 to 14 Years (203 | 13.4%) for men and 55 to 59 Years (198 | 12.0%) for women.
| Age Bracket | Male | Female |
| Under 5 Years | 19 (1.3%) | 55 (3.3%) |
| 5 to 9 Years | 160 (10.5%) | 77 (4.7%) |
| 10 to 14 Years | 203 (13.4%) | 62 (3.8%) |
| 15 to 19 Years | 25 (1.7%) | 20 (1.2%) |
| 20 to 24 Years | 55 (3.6%) | 65 (3.9%) |
| 25 to 29 Years | 16 (1.1%) | 20 (1.2%) |
| 30 to 34 Years | 63 (4.2%) | 42 (2.5%) |
| 35 to 39 Years | 63 (4.2%) | 56 (3.4%) |
| 40 to 44 Years | 69 (4.5%) | 88 (5.3%) |
| 45 to 49 Years | 128 (8.4%) | 150 (9.1%) |
| 50 to 54 Years | 103 (6.8%) | 109 (6.6%) |
| 55 to 59 Years | 86 (5.7%) | 198 (12.0%) |
| 60 to 64 Years | 93 (6.1%) | 119 (7.2%) |
| 65 to 69 Years | 91 (6.0%) | 46 (2.8%) |
| 70 to 74 Years | 59 (3.9%) | 114 (6.9%) |
| 75 to 79 Years | 91 (6.0%) | 158 (9.6%) |
| 80 to 84 Years | 148 (9.8%) | 85 (5.1%) |
| 85 Years and over | 46 (3.0%) | 187 (11.3%) |
| Total | 1,518 (100.0%) | 1,651 (100.0%) |
Families and Households in Port Washington North
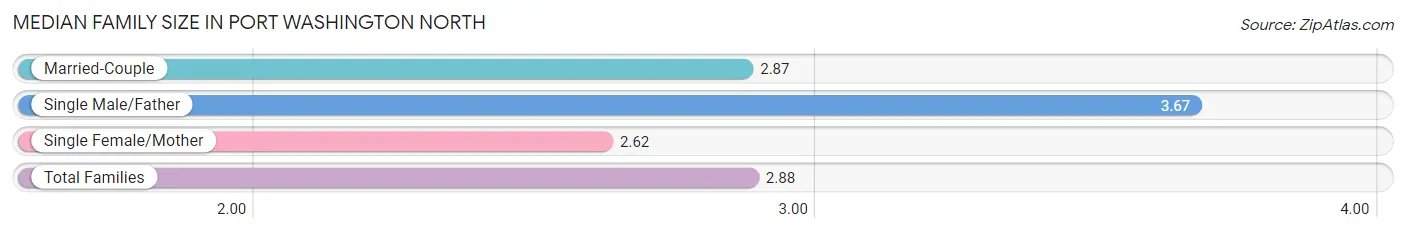
Median Family Size in Port Washington North
The median family size in Port Washington North is 2.88 persons per family, with single male/father families (18 | 2.1%) accounting for the largest median family size of 3.67 persons per family. On the other hand, single female/mother families (37 | 4.4%) represent the smallest median family size with 2.62 persons per family.
| Family Type | # Families | Family Size |
| Married-Couple | 794 (93.5%) | 2.87 |
| Single Male/Father | 18 (2.1%) | 3.67 |
| Single Female/Mother | 37 (4.4%) | 2.62 |
| Total Families | 849 (100.0%) | 2.88 |
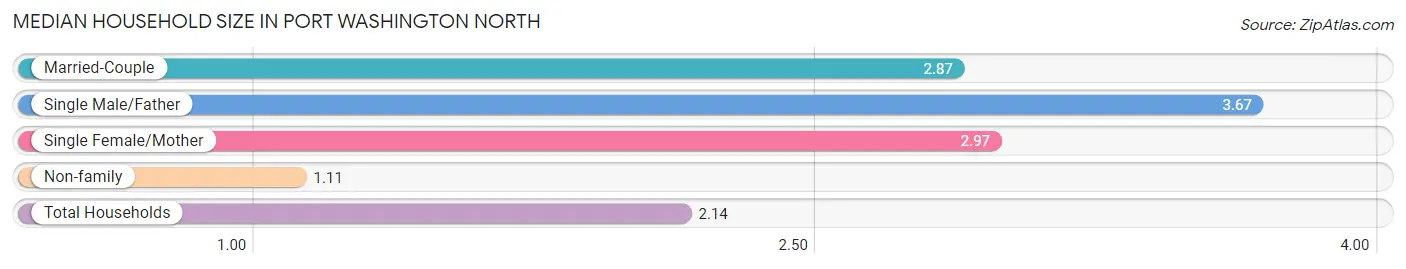
Median Household Size in Port Washington North
The median household size in Port Washington North is 2.14 persons per household, with single male/father households (18 | 1.2%) accounting for the largest median household size of 3.67 persons per household. non-family households (627 | 42.5%) represent the smallest median household size with 1.11 persons per household.
| Household Type | # Households | Household Size |
| Married-Couple | 794 (53.8%) | 2.87 |
| Single Male/Father | 18 (1.2%) | 3.67 |
| Single Female/Mother | 37 (2.5%) | 2.97 |
| Non-family | 627 (42.5%) | 1.11 |
| Total Households | 1,476 (100.0%) | 2.14 |
Household Size by Marriage Status in Port Washington North
Out of a total of 1,476 households in Port Washington North, 849 (57.5%) are family households, while 627 (42.5%) are nonfamily households. The most numerous type of family households are 2-person households, comprising 420, and the most common type of nonfamily households are 1-person households, comprising 567.
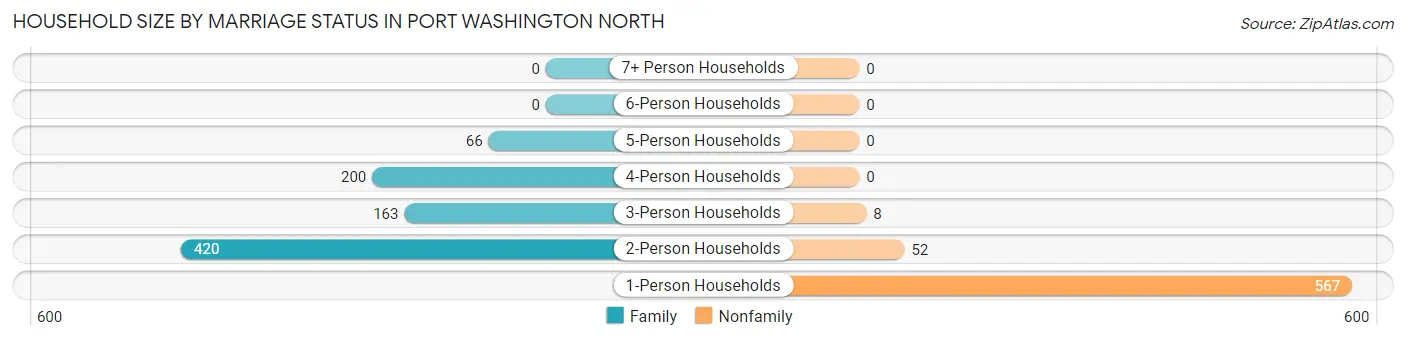
| Household Size | Family Households | Nonfamily Households |
| 1-Person Households | - | 567 (38.4%) |
| 2-Person Households | 420 (28.5%) | 52 (3.5%) |
| 3-Person Households | 163 (11.0%) | 8 (0.5%) |
| 4-Person Households | 200 (13.6%) | 0 (0.0%) |
| 5-Person Households | 66 (4.5%) | 0 (0.0%) |
| 6-Person Households | 0 (0.0%) | 0 (0.0%) |
| 7+ Person Households | 0 (0.0%) | 0 (0.0%) |
| Total | 849 (57.5%) | 627 (42.5%) |
Female Fertility in Port Washington North
Fertility by Age in Port Washington North
| Age Bracket | Women with Births | Births / 1,000 Women |
| 15 to 19 years | 0 (0.0%) | 0.0 |
| 20 to 34 years | 0 (0.0%) | 0.0 |
| 35 to 50 years | 0 (0.0%) | 0.0 |
| Total | 0 (0.0%) | 0.0 |
Fertility by Age by Marriage Status in Port Washington North
| Age Bracket | Married | Unmarried |
| 15 to 19 years | 0 (0.0%) | 0 (0.0%) |
| 20 to 34 years | 0 (0.0%) | 0 (0.0%) |
| 35 to 50 years | 0 (0.0%) | 0 (0.0%) |
| Total | 0 (0.0%) | 0 (0.0%) |
Fertility by Education in Port Washington North
| Educational Attainment | Women with Births | Births / 1,000 Women |
| Less than High School | 0 (0.0%) | 0.0 |
| High School Diploma | 0 (0.0%) | 0.0 |
| College or Associate's Degree | 0 (0.0%) | 0.0 |
| Bachelor's Degree | 0 (0.0%) | 0.0 |
| Graduate Degree | 0 (0.0%) | 0.0 |
| Total | 0 (0.0%) | 0.0 |
Fertility by Education by Marriage Status in Port Washington North
| Educational Attainment | Married | Unmarried |
| Less than High School | 0 (0.0%) | 0 (0.0%) |
| High School Diploma | 0 (0.0%) | 0 (0.0%) |
| College or Associate's Degree | 0 (0.0%) | 0 (0.0%) |
| Bachelor's Degree | 0 (0.0%) | 0 (0.0%) |
| Graduate Degree | 0 (0.0%) | 0 (0.0%) |
| Total | 0 (0.0%) | 0 (0.0%) |
Employment Characteristics in Port Washington North
Employment by Class of Employer in Port Washington North
Among the 1,419 employed individuals in Port Washington North, private company employees (864 | 60.9%), state government employees (176 | 12.4%), and not-for-profit organizations (113 | 8.0%) make up the most common classes of employment.
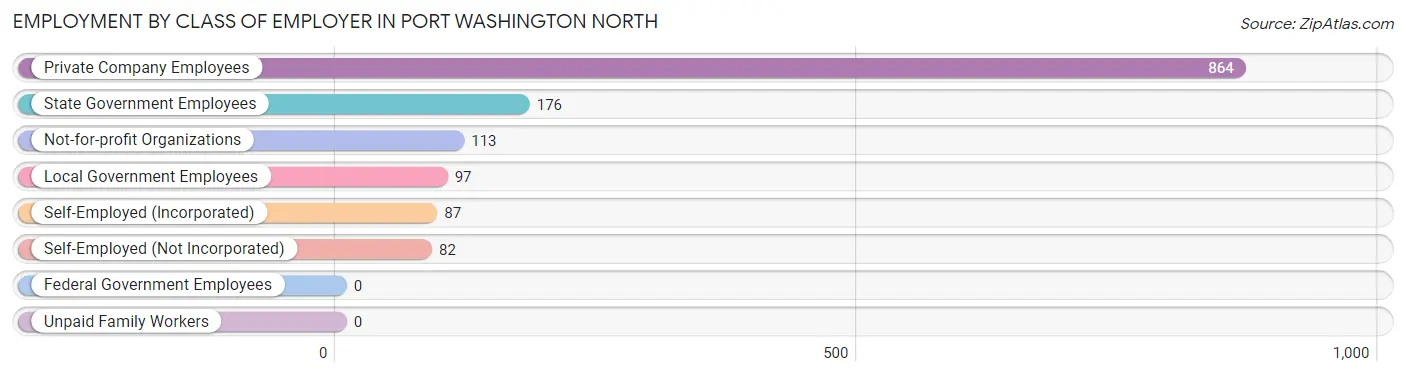
| Employer Class | # Employees | % Employees |
| Private Company Employees | 864 | 60.9% |
| Self-Employed (Incorporated) | 87 | 6.1% |
| Self-Employed (Not Incorporated) | 82 | 5.8% |
| Not-for-profit Organizations | 113 | 8.0% |
| Local Government Employees | 97 | 6.8% |
| State Government Employees | 176 | 12.4% |
| Federal Government Employees | 0 | 0.0% |
| Unpaid Family Workers | 0 | 0.0% |
| Total | 1,419 | 100.0% |
Employment Status by Age in Port Washington North
According to the labor force statistics for Port Washington North, out of the total population over 16 years of age (2,593), 56.7% or 1,470 individuals are in the labor force, with 3.5% or 51 of them unemployed. The age group with the highest labor force participation rate is 25 to 29 years, with 94.4% or 34 individuals in the labor force. Within the labor force, the 20 to 24 years age range has the highest percentage of unemployed individuals, with 18.8% or 18 of them being unemployed.
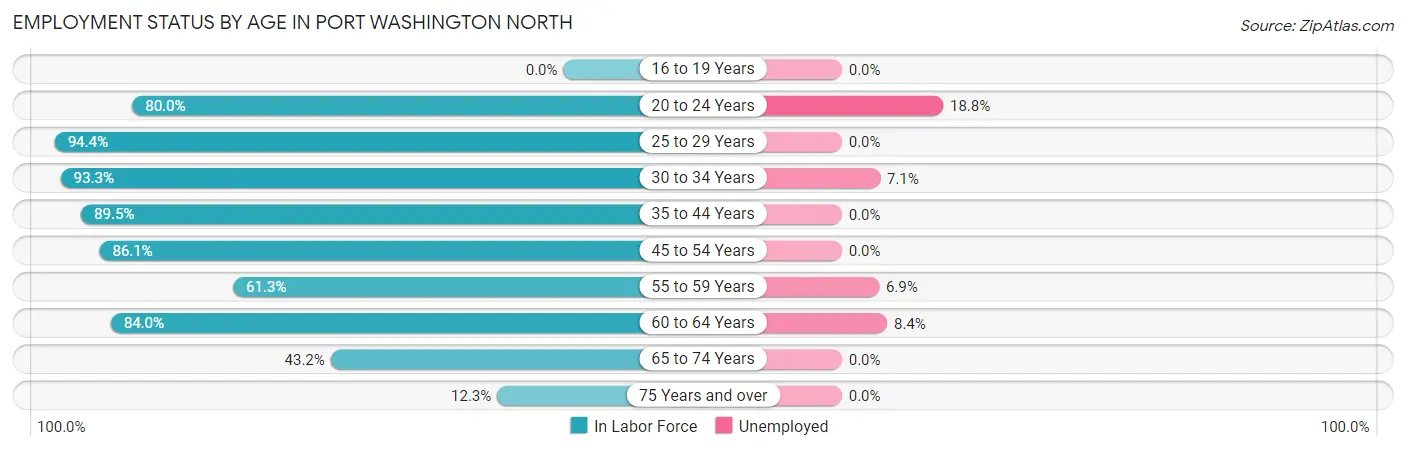
| Age Bracket | In Labor Force | Unemployed |
| 16 to 19 Years | 0 (0.0%) | 0 (0.0%) |
| 20 to 24 Years | 96 (80.0%) | 18 (18.8%) |
| 25 to 29 Years | 34 (94.4%) | 0 (0.0%) |
| 30 to 34 Years | 98 (93.3%) | 7 (7.1%) |
| 35 to 44 Years | 247 (89.5%) | 0 (0.0%) |
| 45 to 54 Years | 422 (86.1%) | 0 (0.0%) |
| 55 to 59 Years | 174 (61.3%) | 12 (6.9%) |
| 60 to 64 Years | 178 (84.0%) | 15 (8.4%) |
| 65 to 74 Years | 134 (43.2%) | 0 (0.0%) |
| 75 Years and over | 88 (12.3%) | 0 (0.0%) |
| Total | 1,470 (56.7%) | 51 (3.5%) |
Employment Status by Educational Attainment in Port Washington North
According to labor force statistics for Port Washington North, 82.2% of individuals (1,153) out of the total population between 25 and 64 years of age (1,403) are in the labor force, with 2.9% or 33 of them being unemployed. The group with the highest labor force participation rate are those with the educational attainment of bachelor's degree or higher, with 90.0% or 985 individuals in the labor force. Within the labor force, individuals with college / associate degree education have the highest percentage of unemployment, with 4.8% or 7 of them being unemployed.
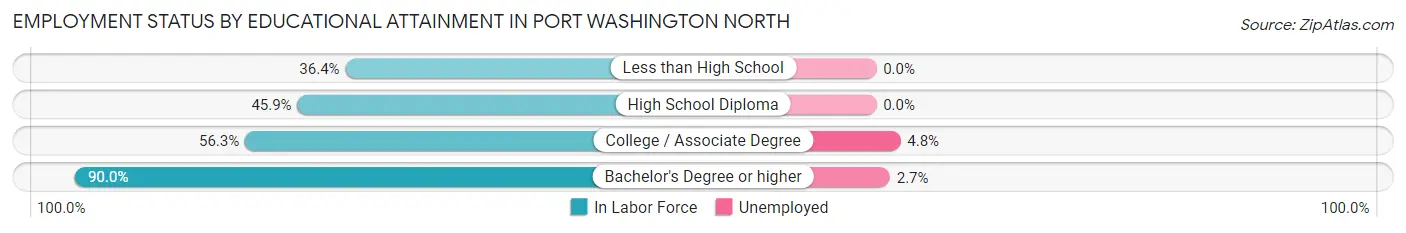
| Educational Attainment | In Labor Force | Unemployed |
| Less than High School | 4 (36.4%) | 0 (0.0%) |
| High School Diploma | 17 (45.9%) | 0 (0.0%) |
| College / Associate Degree | 147 (56.3%) | 13 (4.8%) |
| Bachelor's Degree or higher | 985 (90.0%) | 30 (2.7%) |
| Total | 1,153 (82.2%) | 41 (2.9%) |
Employment Occupations by Sex in Port Washington North
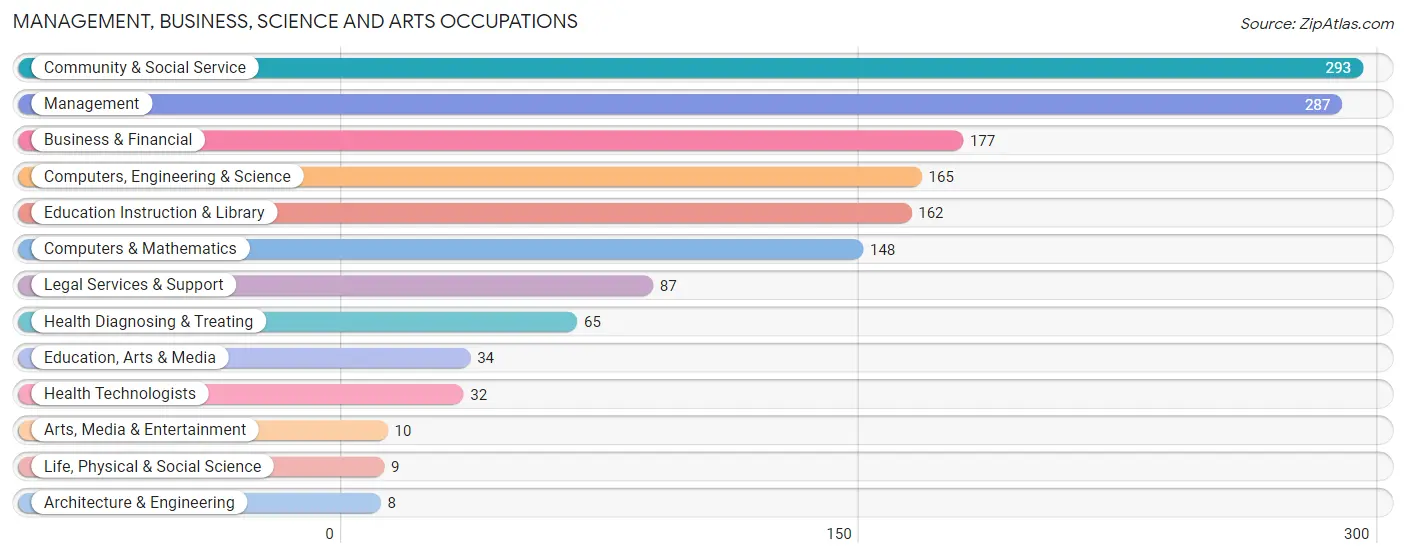
Management, Business, Science and Arts Occupations
The most common Management, Business, Science and Arts occupations in Port Washington North are Community & Social Service (293 | 20.6%), Management (287 | 20.2%), Business & Financial (177 | 12.5%), Computers, Engineering & Science (165 | 11.6%), and Education Instruction & Library (162 | 11.4%).
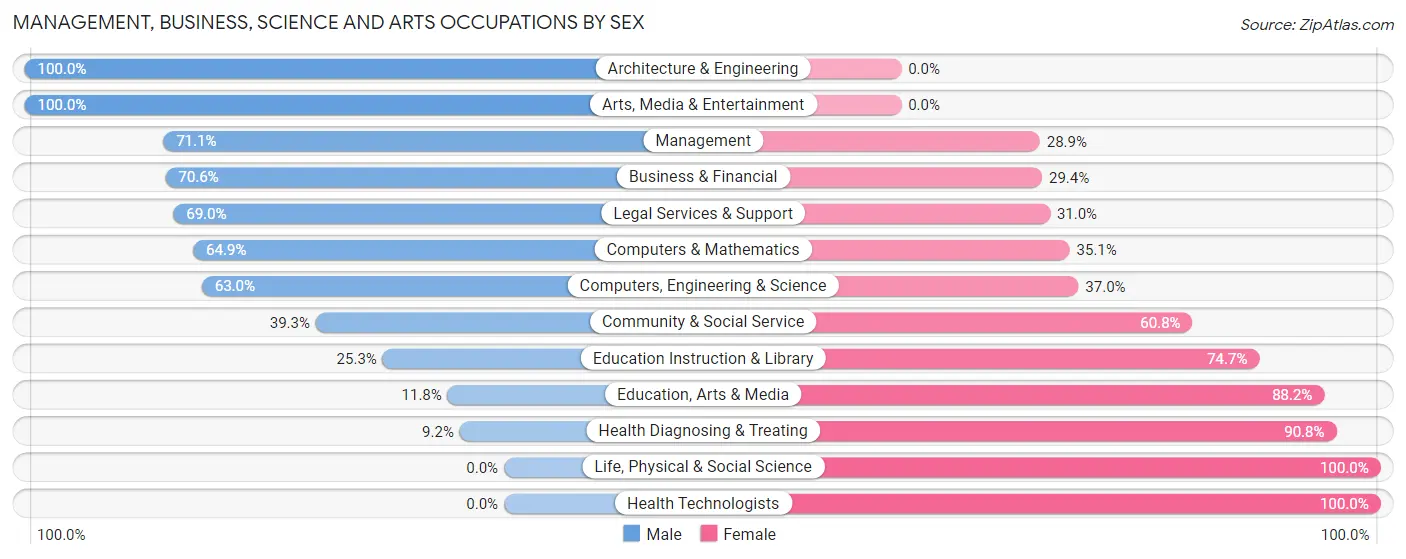
Management, Business, Science and Arts Occupations by Sex
Within the Management, Business, Science and Arts occupations in Port Washington North, the most male-oriented occupations are Architecture & Engineering (100.0%), Arts, Media & Entertainment (100.0%), and Management (71.1%), while the most female-oriented occupations are Life, Physical & Social Science (100.0%), Health Technologists (100.0%), and Health Diagnosing & Treating (90.8%).
| Occupation | Male | Female |
| Management | 204 (71.1%) | 83 (28.9%) |
| Business & Financial | 125 (70.6%) | 52 (29.4%) |
| Computers, Engineering & Science | 104 (63.0%) | 61 (37.0%) |
| Computers & Mathematics | 96 (64.9%) | 52 (35.1%) |
| Architecture & Engineering | 8 (100.0%) | 0 (0.0%) |
| Life, Physical & Social Science | 0 (0.0%) | 9 (100.0%) |
| Community & Social Service | 115 (39.3%) | 178 (60.8%) |
| Education, Arts & Media | 4 (11.8%) | 30 (88.2%) |
| Legal Services & Support | 60 (69.0%) | 27 (31.0%) |
| Education Instruction & Library | 41 (25.3%) | 121 (74.7%) |
| Arts, Media & Entertainment | 10 (100.0%) | 0 (0.0%) |
| Health Diagnosing & Treating | 6 (9.2%) | 59 (90.8%) |
| Health Technologists | 0 (0.0%) | 32 (100.0%) |
| Total (Category) | 554 (56.1%) | 433 (43.9%) |
| Total (Overall) | 753 (53.1%) | 666 (46.9%) |
Services Occupations
The most common Services occupations in Port Washington North are Personal Care & Service (63 | 4.4%), Food Preparation & Serving (36 | 2.5%), Security & Protection (30 | 2.1%), Law Enforcement (19 | 1.3%), and Healthcare Support (13 | 0.9%).

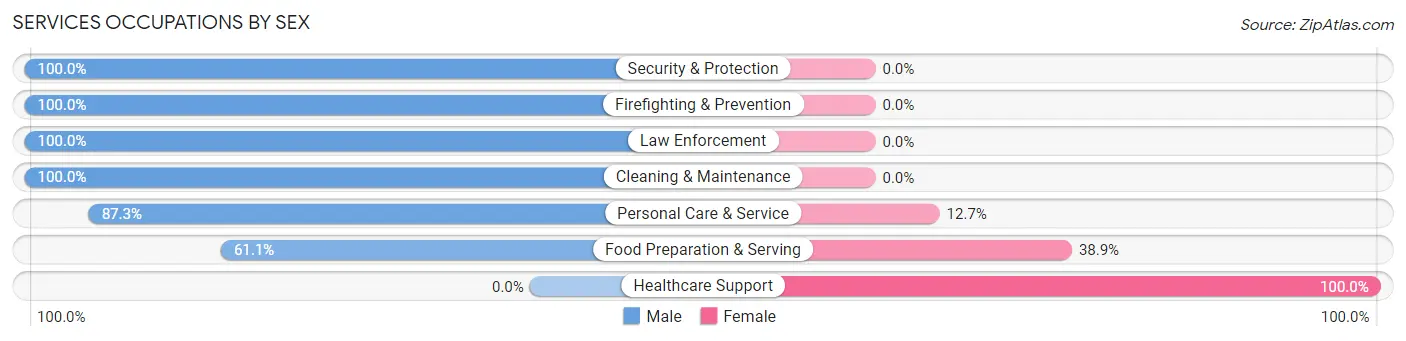
Services Occupations by Sex
Within the Services occupations in Port Washington North, the most male-oriented occupations are Security & Protection (100.0%), Firefighting & Prevention (100.0%), and Law Enforcement (100.0%), while the most female-oriented occupations are Healthcare Support (100.0%), Food Preparation & Serving (38.9%), and Personal Care & Service (12.7%).
| Occupation | Male | Female |
| Healthcare Support | 0 (0.0%) | 13 (100.0%) |
| Security & Protection | 30 (100.0%) | 0 (0.0%) |
| Firefighting & Prevention | 11 (100.0%) | 0 (0.0%) |
| Law Enforcement | 19 (100.0%) | 0 (0.0%) |
| Food Preparation & Serving | 22 (61.1%) | 14 (38.9%) |
| Cleaning & Maintenance | 8 (100.0%) | 0 (0.0%) |
| Personal Care & Service | 55 (87.3%) | 8 (12.7%) |
| Total (Category) | 115 (76.7%) | 35 (23.3%) |
| Total (Overall) | 753 (53.1%) | 666 (46.9%) |
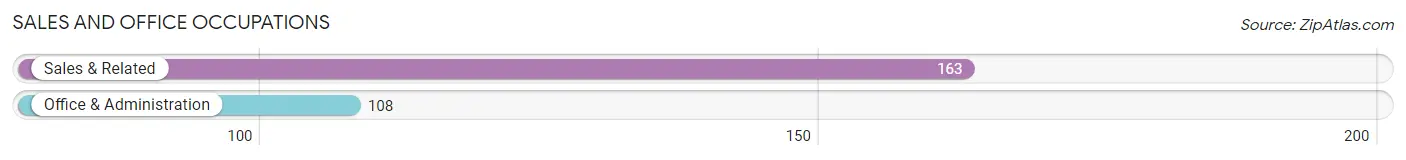
Sales and Office Occupations
The most common Sales and Office occupations in Port Washington North are Sales & Related (163 | 11.5%), and Office & Administration (108 | 7.6%).
Sales and Office Occupations by Sex
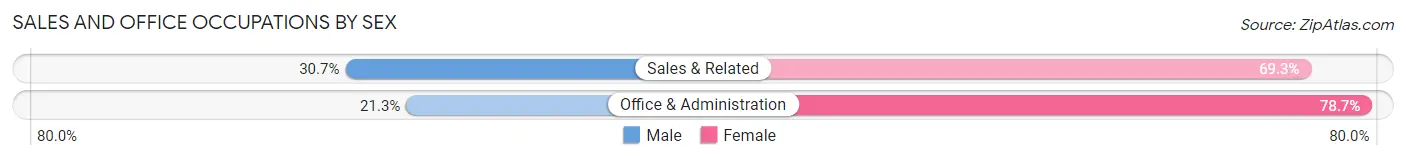
| Occupation | Male | Female |
| Sales & Related | 50 (30.7%) | 113 (69.3%) |
| Office & Administration | 23 (21.3%) | 85 (78.7%) |
| Total (Category) | 73 (26.9%) | 198 (73.1%) |
| Total (Overall) | 753 (53.1%) | 666 (46.9%) |
Natural Resources, Construction and Maintenance Occupations
The most common Natural Resources, Construction and Maintenance occupations in Port Washington North are , and Construction & Extraction (11 | 0.8%).
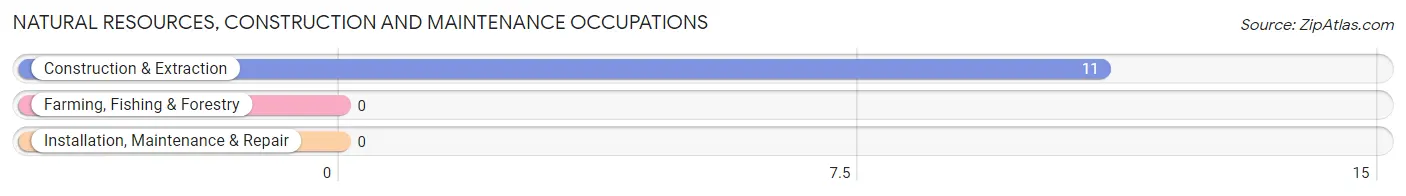
Natural Resources, Construction and Maintenance Occupations by Sex
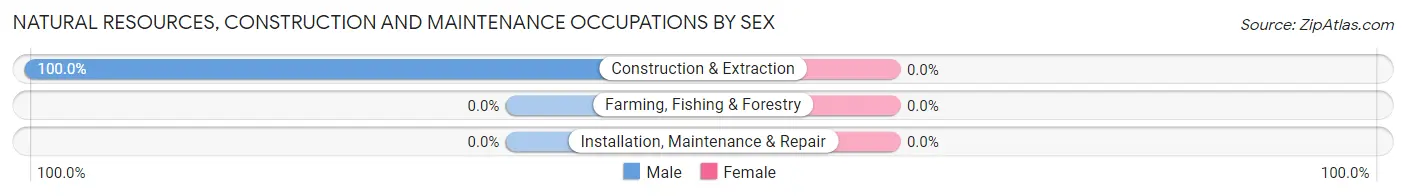
| Occupation | Male | Female |
| Farming, Fishing & Forestry | 0 (0.0%) | 0 (0.0%) |
| Construction & Extraction | 11 (100.0%) | 0 (0.0%) |
| Installation, Maintenance & Repair | 0 (0.0%) | 0 (0.0%) |
| Total (Category) | 11 (100.0%) | 0 (0.0%) |
| Total (Overall) | 753 (53.1%) | 666 (46.9%) |
Production, Transportation and Moving Occupations
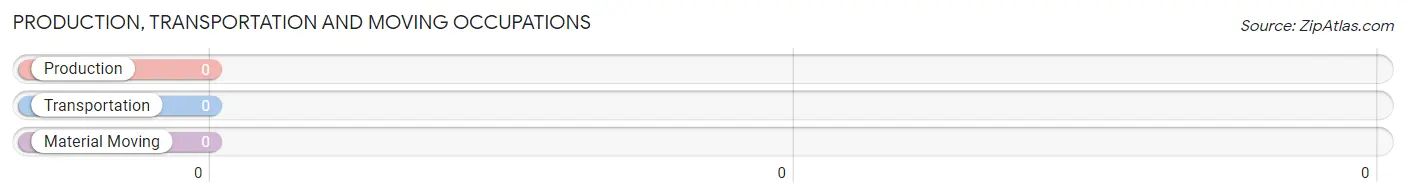
Production, Transportation and Moving Occupations by Sex
| Occupation | Male | Female |
| Production | 0 (0.0%) | 0 (0.0%) |
| Transportation | 0 (0.0%) | 0 (0.0%) |
| Material Moving | 0 (0.0%) | 0 (0.0%) |
| Total (Category) | 0 (0.0%) | 0 (0.0%) |
| Total (Overall) | 753 (53.1%) | 666 (46.9%) |
Employment Industries by Sex in Port Washington North
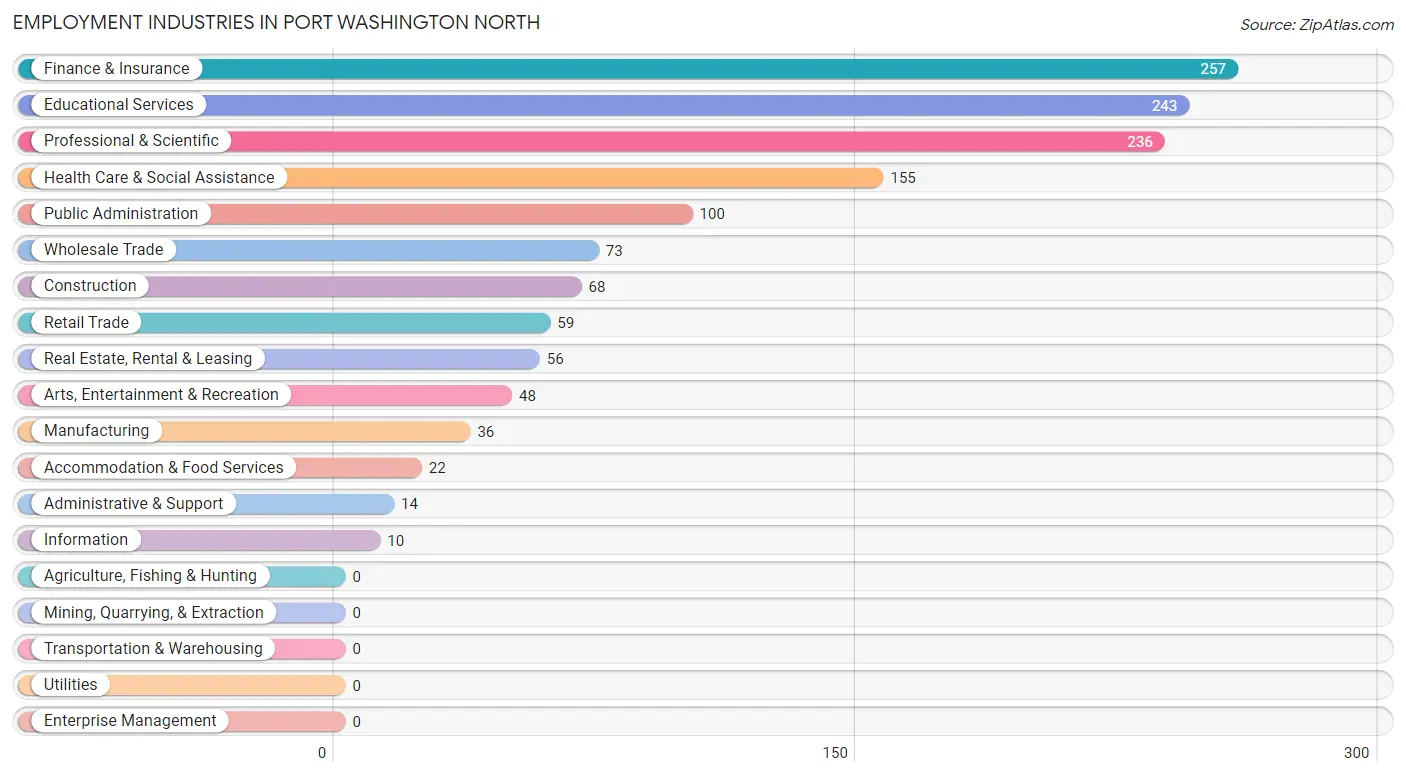
Employment Industries in Port Washington North
The major employment industries in Port Washington North include Finance & Insurance (257 | 18.1%), Educational Services (243 | 17.1%), Professional & Scientific (236 | 16.6%), Health Care & Social Assistance (155 | 10.9%), and Public Administration (100 | 7.0%).
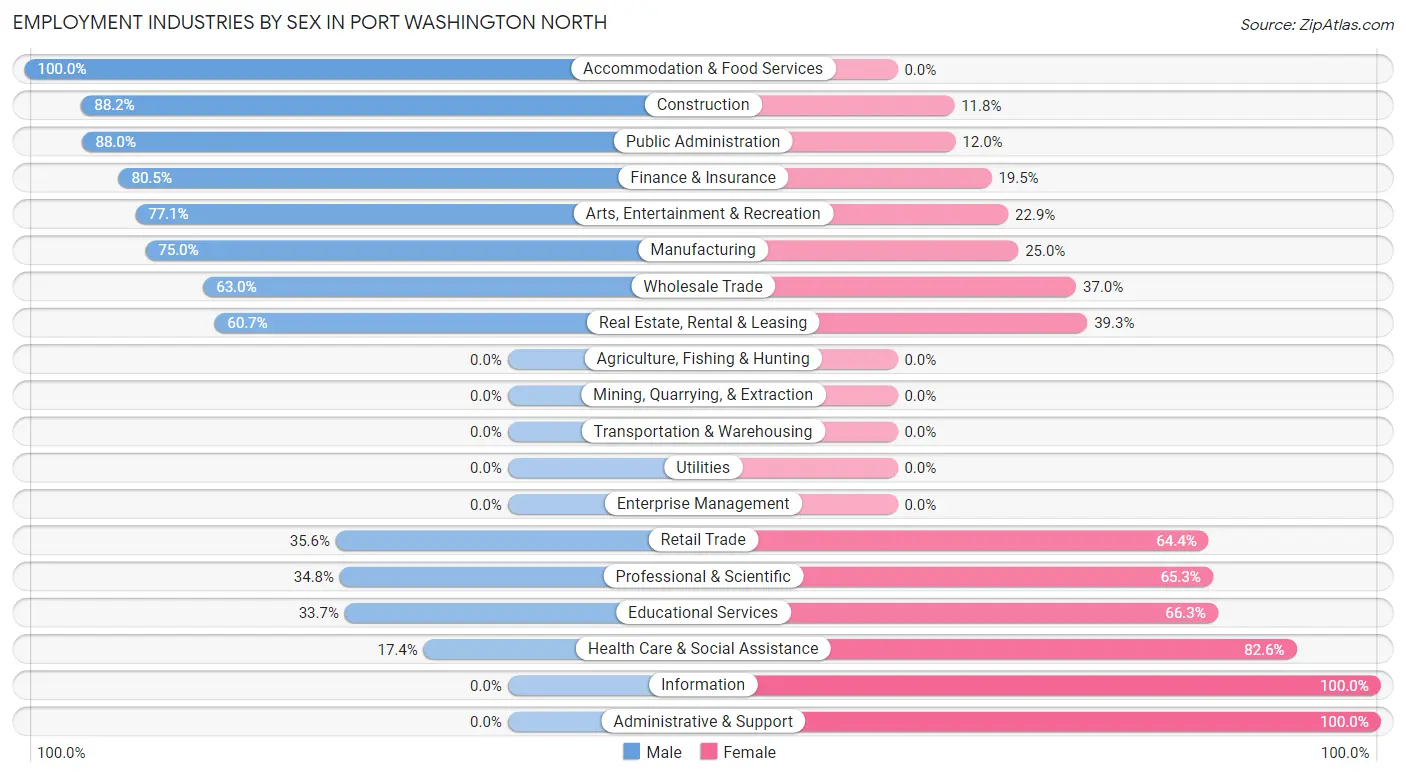
Employment Industries by Sex in Port Washington North
The Port Washington North industries that see more men than women are Accommodation & Food Services (100.0%), Construction (88.2%), and Public Administration (88.0%), whereas the industries that tend to have a higher number of women are Information (100.0%), Administrative & Support (100.0%), and Health Care & Social Assistance (82.6%).
| Industry | Male | Female |
| Agriculture, Fishing & Hunting | 0 (0.0%) | 0 (0.0%) |
| Mining, Quarrying, & Extraction | 0 (0.0%) | 0 (0.0%) |
| Construction | 60 (88.2%) | 8 (11.8%) |
| Manufacturing | 27 (75.0%) | 9 (25.0%) |
| Wholesale Trade | 46 (63.0%) | 27 (37.0%) |
| Retail Trade | 21 (35.6%) | 38 (64.4%) |
| Transportation & Warehousing | 0 (0.0%) | 0 (0.0%) |
| Utilities | 0 (0.0%) | 0 (0.0%) |
| Information | 0 (0.0%) | 10 (100.0%) |
| Finance & Insurance | 207 (80.5%) | 50 (19.5%) |
| Real Estate, Rental & Leasing | 34 (60.7%) | 22 (39.3%) |
| Professional & Scientific | 82 (34.7%) | 154 (65.2%) |
| Enterprise Management | 0 (0.0%) | 0 (0.0%) |
| Administrative & Support | 0 (0.0%) | 14 (100.0%) |
| Educational Services | 82 (33.7%) | 161 (66.3%) |
| Health Care & Social Assistance | 27 (17.4%) | 128 (82.6%) |
| Arts, Entertainment & Recreation | 37 (77.1%) | 11 (22.9%) |
| Accommodation & Food Services | 22 (100.0%) | 0 (0.0%) |
| Public Administration | 88 (88.0%) | 12 (12.0%) |
| Total | 753 (53.1%) | 666 (46.9%) |
Education in Port Washington North
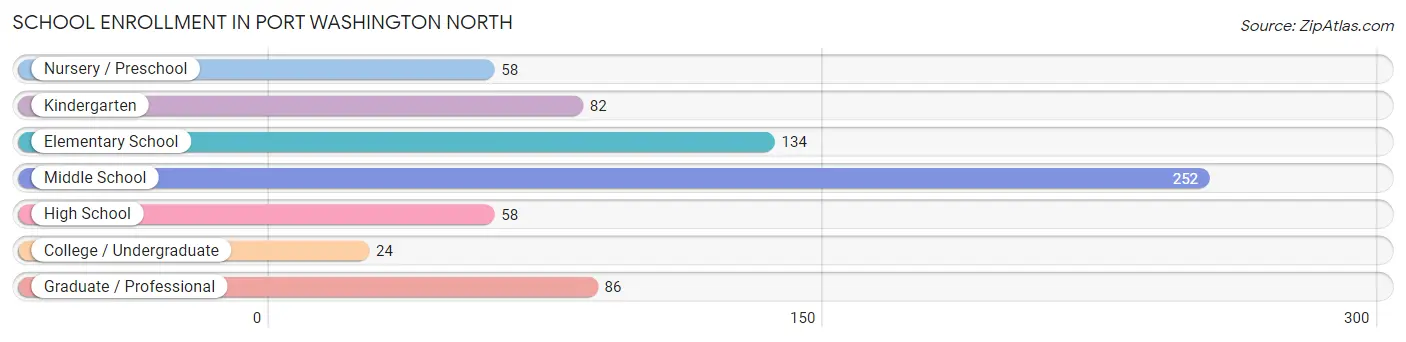
School Enrollment in Port Washington North
The most common levels of schooling among the 694 students in Port Washington North are middle school (252 | 36.3%), elementary school (134 | 19.3%), and graduate / professional (86 | 12.4%).
| School Level | # Students | % Students |
| Nursery / Preschool | 58 | 8.4% |
| Kindergarten | 82 | 11.8% |
| Elementary School | 134 | 19.3% |
| Middle School | 252 | 36.3% |
| High School | 58 | 8.4% |
| College / Undergraduate | 24 | 3.5% |
| Graduate / Professional | 86 | 12.4% |
| Total | 694 | 100.0% |
School Enrollment by Age by Funding Source in Port Washington North
Out of a total of 694 students who are enrolled in schools in Port Washington North, 186 (26.8%) attend a private institution, while the remaining 508 (73.2%) are enrolled in public schools. The age group of 35 years and over has the highest likelihood of being enrolled in private schools, with 52 (100.0% in the age bracket) enrolled. Conversely, the age group of 15 to 17 year olds has the lowest likelihood of being enrolled in a private school, with 45 (100.0% in the age bracket) attending a public institution.
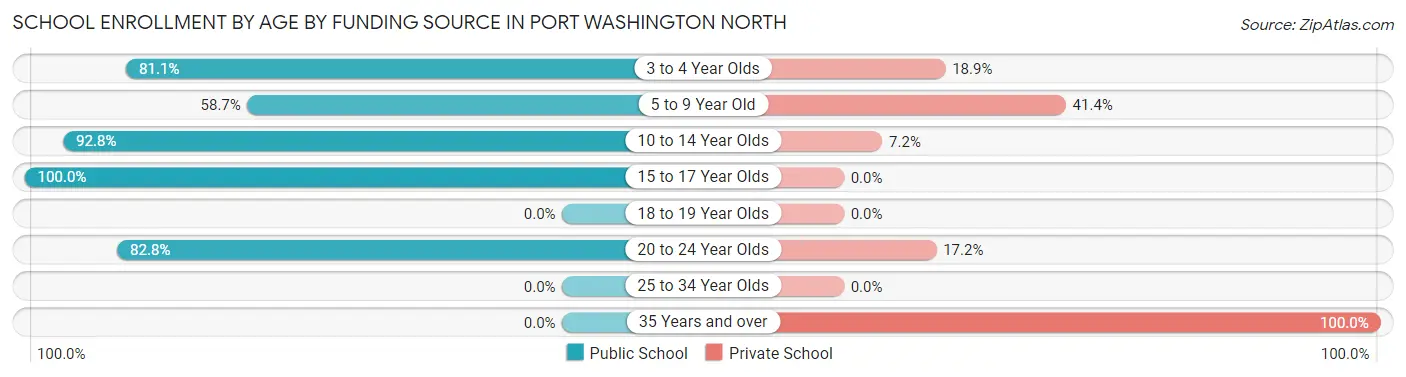
| Age Bracket | Public School | Private School |
| 3 to 4 Year Olds | 30 (81.1%) | 7 (18.9%) |
| 5 to 9 Year Old | 139 (58.7%) | 98 (41.3%) |
| 10 to 14 Year Olds | 246 (92.8%) | 19 (7.2%) |
| 15 to 17 Year Olds | 45 (100.0%) | 0 (0.0%) |
| 18 to 19 Year Olds | 0 (0.0%) | 0 (0.0%) |
| 20 to 24 Year Olds | 48 (82.8%) | 10 (17.2%) |
| 25 to 34 Year Olds | 0 (0.0%) | 0 (0.0%) |
| 35 Years and over | 0 (0.0%) | 52 (100.0%) |
| Total | 508 (73.2%) | 186 (26.8%) |
Educational Attainment by Field of Study in Port Washington North
Business (507 | 31.7%), social sciences (153 | 9.6%), psychology (136 | 8.5%), liberal arts & history (136 | 8.5%), and literature & languages (107 | 6.7%) are the most common fields of study among 1,598 individuals in Port Washington North who have obtained a bachelor's degree or higher.
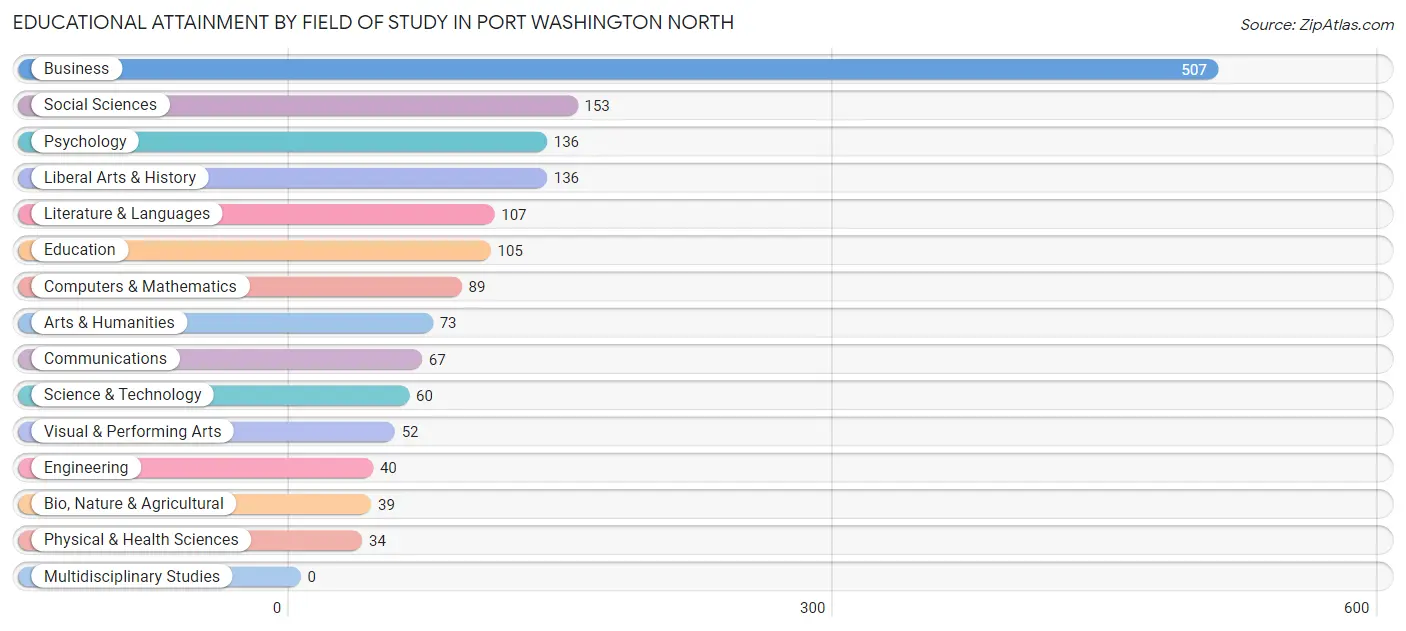
| Field of Study | # Graduates | % Graduates |
| Computers & Mathematics | 89 | 5.6% |
| Bio, Nature & Agricultural | 39 | 2.4% |
| Physical & Health Sciences | 34 | 2.1% |
| Psychology | 136 | 8.5% |
| Social Sciences | 153 | 9.6% |
| Engineering | 40 | 2.5% |
| Multidisciplinary Studies | 0 | 0.0% |
| Science & Technology | 60 | 3.7% |
| Business | 507 | 31.7% |
| Education | 105 | 6.6% |
| Literature & Languages | 107 | 6.7% |
| Liberal Arts & History | 136 | 8.5% |
| Visual & Performing Arts | 52 | 3.3% |
| Communications | 67 | 4.2% |
| Arts & Humanities | 73 | 4.6% |
| Total | 1,598 | 100.0% |
Transportation & Commute in Port Washington North
Vehicle Availability by Sex in Port Washington North
The most prevalent vehicle ownership categories in Port Washington North are males with 2 vehicles (506, accounting for 67.2%) and females with 2 vehicles (332, making up 76.0%).
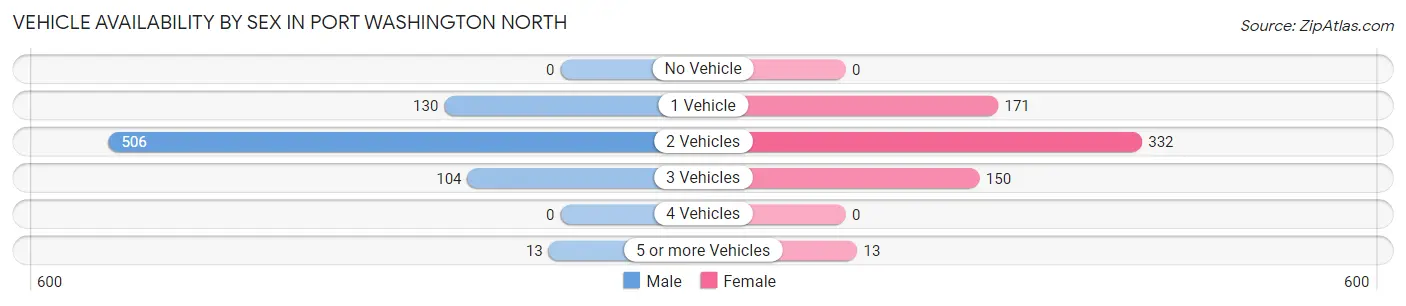
| Vehicles Available | Male | Female |
| No Vehicle | 0 (0.0%) | 0 (0.0%) |
| 1 Vehicle | 130 (17.3%) | 171 (25.7%) |
| 2 Vehicles | 506 (67.2%) | 332 (49.8%) |
| 3 Vehicles | 104 (13.8%) | 150 (22.5%) |
| 4 Vehicles | 0 (0.0%) | 0 (0.0%) |
| 5 or more Vehicles | 13 (1.7%) | 13 (1.9%) |
| Total | 753 (100.0%) | 666 (100.0%) |
Commute Time in Port Washington North
The most frequently occuring commute durations in Port Washington North are 60 to 89 minutes (340 commuters, 28.6%), 90 or more minutes (232 commuters, 19.5%), and 5 to 9 minutes (169 commuters, 14.2%).
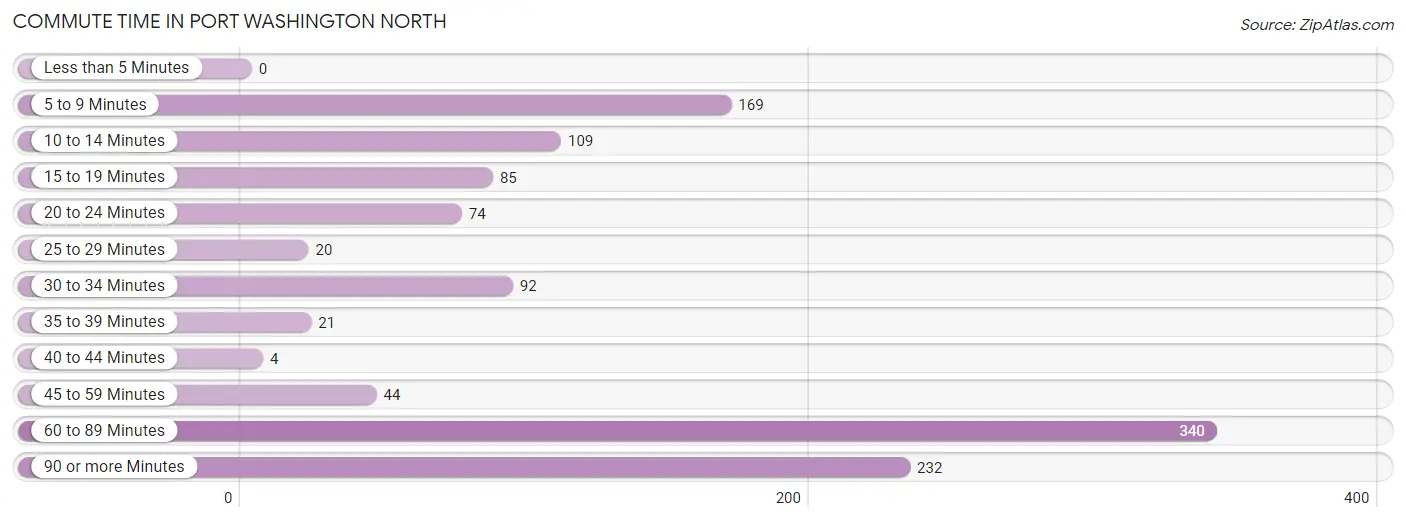
| Commute Time | # Commuters | % Commuters |
| Less than 5 Minutes | 0 | 0.0% |
| 5 to 9 Minutes | 169 | 14.2% |
| 10 to 14 Minutes | 109 | 9.2% |
| 15 to 19 Minutes | 85 | 7.1% |
| 20 to 24 Minutes | 74 | 6.2% |
| 25 to 29 Minutes | 20 | 1.7% |
| 30 to 34 Minutes | 92 | 7.7% |
| 35 to 39 Minutes | 21 | 1.8% |
| 40 to 44 Minutes | 4 | 0.3% |
| 45 to 59 Minutes | 44 | 3.7% |
| 60 to 89 Minutes | 340 | 28.6% |
| 90 or more Minutes | 232 | 19.5% |
Commute Time by Sex in Port Washington North
The most common commute times in Port Washington North are 60 to 89 minutes (267 commuters, 38.4%) for males and 5 to 9 minutes (151 commuters, 30.5%) for females.
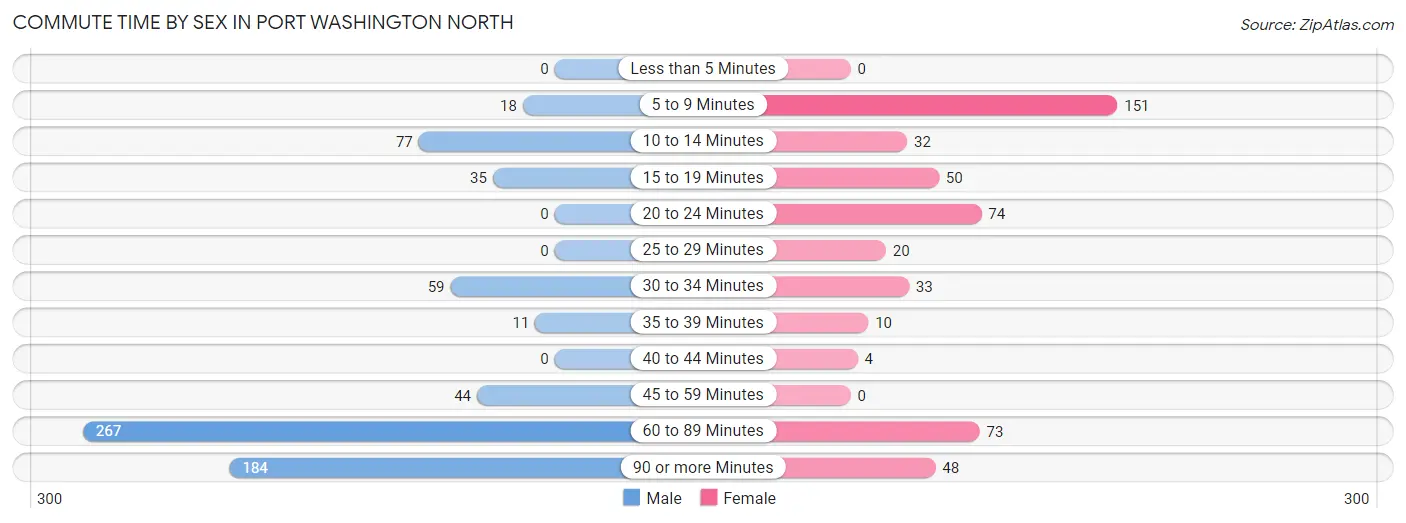
| Commute Time | Male | Female |
| Less than 5 Minutes | 0 (0.0%) | 0 (0.0%) |
| 5 to 9 Minutes | 18 (2.6%) | 151 (30.5%) |
| 10 to 14 Minutes | 77 (11.1%) | 32 (6.5%) |
| 15 to 19 Minutes | 35 (5.0%) | 50 (10.1%) |
| 20 to 24 Minutes | 0 (0.0%) | 74 (14.9%) |
| 25 to 29 Minutes | 0 (0.0%) | 20 (4.0%) |
| 30 to 34 Minutes | 59 (8.5%) | 33 (6.7%) |
| 35 to 39 Minutes | 11 (1.6%) | 10 (2.0%) |
| 40 to 44 Minutes | 0 (0.0%) | 4 (0.8%) |
| 45 to 59 Minutes | 44 (6.3%) | 0 (0.0%) |
| 60 to 89 Minutes | 267 (38.4%) | 73 (14.7%) |
| 90 or more Minutes | 184 (26.5%) | 48 (9.7%) |
Time of Departure to Work by Sex in Port Washington North
The most frequent times of departure to work in Port Washington North are 6:00 AM to 6:29 AM (139, 20.0%) for males and 7:30 AM to 7:59 AM (178, 36.0%) for females.
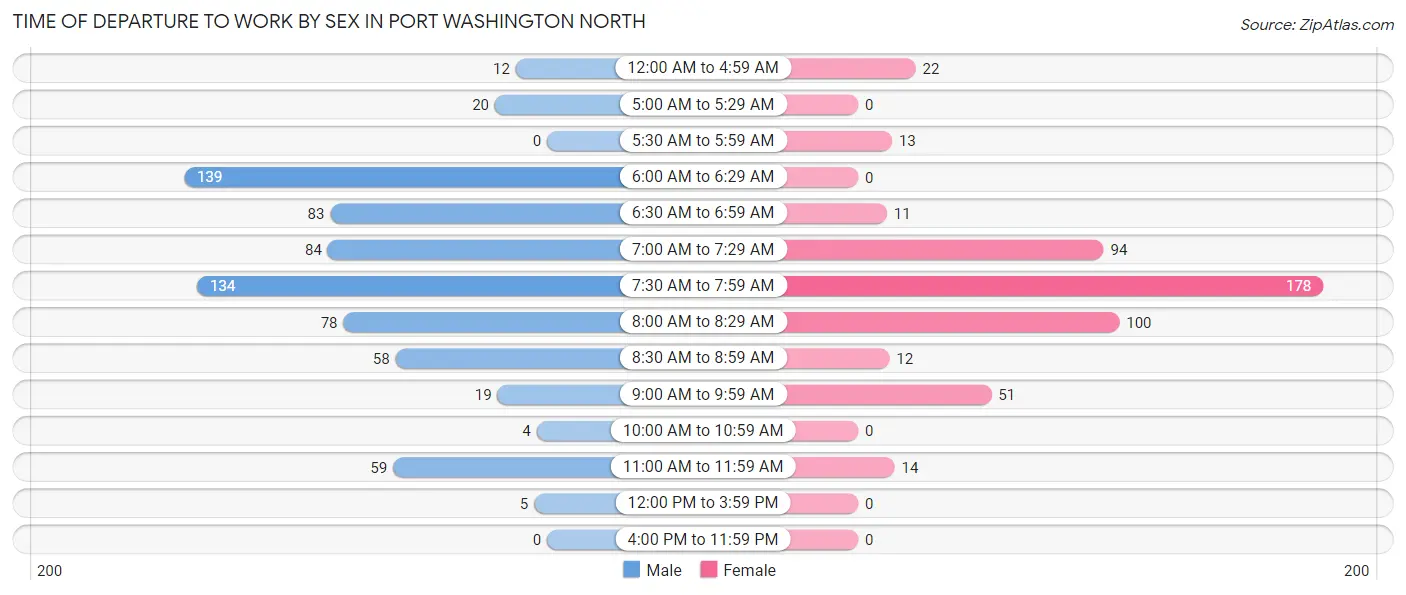
| Time of Departure | Male | Female |
| 12:00 AM to 4:59 AM | 12 (1.7%) | 22 (4.4%) |
| 5:00 AM to 5:29 AM | 20 (2.9%) | 0 (0.0%) |
| 5:30 AM to 5:59 AM | 0 (0.0%) | 13 (2.6%) |
| 6:00 AM to 6:29 AM | 139 (20.0%) | 0 (0.0%) |
| 6:30 AM to 6:59 AM | 83 (11.9%) | 11 (2.2%) |
| 7:00 AM to 7:29 AM | 84 (12.1%) | 94 (19.0%) |
| 7:30 AM to 7:59 AM | 134 (19.3%) | 178 (36.0%) |
| 8:00 AM to 8:29 AM | 78 (11.2%) | 100 (20.2%) |
| 8:30 AM to 8:59 AM | 58 (8.4%) | 12 (2.4%) |
| 9:00 AM to 9:59 AM | 19 (2.7%) | 51 (10.3%) |
| 10:00 AM to 10:59 AM | 4 (0.6%) | 0 (0.0%) |
| 11:00 AM to 11:59 AM | 59 (8.5%) | 14 (2.8%) |
| 12:00 PM to 3:59 PM | 5 (0.7%) | 0 (0.0%) |
| 4:00 PM to 11:59 PM | 0 (0.0%) | 0 (0.0%) |
| Total | 695 (100.0%) | 495 (100.0%) |
Housing Occupancy in Port Washington North
Occupancy by Ownership in Port Washington North
Of the total 1,476 dwellings in Port Washington North, owner-occupied units account for 948 (64.2%), while renter-occupied units make up 528 (35.8%).
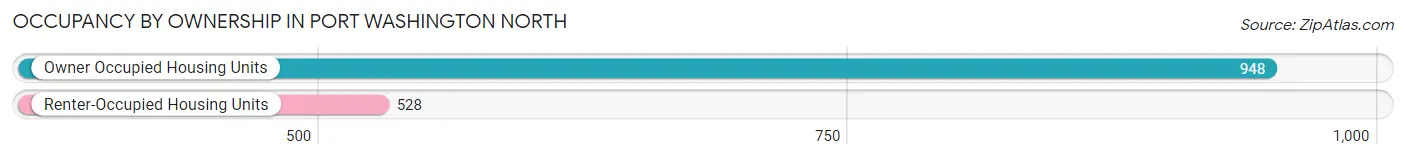
| Occupancy | # Housing Units | % Housing Units |
| Owner Occupied Housing Units | 948 | 64.2% |
| Renter-Occupied Housing Units | 528 | 35.8% |
| Total Occupied Housing Units | 1,476 | 100.0% |
Occupancy by Household Size in Port Washington North
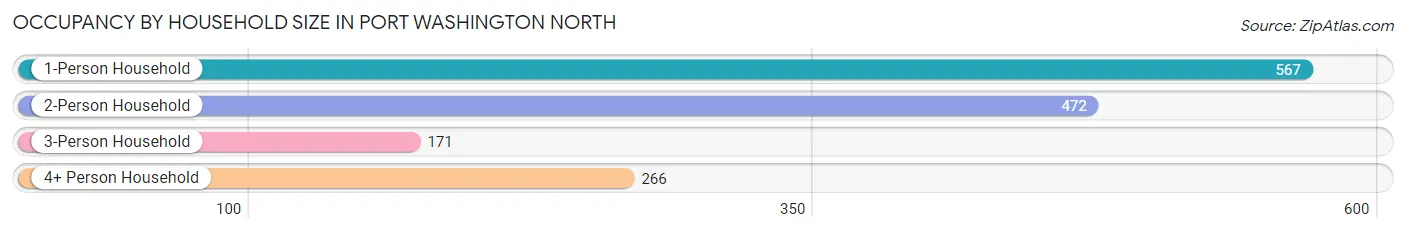
| Household Size | # Housing Units | % Housing Units |
| 1-Person Household | 567 | 38.4% |
| 2-Person Household | 472 | 32.0% |
| 3-Person Household | 171 | 11.6% |
| 4+ Person Household | 266 | 18.0% |
| Total Housing Units | 1,476 | 100.0% |
Occupancy by Ownership by Household Size in Port Washington North
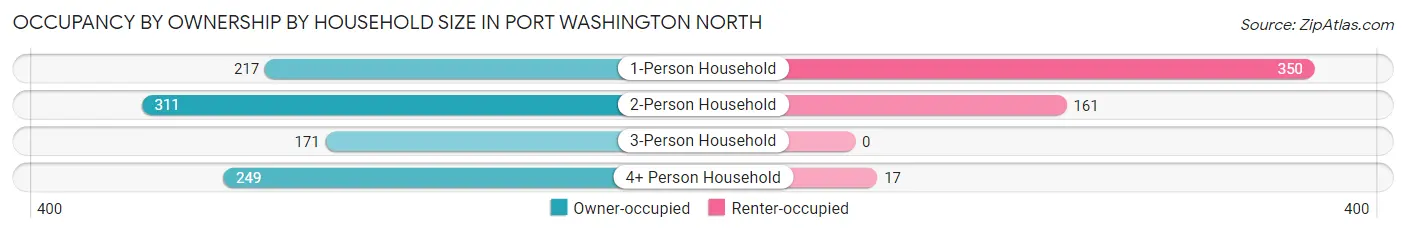
| Household Size | Owner-occupied | Renter-occupied |
| 1-Person Household | 217 (38.3%) | 350 (61.7%) |
| 2-Person Household | 311 (65.9%) | 161 (34.1%) |
| 3-Person Household | 171 (100.0%) | 0 (0.0%) |
| 4+ Person Household | 249 (93.6%) | 17 (6.4%) |
| Total Housing Units | 948 (64.2%) | 528 (35.8%) |
Occupancy by Educational Attainment in Port Washington North
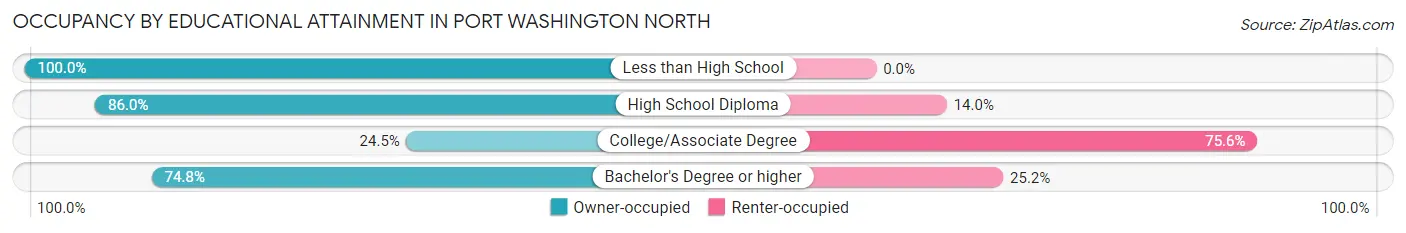
| Household Size | Owner-occupied | Renter-occupied |
| Less than High School | 21 (100.0%) | 0 (0.0%) |
| High School Diploma | 166 (86.0%) | 27 (14.0%) |
| College/Associate Degree | 89 (24.4%) | 275 (75.5%) |
| Bachelor's Degree or higher | 672 (74.8%) | 226 (25.2%) |
Occupancy by Age of Householder in Port Washington North
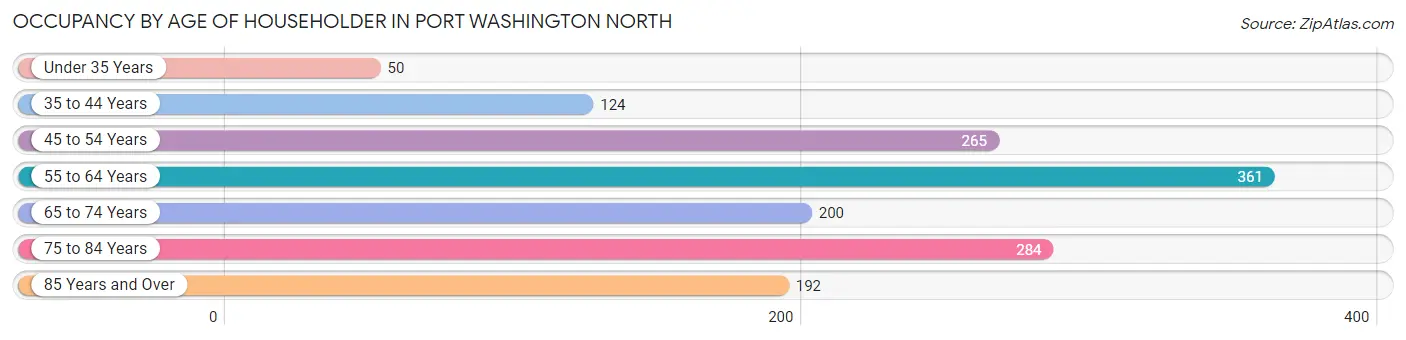
| Age Bracket | # Households | % Households |
| Under 35 Years | 50 | 3.4% |
| 35 to 44 Years | 124 | 8.4% |
| 45 to 54 Years | 265 | 17.9% |
| 55 to 64 Years | 361 | 24.5% |
| 65 to 74 Years | 200 | 13.6% |
| 75 to 84 Years | 284 | 19.2% |
| 85 Years and Over | 192 | 13.0% |
| Total | 1,476 | 100.0% |
Housing Finances in Port Washington North
Median Income by Occupancy in Port Washington North
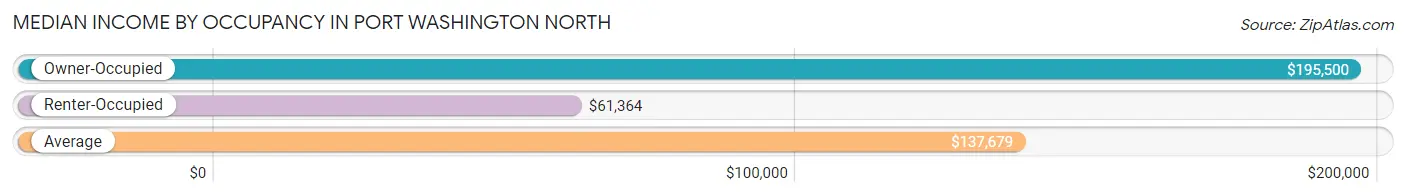
| Occupancy Type | # Households | Median Income |
| Owner-Occupied | 948 (64.2%) | $195,500 |
| Renter-Occupied | 528 (35.8%) | $61,364 |
| Average | 1,476 (100.0%) | $137,679 |
Occupancy by Householder Income Bracket in Port Washington North
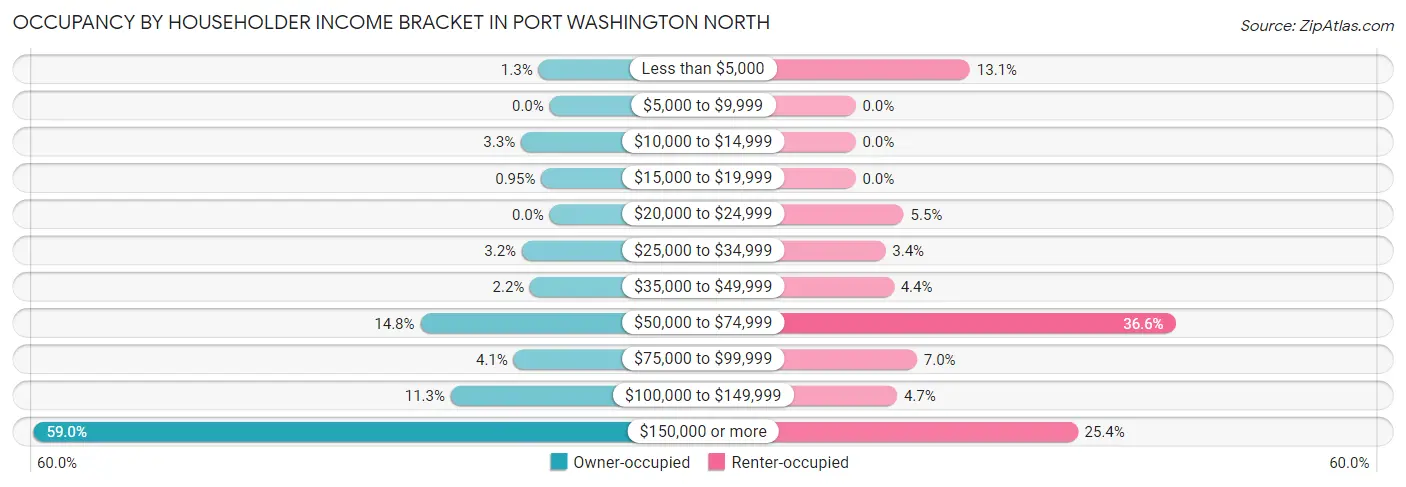
| Income Bracket | Owner-occupied | Renter-occupied |
| Less than $5,000 | 12 (1.3%) | 69 (13.1%) |
| $5,000 to $9,999 | 0 (0.0%) | 0 (0.0%) |
| $10,000 to $14,999 | 31 (3.3%) | 0 (0.0%) |
| $15,000 to $19,999 | 9 (0.9%) | 0 (0.0%) |
| $20,000 to $24,999 | 0 (0.0%) | 29 (5.5%) |
| $25,000 to $34,999 | 30 (3.2%) | 18 (3.4%) |
| $35,000 to $49,999 | 21 (2.2%) | 23 (4.4%) |
| $50,000 to $74,999 | 140 (14.8%) | 193 (36.5%) |
| $75,000 to $99,999 | 39 (4.1%) | 37 (7.0%) |
| $100,000 to $149,999 | 107 (11.3%) | 25 (4.7%) |
| $150,000 or more | 559 (59.0%) | 134 (25.4%) |
| Total | 948 (100.0%) | 528 (100.0%) |
Monthly Housing Cost Tiers in Port Washington North
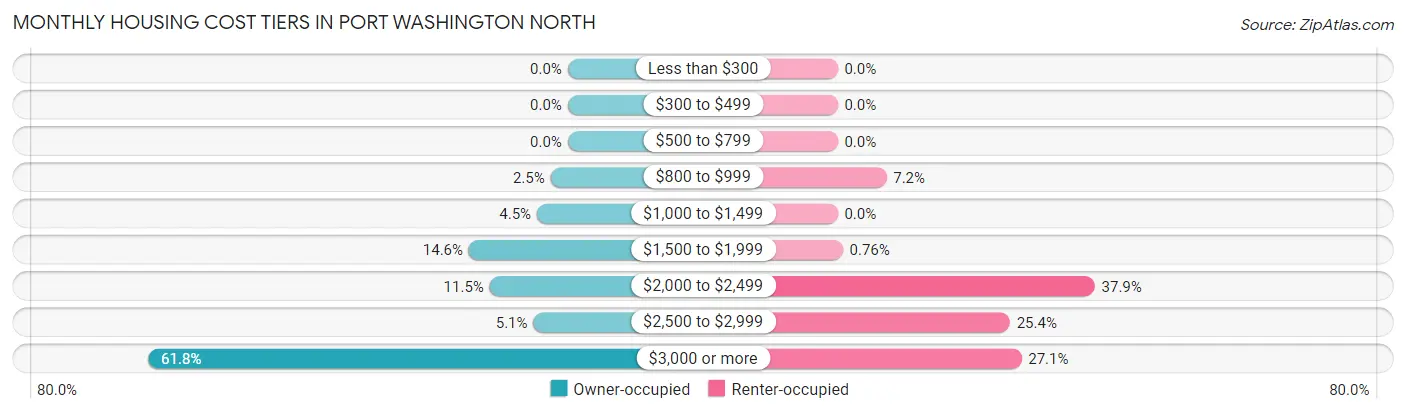
| Monthly Cost | Owner-occupied | Renter-occupied |
| Less than $300 | 0 (0.0%) | 0 (0.0%) |
| $300 to $499 | 0 (0.0%) | 0 (0.0%) |
| $500 to $799 | 0 (0.0%) | 0 (0.0%) |
| $800 to $999 | 24 (2.5%) | 38 (7.2%) |
| $1,000 to $1,499 | 43 (4.5%) | 0 (0.0%) |
| $1,500 to $1,999 | 138 (14.6%) | 4 (0.8%) |
| $2,000 to $2,499 | 109 (11.5%) | 200 (37.9%) |
| $2,500 to $2,999 | 48 (5.1%) | 134 (25.4%) |
| $3,000 or more | 586 (61.8%) | 143 (27.1%) |
| Total | 948 (100.0%) | 528 (100.0%) |
Physical Housing Characteristics in Port Washington North
Housing Structures in Port Washington North
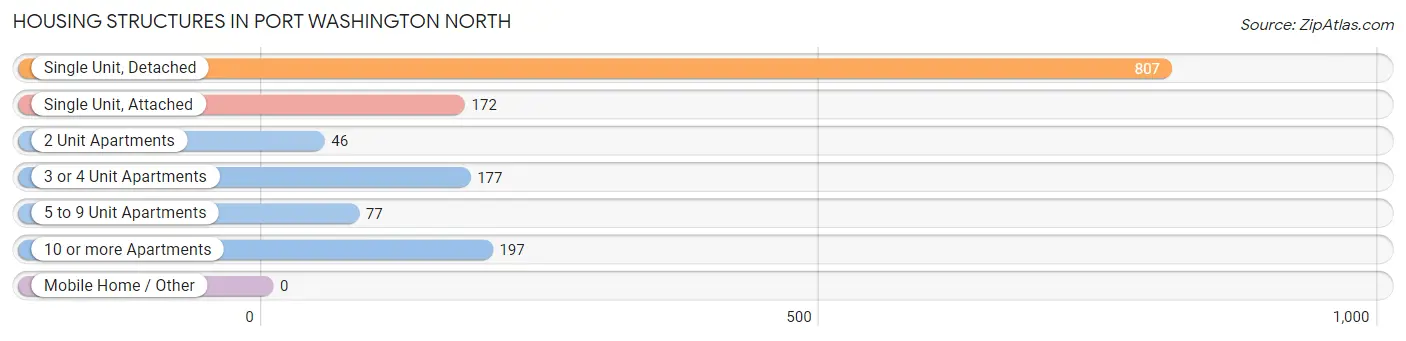
| Structure Type | # Housing Units | % Housing Units |
| Single Unit, Detached | 807 | 54.7% |
| Single Unit, Attached | 172 | 11.7% |
| 2 Unit Apartments | 46 | 3.1% |
| 3 or 4 Unit Apartments | 177 | 12.0% |
| 5 to 9 Unit Apartments | 77 | 5.2% |
| 10 or more Apartments | 197 | 13.4% |
| Mobile Home / Other | 0 | 0.0% |
| Total | 1,476 | 100.0% |
Housing Structures by Occupancy in Port Washington North
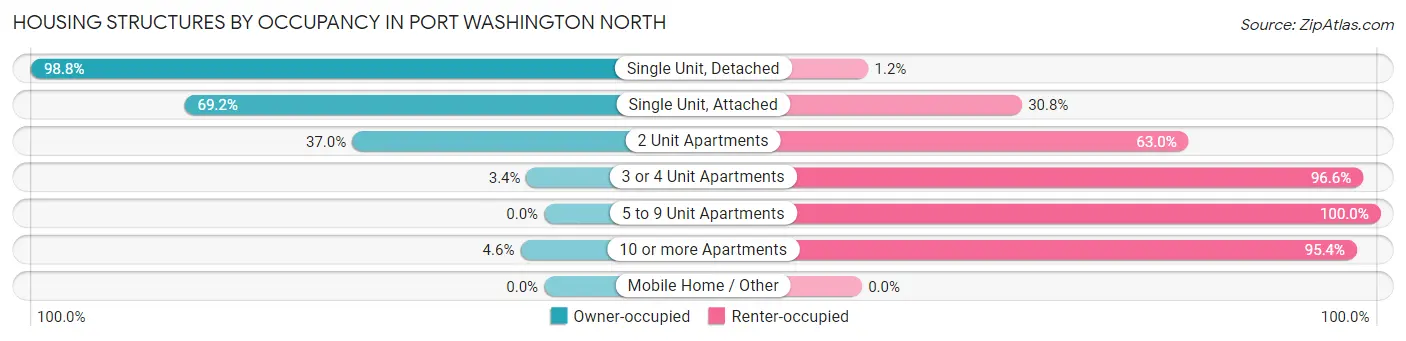
| Structure Type | Owner-occupied | Renter-occupied |
| Single Unit, Detached | 797 (98.8%) | 10 (1.2%) |
| Single Unit, Attached | 119 (69.2%) | 53 (30.8%) |
| 2 Unit Apartments | 17 (37.0%) | 29 (63.0%) |
| 3 or 4 Unit Apartments | 6 (3.4%) | 171 (96.6%) |
| 5 to 9 Unit Apartments | 0 (0.0%) | 77 (100.0%) |
| 10 or more Apartments | 9 (4.6%) | 188 (95.4%) |
| Mobile Home / Other | 0 (0.0%) | 0 (0.0%) |
| Total | 948 (64.2%) | 528 (35.8%) |
Housing Structures by Number of Rooms in Port Washington North
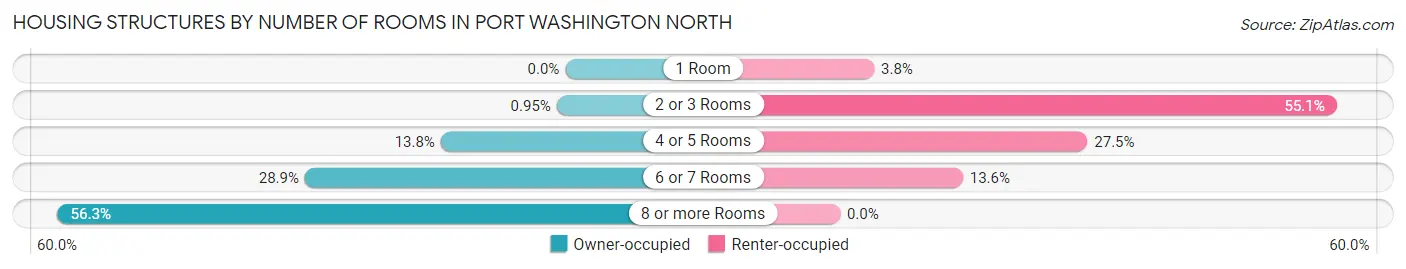
| Number of Rooms | Owner-occupied | Renter-occupied |
| 1 Room | 0 (0.0%) | 20 (3.8%) |
| 2 or 3 Rooms | 9 (0.9%) | 291 (55.1%) |
| 4 or 5 Rooms | 131 (13.8%) | 145 (27.5%) |
| 6 or 7 Rooms | 274 (28.9%) | 72 (13.6%) |
| 8 or more Rooms | 534 (56.3%) | 0 (0.0%) |
| Total | 948 (100.0%) | 528 (100.0%) |
Housing Structure by Heating Type in Port Washington North
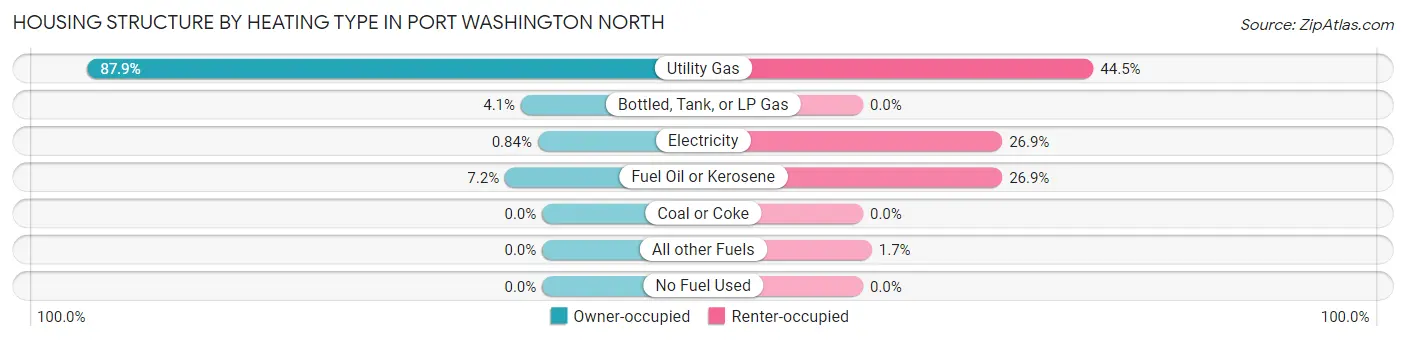
| Heating Type | Owner-occupied | Renter-occupied |
| Utility Gas | 833 (87.9%) | 235 (44.5%) |
| Bottled, Tank, or LP Gas | 39 (4.1%) | 0 (0.0%) |
| Electricity | 8 (0.8%) | 142 (26.9%) |
| Fuel Oil or Kerosene | 68 (7.2%) | 142 (26.9%) |
| Coal or Coke | 0 (0.0%) | 0 (0.0%) |
| All other Fuels | 0 (0.0%) | 9 (1.7%) |
| No Fuel Used | 0 (0.0%) | 0 (0.0%) |
| Total | 948 (100.0%) | 528 (100.0%) |
Household Vehicle Usage in Port Washington North
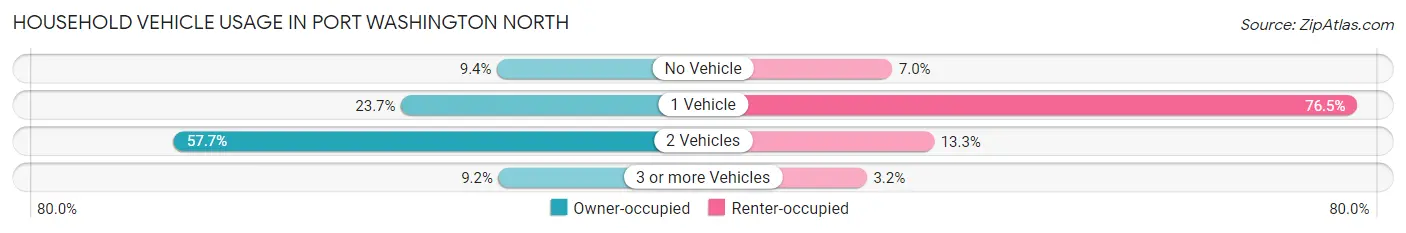
| Vehicles per Household | Owner-occupied | Renter-occupied |
| No Vehicle | 89 (9.4%) | 37 (7.0%) |
| 1 Vehicle | 225 (23.7%) | 404 (76.5%) |
| 2 Vehicles | 547 (57.7%) | 70 (13.3%) |
| 3 or more Vehicles | 87 (9.2%) | 17 (3.2%) |
| Total | 948 (100.0%) | 528 (100.0%) |
Real Estate & Mortgages in Port Washington North
Real Estate and Mortgage Overview in Port Washington North
| Characteristic | Without Mortgage | With Mortgage |
| Housing Units | 352 | 596 |
| Median Property Value | $922,300 | $1,035,800 |
| Median Household Income | $114,000 | $424 |
| Monthly Housing Costs | $1,501 | $557 |
| Real Estate Taxes | $10,001 | $28 |
Property Value by Mortgage Status in Port Washington North
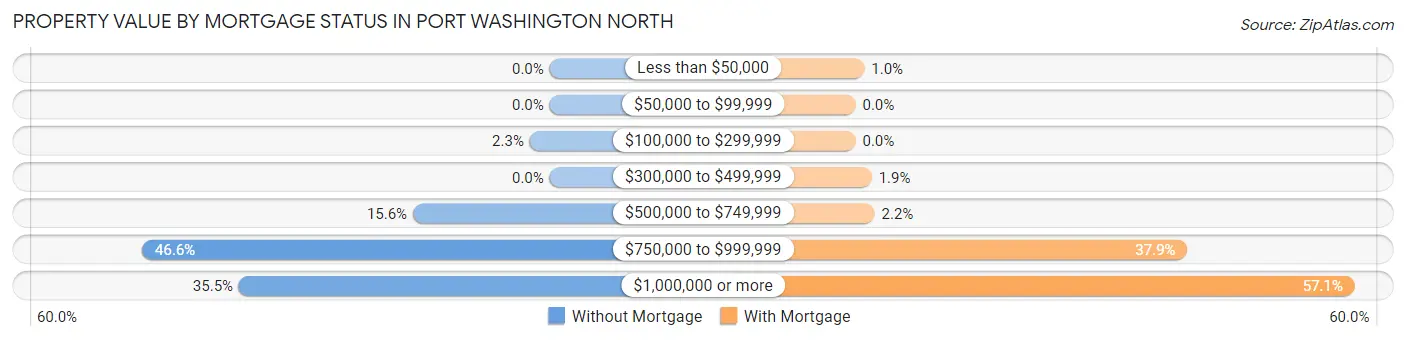
| Property Value | Without Mortgage | With Mortgage |
| Less than $50,000 | 0 (0.0%) | 6 (1.0%) |
| $50,000 to $99,999 | 0 (0.0%) | 0 (0.0%) |
| $100,000 to $299,999 | 8 (2.3%) | 0 (0.0%) |
| $300,000 to $499,999 | 0 (0.0%) | 11 (1.8%) |
| $500,000 to $749,999 | 55 (15.6%) | 13 (2.2%) |
| $750,000 to $999,999 | 164 (46.6%) | 226 (37.9%) |
| $1,000,000 or more | 125 (35.5%) | 340 (57.1%) |
| Total | 352 (100.0%) | 596 (100.0%) |
Household Income by Mortgage Status in Port Washington North
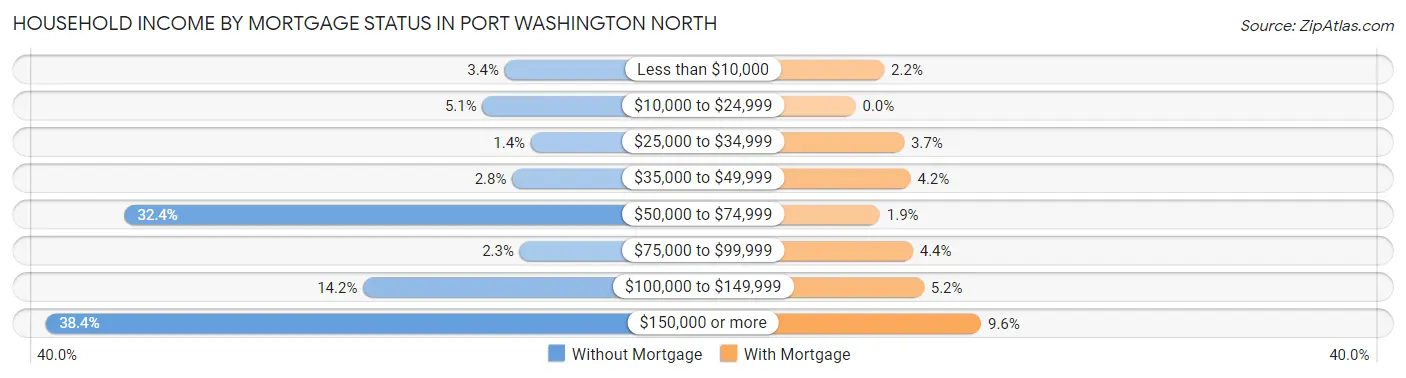
| Household Income | Without Mortgage | With Mortgage |
| Less than $10,000 | 12 (3.4%) | 13 (2.2%) |
| $10,000 to $24,999 | 18 (5.1%) | 0 (0.0%) |
| $25,000 to $34,999 | 5 (1.4%) | 22 (3.7%) |
| $35,000 to $49,999 | 10 (2.8%) | 25 (4.2%) |
| $50,000 to $74,999 | 114 (32.4%) | 11 (1.8%) |
| $75,000 to $99,999 | 8 (2.3%) | 26 (4.4%) |
| $100,000 to $149,999 | 50 (14.2%) | 31 (5.2%) |
| $150,000 or more | 135 (38.4%) | 57 (9.6%) |
| Total | 352 (100.0%) | 596 (100.0%) |
Property Value to Household Income Ratio in Port Washington North
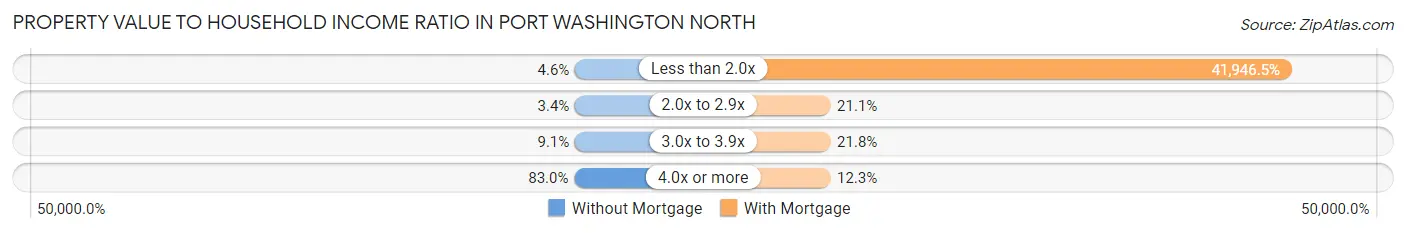
| Value-to-Income Ratio | Without Mortgage | With Mortgage |
| Less than 2.0x | 16 (4.5%) | 250,001 (41,946.5%) |
| 2.0x to 2.9x | 12 (3.4%) | 126 (21.1%) |
| 3.0x to 3.9x | 32 (9.1%) | 130 (21.8%) |
| 4.0x or more | 292 (83.0%) | 73 (12.2%) |
| Total | 352 (100.0%) | 596 (100.0%) |
Real Estate Taxes by Mortgage Status in Port Washington North
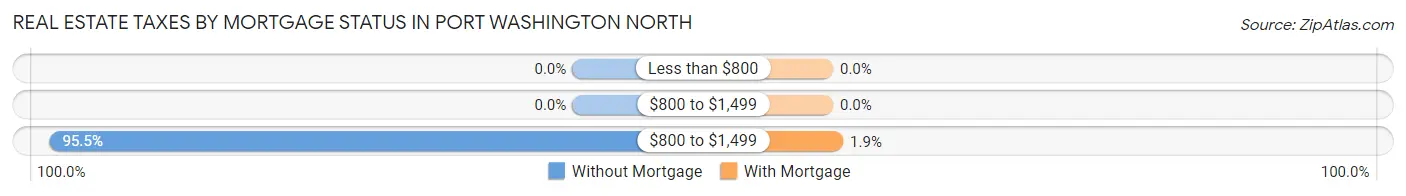
| Property Taxes | Without Mortgage | With Mortgage |
| Less than $800 | 0 (0.0%) | 0 (0.0%) |
| $800 to $1,499 | 0 (0.0%) | 0 (0.0%) |
| $800 to $1,499 | 336 (95.5%) | 11 (1.8%) |
| Total | 352 (100.0%) | 596 (100.0%) |
Health & Disability in Port Washington North
Health Insurance Coverage by Age in Port Washington North
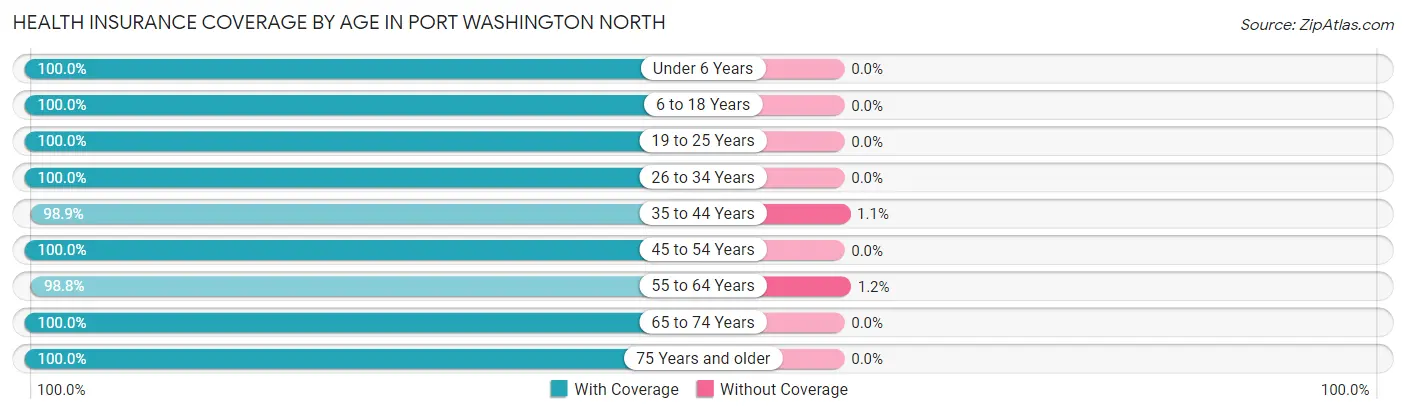
| Age Bracket | With Coverage | Without Coverage |
| Under 6 Years | 161 (100.0%) | 0 (0.0%) |
| 6 to 18 Years | 460 (100.0%) | 0 (0.0%) |
| 19 to 25 Years | 132 (100.0%) | 0 (0.0%) |
| 26 to 34 Years | 129 (100.0%) | 0 (0.0%) |
| 35 to 44 Years | 273 (98.9%) | 3 (1.1%) |
| 45 to 54 Years | 490 (100.0%) | 0 (0.0%) |
| 55 to 64 Years | 490 (98.8%) | 6 (1.2%) |
| 65 to 74 Years | 310 (100.0%) | 0 (0.0%) |
| 75 Years and older | 715 (100.0%) | 0 (0.0%) |
| Total | 3,160 (99.7%) | 9 (0.3%) |
Health Insurance Coverage by Citizenship Status in Port Washington North
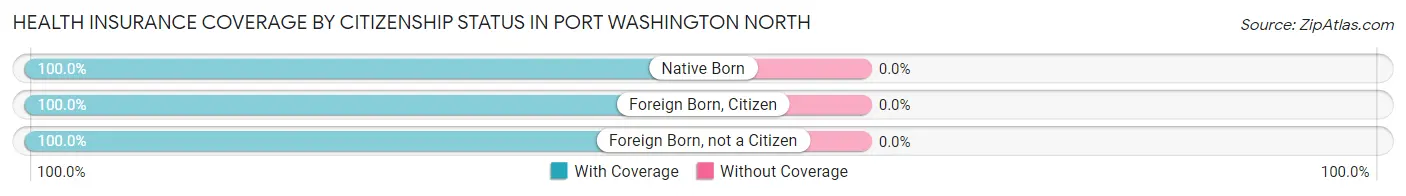
| Citizenship Status | With Coverage | Without Coverage |
| Native Born | 161 (100.0%) | 0 (0.0%) |
| Foreign Born, Citizen | 460 (100.0%) | 0 (0.0%) |
| Foreign Born, not a Citizen | 132 (100.0%) | 0 (0.0%) |
Health Insurance Coverage by Household Income in Port Washington North
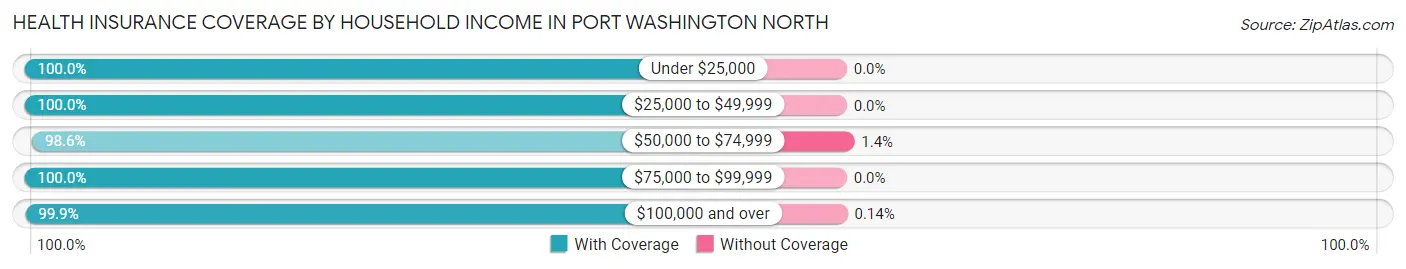
| Household Income | With Coverage | Without Coverage |
| Under $25,000 | 241 (100.0%) | 0 (0.0%) |
| $25,000 to $49,999 | 152 (100.0%) | 0 (0.0%) |
| $50,000 to $74,999 | 418 (98.6%) | 6 (1.4%) |
| $75,000 to $99,999 | 125 (100.0%) | 0 (0.0%) |
| $100,000 and over | 2,212 (99.9%) | 3 (0.1%) |
Public vs Private Health Insurance Coverage by Age in Port Washington North
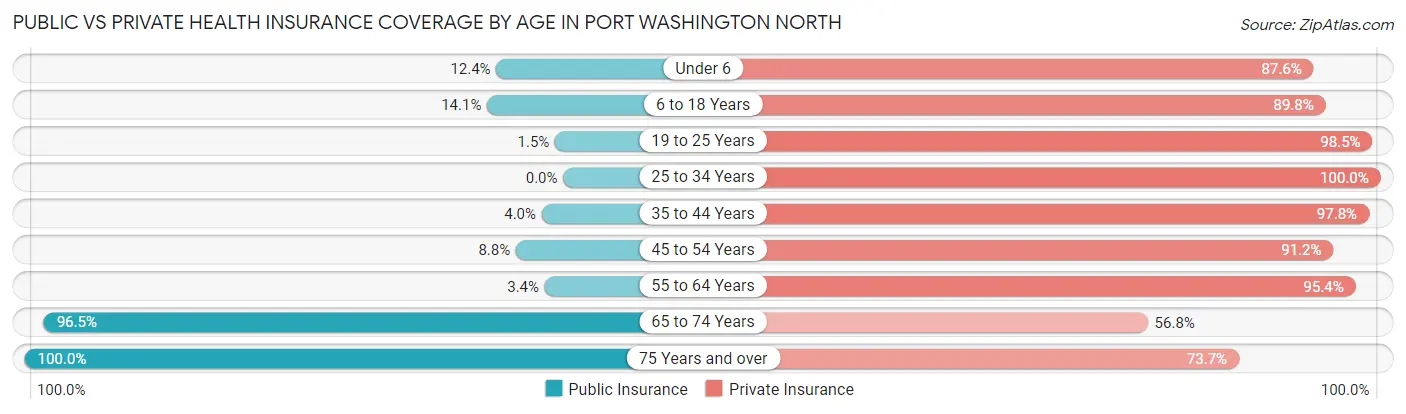
| Age Bracket | Public Insurance | Private Insurance |
| Under 6 | 20 (12.4%) | 141 (87.6%) |
| 6 to 18 Years | 65 (14.1%) | 413 (89.8%) |
| 19 to 25 Years | 2 (1.5%) | 130 (98.5%) |
| 25 to 34 Years | 0 (0.0%) | 129 (100.0%) |
| 35 to 44 Years | 11 (4.0%) | 270 (97.8%) |
| 45 to 54 Years | 43 (8.8%) | 447 (91.2%) |
| 55 to 64 Years | 17 (3.4%) | 473 (95.4%) |
| 65 to 74 Years | 299 (96.5%) | 176 (56.8%) |
| 75 Years and over | 715 (100.0%) | 527 (73.7%) |
| Total | 1,172 (37.0%) | 2,706 (85.4%) |
Disability Status by Sex by Age in Port Washington North
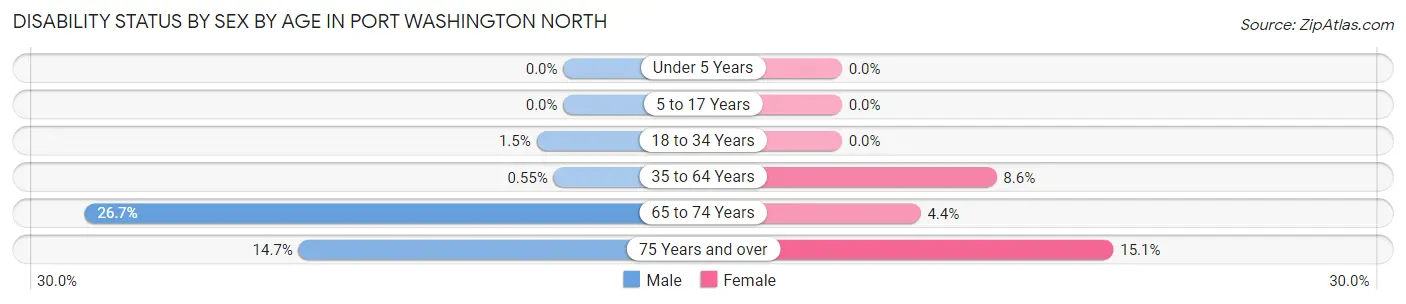
| Age Bracket | Male | Female |
| Under 5 Years | 0 (0.0%) | 0 (0.0%) |
| 5 to 17 Years | 0 (0.0%) | 0 (0.0%) |
| 18 to 34 Years | 2 (1.5%) | 0 (0.0%) |
| 35 to 64 Years | 3 (0.5%) | 62 (8.6%) |
| 65 to 74 Years | 40 (26.7%) | 7 (4.4%) |
| 75 Years and over | 42 (14.7%) | 65 (15.1%) |
Disability Class by Sex by Age in Port Washington North
Disability Class: Hearing Difficulty
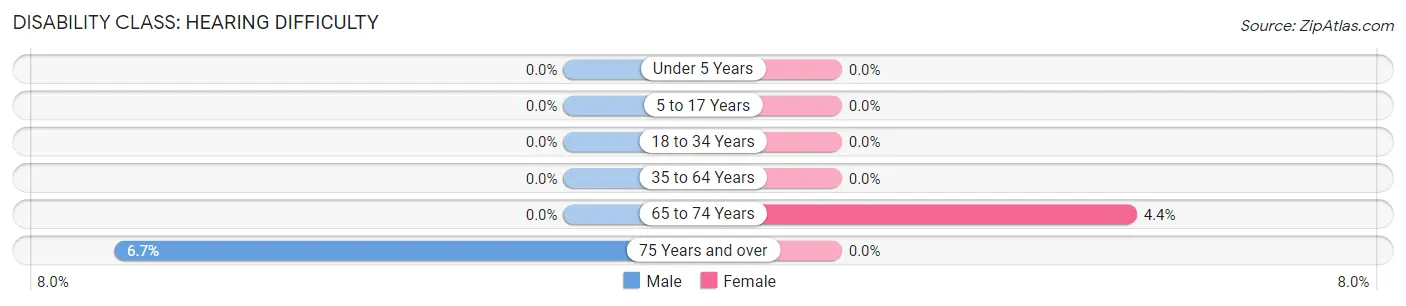
| Age Bracket | Male | Female |
| Under 5 Years | 0 (0.0%) | 0 (0.0%) |
| 5 to 17 Years | 0 (0.0%) | 0 (0.0%) |
| 18 to 34 Years | 0 (0.0%) | 0 (0.0%) |
| 35 to 64 Years | 0 (0.0%) | 0 (0.0%) |
| 65 to 74 Years | 0 (0.0%) | 7 (4.4%) |
| 75 Years and over | 19 (6.7%) | 0 (0.0%) |
Disability Class: Vision Difficulty
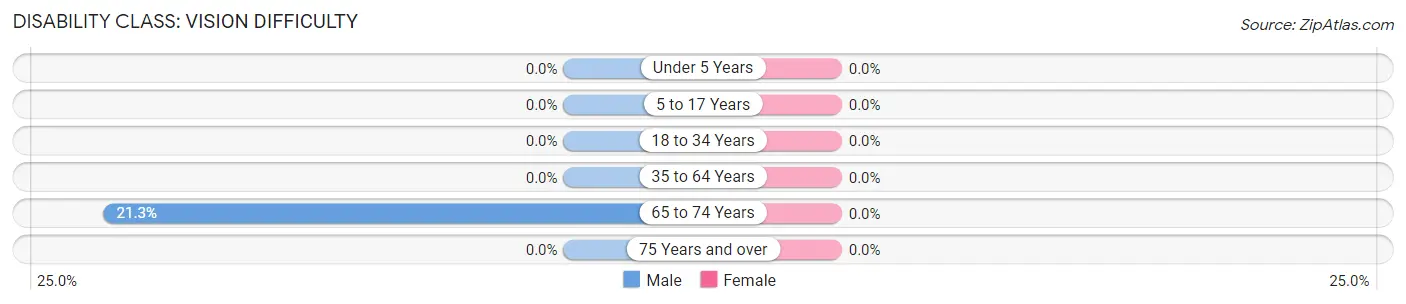
| Age Bracket | Male | Female |
| Under 5 Years | 0 (0.0%) | 0 (0.0%) |
| 5 to 17 Years | 0 (0.0%) | 0 (0.0%) |
| 18 to 34 Years | 0 (0.0%) | 0 (0.0%) |
| 35 to 64 Years | 0 (0.0%) | 0 (0.0%) |
| 65 to 74 Years | 32 (21.3%) | 0 (0.0%) |
| 75 Years and over | 0 (0.0%) | 0 (0.0%) |
Disability Class: Cognitive Difficulty
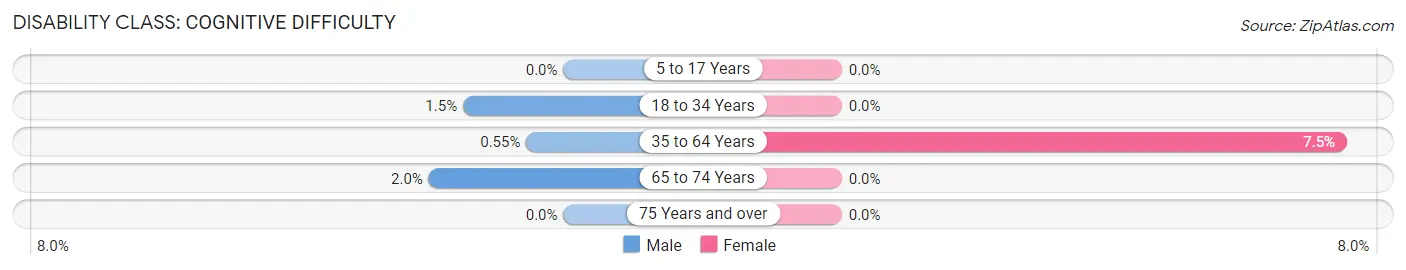
| Age Bracket | Male | Female |
| 5 to 17 Years | 0 (0.0%) | 0 (0.0%) |
| 18 to 34 Years | 2 (1.5%) | 0 (0.0%) |
| 35 to 64 Years | 3 (0.5%) | 54 (7.5%) |
| 65 to 74 Years | 3 (2.0%) | 0 (0.0%) |
| 75 Years and over | 0 (0.0%) | 0 (0.0%) |
Disability Class: Ambulatory Difficulty
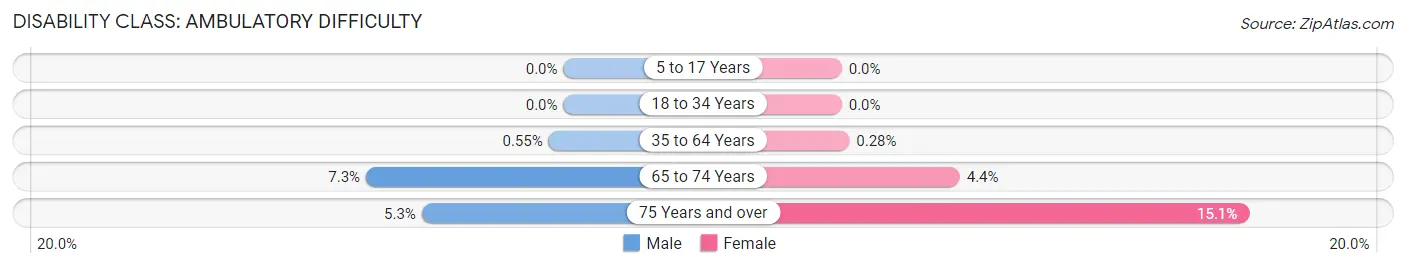
| Age Bracket | Male | Female |
| 5 to 17 Years | 0 (0.0%) | 0 (0.0%) |
| 18 to 34 Years | 0 (0.0%) | 0 (0.0%) |
| 35 to 64 Years | 3 (0.5%) | 2 (0.3%) |
| 65 to 74 Years | 11 (7.3%) | 7 (4.4%) |
| 75 Years and over | 15 (5.3%) | 65 (15.1%) |
Disability Class: Self-Care Difficulty
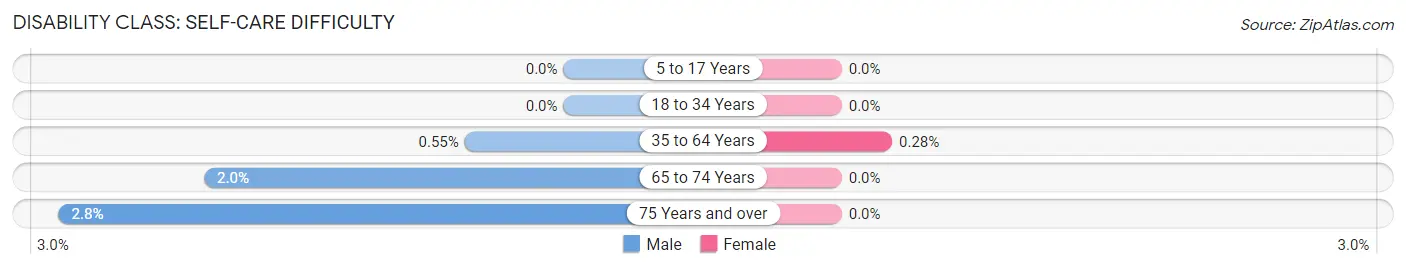
| Age Bracket | Male | Female |
| 5 to 17 Years | 0 (0.0%) | 0 (0.0%) |
| 18 to 34 Years | 0 (0.0%) | 0 (0.0%) |
| 35 to 64 Years | 3 (0.5%) | 2 (0.3%) |
| 65 to 74 Years | 3 (2.0%) | 0 (0.0%) |
| 75 Years and over | 8 (2.8%) | 0 (0.0%) |
Technology Access in Port Washington North
Computing Device Access in Port Washington North
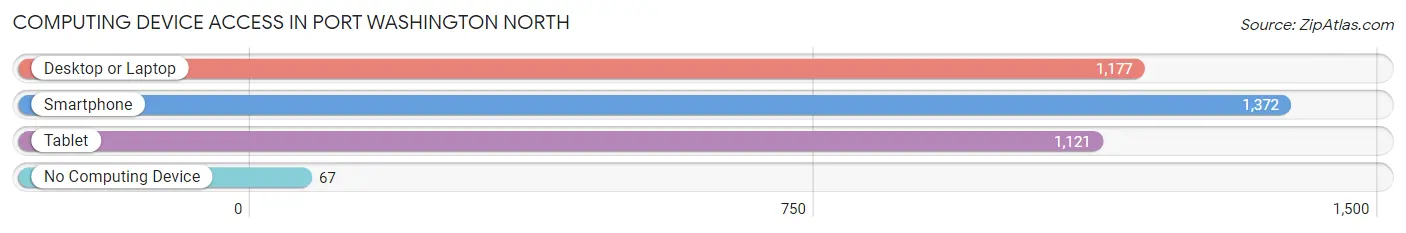
| Device Type | # Households | % Households |
| Desktop or Laptop | 1,177 | 79.7% |
| Smartphone | 1,372 | 92.9% |
| Tablet | 1,121 | 75.9% |
| No Computing Device | 67 | 4.5% |
| Total | 1,476 | 100.0% |
Internet Access in Port Washington North
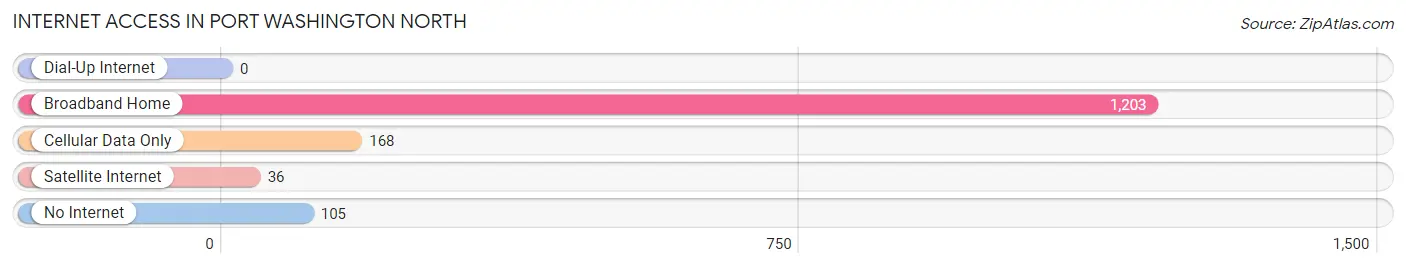
| Internet Type | # Households | % Households |
| Dial-Up Internet | 0 | 0.0% |
| Broadband Home | 1,203 | 81.5% |
| Cellular Data Only | 168 | 11.4% |
| Satellite Internet | 36 | 2.4% |
| No Internet | 105 | 7.1% |
| Total | 1,476 | 100.0% |
Port Washington North Summary
Port Washington North is a hamlet located in Nassau County, New York, United States. It is located on the north shore of Long Island, approximately 25 miles east of Manhattan. The hamlet is part of the Town of North Hempstead and is bordered by the hamlets of Port Washington, Sands Point, and Manhasset. As of the 2010 census, the population of Port Washington North was 4,845.
History
The area that is now Port Washington North was originally inhabited by the Matinecock Native American tribe. The first European settlers arrived in the area in the late 1600s, and the area was known as Cow Neck. In the early 1700s, the area was renamed Cow Neck Peninsula, and the area was divided into several small farms.
In the late 1800s, the area began to develop as a summer resort destination. The area was known for its beautiful beaches and scenic views of the Long Island Sound. In 1883, the Long Island Rail Road opened a station in the area, which helped to spur development.
In the early 1900s, the area began to develop into a residential community. The area was incorporated as the Village of Port Washington North in 1910. The village was dissolved in 1932, and the area was annexed to the Town of North Hempstead.
Geography
Port Washington North is located at 40°51'N 73°41'W (40.85, -73.68). According to the United States Census Bureau, the hamlet has a total area of 1.2 square miles, all of which is land.
The hamlet is located on the north shore of Long Island, approximately 25 miles east of Manhattan. It is bordered by the hamlets of Port Washington, Sands Point, and Manhasset.
Economy
Port Washington North is primarily a residential community, and the majority of its residents are employed in the nearby cities of New York City and Long Island. The hamlet is home to several small businesses, including restaurants, retail stores, and professional services.
Demographics
As of the 2010 census, there were 4,845 people, 1,845 households, and 1,323 families residing in the hamlet. The population density was 4,037.7 people per square mile. The racial makeup of the hamlet was 87.2% White, 4.2% African American, 0.2% Native American, 4.7% Asian, 0.1% Pacific Islander, 1.3% from other races, and 2.3% from two or more races. Hispanic or Latino of any race were 5.3% of the population.
The median income for a household in the hamlet was $100,000, and the median income for a family was $117,000. The per capita income for the hamlet was $50,000. About 2.3% of families and 3.2% of the population were below the poverty line, including 4.2% of those under age 18 and 1.7% of those age 65 or over.
Common Questions
What is Per Capita Income in Port Washington North?
Per Capita income in Port Washington North is $95,612.
What is the Median Family Income in Port Washington North?
Median Family Income in Port Washington North is $206,992.
What is the Median Household income in Port Washington North?
Median Household Income in Port Washington North is $137,679.
What is Income or Wage Gap in Port Washington North?
Income or Wage Gap in Port Washington North is 39.6%.
Women in Port Washington North earn 60.4 cents for every dollar earned by a man.
What is Inequality or Gini Index in Port Washington North?
Inequality or Gini Index in Port Washington North is 0.51.
What is the Total Population of Port Washington North?
Total Population of Port Washington North is 3,169.
What is the Total Male Population of Port Washington North?
Total Male Population of Port Washington North is 1,518.
What is the Total Female Population of Port Washington North?
Total Female Population of Port Washington North is 1,651.
What is the Ratio of Males per 100 Females in Port Washington North?
There are 91.94 Males per 100 Females in Port Washington North.
What is the Ratio of Females per 100 Males in Port Washington North?
There are 108.76 Females per 100 Males in Port Washington North.
What is the Median Population Age in Port Washington North?
Median Population Age in Port Washington North is 53.5 Years.
What is the Average Family Size in Port Washington North
Average Family Size in Port Washington North is 2.9 People.
What is the Average Household Size in Port Washington North
Average Household Size in Port Washington North is 2.1 People.
How Large is the Labor Force in Port Washington North?
There are 1,470 People in the Labor Forcein in Port Washington North.
What is the Percentage of People in the Labor Force in Port Washington North?
56.7% of People are in the Labor Force in Port Washington North.
What is the Unemployment Rate in Port Washington North?
Unemployment Rate in Port Washington North is 3.5%.