Huntington, NY Map & Demographics
Huntington Map
Huntington Overview
$78,708
PER CAPITA INCOME
$178,798
AVG FAMILY INCOME
$148,858
AVG HOUSEHOLD INCOME
49.3%
WAGE / INCOME GAP [ % ]
50.7¢/ $1
WAGE / INCOME GAP [ $ ]
$12,632
FAMILY INCOME DEFICIT
0.45
INEQUALITY / GINI INDEX
19,610
TOTAL POPULATION
9,516
MALE POPULATION
10,094
FEMALE POPULATION
94.27
MALES / 100 FEMALES
106.07
FEMALES / 100 MALES
48.4
MEDIAN AGE
3.0
AVG FAMILY SIZE
2.5
AVG HOUSEHOLD SIZE
11,347
LABOR FORCE [ PEOPLE ]
67.7%
PERCENT IN LABOR FORCE
5.1%
UNEMPLOYMENT RATE
Huntington Zip Codes
Income in Huntington
Income Overview in Huntington
Per Capita Income in Huntington is $78,708, while median incomes of families and households are $178,798 and $148,858 respectively.
| Characteristic | Number | Measure |
| Per Capita Income | 19,610 | $78,708 |
| Median Family Income | 5,173 | $178,798 |
| Mean Family Income | 5,173 | $223,980 |
| Median Household Income | 7,883 | $148,858 |
| Mean Household Income | 7,883 | $192,573 |
| Income Deficit | 5,173 | $12,632 |
| Wage / Income Gap (%) | 19,610 | 49.28% |
| Wage / Income Gap ($) | 19,610 | 50.72¢ per $1 |
| Gini / Inequality Index | 19,610 | 0.45 |
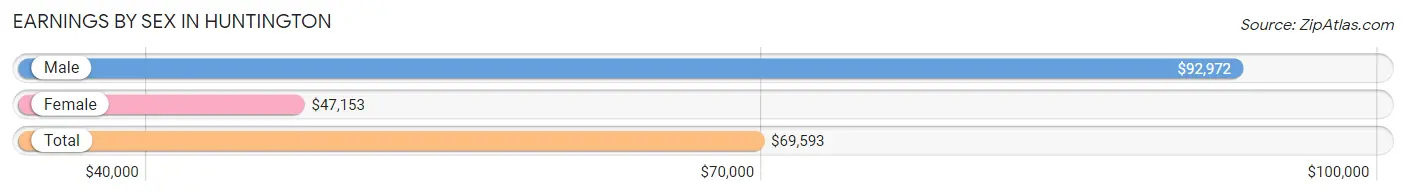
Earnings by Sex in Huntington
Average Earnings in Huntington are $69,593, $92,972 for men and $47,153 for women, a difference of 49.3%.
| Sex | Number | Average Earnings |
| Male | 5,907 (50.4%) | $92,972 |
| Female | 5,816 (49.6%) | $47,153 |
| Total | 11,723 (100.0%) | $69,593 |
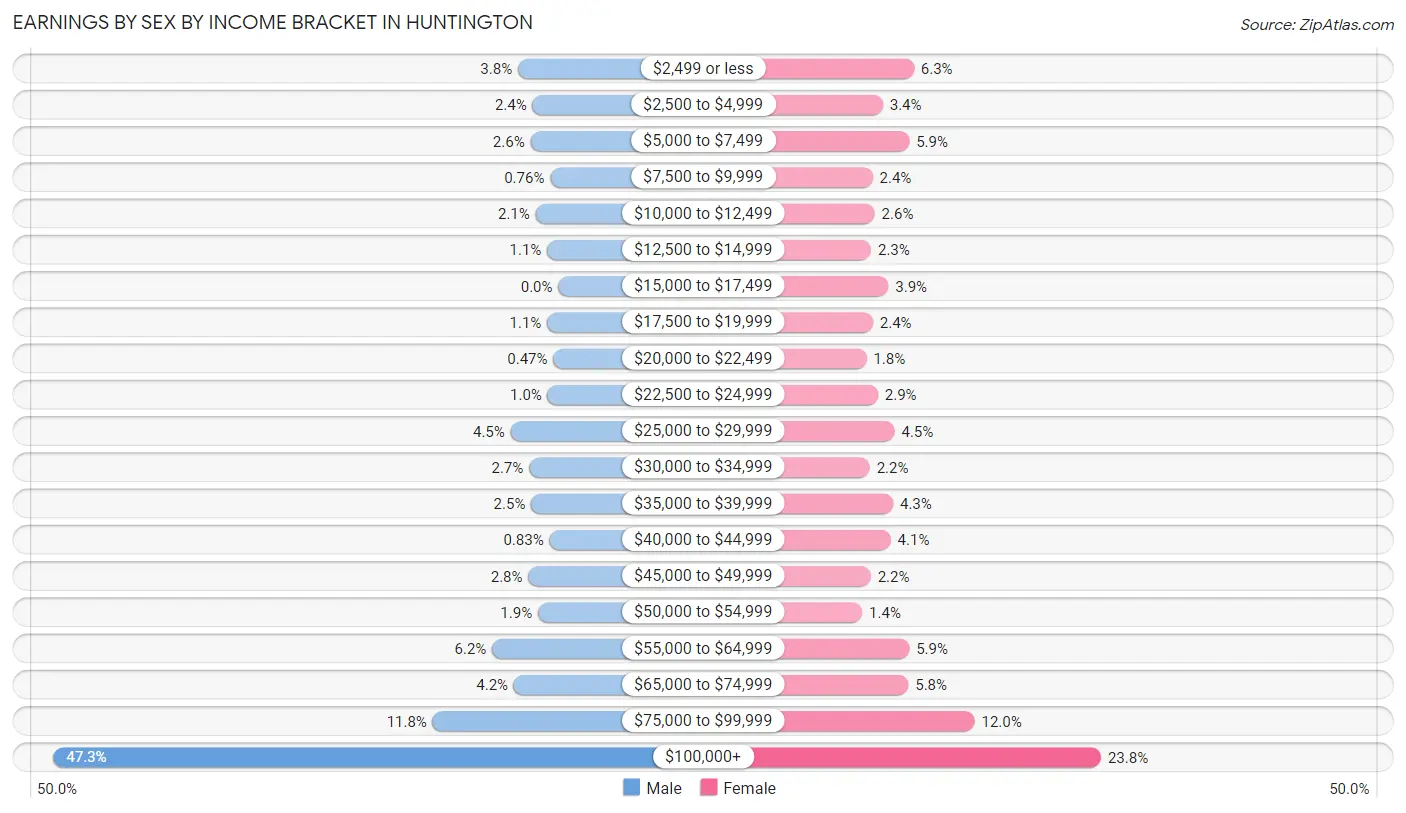
Earnings by Sex by Income Bracket in Huntington
The most common earnings brackets in Huntington are $100,000+ for men (2,794 | 47.3%) and $100,000+ for women (1,385 | 23.8%).
| Income | Male | Female |
| $2,499 or less | 223 (3.8%) | 365 (6.3%) |
| $2,500 to $4,999 | 143 (2.4%) | 196 (3.4%) |
| $5,000 to $7,499 | 154 (2.6%) | 340 (5.9%) |
| $7,500 to $9,999 | 45 (0.8%) | 141 (2.4%) |
| $10,000 to $12,499 | 126 (2.1%) | 152 (2.6%) |
| $12,500 to $14,999 | 62 (1.1%) | 132 (2.3%) |
| $15,000 to $17,499 | 0 (0.0%) | 226 (3.9%) |
| $17,500 to $19,999 | 62 (1.1%) | 142 (2.4%) |
| $20,000 to $22,499 | 28 (0.5%) | 107 (1.8%) |
| $22,500 to $24,999 | 59 (1.0%) | 169 (2.9%) |
| $25,000 to $29,999 | 264 (4.5%) | 260 (4.5%) |
| $30,000 to $34,999 | 162 (2.7%) | 125 (2.1%) |
| $35,000 to $39,999 | 150 (2.5%) | 252 (4.3%) |
| $40,000 to $44,999 | 49 (0.8%) | 239 (4.1%) |
| $45,000 to $49,999 | 166 (2.8%) | 130 (2.2%) |
| $50,000 to $54,999 | 113 (1.9%) | 84 (1.4%) |
| $55,000 to $64,999 | 366 (6.2%) | 340 (5.9%) |
| $65,000 to $74,999 | 246 (4.2%) | 335 (5.8%) |
| $75,000 to $99,999 | 695 (11.8%) | 696 (12.0%) |
| $100,000+ | 2,794 (47.3%) | 1,385 (23.8%) |
| Total | 5,907 (100.0%) | 5,816 (100.0%) |
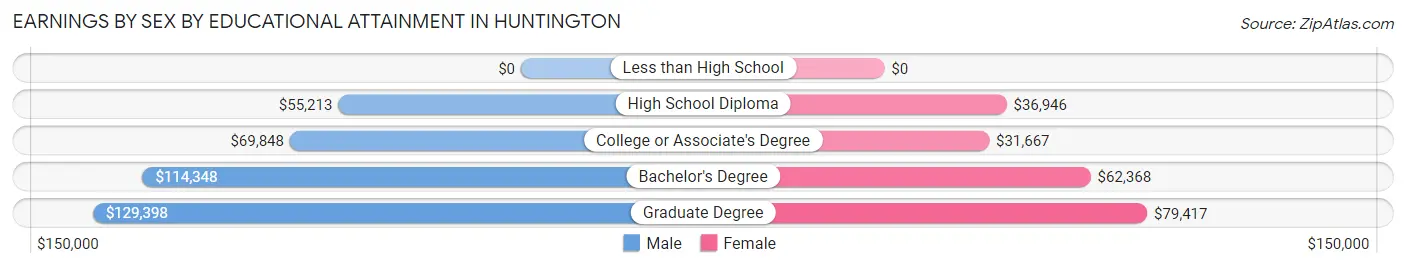
Earnings by Sex by Educational Attainment in Huntington
Average earnings in Huntington are $101,511 for men and $61,289 for women, a difference of 39.6%. Men with an educational attainment of graduate degree enjoy the highest average annual earnings of $129,398, while those with high school diploma education earn the least with $55,213. Women with an educational attainment of graduate degree earn the most with the average annual earnings of $79,417, while those with college or associate's degree education have the smallest earnings of $31,667.
| Educational Attainment | Male Income | Female Income |
| Less than High School | - | - |
| High School Diploma | $55,213 | $36,946 |
| College or Associate's Degree | $69,848 | $31,667 |
| Bachelor's Degree | $114,348 | $62,368 |
| Graduate Degree | $129,398 | $79,417 |
| Total | $101,511 | $61,289 |
Family Income in Huntington
Family Income Brackets in Huntington
According to the Huntington family income data, there are 2,121 families falling into the $200,000+ income range, which is the most common income bracket and makes up 41.0% of all families. Conversely, the $10,000 to $14,999 income bracket is the least frequent group with only 26 families (0.5%) belonging to this category.
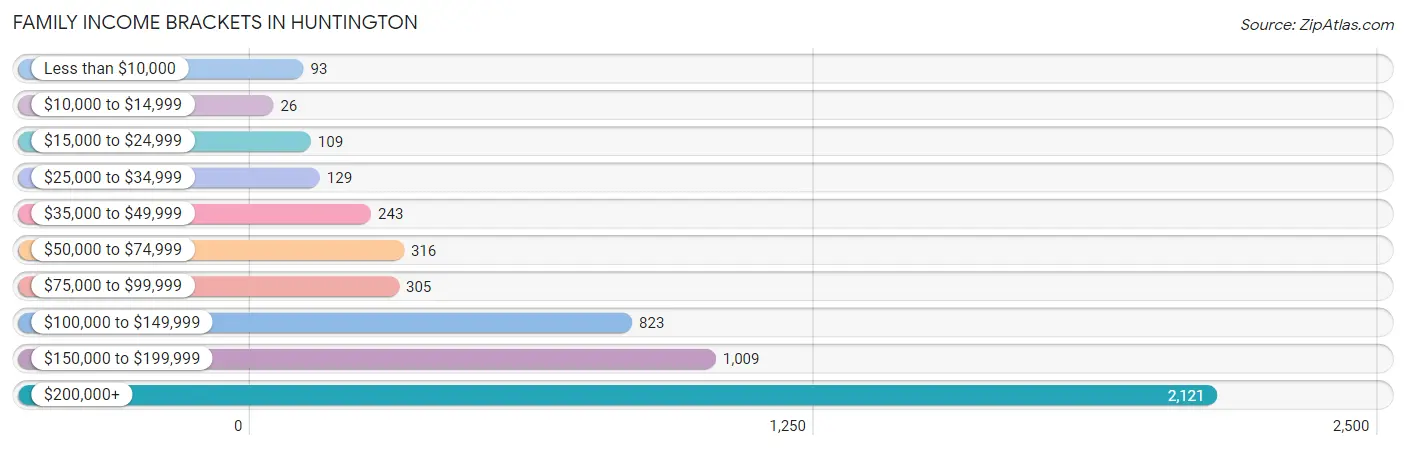
| Income Bracket | # Families | % Families |
| Less than $10,000 | 93 | 1.8% |
| $10,000 to $14,999 | 26 | 0.5% |
| $15,000 to $24,999 | 109 | 2.1% |
| $25,000 to $34,999 | 129 | 2.5% |
| $35,000 to $49,999 | 243 | 4.7% |
| $50,000 to $74,999 | 316 | 6.1% |
| $75,000 to $99,999 | 305 | 5.9% |
| $100,000 to $149,999 | 823 | 15.9% |
| $150,000 to $199,999 | 1,009 | 19.5% |
| $200,000+ | 2,121 | 41.0% |
Family Income by Famaliy Size in Huntington
6-person families (25 | 0.5%) account for the highest median family income in Huntington with $250,001 per family, while 2-person families (2,464 | 47.6%) have the highest median income of $78,125 per family member.
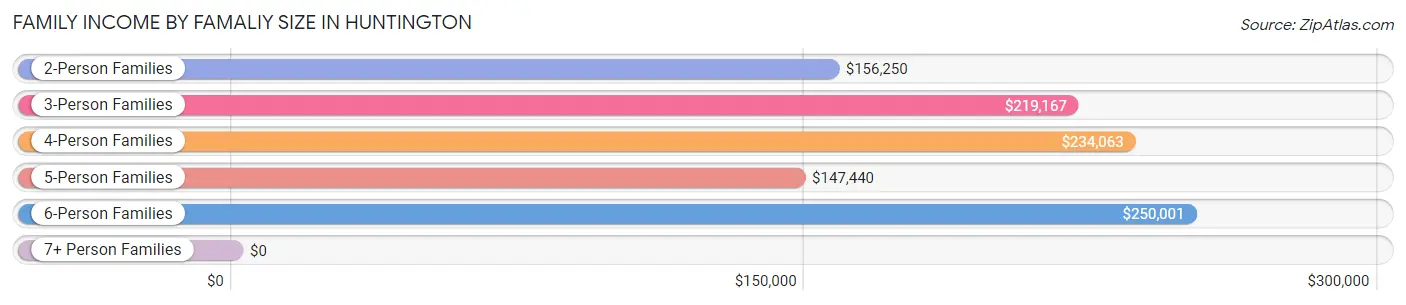
| Income Bracket | # Families | Median Income |
| 2-Person Families | 2,464 (47.6%) | $156,250 |
| 3-Person Families | 1,292 (25.0%) | $219,167 |
| 4-Person Families | 1,016 (19.6%) | $234,063 |
| 5-Person Families | 359 (6.9%) | $147,440 |
| 6-Person Families | 25 (0.5%) | $250,001 |
| 7+ Person Families | 17 (0.3%) | $0 |
| Total | 5,173 (100.0%) | $178,798 |
Family Income by Number of Earners in Huntington
The median family income in Huntington is $178,798, with families comprising 3+ earners (786) having the highest median family income of $250,001, while families with 1 earner (1,332) have the lowest median family income of $86,029, accounting for 15.2% and 25.8% of families, respectively.
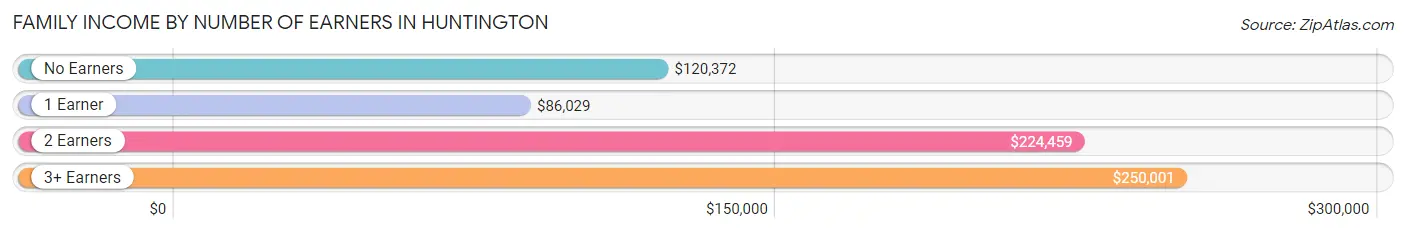
| Number of Earners | # Families | Median Income |
| No Earners | 710 (13.7%) | $120,372 |
| 1 Earner | 1,332 (25.8%) | $86,029 |
| 2 Earners | 2,345 (45.3%) | $224,459 |
| 3+ Earners | 786 (15.2%) | $250,001 |
| Total | 5,173 (100.0%) | $178,798 |
Household Income in Huntington
Household Income Brackets in Huntington
With 2,530 households falling in the category, the $200,000+ income range is the most frequent in Huntington, accounting for 32.1% of all households. In contrast, only 134 households (1.7%) fall into the $10,000 to $14,999 income bracket, making it the least populous group.
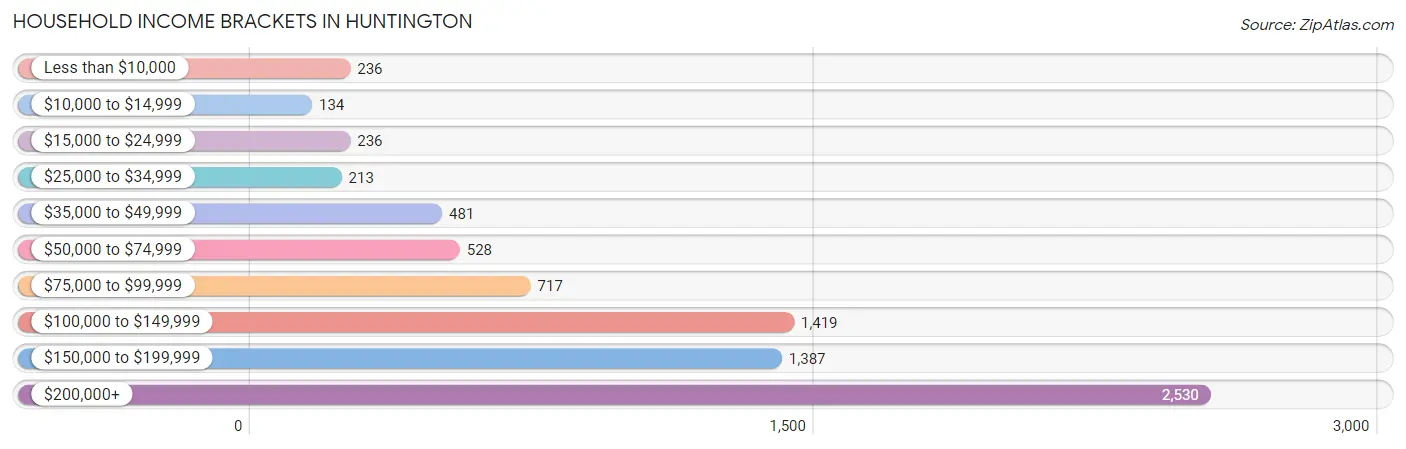
| Income Bracket | # Households | % Households |
| Less than $10,000 | 236 | 3.0% |
| $10,000 to $14,999 | 134 | 1.7% |
| $15,000 to $24,999 | 236 | 3.0% |
| $25,000 to $34,999 | 213 | 2.7% |
| $35,000 to $49,999 | 481 | 6.1% |
| $50,000 to $74,999 | 528 | 6.7% |
| $75,000 to $99,999 | 717 | 9.1% |
| $100,000 to $149,999 | 1,419 | 18.0% |
| $150,000 to $199,999 | 1,387 | 17.6% |
| $200,000+ | 2,530 | 32.1% |
Household Income by Householder Age in Huntington
The median household income in Huntington is $148,858, with the highest median household income of $164,276 found in the 45 to 64 years age bracket for the primary householder. A total of 3,389 households (43.0%) fall into this category. Meanwhile, the 15 to 24 years age bracket for the primary householder has the lowest median household income of $0, with 114 households (1.5%) in this group.
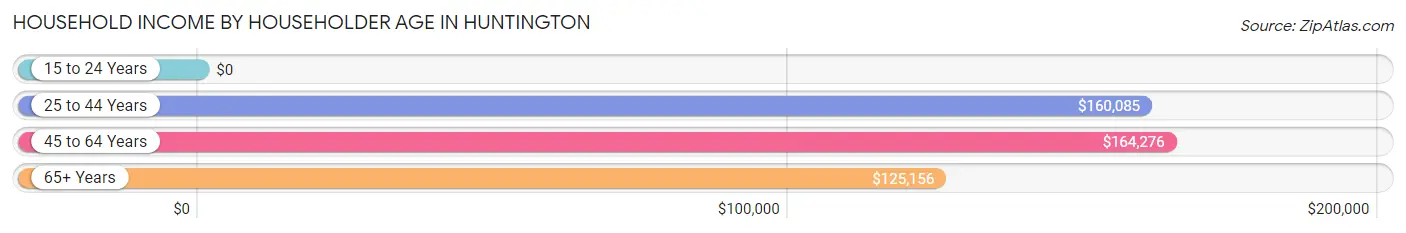
| Income Bracket | # Households | Median Income |
| 15 to 24 Years | 114 (1.5%) | $0 |
| 25 to 44 Years | 1,787 (22.7%) | $160,085 |
| 45 to 64 Years | 3,389 (43.0%) | $164,276 |
| 65+ Years | 2,593 (32.9%) | $125,156 |
| Total | 7,883 (100.0%) | $148,858 |
Poverty in Huntington
Income Below Poverty by Sex and Age in Huntington
With 6.0% poverty level for males and 7.2% for females among the residents of Huntington, 5 year old males and 16 and 17 year old females are the most vulnerable to poverty, with 60 males (32.4%) and 50 females (29.4%) in their respective age groups living below the poverty level.
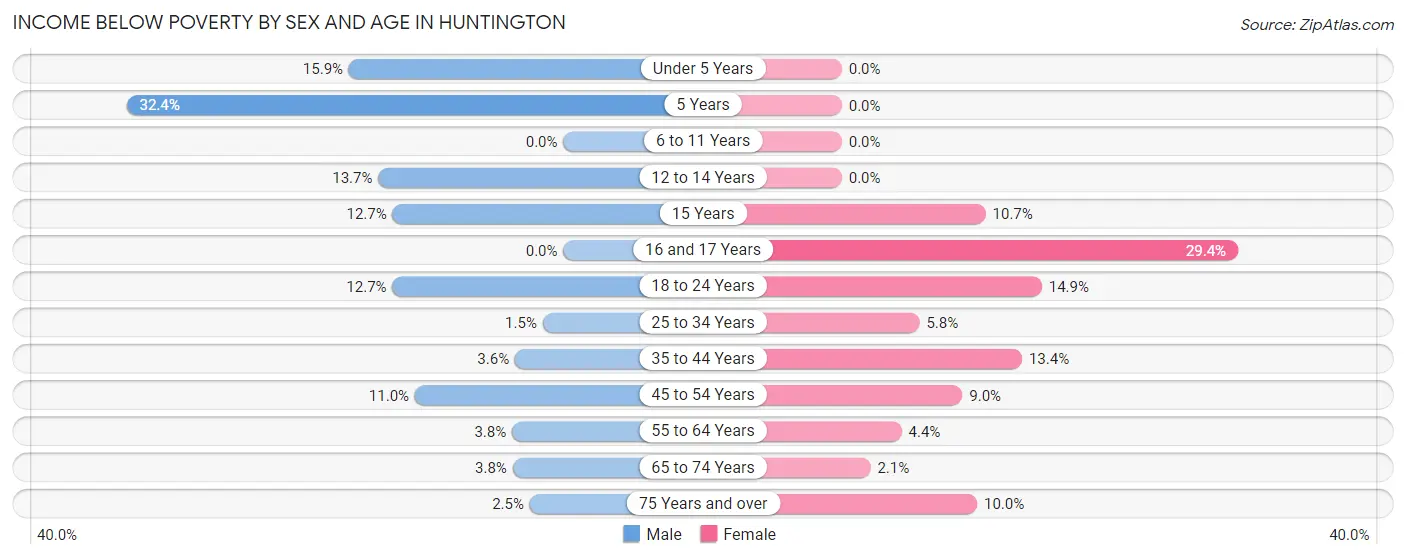
| Age Bracket | Male | Female |
| Under 5 Years | 60 (15.9%) | 0 (0.0%) |
| 5 Years | 60 (32.4%) | 0 (0.0%) |
| 6 to 11 Years | 0 (0.0%) | 0 (0.0%) |
| 12 to 14 Years | 36 (13.7%) | 0 (0.0%) |
| 15 Years | 27 (12.7%) | 11 (10.7%) |
| 16 and 17 Years | 0 (0.0%) | 50 (29.4%) |
| 18 to 24 Years | 59 (12.7%) | 147 (14.8%) |
| 25 to 34 Years | 16 (1.5%) | 68 (5.8%) |
| 35 to 44 Years | 42 (3.6%) | 118 (13.4%) |
| 45 to 54 Years | 134 (11.0%) | 143 (8.9%) |
| 55 to 64 Years | 60 (3.8%) | 76 (4.4%) |
| 65 to 74 Years | 54 (3.8%) | 32 (2.1%) |
| 75 Years and over | 17 (2.5%) | 80 (10.0%) |
| Total | 565 (6.0%) | 725 (7.2%) |
Income Above Poverty by Sex and Age in Huntington
According to the poverty statistics in Huntington, males aged 6 to 11 years and females aged under 5 years are the age groups that are most secure financially, with 100.0% of males and 100.0% of females in these age groups living above the poverty line.
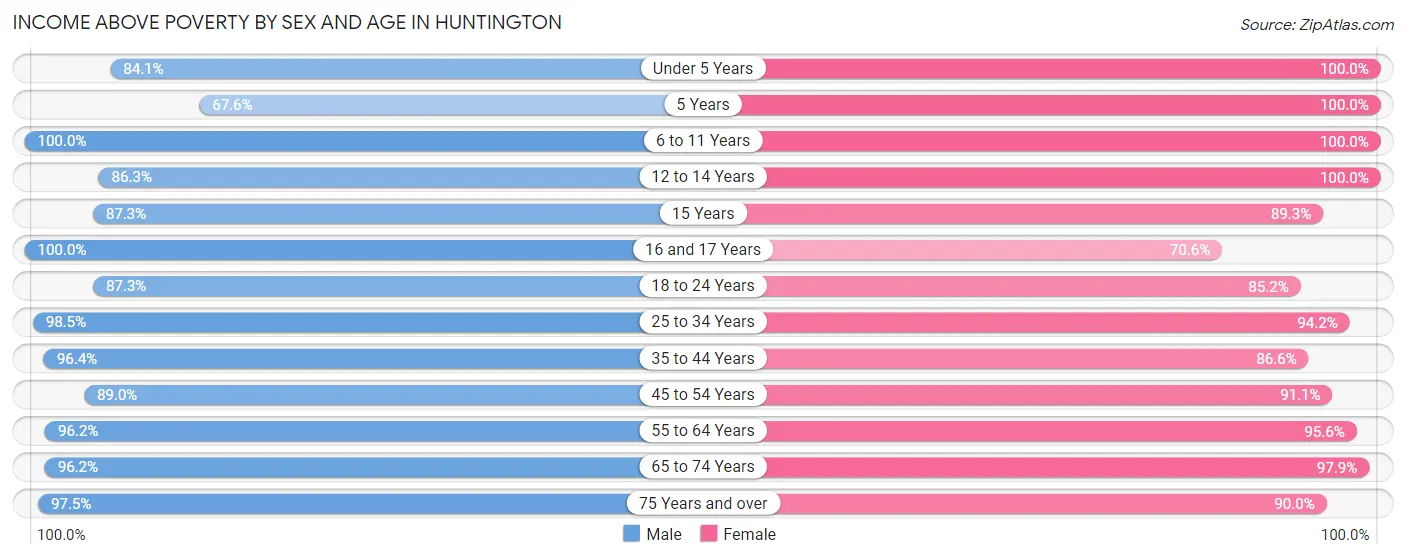
| Age Bracket | Male | Female |
| Under 5 Years | 317 (84.1%) | 288 (100.0%) |
| 5 Years | 125 (67.6%) | 49 (100.0%) |
| 6 to 11 Years | 560 (100.0%) | 375 (100.0%) |
| 12 to 14 Years | 226 (86.3%) | 391 (100.0%) |
| 15 Years | 186 (87.3%) | 92 (89.3%) |
| 16 and 17 Years | 289 (100.0%) | 120 (70.6%) |
| 18 to 24 Years | 406 (87.3%) | 843 (85.2%) |
| 25 to 34 Years | 1,027 (98.5%) | 1,111 (94.2%) |
| 35 to 44 Years | 1,127 (96.4%) | 764 (86.6%) |
| 45 to 54 Years | 1,082 (89.0%) | 1,454 (91.0%) |
| 55 to 64 Years | 1,516 (96.2%) | 1,634 (95.6%) |
| 65 to 74 Years | 1,383 (96.2%) | 1,470 (97.9%) |
| 75 Years and over | 667 (97.5%) | 717 (90.0%) |
| Total | 8,911 (94.0%) | 9,308 (92.8%) |
Income Below Poverty Among Married-Couple Families in Huntington
The poverty statistics for married-couple families in Huntington show that 1.5% or 66 of the total 4,352 families live below the poverty line. Families with 1 or 2 children have the highest poverty rate of 3.8%, comprising of 49 families. On the other hand, families with 3 or 4 children have the lowest poverty rate of 0.0%, which includes 0 families.
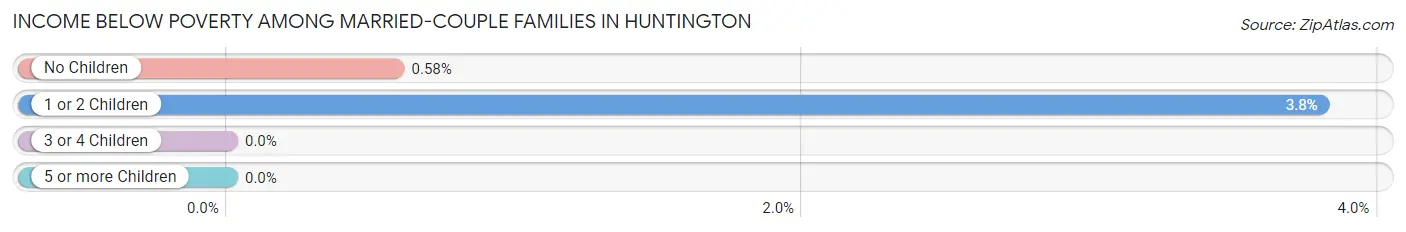
| Children | Above Poverty | Below Poverty |
| No Children | 2,890 (99.4%) | 17 (0.6%) |
| 1 or 2 Children | 1,240 (96.2%) | 49 (3.8%) |
| 3 or 4 Children | 149 (100.0%) | 0 (0.0%) |
| 5 or more Children | 7 (100.0%) | 0 (0.0%) |
| Total | 4,286 (98.5%) | 66 (1.5%) |
Income Below Poverty Among Single-Parent Households in Huntington
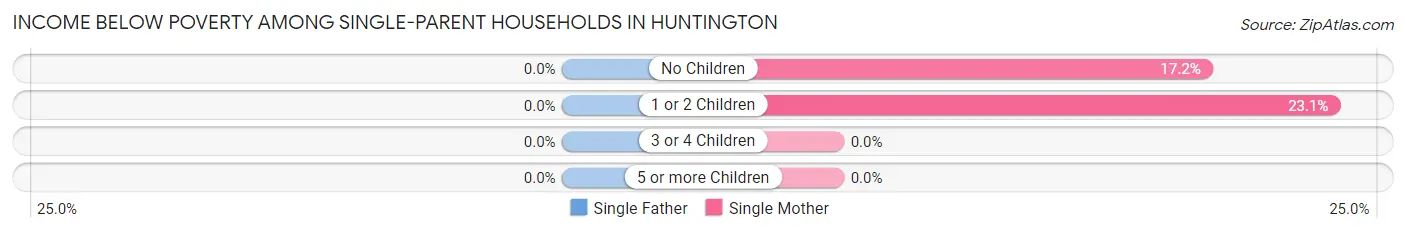
| Children | Single Father | Single Mother |
| No Children | 0 (0.0%) | 50 (17.2%) |
| 1 or 2 Children | 0 (0.0%) | 74 (23.1%) |
| 3 or 4 Children | 0 (0.0%) | 0 (0.0%) |
| 5 or more Children | 0 (0.0%) | 0 (0.0%) |
| Total | 0 (0.0%) | 124 (19.3%) |
Income Below Poverty Among Married-Couple vs Single-Parent Households in Huntington
The poverty data for Huntington shows that 66 of the married-couple family households (1.5%) and 124 of the single-parent households (15.1%) are living below the poverty level. Within the married-couple family households, those with 1 or 2 children have the highest poverty rate, with 49 households (3.8%) falling below the poverty line. Among the single-parent households, those with 1 or 2 children have the highest poverty rate, with 74 household (17.1%) living below poverty.
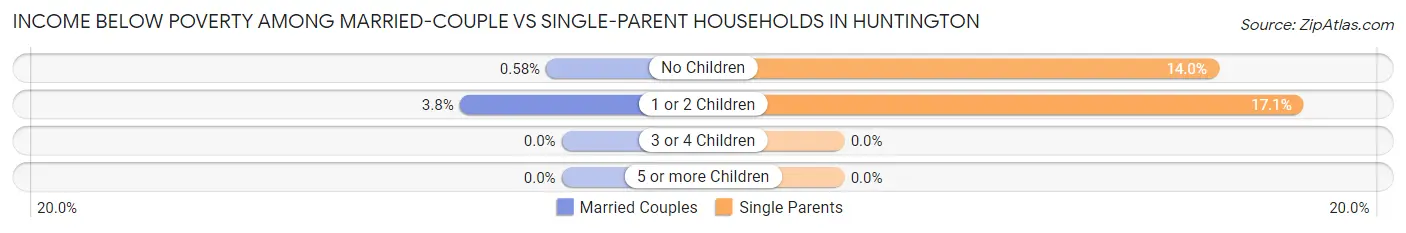
| Children | Married-Couple Families | Single-Parent Households |
| No Children | 17 (0.6%) | 50 (14.0%) |
| 1 or 2 Children | 49 (3.8%) | 74 (17.1%) |
| 3 or 4 Children | 0 (0.0%) | 0 (0.0%) |
| 5 or more Children | 0 (0.0%) | 0 (0.0%) |
| Total | 66 (1.5%) | 124 (15.1%) |
Race in Huntington
The most populous races in Huntington are White / Caucasian (17,411 | 88.8%), Hispanic or Latino (981 | 5.0%), and Two or more Races (927 | 4.7%).
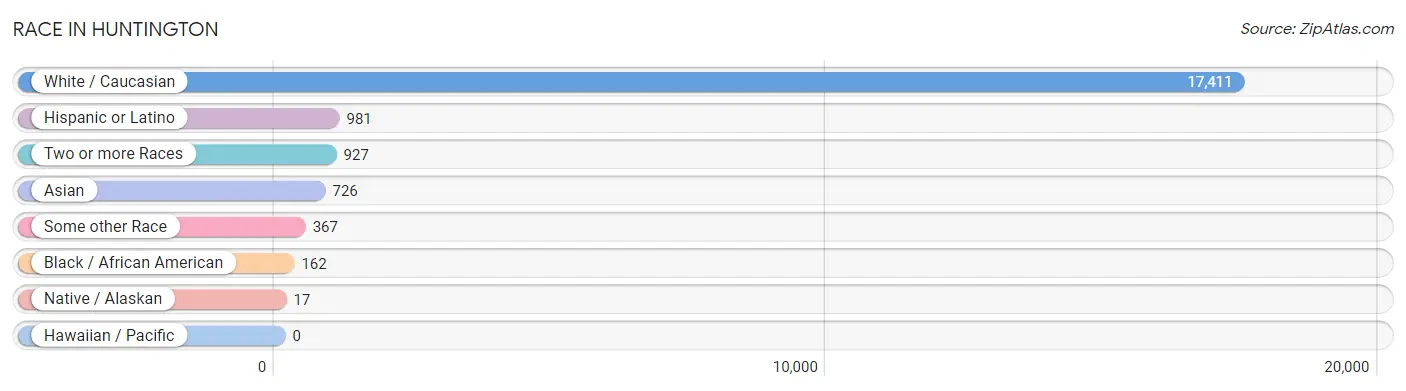
| Race | # Population | % Population |
| Asian | 726 | 3.7% |
| Black / African American | 162 | 0.8% |
| Hawaiian / Pacific | 0 | 0.0% |
| Hispanic or Latino | 981 | 5.0% |
| Native / Alaskan | 17 | 0.1% |
| White / Caucasian | 17,411 | 88.8% |
| Two or more Races | 927 | 4.7% |
| Some other Race | 367 | 1.9% |
| Total | 19,610 | 100.0% |
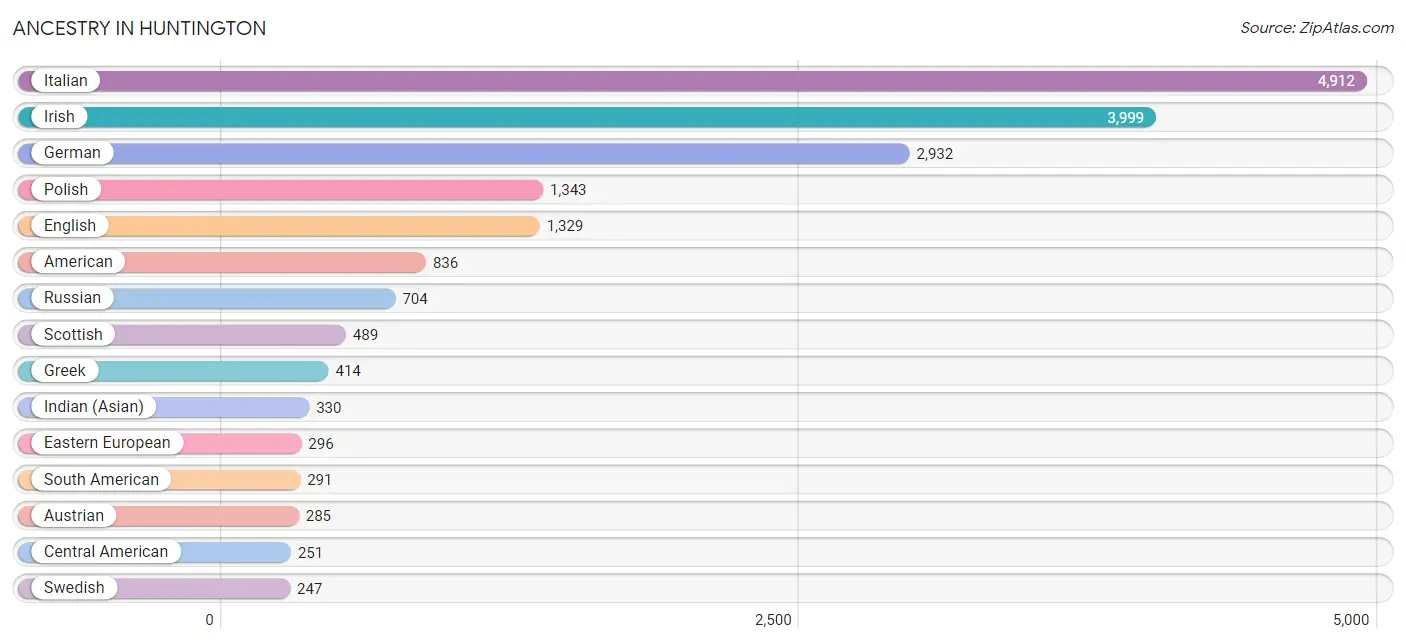
Ancestry in Huntington
The most populous ancestries reported in Huntington are Italian (4,912 | 25.1%), Irish (3,999 | 20.4%), German (2,932 | 14.9%), Polish (1,343 | 6.9%), and English (1,329 | 6.8%), together accounting for 74.0% of all Huntington residents.
| Ancestry | # Population | % Population |
| African | 15 | 0.1% |
| American | 836 | 4.3% |
| Arab | 71 | 0.4% |
| Argentinean | 27 | 0.1% |
| Armenian | 23 | 0.1% |
| Austrian | 285 | 1.5% |
| Bhutanese | 72 | 0.4% |
| British | 150 | 0.8% |
| Burmese | 133 | 0.7% |
| Canadian | 65 | 0.3% |
| Celtic | 6 | 0.0% |
| Central American | 251 | 1.3% |
| Central American Indian | 9 | 0.1% |
| Chilean | 52 | 0.3% |
| Colombian | 129 | 0.7% |
| Croatian | 121 | 0.6% |
| Cuban | 78 | 0.4% |
| Cypriot | 13 | 0.1% |
| Czech | 25 | 0.1% |
| Czechoslovakian | 9 | 0.1% |
| Danish | 96 | 0.5% |
| Dominican | 7 | 0.0% |
| Dutch | 116 | 0.6% |
| Eastern European | 296 | 1.5% |
| Ecuadorian | 23 | 0.1% |
| English | 1,329 | 6.8% |
| European | 143 | 0.7% |
| Finnish | 16 | 0.1% |
| French | 152 | 0.8% |
| French Canadian | 29 | 0.2% |
| German | 2,932 | 14.9% |
| Ghanaian | 4 | 0.0% |
| Greek | 414 | 2.1% |
| Guatemalan | 20 | 0.1% |
| Honduran | 9 | 0.1% |
| Hungarian | 119 | 0.6% |
| Indian (Asian) | 330 | 1.7% |
| Iraqi | 19 | 0.1% |
| Irish | 3,999 | 20.4% |
| Israeli | 29 | 0.2% |
| Italian | 4,912 | 25.1% |
| Jamaican | 12 | 0.1% |
| Jordanian | 5 | 0.0% |
| Korean | 44 | 0.2% |
| Latvian | 14 | 0.1% |
| Lebanese | 12 | 0.1% |
| Lithuanian | 178 | 0.9% |
| Mexican | 29 | 0.2% |
| New Zealander | 9 | 0.1% |
| Northern European | 39 | 0.2% |
| Norwegian | 132 | 0.7% |
| Pakistani | 8 | 0.0% |
| Paraguayan | 7 | 0.0% |
| Peruvian | 19 | 0.1% |
| Polish | 1,343 | 6.9% |
| Portuguese | 51 | 0.3% |
| Puerto Rican | 229 | 1.2% |
| Romanian | 77 | 0.4% |
| Russian | 704 | 3.6% |
| Salvadoran | 222 | 1.1% |
| Samoan | 10 | 0.1% |
| Scandinavian | 16 | 0.1% |
| Scotch-Irish | 32 | 0.2% |
| Scottish | 489 | 2.5% |
| Serbian | 11 | 0.1% |
| Slovene | 17 | 0.1% |
| South American | 291 | 1.5% |
| South American Indian | 34 | 0.2% |
| Spanish | 14 | 0.1% |
| Sri Lankan | 8 | 0.0% |
| Subsaharan African | 19 | 0.1% |
| Swedish | 247 | 1.3% |
| Swiss | 37 | 0.2% |
| Syrian | 6 | 0.0% |
| Thai | 209 | 1.1% |
| Turkish | 19 | 0.1% |
| Ukrainian | 194 | 1.0% |
| Uruguayan | 34 | 0.2% |
| Welsh | 143 | 0.7% | View All 79 Rows |
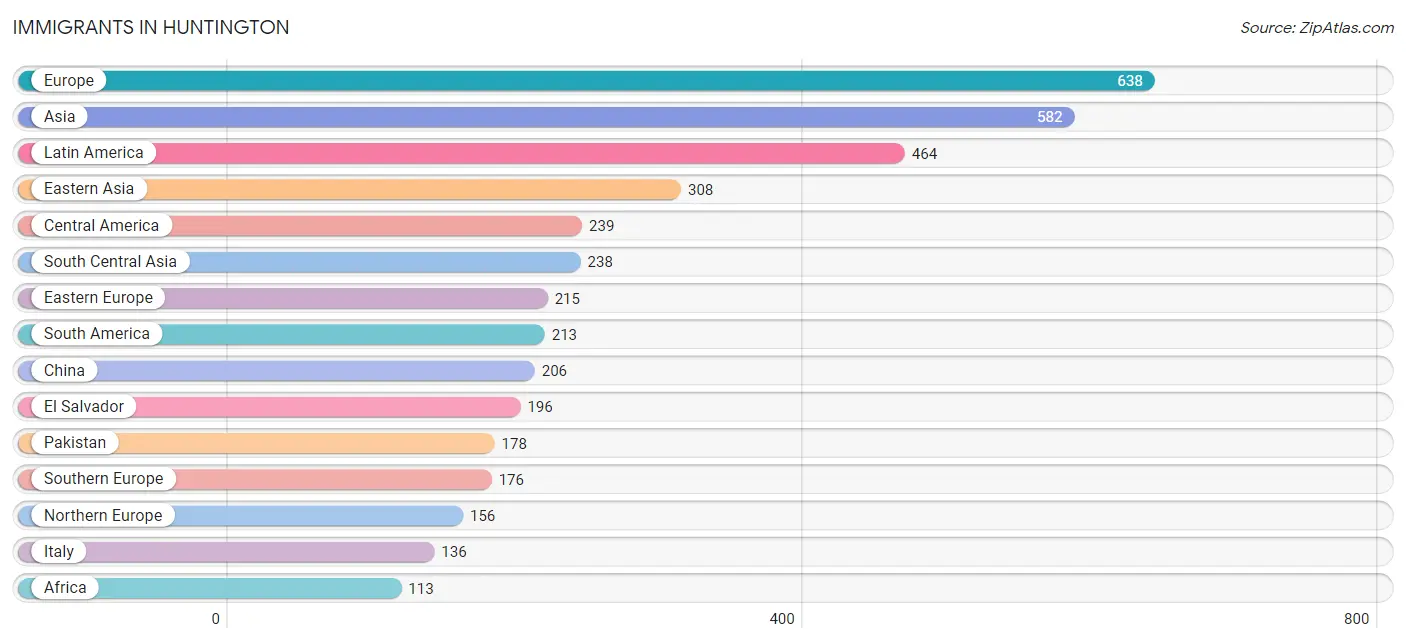
Immigrants in Huntington
The most numerous immigrant groups reported in Huntington came from Europe (638 | 3.3%), Asia (582 | 3.0%), Latin America (464 | 2.4%), Eastern Asia (308 | 1.6%), and Central America (239 | 1.2%), together accounting for 11.4% of all Huntington residents.
| Immigration Origin | # Population | % Population |
| Africa | 113 | 0.6% |
| Argentina | 17 | 0.1% |
| Asia | 582 | 3.0% |
| Australia | 7 | 0.0% |
| Barbados | 12 | 0.1% |
| Belgium | 21 | 0.1% |
| Canada | 55 | 0.3% |
| Caribbean | 12 | 0.1% |
| Central America | 239 | 1.2% |
| Chile | 39 | 0.2% |
| China | 206 | 1.1% |
| Colombia | 97 | 0.5% |
| Croatia | 8 | 0.0% |
| Denmark | 4 | 0.0% |
| Eastern Africa | 8 | 0.0% |
| Eastern Asia | 308 | 1.6% |
| Eastern Europe | 215 | 1.1% |
| Ecuador | 8 | 0.0% |
| El Salvador | 196 | 1.0% |
| England | 52 | 0.3% |
| Europe | 638 | 3.3% |
| France | 14 | 0.1% |
| Germany | 46 | 0.2% |
| Ghana | 4 | 0.0% |
| Greece | 24 | 0.1% |
| Guatemala | 20 | 0.1% |
| Hong Kong | 2 | 0.0% |
| Hungary | 29 | 0.2% |
| India | 60 | 0.3% |
| Israel | 18 | 0.1% |
| Italy | 136 | 0.7% |
| Japan | 28 | 0.1% |
| Korea | 74 | 0.4% |
| Latin America | 464 | 2.4% |
| Malaysia | 4 | 0.0% |
| Mexico | 11 | 0.1% |
| Middle Africa | 101 | 0.5% |
| Netherlands | 10 | 0.1% |
| Nicaragua | 12 | 0.1% |
| Northern Europe | 156 | 0.8% |
| Oceania | 16 | 0.1% |
| Pakistan | 178 | 0.9% |
| Peru | 11 | 0.1% |
| Philippines | 14 | 0.1% |
| Poland | 51 | 0.3% |
| Portugal | 11 | 0.1% |
| Romania | 30 | 0.2% |
| Russia | 42 | 0.2% |
| Scotland | 10 | 0.1% |
| Serbia | 11 | 0.1% |
| South America | 213 | 1.1% |
| South Central Asia | 238 | 1.2% |
| South Eastern Asia | 18 | 0.1% |
| Southern Europe | 176 | 0.9% |
| Spain | 5 | 0.0% |
| Sweden | 19 | 0.1% |
| Ukraine | 11 | 0.1% |
| Uruguay | 34 | 0.2% |
| Western Africa | 4 | 0.0% |
| Western Asia | 18 | 0.1% |
| Western Europe | 91 | 0.5% |
| Zaire | 101 | 0.5% | View All 62 Rows |
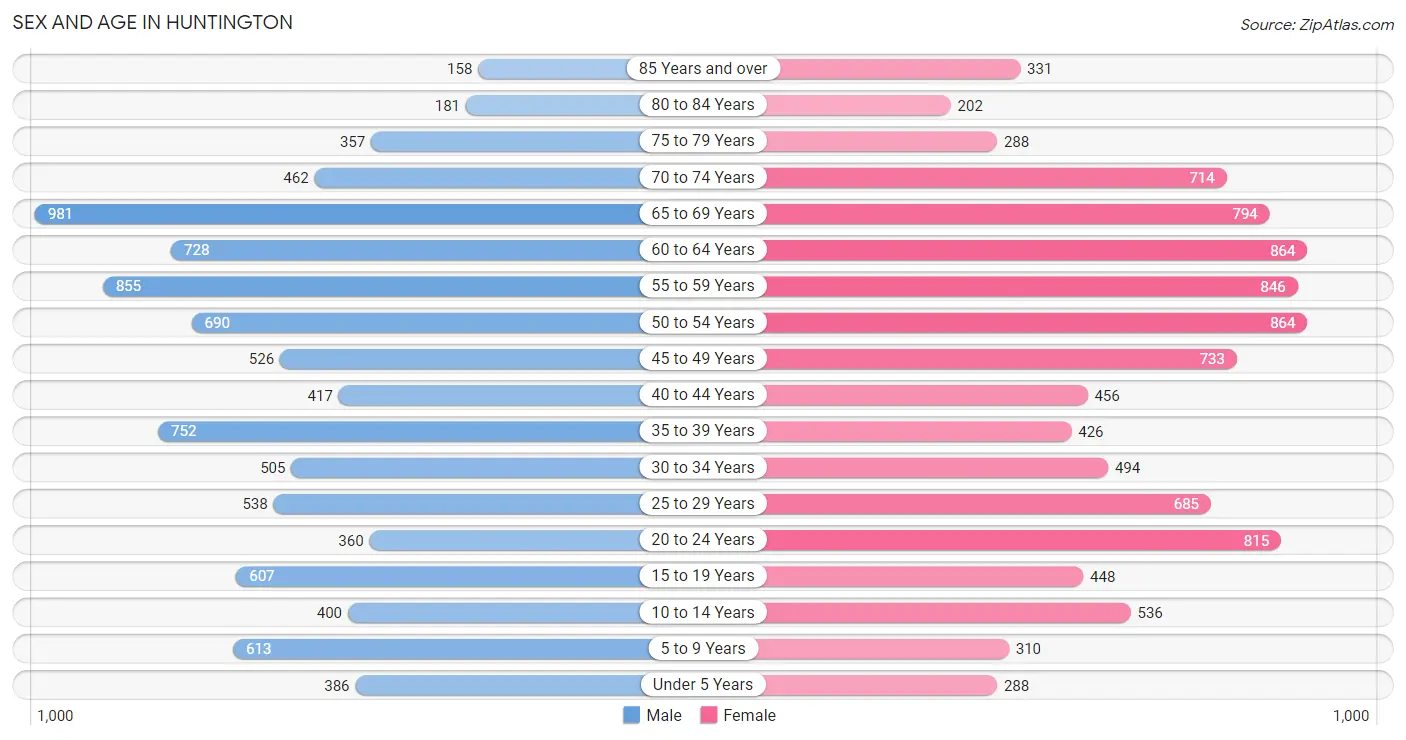
Sex and Age in Huntington
Sex and Age in Huntington
The most populous age groups in Huntington are 65 to 69 Years (981 | 10.3%) for men and 50 to 54 Years (864 | 8.6%) for women.
| Age Bracket | Male | Female |
| Under 5 Years | 386 (4.1%) | 288 (2.9%) |
| 5 to 9 Years | 613 (6.4%) | 310 (3.1%) |
| 10 to 14 Years | 400 (4.2%) | 536 (5.3%) |
| 15 to 19 Years | 607 (6.4%) | 448 (4.4%) |
| 20 to 24 Years | 360 (3.8%) | 815 (8.1%) |
| 25 to 29 Years | 538 (5.7%) | 685 (6.8%) |
| 30 to 34 Years | 505 (5.3%) | 494 (4.9%) |
| 35 to 39 Years | 752 (7.9%) | 426 (4.2%) |
| 40 to 44 Years | 417 (4.4%) | 456 (4.5%) |
| 45 to 49 Years | 526 (5.5%) | 733 (7.3%) |
| 50 to 54 Years | 690 (7.2%) | 864 (8.6%) |
| 55 to 59 Years | 855 (9.0%) | 846 (8.4%) |
| 60 to 64 Years | 728 (7.6%) | 864 (8.6%) |
| 65 to 69 Years | 981 (10.3%) | 794 (7.9%) |
| 70 to 74 Years | 462 (4.9%) | 714 (7.1%) |
| 75 to 79 Years | 357 (3.7%) | 288 (2.9%) |
| 80 to 84 Years | 181 (1.9%) | 202 (2.0%) |
| 85 Years and over | 158 (1.7%) | 331 (3.3%) |
| Total | 9,516 (100.0%) | 10,094 (100.0%) |
Families and Households in Huntington
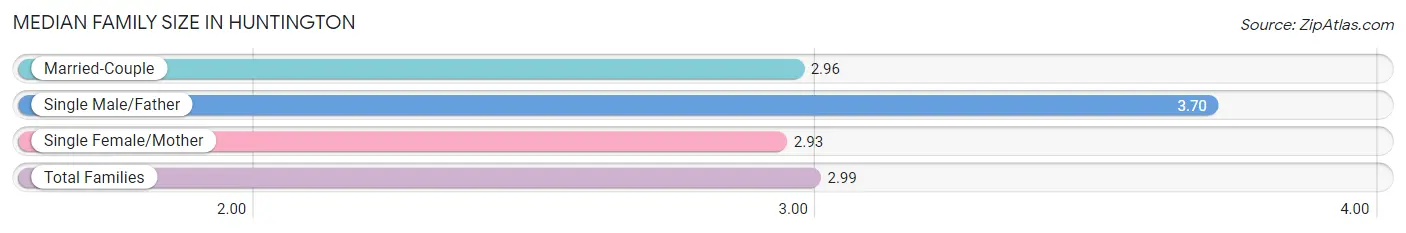
Median Family Size in Huntington
The median family size in Huntington is 2.99 persons per family, with single male/father families (179 | 3.5%) accounting for the largest median family size of 3.7 persons per family. On the other hand, single female/mother families (642 | 12.4%) represent the smallest median family size with 2.93 persons per family.
| Family Type | # Families | Family Size |
| Married-Couple | 4,352 (84.1%) | 2.96 |
| Single Male/Father | 179 (3.5%) | 3.70 |
| Single Female/Mother | 642 (12.4%) | 2.93 |
| Total Families | 5,173 (100.0%) | 2.99 |
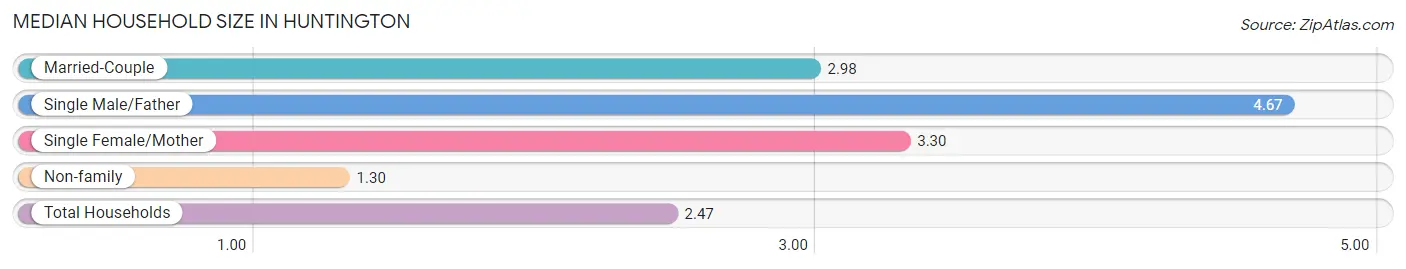
Median Household Size in Huntington
The median household size in Huntington is 2.47 persons per household, with single male/father households (179 | 2.3%) accounting for the largest median household size of 4.67 persons per household. non-family households (2,710 | 34.4%) represent the smallest median household size with 1.30 persons per household.
| Household Type | # Households | Household Size |
| Married-Couple | 4,352 (55.2%) | 2.98 |
| Single Male/Father | 179 (2.3%) | 4.67 |
| Single Female/Mother | 642 (8.1%) | 3.30 |
| Non-family | 2,710 (34.4%) | 1.30 |
| Total Households | 7,883 (100.0%) | 2.47 |
Household Size by Marriage Status in Huntington
Out of a total of 7,883 households in Huntington, 5,173 (65.6%) are family households, while 2,710 (34.4%) are nonfamily households. The most numerous type of family households are 2-person households, comprising 2,295, and the most common type of nonfamily households are 1-person households, comprising 2,039.
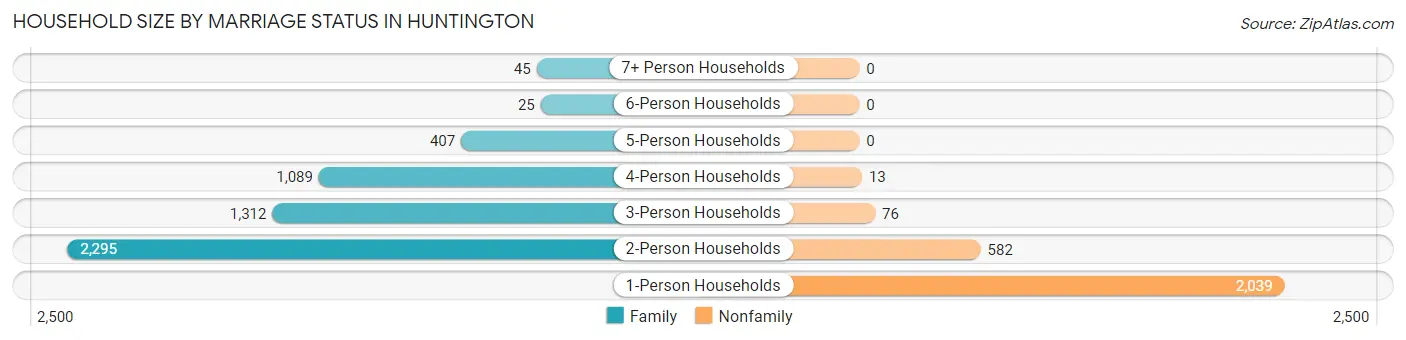
| Household Size | Family Households | Nonfamily Households |
| 1-Person Households | - | 2,039 (25.9%) |
| 2-Person Households | 2,295 (29.1%) | 582 (7.4%) |
| 3-Person Households | 1,312 (16.6%) | 76 (1.0%) |
| 4-Person Households | 1,089 (13.8%) | 13 (0.2%) |
| 5-Person Households | 407 (5.2%) | 0 (0.0%) |
| 6-Person Households | 25 (0.3%) | 0 (0.0%) |
| 7+ Person Households | 45 (0.6%) | 0 (0.0%) |
| Total | 5,173 (65.6%) | 2,710 (34.4%) |
Female Fertility in Huntington
Fertility by Age in Huntington
Average fertility rate in Huntington is 36.0 births per 1,000 women. Women in the age bracket of 20 to 34 years have the highest fertility rate with 68.0 births per 1,000 women. Women in the age bracket of 20 to 34 years acount for 90.1% of all women with births.
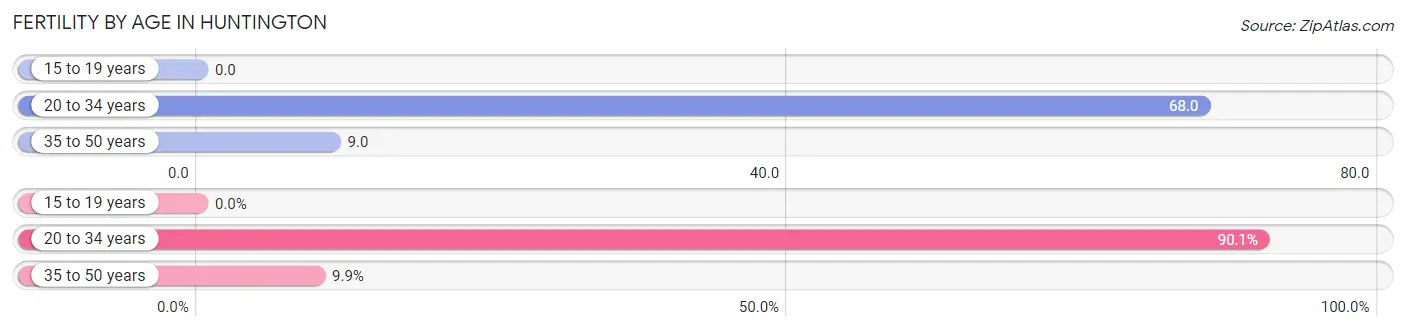
| Age Bracket | Women with Births | Births / 1,000 Women |
| 15 to 19 years | 0 (0.0%) | 0.0 |
| 20 to 34 years | 136 (90.1%) | 68.0 |
| 35 to 50 years | 15 (9.9%) | 9.0 |
| Total | 151 (100.0%) | 36.0 |
Fertility by Age by Marriage Status in Huntington
88.7% of women with births (151) in Huntington are married. The highest percentage of unmarried women with births falls into 20 to 34 years age bracket with 12.5% of them unmarried at the time of birth, while the lowest percentage of unmarried women with births belong to 35 to 50 years age bracket with 0.0% of them unmarried.
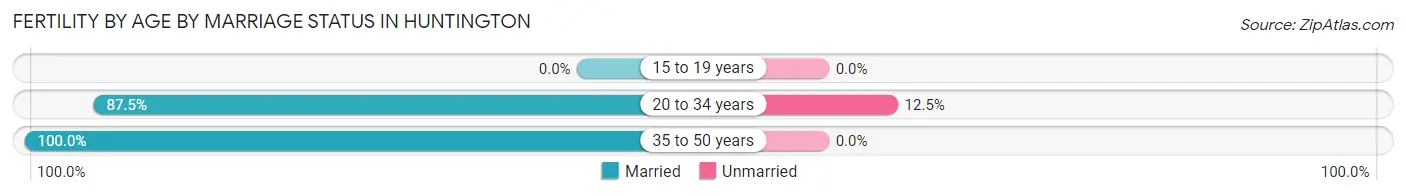
| Age Bracket | Married | Unmarried |
| 15 to 19 years | 0 (0.0%) | 0 (0.0%) |
| 20 to 34 years | 119 (87.5%) | 17 (12.5%) |
| 35 to 50 years | 15 (100.0%) | 0 (0.0%) |
| Total | 134 (88.7%) | 17 (11.3%) |
Fertility by Education in Huntington
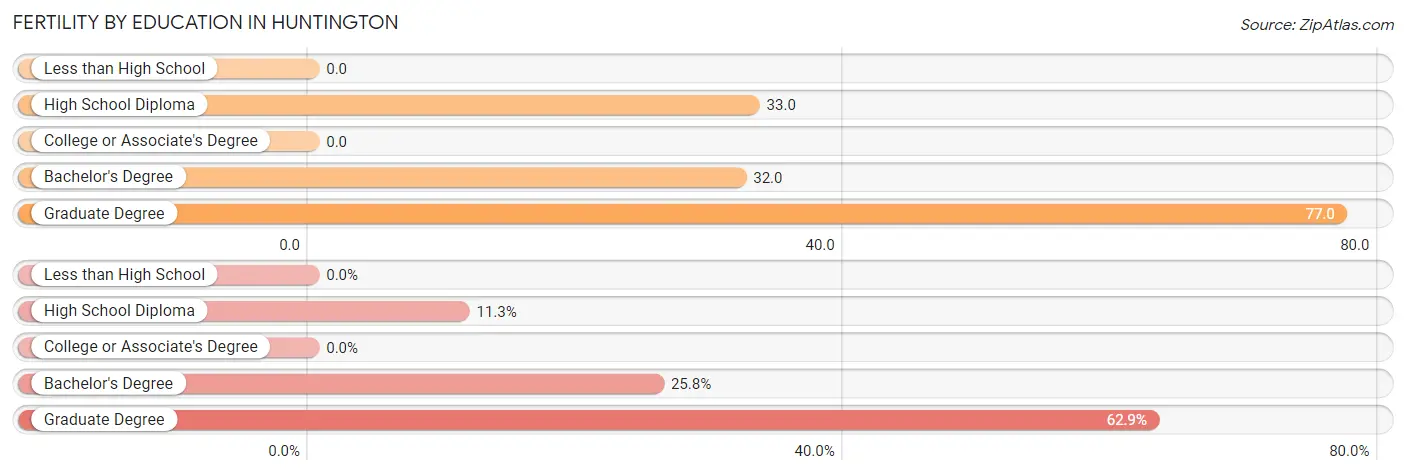
| Educational Attainment | Women with Births | Births / 1,000 Women |
| Less than High School | 0 (0.0%) | 0.0 |
| High School Diploma | 17 (11.3%) | 33.0 |
| College or Associate's Degree | 0 (0.0%) | 0.0 |
| Bachelor's Degree | 39 (25.8%) | 32.0 |
| Graduate Degree | 95 (62.9%) | 77.0 |
| Total | 151 (100.0%) | 36.0 |
Fertility by Education by Marriage Status in Huntington
11.3% of women with births in Huntington are unmarried. Women with the educational attainment of bachelor's degree are most likely to be married with 100.0% of them married at childbirth, while women with the educational attainment of high school diploma are least likely to be married with 100.0% of them unmarried at childbirth.
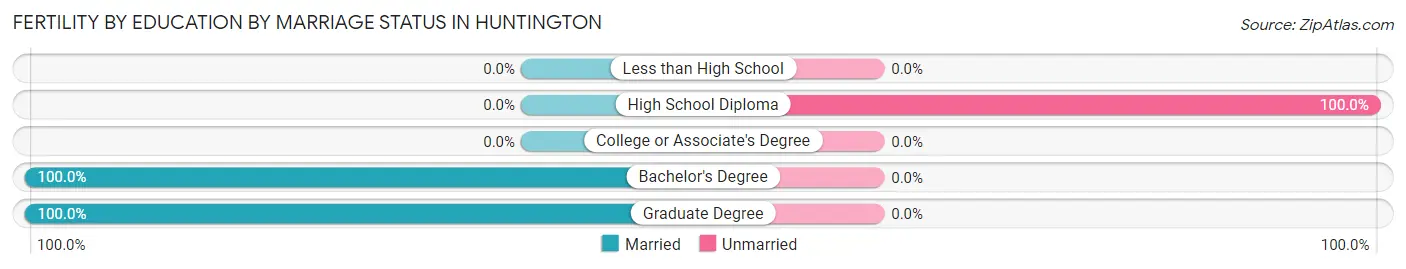
| Educational Attainment | Married | Unmarried |
| Less than High School | 0 (0.0%) | 0 (0.0%) |
| High School Diploma | 0 (0.0%) | 17 (100.0%) |
| College or Associate's Degree | 0 (0.0%) | 0 (0.0%) |
| Bachelor's Degree | 39 (100.0%) | 0 (0.0%) |
| Graduate Degree | 95 (100.0%) | 0 (0.0%) |
| Total | 134 (88.7%) | 17 (11.3%) |
Employment Characteristics in Huntington
Employment by Class of Employer in Huntington
Among the 10,683 employed individuals in Huntington, private company employees (6,874 | 64.3%), not-for-profit organizations (880 | 8.2%), and self-employed (not incorporated) (817 | 7.6%) make up the most common classes of employment.
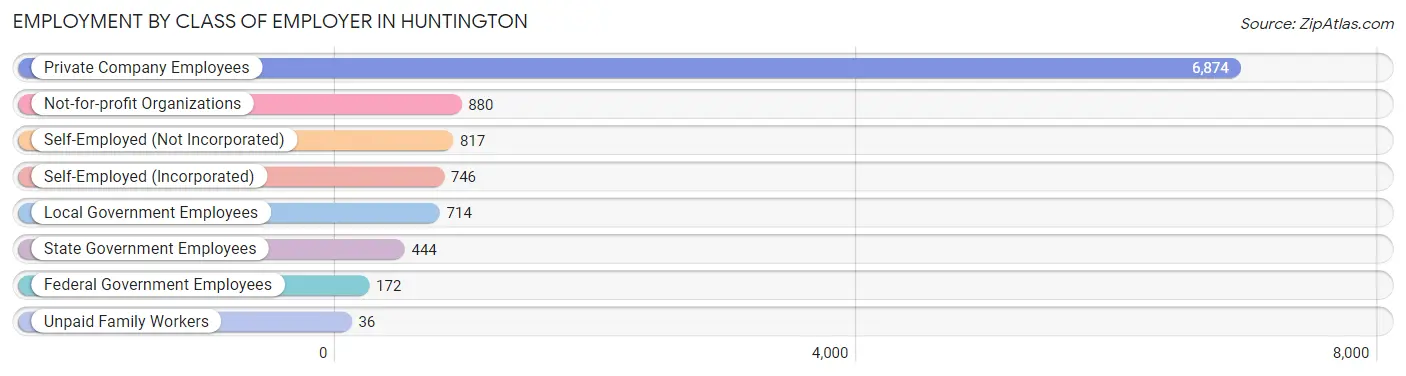
| Employer Class | # Employees | % Employees |
| Private Company Employees | 6,874 | 64.3% |
| Self-Employed (Incorporated) | 746 | 7.0% |
| Self-Employed (Not Incorporated) | 817 | 7.6% |
| Not-for-profit Organizations | 880 | 8.2% |
| Local Government Employees | 714 | 6.7% |
| State Government Employees | 444 | 4.2% |
| Federal Government Employees | 172 | 1.6% |
| Unpaid Family Workers | 36 | 0.3% |
| Total | 10,683 | 100.0% |
Employment Status by Age in Huntington
According to the labor force statistics for Huntington, out of the total population over 16 years of age (16,761), 67.7% or 11,347 individuals are in the labor force, with 5.1% or 579 of them unemployed. The age group with the highest labor force participation rate is 30 to 34 years, with 92.9% or 928 individuals in the labor force. Within the labor force, the 16 to 19 years age range has the highest percentage of unemployed individuals, with 49.8% or 155 of them being unemployed.
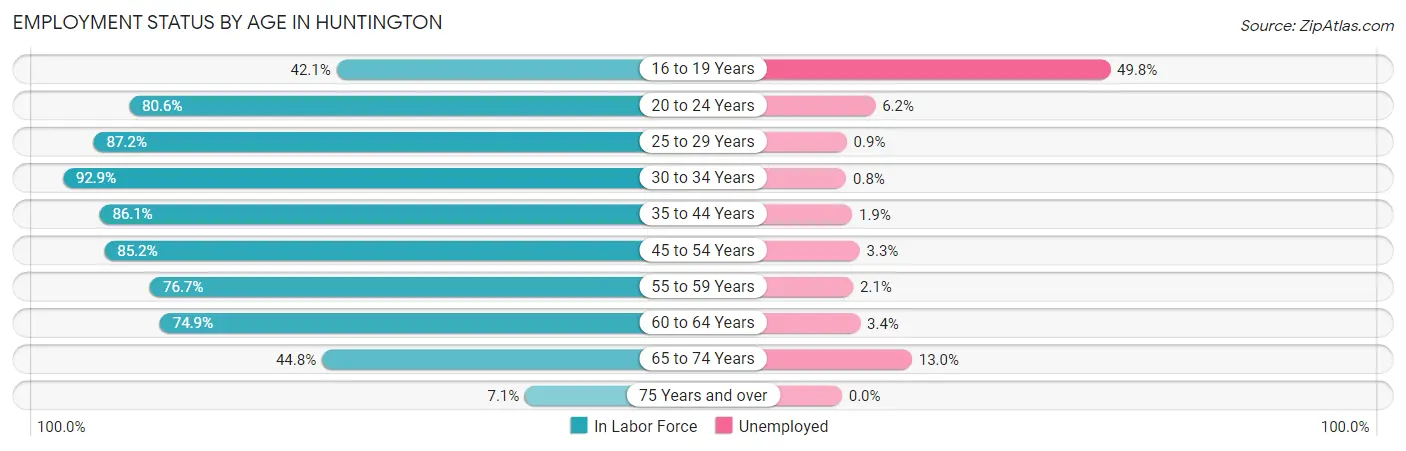
| Age Bracket | In Labor Force | Unemployed |
| 16 to 19 Years | 311 (42.1%) | 155 (49.8%) |
| 20 to 24 Years | 947 (80.6%) | 59 (6.2%) |
| 25 to 29 Years | 1,066 (87.2%) | 10 (0.9%) |
| 30 to 34 Years | 928 (92.9%) | 7 (0.8%) |
| 35 to 44 Years | 1,766 (86.1%) | 34 (1.9%) |
| 45 to 54 Years | 2,397 (85.2%) | 79 (3.3%) |
| 55 to 59 Years | 1,305 (76.7%) | 27 (2.1%) |
| 60 to 64 Years | 1,192 (74.9%) | 41 (3.4%) |
| 65 to 74 Years | 1,322 (44.8%) | 172 (13.0%) |
| 75 Years and over | 108 (7.1%) | 0 (0.0%) |
| Total | 11,347 (67.7%) | 579 (5.1%) |
Employment Status by Educational Attainment in Huntington
According to labor force statistics for Huntington, 83.4% of individuals (8,656) out of the total population between 25 and 64 years of age (10,379) are in the labor force, with 2.3% or 199 of them being unemployed. The group with the highest labor force participation rate are those with the educational attainment of bachelor's degree or higher, with 86.6% or 6,020 individuals in the labor force. Within the labor force, individuals with bachelor's degree or higher education have the highest percentage of unemployment, with 2.9% or 175 of them being unemployed.
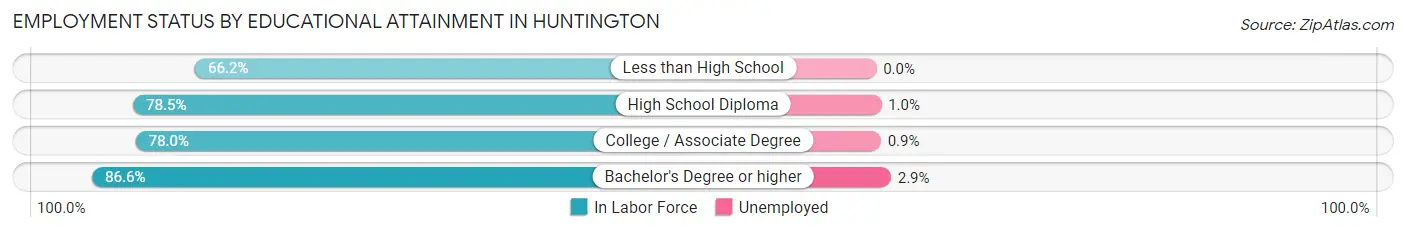
| Educational Attainment | In Labor Force | Unemployed |
| Less than High School | 264 (66.2%) | 0 (0.0%) |
| High School Diploma | 777 (78.5%) | 10 (1.0%) |
| College / Associate Degree | 1,590 (78.0%) | 18 (0.9%) |
| Bachelor's Degree or higher | 6,020 (86.6%) | 202 (2.9%) |
| Total | 8,656 (83.4%) | 239 (2.3%) |
Employment Occupations by Sex in Huntington
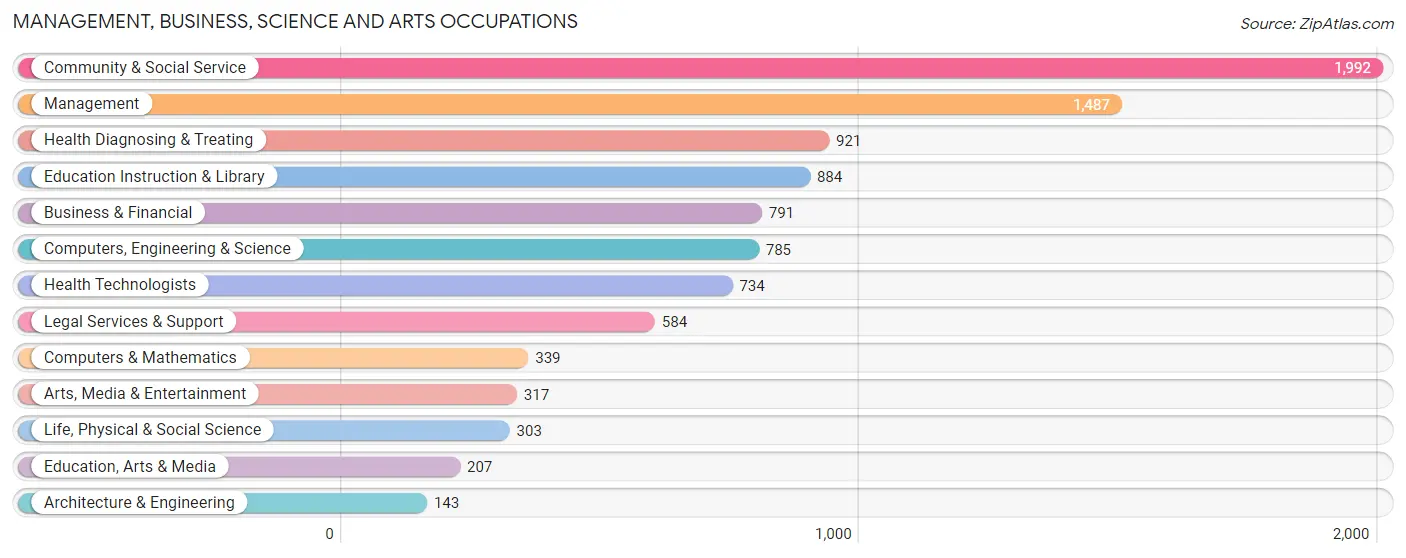
Management, Business, Science and Arts Occupations
The most common Management, Business, Science and Arts occupations in Huntington are Community & Social Service (1,992 | 18.5%), Management (1,487 | 13.8%), Health Diagnosing & Treating (921 | 8.6%), Education Instruction & Library (884 | 8.2%), and Business & Financial (791 | 7.3%).
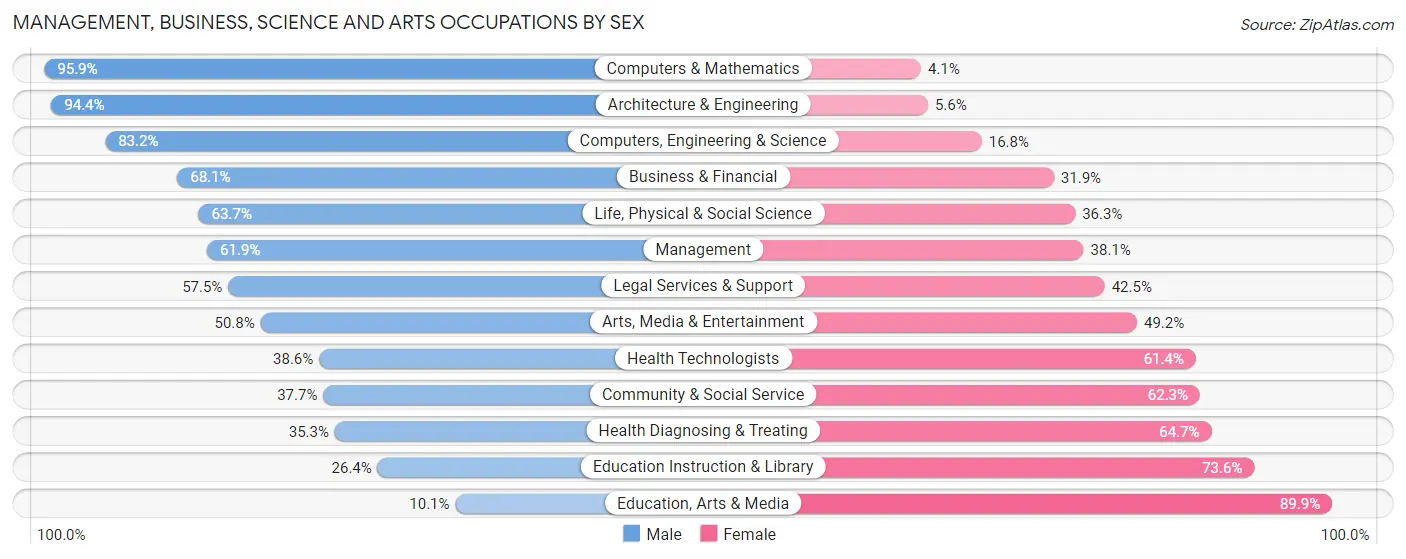
Management, Business, Science and Arts Occupations by Sex
Within the Management, Business, Science and Arts occupations in Huntington, the most male-oriented occupations are Computers & Mathematics (95.9%), Architecture & Engineering (94.4%), and Computers, Engineering & Science (83.2%), while the most female-oriented occupations are Education, Arts & Media (89.9%), Education Instruction & Library (73.6%), and Health Diagnosing & Treating (64.7%).
| Occupation | Male | Female |
| Management | 921 (61.9%) | 566 (38.1%) |
| Business & Financial | 539 (68.1%) | 252 (31.9%) |
| Computers, Engineering & Science | 653 (83.2%) | 132 (16.8%) |
| Computers & Mathematics | 325 (95.9%) | 14 (4.1%) |
| Architecture & Engineering | 135 (94.4%) | 8 (5.6%) |
| Life, Physical & Social Science | 193 (63.7%) | 110 (36.3%) |
| Community & Social Service | 751 (37.7%) | 1,241 (62.3%) |
| Education, Arts & Media | 21 (10.1%) | 186 (89.9%) |
| Legal Services & Support | 336 (57.5%) | 248 (42.5%) |
| Education Instruction & Library | 233 (26.4%) | 651 (73.6%) |
| Arts, Media & Entertainment | 161 (50.8%) | 156 (49.2%) |
| Health Diagnosing & Treating | 325 (35.3%) | 596 (64.7%) |
| Health Technologists | 283 (38.6%) | 451 (61.4%) |
| Total (Category) | 3,189 (53.4%) | 2,787 (46.6%) |
| Total (Overall) | 5,597 (52.0%) | 5,161 (48.0%) |
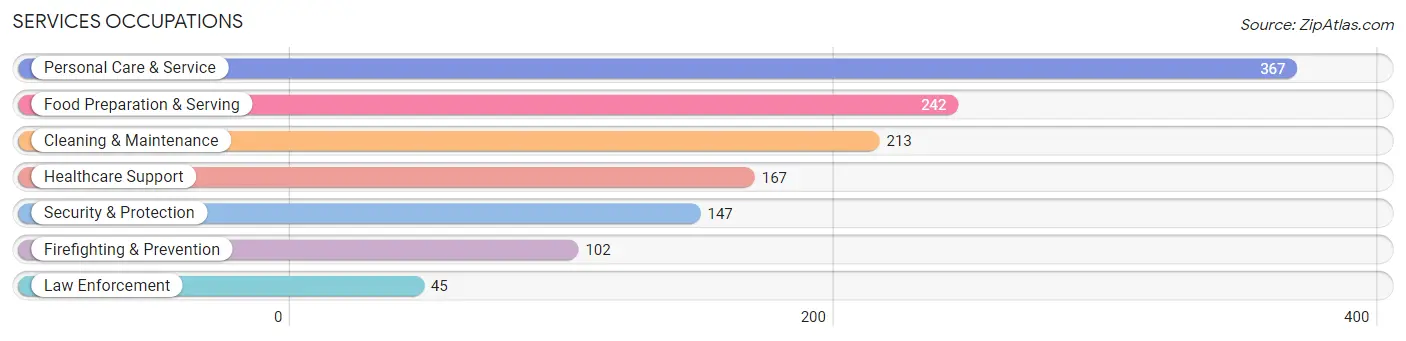
Services Occupations
The most common Services occupations in Huntington are Personal Care & Service (367 | 3.4%), Food Preparation & Serving (242 | 2.2%), Cleaning & Maintenance (213 | 2.0%), Healthcare Support (167 | 1.5%), and Security & Protection (147 | 1.4%).
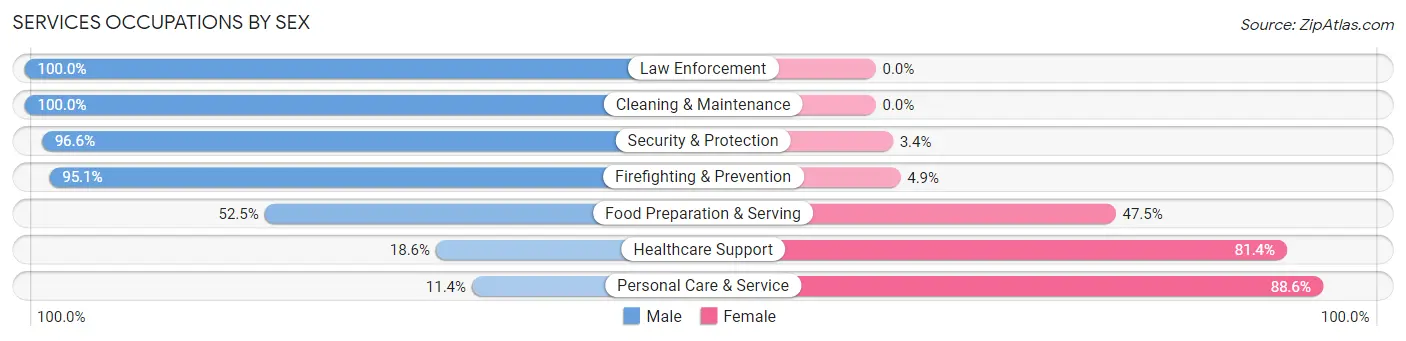
Services Occupations by Sex
Within the Services occupations in Huntington, the most male-oriented occupations are Law Enforcement (100.0%), Cleaning & Maintenance (100.0%), and Security & Protection (96.6%), while the most female-oriented occupations are Personal Care & Service (88.6%), Healthcare Support (81.4%), and Food Preparation & Serving (47.5%).
| Occupation | Male | Female |
| Healthcare Support | 31 (18.6%) | 136 (81.4%) |
| Security & Protection | 142 (96.6%) | 5 (3.4%) |
| Firefighting & Prevention | 97 (95.1%) | 5 (4.9%) |
| Law Enforcement | 45 (100.0%) | 0 (0.0%) |
| Food Preparation & Serving | 127 (52.5%) | 115 (47.5%) |
| Cleaning & Maintenance | 213 (100.0%) | 0 (0.0%) |
| Personal Care & Service | 42 (11.4%) | 325 (88.6%) |
| Total (Category) | 555 (48.9%) | 581 (51.1%) |
| Total (Overall) | 5,597 (52.0%) | 5,161 (48.0%) |
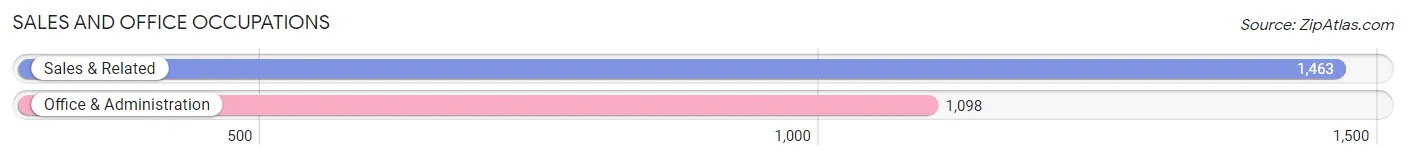
Sales and Office Occupations
The most common Sales and Office occupations in Huntington are Sales & Related (1,463 | 13.6%), and Office & Administration (1,098 | 10.2%).
Sales and Office Occupations by Sex
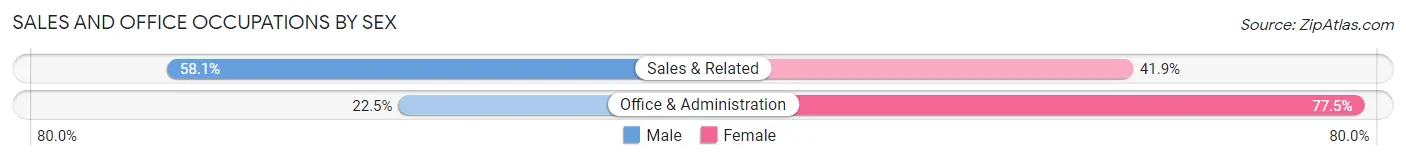
| Occupation | Male | Female |
| Sales & Related | 850 (58.1%) | 613 (41.9%) |
| Office & Administration | 247 (22.5%) | 851 (77.5%) |
| Total (Category) | 1,097 (42.8%) | 1,464 (57.2%) |
| Total (Overall) | 5,597 (52.0%) | 5,161 (48.0%) |
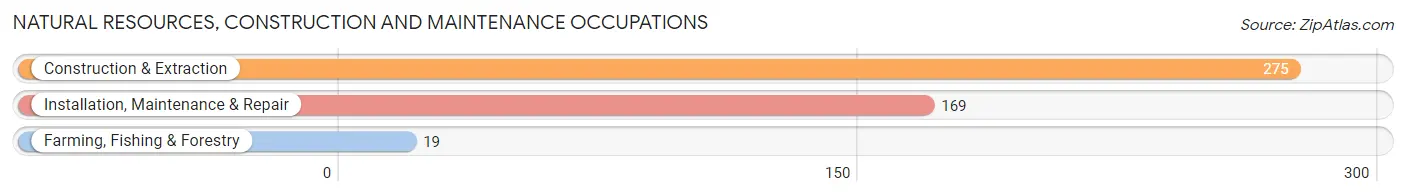
Natural Resources, Construction and Maintenance Occupations
The most common Natural Resources, Construction and Maintenance occupations in Huntington are Construction & Extraction (275 | 2.6%), Installation, Maintenance & Repair (169 | 1.6%), and Farming, Fishing & Forestry (19 | 0.2%).
Natural Resources, Construction and Maintenance Occupations by Sex
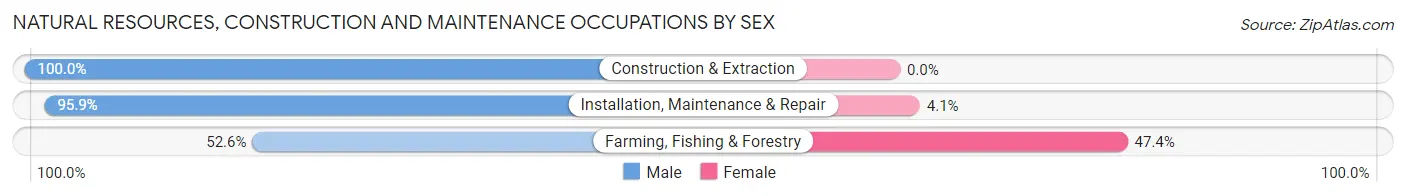
| Occupation | Male | Female |
| Farming, Fishing & Forestry | 10 (52.6%) | 9 (47.4%) |
| Construction & Extraction | 275 (100.0%) | 0 (0.0%) |
| Installation, Maintenance & Repair | 162 (95.9%) | 7 (4.1%) |
| Total (Category) | 447 (96.5%) | 16 (3.5%) |
| Total (Overall) | 5,597 (52.0%) | 5,161 (48.0%) |
Production, Transportation and Moving Occupations
The most common Production, Transportation and Moving occupations in Huntington are Material Moving (267 | 2.5%), Production (255 | 2.4%), and Transportation (100 | 0.9%).
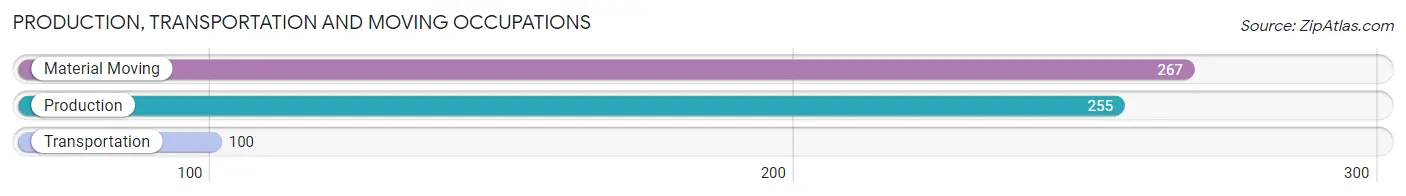
Production, Transportation and Moving Occupations by Sex
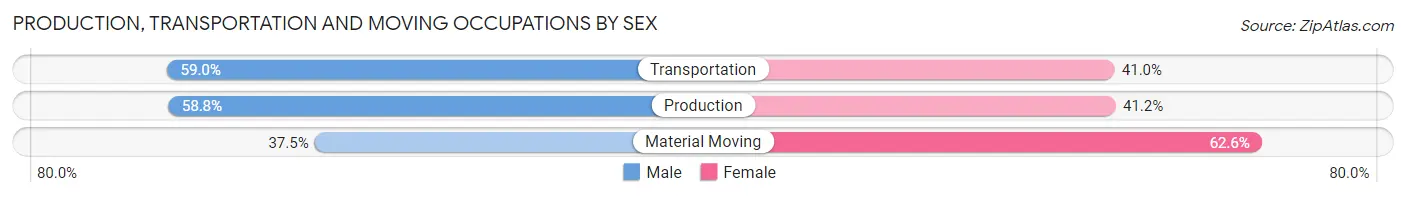
| Occupation | Male | Female |
| Production | 150 (58.8%) | 105 (41.2%) |
| Transportation | 59 (59.0%) | 41 (41.0%) |
| Material Moving | 100 (37.4%) | 167 (62.5%) |
| Total (Category) | 309 (49.7%) | 313 (50.3%) |
| Total (Overall) | 5,597 (52.0%) | 5,161 (48.0%) |
Employment Industries by Sex in Huntington
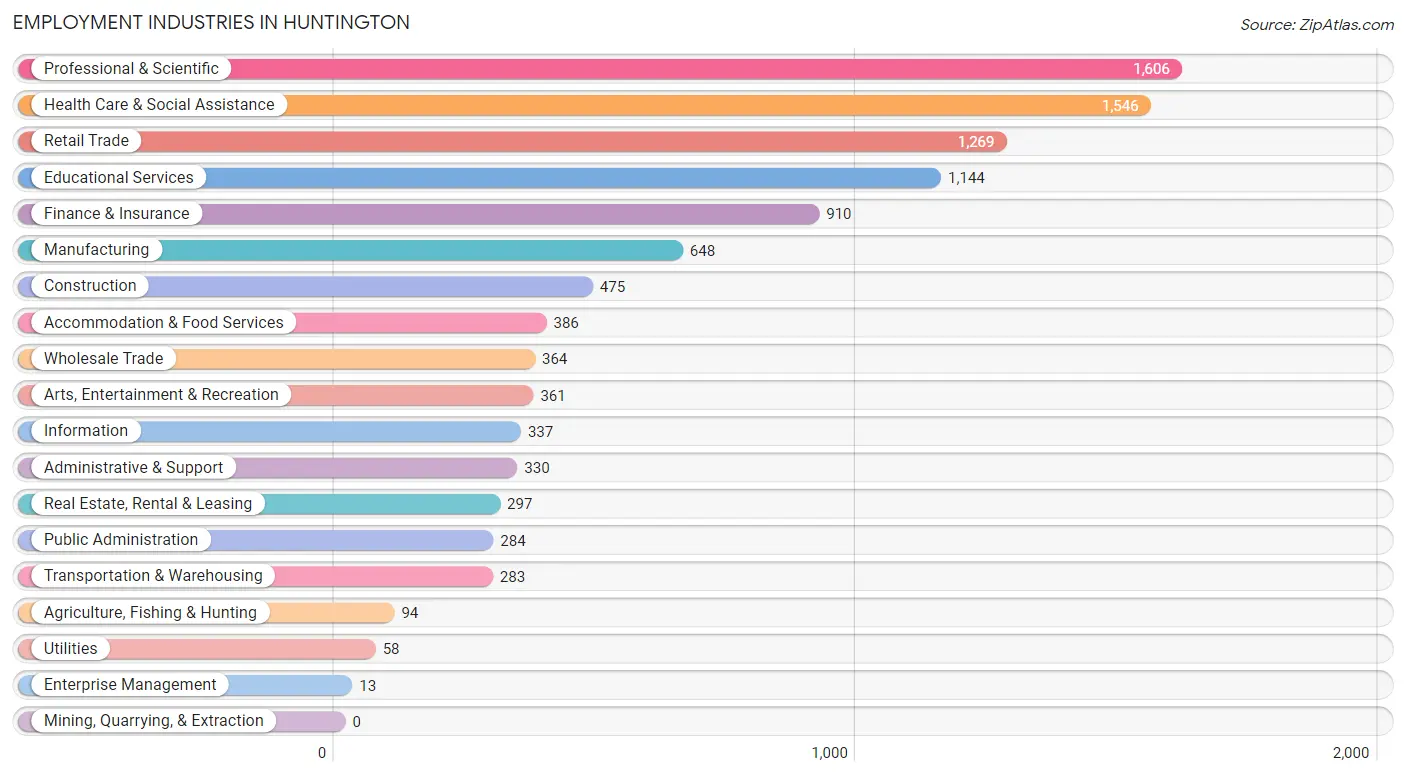
Employment Industries in Huntington
The major employment industries in Huntington include Professional & Scientific (1,606 | 14.9%), Health Care & Social Assistance (1,546 | 14.4%), Retail Trade (1,269 | 11.8%), Educational Services (1,144 | 10.6%), and Finance & Insurance (910 | 8.5%).
Employment Industries by Sex in Huntington
The Huntington industries that see more men than women are Utilities (100.0%), Construction (93.0%), and Administrative & Support (86.1%), whereas the industries that tend to have a higher number of women are Enterprise Management (100.0%), Health Care & Social Assistance (75.9%), and Arts, Entertainment & Recreation (75.3%).
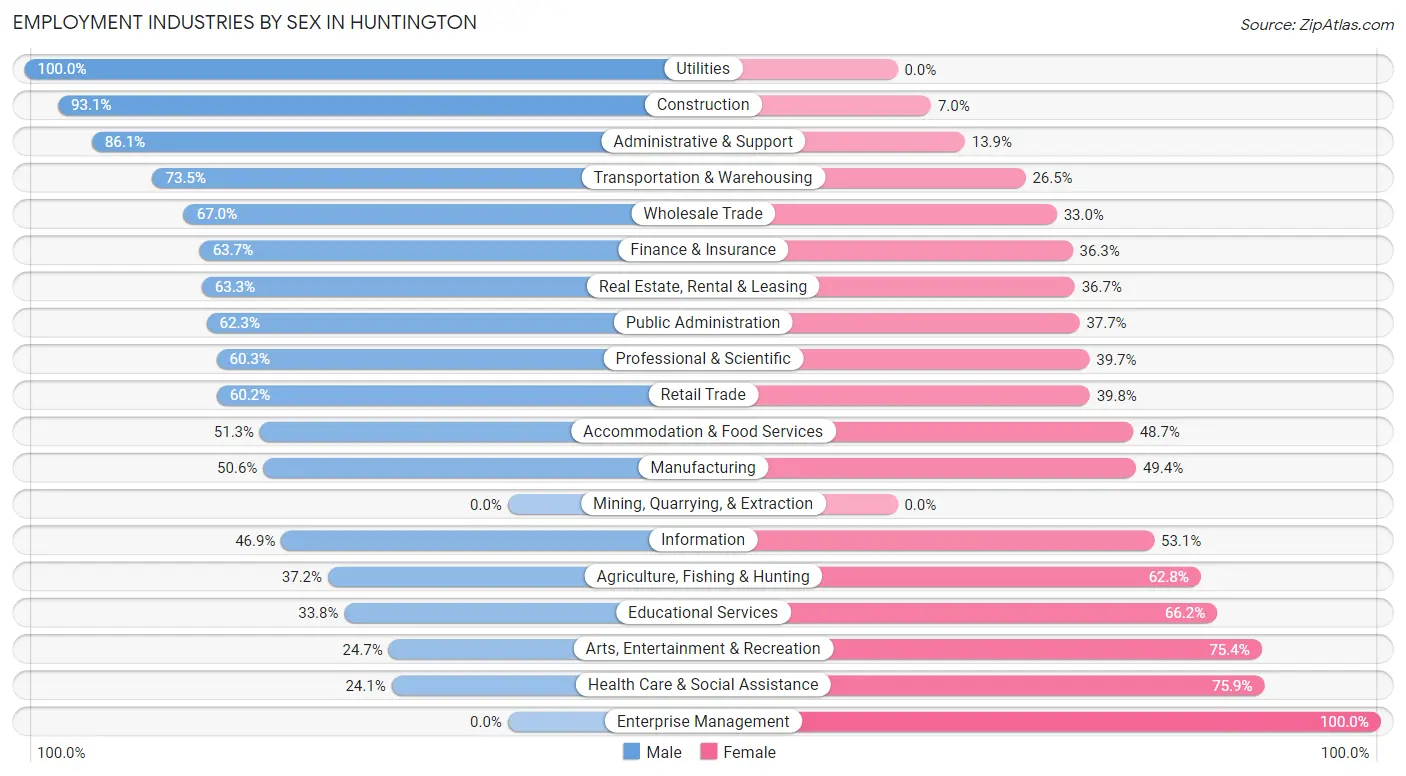
| Industry | Male | Female |
| Agriculture, Fishing & Hunting | 35 (37.2%) | 59 (62.8%) |
| Mining, Quarrying, & Extraction | 0 (0.0%) | 0 (0.0%) |
| Construction | 442 (93.0%) | 33 (7.0%) |
| Manufacturing | 328 (50.6%) | 320 (49.4%) |
| Wholesale Trade | 244 (67.0%) | 120 (33.0%) |
| Retail Trade | 764 (60.2%) | 505 (39.8%) |
| Transportation & Warehousing | 208 (73.5%) | 75 (26.5%) |
| Utilities | 58 (100.0%) | 0 (0.0%) |
| Information | 158 (46.9%) | 179 (53.1%) |
| Finance & Insurance | 580 (63.7%) | 330 (36.3%) |
| Real Estate, Rental & Leasing | 188 (63.3%) | 109 (36.7%) |
| Professional & Scientific | 968 (60.3%) | 638 (39.7%) |
| Enterprise Management | 0 (0.0%) | 13 (100.0%) |
| Administrative & Support | 284 (86.1%) | 46 (13.9%) |
| Educational Services | 387 (33.8%) | 757 (66.2%) |
| Health Care & Social Assistance | 372 (24.1%) | 1,174 (75.9%) |
| Arts, Entertainment & Recreation | 89 (24.6%) | 272 (75.3%) |
| Accommodation & Food Services | 198 (51.3%) | 188 (48.7%) |
| Public Administration | 177 (62.3%) | 107 (37.7%) |
| Total | 5,597 (52.0%) | 5,161 (48.0%) |
Education in Huntington
School Enrollment in Huntington
The most common levels of schooling among the 3,892 students in Huntington are high school (1,192 | 30.6%), elementary school (709 | 18.2%), and middle school (696 | 17.9%).
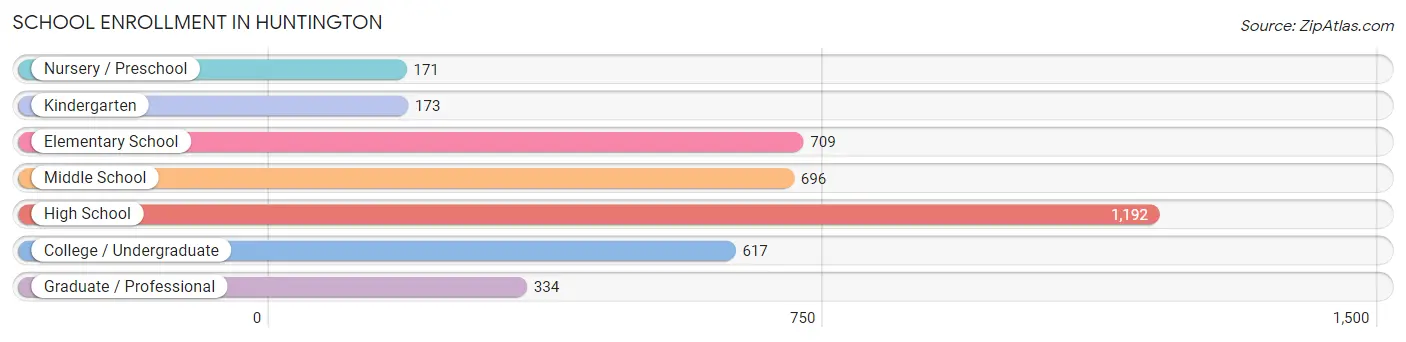
| School Level | # Students | % Students |
| Nursery / Preschool | 171 | 4.4% |
| Kindergarten | 173 | 4.4% |
| Elementary School | 709 | 18.2% |
| Middle School | 696 | 17.9% |
| High School | 1,192 | 30.6% |
| College / Undergraduate | 617 | 15.9% |
| Graduate / Professional | 334 | 8.6% |
| Total | 3,892 | 100.0% |
School Enrollment by Age by Funding Source in Huntington
Out of a total of 3,892 students who are enrolled in schools in Huntington, 1,242 (31.9%) attend a private institution, while the remaining 2,650 (68.1%) are enrolled in public schools. The age group of 25 to 34 year olds has the highest likelihood of being enrolled in private schools, with 103 (67.8% in the age bracket) enrolled. Conversely, the age group of 10 to 14 year olds has the lowest likelihood of being enrolled in a private school, with 784 (84.6% in the age bracket) attending a public institution.
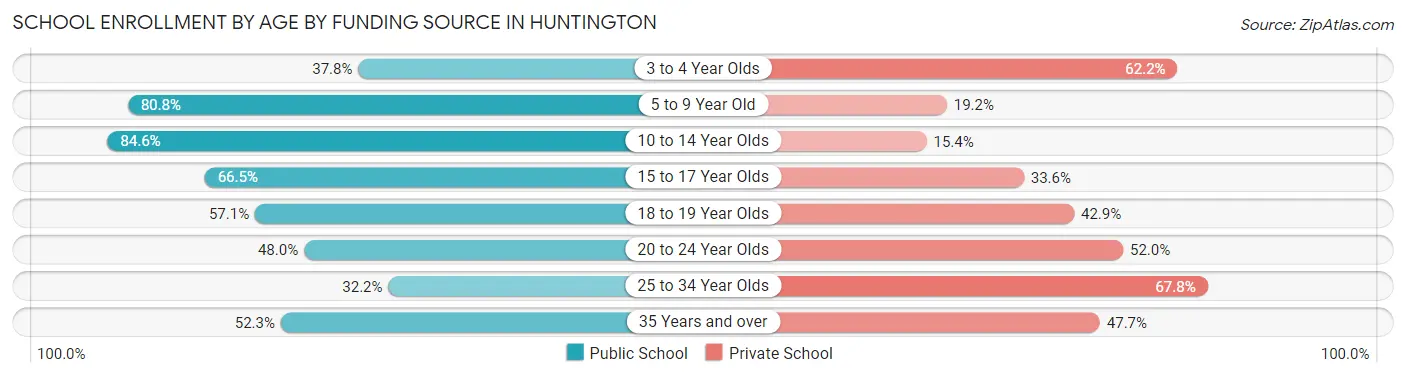
| Age Bracket | Public School | Private School |
| 3 to 4 Year Olds | 42 (37.8%) | 69 (62.2%) |
| 5 to 9 Year Old | 732 (80.8%) | 174 (19.2%) |
| 10 to 14 Year Olds | 784 (84.6%) | 143 (15.4%) |
| 15 to 17 Year Olds | 515 (66.4%) | 260 (33.6%) |
| 18 to 19 Year Olds | 157 (57.1%) | 118 (42.9%) |
| 20 to 24 Year Olds | 200 (48.0%) | 217 (52.0%) |
| 25 to 34 Year Olds | 49 (32.2%) | 103 (67.8%) |
| 35 Years and over | 172 (52.3%) | 157 (47.7%) |
| Total | 2,650 (68.1%) | 1,242 (31.9%) |
Educational Attainment by Field of Study in Huntington
Business (2,073 | 19.2%), education (1,258 | 11.7%), social sciences (1,071 | 9.9%), science & technology (1,060 | 9.8%), and psychology (847 | 7.9%) are the most common fields of study among 10,775 individuals in Huntington who have obtained a bachelor's degree or higher.
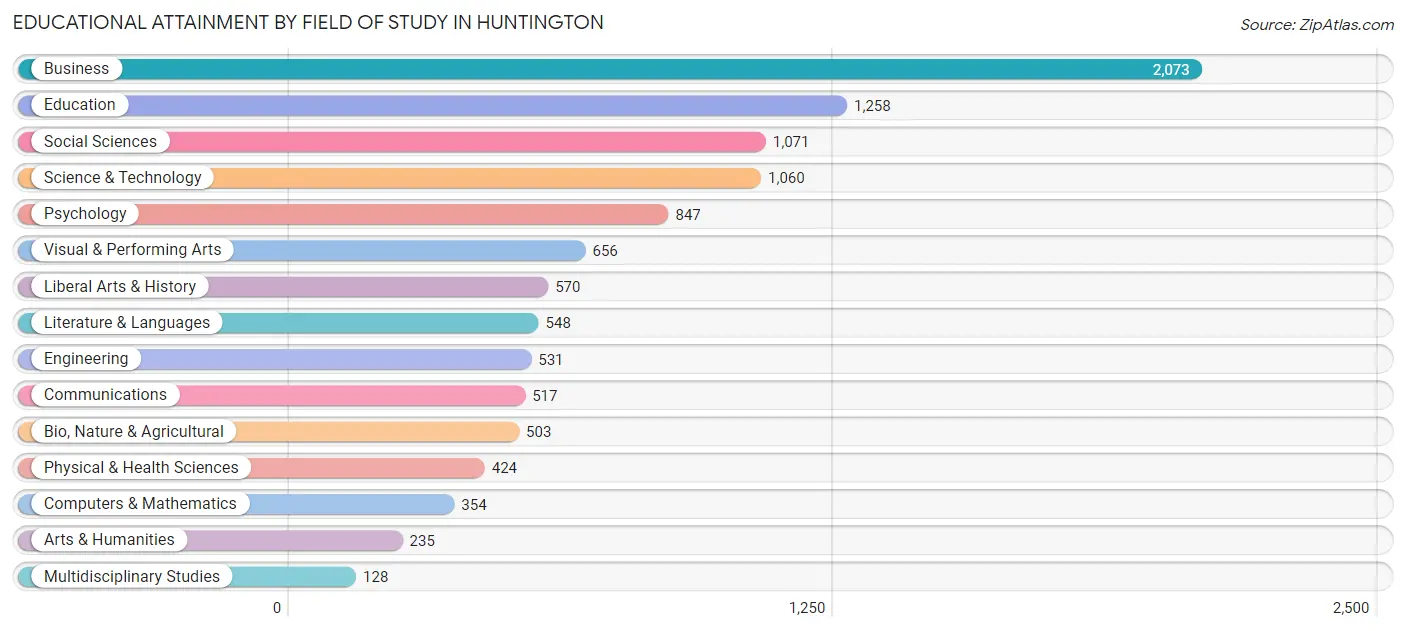
| Field of Study | # Graduates | % Graduates |
| Computers & Mathematics | 354 | 3.3% |
| Bio, Nature & Agricultural | 503 | 4.7% |
| Physical & Health Sciences | 424 | 3.9% |
| Psychology | 847 | 7.9% |
| Social Sciences | 1,071 | 9.9% |
| Engineering | 531 | 4.9% |
| Multidisciplinary Studies | 128 | 1.2% |
| Science & Technology | 1,060 | 9.8% |
| Business | 2,073 | 19.2% |
| Education | 1,258 | 11.7% |
| Literature & Languages | 548 | 5.1% |
| Liberal Arts & History | 570 | 5.3% |
| Visual & Performing Arts | 656 | 6.1% |
| Communications | 517 | 4.8% |
| Arts & Humanities | 235 | 2.2% |
| Total | 10,775 | 100.0% |
Transportation & Commute in Huntington
Vehicle Availability by Sex in Huntington
The most prevalent vehicle ownership categories in Huntington are males with 2 vehicles (2,395, accounting for 43.0%) and females with 2 vehicles (2,043, making up 47.0%).
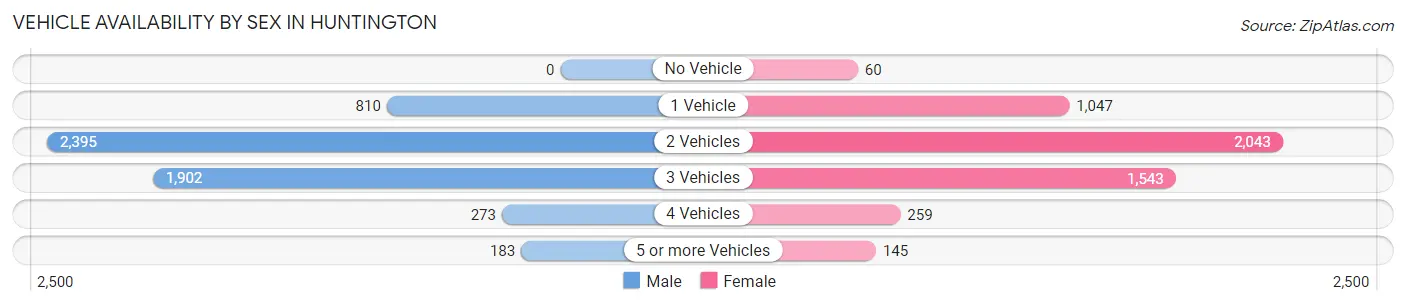
| Vehicles Available | Male | Female |
| No Vehicle | 0 (0.0%) | 60 (1.2%) |
| 1 Vehicle | 810 (14.6%) | 1,047 (20.5%) |
| 2 Vehicles | 2,395 (43.0%) | 2,043 (40.1%) |
| 3 Vehicles | 1,902 (34.2%) | 1,543 (30.3%) |
| 4 Vehicles | 273 (4.9%) | 259 (5.1%) |
| 5 or more Vehicles | 183 (3.3%) | 145 (2.8%) |
| Total | 5,563 (100.0%) | 5,097 (100.0%) |
Commute Time in Huntington
The most frequently occuring commute durations in Huntington are 30 to 34 minutes (1,250 commuters, 14.1%), 60 to 89 minutes (1,018 commuters, 11.5%), and 90 or more minutes (996 commuters, 11.2%).
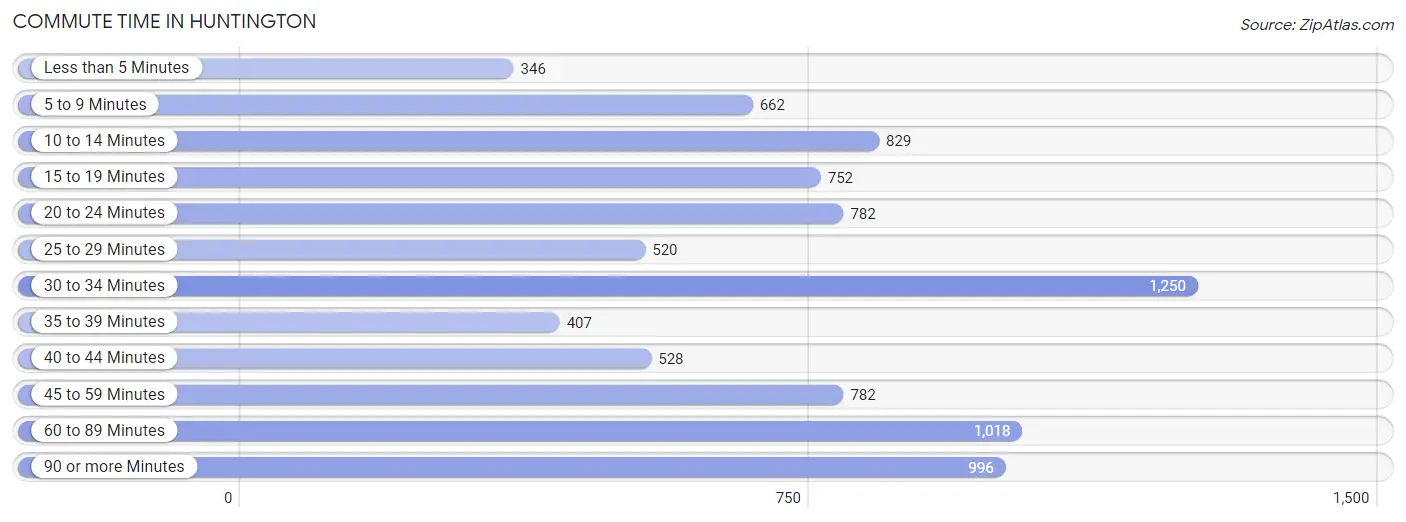
| Commute Time | # Commuters | % Commuters |
| Less than 5 Minutes | 346 | 3.9% |
| 5 to 9 Minutes | 662 | 7.5% |
| 10 to 14 Minutes | 829 | 9.3% |
| 15 to 19 Minutes | 752 | 8.5% |
| 20 to 24 Minutes | 782 | 8.8% |
| 25 to 29 Minutes | 520 | 5.9% |
| 30 to 34 Minutes | 1,250 | 14.1% |
| 35 to 39 Minutes | 407 | 4.6% |
| 40 to 44 Minutes | 528 | 5.9% |
| 45 to 59 Minutes | 782 | 8.8% |
| 60 to 89 Minutes | 1,018 | 11.5% |
| 90 or more Minutes | 996 | 11.2% |
Commute Time by Sex in Huntington
The most common commute times in Huntington are 30 to 34 minutes (705 commuters, 14.9%) for males and 30 to 34 minutes (545 commuters, 13.2%) for females.
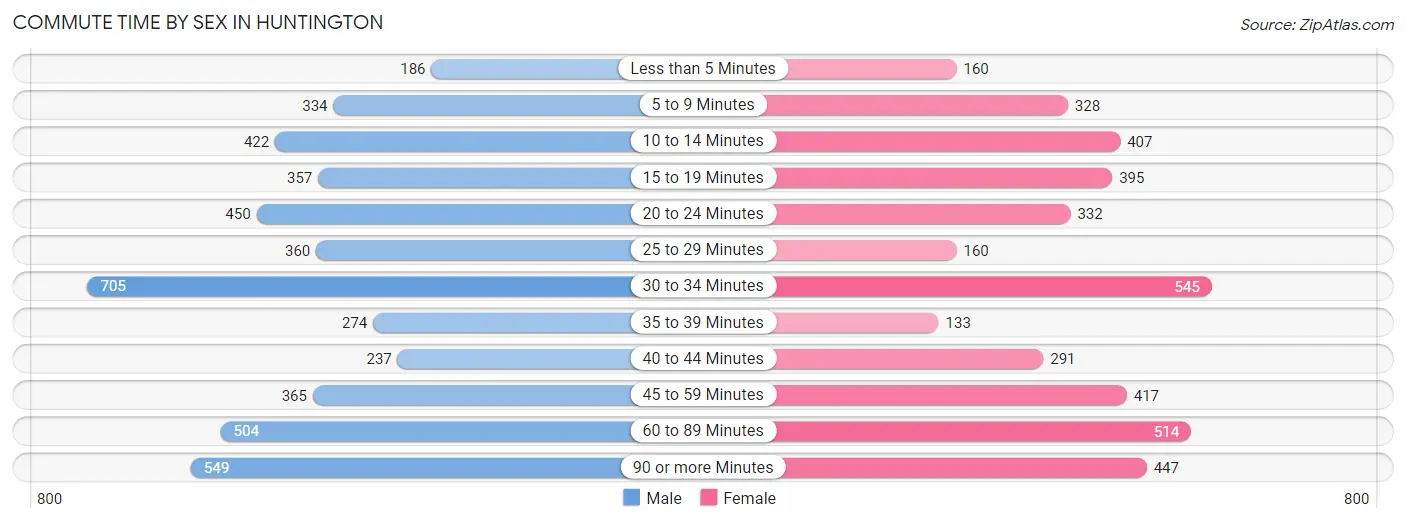
| Commute Time | Male | Female |
| Less than 5 Minutes | 186 (3.9%) | 160 (3.9%) |
| 5 to 9 Minutes | 334 (7.0%) | 328 (7.9%) |
| 10 to 14 Minutes | 422 (8.9%) | 407 (9.9%) |
| 15 to 19 Minutes | 357 (7.5%) | 395 (9.6%) |
| 20 to 24 Minutes | 450 (9.5%) | 332 (8.0%) |
| 25 to 29 Minutes | 360 (7.6%) | 160 (3.9%) |
| 30 to 34 Minutes | 705 (14.9%) | 545 (13.2%) |
| 35 to 39 Minutes | 274 (5.8%) | 133 (3.2%) |
| 40 to 44 Minutes | 237 (5.0%) | 291 (7.0%) |
| 45 to 59 Minutes | 365 (7.7%) | 417 (10.1%) |
| 60 to 89 Minutes | 504 (10.6%) | 514 (12.4%) |
| 90 or more Minutes | 549 (11.6%) | 447 (10.8%) |
Time of Departure to Work by Sex in Huntington
The most frequent times of departure to work in Huntington are 7:30 AM to 7:59 AM (620, 13.1%) for males and 8:00 AM to 8:29 AM (600, 14.5%) for females.
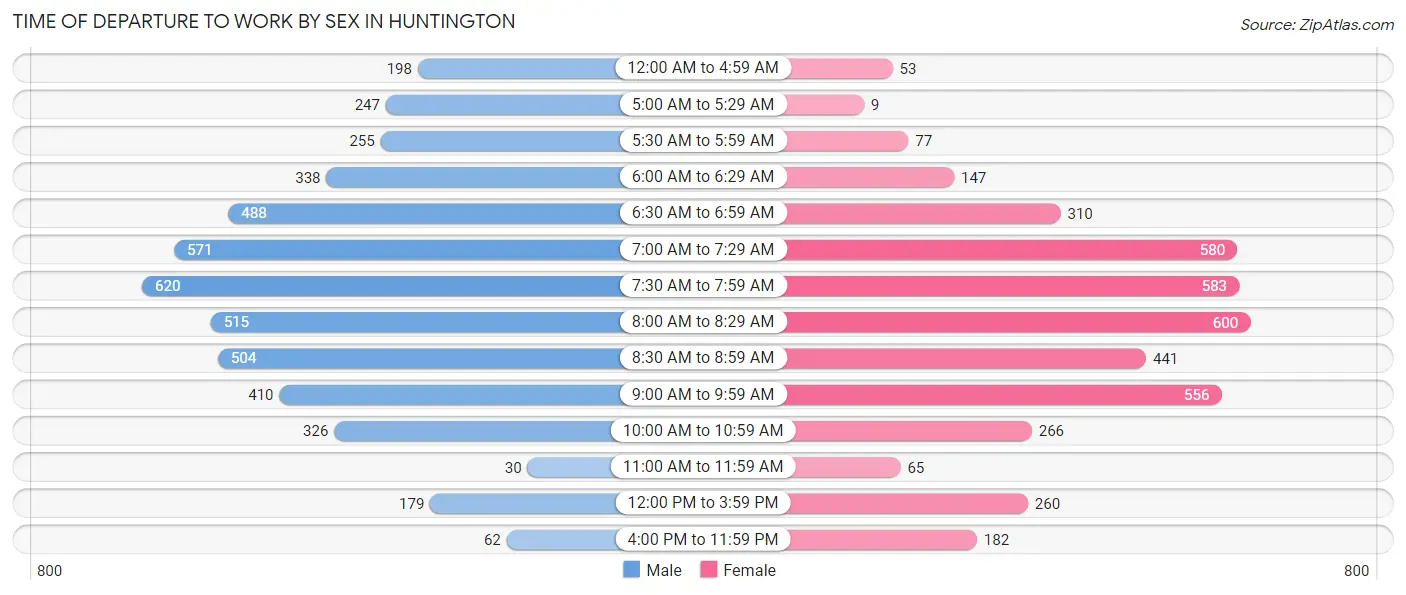
| Time of Departure | Male | Female |
| 12:00 AM to 4:59 AM | 198 (4.2%) | 53 (1.3%) |
| 5:00 AM to 5:29 AM | 247 (5.2%) | 9 (0.2%) |
| 5:30 AM to 5:59 AM | 255 (5.4%) | 77 (1.9%) |
| 6:00 AM to 6:29 AM | 338 (7.1%) | 147 (3.6%) |
| 6:30 AM to 6:59 AM | 488 (10.3%) | 310 (7.5%) |
| 7:00 AM to 7:29 AM | 571 (12.0%) | 580 (14.1%) |
| 7:30 AM to 7:59 AM | 620 (13.1%) | 583 (14.1%) |
| 8:00 AM to 8:29 AM | 515 (10.9%) | 600 (14.5%) |
| 8:30 AM to 8:59 AM | 504 (10.6%) | 441 (10.7%) |
| 9:00 AM to 9:59 AM | 410 (8.6%) | 556 (13.5%) |
| 10:00 AM to 10:59 AM | 326 (6.9%) | 266 (6.4%) |
| 11:00 AM to 11:59 AM | 30 (0.6%) | 65 (1.6%) |
| 12:00 PM to 3:59 PM | 179 (3.8%) | 260 (6.3%) |
| 4:00 PM to 11:59 PM | 62 (1.3%) | 182 (4.4%) |
| Total | 4,743 (100.0%) | 4,129 (100.0%) |
Housing Occupancy in Huntington
Occupancy by Ownership in Huntington
Of the total 7,883 dwellings in Huntington, owner-occupied units account for 6,594 (83.7%), while renter-occupied units make up 1,289 (16.4%).
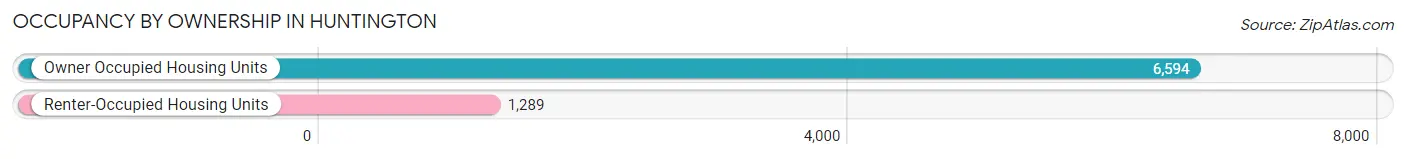
| Occupancy | # Housing Units | % Housing Units |
| Owner Occupied Housing Units | 6,594 | 83.7% |
| Renter-Occupied Housing Units | 1,289 | 16.4% |
| Total Occupied Housing Units | 7,883 | 100.0% |
Occupancy by Household Size in Huntington
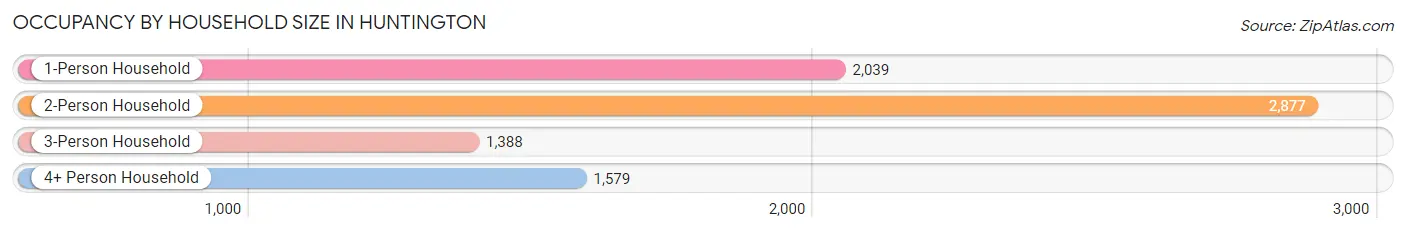
| Household Size | # Housing Units | % Housing Units |
| 1-Person Household | 2,039 | 25.9% |
| 2-Person Household | 2,877 | 36.5% |
| 3-Person Household | 1,388 | 17.6% |
| 4+ Person Household | 1,579 | 20.0% |
| Total Housing Units | 7,883 | 100.0% |
Occupancy by Ownership by Household Size in Huntington
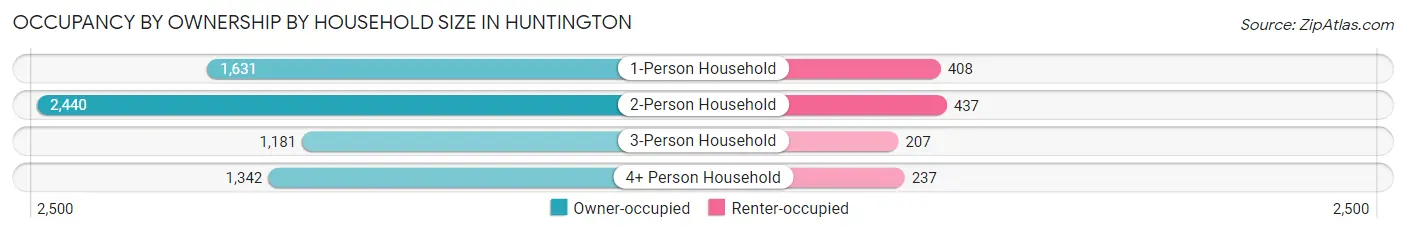
| Household Size | Owner-occupied | Renter-occupied |
| 1-Person Household | 1,631 (80.0%) | 408 (20.0%) |
| 2-Person Household | 2,440 (84.8%) | 437 (15.2%) |
| 3-Person Household | 1,181 (85.1%) | 207 (14.9%) |
| 4+ Person Household | 1,342 (85.0%) | 237 (15.0%) |
| Total Housing Units | 6,594 (83.7%) | 1,289 (16.4%) |
Occupancy by Educational Attainment in Huntington
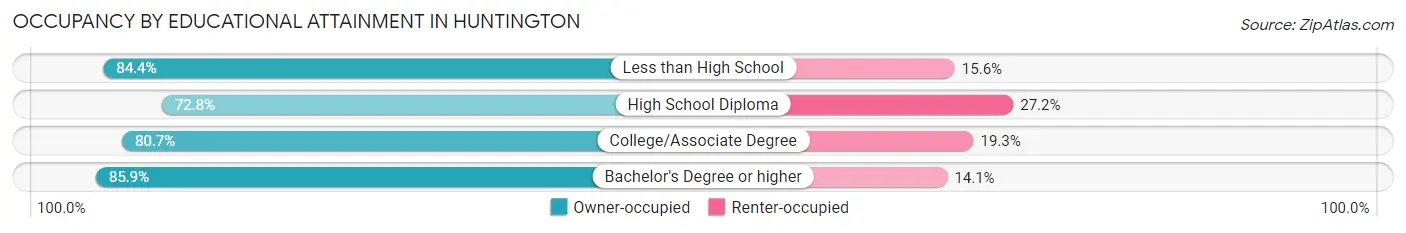
| Household Size | Owner-occupied | Renter-occupied |
| Less than High School | 200 (84.4%) | 37 (15.6%) |
| High School Diploma | 549 (72.8%) | 205 (27.2%) |
| College/Associate Degree | 1,141 (80.7%) | 273 (19.3%) |
| Bachelor's Degree or higher | 4,704 (85.9%) | 774 (14.1%) |
Occupancy by Age of Householder in Huntington
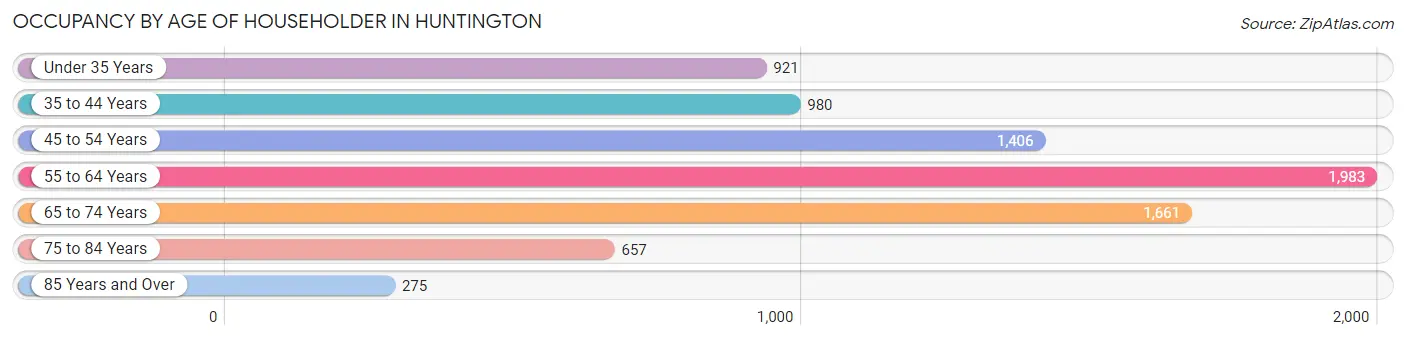
| Age Bracket | # Households | % Households |
| Under 35 Years | 921 | 11.7% |
| 35 to 44 Years | 980 | 12.4% |
| 45 to 54 Years | 1,406 | 17.8% |
| 55 to 64 Years | 1,983 | 25.2% |
| 65 to 74 Years | 1,661 | 21.1% |
| 75 to 84 Years | 657 | 8.3% |
| 85 Years and Over | 275 | 3.5% |
| Total | 7,883 | 100.0% |
Housing Finances in Huntington
Median Income by Occupancy in Huntington
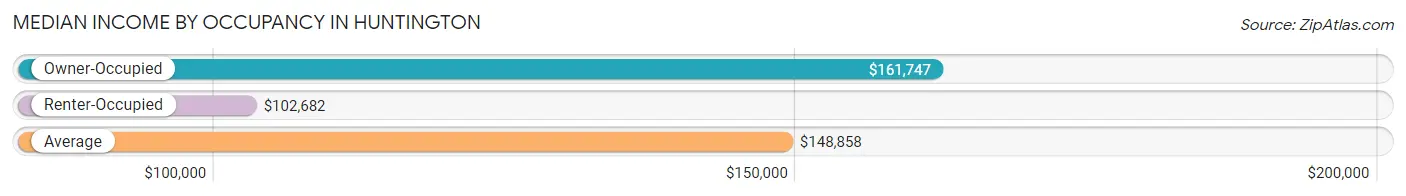
| Occupancy Type | # Households | Median Income |
| Owner-Occupied | 6,594 (83.7%) | $161,747 |
| Renter-Occupied | 1,289 (16.4%) | $102,682 |
| Average | 7,883 (100.0%) | $148,858 |
Occupancy by Householder Income Bracket in Huntington
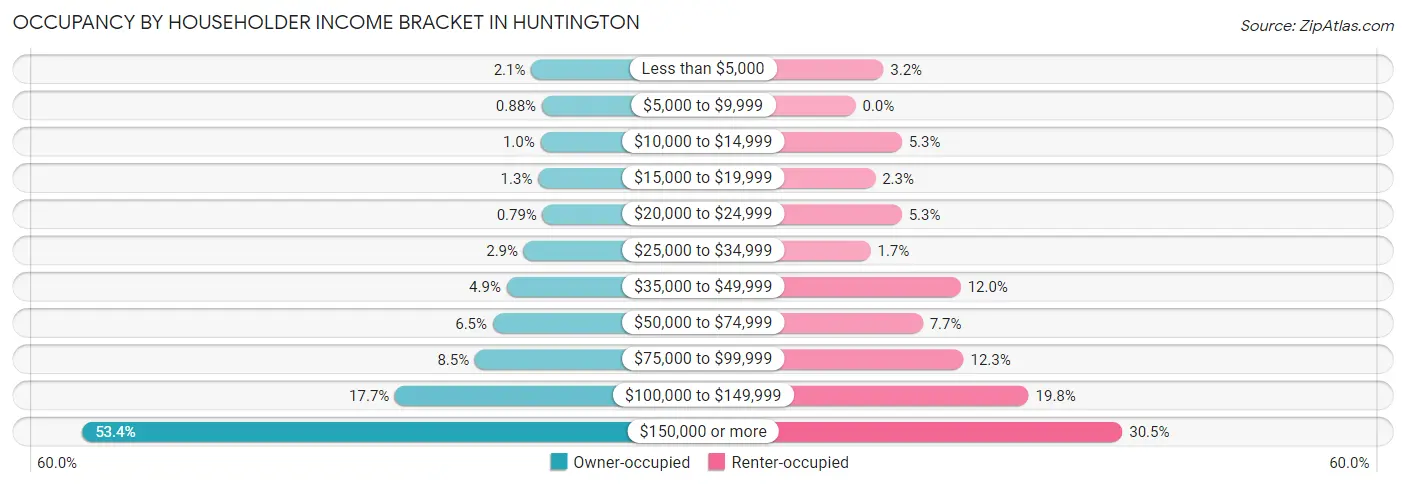
| Income Bracket | Owner-occupied | Renter-occupied |
| Less than $5,000 | 138 (2.1%) | 41 (3.2%) |
| $5,000 to $9,999 | 58 (0.9%) | 0 (0.0%) |
| $10,000 to $14,999 | 68 (1.0%) | 68 (5.3%) |
| $15,000 to $19,999 | 86 (1.3%) | 29 (2.2%) |
| $20,000 to $24,999 | 52 (0.8%) | 68 (5.3%) |
| $25,000 to $34,999 | 194 (2.9%) | 22 (1.7%) |
| $35,000 to $49,999 | 323 (4.9%) | 155 (12.0%) |
| $50,000 to $74,999 | 427 (6.5%) | 99 (7.7%) |
| $75,000 to $99,999 | 562 (8.5%) | 159 (12.3%) |
| $100,000 to $149,999 | 1,164 (17.6%) | 255 (19.8%) |
| $150,000 or more | 3,522 (53.4%) | 393 (30.5%) |
| Total | 6,594 (100.0%) | 1,289 (100.0%) |
Monthly Housing Cost Tiers in Huntington
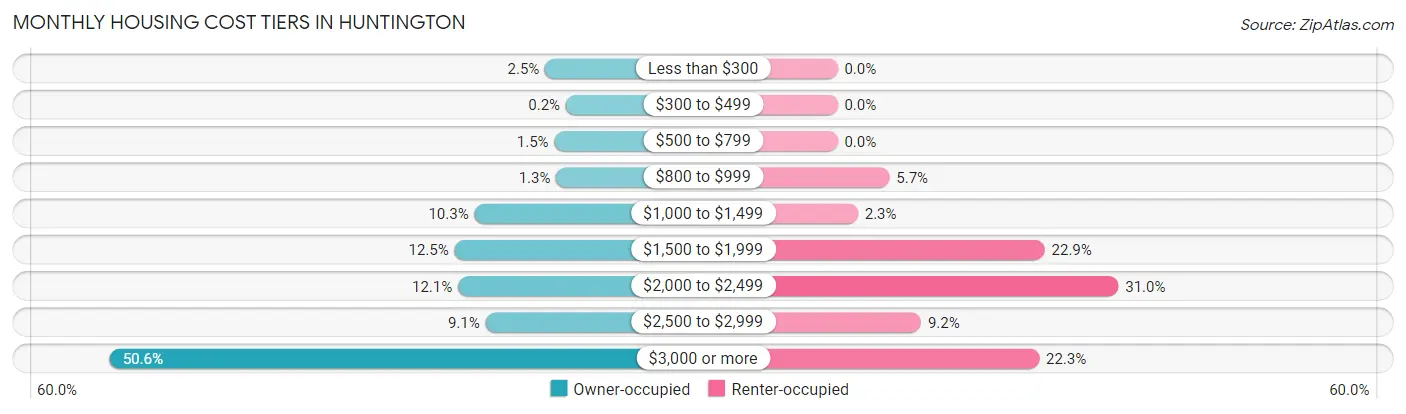
| Monthly Cost | Owner-occupied | Renter-occupied |
| Less than $300 | 164 (2.5%) | 0 (0.0%) |
| $300 to $499 | 13 (0.2%) | 0 (0.0%) |
| $500 to $799 | 97 (1.5%) | 0 (0.0%) |
| $800 to $999 | 83 (1.3%) | 74 (5.7%) |
| $1,000 to $1,499 | 679 (10.3%) | 29 (2.2%) |
| $1,500 to $1,999 | 824 (12.5%) | 295 (22.9%) |
| $2,000 to $2,499 | 799 (12.1%) | 400 (31.0%) |
| $2,500 to $2,999 | 599 (9.1%) | 119 (9.2%) |
| $3,000 or more | 3,336 (50.6%) | 287 (22.3%) |
| Total | 6,594 (100.0%) | 1,289 (100.0%) |
Physical Housing Characteristics in Huntington
Housing Structures in Huntington
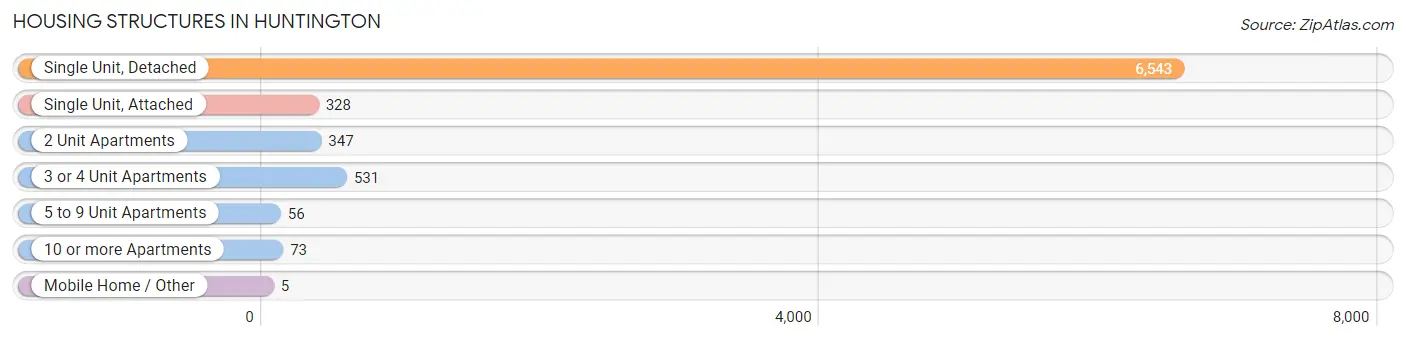
| Structure Type | # Housing Units | % Housing Units |
| Single Unit, Detached | 6,543 | 83.0% |
| Single Unit, Attached | 328 | 4.2% |
| 2 Unit Apartments | 347 | 4.4% |
| 3 or 4 Unit Apartments | 531 | 6.7% |
| 5 to 9 Unit Apartments | 56 | 0.7% |
| 10 or more Apartments | 73 | 0.9% |
| Mobile Home / Other | 5 | 0.1% |
| Total | 7,883 | 100.0% |
Housing Structures by Occupancy in Huntington
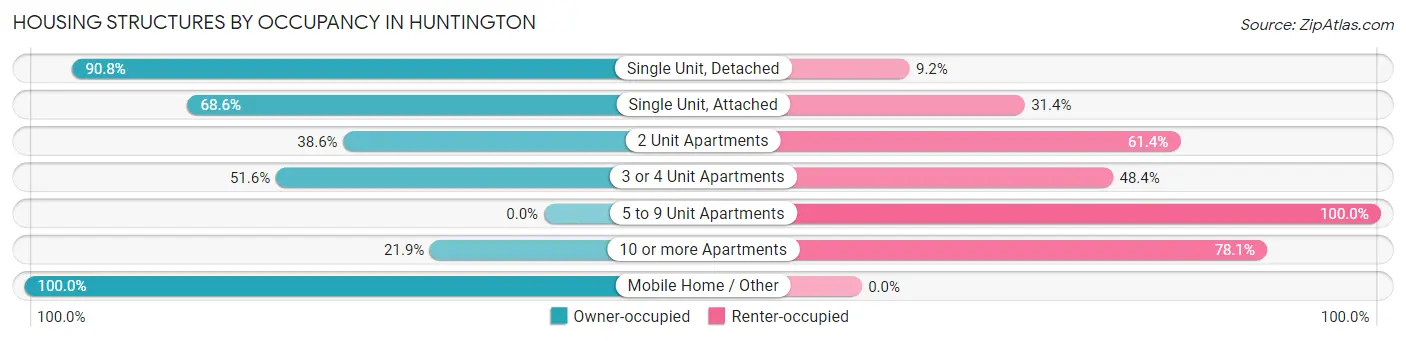
| Structure Type | Owner-occupied | Renter-occupied |
| Single Unit, Detached | 5,940 (90.8%) | 603 (9.2%) |
| Single Unit, Attached | 225 (68.6%) | 103 (31.4%) |
| 2 Unit Apartments | 134 (38.6%) | 213 (61.4%) |
| 3 or 4 Unit Apartments | 274 (51.6%) | 257 (48.4%) |
| 5 to 9 Unit Apartments | 0 (0.0%) | 56 (100.0%) |
| 10 or more Apartments | 16 (21.9%) | 57 (78.1%) |
| Mobile Home / Other | 5 (100.0%) | 0 (0.0%) |
| Total | 6,594 (83.7%) | 1,289 (16.4%) |
Housing Structures by Number of Rooms in Huntington
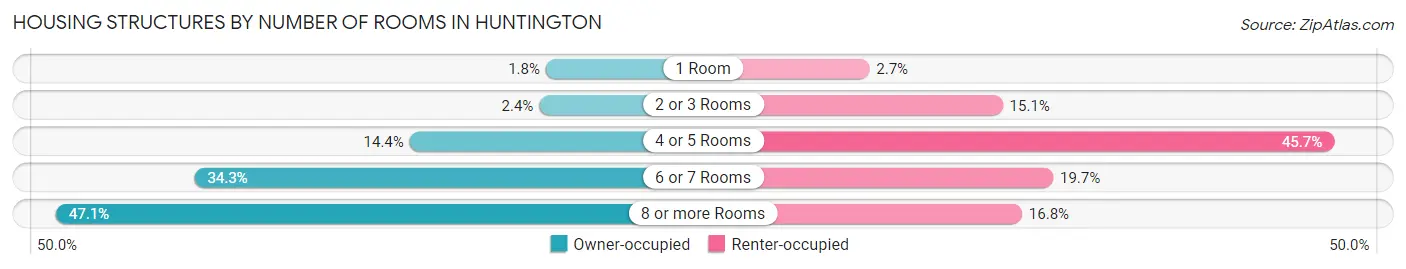
| Number of Rooms | Owner-occupied | Renter-occupied |
| 1 Room | 119 (1.8%) | 35 (2.7%) |
| 2 or 3 Rooms | 159 (2.4%) | 194 (15.0%) |
| 4 or 5 Rooms | 949 (14.4%) | 589 (45.7%) |
| 6 or 7 Rooms | 2,261 (34.3%) | 254 (19.7%) |
| 8 or more Rooms | 3,106 (47.1%) | 217 (16.8%) |
| Total | 6,594 (100.0%) | 1,289 (100.0%) |
Housing Structure by Heating Type in Huntington
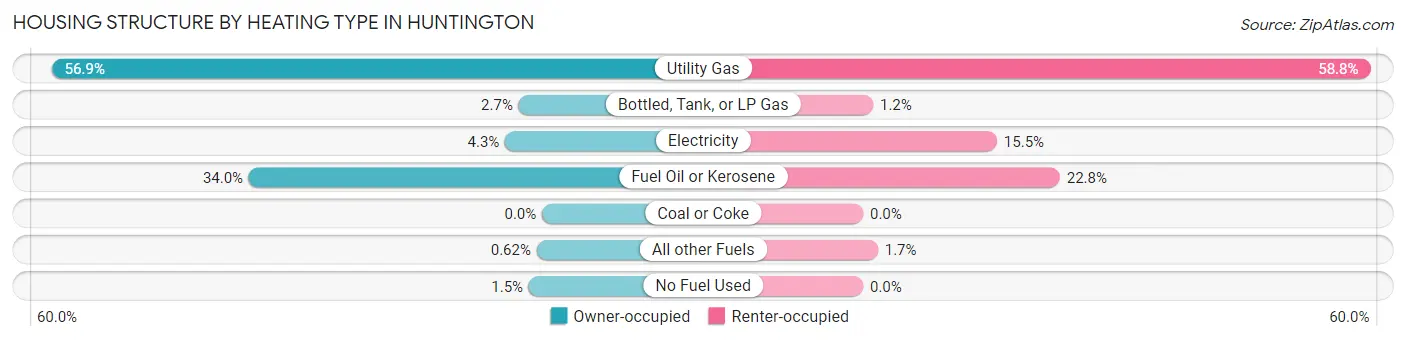
| Heating Type | Owner-occupied | Renter-occupied |
| Utility Gas | 3,750 (56.9%) | 758 (58.8%) |
| Bottled, Tank, or LP Gas | 179 (2.7%) | 15 (1.2%) |
| Electricity | 282 (4.3%) | 200 (15.5%) |
| Fuel Oil or Kerosene | 2,241 (34.0%) | 294 (22.8%) |
| Coal or Coke | 0 (0.0%) | 0 (0.0%) |
| All other Fuels | 41 (0.6%) | 22 (1.7%) |
| No Fuel Used | 101 (1.5%) | 0 (0.0%) |
| Total | 6,594 (100.0%) | 1,289 (100.0%) |
Household Vehicle Usage in Huntington
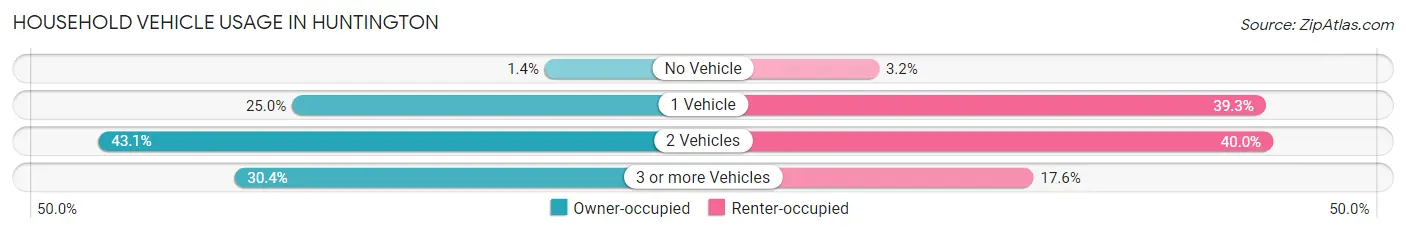
| Vehicles per Household | Owner-occupied | Renter-occupied |
| No Vehicle | 95 (1.4%) | 41 (3.2%) |
| 1 Vehicle | 1,651 (25.0%) | 506 (39.3%) |
| 2 Vehicles | 2,843 (43.1%) | 515 (40.0%) |
| 3 or more Vehicles | 2,005 (30.4%) | 227 (17.6%) |
| Total | 6,594 (100.0%) | 1,289 (100.0%) |
Real Estate & Mortgages in Huntington
Real Estate and Mortgage Overview in Huntington
| Characteristic | Without Mortgage | With Mortgage |
| Housing Units | 2,520 | 4,074 |
| Median Property Value | $685,600 | $711,000 |
| Median Household Income | $129,375 | $2,388 |
| Monthly Housing Costs | $1,501 | $3,196 |
| Real Estate Taxes | $10,001 | $69 |
Property Value by Mortgage Status in Huntington
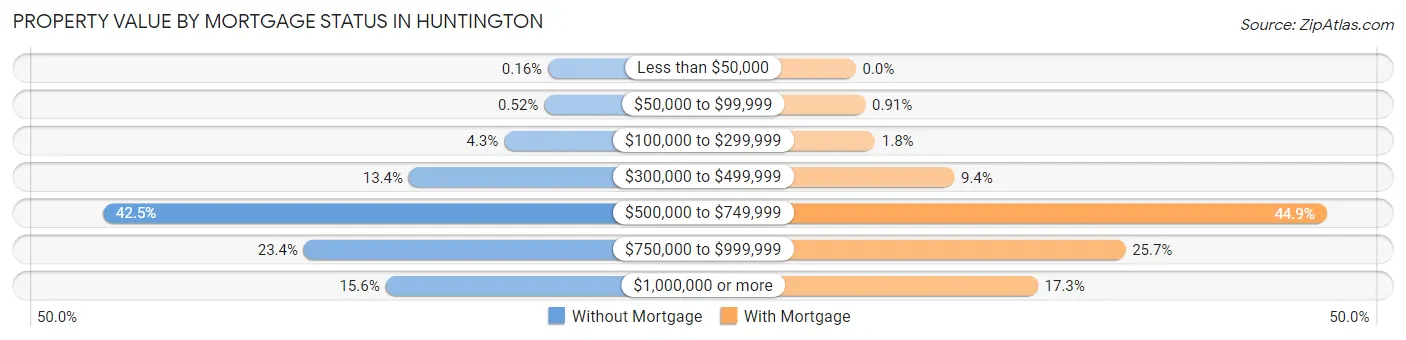
| Property Value | Without Mortgage | With Mortgage |
| Less than $50,000 | 4 (0.2%) | 0 (0.0%) |
| $50,000 to $99,999 | 13 (0.5%) | 37 (0.9%) |
| $100,000 to $299,999 | 109 (4.3%) | 75 (1.8%) |
| $300,000 to $499,999 | 338 (13.4%) | 382 (9.4%) |
| $500,000 to $749,999 | 1,072 (42.5%) | 1,828 (44.9%) |
| $750,000 to $999,999 | 590 (23.4%) | 1,046 (25.7%) |
| $1,000,000 or more | 394 (15.6%) | 706 (17.3%) |
| Total | 2,520 (100.0%) | 4,074 (100.0%) |
Household Income by Mortgage Status in Huntington
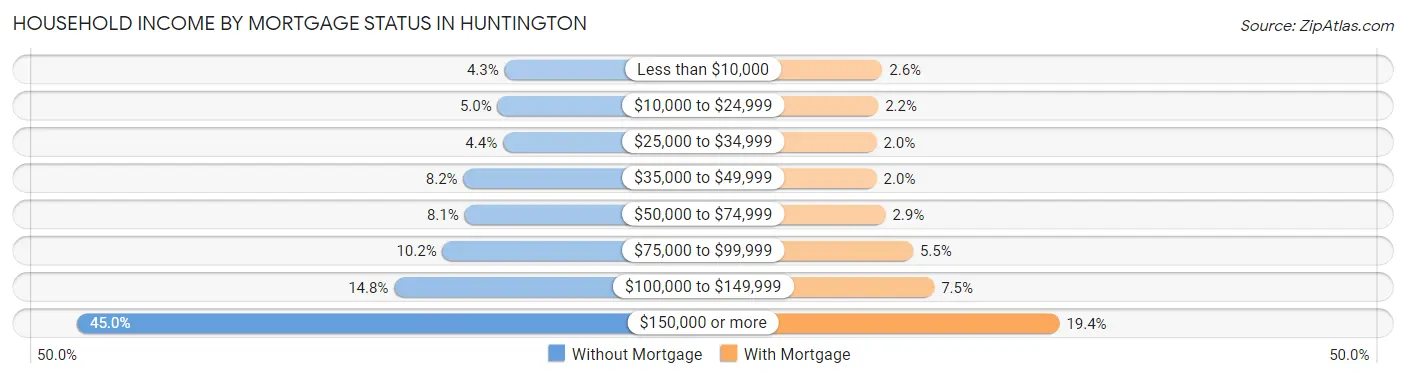
| Household Income | Without Mortgage | With Mortgage |
| Less than $10,000 | 108 (4.3%) | 104 (2.5%) |
| $10,000 to $24,999 | 125 (5.0%) | 88 (2.2%) |
| $25,000 to $34,999 | 112 (4.4%) | 81 (2.0%) |
| $35,000 to $49,999 | 207 (8.2%) | 82 (2.0%) |
| $50,000 to $74,999 | 204 (8.1%) | 116 (2.9%) |
| $75,000 to $99,999 | 257 (10.2%) | 223 (5.5%) |
| $100,000 to $149,999 | 373 (14.8%) | 305 (7.5%) |
| $150,000 or more | 1,134 (45.0%) | 791 (19.4%) |
| Total | 2,520 (100.0%) | 4,074 (100.0%) |
Property Value to Household Income Ratio in Huntington
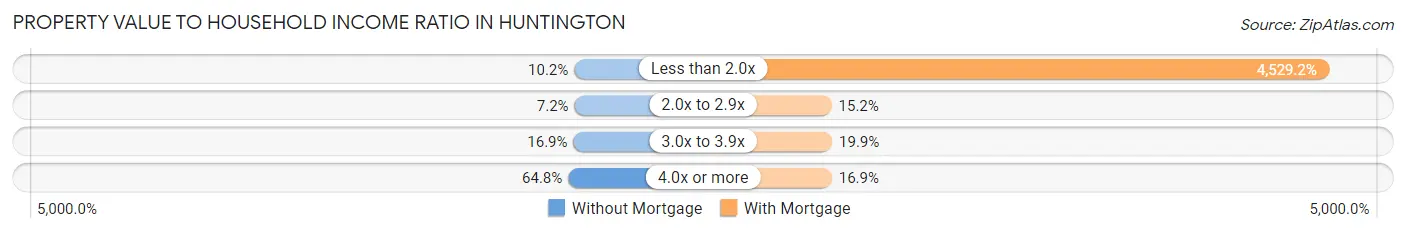
| Value-to-Income Ratio | Without Mortgage | With Mortgage |
| Less than 2.0x | 256 (10.2%) | 184,519 (4,529.2%) |
| 2.0x to 2.9x | 182 (7.2%) | 618 (15.2%) |
| 3.0x to 3.9x | 426 (16.9%) | 810 (19.9%) |
| 4.0x or more | 1,632 (64.8%) | 687 (16.9%) |
| Total | 2,520 (100.0%) | 4,074 (100.0%) |
Real Estate Taxes by Mortgage Status in Huntington
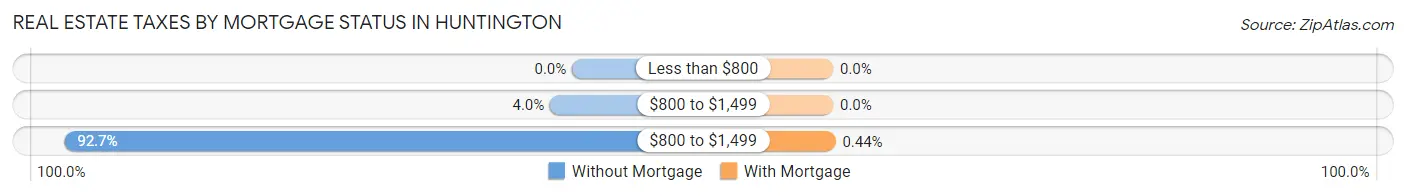
| Property Taxes | Without Mortgage | With Mortgage |
| Less than $800 | 0 (0.0%) | 0 (0.0%) |
| $800 to $1,499 | 101 (4.0%) | 0 (0.0%) |
| $800 to $1,499 | 2,337 (92.7%) | 18 (0.4%) |
| Total | 2,520 (100.0%) | 4,074 (100.0%) |
Health & Disability in Huntington
Health Insurance Coverage by Age in Huntington
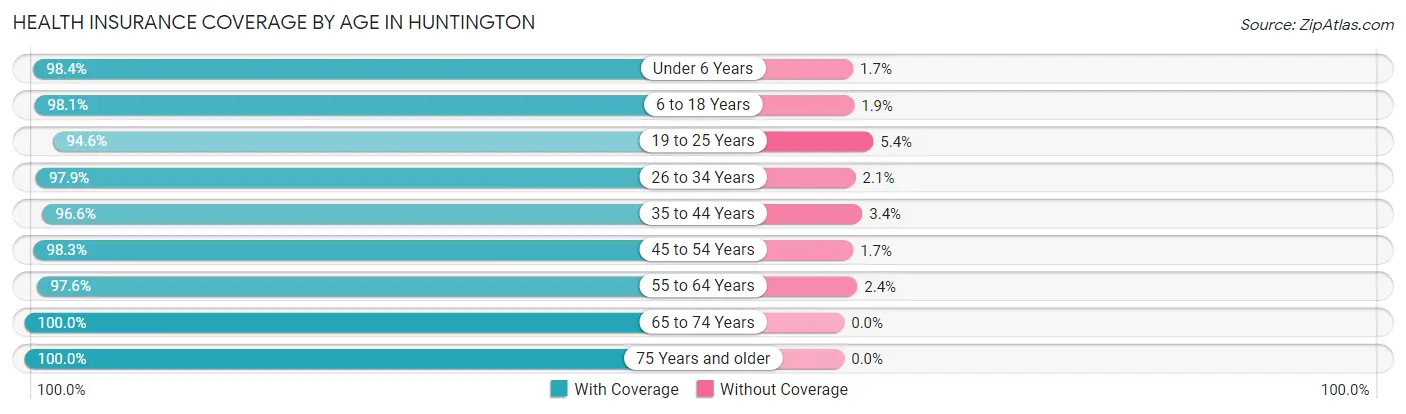
| Age Bracket | With Coverage | Without Coverage |
| Under 6 Years | 893 (98.4%) | 15 (1.7%) |
| 6 to 18 Years | 2,579 (98.1%) | 49 (1.9%) |
| 19 to 25 Years | 1,343 (94.6%) | 77 (5.4%) |
| 26 to 34 Years | 1,986 (97.9%) | 43 (2.1%) |
| 35 to 44 Years | 1,982 (96.6%) | 69 (3.4%) |
| 45 to 54 Years | 2,766 (98.3%) | 47 (1.7%) |
| 55 to 64 Years | 3,206 (97.6%) | 80 (2.4%) |
| 65 to 74 Years | 2,939 (100.0%) | 0 (0.0%) |
| 75 Years and older | 1,481 (100.0%) | 0 (0.0%) |
| Total | 19,175 (98.1%) | 380 (1.9%) |
Health Insurance Coverage by Citizenship Status in Huntington
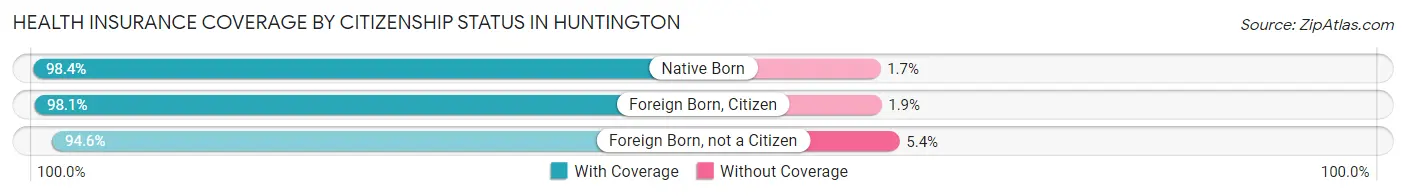
| Citizenship Status | With Coverage | Without Coverage |
| Native Born | 893 (98.4%) | 15 (1.7%) |
| Foreign Born, Citizen | 2,579 (98.1%) | 49 (1.9%) |
| Foreign Born, not a Citizen | 1,343 (94.6%) | 77 (5.4%) |
Health Insurance Coverage by Household Income in Huntington
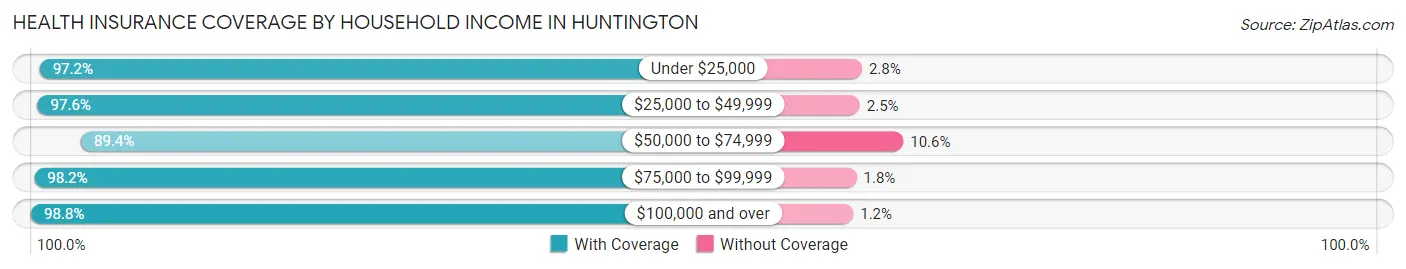
| Household Income | With Coverage | Without Coverage |
| Under $25,000 | 1,094 (97.2%) | 32 (2.8%) |
| $25,000 to $49,999 | 1,351 (97.6%) | 34 (2.5%) |
| $50,000 to $74,999 | 937 (89.4%) | 111 (10.6%) |
| $75,000 to $99,999 | 1,390 (98.2%) | 26 (1.8%) |
| $100,000 and over | 14,285 (98.8%) | 176 (1.2%) |
Public vs Private Health Insurance Coverage by Age in Huntington
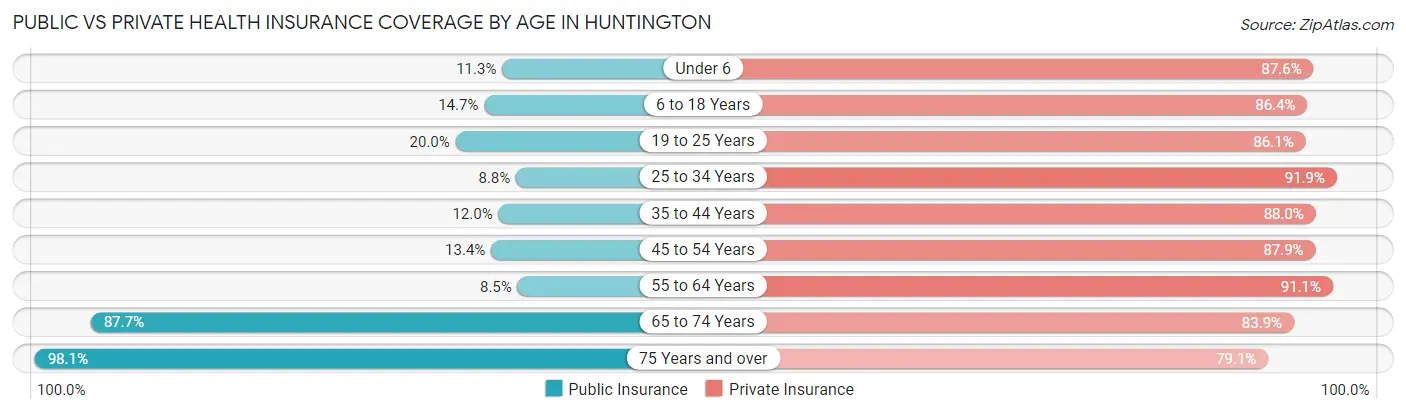
| Age Bracket | Public Insurance | Private Insurance |
| Under 6 | 103 (11.3%) | 795 (87.6%) |
| 6 to 18 Years | 386 (14.7%) | 2,271 (86.4%) |
| 19 to 25 Years | 284 (20.0%) | 1,222 (86.1%) |
| 25 to 34 Years | 178 (8.8%) | 1,864 (91.9%) |
| 35 to 44 Years | 247 (12.0%) | 1,804 (88.0%) |
| 45 to 54 Years | 377 (13.4%) | 2,473 (87.9%) |
| 55 to 64 Years | 279 (8.5%) | 2,995 (91.1%) |
| 65 to 74 Years | 2,578 (87.7%) | 2,466 (83.9%) |
| 75 Years and over | 1,453 (98.1%) | 1,172 (79.1%) |
| Total | 5,885 (30.1%) | 17,062 (87.3%) |
Disability Status by Sex by Age in Huntington
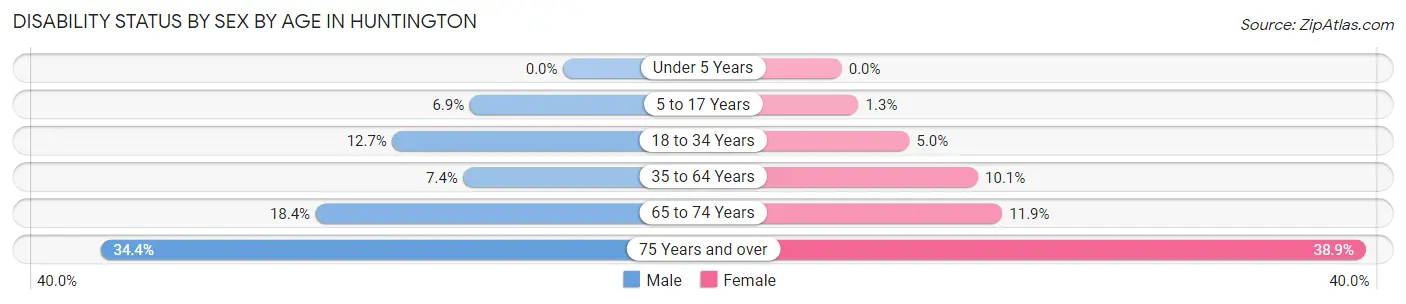
| Age Bracket | Male | Female |
| Under 5 Years | 0 (0.0%) | 0 (0.0%) |
| 5 to 17 Years | 105 (6.9%) | 14 (1.3%) |
| 18 to 34 Years | 191 (12.7%) | 109 (5.0%) |
| 35 to 64 Years | 293 (7.4%) | 424 (10.1%) |
| 65 to 74 Years | 264 (18.4%) | 179 (11.9%) |
| 75 Years and over | 235 (34.4%) | 310 (38.9%) |
Disability Class by Sex by Age in Huntington
Disability Class: Hearing Difficulty
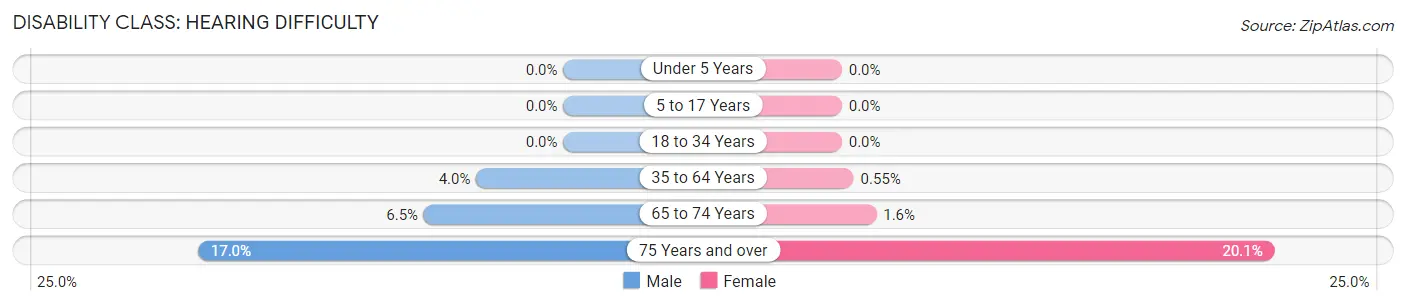
| Age Bracket | Male | Female |
| Under 5 Years | 0 (0.0%) | 0 (0.0%) |
| 5 to 17 Years | 0 (0.0%) | 0 (0.0%) |
| 18 to 34 Years | 0 (0.0%) | 0 (0.0%) |
| 35 to 64 Years | 160 (4.0%) | 23 (0.5%) |
| 65 to 74 Years | 93 (6.5%) | 24 (1.6%) |
| 75 Years and over | 116 (17.0%) | 160 (20.1%) |
Disability Class: Vision Difficulty
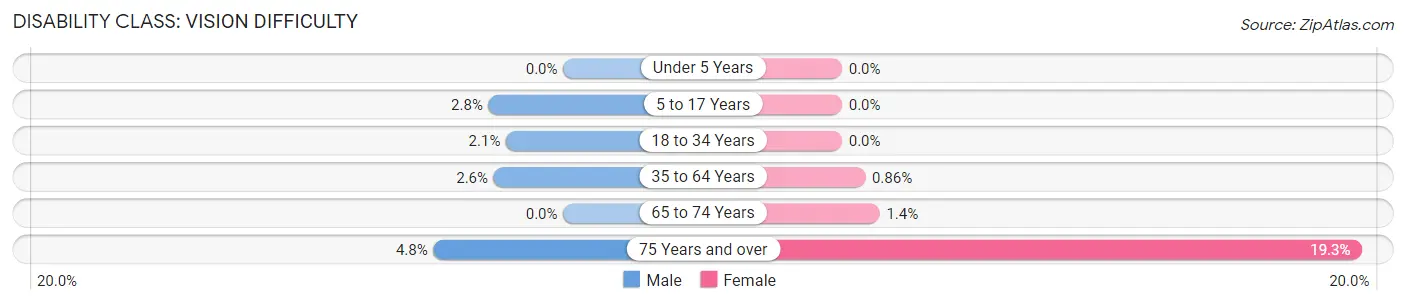
| Age Bracket | Male | Female |
| Under 5 Years | 0 (0.0%) | 0 (0.0%) |
| 5 to 17 Years | 42 (2.8%) | 0 (0.0%) |
| 18 to 34 Years | 32 (2.1%) | 0 (0.0%) |
| 35 to 64 Years | 102 (2.6%) | 36 (0.9%) |
| 65 to 74 Years | 0 (0.0%) | 21 (1.4%) |
| 75 Years and over | 33 (4.8%) | 154 (19.3%) |
Disability Class: Cognitive Difficulty
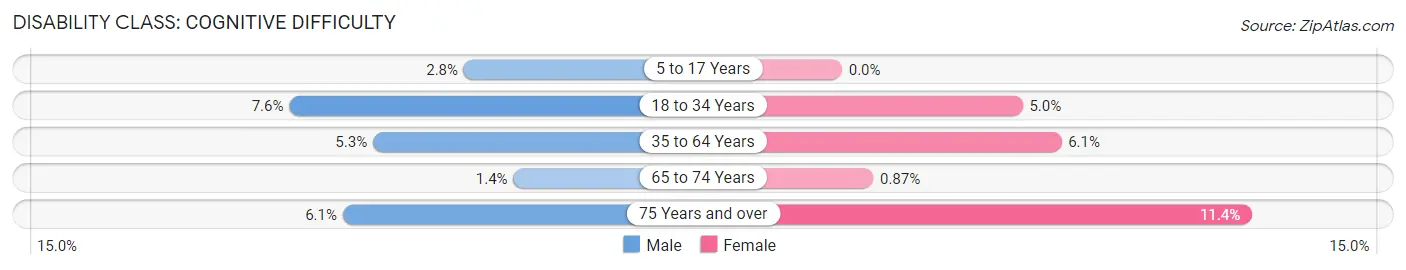
| Age Bracket | Male | Female |
| 5 to 17 Years | 42 (2.8%) | 0 (0.0%) |
| 18 to 34 Years | 115 (7.6%) | 109 (5.0%) |
| 35 to 64 Years | 210 (5.3%) | 256 (6.1%) |
| 65 to 74 Years | 20 (1.4%) | 13 (0.9%) |
| 75 Years and over | 42 (6.1%) | 91 (11.4%) |
Disability Class: Ambulatory Difficulty
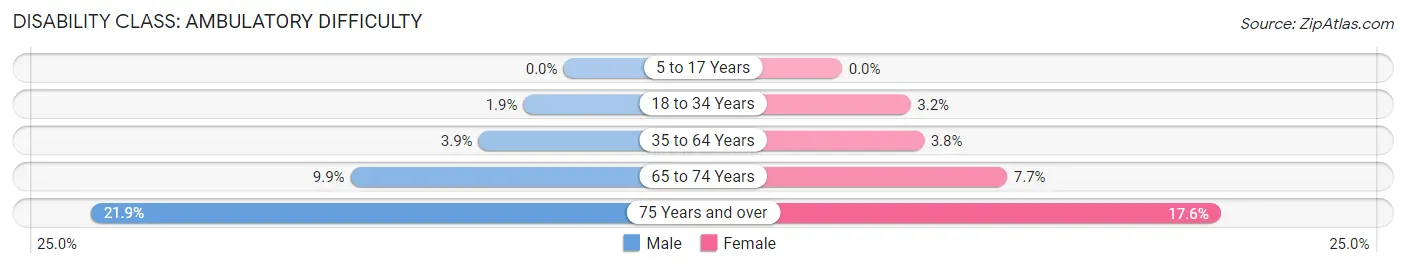
| Age Bracket | Male | Female |
| 5 to 17 Years | 0 (0.0%) | 0 (0.0%) |
| 18 to 34 Years | 28 (1.9%) | 69 (3.2%) |
| 35 to 64 Years | 156 (3.9%) | 159 (3.8%) |
| 65 to 74 Years | 142 (9.9%) | 115 (7.7%) |
| 75 Years and over | 150 (21.9%) | 140 (17.6%) |
Disability Class: Self-Care Difficulty
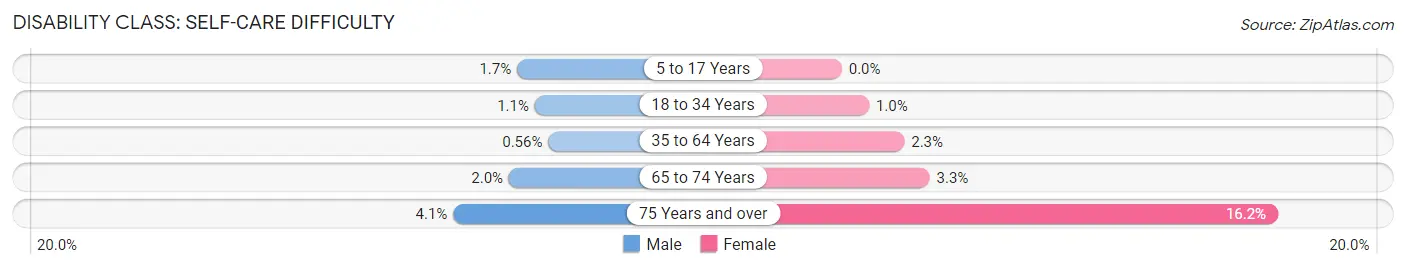
| Age Bracket | Male | Female |
| 5 to 17 Years | 26 (1.7%) | 0 (0.0%) |
| 18 to 34 Years | 16 (1.1%) | 22 (1.0%) |
| 35 to 64 Years | 22 (0.6%) | 97 (2.3%) |
| 65 to 74 Years | 29 (2.0%) | 49 (3.3%) |
| 75 Years and over | 28 (4.1%) | 129 (16.2%) |
Technology Access in Huntington
Computing Device Access in Huntington
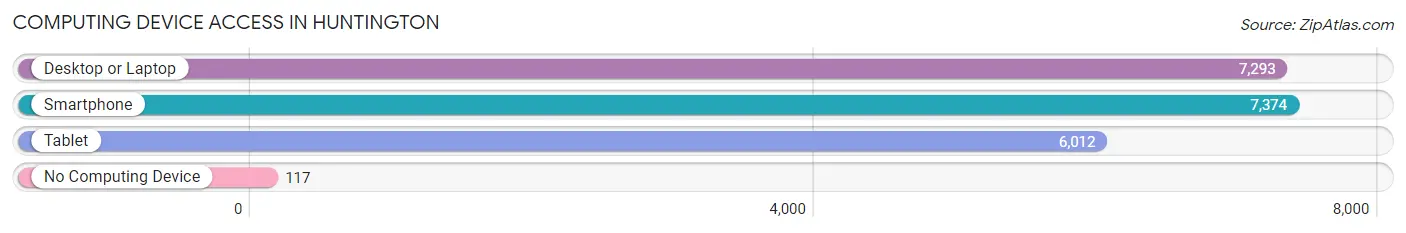
| Device Type | # Households | % Households |
| Desktop or Laptop | 7,293 | 92.5% |
| Smartphone | 7,374 | 93.5% |
| Tablet | 6,012 | 76.3% |
| No Computing Device | 117 | 1.5% |
| Total | 7,883 | 100.0% |
Internet Access in Huntington
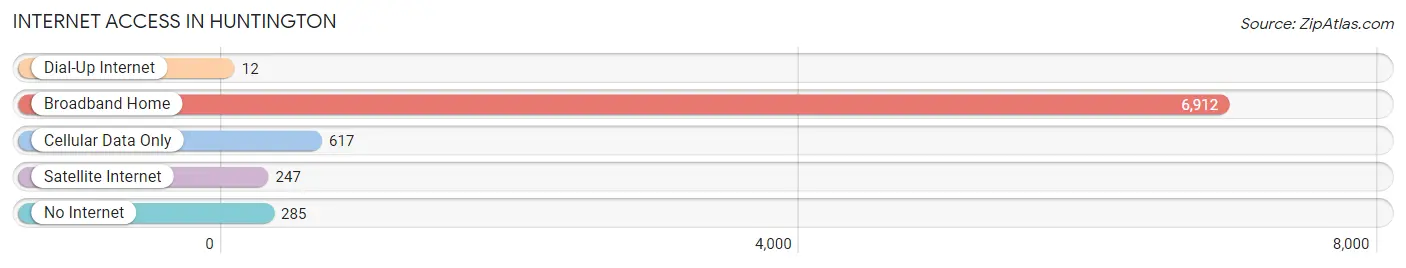
| Internet Type | # Households | % Households |
| Dial-Up Internet | 12 | 0.2% |
| Broadband Home | 6,912 | 87.7% |
| Cellular Data Only | 617 | 7.8% |
| Satellite Internet | 247 | 3.1% |
| No Internet | 285 | 3.6% |
| Total | 7,883 | 100.0% |
Huntington Summary
Huntington, NY is a town located in Suffolk County, New York, United States. It is situated on the north shore of Long Island, and is part of the New York metropolitan area. The town was founded in 1653 by three English settlers, and was named after the English nobleman, Samuel Huntington.
Geography
Huntington is located in the northeast corner of Suffolk County, and is bordered by the towns of Smithtown, Babylon, Islip, and Oyster Bay. The town is situated on the north shore of Long Island, and is part of the New York metropolitan area. The town covers an area of approximately 95 square miles, and has a population of approximately 200,000 people.
The town is divided into several distinct neighborhoods, including Huntington Station, Huntington Bay, Huntington Woods, Huntington Village, and Northport. The town is also home to several parks, including Heckscher State Park, Caumsett State Historic Park, and the Cold Spring Harbor State Park.
History
Huntington was founded in 1653 by three English settlers, and was named after the English nobleman, Samuel Huntington. The town was originally part of the Town of Oyster Bay, and was later incorporated as a separate town in 1788.
During the American Revolution, Huntington was a major center of activity, and was the site of several battles. After the war, the town experienced a period of growth and prosperity, and became a popular summer resort destination.
In the late 19th century, the town experienced a period of industrialization, and several factories were built in the area. The town also became a popular destination for immigrants, and by the early 20th century, the population had grown to over 10,000 people.
Economy
Huntington is a major economic center in Suffolk County, and is home to several large corporations, including Canon USA, Northrop Grumman, and Estee Lauder. The town is also home to several smaller businesses, including restaurants, retail stores, and professional services.
The town is also home to several educational institutions, including the State University of New York at Stony Brook, Dowling College, and Touro College.
Demographics
As of the 2010 census, the population of Huntington was 203,264. The racial makeup of the town was 79.2% White, 8.3% African American, 0.3% Native American, 5.2% Asian, 0.1% Pacific Islander, 4.2% from other races, and 2.7% from two or more races. Hispanic or Latino of any race were 11.3% of the population.
The median income for a household in the town was $90,837, and the median income for a family was $106,837. The per capita income for the town was $41,845.
Conclusion
Huntington, NY is a town located in Suffolk County, New York, United States. It is situated on the north shore of Long Island, and is part of the New York metropolitan area. The town was founded in 1653 by three English settlers, and was named after the English nobleman, Samuel Huntington. The town is divided into several distinct neighborhoods, and is home to several parks, businesses, and educational institutions. As of the 2010 census, the population of Huntington was 203,264, and the median income for a household in the town was $90,837.
Common Questions
What is Per Capita Income in Huntington?
Per Capita income in Huntington is $78,708.
What is the Median Family Income in Huntington?
Median Family Income in Huntington is $178,798.
What is the Median Household income in Huntington?
Median Household Income in Huntington is $148,858.
What is Income or Wage Gap in Huntington?
Income or Wage Gap in Huntington is 49.3%.
Women in Huntington earn 50.7 cents for every dollar earned by a man.
What is Family Income Deficit in Huntington?
Family Income Deficit in Huntington is $12,632.
Families that are below poverty line in Huntington earn $12,632 less on average than the poverty threshold level.
What is Inequality or Gini Index in Huntington?
Inequality or Gini Index in Huntington is 0.45.
What is the Total Population of Huntington?
Total Population of Huntington is 19,610.
What is the Total Male Population of Huntington?
Total Male Population of Huntington is 9,516.
What is the Total Female Population of Huntington?
Total Female Population of Huntington is 10,094.
What is the Ratio of Males per 100 Females in Huntington?
There are 94.27 Males per 100 Females in Huntington.
What is the Ratio of Females per 100 Males in Huntington?
There are 106.07 Females per 100 Males in Huntington.
What is the Median Population Age in Huntington?
Median Population Age in Huntington is 48.4 Years.
What is the Average Family Size in Huntington
Average Family Size in Huntington is 3.0 People.
What is the Average Household Size in Huntington
Average Household Size in Huntington is 2.5 People.
How Large is the Labor Force in Huntington?
There are 11,347 People in the Labor Forcein in Huntington.
What is the Percentage of People in the Labor Force in Huntington?
67.7% of People are in the Labor Force in Huntington.
What is the Unemployment Rate in Huntington?
Unemployment Rate in Huntington is 5.1%.