Cambridge, NY Map & Demographics
Cambridge Map
Cambridge Overview
$32,822
PER CAPITA INCOME
$72,250
AVG FAMILY INCOME
$57,880
AVG HOUSEHOLD INCOME
36.9%
WAGE / INCOME GAP [ % ]
63.1¢/ $1
WAGE / INCOME GAP [ $ ]
0.45
INEQUALITY / GINI INDEX
2,390
TOTAL POPULATION
937
MALE POPULATION
1,453
FEMALE POPULATION
64.49
MALES / 100 FEMALES
155.07
FEMALES / 100 MALES
48.0
MEDIAN AGE
2.9
AVG FAMILY SIZE
2.4
AVG HOUSEHOLD SIZE
1,121
LABOR FORCE [ PEOPLE ]
55.0%
PERCENT IN LABOR FORCE
5.5%
UNEMPLOYMENT RATE
Cambridge Zip Codes
Cambridge Area Codes
Income in Cambridge
Income Overview in Cambridge
Per Capita Income in Cambridge is $32,822, while median incomes of families and households are $72,250 and $57,880 respectively.
| Characteristic | Number | Measure |
| Per Capita Income | 2,390 | $32,822 |
| Median Family Income | 579 | $72,250 |
| Mean Family Income | 579 | $91,846 |
| Median Household Income | 999 | $57,880 |
| Mean Household Income | 999 | $76,346 |
| Income Deficit | 579 | $0 |
| Wage / Income Gap (%) | 2,390 | 36.95% |
| Wage / Income Gap ($) | 2,390 | 63.05¢ per $1 |
| Gini / Inequality Index | 2,390 | 0.45 |
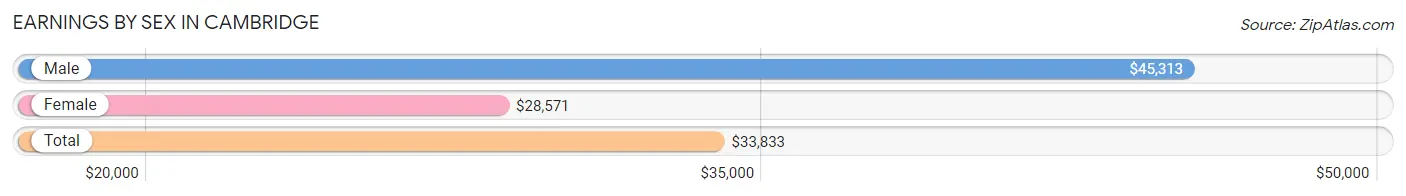
Earnings by Sex in Cambridge
Average Earnings in Cambridge are $33,833, $45,313 for men and $28,571 for women, a difference of 36.9%.
| Sex | Number | Average Earnings |
| Male | 562 (45.0%) | $45,313 |
| Female | 688 (55.0%) | $28,571 |
| Total | 1,250 (100.0%) | $33,833 |
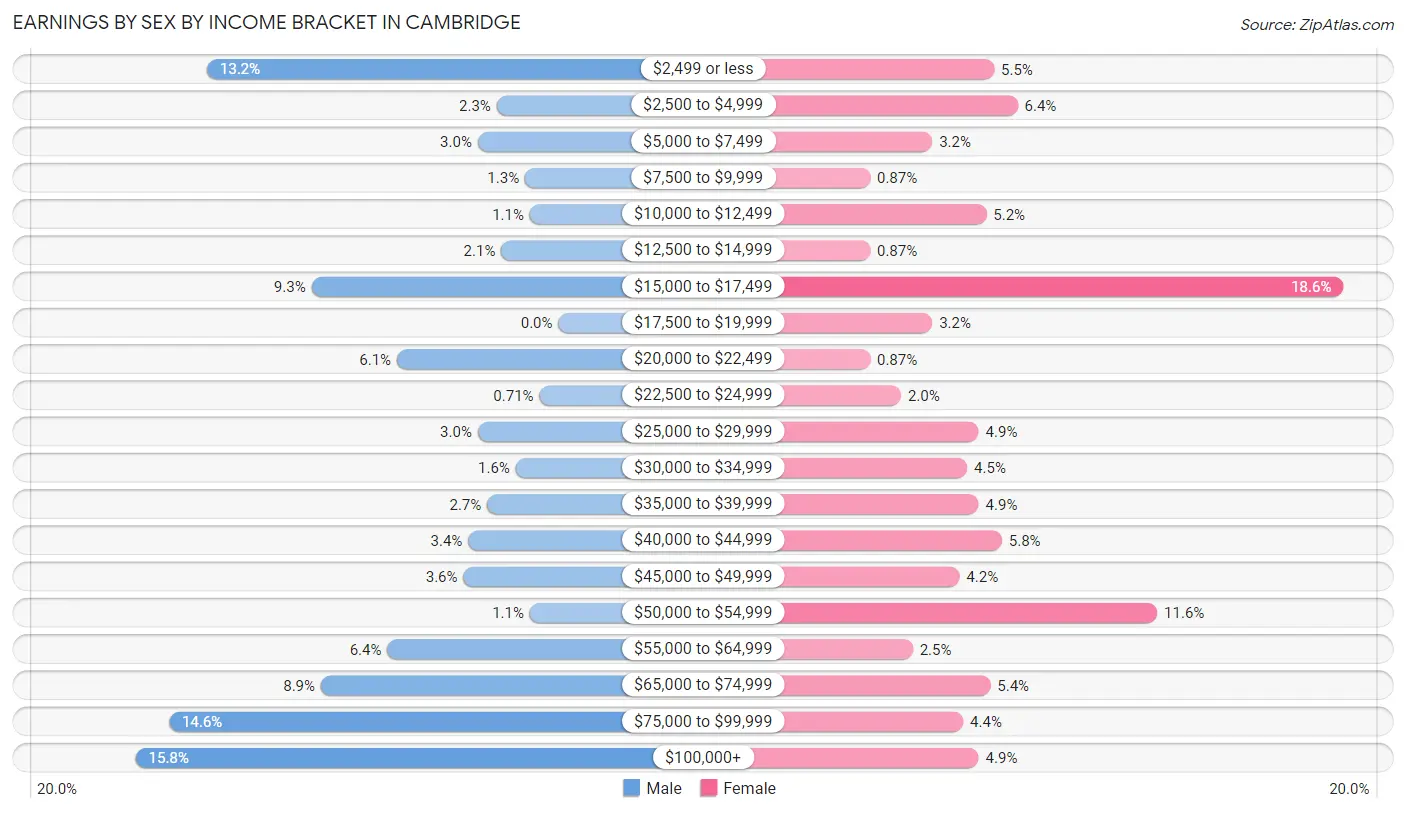
Earnings by Sex by Income Bracket in Cambridge
The most common earnings brackets in Cambridge are $100,000+ for men (89 | 15.8%) and $15,000 to $17,499 for women (128 | 18.6%).
| Income | Male | Female |
| $2,499 or less | 74 (13.2%) | 38 (5.5%) |
| $2,500 to $4,999 | 13 (2.3%) | 44 (6.4%) |
| $5,000 to $7,499 | 17 (3.0%) | 22 (3.2%) |
| $7,500 to $9,999 | 7 (1.3%) | 6 (0.9%) |
| $10,000 to $12,499 | 6 (1.1%) | 36 (5.2%) |
| $12,500 to $14,999 | 12 (2.1%) | 6 (0.9%) |
| $15,000 to $17,499 | 52 (9.2%) | 128 (18.6%) |
| $17,500 to $19,999 | 0 (0.0%) | 22 (3.2%) |
| $20,000 to $22,499 | 34 (6.0%) | 6 (0.9%) |
| $22,500 to $24,999 | 4 (0.7%) | 14 (2.0%) |
| $25,000 to $29,999 | 17 (3.0%) | 34 (4.9%) |
| $30,000 to $34,999 | 9 (1.6%) | 31 (4.5%) |
| $35,000 to $39,999 | 15 (2.7%) | 34 (4.9%) |
| $40,000 to $44,999 | 19 (3.4%) | 40 (5.8%) |
| $45,000 to $49,999 | 20 (3.6%) | 29 (4.2%) |
| $50,000 to $54,999 | 6 (1.1%) | 80 (11.6%) |
| $55,000 to $64,999 | 36 (6.4%) | 17 (2.5%) |
| $65,000 to $74,999 | 50 (8.9%) | 37 (5.4%) |
| $75,000 to $99,999 | 82 (14.6%) | 30 (4.4%) |
| $100,000+ | 89 (15.8%) | 34 (4.9%) |
| Total | 562 (100.0%) | 688 (100.0%) |
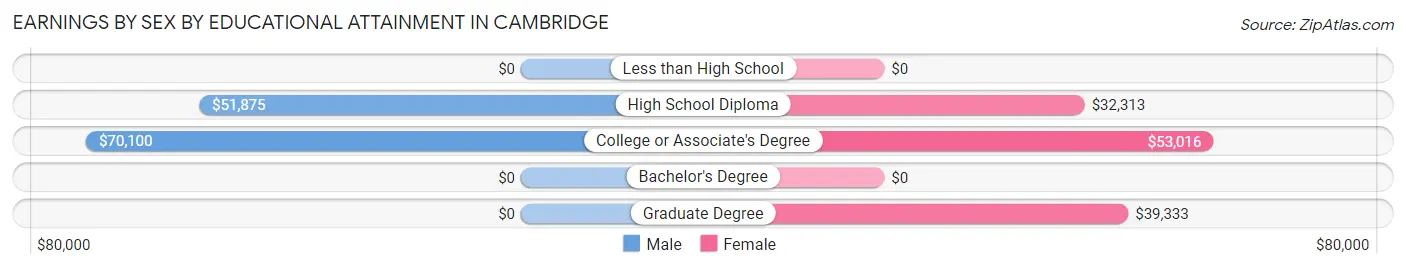
Earnings by Sex by Educational Attainment in Cambridge
Average earnings in Cambridge are $59,917 for men and $42,269 for women, a difference of 29.4%. Men with an educational attainment of college or associate's degree enjoy the highest average annual earnings of $70,100, while those with high school diploma education earn the least with $51,875. Women with an educational attainment of college or associate's degree earn the most with the average annual earnings of $53,016, while those with high school diploma education have the smallest earnings of $32,313.
| Educational Attainment | Male Income | Female Income |
| Less than High School | - | - |
| High School Diploma | $51,875 | $32,313 |
| College or Associate's Degree | $70,100 | $53,016 |
| Bachelor's Degree | - | - |
| Graduate Degree | - | - |
| Total | $59,917 | $42,269 |
Family Income in Cambridge
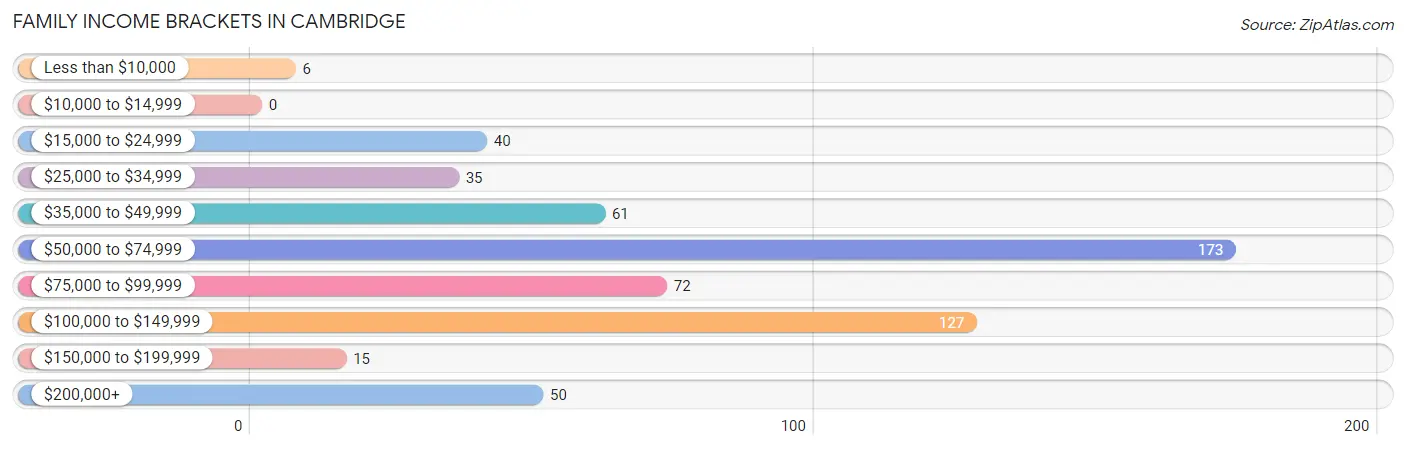
Family Income Brackets in Cambridge
According to the Cambridge family income data, there are 173 families falling into the $50,000 to $74,999 income range, which is the most common income bracket and makes up 29.9% of all families.
| Income Bracket | # Families | % Families |
| Less than $10,000 | 6 | 1.0% |
| $10,000 to $14,999 | 0 | 0.0% |
| $15,000 to $24,999 | 40 | 6.9% |
| $25,000 to $34,999 | 35 | 6.0% |
| $35,000 to $49,999 | 61 | 10.5% |
| $50,000 to $74,999 | 173 | 29.9% |
| $75,000 to $99,999 | 72 | 12.4% |
| $100,000 to $149,999 | 127 | 21.9% |
| $150,000 to $199,999 | 15 | 2.6% |
| $200,000+ | 50 | 8.6% |
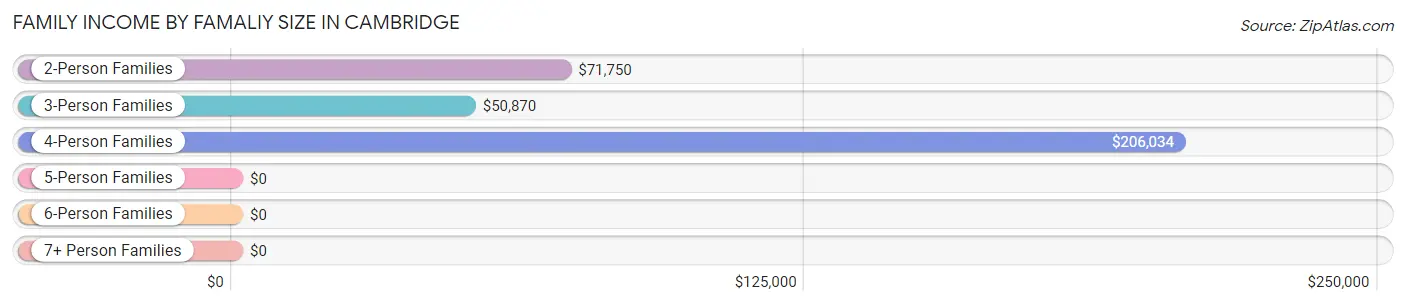
Family Income by Famaliy Size in Cambridge
4-person families (48 | 8.3%) account for the highest median family income in Cambridge with $206,034 per family, while 4-person families (48 | 8.3%) have the highest median income of $51,508 per family member.
| Income Bracket | # Families | Median Income |
| 2-Person Families | 333 (57.5%) | $71,750 |
| 3-Person Families | 178 (30.7%) | $50,870 |
| 4-Person Families | 48 (8.3%) | $206,034 |
| 5-Person Families | 0 (0.0%) | $0 |
| 6-Person Families | 10 (1.7%) | $0 |
| 7+ Person Families | 10 (1.7%) | $0 |
| Total | 579 (100.0%) | $72,250 |
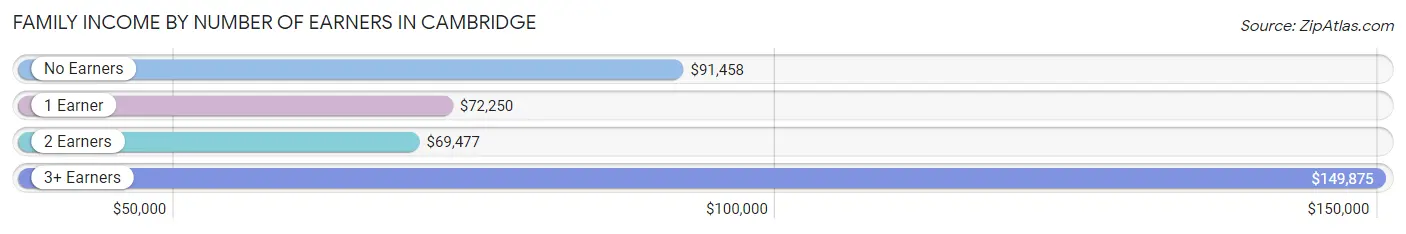
Family Income by Number of Earners in Cambridge
The median family income in Cambridge is $72,250, with families comprising 3+ earners (71) having the highest median family income of $149,875, while families with 2 earners (218) have the lowest median family income of $69,477, accounting for 12.3% and 37.7% of families, respectively.
| Number of Earners | # Families | Median Income |
| No Earners | 51 (8.8%) | $91,458 |
| 1 Earner | 239 (41.3%) | $72,250 |
| 2 Earners | 218 (37.7%) | $69,477 |
| 3+ Earners | 71 (12.3%) | $149,875 |
| Total | 579 (100.0%) | $72,250 |
Household Income in Cambridge
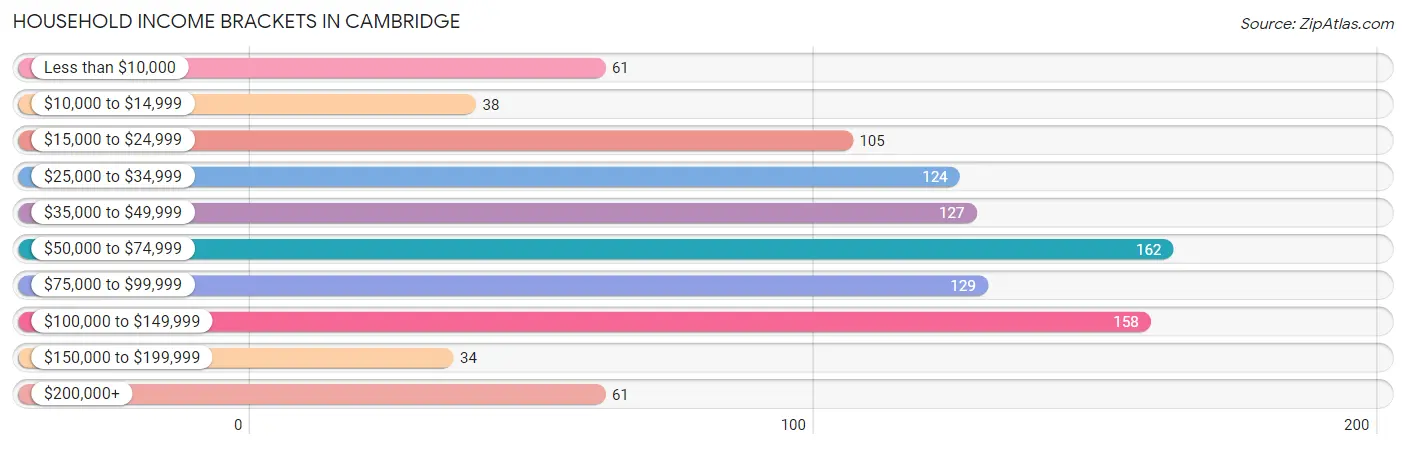
Household Income Brackets in Cambridge
With 162 households falling in the category, the $50,000 to $74,999 income range is the most frequent in Cambridge, accounting for 16.2% of all households. In contrast, only 34 households (3.4%) fall into the $150,000 to $199,999 income bracket, making it the least populous group.
| Income Bracket | # Households | % Households |
| Less than $10,000 | 61 | 6.1% |
| $10,000 to $14,999 | 38 | 3.8% |
| $15,000 to $24,999 | 105 | 10.5% |
| $25,000 to $34,999 | 124 | 12.4% |
| $35,000 to $49,999 | 127 | 12.7% |
| $50,000 to $74,999 | 162 | 16.2% |
| $75,000 to $99,999 | 129 | 12.9% |
| $100,000 to $149,999 | 158 | 15.8% |
| $150,000 to $199,999 | 34 | 3.4% |
| $200,000+ | 61 | 6.1% |
Household Income by Householder Age in Cambridge
The median household income in Cambridge is $57,880, with the highest median household income of $95,333 found in the 25 to 44 years age bracket for the primary householder. A total of 160 households (16.0%) fall into this category. Meanwhile, the 15 to 24 years age bracket for the primary householder has the lowest median household income of $0, with 28 households (2.8%) in this group.
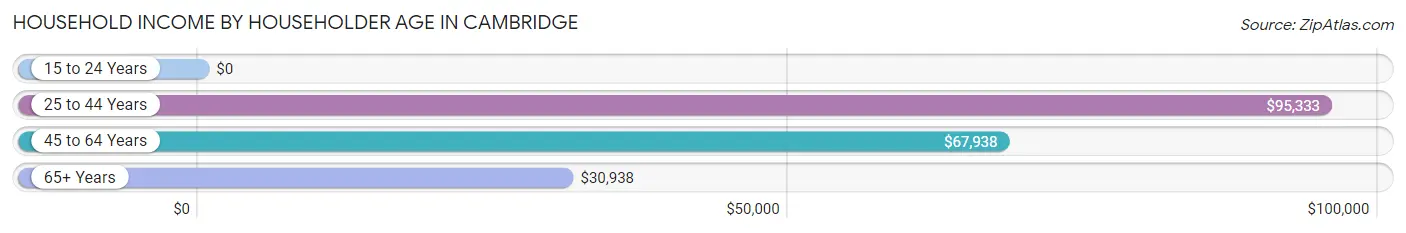
| Income Bracket | # Households | Median Income |
| 15 to 24 Years | 28 (2.8%) | $0 |
| 25 to 44 Years | 160 (16.0%) | $95,333 |
| 45 to 64 Years | 474 (47.4%) | $67,938 |
| 65+ Years | 337 (33.7%) | $30,938 |
| Total | 999 (100.0%) | $57,880 |
Poverty in Cambridge
Income Below Poverty by Sex and Age in Cambridge
With 15.1% poverty level for males and 10.4% for females among the residents of Cambridge, 45 to 54 year old males and 12 to 14 year old females are the most vulnerable to poverty, with 74 males (44.9%) and 28 females (65.1%) in their respective age groups living below the poverty level.
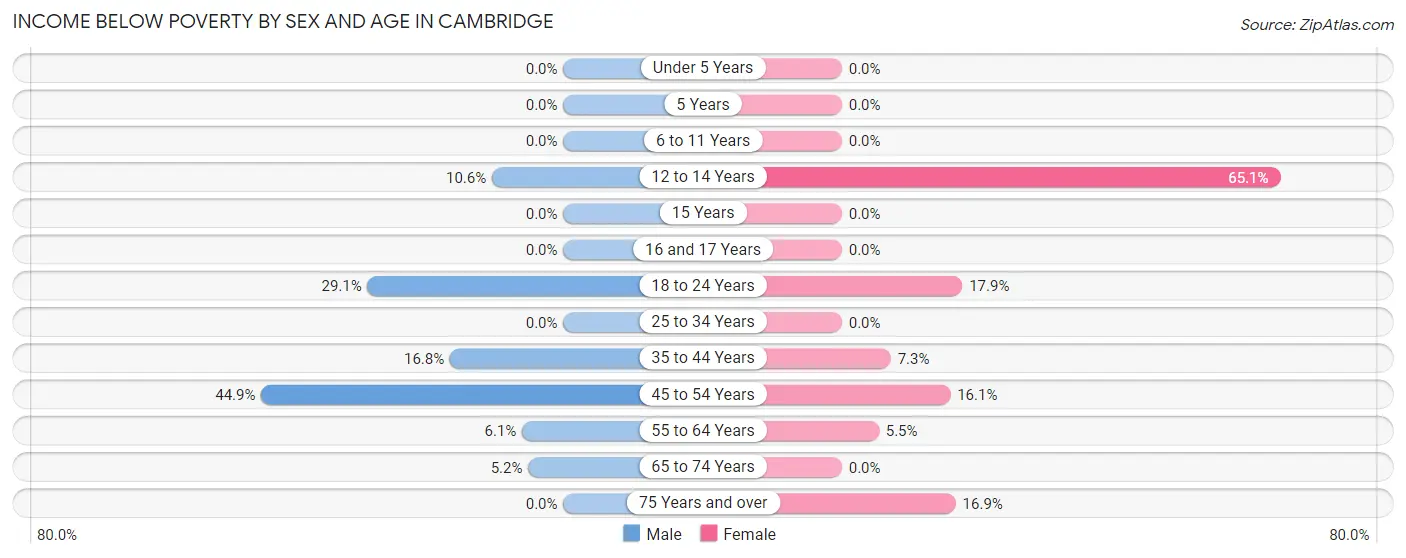
| Age Bracket | Male | Female |
| Under 5 Years | 0 (0.0%) | 0 (0.0%) |
| 5 Years | 0 (0.0%) | 0 (0.0%) |
| 6 to 11 Years | 0 (0.0%) | 0 (0.0%) |
| 12 to 14 Years | 9 (10.6%) | 28 (65.1%) |
| 15 Years | 0 (0.0%) | 0 (0.0%) |
| 16 and 17 Years | 0 (0.0%) | 0 (0.0%) |
| 18 to 24 Years | 25 (29.1%) | 32 (17.9%) |
| 25 to 34 Years | 0 (0.0%) | 0 (0.0%) |
| 35 to 44 Years | 18 (16.8%) | 8 (7.3%) |
| 45 to 54 Years | 74 (44.9%) | 38 (16.1%) |
| 55 to 64 Years | 11 (6.1%) | 10 (5.5%) |
| 65 to 74 Years | 5 (5.2%) | 0 (0.0%) |
| 75 Years and over | 0 (0.0%) | 35 (16.9%) |
| Total | 142 (15.1%) | 151 (10.4%) |
Income Above Poverty by Sex and Age in Cambridge
According to the poverty statistics in Cambridge, males aged 5 years and females aged under 5 years are the age groups that are most secure financially, with 100.0% of males and 100.0% of females in these age groups living above the poverty line.
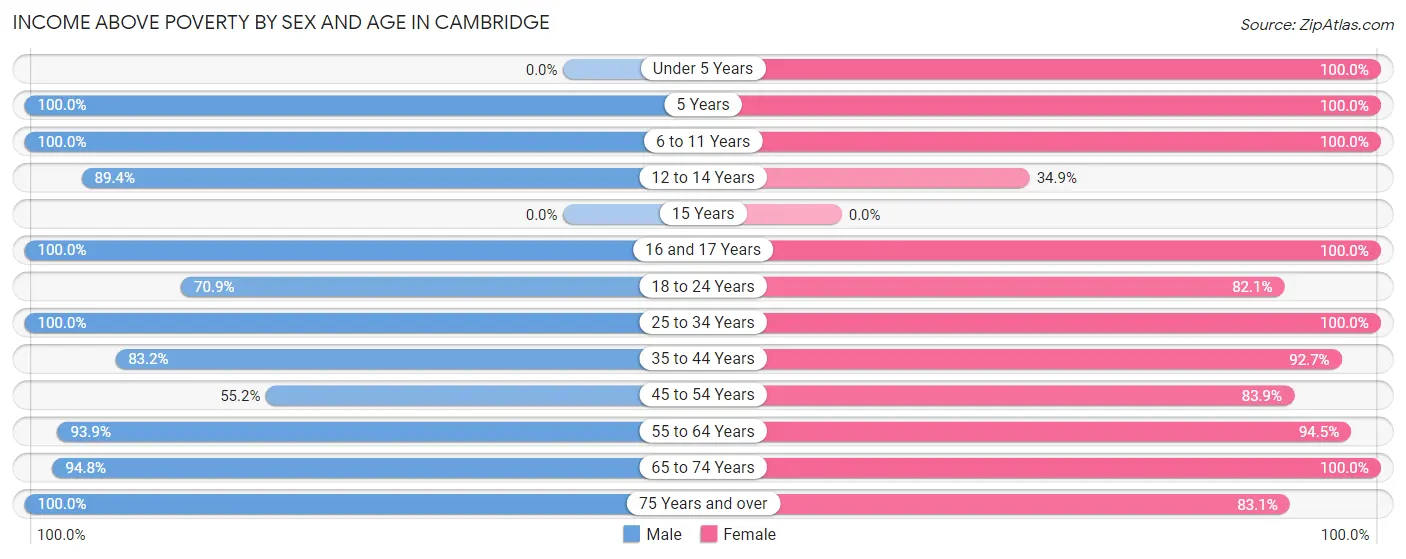
| Age Bracket | Male | Female |
| Under 5 Years | 0 (0.0%) | 31 (100.0%) |
| 5 Years | 24 (100.0%) | 26 (100.0%) |
| 6 to 11 Years | 52 (100.0%) | 84 (100.0%) |
| 12 to 14 Years | 76 (89.4%) | 15 (34.9%) |
| 15 Years | 0 (0.0%) | 0 (0.0%) |
| 16 and 17 Years | 36 (100.0%) | 145 (100.0%) |
| 18 to 24 Years | 61 (70.9%) | 147 (82.1%) |
| 25 to 34 Years | 51 (100.0%) | 89 (100.0%) |
| 35 to 44 Years | 89 (83.2%) | 102 (92.7%) |
| 45 to 54 Years | 91 (55.1%) | 198 (83.9%) |
| 55 to 64 Years | 169 (93.9%) | 172 (94.5%) |
| 65 to 74 Years | 91 (94.8%) | 115 (100.0%) |
| 75 Years and over | 55 (100.0%) | 172 (83.1%) |
| Total | 795 (84.9%) | 1,296 (89.6%) |
Income Below Poverty Among Married-Couple Families in Cambridge
The poverty statistics for married-couple families in Cambridge show that 9.5% or 29 of the total 304 families live below the poverty line. Families with 1 or 2 children have the highest poverty rate of 19.7%, comprising of 23 families. On the other hand, families with 3 or 4 children have the lowest poverty rate of 0.0%, which includes 0 families.
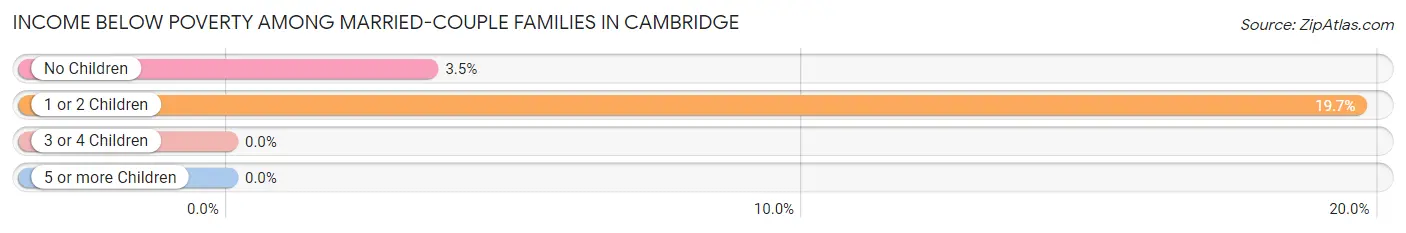
| Children | Above Poverty | Below Poverty |
| No Children | 166 (96.5%) | 6 (3.5%) |
| 1 or 2 Children | 94 (80.3%) | 23 (19.7%) |
| 3 or 4 Children | 15 (100.0%) | 0 (0.0%) |
| 5 or more Children | 0 (0.0%) | 0 (0.0%) |
| Total | 275 (90.5%) | 29 (9.5%) |
Income Below Poverty Among Single-Parent Households in Cambridge
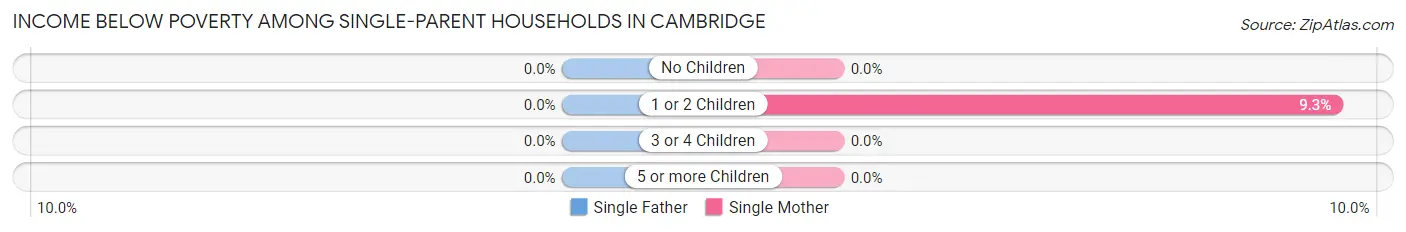
| Children | Single Father | Single Mother |
| No Children | 0 (0.0%) | 0 (0.0%) |
| 1 or 2 Children | 0 (0.0%) | 8 (9.3%) |
| 3 or 4 Children | 0 (0.0%) | 0 (0.0%) |
| 5 or more Children | 0 (0.0%) | 0 (0.0%) |
| Total | 0 (0.0%) | 8 (4.1%) |
Income Below Poverty Among Married-Couple vs Single-Parent Households in Cambridge
The poverty data for Cambridge shows that 29 of the married-couple family households (9.5%) and 8 of the single-parent households (2.9%) are living below the poverty level. Within the married-couple family households, those with 1 or 2 children have the highest poverty rate, with 23 households (19.7%) falling below the poverty line. Among the single-parent households, those with 1 or 2 children have the highest poverty rate, with 8 household (5.4%) living below poverty.
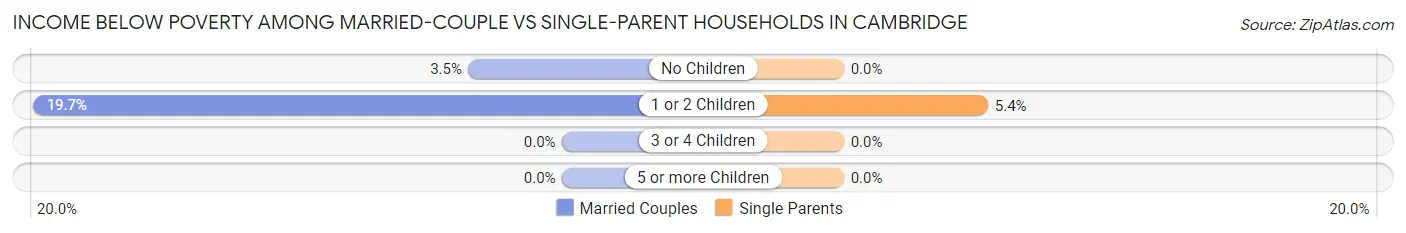
| Children | Married-Couple Families | Single-Parent Households |
| No Children | 6 (3.5%) | 0 (0.0%) |
| 1 or 2 Children | 23 (19.7%) | 8 (5.4%) |
| 3 or 4 Children | 0 (0.0%) | 0 (0.0%) |
| 5 or more Children | 0 (0.0%) | 0 (0.0%) |
| Total | 29 (9.5%) | 8 (2.9%) |
Race in Cambridge
The most populous races in Cambridge are White / Caucasian (2,303 | 96.4%), Hispanic or Latino (77 | 3.2%), and Asian (46 | 1.9%).
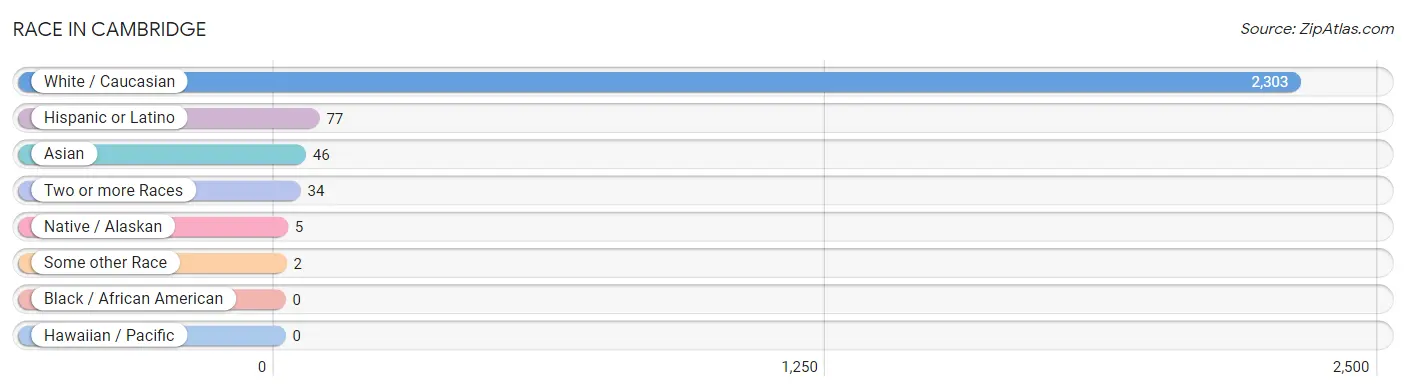
| Race | # Population | % Population |
| Asian | 46 | 1.9% |
| Black / African American | 0 | 0.0% |
| Hawaiian / Pacific | 0 | 0.0% |
| Hispanic or Latino | 77 | 3.2% |
| Native / Alaskan | 5 | 0.2% |
| White / Caucasian | 2,303 | 96.4% |
| Two or more Races | 34 | 1.4% |
| Some other Race | 2 | 0.1% |
| Total | 2,390 | 100.0% |
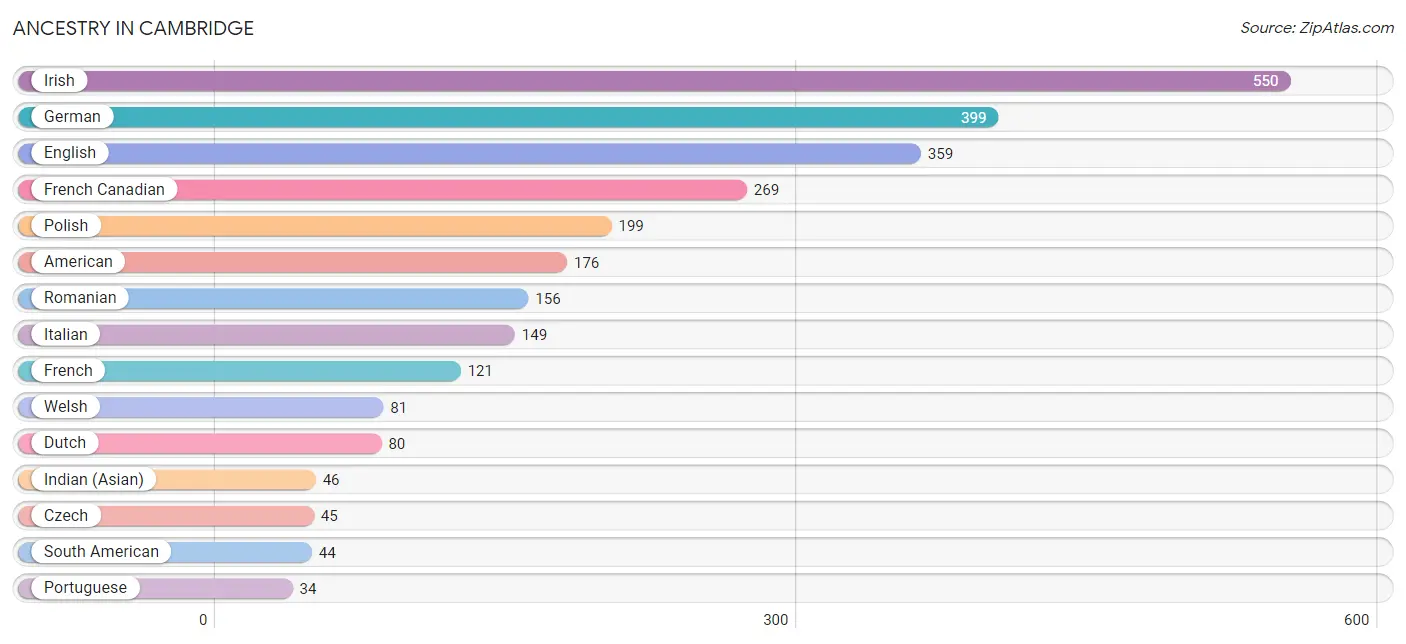
Ancestry in Cambridge
The most populous ancestries reported in Cambridge are Irish (550 | 23.0%), German (399 | 16.7%), English (359 | 15.0%), French Canadian (269 | 11.3%), and Polish (199 | 8.3%), together accounting for 74.3% of all Cambridge residents.
| Ancestry | # Population | % Population |
| Alsatian | 5 | 0.2% |
| American | 176 | 7.4% |
| British | 6 | 0.3% |
| Central American | 2 | 0.1% |
| Cherokee | 5 | 0.2% |
| Chilean | 10 | 0.4% |
| Czech | 45 | 1.9% |
| Dutch | 80 | 3.4% |
| English | 359 | 15.0% |
| Estonian | 5 | 0.2% |
| European | 7 | 0.3% |
| Finnish | 4 | 0.2% |
| French | 121 | 5.1% |
| French Canadian | 269 | 11.3% |
| German | 399 | 16.7% |
| Honduran | 2 | 0.1% |
| Hungarian | 3 | 0.1% |
| Indian (Asian) | 46 | 1.9% |
| Irish | 550 | 23.0% |
| Italian | 149 | 6.2% |
| Mexican | 20 | 0.8% |
| Norwegian | 10 | 0.4% |
| Polish | 199 | 8.3% |
| Portuguese | 34 | 1.4% |
| Romanian | 156 | 6.5% |
| Russian | 3 | 0.1% |
| Scotch-Irish | 27 | 1.1% |
| Scottish | 27 | 1.1% |
| Slavic | 7 | 0.3% |
| Slovak | 4 | 0.2% |
| South American | 44 | 1.8% |
| Spaniard | 11 | 0.5% |
| Swedish | 29 | 1.2% |
| Ukrainian | 16 | 0.7% |
| Uruguayan | 34 | 1.4% |
| Welsh | 81 | 3.4% | View All 36 Rows |
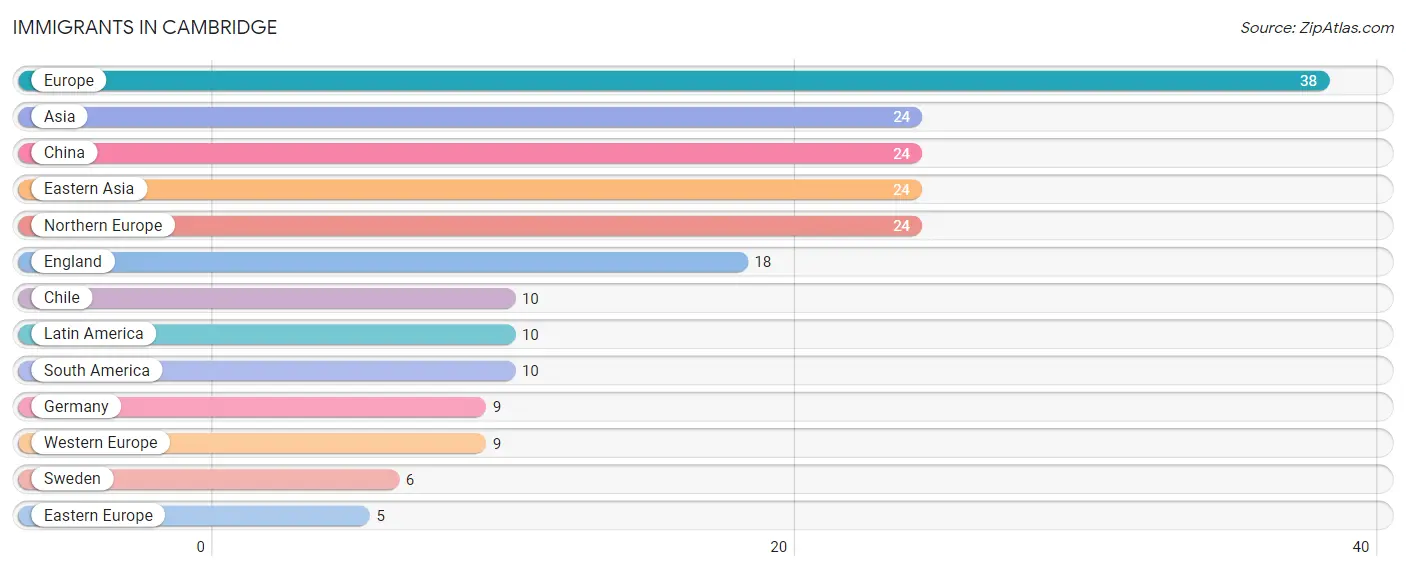
Immigrants in Cambridge
The most numerous immigrant groups reported in Cambridge came from Europe (38 | 1.6%), Asia (24 | 1.0%), China (24 | 1.0%), Eastern Asia (24 | 1.0%), and Northern Europe (24 | 1.0%), together accounting for 5.6% of all Cambridge residents.
| Immigration Origin | # Population | % Population |
| Asia | 24 | 1.0% |
| Chile | 10 | 0.4% |
| China | 24 | 1.0% |
| Eastern Asia | 24 | 1.0% |
| Eastern Europe | 5 | 0.2% |
| England | 18 | 0.7% |
| Europe | 38 | 1.6% |
| Germany | 9 | 0.4% |
| Latin America | 10 | 0.4% |
| Northern Europe | 24 | 1.0% |
| South America | 10 | 0.4% |
| Sweden | 6 | 0.3% |
| Western Europe | 9 | 0.4% | View All 13 Rows |
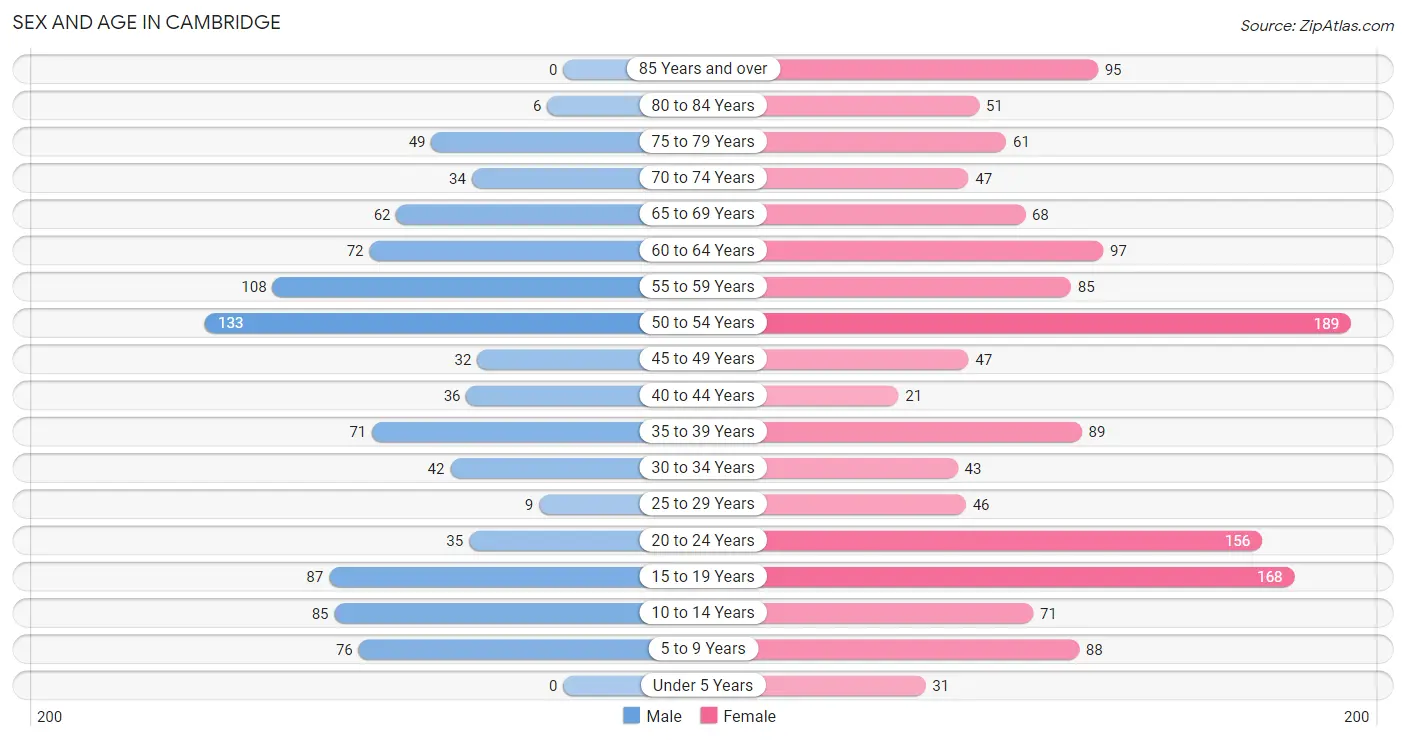
Sex and Age in Cambridge
Sex and Age in Cambridge
The most populous age groups in Cambridge are 50 to 54 Years (133 | 14.2%) for men and 50 to 54 Years (189 | 13.0%) for women.
| Age Bracket | Male | Female |
| Under 5 Years | 0 (0.0%) | 31 (2.1%) |
| 5 to 9 Years | 76 (8.1%) | 88 (6.1%) |
| 10 to 14 Years | 85 (9.1%) | 71 (4.9%) |
| 15 to 19 Years | 87 (9.3%) | 168 (11.6%) |
| 20 to 24 Years | 35 (3.7%) | 156 (10.7%) |
| 25 to 29 Years | 9 (1.0%) | 46 (3.2%) |
| 30 to 34 Years | 42 (4.5%) | 43 (3.0%) |
| 35 to 39 Years | 71 (7.6%) | 89 (6.1%) |
| 40 to 44 Years | 36 (3.8%) | 21 (1.5%) |
| 45 to 49 Years | 32 (3.4%) | 47 (3.2%) |
| 50 to 54 Years | 133 (14.2%) | 189 (13.0%) |
| 55 to 59 Years | 108 (11.5%) | 85 (5.9%) |
| 60 to 64 Years | 72 (7.7%) | 97 (6.7%) |
| 65 to 69 Years | 62 (6.6%) | 68 (4.7%) |
| 70 to 74 Years | 34 (3.6%) | 47 (3.2%) |
| 75 to 79 Years | 49 (5.2%) | 61 (4.2%) |
| 80 to 84 Years | 6 (0.6%) | 51 (3.5%) |
| 85 Years and over | 0 (0.0%) | 95 (6.5%) |
| Total | 937 (100.0%) | 1,453 (100.0%) |
Families and Households in Cambridge
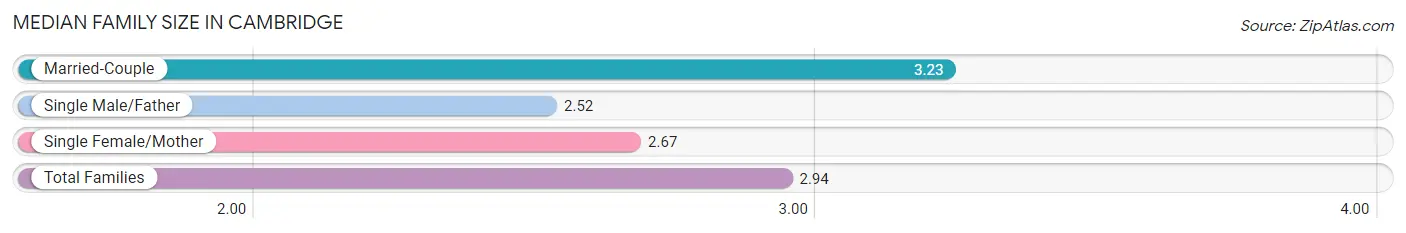
Median Family Size in Cambridge
The median family size in Cambridge is 2.94 persons per family, with married-couple families (304 | 52.5%) accounting for the largest median family size of 3.23 persons per family. On the other hand, single male/father families (79 | 13.6%) represent the smallest median family size with 2.52 persons per family.
| Family Type | # Families | Family Size |
| Married-Couple | 304 (52.5%) | 3.23 |
| Single Male/Father | 79 (13.6%) | 2.52 |
| Single Female/Mother | 196 (33.9%) | 2.67 |
| Total Families | 579 (100.0%) | 2.94 |
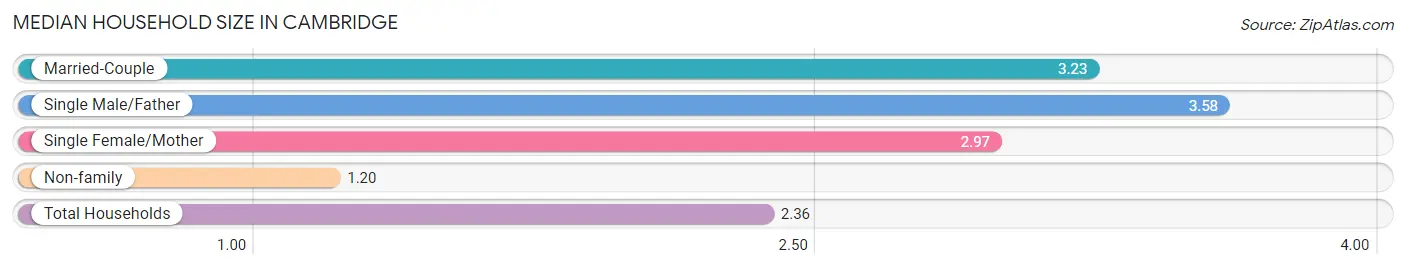
Median Household Size in Cambridge
The median household size in Cambridge is 2.36 persons per household, with single male/father households (79 | 7.9%) accounting for the largest median household size of 3.58 persons per household. non-family households (420 | 42.0%) represent the smallest median household size with 1.20 persons per household.
| Household Type | # Households | Household Size |
| Married-Couple | 304 (30.4%) | 3.23 |
| Single Male/Father | 79 (7.9%) | 3.58 |
| Single Female/Mother | 196 (19.6%) | 2.97 |
| Non-family | 420 (42.0%) | 1.20 |
| Total Households | 999 (100.0%) | 2.36 |
Household Size by Marriage Status in Cambridge
Out of a total of 999 households in Cambridge, 579 (58.0%) are family households, while 420 (42.0%) are nonfamily households. The most numerous type of family households are 2-person households, comprising 266, and the most common type of nonfamily households are 1-person households, comprising 345.
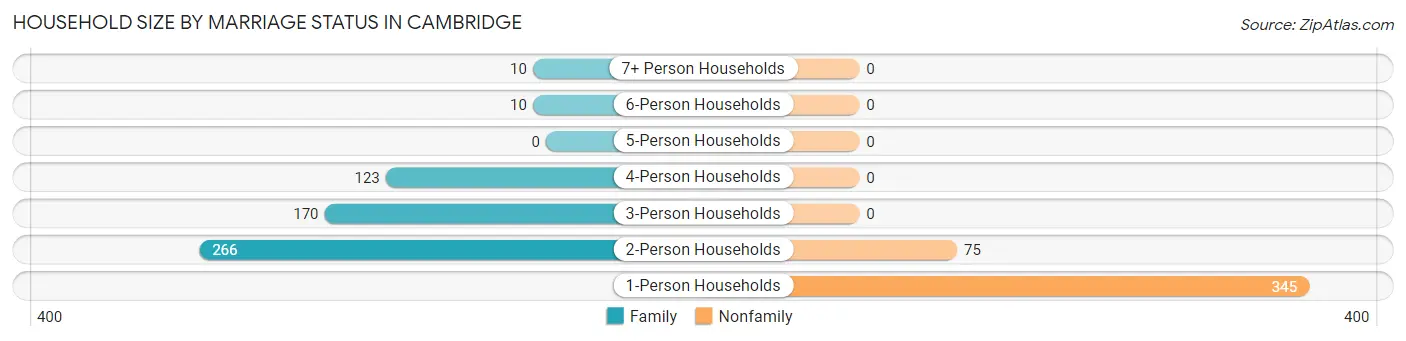
| Household Size | Family Households | Nonfamily Households |
| 1-Person Households | - | 345 (34.5%) |
| 2-Person Households | 266 (26.6%) | 75 (7.5%) |
| 3-Person Households | 170 (17.0%) | 0 (0.0%) |
| 4-Person Households | 123 (12.3%) | 0 (0.0%) |
| 5-Person Households | 0 (0.0%) | 0 (0.0%) |
| 6-Person Households | 10 (1.0%) | 0 (0.0%) |
| 7+ Person Households | 10 (1.0%) | 0 (0.0%) |
| Total | 579 (58.0%) | 420 (42.0%) |
Female Fertility in Cambridge
Fertility by Age in Cambridge
| Age Bracket | Women with Births | Births / 1,000 Women |
| 15 to 19 years | 0 (0.0%) | 0.0 |
| 20 to 34 years | 0 (0.0%) | 0.0 |
| 35 to 50 years | 0 (0.0%) | 0.0 |
| Total | 0 (0.0%) | 0.0 |
Fertility by Age by Marriage Status in Cambridge
| Age Bracket | Married | Unmarried |
| 15 to 19 years | 0 (0.0%) | 0 (0.0%) |
| 20 to 34 years | 0 (0.0%) | 0 (0.0%) |
| 35 to 50 years | 0 (0.0%) | 0 (0.0%) |
| Total | 0 (0.0%) | 0 (0.0%) |
Fertility by Education in Cambridge
| Educational Attainment | Women with Births | Births / 1,000 Women |
| Less than High School | 0 (0.0%) | 0.0 |
| High School Diploma | 0 (0.0%) | 0.0 |
| College or Associate's Degree | 0 (0.0%) | 0.0 |
| Bachelor's Degree | 0 (0.0%) | 0.0 |
| Graduate Degree | 0 (0.0%) | 0.0 |
| Total | 0 (0.0%) | 0.0 |
Fertility by Education by Marriage Status in Cambridge
| Educational Attainment | Married | Unmarried |
| Less than High School | 0 (0.0%) | 0 (0.0%) |
| High School Diploma | 0 (0.0%) | 0 (0.0%) |
| College or Associate's Degree | 0 (0.0%) | 0 (0.0%) |
| Bachelor's Degree | 0 (0.0%) | 0 (0.0%) |
| Graduate Degree | 0 (0.0%) | 0 (0.0%) |
| Total | 0 (0.0%) | 0 (0.0%) |
Employment Characteristics in Cambridge
Employment by Class of Employer in Cambridge
Among the 1,052 employed individuals in Cambridge, private company employees (641 | 60.9%), not-for-profit organizations (154 | 14.6%), and self-employed (not incorporated) (116 | 11.0%) make up the most common classes of employment.
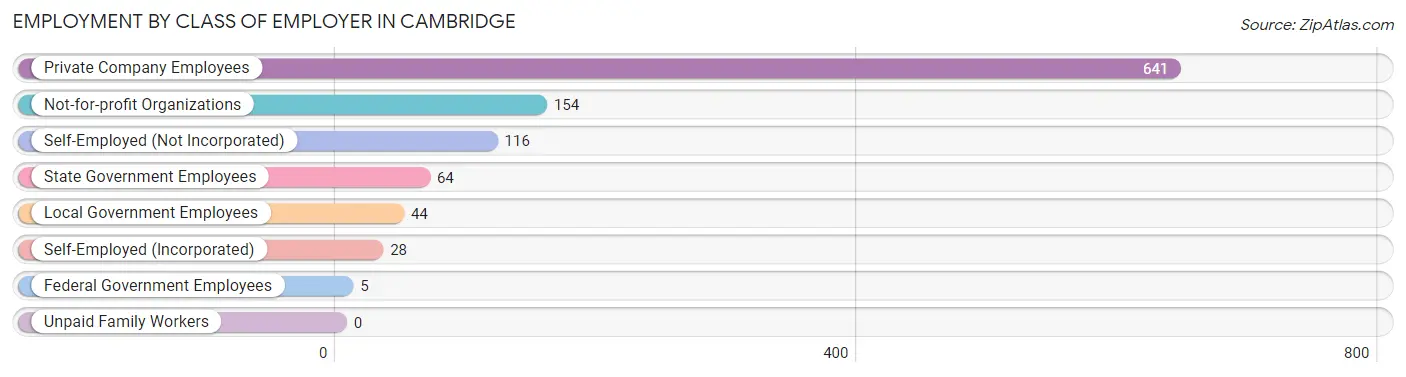
| Employer Class | # Employees | % Employees |
| Private Company Employees | 641 | 60.9% |
| Self-Employed (Incorporated) | 28 | 2.7% |
| Self-Employed (Not Incorporated) | 116 | 11.0% |
| Not-for-profit Organizations | 154 | 14.6% |
| Local Government Employees | 44 | 4.2% |
| State Government Employees | 64 | 6.1% |
| Federal Government Employees | 5 | 0.5% |
| Unpaid Family Workers | 0 | 0.0% |
| Total | 1,052 | 100.0% |
Employment Status by Age in Cambridge
According to the labor force statistics for Cambridge, out of the total population over 16 years of age (2,039), 55.0% or 1,121 individuals are in the labor force, with 5.5% or 62 of them unemployed. The age group with the highest labor force participation rate is 25 to 29 years, with 100.0% or 55 individuals in the labor force. Within the labor force, the 45 to 54 years age range has the highest percentage of unemployed individuals, with 16.9% or 54 of them being unemployed.
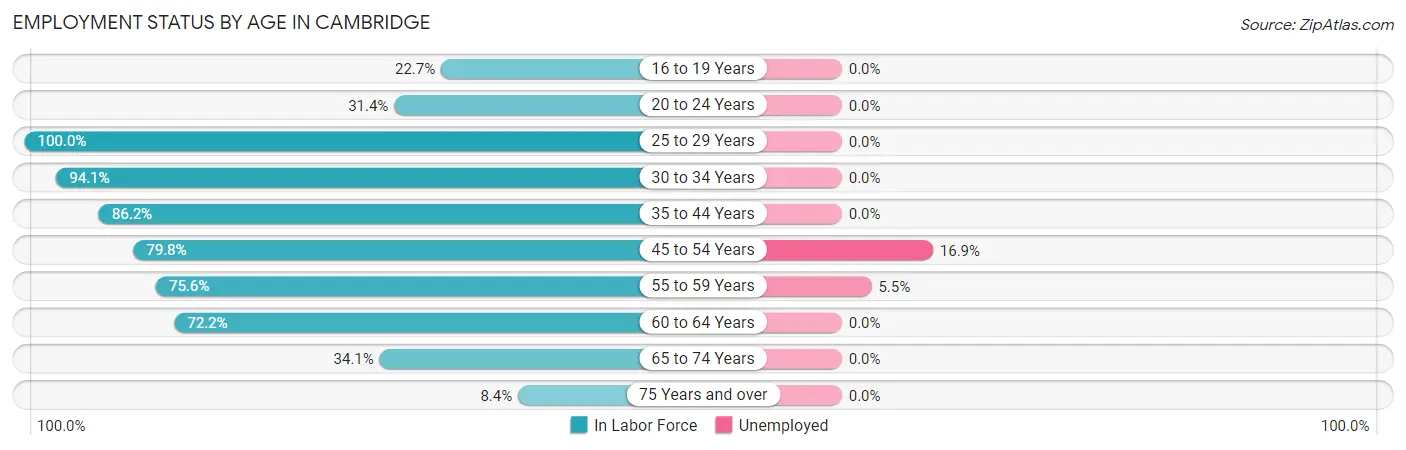
| Age Bracket | In Labor Force | Unemployed |
| 16 to 19 Years | 58 (22.7%) | 0 (0.0%) |
| 20 to 24 Years | 60 (31.4%) | 0 (0.0%) |
| 25 to 29 Years | 55 (100.0%) | 0 (0.0%) |
| 30 to 34 Years | 80 (94.1%) | 0 (0.0%) |
| 35 to 44 Years | 187 (86.2%) | 0 (0.0%) |
| 45 to 54 Years | 320 (79.8%) | 54 (16.9%) |
| 55 to 59 Years | 146 (75.6%) | 8 (5.5%) |
| 60 to 64 Years | 122 (72.2%) | 0 (0.0%) |
| 65 to 74 Years | 72 (34.1%) | 0 (0.0%) |
| 75 Years and over | 22 (8.4%) | 0 (0.0%) |
| Total | 1,121 (55.0%) | 62 (5.5%) |
Employment Status by Educational Attainment in Cambridge
According to labor force statistics for Cambridge, 81.3% of individuals (911) out of the total population between 25 and 64 years of age (1,120) are in the labor force, with 6.8% or 62 of them being unemployed. The group with the highest labor force participation rate are those with the educational attainment of college / associate degree, with 95.5% or 341 individuals in the labor force. Within the labor force, individuals with high school diploma education have the highest percentage of unemployment, with 11.9% or 26 of them being unemployed.
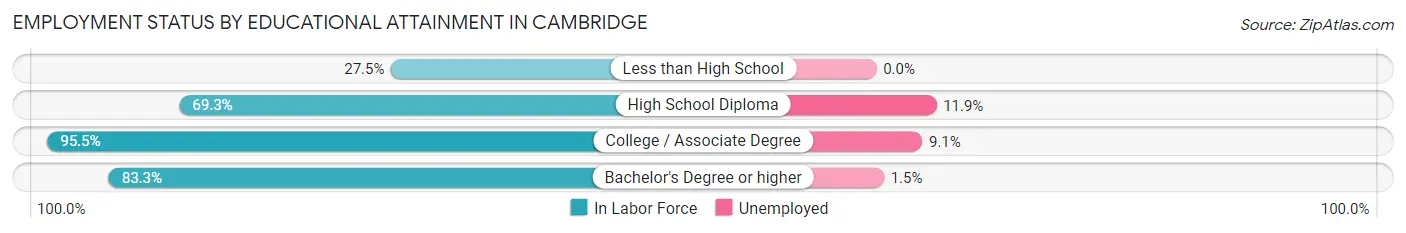
| Educational Attainment | In Labor Force | Unemployed |
| Less than High School | 11 (27.5%) | 0 (0.0%) |
| High School Diploma | 219 (69.3%) | 38 (11.9%) |
| College / Associate Degree | 341 (95.5%) | 32 (9.1%) |
| Bachelor's Degree or higher | 339 (83.3%) | 6 (1.5%) |
| Total | 911 (81.3%) | 76 (6.8%) |
Employment Occupations by Sex in Cambridge
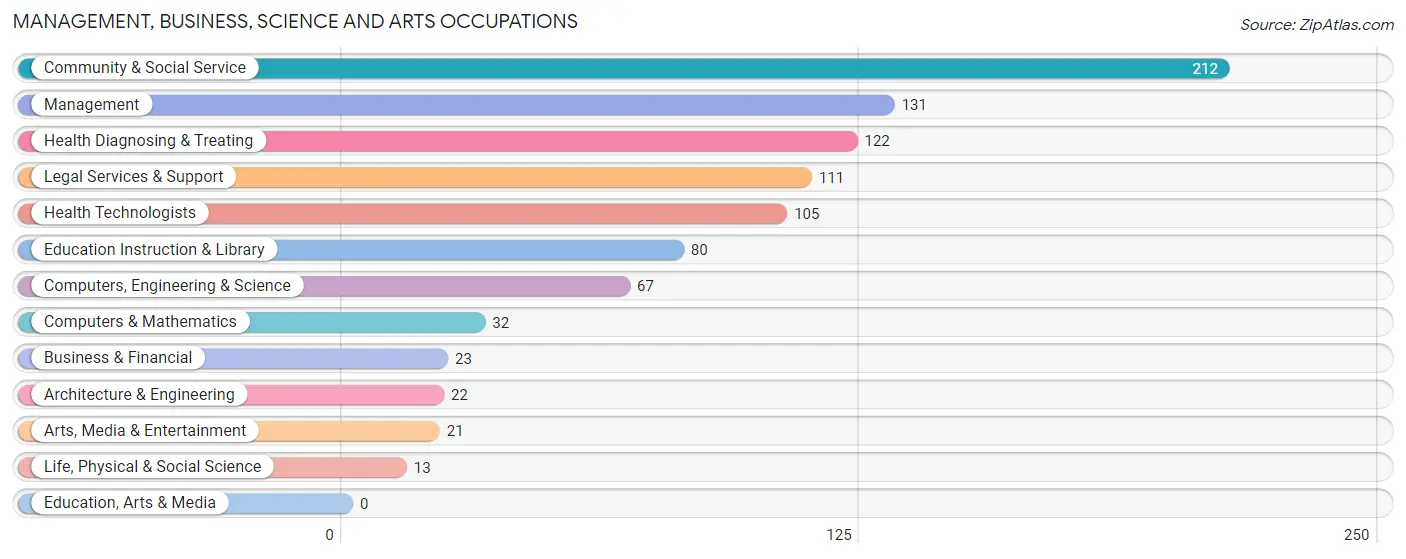
Management, Business, Science and Arts Occupations
The most common Management, Business, Science and Arts occupations in Cambridge are Community & Social Service (212 | 20.0%), Management (131 | 12.4%), Health Diagnosing & Treating (122 | 11.5%), Legal Services & Support (111 | 10.5%), and Health Technologists (105 | 9.9%).
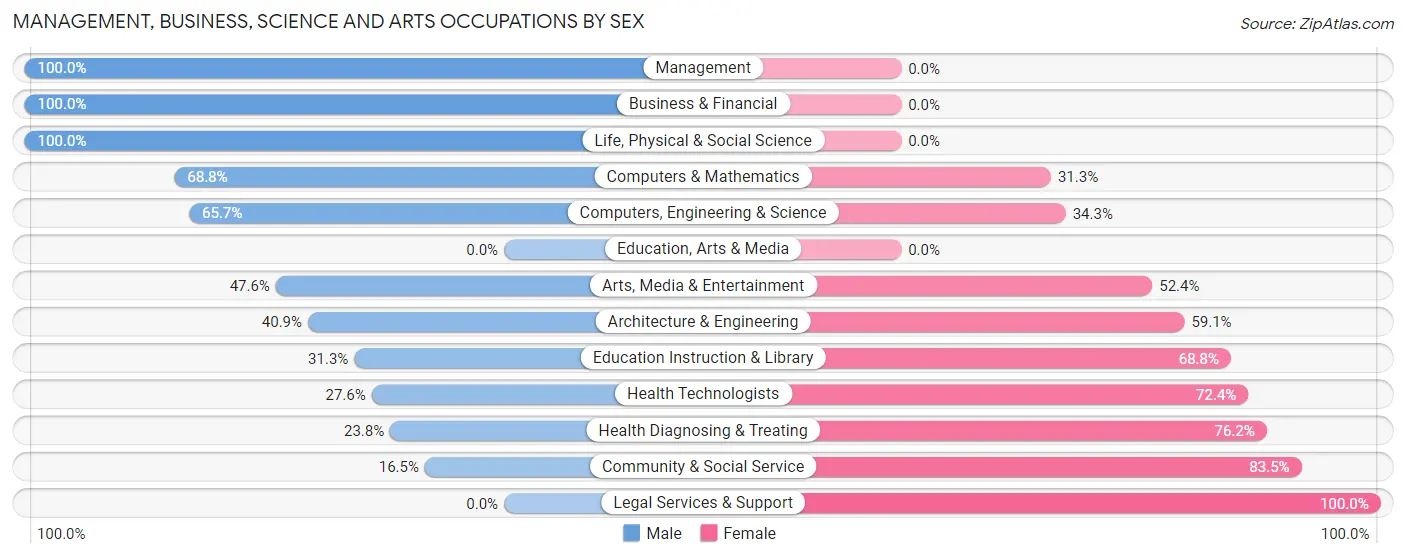
Management, Business, Science and Arts Occupations by Sex
Within the Management, Business, Science and Arts occupations in Cambridge, the most male-oriented occupations are Management (100.0%), Business & Financial (100.0%), and Life, Physical & Social Science (100.0%), while the most female-oriented occupations are Legal Services & Support (100.0%), Community & Social Service (83.5%), and Health Diagnosing & Treating (76.2%).
| Occupation | Male | Female |
| Management | 131 (100.0%) | 0 (0.0%) |
| Business & Financial | 23 (100.0%) | 0 (0.0%) |
| Computers, Engineering & Science | 44 (65.7%) | 23 (34.3%) |
| Computers & Mathematics | 22 (68.8%) | 10 (31.2%) |
| Architecture & Engineering | 9 (40.9%) | 13 (59.1%) |
| Life, Physical & Social Science | 13 (100.0%) | 0 (0.0%) |
| Community & Social Service | 35 (16.5%) | 177 (83.5%) |
| Education, Arts & Media | 0 (0.0%) | 0 (0.0%) |
| Legal Services & Support | 0 (0.0%) | 111 (100.0%) |
| Education Instruction & Library | 25 (31.2%) | 55 (68.8%) |
| Arts, Media & Entertainment | 10 (47.6%) | 11 (52.4%) |
| Health Diagnosing & Treating | 29 (23.8%) | 93 (76.2%) |
| Health Technologists | 29 (27.6%) | 76 (72.4%) |
| Total (Category) | 262 (47.2%) | 293 (52.8%) |
| Total (Overall) | 536 (50.6%) | 524 (49.4%) |
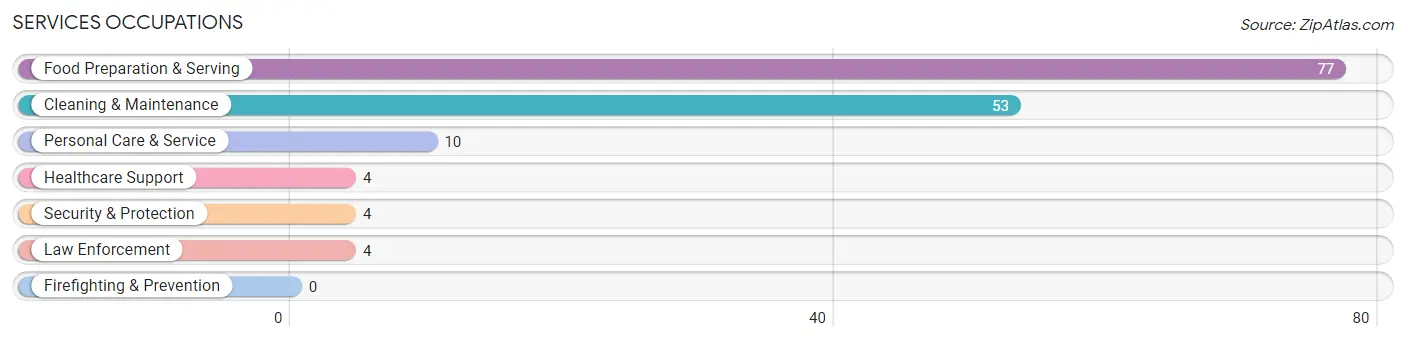
Services Occupations
The most common Services occupations in Cambridge are Food Preparation & Serving (77 | 7.3%), Cleaning & Maintenance (53 | 5.0%), Personal Care & Service (10 | 0.9%), Healthcare Support (4 | 0.4%), and Security & Protection (4 | 0.4%).
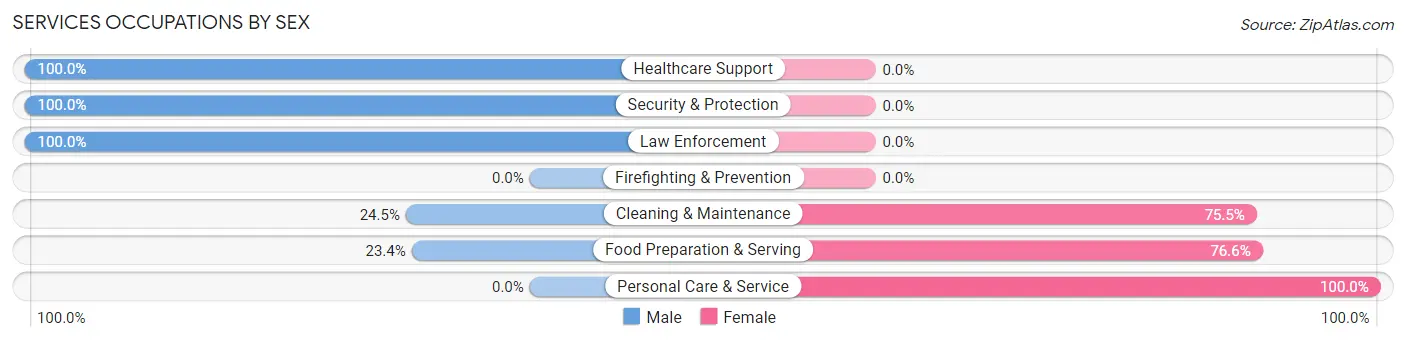
Services Occupations by Sex
Within the Services occupations in Cambridge, the most male-oriented occupations are Healthcare Support (100.0%), Security & Protection (100.0%), and Law Enforcement (100.0%), while the most female-oriented occupations are Personal Care & Service (100.0%), Food Preparation & Serving (76.6%), and Cleaning & Maintenance (75.5%).
| Occupation | Male | Female |
| Healthcare Support | 4 (100.0%) | 0 (0.0%) |
| Security & Protection | 4 (100.0%) | 0 (0.0%) |
| Firefighting & Prevention | 0 (0.0%) | 0 (0.0%) |
| Law Enforcement | 4 (100.0%) | 0 (0.0%) |
| Food Preparation & Serving | 18 (23.4%) | 59 (76.6%) |
| Cleaning & Maintenance | 13 (24.5%) | 40 (75.5%) |
| Personal Care & Service | 0 (0.0%) | 10 (100.0%) |
| Total (Category) | 39 (26.4%) | 109 (73.7%) |
| Total (Overall) | 536 (50.6%) | 524 (49.4%) |
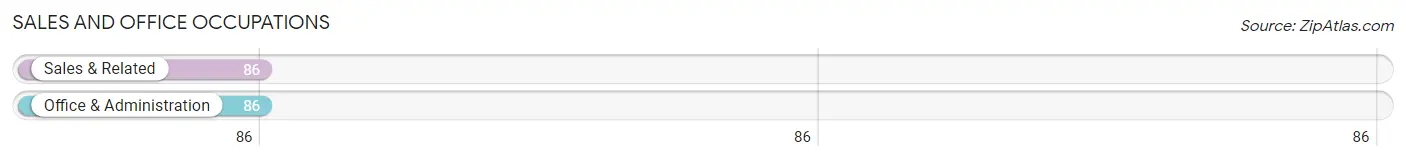
Sales and Office Occupations
The most common Sales and Office occupations in Cambridge are Sales & Related (86 | 8.1%), and Office & Administration (86 | 8.1%).
Sales and Office Occupations by Sex
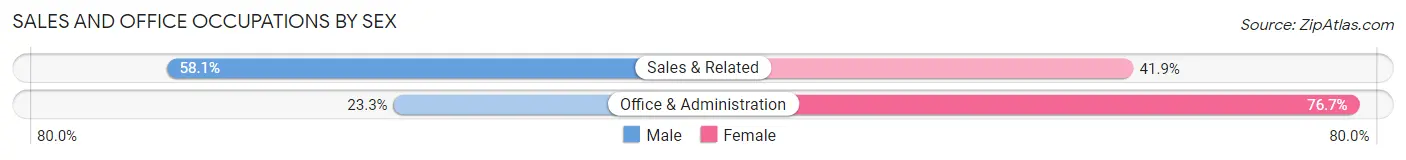
| Occupation | Male | Female |
| Sales & Related | 50 (58.1%) | 36 (41.9%) |
| Office & Administration | 20 (23.3%) | 66 (76.7%) |
| Total (Category) | 70 (40.7%) | 102 (59.3%) |
| Total (Overall) | 536 (50.6%) | 524 (49.4%) |
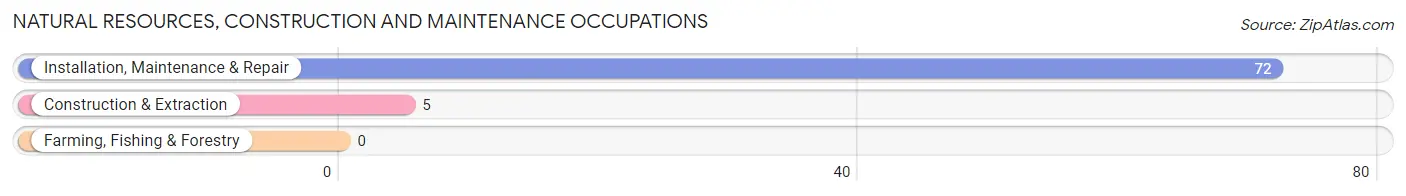
Natural Resources, Construction and Maintenance Occupations
The most common Natural Resources, Construction and Maintenance occupations in Cambridge are Installation, Maintenance & Repair (72 | 6.8%), and Construction & Extraction (5 | 0.5%).
Natural Resources, Construction and Maintenance Occupations by Sex
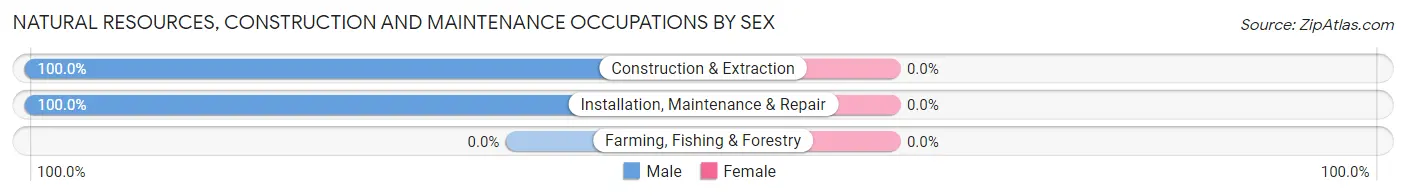
| Occupation | Male | Female |
| Farming, Fishing & Forestry | 0 (0.0%) | 0 (0.0%) |
| Construction & Extraction | 5 (100.0%) | 0 (0.0%) |
| Installation, Maintenance & Repair | 72 (100.0%) | 0 (0.0%) |
| Total (Category) | 77 (100.0%) | 0 (0.0%) |
| Total (Overall) | 536 (50.6%) | 524 (49.4%) |
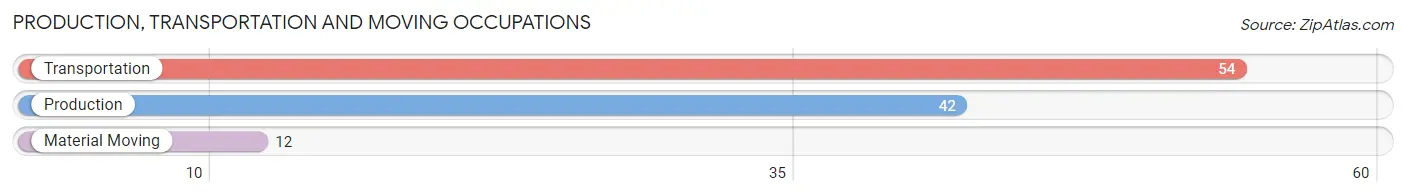
Production, Transportation and Moving Occupations
The most common Production, Transportation and Moving occupations in Cambridge are Transportation (54 | 5.1%), Production (42 | 4.0%), and Material Moving (12 | 1.1%).
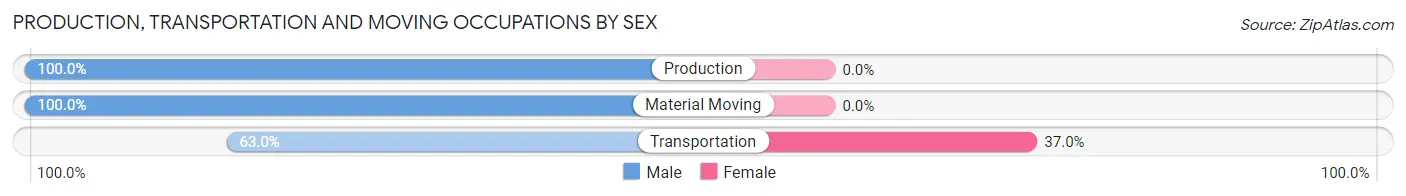
Production, Transportation and Moving Occupations by Sex
| Occupation | Male | Female |
| Production | 42 (100.0%) | 0 (0.0%) |
| Transportation | 34 (63.0%) | 20 (37.0%) |
| Material Moving | 12 (100.0%) | 0 (0.0%) |
| Total (Category) | 88 (81.5%) | 20 (18.5%) |
| Total (Overall) | 536 (50.6%) | 524 (49.4%) |
Employment Industries by Sex in Cambridge
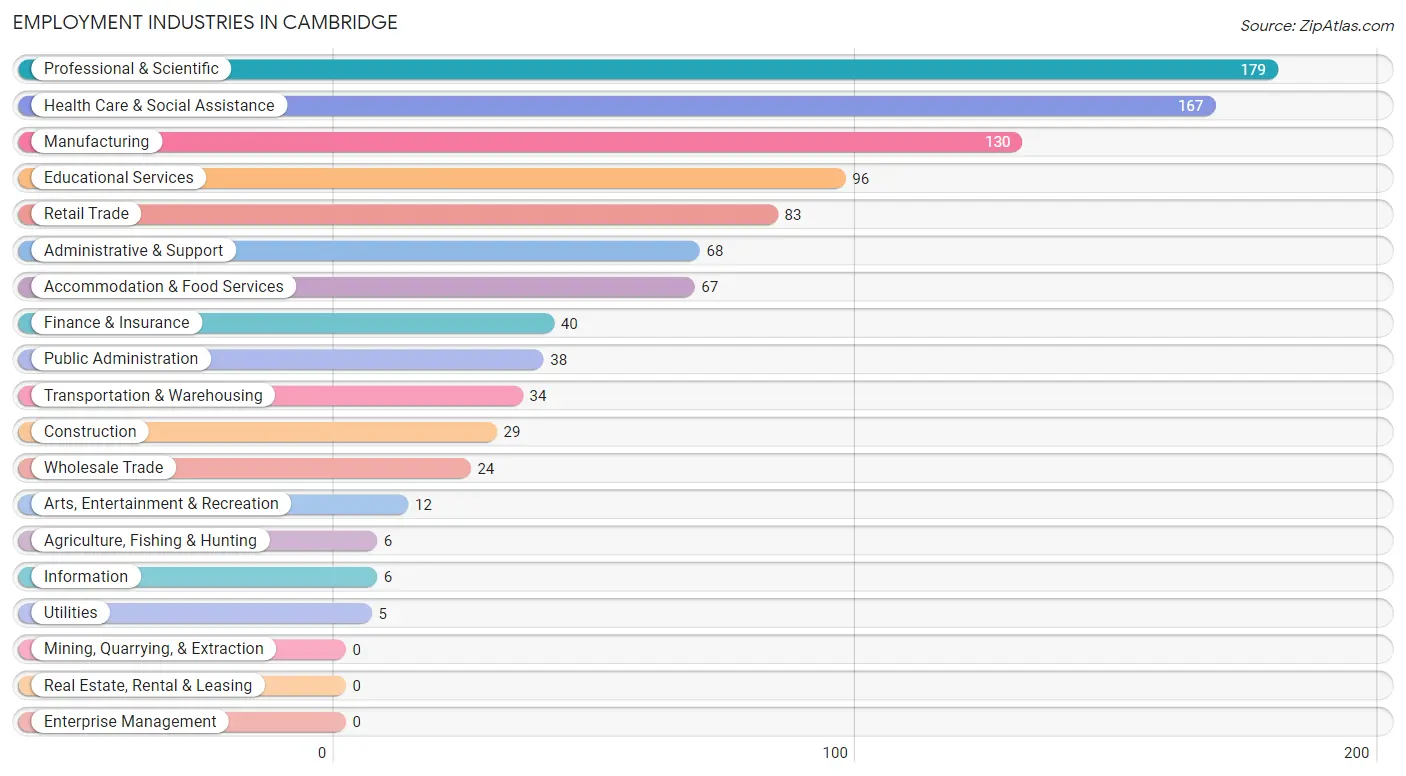
Employment Industries in Cambridge
The major employment industries in Cambridge include Professional & Scientific (179 | 16.9%), Health Care & Social Assistance (167 | 15.8%), Manufacturing (130 | 12.3%), Educational Services (96 | 9.1%), and Retail Trade (83 | 7.8%).
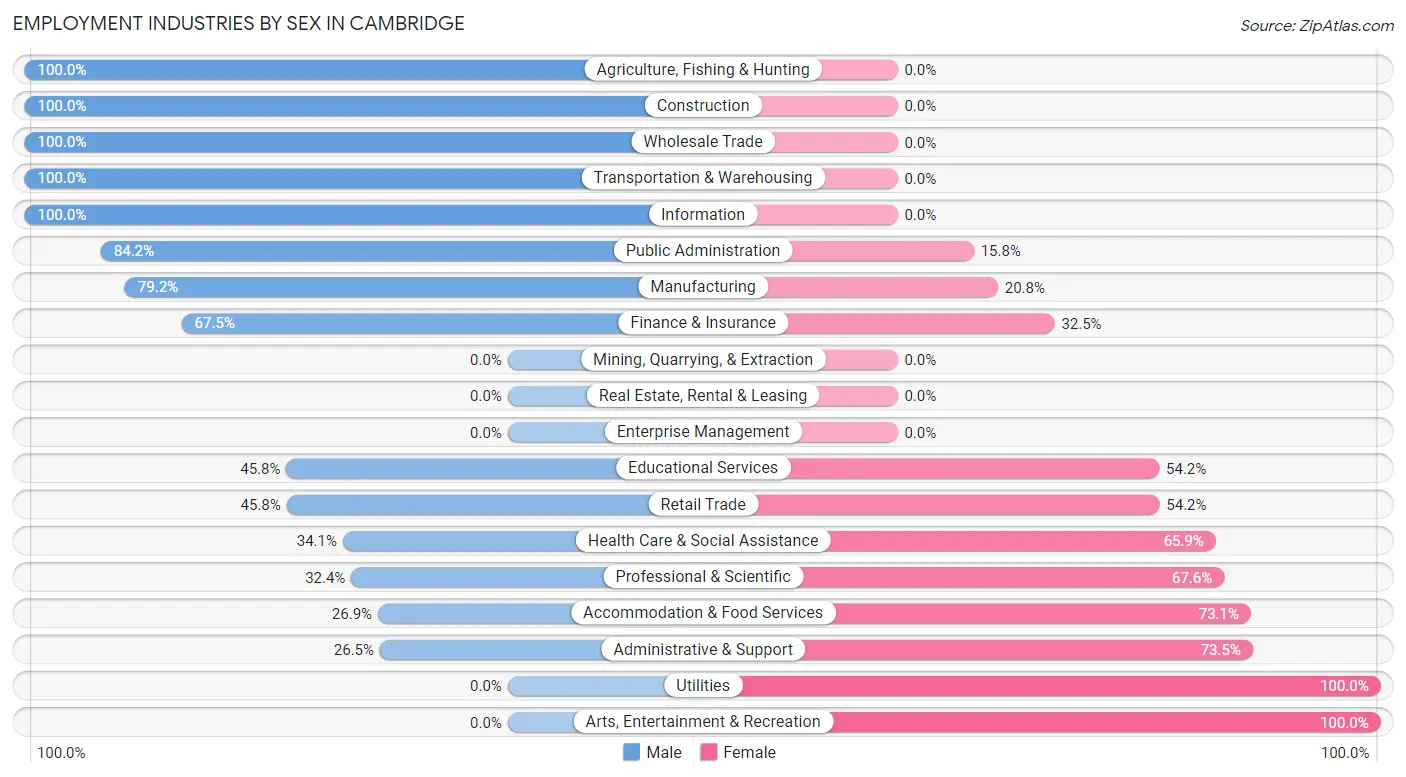
Employment Industries by Sex in Cambridge
The Cambridge industries that see more men than women are Agriculture, Fishing & Hunting (100.0%), Construction (100.0%), and Wholesale Trade (100.0%), whereas the industries that tend to have a higher number of women are Utilities (100.0%), Arts, Entertainment & Recreation (100.0%), and Administrative & Support (73.5%).
| Industry | Male | Female |
| Agriculture, Fishing & Hunting | 6 (100.0%) | 0 (0.0%) |
| Mining, Quarrying, & Extraction | 0 (0.0%) | 0 (0.0%) |
| Construction | 29 (100.0%) | 0 (0.0%) |
| Manufacturing | 103 (79.2%) | 27 (20.8%) |
| Wholesale Trade | 24 (100.0%) | 0 (0.0%) |
| Retail Trade | 38 (45.8%) | 45 (54.2%) |
| Transportation & Warehousing | 34 (100.0%) | 0 (0.0%) |
| Utilities | 0 (0.0%) | 5 (100.0%) |
| Information | 6 (100.0%) | 0 (0.0%) |
| Finance & Insurance | 27 (67.5%) | 13 (32.5%) |
| Real Estate, Rental & Leasing | 0 (0.0%) | 0 (0.0%) |
| Professional & Scientific | 58 (32.4%) | 121 (67.6%) |
| Enterprise Management | 0 (0.0%) | 0 (0.0%) |
| Administrative & Support | 18 (26.5%) | 50 (73.5%) |
| Educational Services | 44 (45.8%) | 52 (54.2%) |
| Health Care & Social Assistance | 57 (34.1%) | 110 (65.9%) |
| Arts, Entertainment & Recreation | 0 (0.0%) | 12 (100.0%) |
| Accommodation & Food Services | 18 (26.9%) | 49 (73.1%) |
| Public Administration | 32 (84.2%) | 6 (15.8%) |
| Total | 536 (50.6%) | 524 (49.4%) |
Education in Cambridge
School Enrollment in Cambridge
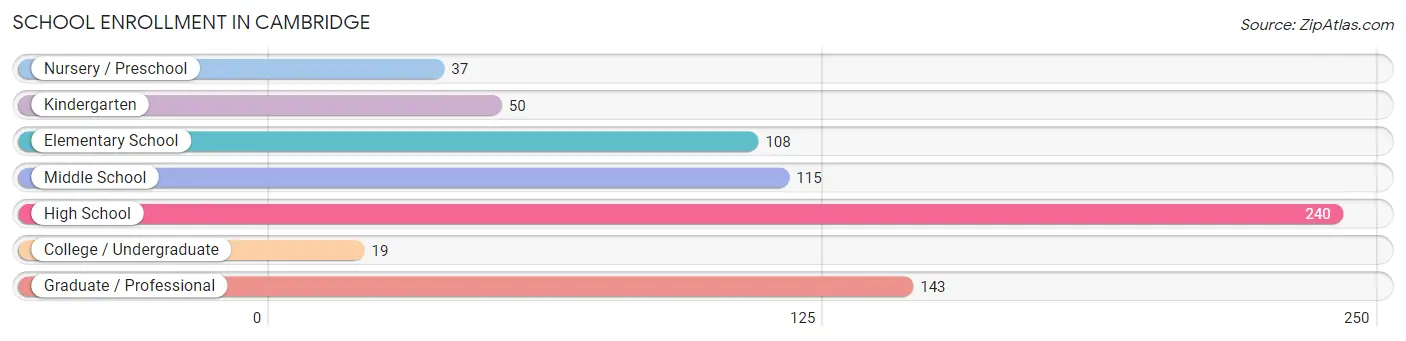
The most common levels of schooling among the 712 students in Cambridge are high school (240 | 33.7%), graduate / professional (143 | 20.1%), and middle school (115 | 16.2%).
| School Level | # Students | % Students |
| Nursery / Preschool | 37 | 5.2% |
| Kindergarten | 50 | 7.0% |
| Elementary School | 108 | 15.2% |
| Middle School | 115 | 16.2% |
| High School | 240 | 33.7% |
| College / Undergraduate | 19 | 2.7% |
| Graduate / Professional | 143 | 20.1% |
| Total | 712 | 100.0% |
School Enrollment by Age by Funding Source in Cambridge
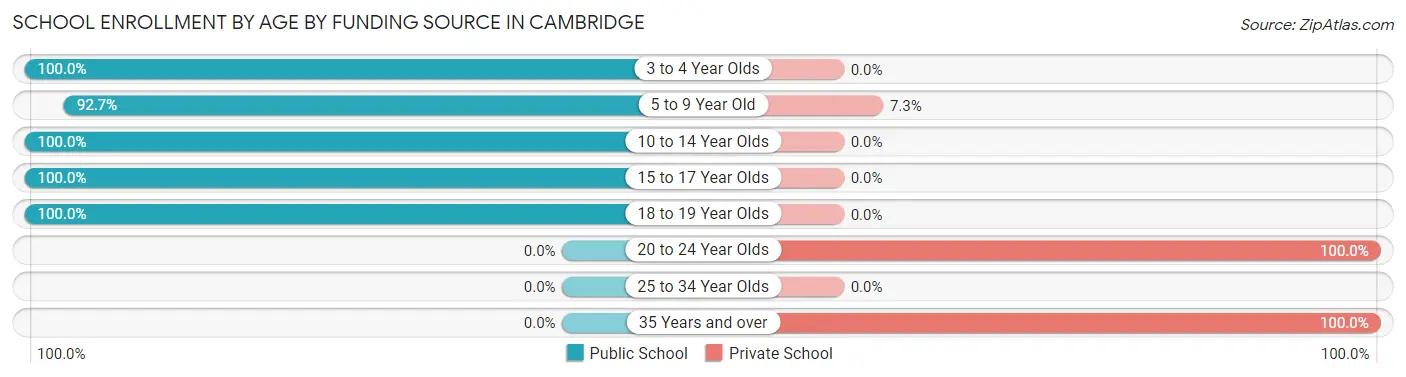
Out of a total of 712 students who are enrolled in schools in Cambridge, 155 (21.8%) attend a private institution, while the remaining 557 (78.2%) are enrolled in public schools. The age group of 20 to 24 year olds has the highest likelihood of being enrolled in private schools, with 124 (100.0% in the age bracket) enrolled. Conversely, the age group of 3 to 4 year olds has the lowest likelihood of being enrolled in a private school, with 31 (100.0% in the age bracket) attending a public institution.
| Age Bracket | Public School | Private School |
| 3 to 4 Year Olds | 31 (100.0%) | 0 (0.0%) |
| 5 to 9 Year Old | 152 (92.7%) | 12 (7.3%) |
| 10 to 14 Year Olds | 156 (100.0%) | 0 (0.0%) |
| 15 to 17 Year Olds | 176 (100.0%) | 0 (0.0%) |
| 18 to 19 Year Olds | 42 (100.0%) | 0 (0.0%) |
| 20 to 24 Year Olds | 0 (0.0%) | 124 (100.0%) |
| 25 to 34 Year Olds | 0 (0.0%) | 0 (0.0%) |
| 35 Years and over | 0 (0.0%) | 19 (100.0%) |
| Total | 557 (78.2%) | 155 (21.8%) |
Educational Attainment by Field of Study in Cambridge
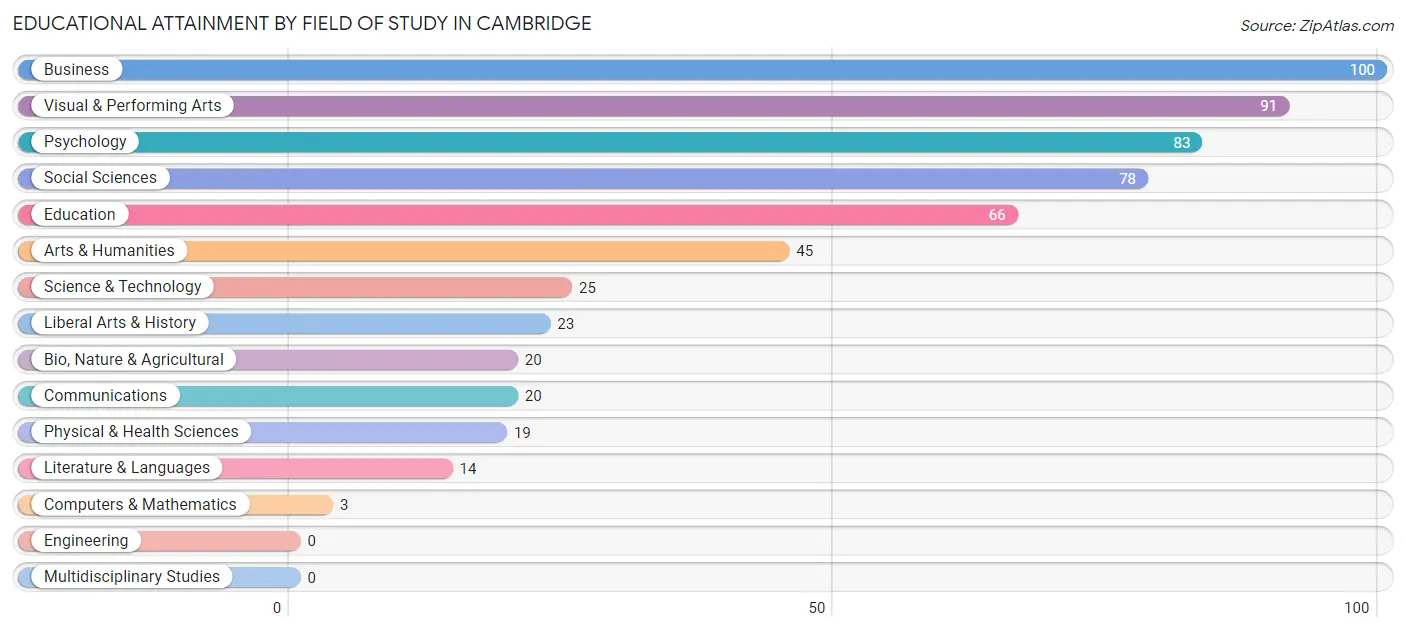
Business (100 | 17.0%), visual & performing arts (91 | 15.5%), psychology (83 | 14.1%), social sciences (78 | 13.3%), and education (66 | 11.2%) are the most common fields of study among 587 individuals in Cambridge who have obtained a bachelor's degree or higher.
| Field of Study | # Graduates | % Graduates |
| Computers & Mathematics | 3 | 0.5% |
| Bio, Nature & Agricultural | 20 | 3.4% |
| Physical & Health Sciences | 19 | 3.2% |
| Psychology | 83 | 14.1% |
| Social Sciences | 78 | 13.3% |
| Engineering | 0 | 0.0% |
| Multidisciplinary Studies | 0 | 0.0% |
| Science & Technology | 25 | 4.3% |
| Business | 100 | 17.0% |
| Education | 66 | 11.2% |
| Literature & Languages | 14 | 2.4% |
| Liberal Arts & History | 23 | 3.9% |
| Visual & Performing Arts | 91 | 15.5% |
| Communications | 20 | 3.4% |
| Arts & Humanities | 45 | 7.7% |
| Total | 587 | 100.0% |
Transportation & Commute in Cambridge
Vehicle Availability by Sex in Cambridge
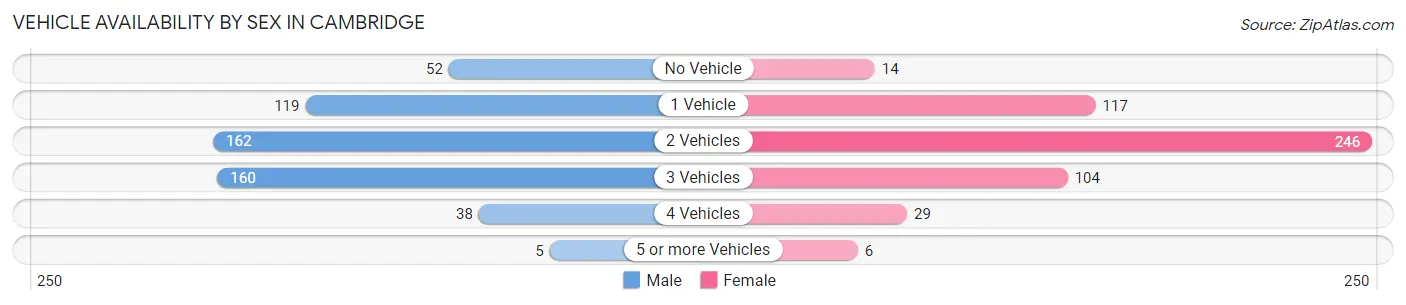
The most prevalent vehicle ownership categories in Cambridge are males with 2 vehicles (162, accounting for 30.2%) and females with 2 vehicles (246, making up 31.4%).
| Vehicles Available | Male | Female |
| No Vehicle | 52 (9.7%) | 14 (2.7%) |
| 1 Vehicle | 119 (22.2%) | 117 (22.7%) |
| 2 Vehicles | 162 (30.2%) | 246 (47.7%) |
| 3 Vehicles | 160 (29.8%) | 104 (20.2%) |
| 4 Vehicles | 38 (7.1%) | 29 (5.6%) |
| 5 or more Vehicles | 5 (0.9%) | 6 (1.2%) |
| Total | 536 (100.0%) | 516 (100.0%) |
Commute Time in Cambridge
The most frequently occuring commute durations in Cambridge are 45 to 59 minutes (315 commuters, 33.8%), less than 5 minutes (120 commuters, 12.9%), and 5 to 9 minutes (107 commuters, 11.5%).
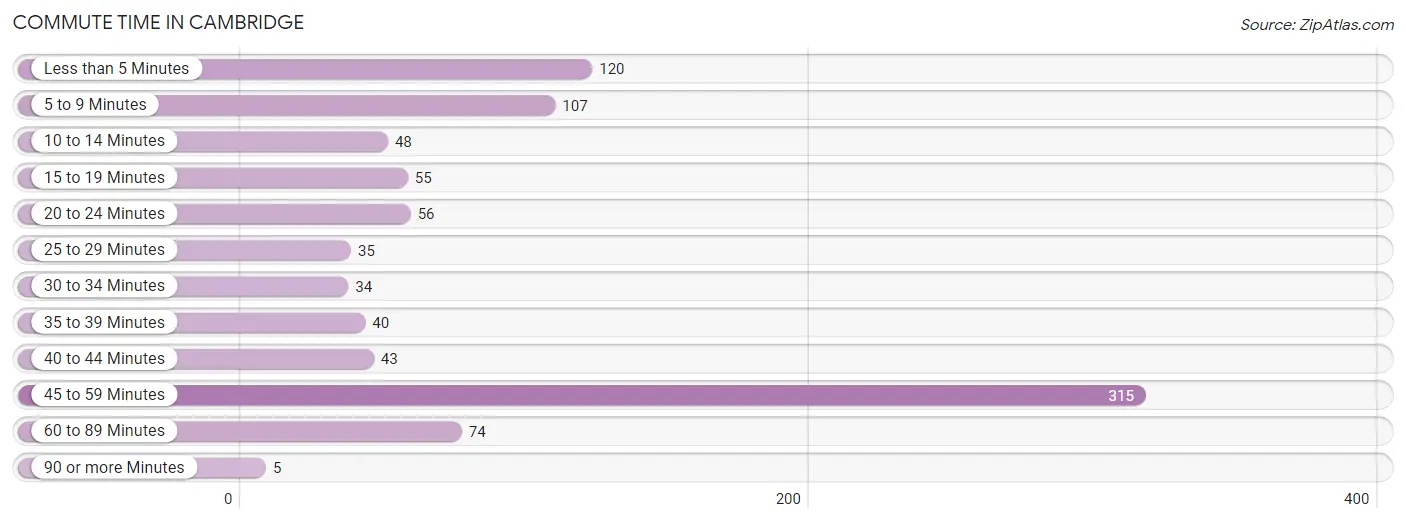
| Commute Time | # Commuters | % Commuters |
| Less than 5 Minutes | 120 | 12.9% |
| 5 to 9 Minutes | 107 | 11.5% |
| 10 to 14 Minutes | 48 | 5.1% |
| 15 to 19 Minutes | 55 | 5.9% |
| 20 to 24 Minutes | 56 | 6.0% |
| 25 to 29 Minutes | 35 | 3.8% |
| 30 to 34 Minutes | 34 | 3.6% |
| 35 to 39 Minutes | 40 | 4.3% |
| 40 to 44 Minutes | 43 | 4.6% |
| 45 to 59 Minutes | 315 | 33.8% |
| 60 to 89 Minutes | 74 | 7.9% |
| 90 or more Minutes | 5 | 0.5% |
Commute Time by Sex in Cambridge
The most common commute times in Cambridge are 45 to 59 minutes (141 commuters, 29.8%) for males and 45 to 59 minutes (174 commuters, 37.9%) for females.
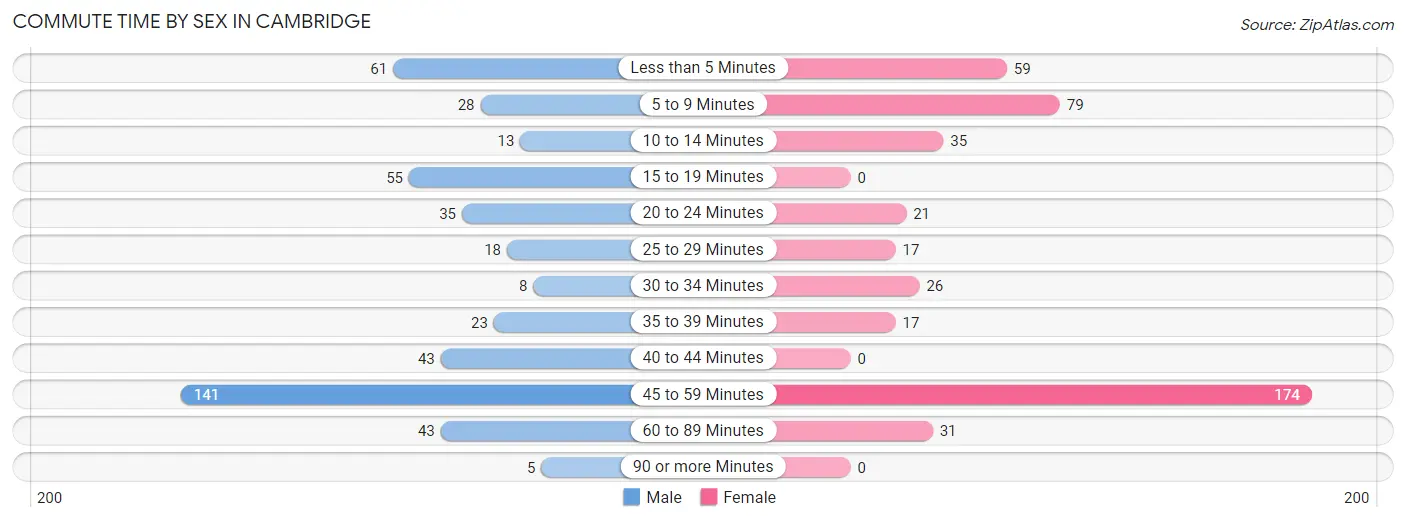
| Commute Time | Male | Female |
| Less than 5 Minutes | 61 (12.9%) | 59 (12.9%) |
| 5 to 9 Minutes | 28 (5.9%) | 79 (17.2%) |
| 10 to 14 Minutes | 13 (2.8%) | 35 (7.6%) |
| 15 to 19 Minutes | 55 (11.6%) | 0 (0.0%) |
| 20 to 24 Minutes | 35 (7.4%) | 21 (4.6%) |
| 25 to 29 Minutes | 18 (3.8%) | 17 (3.7%) |
| 30 to 34 Minutes | 8 (1.7%) | 26 (5.7%) |
| 35 to 39 Minutes | 23 (4.9%) | 17 (3.7%) |
| 40 to 44 Minutes | 43 (9.1%) | 0 (0.0%) |
| 45 to 59 Minutes | 141 (29.8%) | 174 (37.9%) |
| 60 to 89 Minutes | 43 (9.1%) | 31 (6.8%) |
| 90 or more Minutes | 5 (1.1%) | 0 (0.0%) |
Time of Departure to Work by Sex in Cambridge
The most frequent times of departure to work in Cambridge are 5:00 AM to 5:29 AM (72, 15.2%) for males and 7:30 AM to 7:59 AM (132, 28.8%) for females.
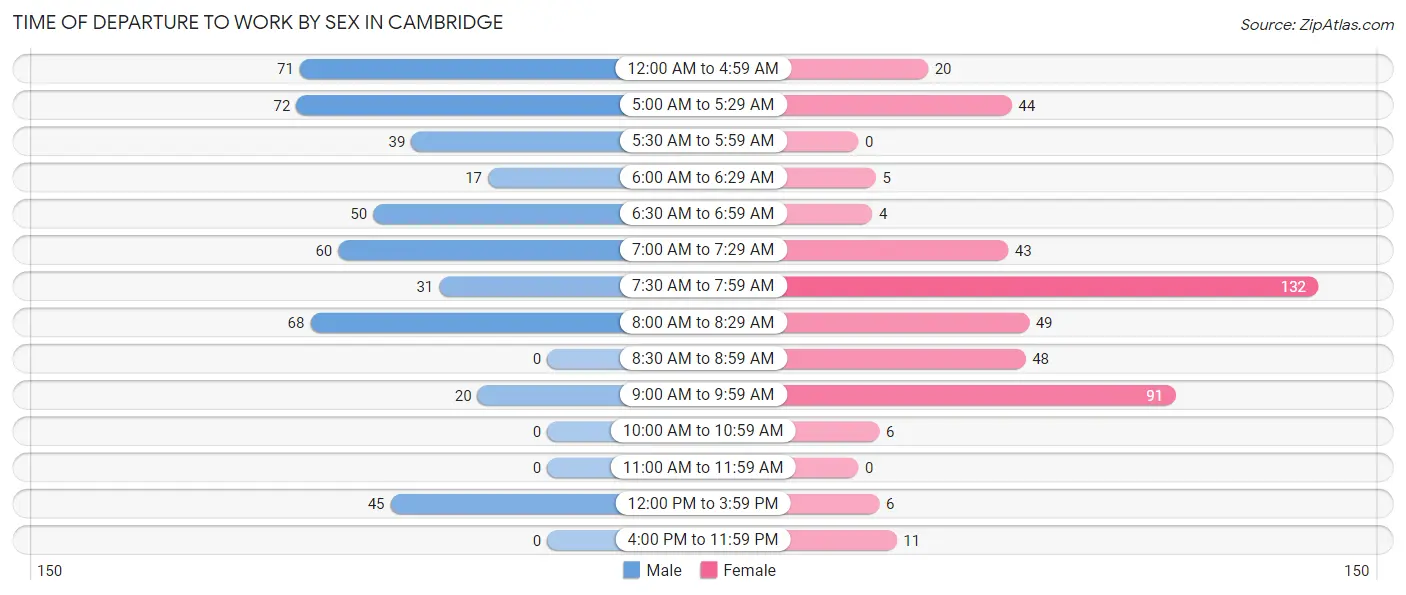
| Time of Departure | Male | Female |
| 12:00 AM to 4:59 AM | 71 (15.0%) | 20 (4.4%) |
| 5:00 AM to 5:29 AM | 72 (15.2%) | 44 (9.6%) |
| 5:30 AM to 5:59 AM | 39 (8.3%) | 0 (0.0%) |
| 6:00 AM to 6:29 AM | 17 (3.6%) | 5 (1.1%) |
| 6:30 AM to 6:59 AM | 50 (10.6%) | 4 (0.9%) |
| 7:00 AM to 7:29 AM | 60 (12.7%) | 43 (9.4%) |
| 7:30 AM to 7:59 AM | 31 (6.6%) | 132 (28.8%) |
| 8:00 AM to 8:29 AM | 68 (14.4%) | 49 (10.7%) |
| 8:30 AM to 8:59 AM | 0 (0.0%) | 48 (10.5%) |
| 9:00 AM to 9:59 AM | 20 (4.2%) | 91 (19.8%) |
| 10:00 AM to 10:59 AM | 0 (0.0%) | 6 (1.3%) |
| 11:00 AM to 11:59 AM | 0 (0.0%) | 0 (0.0%) |
| 12:00 PM to 3:59 PM | 45 (9.5%) | 6 (1.3%) |
| 4:00 PM to 11:59 PM | 0 (0.0%) | 11 (2.4%) |
| Total | 473 (100.0%) | 459 (100.0%) |
Housing Occupancy in Cambridge
Occupancy by Ownership in Cambridge
Of the total 999 dwellings in Cambridge, owner-occupied units account for 739 (74.0%), while renter-occupied units make up 260 (26.0%).
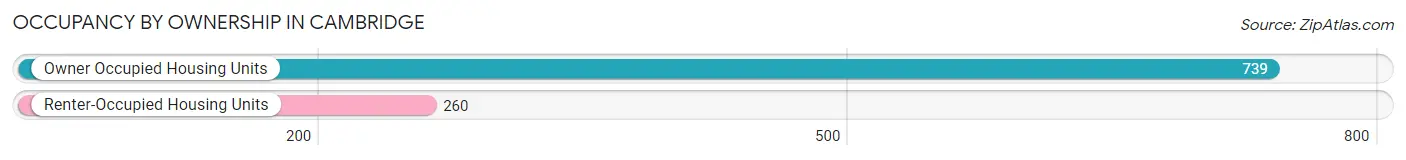
| Occupancy | # Housing Units | % Housing Units |
| Owner Occupied Housing Units | 739 | 74.0% |
| Renter-Occupied Housing Units | 260 | 26.0% |
| Total Occupied Housing Units | 999 | 100.0% |
Occupancy by Household Size in Cambridge
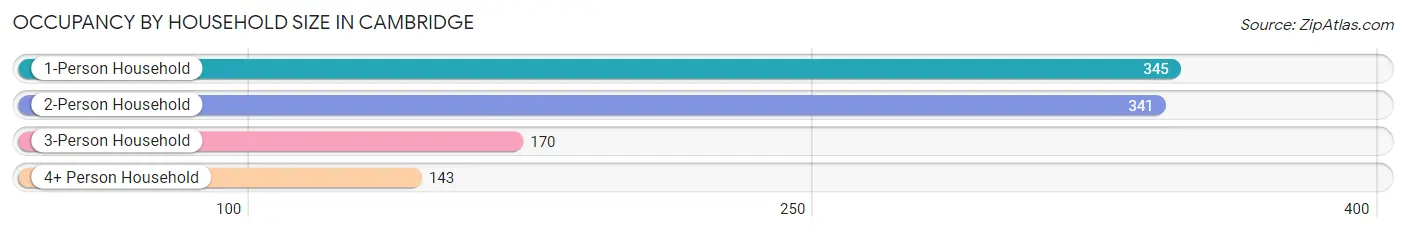
| Household Size | # Housing Units | % Housing Units |
| 1-Person Household | 345 | 34.5% |
| 2-Person Household | 341 | 34.1% |
| 3-Person Household | 170 | 17.0% |
| 4+ Person Household | 143 | 14.3% |
| Total Housing Units | 999 | 100.0% |
Occupancy by Ownership by Household Size in Cambridge
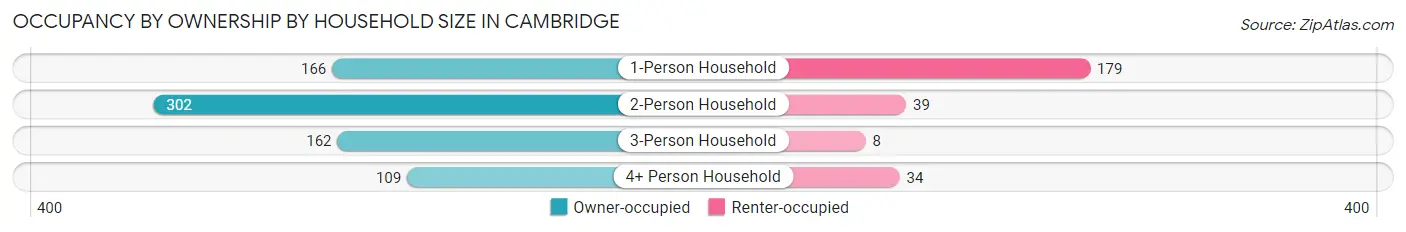
| Household Size | Owner-occupied | Renter-occupied |
| 1-Person Household | 166 (48.1%) | 179 (51.9%) |
| 2-Person Household | 302 (88.6%) | 39 (11.4%) |
| 3-Person Household | 162 (95.3%) | 8 (4.7%) |
| 4+ Person Household | 109 (76.2%) | 34 (23.8%) |
| Total Housing Units | 739 (74.0%) | 260 (26.0%) |
Occupancy by Educational Attainment in Cambridge
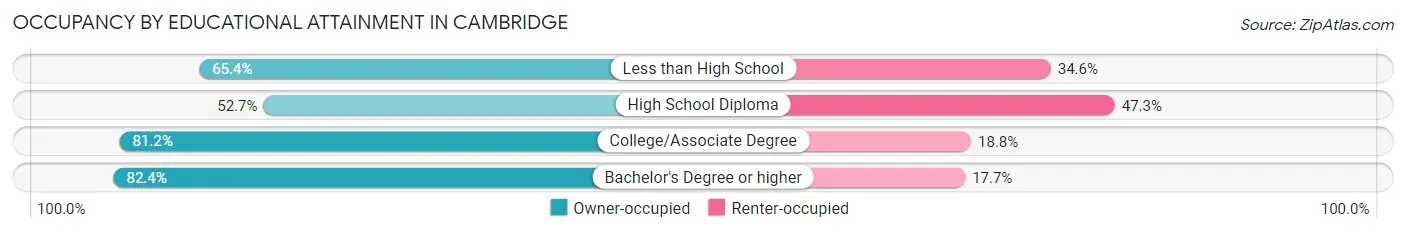
| Household Size | Owner-occupied | Renter-occupied |
| Less than High School | 51 (65.4%) | 27 (34.6%) |
| High School Diploma | 118 (52.7%) | 106 (47.3%) |
| College/Associate Degree | 276 (81.2%) | 64 (18.8%) |
| Bachelor's Degree or higher | 294 (82.4%) | 63 (17.6%) |
Occupancy by Age of Householder in Cambridge
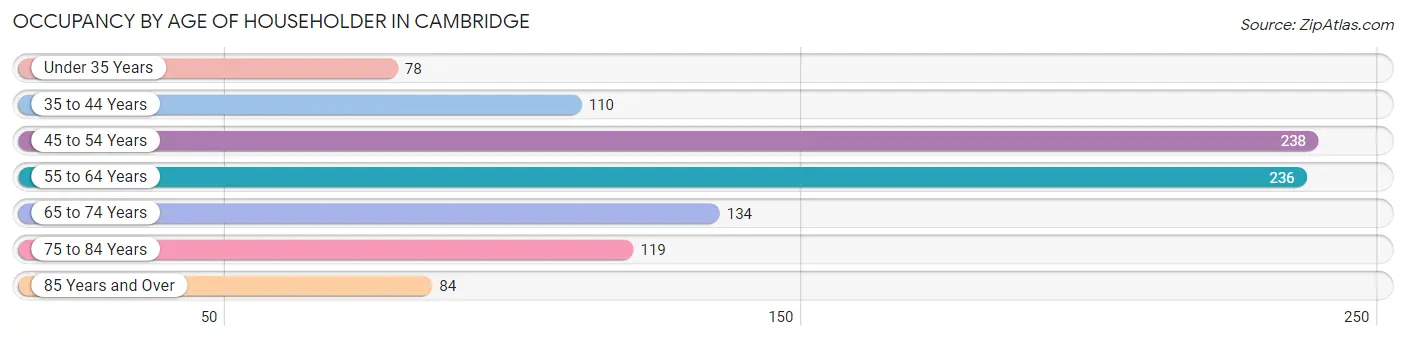
| Age Bracket | # Households | % Households |
| Under 35 Years | 78 | 7.8% |
| 35 to 44 Years | 110 | 11.0% |
| 45 to 54 Years | 238 | 23.8% |
| 55 to 64 Years | 236 | 23.6% |
| 65 to 74 Years | 134 | 13.4% |
| 75 to 84 Years | 119 | 11.9% |
| 85 Years and Over | 84 | 8.4% |
| Total | 999 | 100.0% |
Housing Finances in Cambridge
Median Income by Occupancy in Cambridge
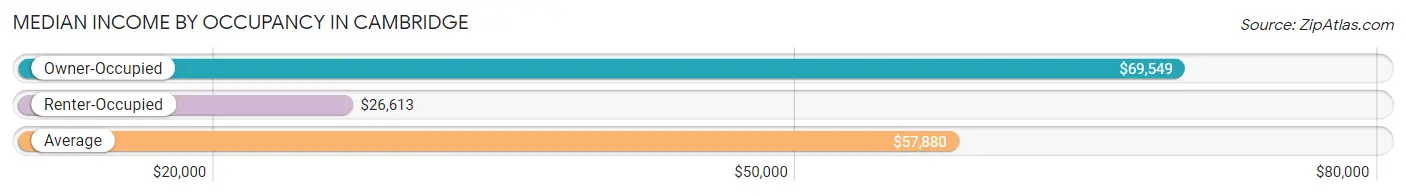
| Occupancy Type | # Households | Median Income |
| Owner-Occupied | 739 (74.0%) | $69,549 |
| Renter-Occupied | 260 (26.0%) | $26,613 |
| Average | 999 (100.0%) | $57,880 |
Occupancy by Householder Income Bracket in Cambridge
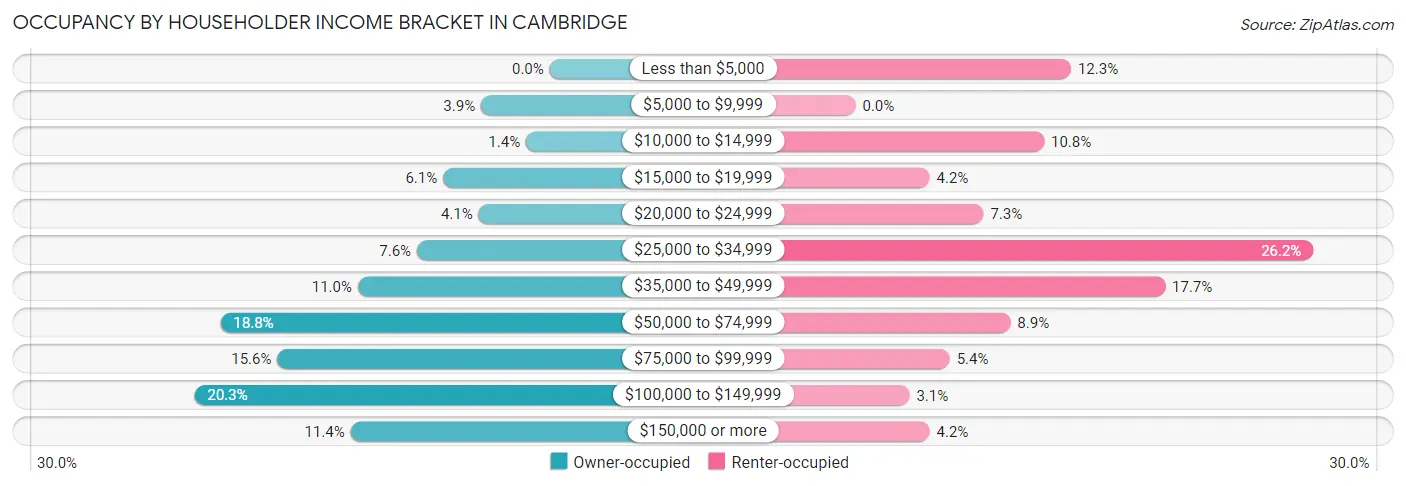
| Income Bracket | Owner-occupied | Renter-occupied |
| Less than $5,000 | 0 (0.0%) | 32 (12.3%) |
| $5,000 to $9,999 | 29 (3.9%) | 0 (0.0%) |
| $10,000 to $14,999 | 10 (1.3%) | 28 (10.8%) |
| $15,000 to $19,999 | 45 (6.1%) | 11 (4.2%) |
| $20,000 to $24,999 | 30 (4.1%) | 19 (7.3%) |
| $25,000 to $34,999 | 56 (7.6%) | 68 (26.2%) |
| $35,000 to $49,999 | 81 (11.0%) | 46 (17.7%) |
| $50,000 to $74,999 | 139 (18.8%) | 23 (8.8%) |
| $75,000 to $99,999 | 115 (15.6%) | 14 (5.4%) |
| $100,000 to $149,999 | 150 (20.3%) | 8 (3.1%) |
| $150,000 or more | 84 (11.4%) | 11 (4.2%) |
| Total | 739 (100.0%) | 260 (100.0%) |
Monthly Housing Cost Tiers in Cambridge
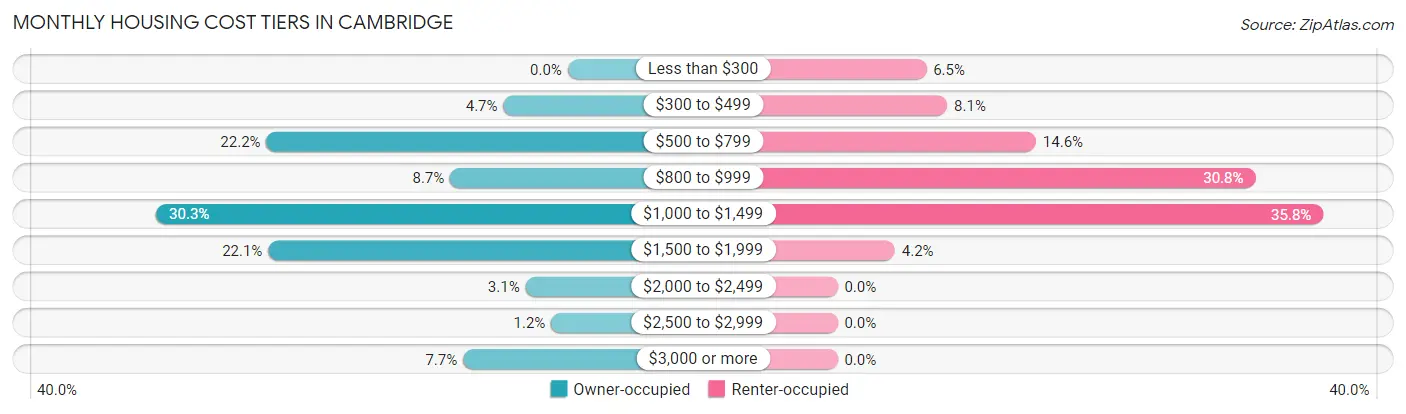
| Monthly Cost | Owner-occupied | Renter-occupied |
| Less than $300 | 0 (0.0%) | 17 (6.5%) |
| $300 to $499 | 35 (4.7%) | 21 (8.1%) |
| $500 to $799 | 164 (22.2%) | 38 (14.6%) |
| $800 to $999 | 64 (8.7%) | 80 (30.8%) |
| $1,000 to $1,499 | 224 (30.3%) | 93 (35.8%) |
| $1,500 to $1,999 | 163 (22.1%) | 11 (4.2%) |
| $2,000 to $2,499 | 23 (3.1%) | 0 (0.0%) |
| $2,500 to $2,999 | 9 (1.2%) | 0 (0.0%) |
| $3,000 or more | 57 (7.7%) | 0 (0.0%) |
| Total | 739 (100.0%) | 260 (100.0%) |
Physical Housing Characteristics in Cambridge
Housing Structures in Cambridge
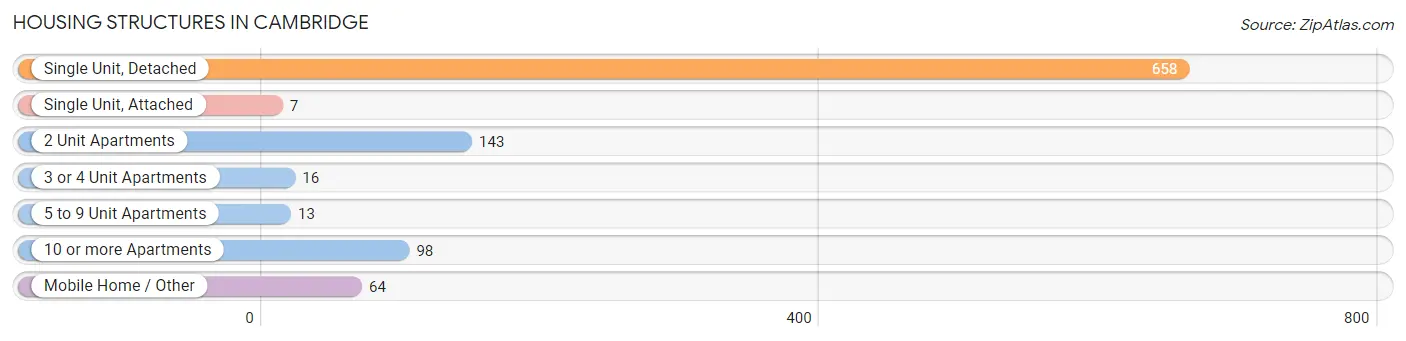
| Structure Type | # Housing Units | % Housing Units |
| Single Unit, Detached | 658 | 65.9% |
| Single Unit, Attached | 7 | 0.7% |
| 2 Unit Apartments | 143 | 14.3% |
| 3 or 4 Unit Apartments | 16 | 1.6% |
| 5 to 9 Unit Apartments | 13 | 1.3% |
| 10 or more Apartments | 98 | 9.8% |
| Mobile Home / Other | 64 | 6.4% |
| Total | 999 | 100.0% |
Housing Structures by Occupancy in Cambridge
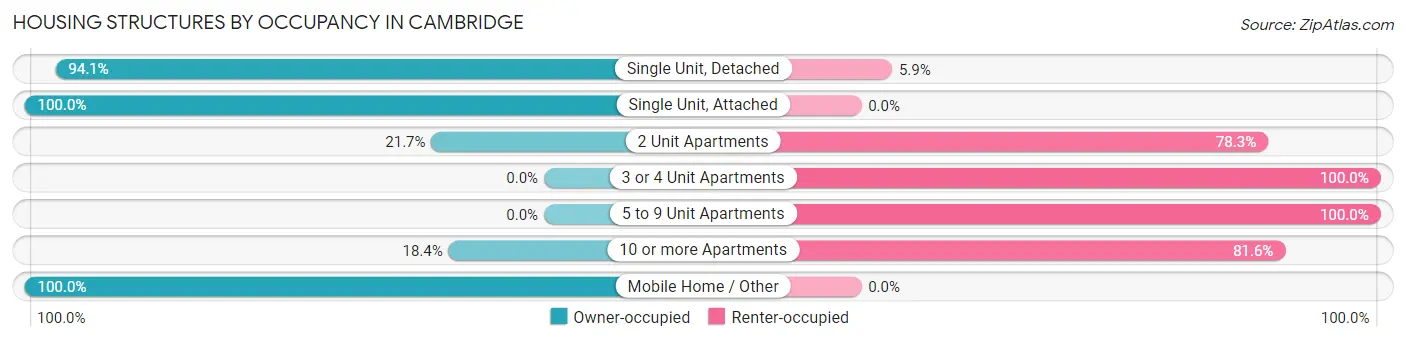
| Structure Type | Owner-occupied | Renter-occupied |
| Single Unit, Detached | 619 (94.1%) | 39 (5.9%) |
| Single Unit, Attached | 7 (100.0%) | 0 (0.0%) |
| 2 Unit Apartments | 31 (21.7%) | 112 (78.3%) |
| 3 or 4 Unit Apartments | 0 (0.0%) | 16 (100.0%) |
| 5 to 9 Unit Apartments | 0 (0.0%) | 13 (100.0%) |
| 10 or more Apartments | 18 (18.4%) | 80 (81.6%) |
| Mobile Home / Other | 64 (100.0%) | 0 (0.0%) |
| Total | 739 (74.0%) | 260 (26.0%) |
Housing Structures by Number of Rooms in Cambridge
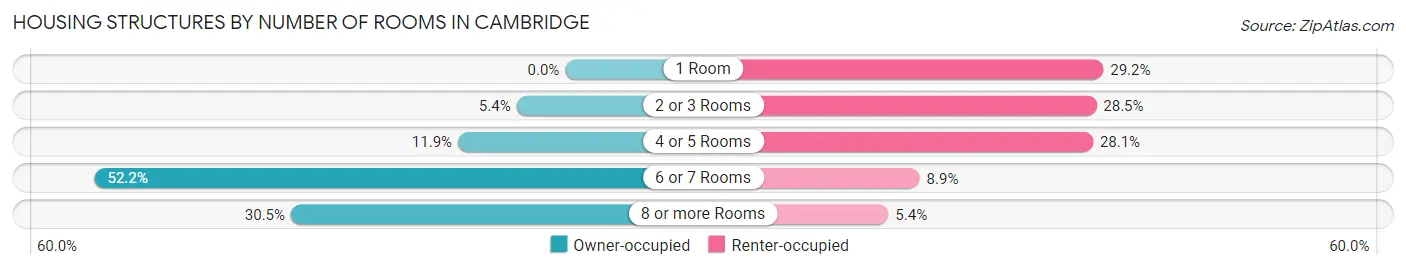
| Number of Rooms | Owner-occupied | Renter-occupied |
| 1 Room | 0 (0.0%) | 76 (29.2%) |
| 2 or 3 Rooms | 40 (5.4%) | 74 (28.5%) |
| 4 or 5 Rooms | 88 (11.9%) | 73 (28.1%) |
| 6 or 7 Rooms | 386 (52.2%) | 23 (8.8%) |
| 8 or more Rooms | 225 (30.4%) | 14 (5.4%) |
| Total | 739 (100.0%) | 260 (100.0%) |
Housing Structure by Heating Type in Cambridge
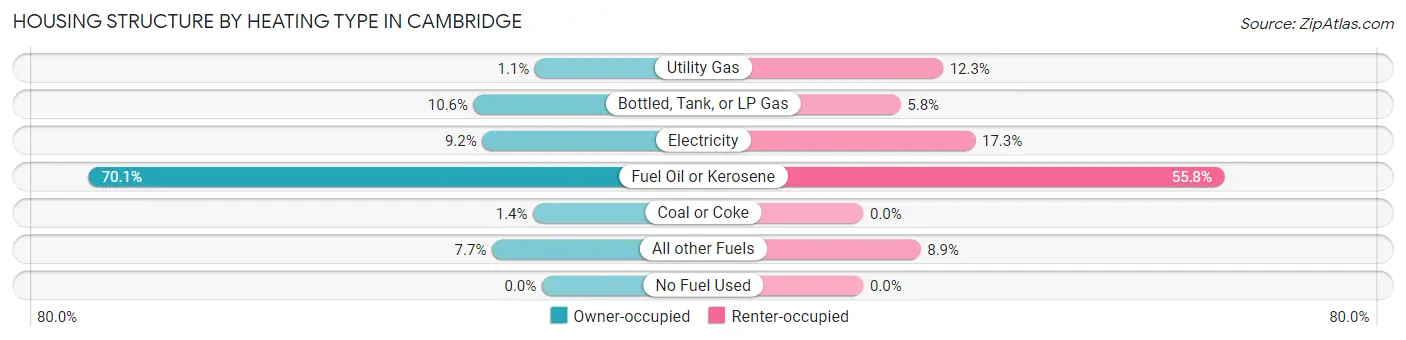
| Heating Type | Owner-occupied | Renter-occupied |
| Utility Gas | 8 (1.1%) | 32 (12.3%) |
| Bottled, Tank, or LP Gas | 78 (10.5%) | 15 (5.8%) |
| Electricity | 68 (9.2%) | 45 (17.3%) |
| Fuel Oil or Kerosene | 518 (70.1%) | 145 (55.8%) |
| Coal or Coke | 10 (1.3%) | 0 (0.0%) |
| All other Fuels | 57 (7.7%) | 23 (8.8%) |
| No Fuel Used | 0 (0.0%) | 0 (0.0%) |
| Total | 739 (100.0%) | 260 (100.0%) |
Household Vehicle Usage in Cambridge
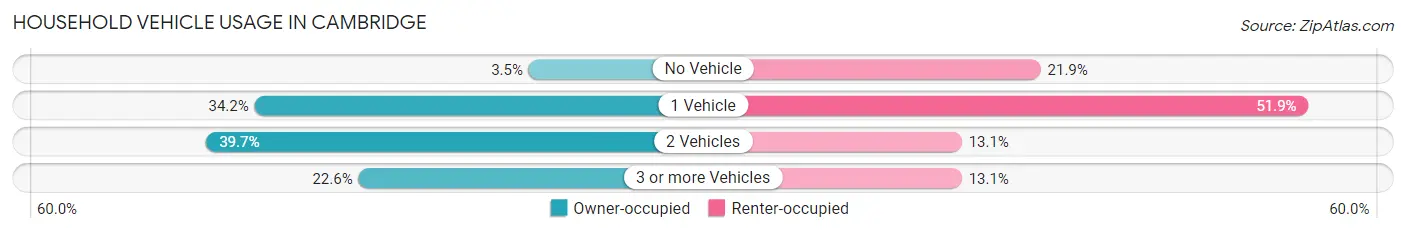
| Vehicles per Household | Owner-occupied | Renter-occupied |
| No Vehicle | 26 (3.5%) | 57 (21.9%) |
| 1 Vehicle | 253 (34.2%) | 135 (51.9%) |
| 2 Vehicles | 293 (39.7%) | 34 (13.1%) |
| 3 or more Vehicles | 167 (22.6%) | 34 (13.1%) |
| Total | 739 (100.0%) | 260 (100.0%) |
Real Estate & Mortgages in Cambridge
Real Estate and Mortgage Overview in Cambridge
| Characteristic | Without Mortgage | With Mortgage |
| Housing Units | 263 | 476 |
| Median Property Value | $164,400 | $167,900 |
| Median Household Income | $81,406 | $70 |
| Monthly Housing Costs | $750 | $57 |
| Real Estate Taxes | $4,378 | $41 |
Property Value by Mortgage Status in Cambridge
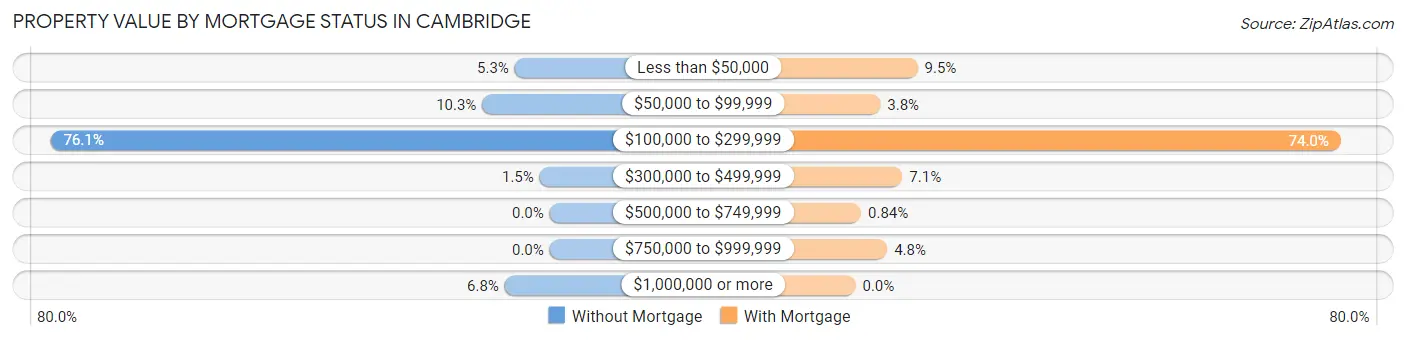
| Property Value | Without Mortgage | With Mortgage |
| Less than $50,000 | 14 (5.3%) | 45 (9.5%) |
| $50,000 to $99,999 | 27 (10.3%) | 18 (3.8%) |
| $100,000 to $299,999 | 200 (76.0%) | 352 (74.0%) |
| $300,000 to $499,999 | 4 (1.5%) | 34 (7.1%) |
| $500,000 to $749,999 | 0 (0.0%) | 4 (0.8%) |
| $750,000 to $999,999 | 0 (0.0%) | 23 (4.8%) |
| $1,000,000 or more | 18 (6.8%) | 0 (0.0%) |
| Total | 263 (100.0%) | 476 (100.0%) |
Household Income by Mortgage Status in Cambridge
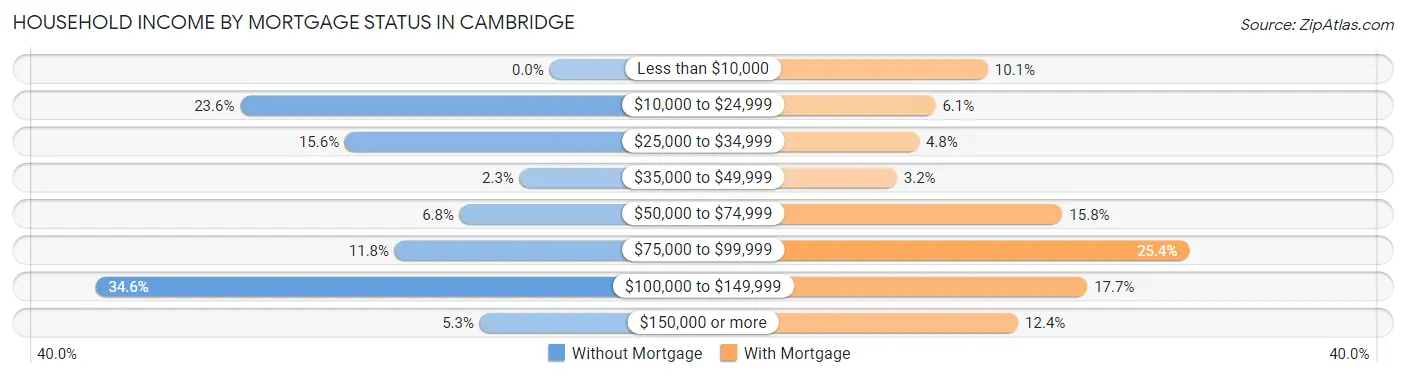
| Household Income | Without Mortgage | With Mortgage |
| Less than $10,000 | 0 (0.0%) | 48 (10.1%) |
| $10,000 to $24,999 | 62 (23.6%) | 29 (6.1%) |
| $25,000 to $34,999 | 41 (15.6%) | 23 (4.8%) |
| $35,000 to $49,999 | 6 (2.3%) | 15 (3.2%) |
| $50,000 to $74,999 | 18 (6.8%) | 75 (15.8%) |
| $75,000 to $99,999 | 31 (11.8%) | 121 (25.4%) |
| $100,000 to $149,999 | 91 (34.6%) | 84 (17.6%) |
| $150,000 or more | 14 (5.3%) | 59 (12.4%) |
| Total | 263 (100.0%) | 476 (100.0%) |
Property Value to Household Income Ratio in Cambridge
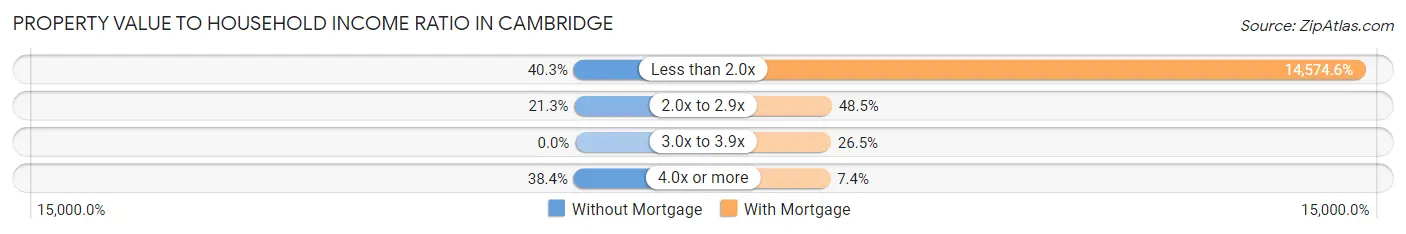
| Value-to-Income Ratio | Without Mortgage | With Mortgage |
| Less than 2.0x | 106 (40.3%) | 69,375 (14,574.6%) |
| 2.0x to 2.9x | 56 (21.3%) | 231 (48.5%) |
| 3.0x to 3.9x | 0 (0.0%) | 126 (26.5%) |
| 4.0x or more | 101 (38.4%) | 35 (7.3%) |
| Total | 263 (100.0%) | 476 (100.0%) |
Real Estate Taxes by Mortgage Status in Cambridge
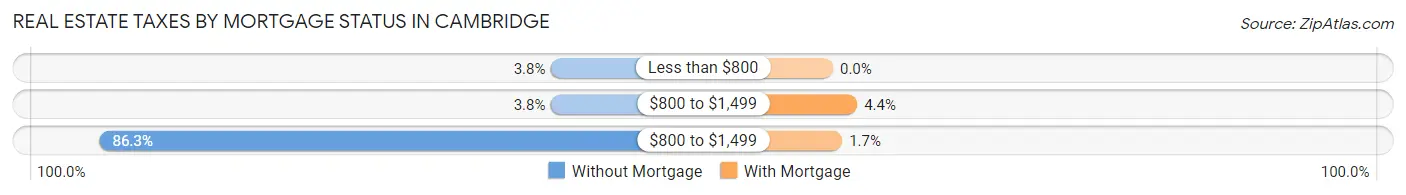
| Property Taxes | Without Mortgage | With Mortgage |
| Less than $800 | 10 (3.8%) | 0 (0.0%) |
| $800 to $1,499 | 10 (3.8%) | 21 (4.4%) |
| $800 to $1,499 | 227 (86.3%) | 8 (1.7%) |
| Total | 263 (100.0%) | 476 (100.0%) |
Health & Disability in Cambridge
Health Insurance Coverage by Age in Cambridge
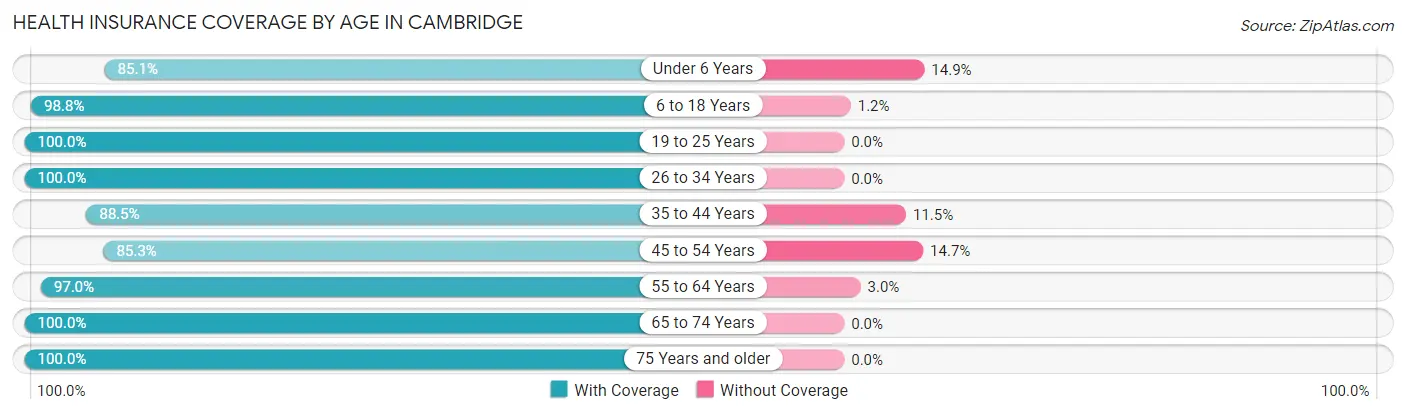
| Age Bracket | With Coverage | Without Coverage |
| Under 6 Years | 74 (85.1%) | 13 (14.9%) |
| 6 to 18 Years | 488 (98.8%) | 6 (1.2%) |
| 19 to 25 Years | 240 (100.0%) | 0 (0.0%) |
| 26 to 34 Years | 116 (100.0%) | 0 (0.0%) |
| 35 to 44 Years | 192 (88.5%) | 25 (11.5%) |
| 45 to 54 Years | 342 (85.3%) | 59 (14.7%) |
| 55 to 64 Years | 351 (97.0%) | 11 (3.0%) |
| 65 to 74 Years | 211 (100.0%) | 0 (0.0%) |
| 75 Years and older | 262 (100.0%) | 0 (0.0%) |
| Total | 2,276 (95.2%) | 114 (4.8%) |
Health Insurance Coverage by Citizenship Status in Cambridge
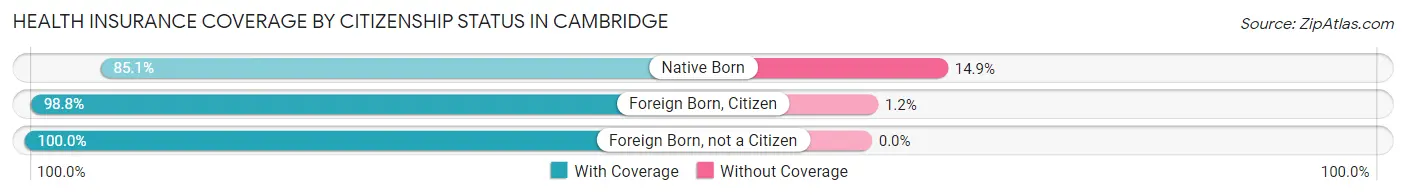
| Citizenship Status | With Coverage | Without Coverage |
| Native Born | 74 (85.1%) | 13 (14.9%) |
| Foreign Born, Citizen | 488 (98.8%) | 6 (1.2%) |
| Foreign Born, not a Citizen | 240 (100.0%) | 0 (0.0%) |
Health Insurance Coverage by Household Income in Cambridge
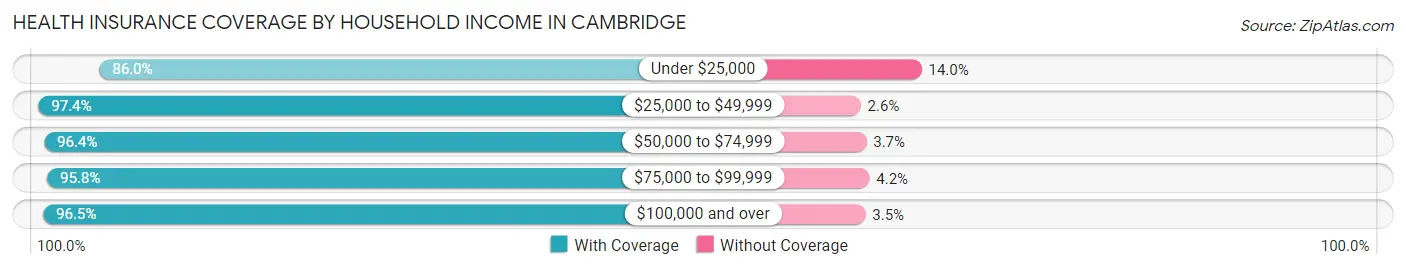
| Household Income | With Coverage | Without Coverage |
| Under $25,000 | 270 (86.0%) | 44 (14.0%) |
| $25,000 to $49,999 | 416 (97.4%) | 11 (2.6%) |
| $50,000 to $74,999 | 396 (96.4%) | 15 (3.6%) |
| $75,000 to $99,999 | 294 (95.8%) | 13 (4.2%) |
| $100,000 and over | 863 (96.5%) | 31 (3.5%) |
Public vs Private Health Insurance Coverage by Age in Cambridge
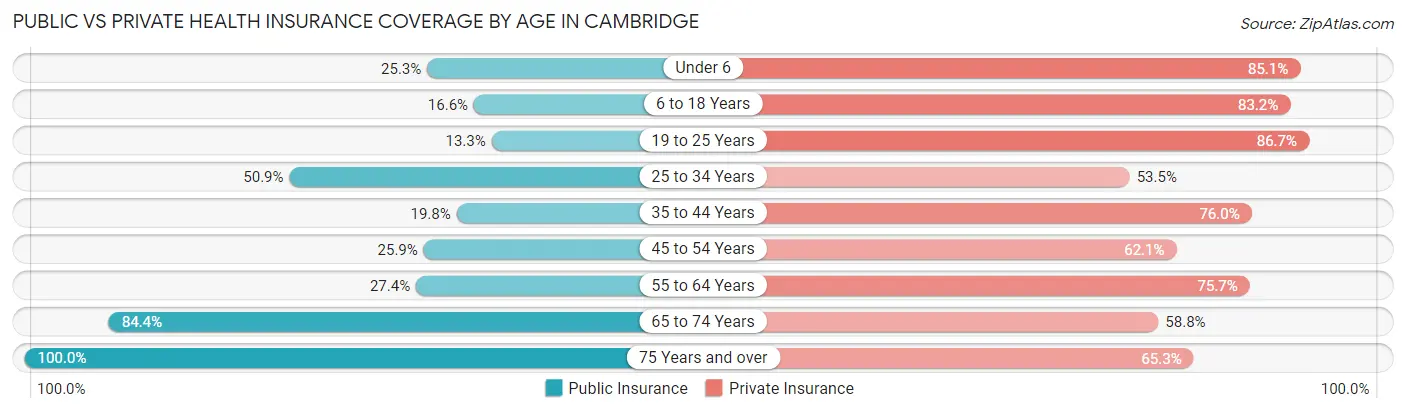
| Age Bracket | Public Insurance | Private Insurance |
| Under 6 | 22 (25.3%) | 74 (85.1%) |
| 6 to 18 Years | 82 (16.6%) | 411 (83.2%) |
| 19 to 25 Years | 32 (13.3%) | 208 (86.7%) |
| 25 to 34 Years | 59 (50.9%) | 62 (53.4%) |
| 35 to 44 Years | 43 (19.8%) | 165 (76.0%) |
| 45 to 54 Years | 104 (25.9%) | 249 (62.1%) |
| 55 to 64 Years | 99 (27.4%) | 274 (75.7%) |
| 65 to 74 Years | 178 (84.4%) | 124 (58.8%) |
| 75 Years and over | 262 (100.0%) | 171 (65.3%) |
| Total | 881 (36.9%) | 1,738 (72.7%) |
Disability Status by Sex by Age in Cambridge
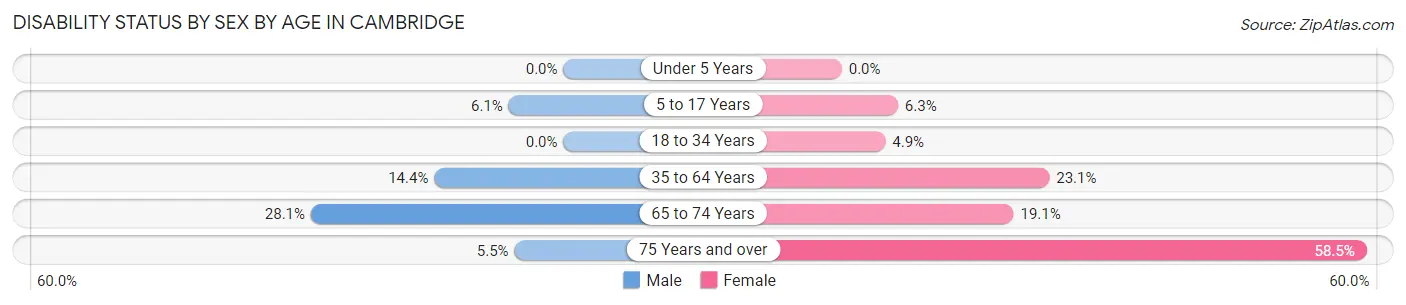
| Age Bracket | Male | Female |
| Under 5 Years | 0 (0.0%) | 0 (0.0%) |
| 5 to 17 Years | 12 (6.1%) | 19 (6.2%) |
| 18 to 34 Years | 0 (0.0%) | 13 (4.9%) |
| 35 to 64 Years | 65 (14.4%) | 122 (23.1%) |
| 65 to 74 Years | 27 (28.1%) | 22 (19.1%) |
| 75 Years and over | 3 (5.4%) | 121 (58.5%) |
Disability Class by Sex by Age in Cambridge
Disability Class: Hearing Difficulty
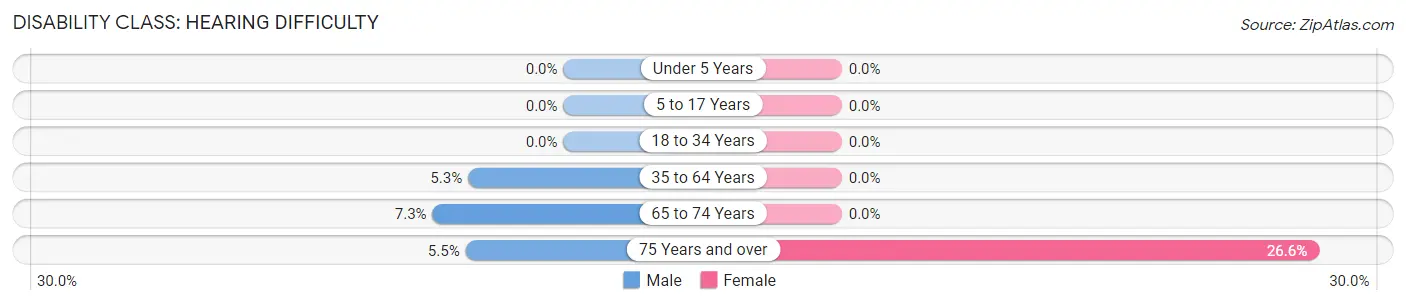
| Age Bracket | Male | Female |
| Under 5 Years | 0 (0.0%) | 0 (0.0%) |
| 5 to 17 Years | 0 (0.0%) | 0 (0.0%) |
| 18 to 34 Years | 0 (0.0%) | 0 (0.0%) |
| 35 to 64 Years | 24 (5.3%) | 0 (0.0%) |
| 65 to 74 Years | 7 (7.3%) | 0 (0.0%) |
| 75 Years and over | 3 (5.4%) | 55 (26.6%) |
Disability Class: Vision Difficulty
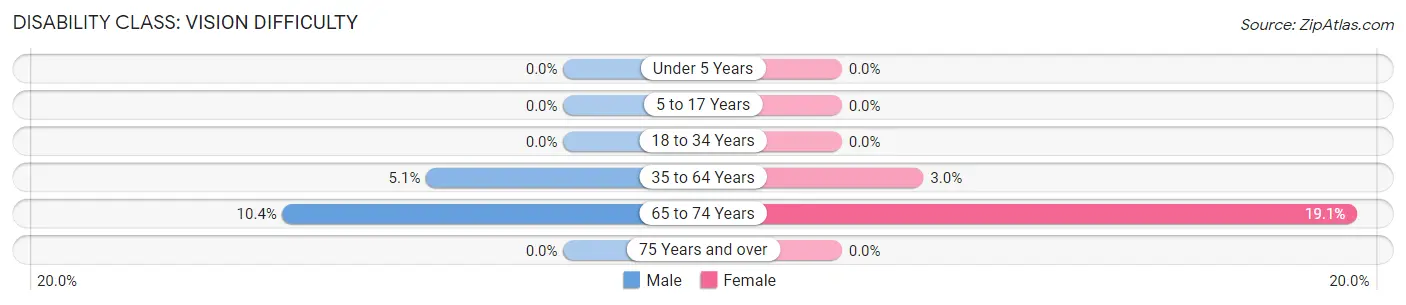
| Age Bracket | Male | Female |
| Under 5 Years | 0 (0.0%) | 0 (0.0%) |
| 5 to 17 Years | 0 (0.0%) | 0 (0.0%) |
| 18 to 34 Years | 0 (0.0%) | 0 (0.0%) |
| 35 to 64 Years | 23 (5.1%) | 16 (3.0%) |
| 65 to 74 Years | 10 (10.4%) | 22 (19.1%) |
| 75 Years and over | 0 (0.0%) | 0 (0.0%) |
Disability Class: Cognitive Difficulty
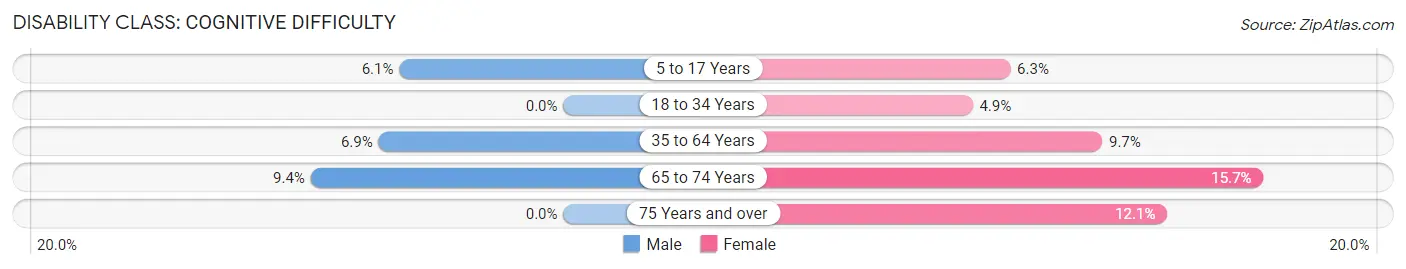
| Age Bracket | Male | Female |
| 5 to 17 Years | 12 (6.1%) | 19 (6.2%) |
| 18 to 34 Years | 0 (0.0%) | 13 (4.9%) |
| 35 to 64 Years | 31 (6.9%) | 51 (9.7%) |
| 65 to 74 Years | 9 (9.4%) | 18 (15.7%) |
| 75 Years and over | 0 (0.0%) | 25 (12.1%) |
Disability Class: Ambulatory Difficulty
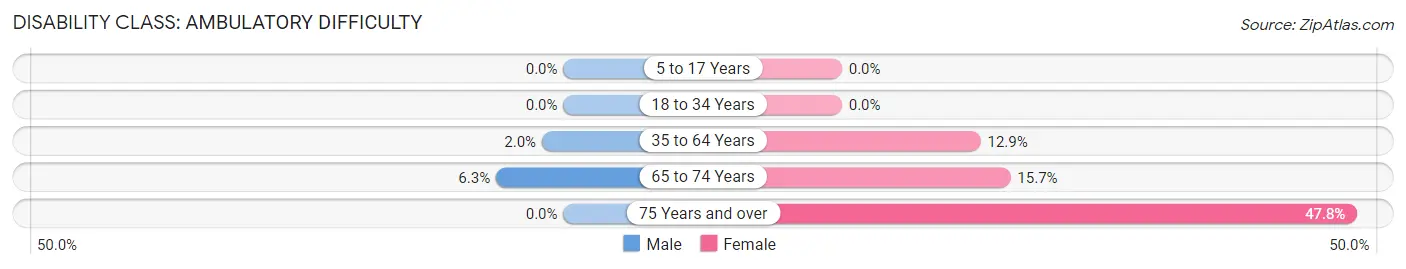
| Age Bracket | Male | Female |
| 5 to 17 Years | 0 (0.0%) | 0 (0.0%) |
| 18 to 34 Years | 0 (0.0%) | 0 (0.0%) |
| 35 to 64 Years | 9 (2.0%) | 68 (12.9%) |
| 65 to 74 Years | 6 (6.2%) | 18 (15.7%) |
| 75 Years and over | 0 (0.0%) | 99 (47.8%) |
Disability Class: Self-Care Difficulty
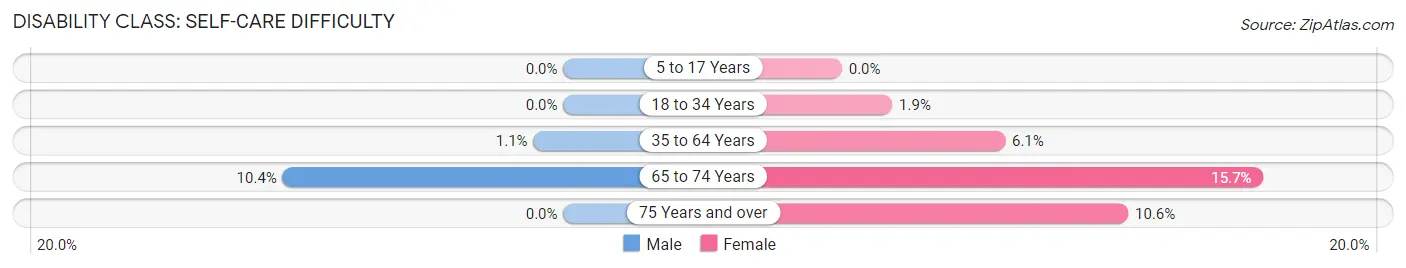
| Age Bracket | Male | Female |
| 5 to 17 Years | 0 (0.0%) | 0 (0.0%) |
| 18 to 34 Years | 0 (0.0%) | 5 (1.9%) |
| 35 to 64 Years | 5 (1.1%) | 32 (6.1%) |
| 65 to 74 Years | 10 (10.4%) | 18 (15.7%) |
| 75 Years and over | 0 (0.0%) | 22 (10.6%) |
Technology Access in Cambridge
Computing Device Access in Cambridge
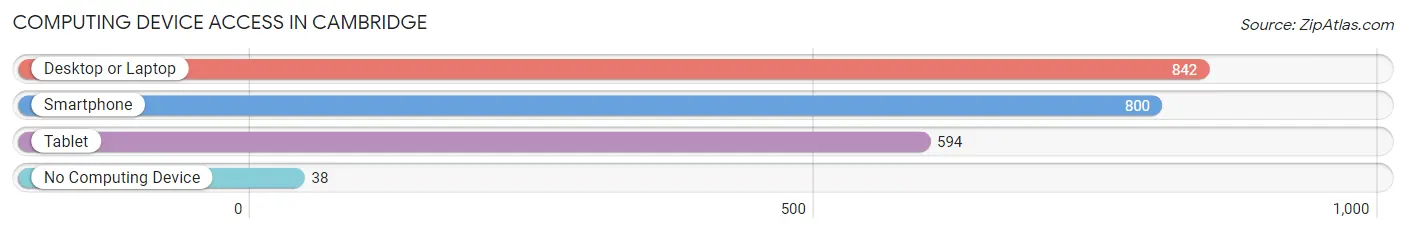
| Device Type | # Households | % Households |
| Desktop or Laptop | 842 | 84.3% |
| Smartphone | 800 | 80.1% |
| Tablet | 594 | 59.5% |
| No Computing Device | 38 | 3.8% |
| Total | 999 | 100.0% |
Internet Access in Cambridge
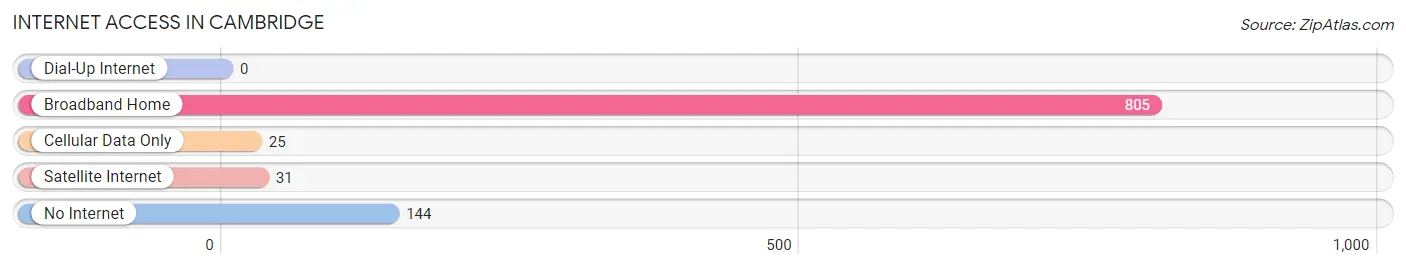
| Internet Type | # Households | % Households |
| Dial-Up Internet | 0 | 0.0% |
| Broadband Home | 805 | 80.6% |
| Cellular Data Only | 25 | 2.5% |
| Satellite Internet | 31 | 3.1% |
| No Internet | 144 | 14.4% |
| Total | 999 | 100.0% |
Cambridge Summary
Cambridge is a town located in Washington County, New York, United States. It is part of the Glens Falls Metropolitan Statistical Area. The population was 1,871 at the 2010 census.
History
The area that is now Cambridge was first settled in 1766 by a group of settlers from Connecticut. The town was originally part of Albany County, but was later transferred to Washington County in 1791. The town was officially established in 1788 and was named after the city of Cambridge, Massachusetts.
The town was an important center of the iron industry in the 19th century. The Cambridge Iron Works was established in 1810 and was one of the largest iron works in the country. The iron works closed in 1876, but the town continued to be an important center of industry. The Cambridge Tannery was established in 1820 and was one of the largest tanneries in the country. The tannery closed in 1876, but the town continued to be an important center of industry.
Geography
Cambridge is located in the eastern part of Washington County, in the foothills of the Adirondack Mountains. The town is bordered by the towns of White Creek to the north, Jackson to the east, Salem to the south, and Easton to the west.
The Batten Kill, a tributary of the Hudson River, flows through the town. The town is located in the Batten Kill Valley, which is known for its scenic beauty.
The town has a total area of 36.2 square miles, of which 36.1 square miles is land and 0.1 square miles is water.
Economy
The economy of Cambridge is largely based on agriculture and tourism. The town is home to several farms, including dairy farms, vegetable farms, and apple orchards. The town is also home to several wineries and breweries.
Tourism is an important part of the economy of Cambridge. The town is home to several historic sites, including the Cambridge Iron Works, the Cambridge Tannery, and the Batten Kill Valley Railroad. The town is also home to several parks and recreational areas, including the Cambridge Valley State Park and the Batten Kill State Forest.
Demographics
As of the census of 2010, there were 1,871 people, 745 households, and 498 families residing in the town. The population density was 51.9 people per square mile. There were 845 housing units at an average density of 23.3 per square mile. The racial makeup of the town was 97.2% White, 0.7% African American, 0.2% Native American, 0.3% Asian, 0.1% Pacific Islander, 0.3% from other races, and 1.2% from two or more races. Hispanic or Latino of any race were 1.3% of the population.
There were 745 households, out of which 28.3% had children under the age of 18 living with them, 51.2% were married couples living together, 9.7% had a female householder with no husband present, and 34.2% were non-families. 28.3% of all households were made up of individuals, and 12.7% had someone living alone who was 65 years of age or older. The average household size was 2.50 and the average family size was 3.06.
In the town, the population was spread out, with 24.2% under the age of 18, 6.7% from 18 to 24, 25.7% from 25 to 44, 28.2% from 45 to 64, and 15.2% who were 65 years of age or older. The median age was 40 years. For every 100 females, there were 97.2 males. For every 100 females age 18 and over, there were 94.2 males.
The median income for a household in the town was $41,250, and the median income for a family was $50,000. Males had a median income of $35,000 versus $25,000 for females. The per capita income for the town was $20,945. About 6.2% of families and 8.7% of the population were below the poverty line, including 10.2% of those under age 18 and 8.2% of those age 65 or over.
Common Questions
What is Per Capita Income in Cambridge?
Per Capita income in Cambridge is $32,822.
What is the Median Family Income in Cambridge?
Median Family Income in Cambridge is $72,250.
What is the Median Household income in Cambridge?
Median Household Income in Cambridge is $57,880.
What is Income or Wage Gap in Cambridge?
Income or Wage Gap in Cambridge is 36.9%.
Women in Cambridge earn 63.1 cents for every dollar earned by a man.
What is Inequality or Gini Index in Cambridge?
Inequality or Gini Index in Cambridge is 0.45.
What is the Total Population of Cambridge?
Total Population of Cambridge is 2,390.
What is the Total Male Population of Cambridge?
Total Male Population of Cambridge is 937.
What is the Total Female Population of Cambridge?
Total Female Population of Cambridge is 1,453.
What is the Ratio of Males per 100 Females in Cambridge?
There are 64.49 Males per 100 Females in Cambridge.
What is the Ratio of Females per 100 Males in Cambridge?
There are 155.07 Females per 100 Males in Cambridge.
What is the Median Population Age in Cambridge?
Median Population Age in Cambridge is 48.0 Years.
What is the Average Family Size in Cambridge
Average Family Size in Cambridge is 2.9 People.
What is the Average Household Size in Cambridge
Average Household Size in Cambridge is 2.4 People.
How Large is the Labor Force in Cambridge?
There are 1,121 People in the Labor Forcein in Cambridge.
What is the Percentage of People in the Labor Force in Cambridge?
55.0% of People are in the Labor Force in Cambridge.
What is the Unemployment Rate in Cambridge?
Unemployment Rate in Cambridge is 5.5%.