Melville, NY Map & Demographics
Melville Map
Melville Overview
$85,127
PER CAPITA INCOME
$189,022
AVG FAMILY INCOME
$146,302
AVG HOUSEHOLD INCOME
38.3%
WAGE / INCOME GAP [ % ]
61.7¢/ $1
WAGE / INCOME GAP [ $ ]
$12,315
FAMILY INCOME DEFICIT
0.51
INEQUALITY / GINI INDEX
18,526
TOTAL POPULATION
8,362
MALE POPULATION
10,164
FEMALE POPULATION
82.27
MALES / 100 FEMALES
121.55
FEMALES / 100 MALES
51.1
MEDIAN AGE
3.1
AVG FAMILY SIZE
2.5
AVG HOUSEHOLD SIZE
10,036
LABOR FORCE [ PEOPLE ]
64.5%
PERCENT IN LABOR FORCE
8.3%
UNEMPLOYMENT RATE
Melville Zip Codes
Income in Melville
Income Overview in Melville
Per Capita Income in Melville is $85,127, while median incomes of families and households are $189,022 and $146,302 respectively.
| Characteristic | Number | Measure |
| Per Capita Income | 18,526 | $85,127 |
| Median Family Income | 4,738 | $189,022 |
| Mean Family Income | 4,738 | $261,507 |
| Median Household Income | 7,178 | $146,302 |
| Mean Household Income | 7,178 | $212,900 |
| Income Deficit | 4,738 | $12,315 |
| Wage / Income Gap (%) | 18,526 | 38.32% |
| Wage / Income Gap ($) | 18,526 | 61.68¢ per $1 |
| Gini / Inequality Index | 18,526 | 0.51 |
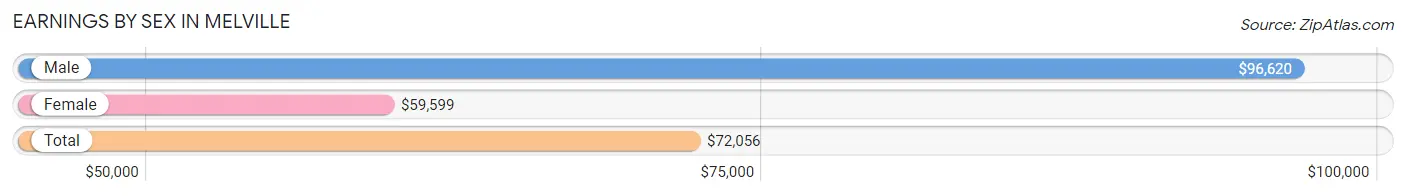
Earnings by Sex in Melville
Average Earnings in Melville are $72,056, $96,620 for men and $59,599 for women, a difference of 38.3%.
| Sex | Number | Average Earnings |
| Male | 4,811 (48.6%) | $96,620 |
| Female | 5,079 (51.3%) | $59,599 |
| Total | 9,890 (100.0%) | $72,056 |
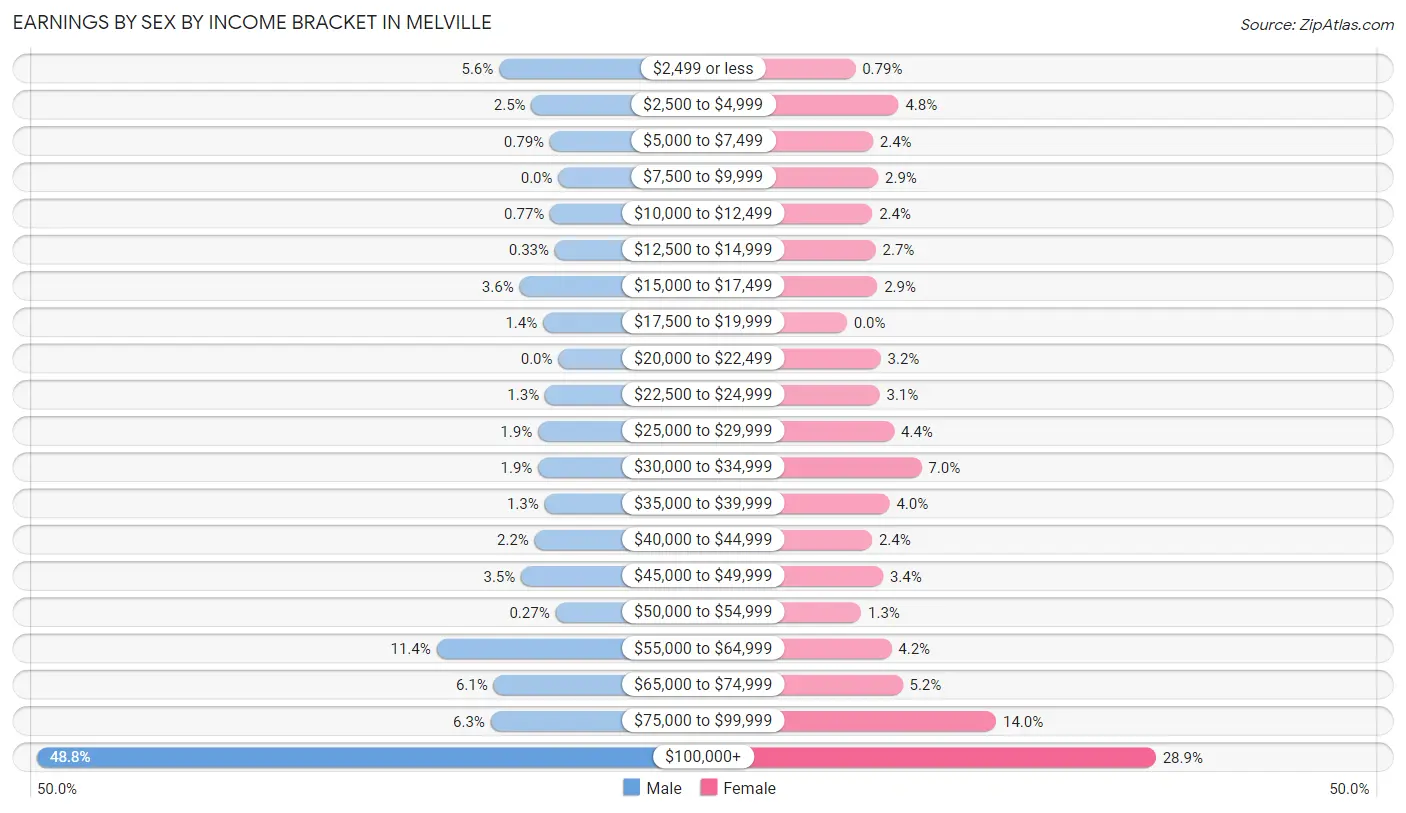
Earnings by Sex by Income Bracket in Melville
The most common earnings brackets in Melville are $100,000+ for men (2,349 | 48.8%) and $100,000+ for women (1,470 | 28.9%).
| Income | Male | Female |
| $2,499 or less | 267 (5.6%) | 40 (0.8%) |
| $2,500 to $4,999 | 121 (2.5%) | 246 (4.8%) |
| $5,000 to $7,499 | 38 (0.8%) | 124 (2.4%) |
| $7,500 to $9,999 | 0 (0.0%) | 149 (2.9%) |
| $10,000 to $12,499 | 37 (0.8%) | 121 (2.4%) |
| $12,500 to $14,999 | 16 (0.3%) | 137 (2.7%) |
| $15,000 to $17,499 | 175 (3.6%) | 145 (2.9%) |
| $17,500 to $19,999 | 69 (1.4%) | 0 (0.0%) |
| $20,000 to $22,499 | 0 (0.0%) | 161 (3.2%) |
| $22,500 to $24,999 | 60 (1.3%) | 156 (3.1%) |
| $25,000 to $29,999 | 92 (1.9%) | 225 (4.4%) |
| $30,000 to $34,999 | 91 (1.9%) | 355 (7.0%) |
| $35,000 to $39,999 | 62 (1.3%) | 203 (4.0%) |
| $40,000 to $44,999 | 107 (2.2%) | 120 (2.4%) |
| $45,000 to $49,999 | 168 (3.5%) | 172 (3.4%) |
| $50,000 to $54,999 | 13 (0.3%) | 68 (1.3%) |
| $55,000 to $64,999 | 549 (11.4%) | 212 (4.2%) |
| $65,000 to $74,999 | 292 (6.1%) | 265 (5.2%) |
| $75,000 to $99,999 | 305 (6.3%) | 710 (14.0%) |
| $100,000+ | 2,349 (48.8%) | 1,470 (28.9%) |
| Total | 4,811 (100.0%) | 5,079 (100.0%) |
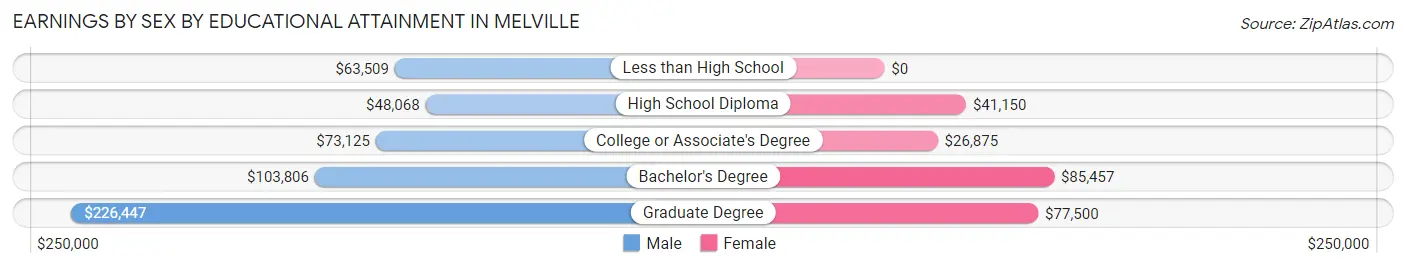
Earnings by Sex by Educational Attainment in Melville
Average earnings in Melville are $113,955 for men and $70,952 for women, a difference of 37.7%. Men with an educational attainment of graduate degree enjoy the highest average annual earnings of $226,447, while those with high school diploma education earn the least with $48,068. Women with an educational attainment of bachelor's degree earn the most with the average annual earnings of $85,457, while those with college or associate's degree education have the smallest earnings of $26,875.
| Educational Attainment | Male Income | Female Income |
| Less than High School | $63,509 | $0 |
| High School Diploma | $48,068 | $41,150 |
| College or Associate's Degree | $73,125 | $26,875 |
| Bachelor's Degree | $103,806 | $85,457 |
| Graduate Degree | $226,447 | $77,500 |
| Total | $113,955 | $70,952 |
Family Income in Melville
Family Income Brackets in Melville
According to the Melville family income data, there are 2,023 families falling into the $200,000+ income range, which is the most common income bracket and makes up 42.7% of all families. Conversely, the less than $10,000 income bracket is the least frequent group with only 9 families (0.2%) belonging to this category.
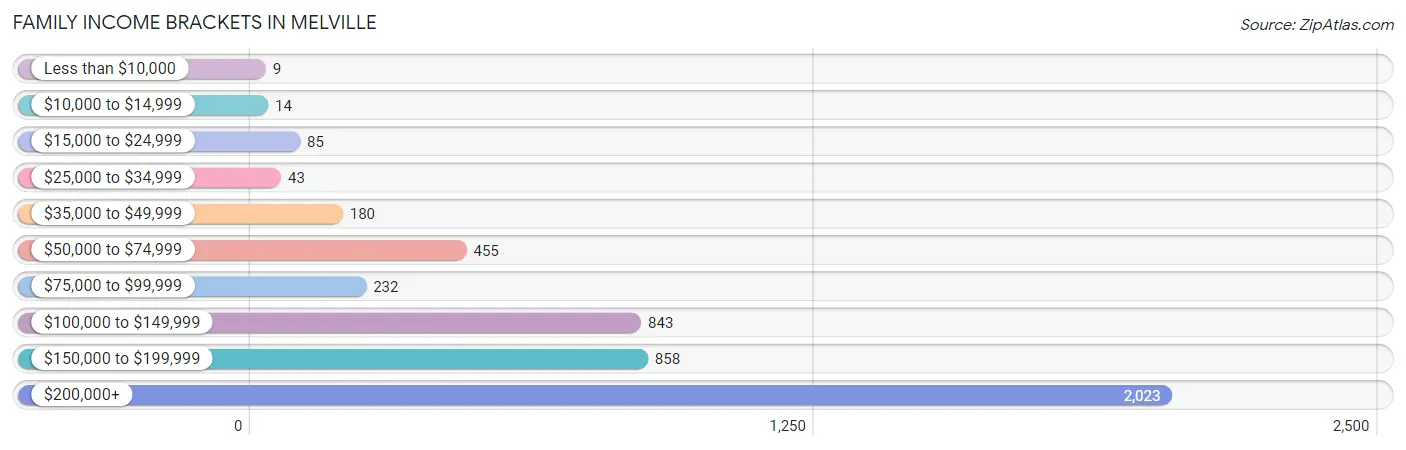
| Income Bracket | # Families | % Families |
| Less than $10,000 | 9 | 0.2% |
| $10,000 to $14,999 | 14 | 0.3% |
| $15,000 to $24,999 | 85 | 1.8% |
| $25,000 to $34,999 | 43 | 0.9% |
| $35,000 to $49,999 | 180 | 3.8% |
| $50,000 to $74,999 | 455 | 9.6% |
| $75,000 to $99,999 | 232 | 4.9% |
| $100,000 to $149,999 | 843 | 17.8% |
| $150,000 to $199,999 | 858 | 18.1% |
| $200,000+ | 2,023 | 42.7% |
Family Income by Famaliy Size in Melville
4-person families (903 | 19.1%) account for the highest median family income in Melville with $250,001 per family, while 2-person families (2,296 | 48.5%) have the highest median income of $75,474 per family member.
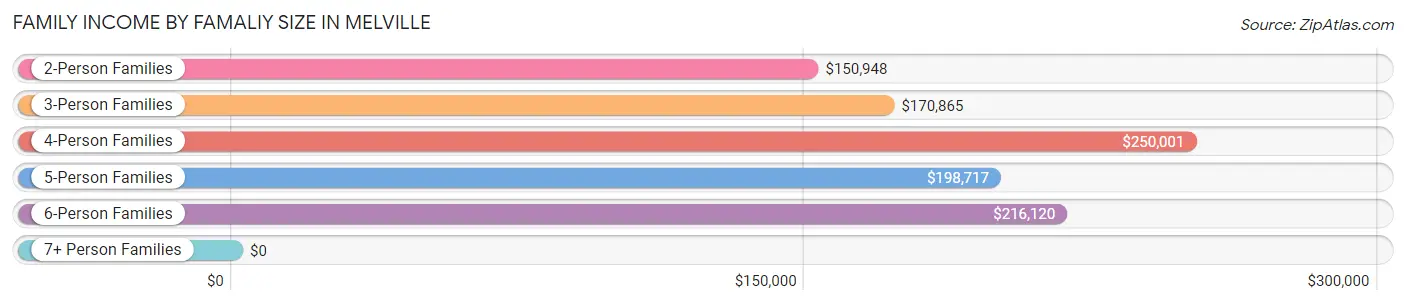
| Income Bracket | # Families | Median Income |
| 2-Person Families | 2,296 (48.5%) | $150,948 |
| 3-Person Families | 947 (20.0%) | $170,865 |
| 4-Person Families | 903 (19.1%) | $250,001 |
| 5-Person Families | 406 (8.6%) | $198,717 |
| 6-Person Families | 186 (3.9%) | $216,120 |
| 7+ Person Families | 0 (0.0%) | $0 |
| Total | 4,738 (100.0%) | $189,022 |
Family Income by Number of Earners in Melville
The median family income in Melville is $189,022, with families comprising 3+ earners (832) having the highest median family income of $250,001, while families with no earners (746) have the lowest median family income of $101,321, accounting for 17.6% and 15.8% of families, respectively.
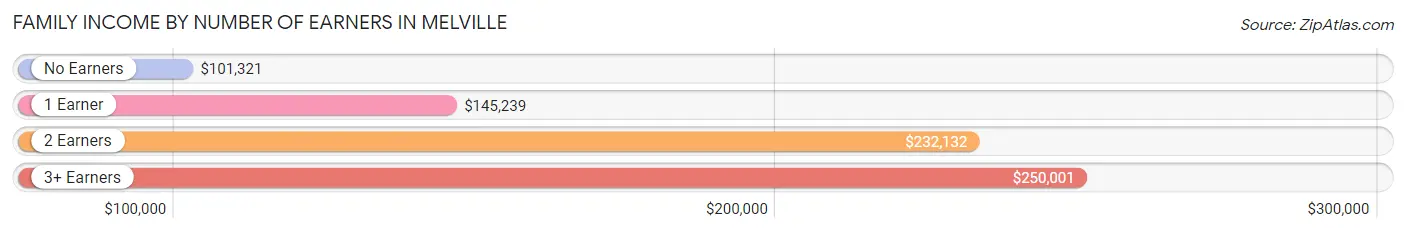
| Number of Earners | # Families | Median Income |
| No Earners | 746 (15.8%) | $101,321 |
| 1 Earner | 1,297 (27.4%) | $145,239 |
| 2 Earners | 1,863 (39.3%) | $232,132 |
| 3+ Earners | 832 (17.6%) | $250,001 |
| Total | 4,738 (100.0%) | $189,022 |
Household Income in Melville
Household Income Brackets in Melville
With 2,318 households falling in the category, the $200,000+ income range is the most frequent in Melville, accounting for 32.3% of all households. In contrast, only 100 households (1.4%) fall into the $10,000 to $14,999 income bracket, making it the least populous group.
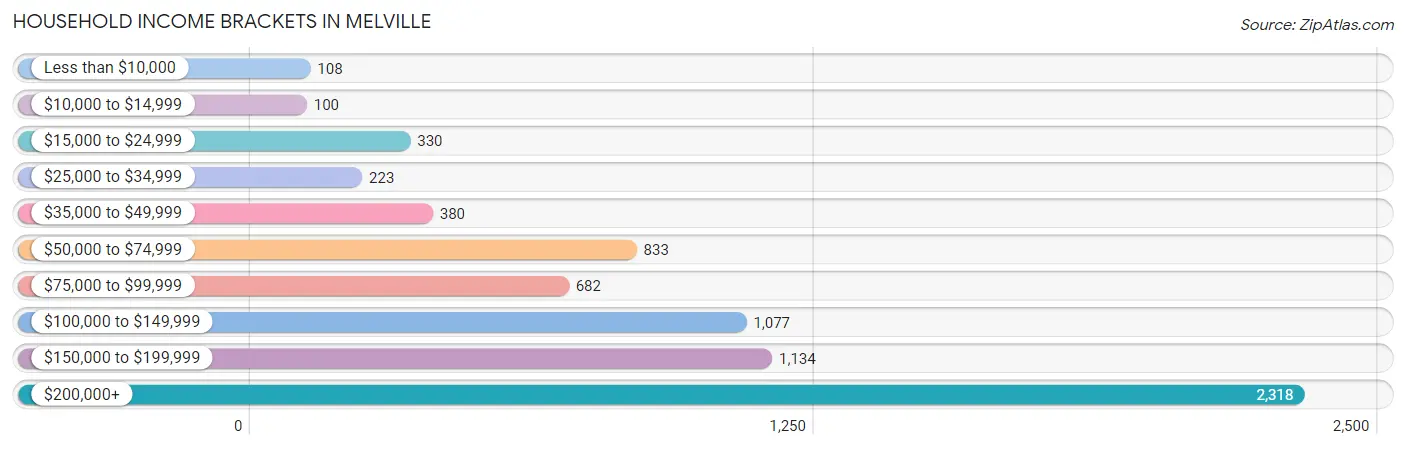
| Income Bracket | # Households | % Households |
| Less than $10,000 | 108 | 1.5% |
| $10,000 to $14,999 | 100 | 1.4% |
| $15,000 to $24,999 | 330 | 4.6% |
| $25,000 to $34,999 | 223 | 3.1% |
| $35,000 to $49,999 | 380 | 5.3% |
| $50,000 to $74,999 | 833 | 11.6% |
| $75,000 to $99,999 | 682 | 9.5% |
| $100,000 to $149,999 | 1,077 | 15.0% |
| $150,000 to $199,999 | 1,134 | 15.8% |
| $200,000+ | 2,318 | 32.3% |
Household Income by Householder Age in Melville
The median household income in Melville is $146,302, with the highest median household income of $199,326 found in the 45 to 64 years age bracket for the primary householder. A total of 2,819 households (39.3%) fall into this category. Meanwhile, the 15 to 24 years age bracket for the primary householder has the lowest median household income of $0, with 14 households (0.2%) in this group.
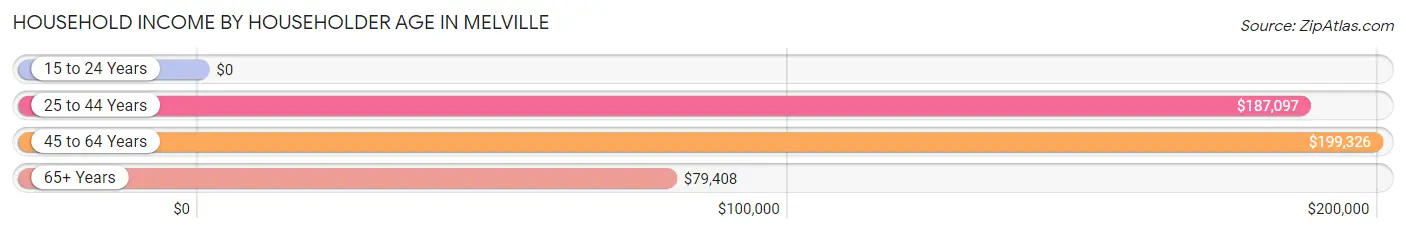
| Income Bracket | # Households | Median Income |
| 15 to 24 Years | 14 (0.2%) | $0 |
| 25 to 44 Years | 1,024 (14.3%) | $187,097 |
| 45 to 64 Years | 2,819 (39.3%) | $199,326 |
| 65+ Years | 3,321 (46.3%) | $79,408 |
| Total | 7,178 (100.0%) | $146,302 |
Poverty in Melville
Income Below Poverty by Sex and Age in Melville
With 4.3% poverty level for males and 3.8% for females among the residents of Melville, 35 to 44 year old males and 18 to 24 year old females are the most vulnerable to poverty, with 234 males (24.6%) and 42 females (7.8%) in their respective age groups living below the poverty level.
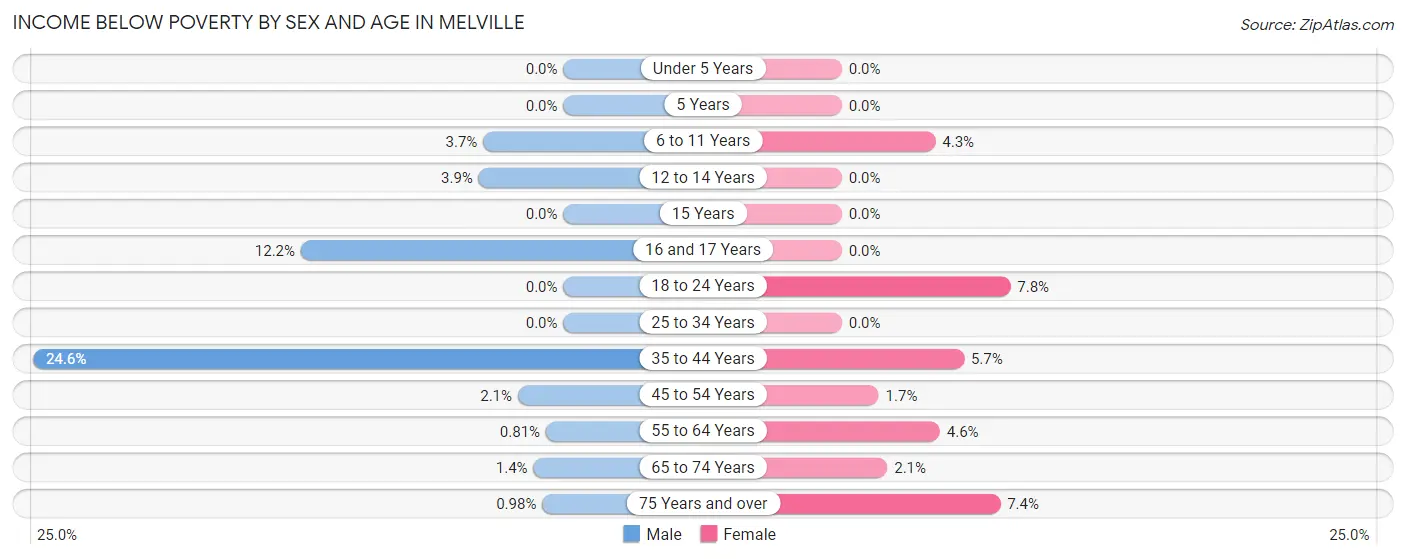
| Age Bracket | Male | Female |
| Under 5 Years | 0 (0.0%) | 0 (0.0%) |
| 5 Years | 0 (0.0%) | 0 (0.0%) |
| 6 to 11 Years | 21 (3.7%) | 21 (4.3%) |
| 12 to 14 Years | 19 (3.9%) | 0 (0.0%) |
| 15 Years | 0 (0.0%) | 0 (0.0%) |
| 16 and 17 Years | 24 (12.2%) | 0 (0.0%) |
| 18 to 24 Years | 0 (0.0%) | 42 (7.8%) |
| 25 to 34 Years | 0 (0.0%) | 0 (0.0%) |
| 35 to 44 Years | 234 (24.6%) | 63 (5.7%) |
| 45 to 54 Years | 26 (2.1%) | 21 (1.7%) |
| 55 to 64 Years | 9 (0.8%) | 78 (4.5%) |
| 65 to 74 Years | 13 (1.4%) | 25 (2.1%) |
| 75 Years and over | 10 (1.0%) | 134 (7.3%) |
| Total | 356 (4.3%) | 384 (3.8%) |
Income Above Poverty by Sex and Age in Melville
According to the poverty statistics in Melville, males aged under 5 years and females aged under 5 years are the age groups that are most secure financially, with 100.0% of males and 100.0% of females in these age groups living above the poverty line.
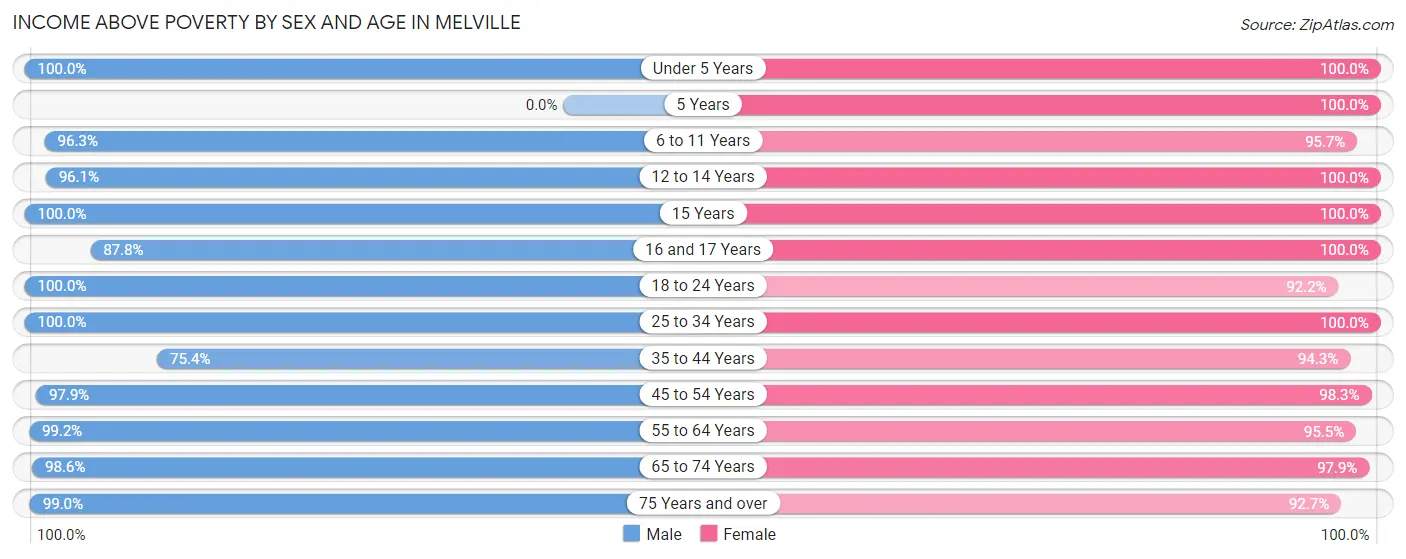
| Age Bracket | Male | Female |
| Under 5 Years | 410 (100.0%) | 454 (100.0%) |
| 5 Years | 0 (0.0%) | 157 (100.0%) |
| 6 to 11 Years | 543 (96.3%) | 463 (95.7%) |
| 12 to 14 Years | 465 (96.1%) | 187 (100.0%) |
| 15 Years | 56 (100.0%) | 170 (100.0%) |
| 16 and 17 Years | 173 (87.8%) | 134 (100.0%) |
| 18 to 24 Years | 401 (100.0%) | 495 (92.2%) |
| 25 to 34 Years | 965 (100.0%) | 813 (100.0%) |
| 35 to 44 Years | 717 (75.4%) | 1,048 (94.3%) |
| 45 to 54 Years | 1,205 (97.9%) | 1,204 (98.3%) |
| 55 to 64 Years | 1,103 (99.2%) | 1,637 (95.5%) |
| 65 to 74 Years | 920 (98.6%) | 1,158 (97.9%) |
| 75 Years and over | 1,015 (99.0%) | 1,689 (92.6%) |
| Total | 7,973 (95.7%) | 9,609 (96.2%) |
Income Below Poverty Among Married-Couple Families in Melville
The poverty statistics for married-couple families in Melville show that 1.0% or 39 of the total 4,074 families live below the poverty line. Families with 3 or 4 children have the highest poverty rate of 5.8%, comprising of 16 families. On the other hand, families with 1 or 2 children have the lowest poverty rate of 0.0%, which includes 0 families.
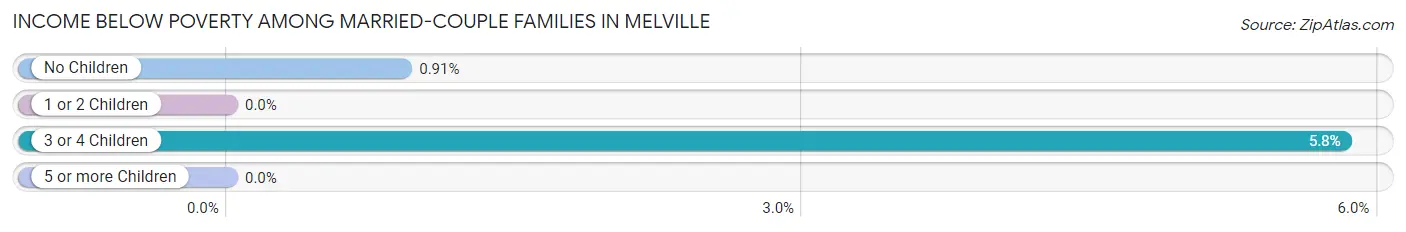
| Children | Above Poverty | Below Poverty |
| No Children | 2,511 (99.1%) | 23 (0.9%) |
| 1 or 2 Children | 1,265 (100.0%) | 0 (0.0%) |
| 3 or 4 Children | 259 (94.2%) | 16 (5.8%) |
| 5 or more Children | 0 (0.0%) | 0 (0.0%) |
| Total | 4,035 (99.0%) | 39 (1.0%) |
Income Below Poverty Among Single-Parent Households in Melville
| Children | Single Father | Single Mother |
| No Children | 0 (0.0%) | 0 (0.0%) |
| 1 or 2 Children | 0 (0.0%) | 0 (0.0%) |
| 3 or 4 Children | 0 (0.0%) | 0 (0.0%) |
| 5 or more Children | 0 (0.0%) | 0 (0.0%) |
| Total | 0 (0.0%) | 0 (0.0%) |
Income Below Poverty Among Married-Couple vs Single-Parent Households in Melville
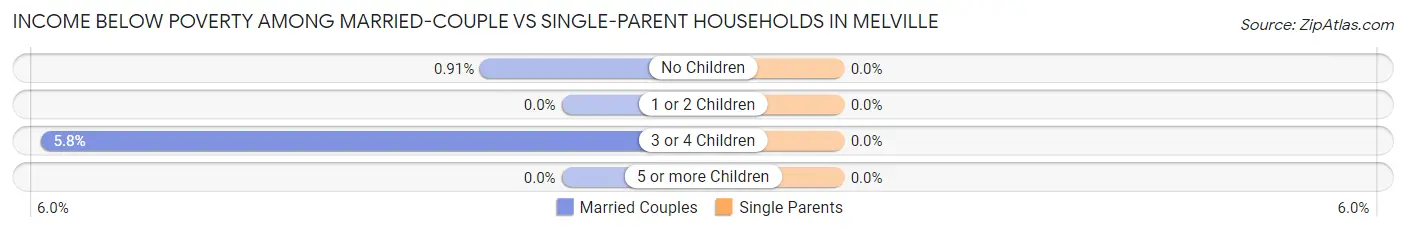
| Children | Married-Couple Families | Single-Parent Households |
| No Children | 23 (0.9%) | 0 (0.0%) |
| 1 or 2 Children | 0 (0.0%) | 0 (0.0%) |
| 3 or 4 Children | 16 (5.8%) | 0 (0.0%) |
| 5 or more Children | 0 (0.0%) | 0 (0.0%) |
| Total | 39 (1.0%) | 0 (0.0%) |
Race in Melville
The most populous races in Melville are White / Caucasian (16,350 | 88.2%), Two or more Races (991 | 5.3%), and Asian (847 | 4.6%).
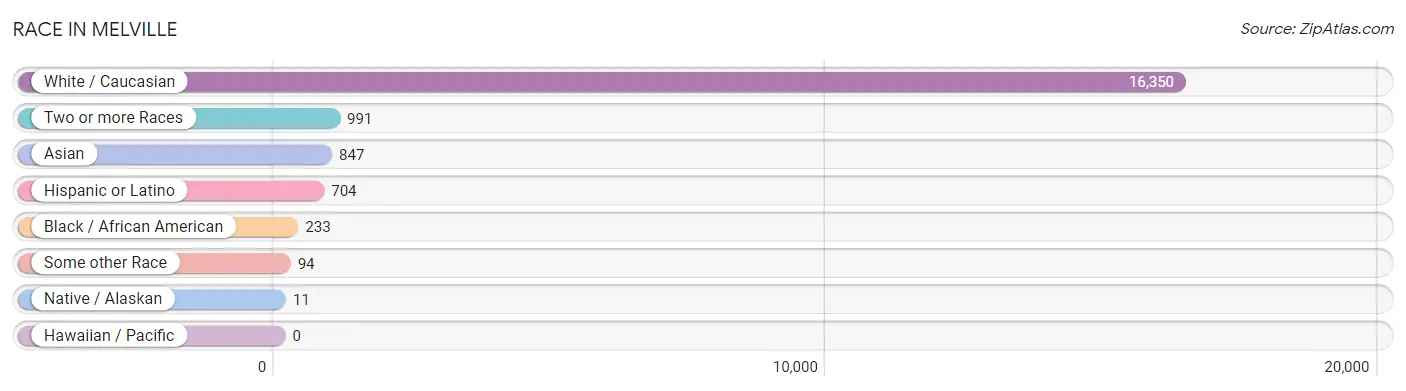
| Race | # Population | % Population |
| Asian | 847 | 4.6% |
| Black / African American | 233 | 1.3% |
| Hawaiian / Pacific | 0 | 0.0% |
| Hispanic or Latino | 704 | 3.8% |
| Native / Alaskan | 11 | 0.1% |
| White / Caucasian | 16,350 | 88.2% |
| Two or more Races | 991 | 5.3% |
| Some other Race | 94 | 0.5% |
| Total | 18,526 | 100.0% |
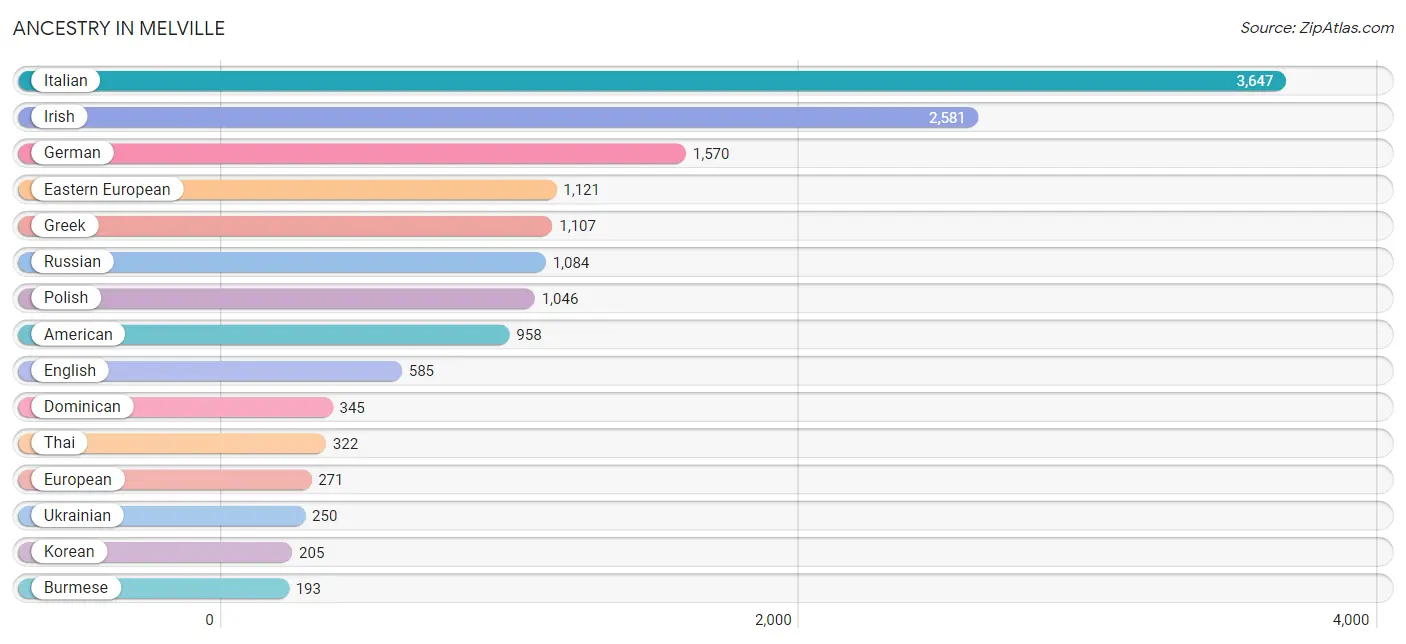
Ancestry in Melville
The most populous ancestries reported in Melville are Italian (3,647 | 19.7%), Irish (2,581 | 13.9%), German (1,570 | 8.5%), Eastern European (1,121 | 6.0%), and Greek (1,107 | 6.0%), together accounting for 54.1% of all Melville residents.
| Ancestry | # Population | % Population |
| Afghan | 19 | 0.1% |
| American | 958 | 5.2% |
| Arab | 33 | 0.2% |
| Armenian | 24 | 0.1% |
| Austrian | 28 | 0.2% |
| British | 134 | 0.7% |
| Burmese | 193 | 1.0% |
| Central American Indian | 24 | 0.1% |
| Colombian | 6 | 0.0% |
| Croatian | 62 | 0.3% |
| Cuban | 29 | 0.2% |
| Cypriot | 22 | 0.1% |
| Czechoslovakian | 41 | 0.2% |
| Danish | 30 | 0.2% |
| Dominican | 345 | 1.9% |
| Dutch | 99 | 0.5% |
| Eastern European | 1,121 | 6.0% |
| English | 585 | 3.2% |
| European | 271 | 1.5% |
| Filipino | 30 | 0.2% |
| French | 177 | 1.0% |
| German | 1,570 | 8.5% |
| Greek | 1,107 | 6.0% |
| Guamanian / Chamorro | 12 | 0.1% |
| Guyanese | 13 | 0.1% |
| Haitian | 7 | 0.0% |
| Hungarian | 156 | 0.8% |
| Indian (Asian) | 169 | 0.9% |
| Irish | 2,581 | 13.9% |
| Israeli | 86 | 0.5% |
| Italian | 3,647 | 19.7% |
| Korean | 205 | 1.1% |
| Latvian | 25 | 0.1% |
| Lebanese | 33 | 0.2% |
| Lithuanian | 61 | 0.3% |
| Mexican | 52 | 0.3% |
| Norwegian | 135 | 0.7% |
| Polish | 1,046 | 5.7% |
| Portuguese | 39 | 0.2% |
| Puerto Rican | 154 | 0.8% |
| Romanian | 32 | 0.2% |
| Russian | 1,084 | 5.9% |
| Samoan | 12 | 0.1% |
| Scandinavian | 15 | 0.1% |
| Scotch-Irish | 34 | 0.2% |
| Scottish | 153 | 0.8% |
| Slovak | 26 | 0.1% |
| South American | 6 | 0.0% |
| Spaniard | 34 | 0.2% |
| Spanish | 41 | 0.2% |
| Sri Lankan | 24 | 0.1% |
| Subsaharan African | 10 | 0.1% |
| Swedish | 50 | 0.3% |
| Swiss | 19 | 0.1% |
| Thai | 322 | 1.7% |
| Trinidadian and Tobagonian | 6 | 0.0% |
| Turkish | 21 | 0.1% |
| Ukrainian | 250 | 1.3% |
| West Indian | 11 | 0.1% | View All 59 Rows |
Immigrants in Melville
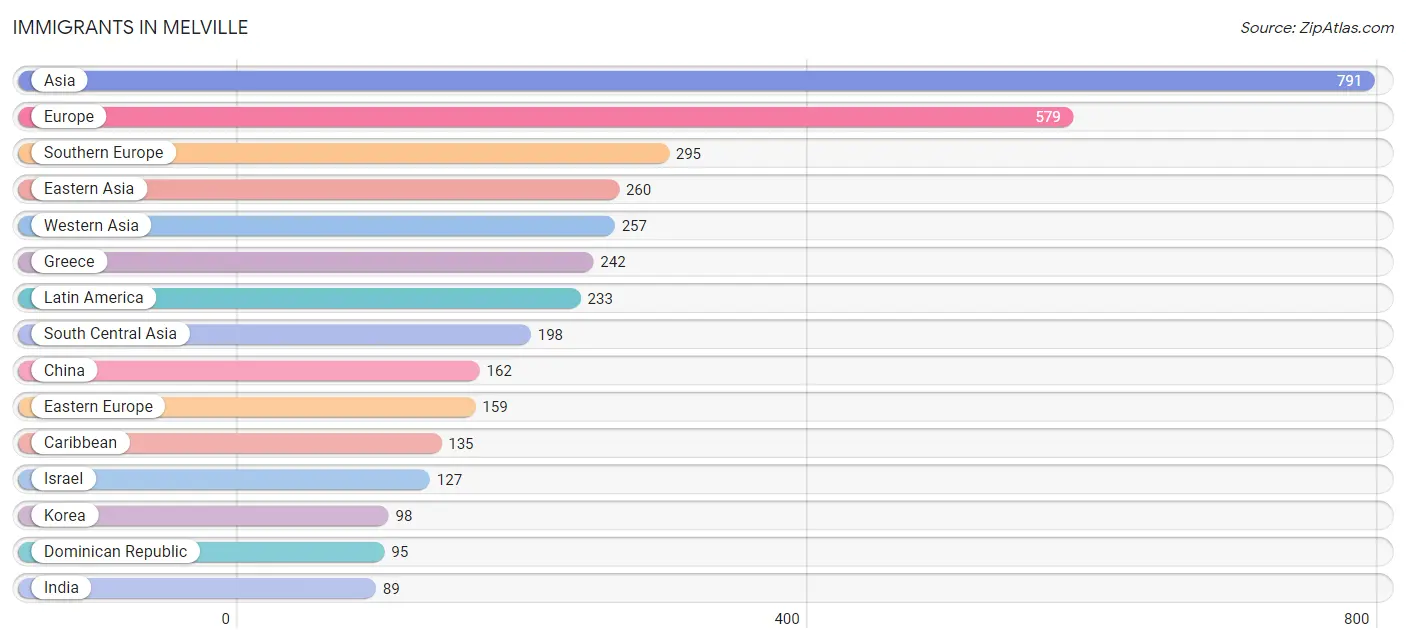
The most numerous immigrant groups reported in Melville came from Asia (791 | 4.3%), Europe (579 | 3.1%), Southern Europe (295 | 1.6%), Eastern Asia (260 | 1.4%), and Western Asia (257 | 1.4%), together accounting for 11.8% of all Melville residents.
| Immigration Origin | # Population | % Population |
| Afghanistan | 65 | 0.4% |
| Africa | 41 | 0.2% |
| Asia | 791 | 4.3% |
| Belgium | 7 | 0.0% |
| Brazil | 42 | 0.2% |
| Canada | 14 | 0.1% |
| Caribbean | 135 | 0.7% |
| Central America | 27 | 0.2% |
| China | 162 | 0.9% |
| Colombia | 6 | 0.0% |
| Czechoslovakia | 26 | 0.1% |
| Dominican Republic | 95 | 0.5% |
| Eastern Asia | 260 | 1.4% |
| Eastern Europe | 159 | 0.9% |
| Europe | 579 | 3.1% |
| Germany | 46 | 0.3% |
| Greece | 242 | 1.3% |
| Guyana | 23 | 0.1% |
| Haiti | 28 | 0.2% |
| India | 89 | 0.5% |
| Israel | 127 | 0.7% |
| Italy | 43 | 0.2% |
| Korea | 98 | 0.5% |
| Latin America | 233 | 1.3% |
| Lebanon | 48 | 0.3% |
| Mexico | 27 | 0.2% |
| Middle Africa | 10 | 0.1% |
| Morocco | 31 | 0.2% |
| Netherlands | 7 | 0.0% |
| Northern Africa | 31 | 0.2% |
| Northern Europe | 65 | 0.4% |
| Pakistan | 44 | 0.2% |
| Philippines | 45 | 0.2% |
| Poland | 50 | 0.3% |
| Romania | 33 | 0.2% |
| Russia | 50 | 0.3% |
| South America | 71 | 0.4% |
| South Central Asia | 198 | 1.1% |
| South Eastern Asia | 76 | 0.4% |
| Southern Europe | 295 | 1.6% |
| Sweden | 21 | 0.1% |
| Taiwan | 30 | 0.2% |
| Trinidad and Tobago | 12 | 0.1% |
| Turkey | 42 | 0.2% |
| Vietnam | 31 | 0.2% |
| Western Asia | 257 | 1.4% |
| Western Europe | 60 | 0.3% |
| Zaire | 10 | 0.1% | View All 48 Rows |
Sex and Age in Melville
Sex and Age in Melville
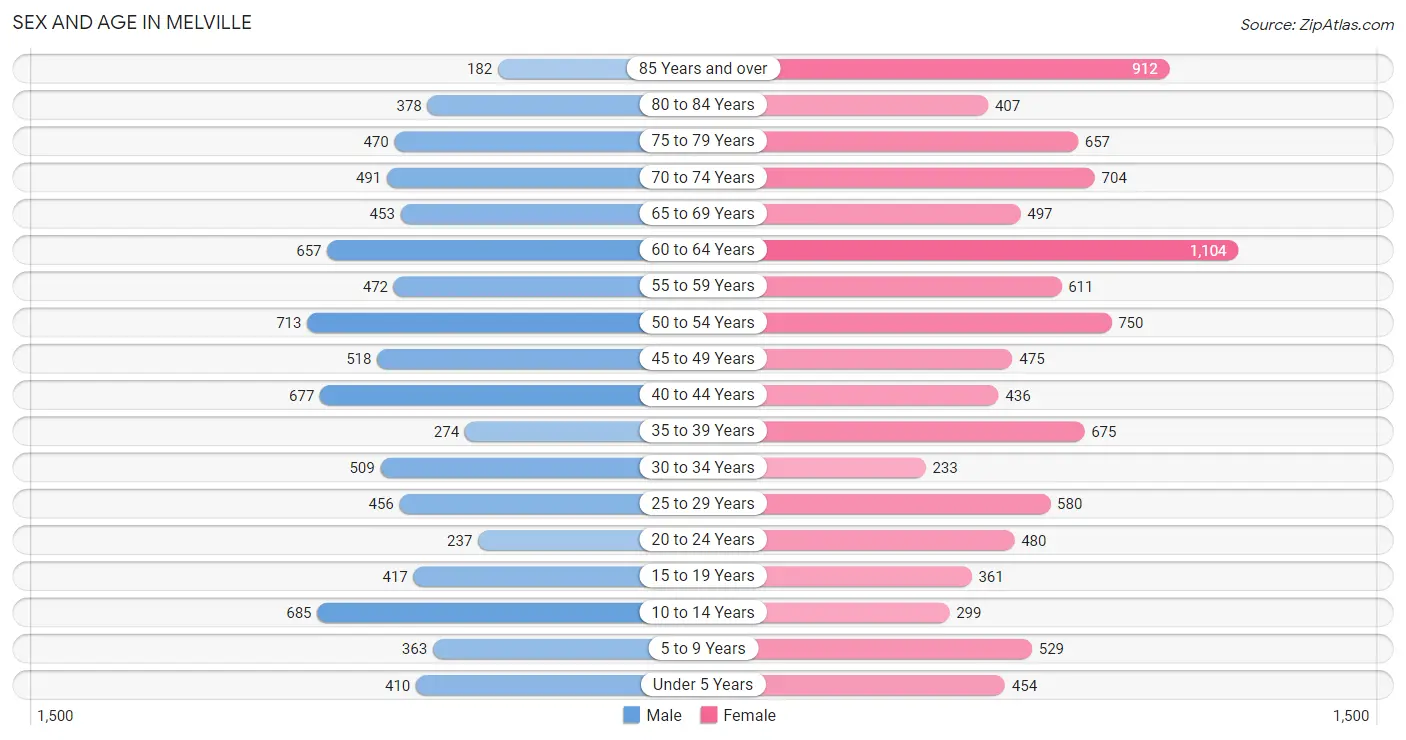
The most populous age groups in Melville are 50 to 54 Years (713 | 8.5%) for men and 60 to 64 Years (1,104 | 10.9%) for women.
| Age Bracket | Male | Female |
| Under 5 Years | 410 (4.9%) | 454 (4.5%) |
| 5 to 9 Years | 363 (4.3%) | 529 (5.2%) |
| 10 to 14 Years | 685 (8.2%) | 299 (2.9%) |
| 15 to 19 Years | 417 (5.0%) | 361 (3.5%) |
| 20 to 24 Years | 237 (2.8%) | 480 (4.7%) |
| 25 to 29 Years | 456 (5.4%) | 580 (5.7%) |
| 30 to 34 Years | 509 (6.1%) | 233 (2.3%) |
| 35 to 39 Years | 274 (3.3%) | 675 (6.6%) |
| 40 to 44 Years | 677 (8.1%) | 436 (4.3%) |
| 45 to 49 Years | 518 (6.2%) | 475 (4.7%) |
| 50 to 54 Years | 713 (8.5%) | 750 (7.4%) |
| 55 to 59 Years | 472 (5.6%) | 611 (6.0%) |
| 60 to 64 Years | 657 (7.9%) | 1,104 (10.9%) |
| 65 to 69 Years | 453 (5.4%) | 497 (4.9%) |
| 70 to 74 Years | 491 (5.9%) | 704 (6.9%) |
| 75 to 79 Years | 470 (5.6%) | 657 (6.5%) |
| 80 to 84 Years | 378 (4.5%) | 407 (4.0%) |
| 85 Years and over | 182 (2.2%) | 912 (9.0%) |
| Total | 8,362 (100.0%) | 10,164 (100.0%) |
Families and Households in Melville
Median Family Size in Melville
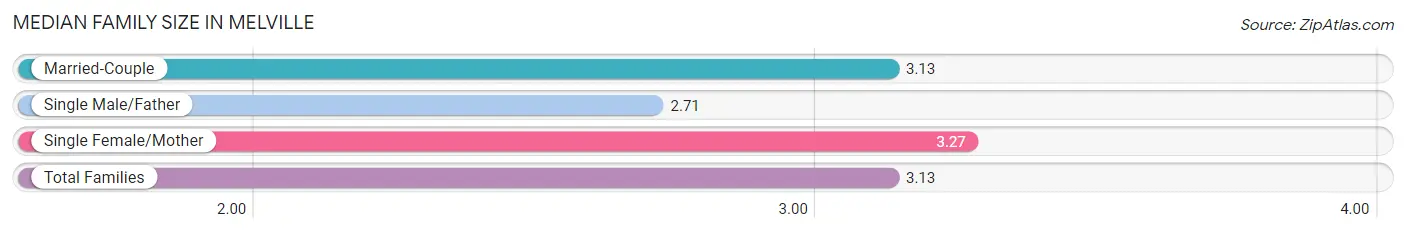
The median family size in Melville is 3.13 persons per family, with single female/mother families (548 | 11.6%) accounting for the largest median family size of 3.27 persons per family. On the other hand, single male/father families (116 | 2.5%) represent the smallest median family size with 2.71 persons per family.
| Family Type | # Families | Family Size |
| Married-Couple | 4,074 (86.0%) | 3.13 |
| Single Male/Father | 116 (2.5%) | 2.71 |
| Single Female/Mother | 548 (11.6%) | 3.27 |
| Total Families | 4,738 (100.0%) | 3.13 |
Median Household Size in Melville
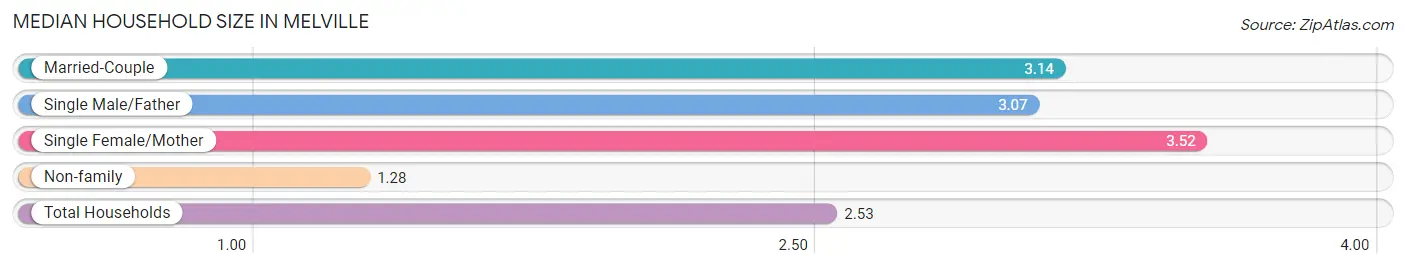
The median household size in Melville is 2.53 persons per household, with single female/mother households (548 | 7.6%) accounting for the largest median household size of 3.52 persons per household. non-family households (2,440 | 34.0%) represent the smallest median household size with 1.28 persons per household.
| Household Type | # Households | Household Size |
| Married-Couple | 4,074 (56.8%) | 3.14 |
| Single Male/Father | 116 (1.6%) | 3.07 |
| Single Female/Mother | 548 (7.6%) | 3.52 |
| Non-family | 2,440 (34.0%) | 1.28 |
| Total Households | 7,178 (100.0%) | 2.53 |
Household Size by Marriage Status in Melville
Out of a total of 7,178 households in Melville, 4,738 (66.0%) are family households, while 2,440 (34.0%) are nonfamily households. The most numerous type of family households are 2-person households, comprising 2,257, and the most common type of nonfamily households are 1-person households, comprising 2,053.
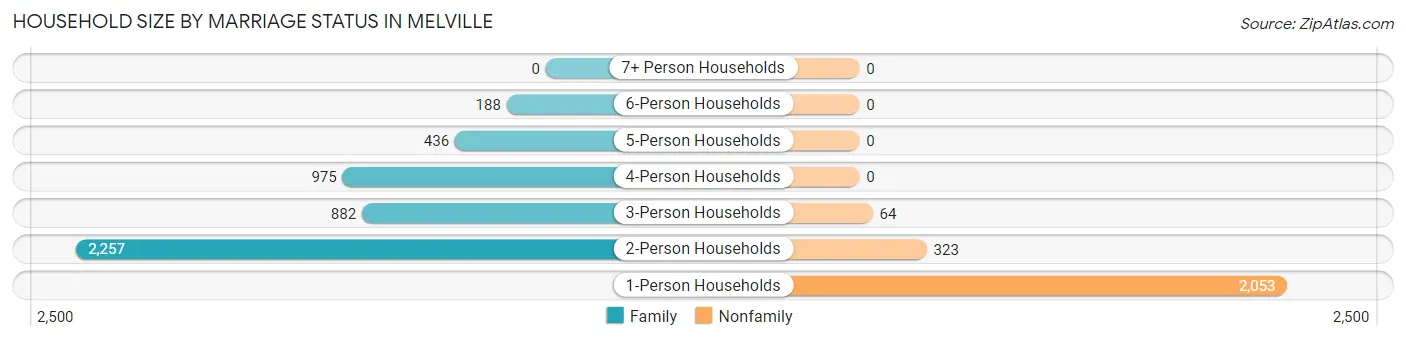
| Household Size | Family Households | Nonfamily Households |
| 1-Person Households | - | 2,053 (28.6%) |
| 2-Person Households | 2,257 (31.4%) | 323 (4.5%) |
| 3-Person Households | 882 (12.3%) | 64 (0.9%) |
| 4-Person Households | 975 (13.6%) | 0 (0.0%) |
| 5-Person Households | 436 (6.1%) | 0 (0.0%) |
| 6-Person Households | 188 (2.6%) | 0 (0.0%) |
| 7+ Person Households | 0 (0.0%) | 0 (0.0%) |
| Total | 4,738 (66.0%) | 2,440 (34.0%) |
Female Fertility in Melville
Fertility by Age in Melville
Average fertility rate in Melville is 40.0 births per 1,000 women. Women in the age bracket of 35 to 50 years have the highest fertility rate with 55.0 births per 1,000 women. Women in the age bracket of 35 to 50 years acount for 68.7% of all women with births.
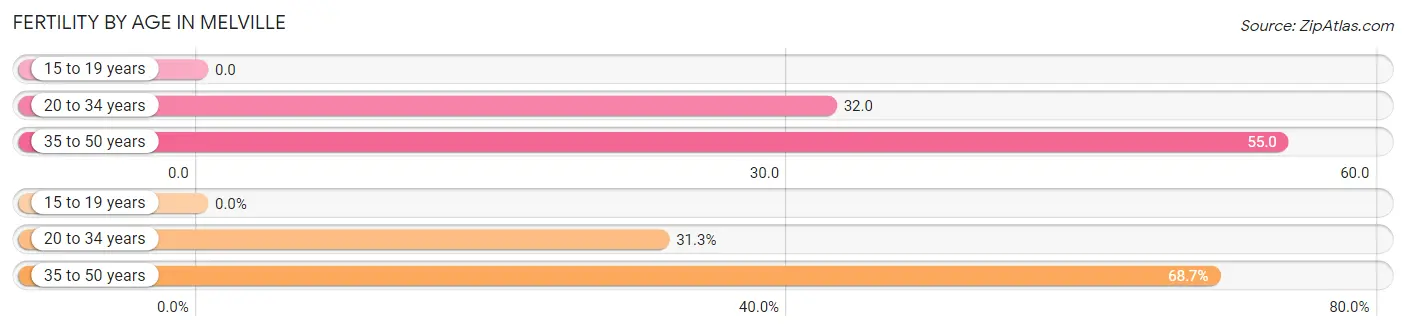
| Age Bracket | Women with Births | Births / 1,000 Women |
| 15 to 19 years | 0 (0.0%) | 0.0 |
| 20 to 34 years | 41 (31.3%) | 32.0 |
| 35 to 50 years | 90 (68.7%) | 55.0 |
| Total | 131 (100.0%) | 40.0 |
Fertility by Age by Marriage Status in Melville
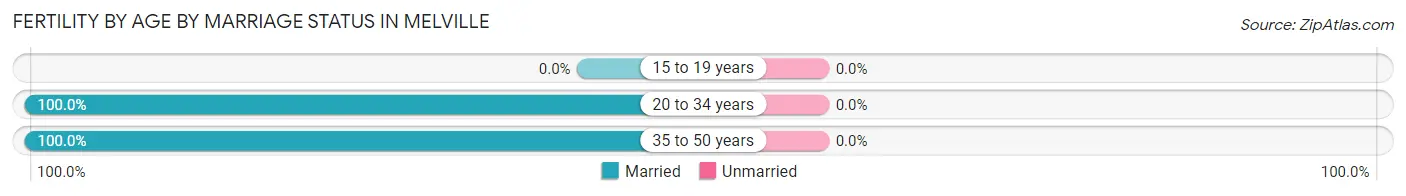
| Age Bracket | Married | Unmarried |
| 15 to 19 years | 0 (0.0%) | 0 (0.0%) |
| 20 to 34 years | 41 (100.0%) | 0 (0.0%) |
| 35 to 50 years | 90 (100.0%) | 0 (0.0%) |
| Total | 131 (100.0%) | 0 (0.0%) |
Fertility by Education in Melville
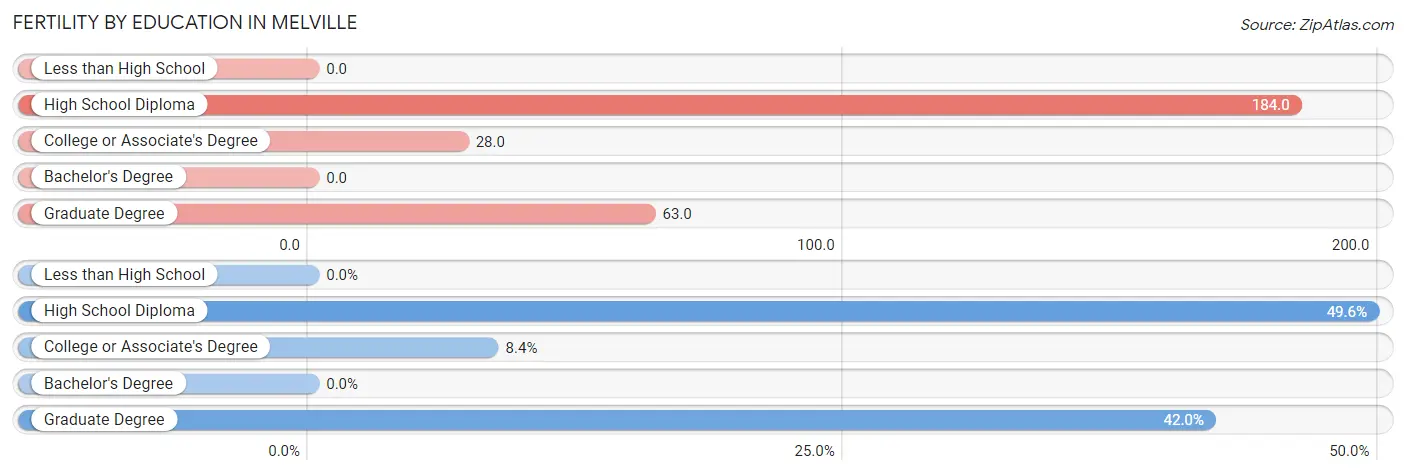
| Educational Attainment | Women with Births | Births / 1,000 Women |
| Less than High School | 0 (0.0%) | 0.0 |
| High School Diploma | 65 (49.6%) | 184.0 |
| College or Associate's Degree | 11 (8.4%) | 28.0 |
| Bachelor's Degree | 0 (0.0%) | 0.0 |
| Graduate Degree | 55 (42.0%) | 63.0 |
| Total | 131 (100.0%) | 40.0 |
Fertility by Education by Marriage Status in Melville
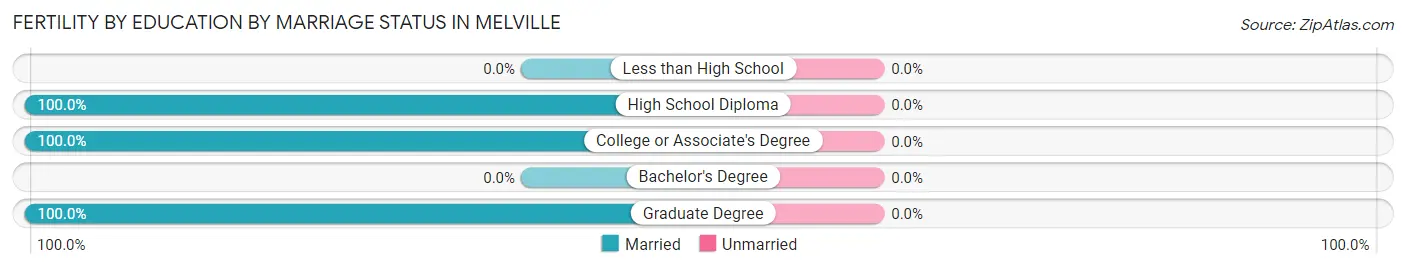
| Educational Attainment | Married | Unmarried |
| Less than High School | 0 (0.0%) | 0 (0.0%) |
| High School Diploma | 65 (100.0%) | 0 (0.0%) |
| College or Associate's Degree | 11 (100.0%) | 0 (0.0%) |
| Bachelor's Degree | 0 (0.0%) | 0 (0.0%) |
| Graduate Degree | 55 (100.0%) | 0 (0.0%) |
| Total | 131 (100.0%) | 0 (0.0%) |
Employment Characteristics in Melville
Employment by Class of Employer in Melville
Among the 9,122 employed individuals in Melville, private company employees (5,651 | 62.0%), not-for-profit organizations (948 | 10.4%), and local government employees (838 | 9.2%) make up the most common classes of employment.
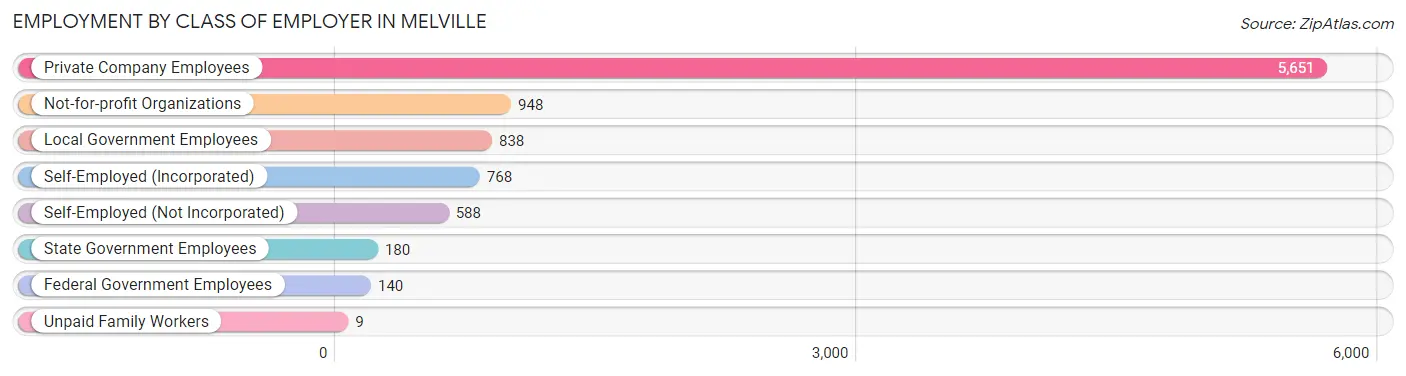
| Employer Class | # Employees | % Employees |
| Private Company Employees | 5,651 | 62.0% |
| Self-Employed (Incorporated) | 768 | 8.4% |
| Self-Employed (Not Incorporated) | 588 | 6.5% |
| Not-for-profit Organizations | 948 | 10.4% |
| Local Government Employees | 838 | 9.2% |
| State Government Employees | 180 | 2.0% |
| Federal Government Employees | 140 | 1.5% |
| Unpaid Family Workers | 9 | 0.1% |
| Total | 9,122 | 100.0% |
Employment Status by Age in Melville
According to the labor force statistics for Melville, out of the total population over 16 years of age (15,560), 64.5% or 10,036 individuals are in the labor force, with 8.3% or 833 of them unemployed. The age group with the highest labor force participation rate is 25 to 29 years, with 96.7% or 1,002 individuals in the labor force. Within the labor force, the 16 to 19 years age range has the highest percentage of unemployed individuals, with 34.5% or 115 of them being unemployed.
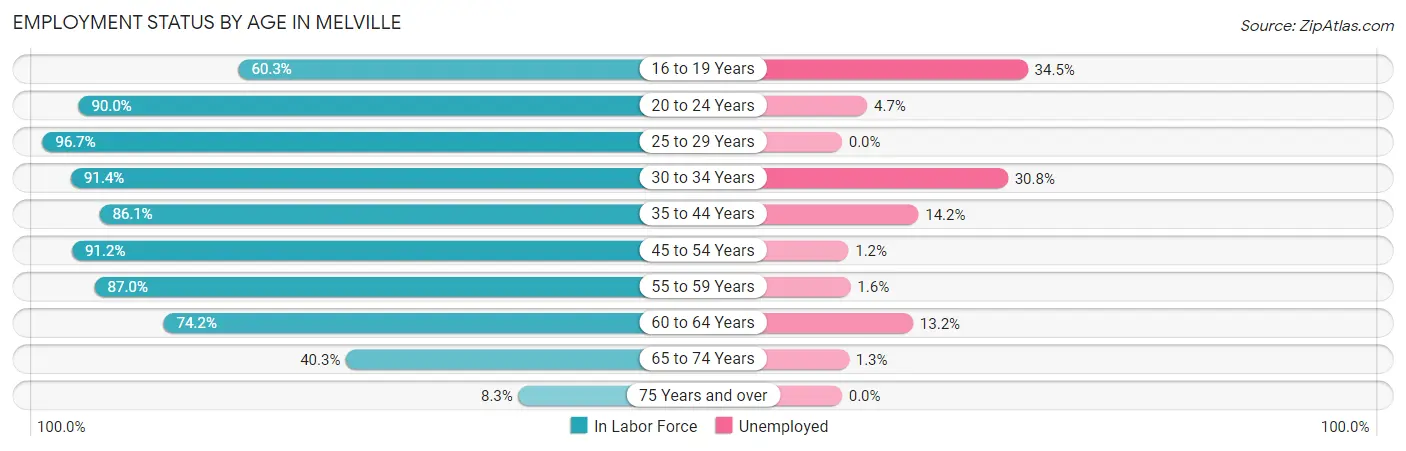
| Age Bracket | In Labor Force | Unemployed |
| 16 to 19 Years | 333 (60.3%) | 115 (34.5%) |
| 20 to 24 Years | 645 (90.0%) | 30 (4.7%) |
| 25 to 29 Years | 1,002 (96.7%) | 0 (0.0%) |
| 30 to 34 Years | 678 (91.4%) | 209 (30.8%) |
| 35 to 44 Years | 1,775 (86.1%) | 252 (14.2%) |
| 45 to 54 Years | 2,240 (91.2%) | 27 (1.2%) |
| 55 to 59 Years | 942 (87.0%) | 15 (1.6%) |
| 60 to 64 Years | 1,307 (74.2%) | 173 (13.2%) |
| 65 to 74 Years | 864 (40.3%) | 11 (1.3%) |
| 75 Years and over | 249 (8.3%) | 0 (0.0%) |
| Total | 10,036 (64.5%) | 833 (8.3%) |
Employment Status by Educational Attainment in Melville
According to labor force statistics for Melville, 86.9% of individuals (7,943) out of the total population between 25 and 64 years of age (9,140) are in the labor force, with 8.5% or 675 of them being unemployed. The group with the highest labor force participation rate are those with the educational attainment of bachelor's degree or higher, with 93.2% or 5,892 individuals in the labor force. Within the labor force, individuals with college / associate degree education have the highest percentage of unemployment, with 26.5% or 372 of them being unemployed.
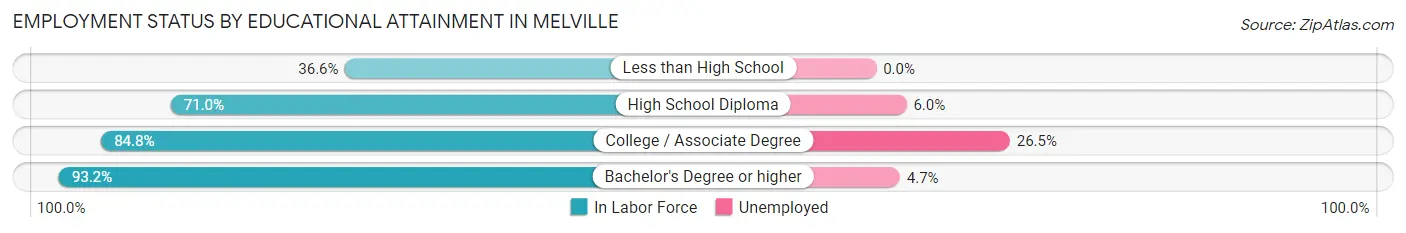
| Educational Attainment | In Labor Force | Unemployed |
| Less than High School | 185 (36.6%) | 0 (0.0%) |
| High School Diploma | 468 (71.0%) | 40 (6.0%) |
| College / Associate Degree | 1,402 (84.8%) | 438 (26.5%) |
| Bachelor's Degree or higher | 5,892 (93.2%) | 297 (4.7%) |
| Total | 7,943 (86.9%) | 777 (8.5%) |
Employment Occupations by Sex in Melville
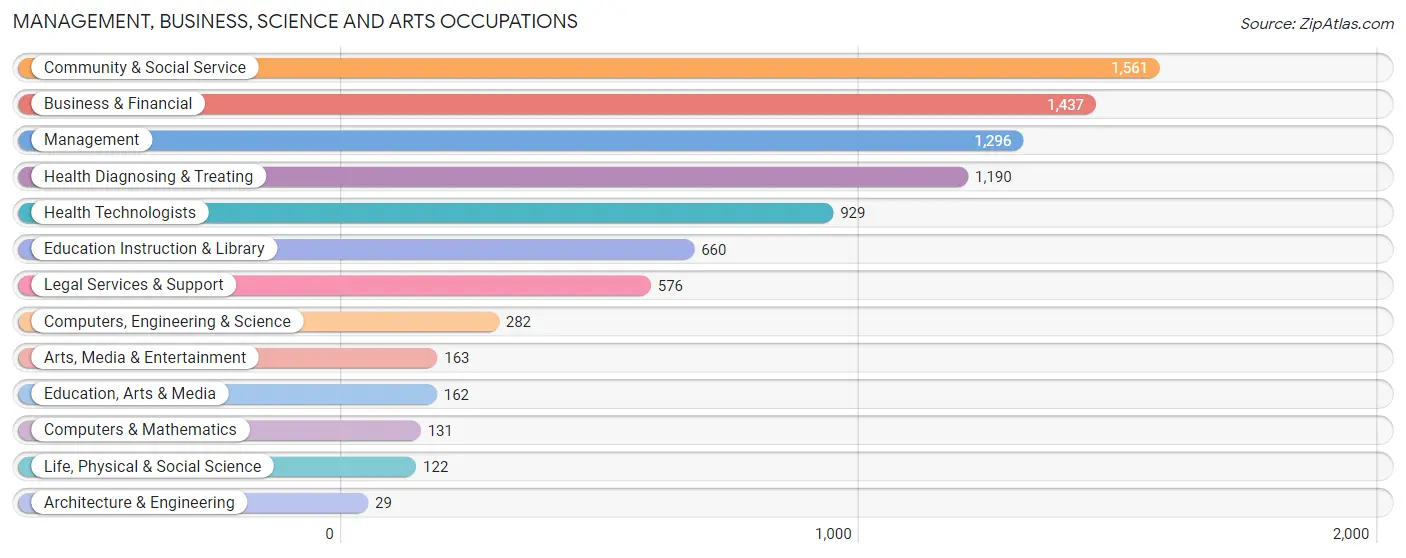
Management, Business, Science and Arts Occupations
The most common Management, Business, Science and Arts occupations in Melville are Community & Social Service (1,561 | 17.0%), Business & Financial (1,437 | 15.6%), Management (1,296 | 14.1%), Health Diagnosing & Treating (1,190 | 12.9%), and Health Technologists (929 | 10.1%).
Management, Business, Science and Arts Occupations by Sex
Within the Management, Business, Science and Arts occupations in Melville, the most male-oriented occupations are Architecture & Engineering (100.0%), Computers & Mathematics (81.7%), and Computers, Engineering & Science (61.0%), while the most female-oriented occupations are Education Instruction & Library (81.2%), Arts, Media & Entertainment (74.9%), and Education, Arts & Media (72.8%).
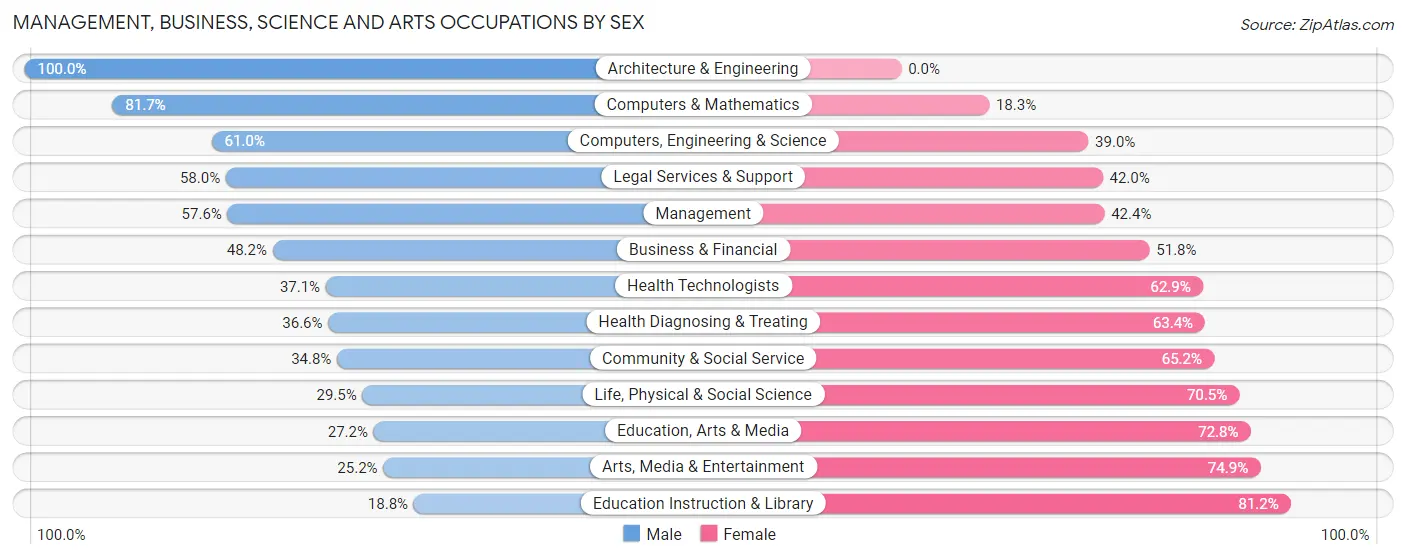
| Occupation | Male | Female |
| Management | 747 (57.6%) | 549 (42.4%) |
| Business & Financial | 693 (48.2%) | 744 (51.8%) |
| Computers, Engineering & Science | 172 (61.0%) | 110 (39.0%) |
| Computers & Mathematics | 107 (81.7%) | 24 (18.3%) |
| Architecture & Engineering | 29 (100.0%) | 0 (0.0%) |
| Life, Physical & Social Science | 36 (29.5%) | 86 (70.5%) |
| Community & Social Service | 543 (34.8%) | 1,018 (65.2%) |
| Education, Arts & Media | 44 (27.2%) | 118 (72.8%) |
| Legal Services & Support | 334 (58.0%) | 242 (42.0%) |
| Education Instruction & Library | 124 (18.8%) | 536 (81.2%) |
| Arts, Media & Entertainment | 41 (25.2%) | 122 (74.9%) |
| Health Diagnosing & Treating | 436 (36.6%) | 754 (63.4%) |
| Health Technologists | 345 (37.1%) | 584 (62.9%) |
| Total (Category) | 2,591 (44.9%) | 3,175 (55.1%) |
| Total (Overall) | 4,442 (48.2%) | 4,765 (51.7%) |
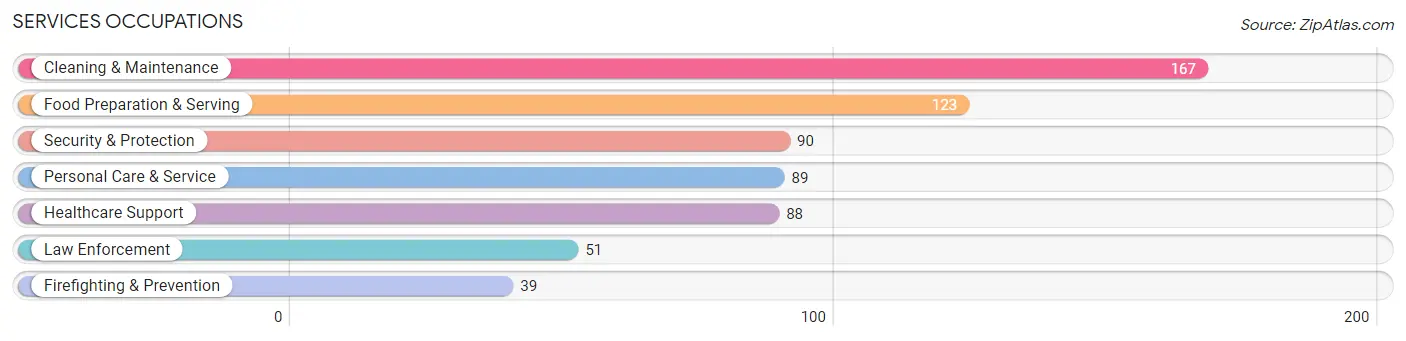
Services Occupations
The most common Services occupations in Melville are Cleaning & Maintenance (167 | 1.8%), Food Preparation & Serving (123 | 1.3%), Security & Protection (90 | 1.0%), Personal Care & Service (89 | 1.0%), and Healthcare Support (88 | 1.0%).
Services Occupations by Sex
Within the Services occupations in Melville, the most male-oriented occupations are Law Enforcement (100.0%), Healthcare Support (85.2%), and Cleaning & Maintenance (74.3%), while the most female-oriented occupations are Firefighting & Prevention (74.4%), Food Preparation & Serving (74.0%), and Personal Care & Service (55.1%).
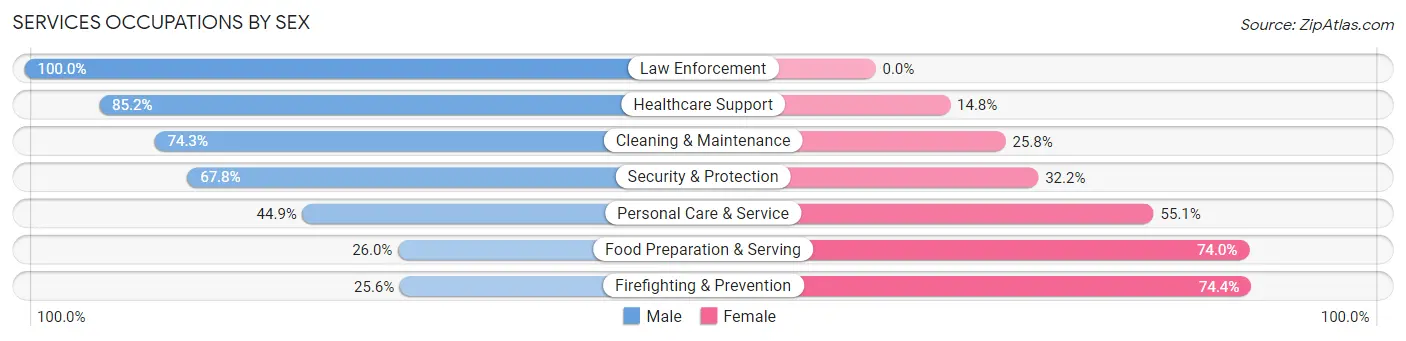
| Occupation | Male | Female |
| Healthcare Support | 75 (85.2%) | 13 (14.8%) |
| Security & Protection | 61 (67.8%) | 29 (32.2%) |
| Firefighting & Prevention | 10 (25.6%) | 29 (74.4%) |
| Law Enforcement | 51 (100.0%) | 0 (0.0%) |
| Food Preparation & Serving | 32 (26.0%) | 91 (74.0%) |
| Cleaning & Maintenance | 124 (74.3%) | 43 (25.8%) |
| Personal Care & Service | 40 (44.9%) | 49 (55.1%) |
| Total (Category) | 332 (59.6%) | 225 (40.4%) |
| Total (Overall) | 4,442 (48.2%) | 4,765 (51.7%) |
Sales and Office Occupations
The most common Sales and Office occupations in Melville are Sales & Related (1,229 | 13.4%), and Office & Administration (1,077 | 11.7%).
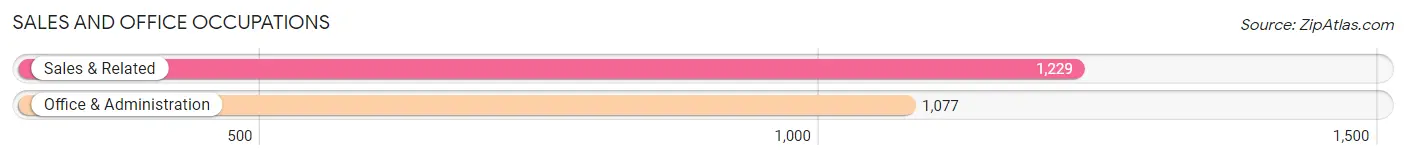
Sales and Office Occupations by Sex
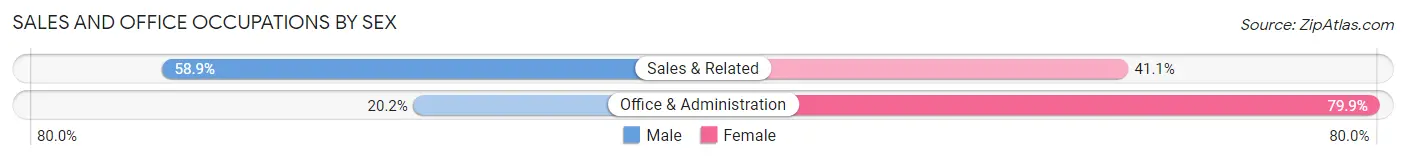
| Occupation | Male | Female |
| Sales & Related | 724 (58.9%) | 505 (41.1%) |
| Office & Administration | 217 (20.2%) | 860 (79.8%) |
| Total (Category) | 941 (40.8%) | 1,365 (59.2%) |
| Total (Overall) | 4,442 (48.2%) | 4,765 (51.7%) |
Natural Resources, Construction and Maintenance Occupations
The most common Natural Resources, Construction and Maintenance occupations in Melville are Construction & Extraction (220 | 2.4%), Farming, Fishing & Forestry (67 | 0.7%), and Installation, Maintenance & Repair (39 | 0.4%).

Natural Resources, Construction and Maintenance Occupations by Sex
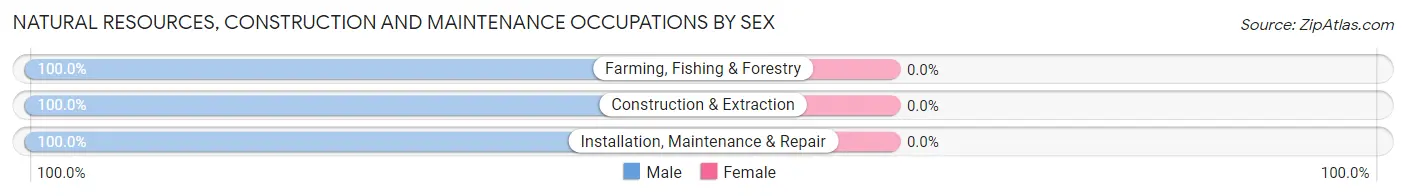
| Occupation | Male | Female |
| Farming, Fishing & Forestry | 67 (100.0%) | 0 (0.0%) |
| Construction & Extraction | 220 (100.0%) | 0 (0.0%) |
| Installation, Maintenance & Repair | 39 (100.0%) | 0 (0.0%) |
| Total (Category) | 326 (100.0%) | 0 (0.0%) |
| Total (Overall) | 4,442 (48.2%) | 4,765 (51.7%) |
Production, Transportation and Moving Occupations
The most common Production, Transportation and Moving occupations in Melville are Material Moving (107 | 1.2%), Transportation (103 | 1.1%), and Production (42 | 0.5%).
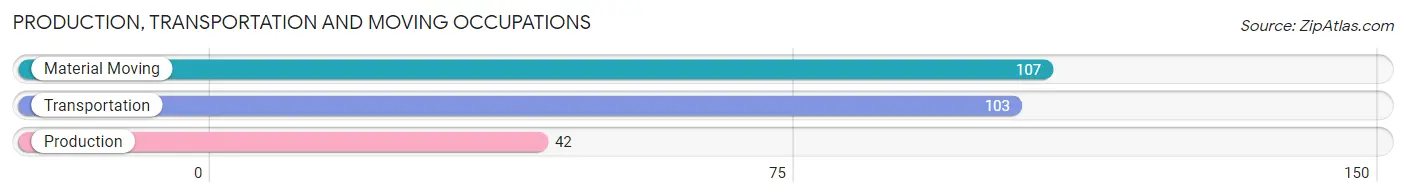
Production, Transportation and Moving Occupations by Sex
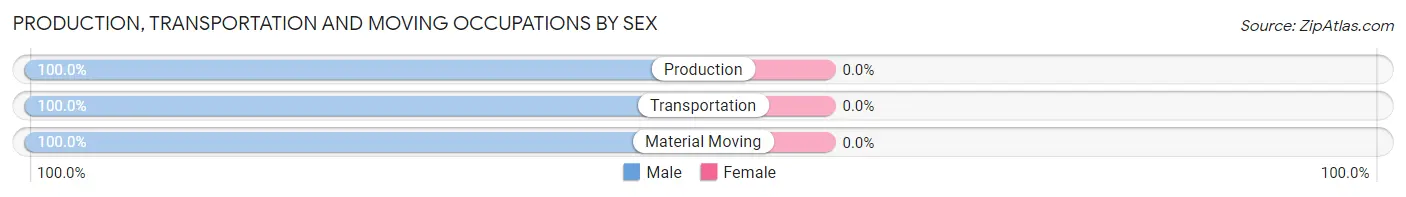
| Occupation | Male | Female |
| Production | 42 (100.0%) | 0 (0.0%) |
| Transportation | 103 (100.0%) | 0 (0.0%) |
| Material Moving | 107 (100.0%) | 0 (0.0%) |
| Total (Category) | 252 (100.0%) | 0 (0.0%) |
| Total (Overall) | 4,442 (48.2%) | 4,765 (51.7%) |
Employment Industries by Sex in Melville
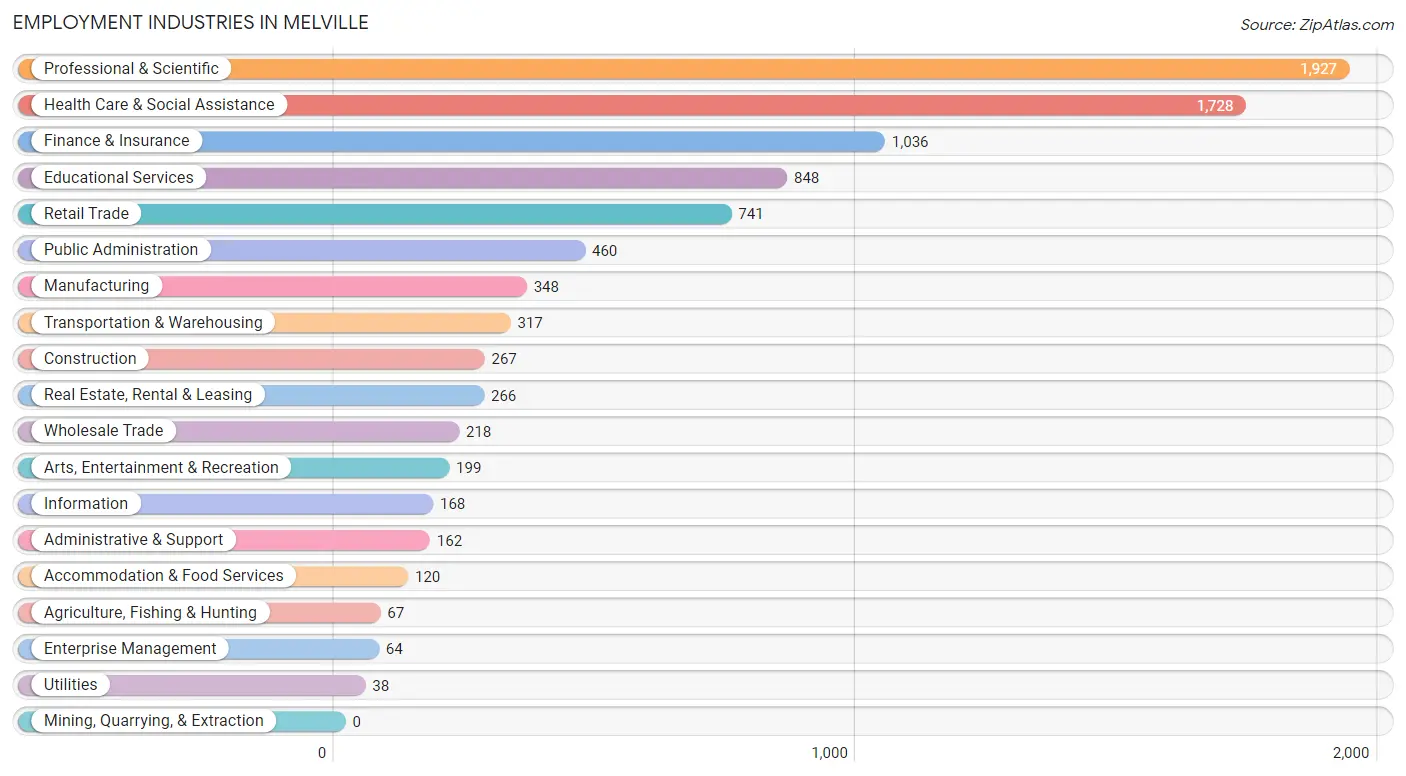
Employment Industries in Melville
The major employment industries in Melville include Professional & Scientific (1,927 | 20.9%), Health Care & Social Assistance (1,728 | 18.8%), Finance & Insurance (1,036 | 11.3%), Educational Services (848 | 9.2%), and Retail Trade (741 | 8.1%).
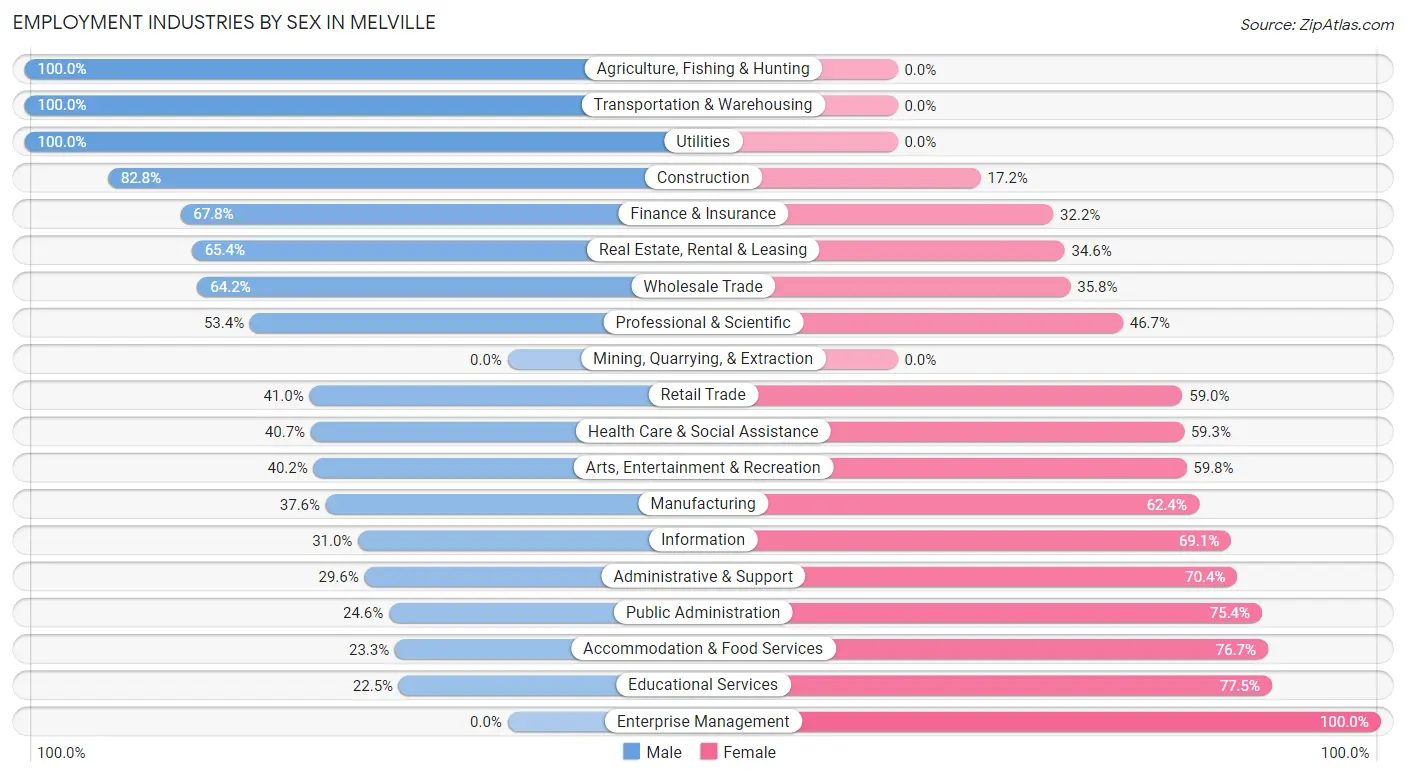
Employment Industries by Sex in Melville
The Melville industries that see more men than women are Agriculture, Fishing & Hunting (100.0%), Transportation & Warehousing (100.0%), and Utilities (100.0%), whereas the industries that tend to have a higher number of women are Enterprise Management (100.0%), Educational Services (77.5%), and Accommodation & Food Services (76.7%).
| Industry | Male | Female |
| Agriculture, Fishing & Hunting | 67 (100.0%) | 0 (0.0%) |
| Mining, Quarrying, & Extraction | 0 (0.0%) | 0 (0.0%) |
| Construction | 221 (82.8%) | 46 (17.2%) |
| Manufacturing | 131 (37.6%) | 217 (62.4%) |
| Wholesale Trade | 140 (64.2%) | 78 (35.8%) |
| Retail Trade | 304 (41.0%) | 437 (59.0%) |
| Transportation & Warehousing | 317 (100.0%) | 0 (0.0%) |
| Utilities | 38 (100.0%) | 0 (0.0%) |
| Information | 52 (30.9%) | 116 (69.1%) |
| Finance & Insurance | 702 (67.8%) | 334 (32.2%) |
| Real Estate, Rental & Leasing | 174 (65.4%) | 92 (34.6%) |
| Professional & Scientific | 1,028 (53.3%) | 899 (46.7%) |
| Enterprise Management | 0 (0.0%) | 64 (100.0%) |
| Administrative & Support | 48 (29.6%) | 114 (70.4%) |
| Educational Services | 191 (22.5%) | 657 (77.5%) |
| Health Care & Social Assistance | 704 (40.7%) | 1,024 (59.3%) |
| Arts, Entertainment & Recreation | 80 (40.2%) | 119 (59.8%) |
| Accommodation & Food Services | 28 (23.3%) | 92 (76.7%) |
| Public Administration | 113 (24.6%) | 347 (75.4%) |
| Total | 4,442 (48.2%) | 4,765 (51.7%) |
Education in Melville
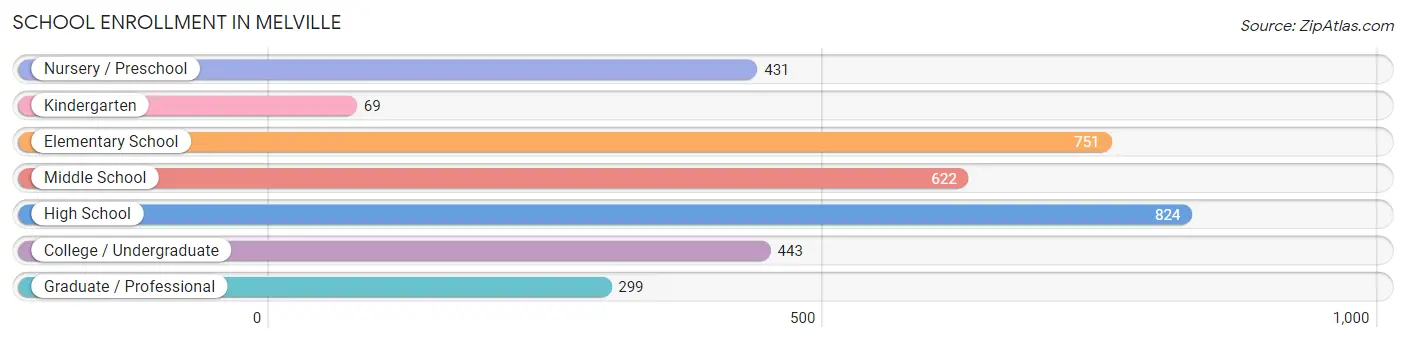
School Enrollment in Melville
The most common levels of schooling among the 3,439 students in Melville are high school (824 | 24.0%), elementary school (751 | 21.8%), and middle school (622 | 18.1%).
| School Level | # Students | % Students |
| Nursery / Preschool | 431 | 12.5% |
| Kindergarten | 69 | 2.0% |
| Elementary School | 751 | 21.8% |
| Middle School | 622 | 18.1% |
| High School | 824 | 24.0% |
| College / Undergraduate | 443 | 12.9% |
| Graduate / Professional | 299 | 8.7% |
| Total | 3,439 | 100.0% |
School Enrollment by Age by Funding Source in Melville
Out of a total of 3,439 students who are enrolled in schools in Melville, 1,073 (31.2%) attend a private institution, while the remaining 2,366 (68.8%) are enrolled in public schools. The age group of 35 years and over has the highest likelihood of being enrolled in private schools, with 291 (97.3% in the age bracket) enrolled. Conversely, the age group of 15 to 17 year olds has the lowest likelihood of being enrolled in a private school, with 557 (100.0% in the age bracket) attending a public institution.
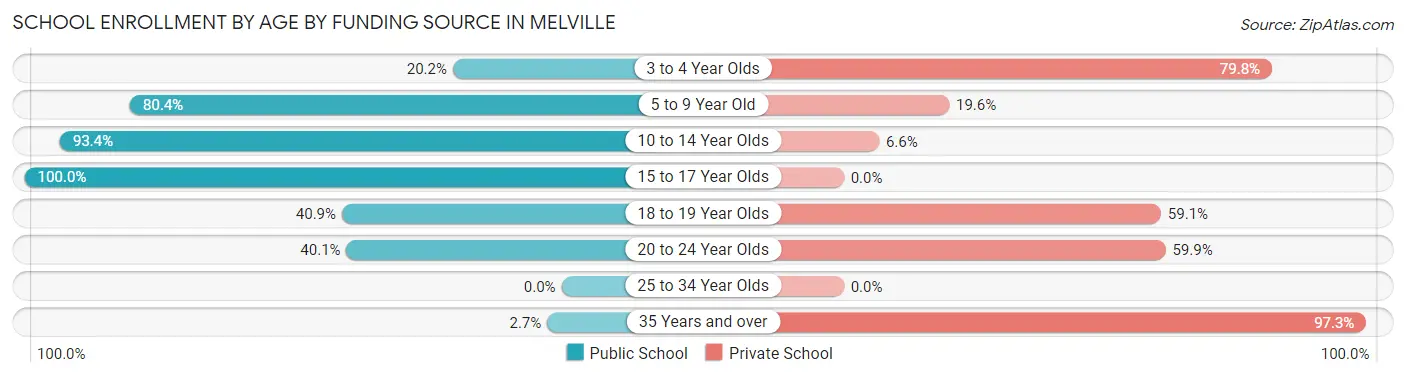
| Age Bracket | Public School | Private School |
| 3 to 4 Year Olds | 68 (20.2%) | 268 (79.8%) |
| 5 to 9 Year Old | 717 (80.4%) | 175 (19.6%) |
| 10 to 14 Year Olds | 825 (93.4%) | 58 (6.6%) |
| 15 to 17 Year Olds | 557 (100.0%) | 0 (0.0%) |
| 18 to 19 Year Olds | 45 (40.9%) | 65 (59.1%) |
| 20 to 24 Year Olds | 145 (40.1%) | 217 (59.9%) |
| 25 to 34 Year Olds | 0 (0.0%) | 0 (0.0%) |
| 35 Years and over | 8 (2.7%) | 291 (97.3%) |
| Total | 2,366 (68.8%) | 1,073 (31.2%) |
Educational Attainment by Field of Study in Melville
Business (2,301 | 25.0%), education (1,381 | 15.0%), science & technology (922 | 10.0%), social sciences (862 | 9.4%), and bio, nature & agricultural (509 | 5.5%) are the most common fields of study among 9,207 individuals in Melville who have obtained a bachelor's degree or higher.
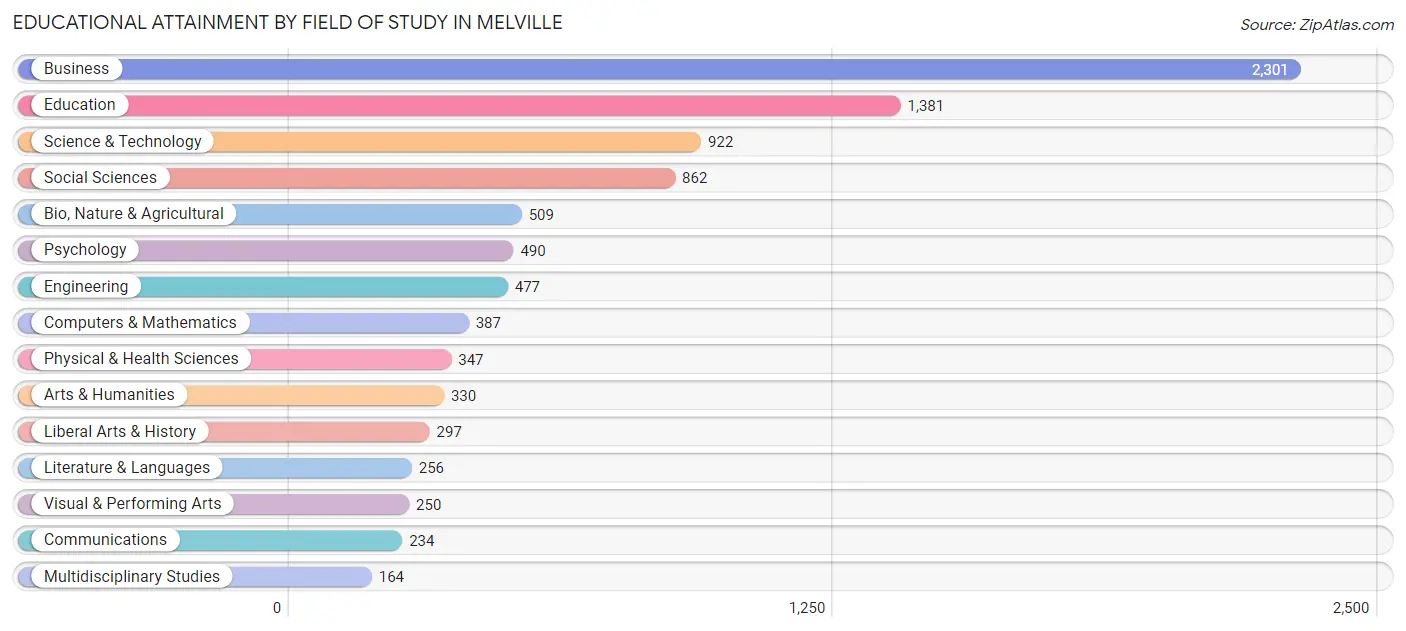
| Field of Study | # Graduates | % Graduates |
| Computers & Mathematics | 387 | 4.2% |
| Bio, Nature & Agricultural | 509 | 5.5% |
| Physical & Health Sciences | 347 | 3.8% |
| Psychology | 490 | 5.3% |
| Social Sciences | 862 | 9.4% |
| Engineering | 477 | 5.2% |
| Multidisciplinary Studies | 164 | 1.8% |
| Science & Technology | 922 | 10.0% |
| Business | 2,301 | 25.0% |
| Education | 1,381 | 15.0% |
| Literature & Languages | 256 | 2.8% |
| Liberal Arts & History | 297 | 3.2% |
| Visual & Performing Arts | 250 | 2.7% |
| Communications | 234 | 2.5% |
| Arts & Humanities | 330 | 3.6% |
| Total | 9,207 | 100.0% |
Transportation & Commute in Melville
Vehicle Availability by Sex in Melville
The most prevalent vehicle ownership categories in Melville are males with 2 vehicles (2,234, accounting for 51.2%) and females with 2 vehicles (1,745, making up 47.4%).
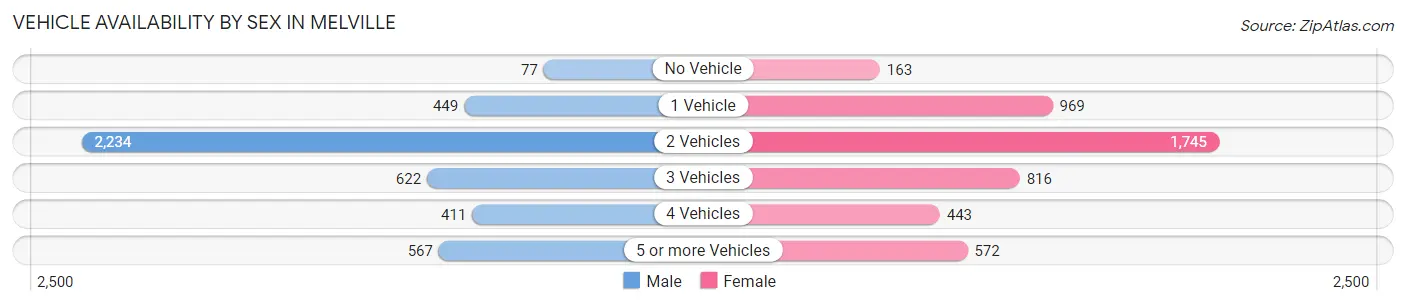
| Vehicles Available | Male | Female |
| No Vehicle | 77 (1.8%) | 163 (3.5%) |
| 1 Vehicle | 449 (10.3%) | 969 (20.6%) |
| 2 Vehicles | 2,234 (51.2%) | 1,745 (37.1%) |
| 3 Vehicles | 622 (14.3%) | 816 (17.3%) |
| 4 Vehicles | 411 (9.4%) | 443 (9.4%) |
| 5 or more Vehicles | 567 (13.0%) | 572 (12.1%) |
| Total | 4,360 (100.0%) | 4,708 (100.0%) |
Commute Time in Melville
The most frequently occuring commute durations in Melville are 20 to 24 minutes (1,386 commuters, 17.7%), 15 to 19 minutes (1,341 commuters, 17.1%), and 10 to 14 minutes (1,167 commuters, 14.9%).
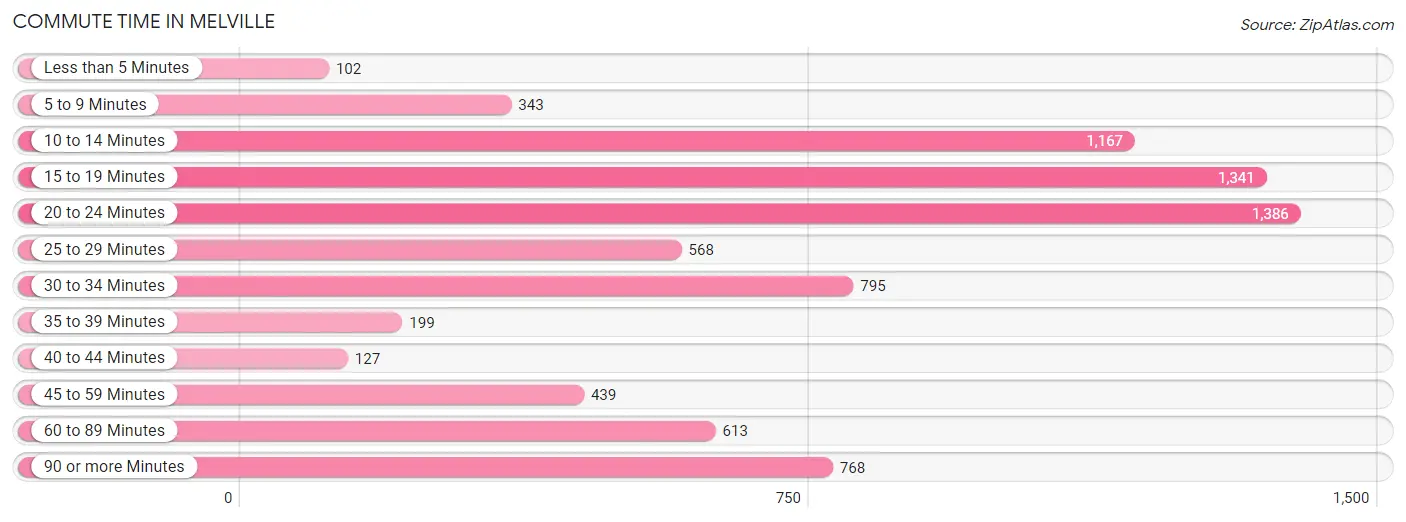
| Commute Time | # Commuters | % Commuters |
| Less than 5 Minutes | 102 | 1.3% |
| 5 to 9 Minutes | 343 | 4.4% |
| 10 to 14 Minutes | 1,167 | 14.9% |
| 15 to 19 Minutes | 1,341 | 17.1% |
| 20 to 24 Minutes | 1,386 | 17.7% |
| 25 to 29 Minutes | 568 | 7.2% |
| 30 to 34 Minutes | 795 | 10.1% |
| 35 to 39 Minutes | 199 | 2.5% |
| 40 to 44 Minutes | 127 | 1.6% |
| 45 to 59 Minutes | 439 | 5.6% |
| 60 to 89 Minutes | 613 | 7.8% |
| 90 or more Minutes | 768 | 9.8% |
Commute Time by Sex in Melville
The most common commute times in Melville are 10 to 14 minutes (761 commuters, 19.9%) for males and 15 to 19 minutes (908 commuters, 22.5%) for females.
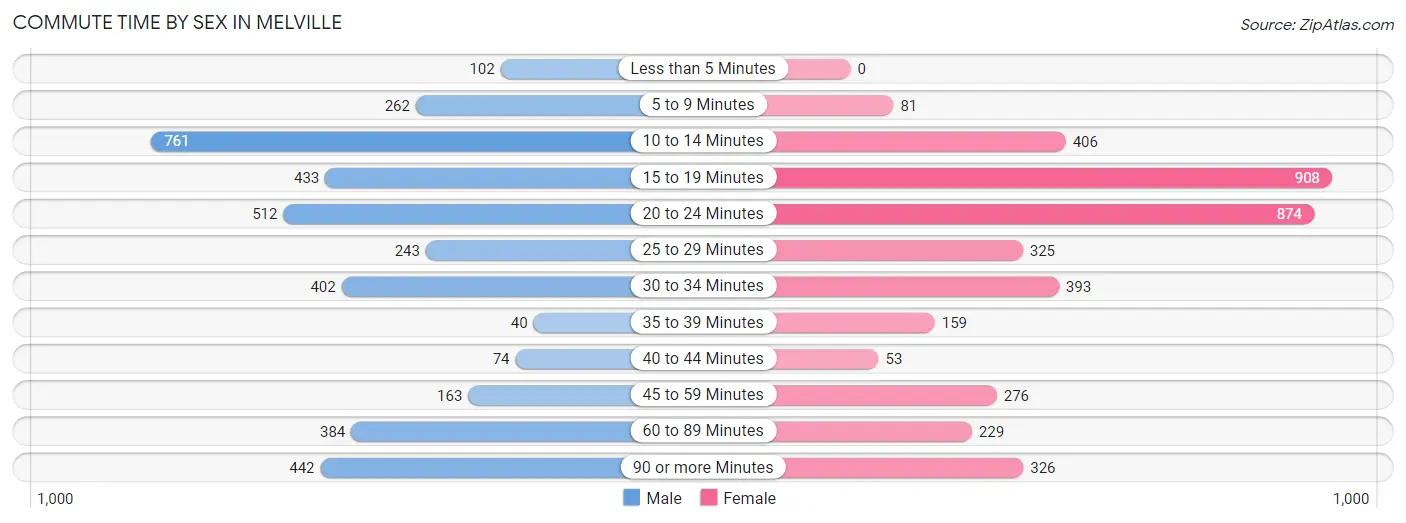
| Commute Time | Male | Female |
| Less than 5 Minutes | 102 (2.7%) | 0 (0.0%) |
| 5 to 9 Minutes | 262 (6.9%) | 81 (2.0%) |
| 10 to 14 Minutes | 761 (19.9%) | 406 (10.1%) |
| 15 to 19 Minutes | 433 (11.3%) | 908 (22.5%) |
| 20 to 24 Minutes | 512 (13.4%) | 874 (21.7%) |
| 25 to 29 Minutes | 243 (6.4%) | 325 (8.1%) |
| 30 to 34 Minutes | 402 (10.5%) | 393 (9.8%) |
| 35 to 39 Minutes | 40 (1.1%) | 159 (4.0%) |
| 40 to 44 Minutes | 74 (1.9%) | 53 (1.3%) |
| 45 to 59 Minutes | 163 (4.3%) | 276 (6.9%) |
| 60 to 89 Minutes | 384 (10.1%) | 229 (5.7%) |
| 90 or more Minutes | 442 (11.6%) | 326 (8.1%) |
Time of Departure to Work by Sex in Melville
The most frequent times of departure to work in Melville are 7:30 AM to 7:59 AM (716, 18.8%) for males and 8:00 AM to 8:29 AM (789, 19.6%) for females.
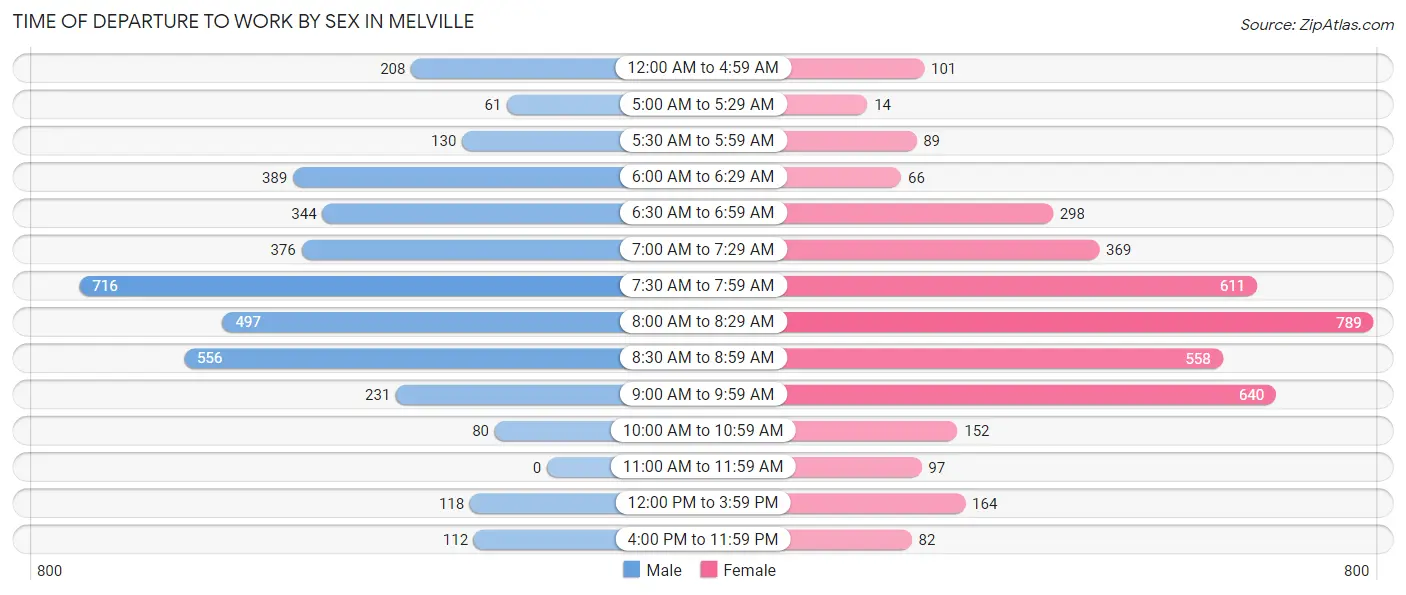
| Time of Departure | Male | Female |
| 12:00 AM to 4:59 AM | 208 (5.4%) | 101 (2.5%) |
| 5:00 AM to 5:29 AM | 61 (1.6%) | 14 (0.4%) |
| 5:30 AM to 5:59 AM | 130 (3.4%) | 89 (2.2%) |
| 6:00 AM to 6:29 AM | 389 (10.2%) | 66 (1.6%) |
| 6:30 AM to 6:59 AM | 344 (9.0%) | 298 (7.4%) |
| 7:00 AM to 7:29 AM | 376 (9.9%) | 369 (9.2%) |
| 7:30 AM to 7:59 AM | 716 (18.8%) | 611 (15.2%) |
| 8:00 AM to 8:29 AM | 497 (13.0%) | 789 (19.6%) |
| 8:30 AM to 8:59 AM | 556 (14.6%) | 558 (13.9%) |
| 9:00 AM to 9:59 AM | 231 (6.0%) | 640 (15.9%) |
| 10:00 AM to 10:59 AM | 80 (2.1%) | 152 (3.8%) |
| 11:00 AM to 11:59 AM | 0 (0.0%) | 97 (2.4%) |
| 12:00 PM to 3:59 PM | 118 (3.1%) | 164 (4.1%) |
| 4:00 PM to 11:59 PM | 112 (2.9%) | 82 (2.0%) |
| Total | 3,818 (100.0%) | 4,030 (100.0%) |
Housing Occupancy in Melville
Occupancy by Ownership in Melville
Of the total 7,178 dwellings in Melville, owner-occupied units account for 6,375 (88.8%), while renter-occupied units make up 803 (11.2%).
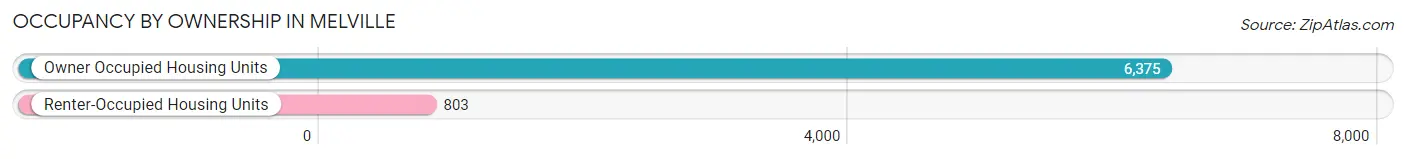
| Occupancy | # Housing Units | % Housing Units |
| Owner Occupied Housing Units | 6,375 | 88.8% |
| Renter-Occupied Housing Units | 803 | 11.2% |
| Total Occupied Housing Units | 7,178 | 100.0% |
Occupancy by Household Size in Melville
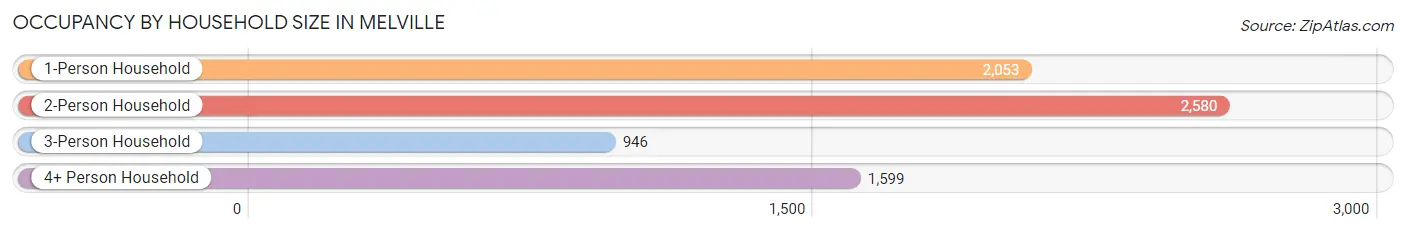
| Household Size | # Housing Units | % Housing Units |
| 1-Person Household | 2,053 | 28.6% |
| 2-Person Household | 2,580 | 35.9% |
| 3-Person Household | 946 | 13.2% |
| 4+ Person Household | 1,599 | 22.3% |
| Total Housing Units | 7,178 | 100.0% |
Occupancy by Ownership by Household Size in Melville
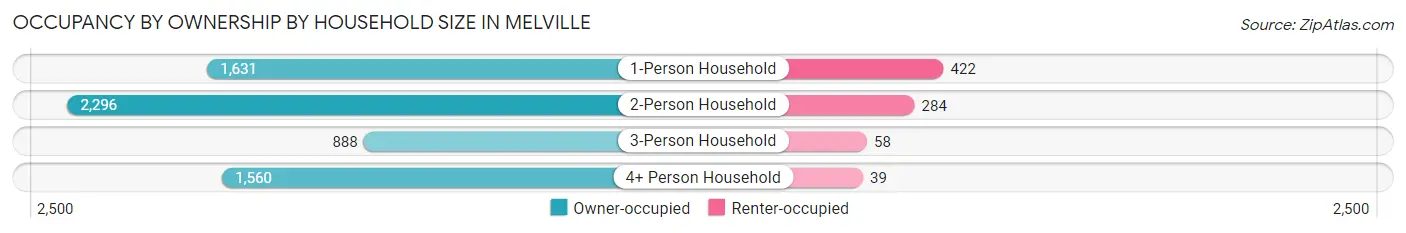
| Household Size | Owner-occupied | Renter-occupied |
| 1-Person Household | 1,631 (79.4%) | 422 (20.6%) |
| 2-Person Household | 2,296 (89.0%) | 284 (11.0%) |
| 3-Person Household | 888 (93.9%) | 58 (6.1%) |
| 4+ Person Household | 1,560 (97.6%) | 39 (2.4%) |
| Total Housing Units | 6,375 (88.8%) | 803 (11.2%) |
Occupancy by Educational Attainment in Melville
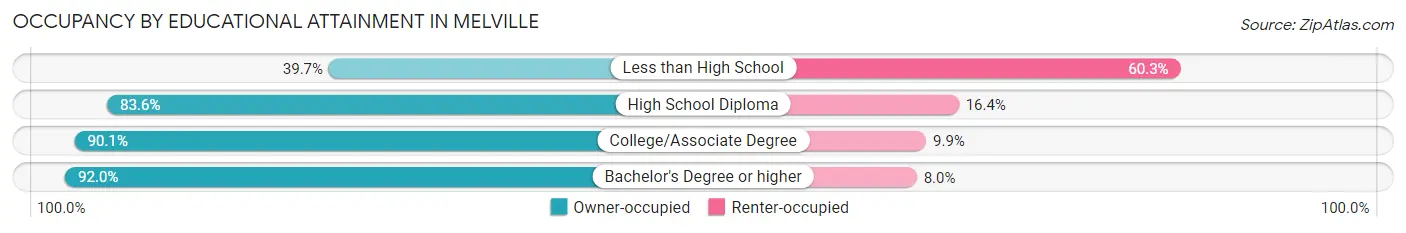
| Household Size | Owner-occupied | Renter-occupied |
| Less than High School | 100 (39.7%) | 152 (60.3%) |
| High School Diploma | 629 (83.6%) | 123 (16.4%) |
| College/Associate Degree | 1,538 (90.1%) | 169 (9.9%) |
| Bachelor's Degree or higher | 4,108 (92.0%) | 359 (8.0%) |
Occupancy by Age of Householder in Melville
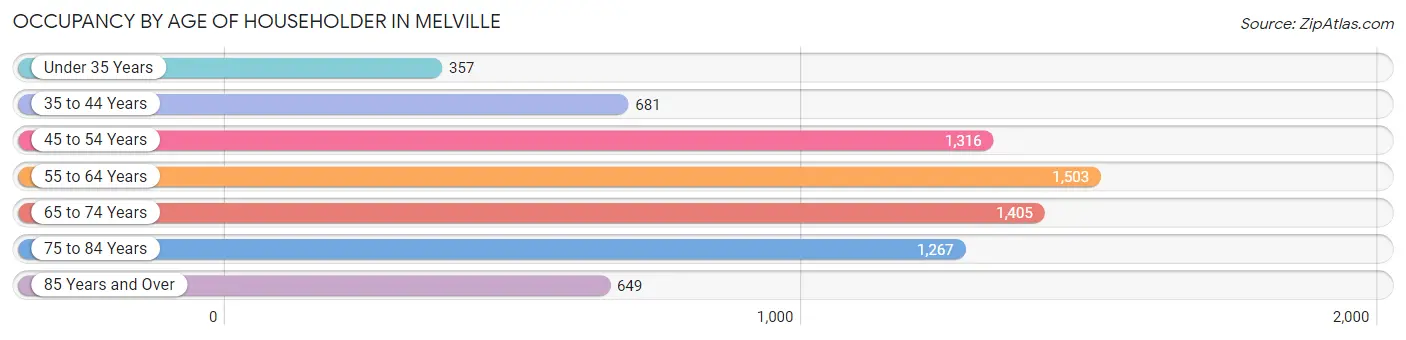
| Age Bracket | # Households | % Households |
| Under 35 Years | 357 | 5.0% |
| 35 to 44 Years | 681 | 9.5% |
| 45 to 54 Years | 1,316 | 18.3% |
| 55 to 64 Years | 1,503 | 20.9% |
| 65 to 74 Years | 1,405 | 19.6% |
| 75 to 84 Years | 1,267 | 17.6% |
| 85 Years and Over | 649 | 9.0% |
| Total | 7,178 | 100.0% |
Housing Finances in Melville
Median Income by Occupancy in Melville
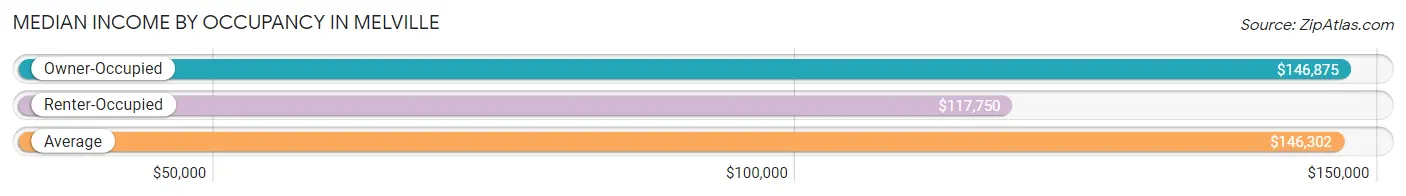
| Occupancy Type | # Households | Median Income |
| Owner-Occupied | 6,375 (88.8%) | $146,875 |
| Renter-Occupied | 803 (11.2%) | $117,750 |
| Average | 7,178 (100.0%) | $146,302 |
Occupancy by Householder Income Bracket in Melville
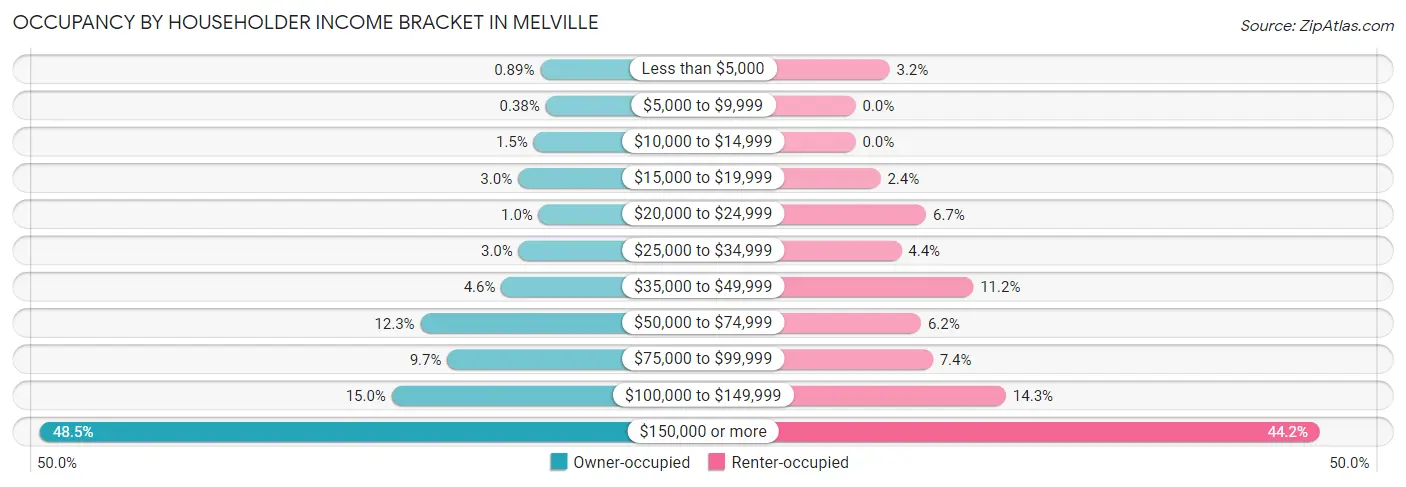
| Income Bracket | Owner-occupied | Renter-occupied |
| Less than $5,000 | 57 (0.9%) | 26 (3.2%) |
| $5,000 to $9,999 | 24 (0.4%) | 0 (0.0%) |
| $10,000 to $14,999 | 97 (1.5%) | 0 (0.0%) |
| $15,000 to $19,999 | 192 (3.0%) | 19 (2.4%) |
| $20,000 to $24,999 | 66 (1.0%) | 54 (6.7%) |
| $25,000 to $34,999 | 188 (2.9%) | 35 (4.4%) |
| $35,000 to $49,999 | 293 (4.6%) | 90 (11.2%) |
| $50,000 to $74,999 | 784 (12.3%) | 50 (6.2%) |
| $75,000 to $99,999 | 621 (9.7%) | 59 (7.3%) |
| $100,000 to $149,999 | 959 (15.0%) | 115 (14.3%) |
| $150,000 or more | 3,094 (48.5%) | 355 (44.2%) |
| Total | 6,375 (100.0%) | 803 (100.0%) |
Monthly Housing Cost Tiers in Melville
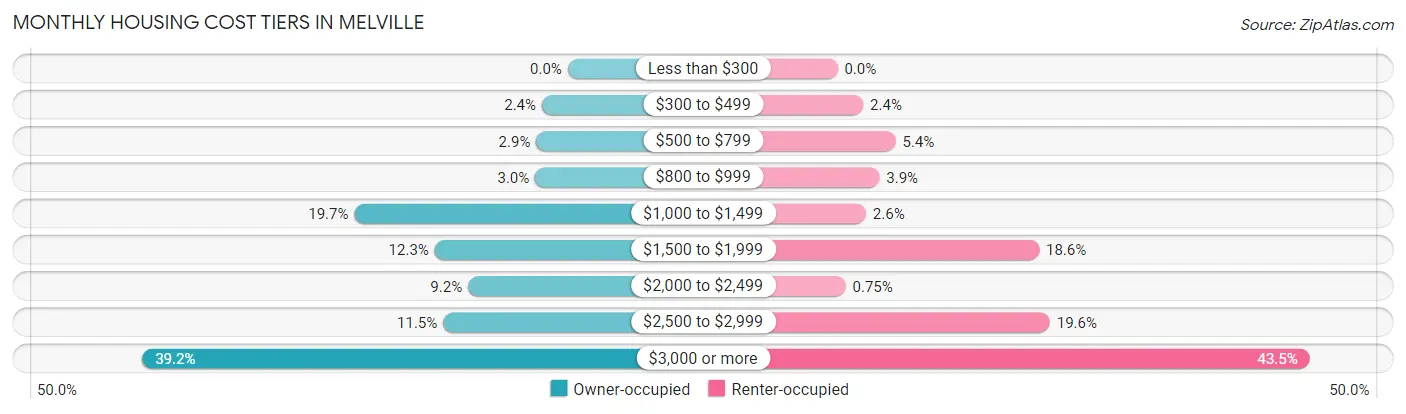
| Monthly Cost | Owner-occupied | Renter-occupied |
| Less than $300 | 0 (0.0%) | 0 (0.0%) |
| $300 to $499 | 152 (2.4%) | 19 (2.4%) |
| $500 to $799 | 185 (2.9%) | 43 (5.3%) |
| $800 to $999 | 191 (3.0%) | 31 (3.9%) |
| $1,000 to $1,499 | 1,253 (19.7%) | 21 (2.6%) |
| $1,500 to $1,999 | 781 (12.2%) | 149 (18.6%) |
| $2,000 to $2,499 | 585 (9.2%) | 6 (0.7%) |
| $2,500 to $2,999 | 731 (11.5%) | 157 (19.6%) |
| $3,000 or more | 2,497 (39.2%) | 349 (43.5%) |
| Total | 6,375 (100.0%) | 803 (100.0%) |
Physical Housing Characteristics in Melville
Housing Structures in Melville
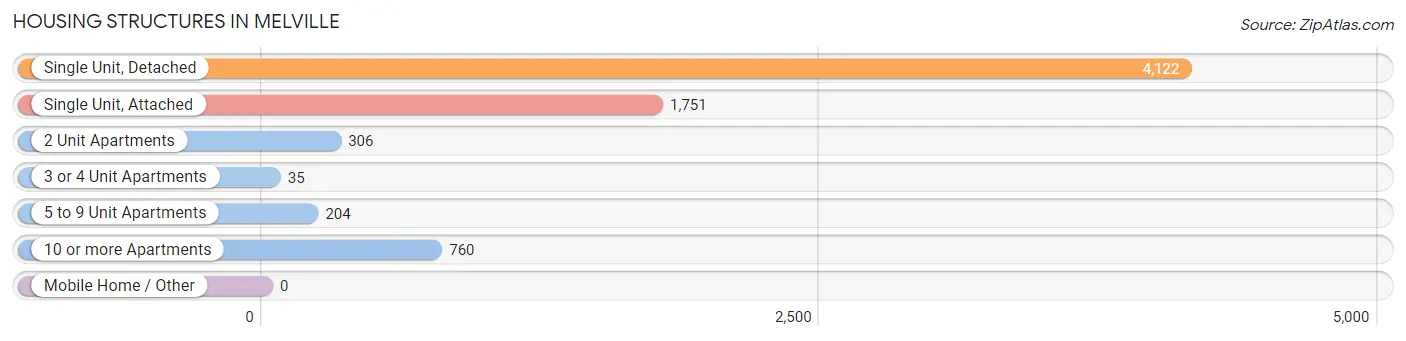
| Structure Type | # Housing Units | % Housing Units |
| Single Unit, Detached | 4,122 | 57.4% |
| Single Unit, Attached | 1,751 | 24.4% |
| 2 Unit Apartments | 306 | 4.3% |
| 3 or 4 Unit Apartments | 35 | 0.5% |
| 5 to 9 Unit Apartments | 204 | 2.8% |
| 10 or more Apartments | 760 | 10.6% |
| Mobile Home / Other | 0 | 0.0% |
| Total | 7,178 | 100.0% |
Housing Structures by Occupancy in Melville
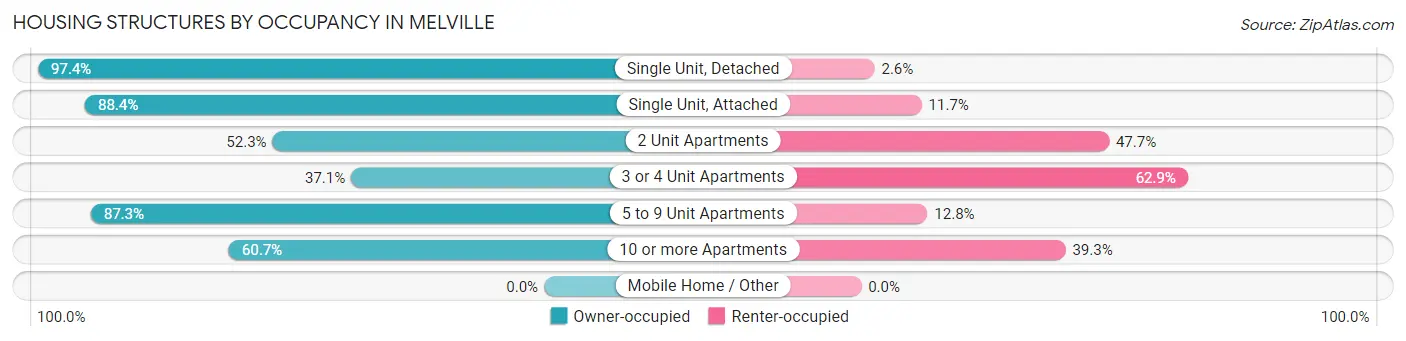
| Structure Type | Owner-occupied | Renter-occupied |
| Single Unit, Detached | 4,016 (97.4%) | 106 (2.6%) |
| Single Unit, Attached | 1,547 (88.3%) | 204 (11.7%) |
| 2 Unit Apartments | 160 (52.3%) | 146 (47.7%) |
| 3 or 4 Unit Apartments | 13 (37.1%) | 22 (62.9%) |
| 5 to 9 Unit Apartments | 178 (87.3%) | 26 (12.8%) |
| 10 or more Apartments | 461 (60.7%) | 299 (39.3%) |
| Mobile Home / Other | 0 (0.0%) | 0 (0.0%) |
| Total | 6,375 (88.8%) | 803 (11.2%) |
Housing Structures by Number of Rooms in Melville
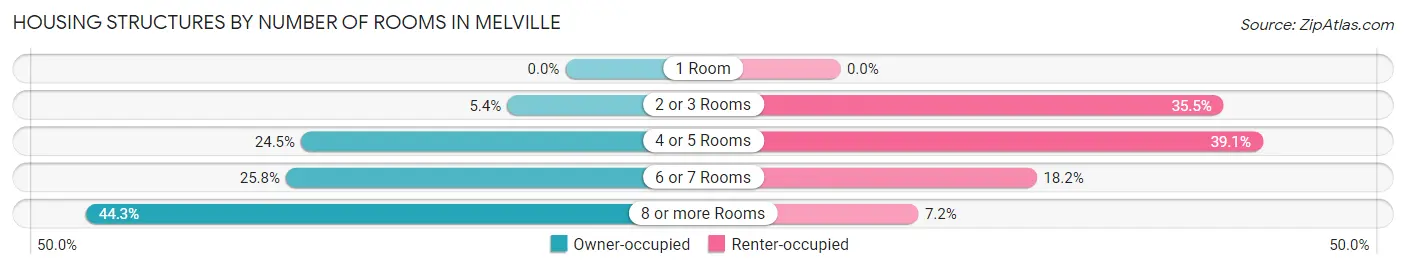
| Number of Rooms | Owner-occupied | Renter-occupied |
| 1 Room | 0 (0.0%) | 0 (0.0%) |
| 2 or 3 Rooms | 343 (5.4%) | 285 (35.5%) |
| 4 or 5 Rooms | 1,559 (24.4%) | 314 (39.1%) |
| 6 or 7 Rooms | 1,647 (25.8%) | 146 (18.2%) |
| 8 or more Rooms | 2,826 (44.3%) | 58 (7.2%) |
| Total | 6,375 (100.0%) | 803 (100.0%) |
Housing Structure by Heating Type in Melville
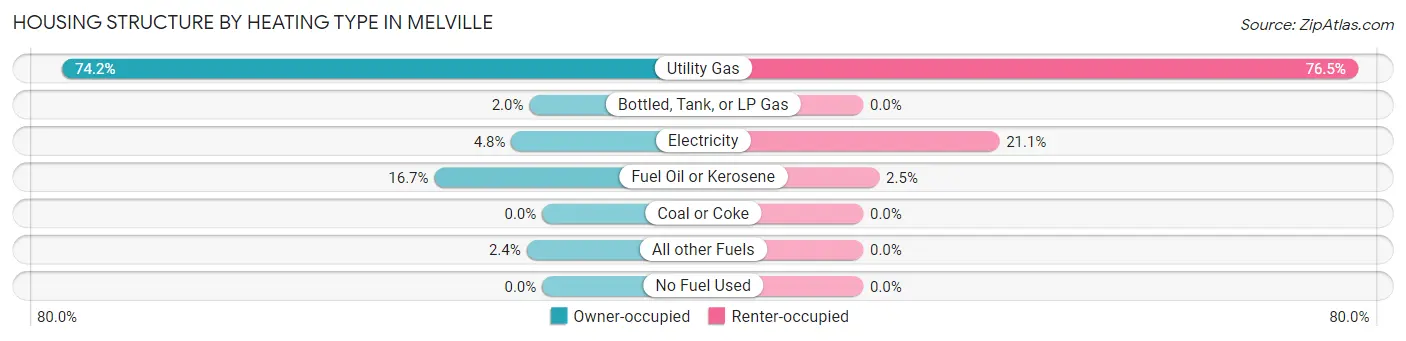
| Heating Type | Owner-occupied | Renter-occupied |
| Utility Gas | 4,731 (74.2%) | 614 (76.5%) |
| Bottled, Tank, or LP Gas | 126 (2.0%) | 0 (0.0%) |
| Electricity | 303 (4.8%) | 169 (21.0%) |
| Fuel Oil or Kerosene | 1,062 (16.7%) | 20 (2.5%) |
| Coal or Coke | 0 (0.0%) | 0 (0.0%) |
| All other Fuels | 153 (2.4%) | 0 (0.0%) |
| No Fuel Used | 0 (0.0%) | 0 (0.0%) |
| Total | 6,375 (100.0%) | 803 (100.0%) |
Household Vehicle Usage in Melville
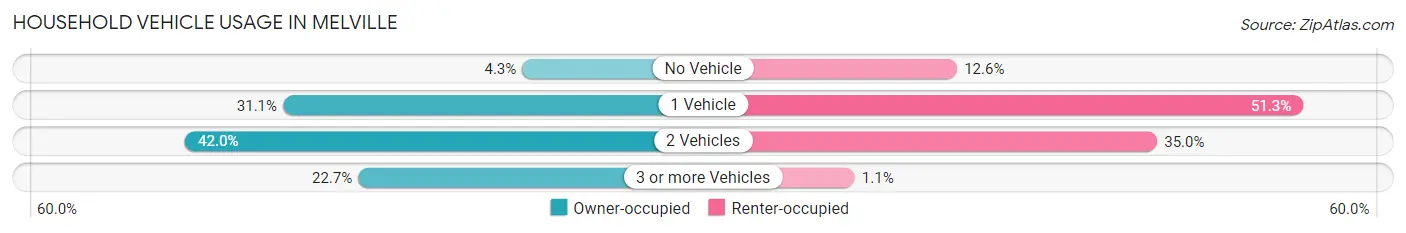
| Vehicles per Household | Owner-occupied | Renter-occupied |
| No Vehicle | 272 (4.3%) | 101 (12.6%) |
| 1 Vehicle | 1,981 (31.1%) | 412 (51.3%) |
| 2 Vehicles | 2,678 (42.0%) | 281 (35.0%) |
| 3 or more Vehicles | 1,444 (22.7%) | 9 (1.1%) |
| Total | 6,375 (100.0%) | 803 (100.0%) |
Real Estate & Mortgages in Melville
Real Estate and Mortgage Overview in Melville
| Characteristic | Without Mortgage | With Mortgage |
| Housing Units | 2,926 | 3,449 |
| Median Property Value | $633,200 | $841,400 |
| Median Household Income | $81,753 | $2,212 |
| Monthly Housing Costs | $1,483 | $2,419 |
| Real Estate Taxes | $8,746 | $11 |
Property Value by Mortgage Status in Melville
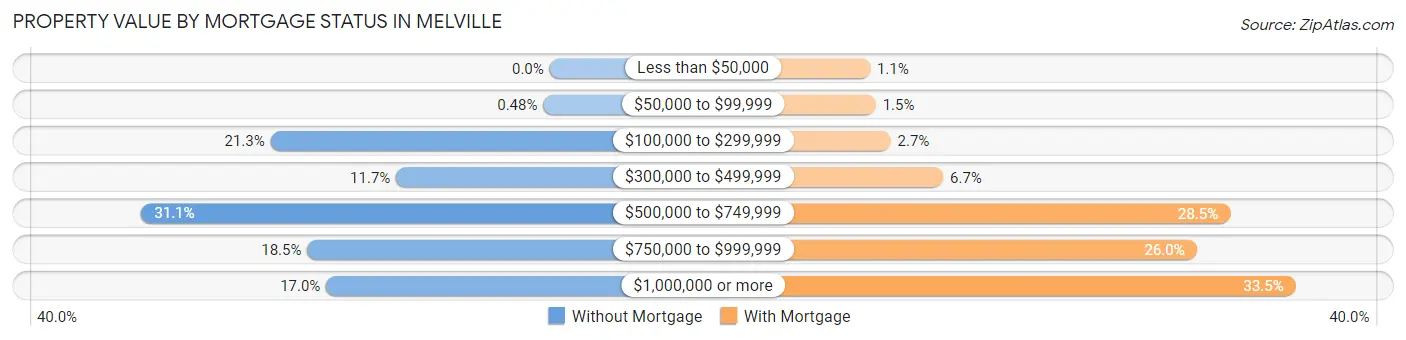
| Property Value | Without Mortgage | With Mortgage |
| Less than $50,000 | 0 (0.0%) | 38 (1.1%) |
| $50,000 to $99,999 | 14 (0.5%) | 53 (1.5%) |
| $100,000 to $299,999 | 622 (21.3%) | 92 (2.7%) |
| $300,000 to $499,999 | 342 (11.7%) | 230 (6.7%) |
| $500,000 to $749,999 | 910 (31.1%) | 984 (28.5%) |
| $750,000 to $999,999 | 540 (18.5%) | 896 (26.0%) |
| $1,000,000 or more | 498 (17.0%) | 1,156 (33.5%) |
| Total | 2,926 (100.0%) | 3,449 (100.0%) |
Household Income by Mortgage Status in Melville
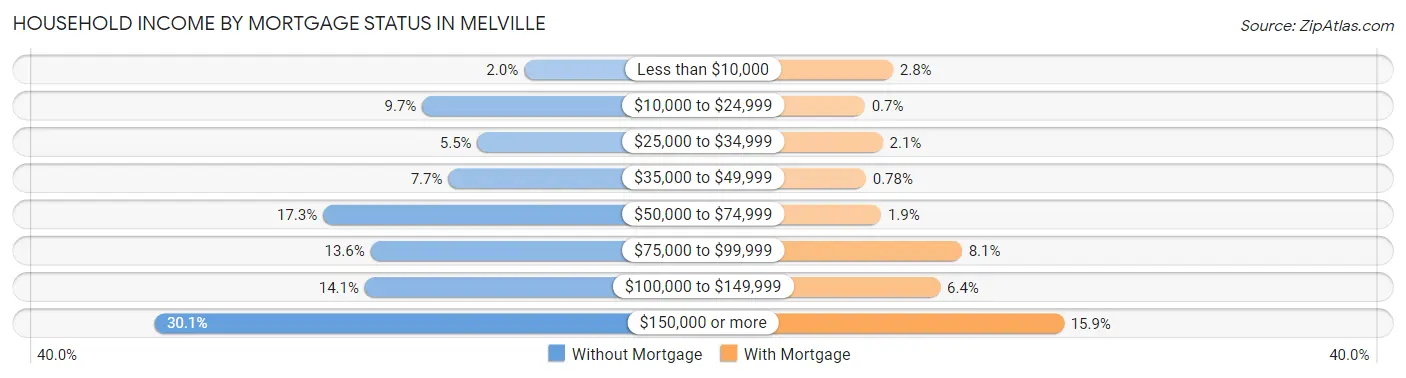
| Household Income | Without Mortgage | With Mortgage |
| Less than $10,000 | 57 (1.9%) | 98 (2.8%) |
| $10,000 to $24,999 | 284 (9.7%) | 24 (0.7%) |
| $25,000 to $34,999 | 161 (5.5%) | 71 (2.1%) |
| $35,000 to $49,999 | 226 (7.7%) | 27 (0.8%) |
| $50,000 to $74,999 | 505 (17.3%) | 67 (1.9%) |
| $75,000 to $99,999 | 399 (13.6%) | 279 (8.1%) |
| $100,000 to $149,999 | 412 (14.1%) | 222 (6.4%) |
| $150,000 or more | 882 (30.1%) | 547 (15.9%) |
| Total | 2,926 (100.0%) | 3,449 (100.0%) |
Property Value to Household Income Ratio in Melville
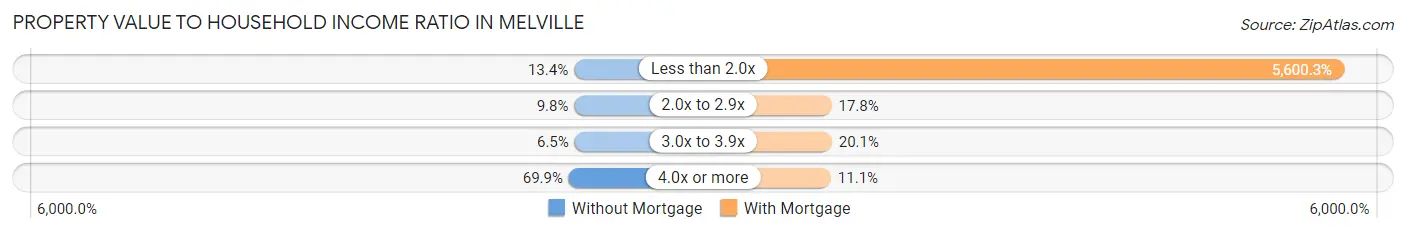
| Value-to-Income Ratio | Without Mortgage | With Mortgage |
| Less than 2.0x | 392 (13.4%) | 193,153 (5,600.3%) |
| 2.0x to 2.9x | 286 (9.8%) | 615 (17.8%) |
| 3.0x to 3.9x | 190 (6.5%) | 692 (20.1%) |
| 4.0x or more | 2,046 (69.9%) | 381 (11.1%) |
| Total | 2,926 (100.0%) | 3,449 (100.0%) |
Real Estate Taxes by Mortgage Status in Melville
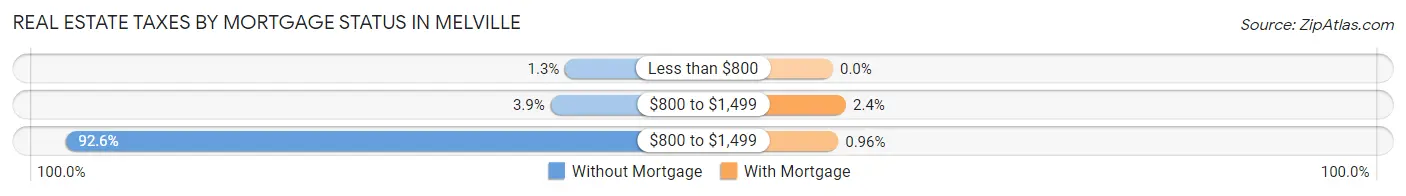
| Property Taxes | Without Mortgage | With Mortgage |
| Less than $800 | 37 (1.3%) | 0 (0.0%) |
| $800 to $1,499 | 115 (3.9%) | 82 (2.4%) |
| $800 to $1,499 | 2,708 (92.5%) | 33 (1.0%) |
| Total | 2,926 (100.0%) | 3,449 (100.0%) |
Health & Disability in Melville
Health Insurance Coverage by Age in Melville
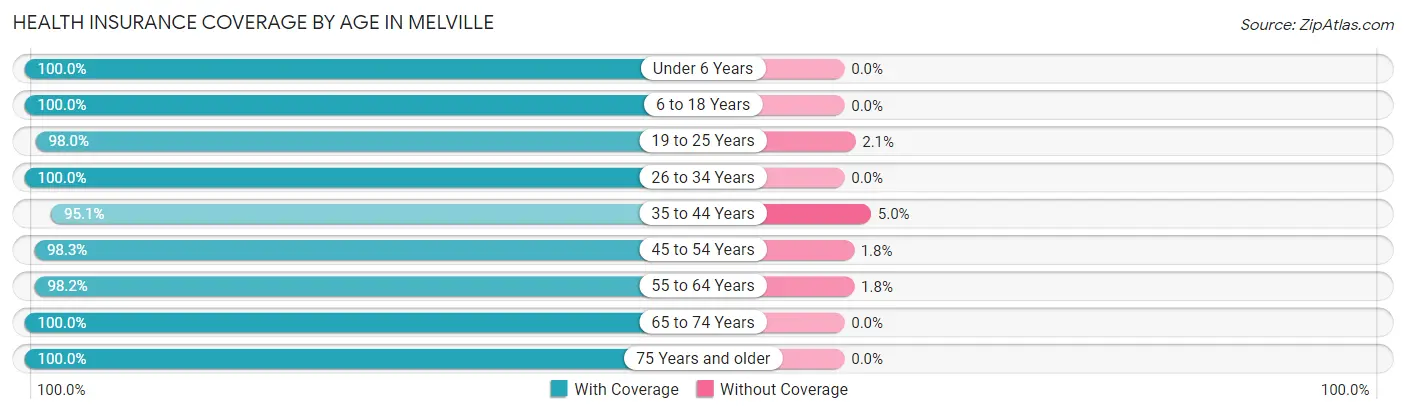
| Age Bracket | With Coverage | Without Coverage |
| Under 6 Years | 1,021 (100.0%) | 0 (0.0%) |
| 6 to 18 Years | 2,420 (100.0%) | 0 (0.0%) |
| 19 to 25 Years | 862 (98.0%) | 18 (2.1%) |
| 26 to 34 Years | 1,692 (100.0%) | 0 (0.0%) |
| 35 to 44 Years | 1,960 (95.1%) | 102 (5.0%) |
| 45 to 54 Years | 2,413 (98.3%) | 43 (1.8%) |
| 55 to 64 Years | 2,775 (98.2%) | 52 (1.8%) |
| 65 to 74 Years | 2,116 (100.0%) | 0 (0.0%) |
| 75 Years and older | 2,848 (100.0%) | 0 (0.0%) |
| Total | 18,107 (98.8%) | 215 (1.2%) |
Health Insurance Coverage by Citizenship Status in Melville
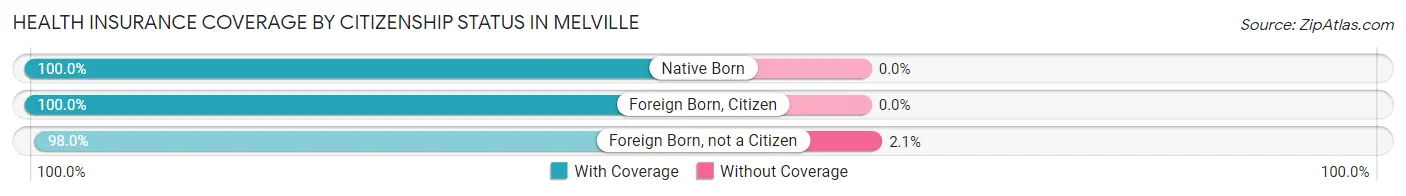
| Citizenship Status | With Coverage | Without Coverage |
| Native Born | 1,021 (100.0%) | 0 (0.0%) |
| Foreign Born, Citizen | 2,420 (100.0%) | 0 (0.0%) |
| Foreign Born, not a Citizen | 862 (98.0%) | 18 (2.1%) |
Health Insurance Coverage by Household Income in Melville
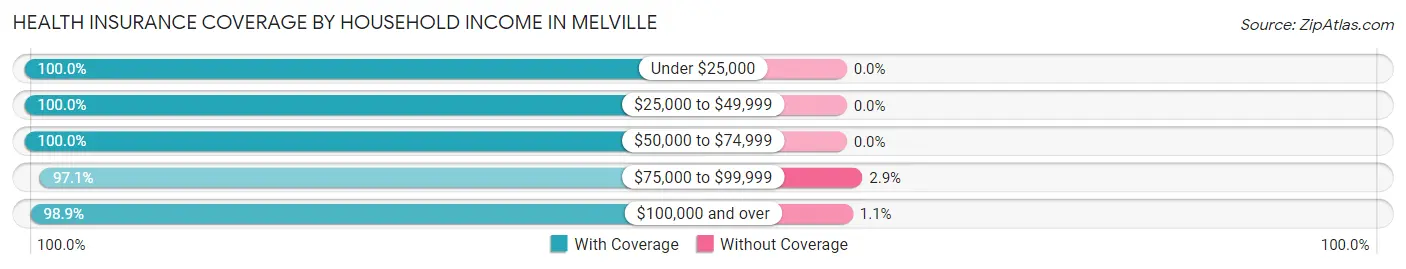
| Household Income | With Coverage | Without Coverage |
| Under $25,000 | 775 (100.0%) | 0 (0.0%) |
| $25,000 to $49,999 | 905 (100.0%) | 0 (0.0%) |
| $50,000 to $74,999 | 1,548 (100.0%) | 0 (0.0%) |
| $75,000 to $99,999 | 931 (97.1%) | 28 (2.9%) |
| $100,000 and over | 13,832 (98.9%) | 160 (1.1%) |
Public vs Private Health Insurance Coverage by Age in Melville
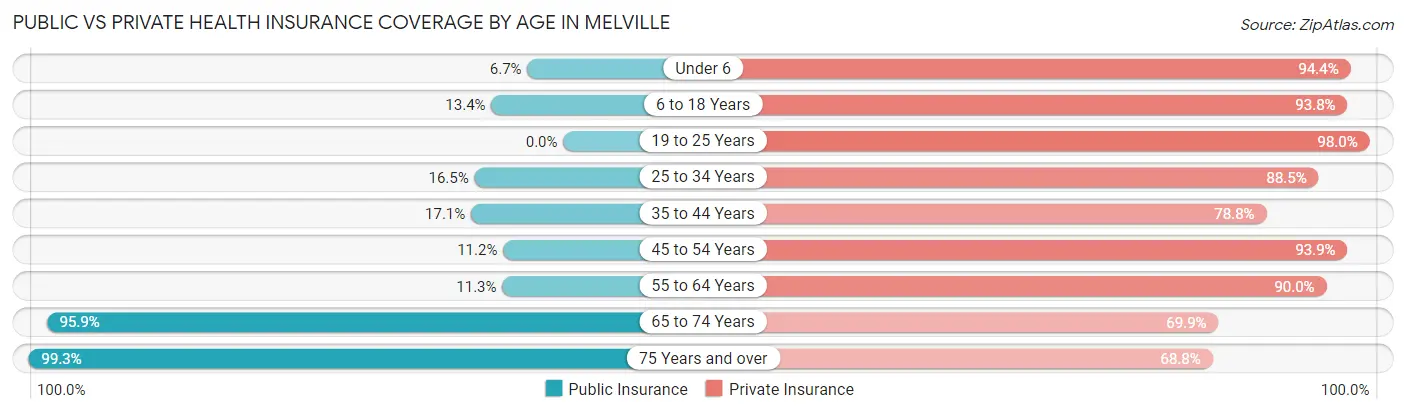
| Age Bracket | Public Insurance | Private Insurance |
| Under 6 | 68 (6.7%) | 964 (94.4%) |
| 6 to 18 Years | 323 (13.4%) | 2,271 (93.8%) |
| 19 to 25 Years | 0 (0.0%) | 862 (98.0%) |
| 25 to 34 Years | 279 (16.5%) | 1,497 (88.5%) |
| 35 to 44 Years | 353 (17.1%) | 1,625 (78.8%) |
| 45 to 54 Years | 274 (11.2%) | 2,305 (93.9%) |
| 55 to 64 Years | 320 (11.3%) | 2,543 (89.9%) |
| 65 to 74 Years | 2,030 (95.9%) | 1,479 (69.9%) |
| 75 Years and over | 2,828 (99.3%) | 1,960 (68.8%) |
| Total | 6,475 (35.3%) | 15,506 (84.6%) |
Disability Status by Sex by Age in Melville
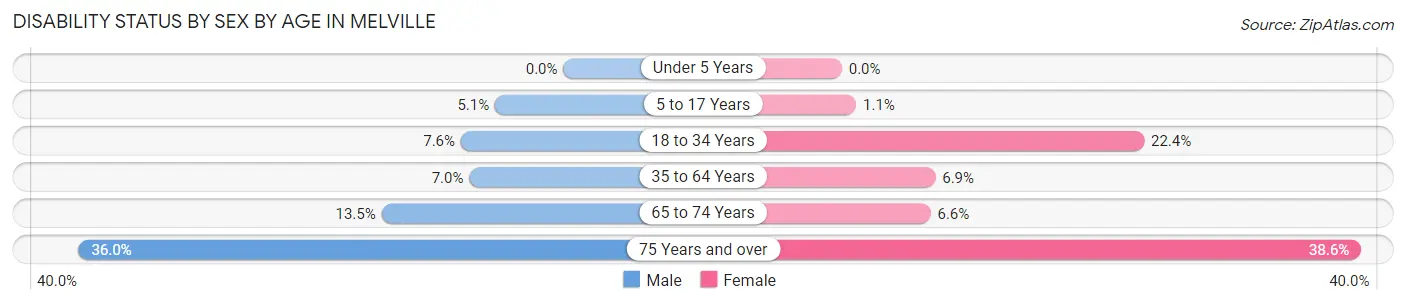
| Age Bracket | Male | Female |
| Under 5 Years | 0 (0.0%) | 0 (0.0%) |
| 5 to 17 Years | 66 (5.1%) | 12 (1.1%) |
| 18 to 34 Years | 104 (7.6%) | 303 (22.4%) |
| 35 to 64 Years | 230 (7.0%) | 281 (6.9%) |
| 65 to 74 Years | 126 (13.5%) | 78 (6.6%) |
| 75 Years and over | 369 (36.0%) | 703 (38.6%) |
Disability Class by Sex by Age in Melville
Disability Class: Hearing Difficulty
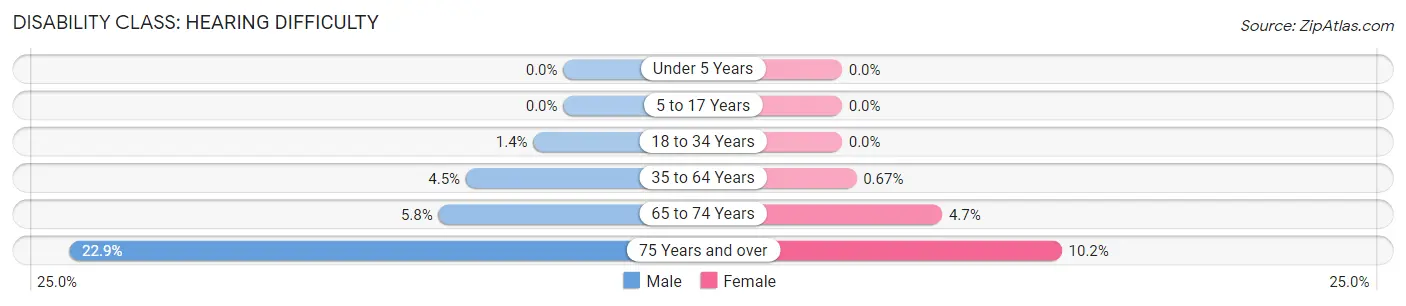
| Age Bracket | Male | Female |
| Under 5 Years | 0 (0.0%) | 0 (0.0%) |
| 5 to 17 Years | 0 (0.0%) | 0 (0.0%) |
| 18 to 34 Years | 19 (1.4%) | 0 (0.0%) |
| 35 to 64 Years | 149 (4.5%) | 27 (0.7%) |
| 65 to 74 Years | 54 (5.8%) | 55 (4.6%) |
| 75 Years and over | 235 (22.9%) | 186 (10.2%) |
Disability Class: Vision Difficulty
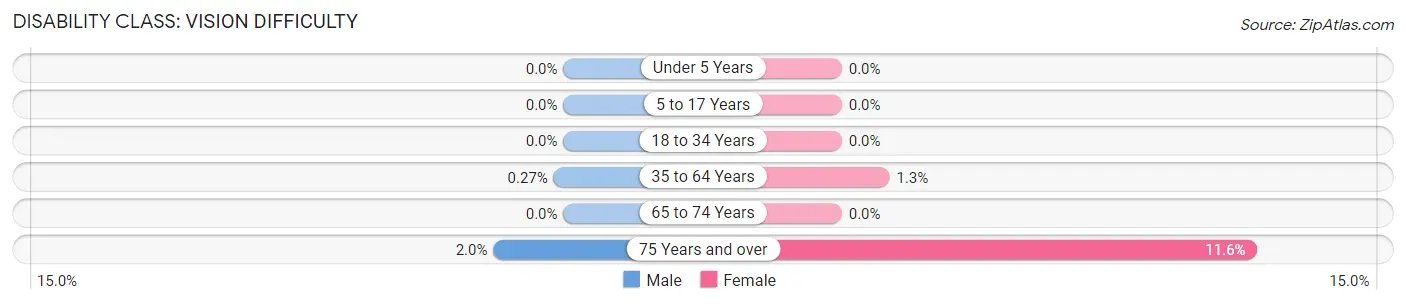
| Age Bracket | Male | Female |
| Under 5 Years | 0 (0.0%) | 0 (0.0%) |
| 5 to 17 Years | 0 (0.0%) | 0 (0.0%) |
| 18 to 34 Years | 0 (0.0%) | 0 (0.0%) |
| 35 to 64 Years | 9 (0.3%) | 54 (1.3%) |
| 65 to 74 Years | 0 (0.0%) | 0 (0.0%) |
| 75 Years and over | 20 (1.9%) | 211 (11.6%) |
Disability Class: Cognitive Difficulty
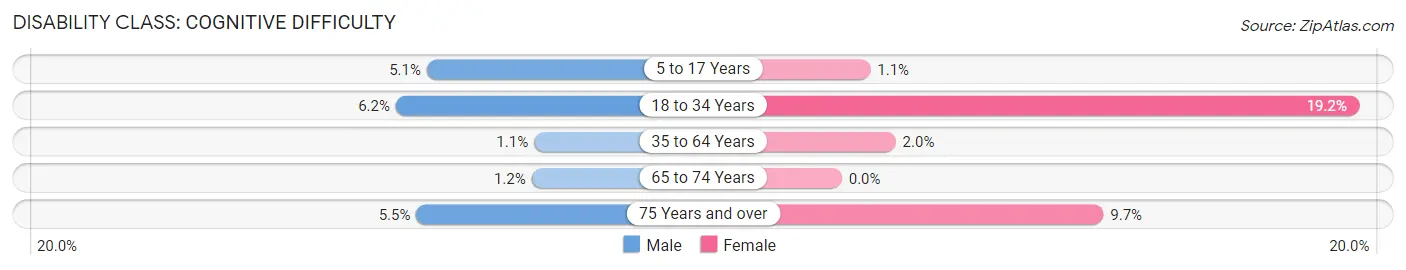
| Age Bracket | Male | Female |
| 5 to 17 Years | 66 (5.1%) | 12 (1.1%) |
| 18 to 34 Years | 85 (6.2%) | 259 (19.2%) |
| 35 to 64 Years | 36 (1.1%) | 81 (2.0%) |
| 65 to 74 Years | 11 (1.2%) | 0 (0.0%) |
| 75 Years and over | 56 (5.5%) | 177 (9.7%) |
Disability Class: Ambulatory Difficulty
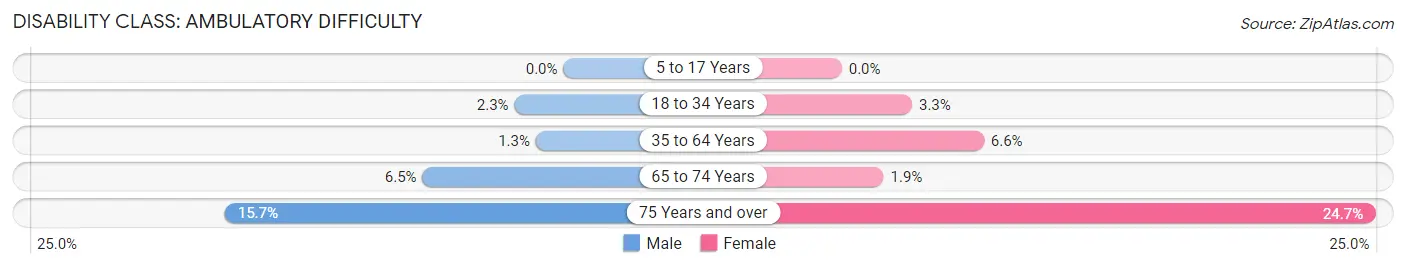
| Age Bracket | Male | Female |
| 5 to 17 Years | 0 (0.0%) | 0 (0.0%) |
| 18 to 34 Years | 31 (2.3%) | 44 (3.3%) |
| 35 to 64 Years | 42 (1.3%) | 267 (6.6%) |
| 65 to 74 Years | 61 (6.5%) | 23 (1.9%) |
| 75 Years and over | 161 (15.7%) | 451 (24.7%) |
Disability Class: Self-Care Difficulty
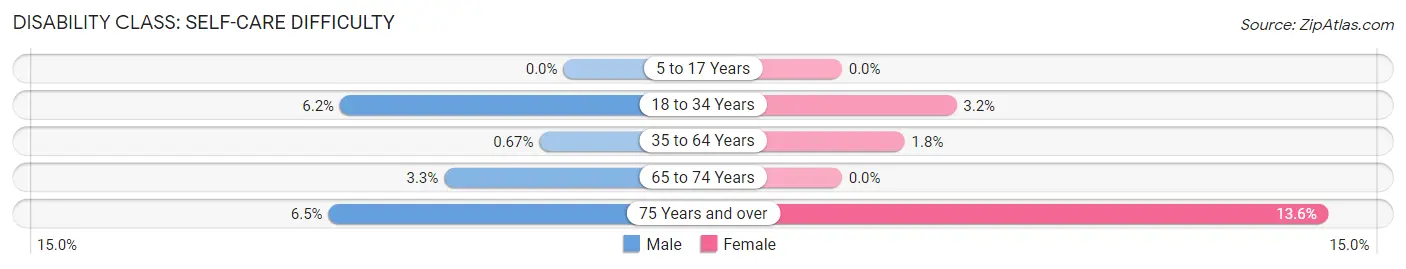
| Age Bracket | Male | Female |
| 5 to 17 Years | 0 (0.0%) | 0 (0.0%) |
| 18 to 34 Years | 85 (6.2%) | 43 (3.2%) |
| 35 to 64 Years | 22 (0.7%) | 71 (1.8%) |
| 65 to 74 Years | 31 (3.3%) | 0 (0.0%) |
| 75 Years and over | 67 (6.5%) | 247 (13.6%) |
Technology Access in Melville
Computing Device Access in Melville
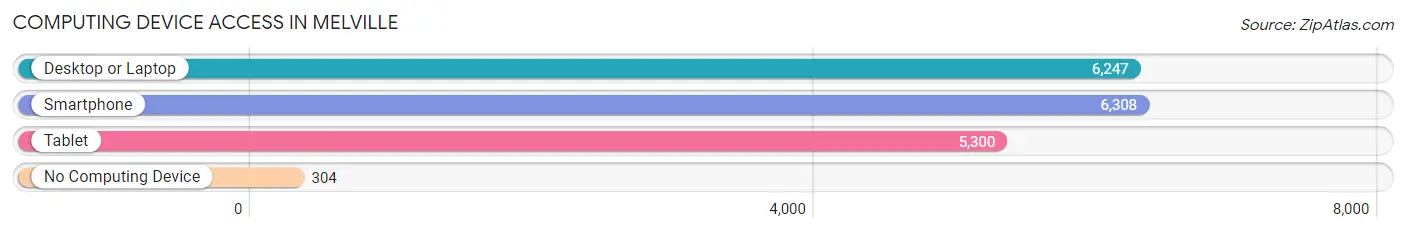
| Device Type | # Households | % Households |
| Desktop or Laptop | 6,247 | 87.0% |
| Smartphone | 6,308 | 87.9% |
| Tablet | 5,300 | 73.8% |
| No Computing Device | 304 | 4.2% |
| Total | 7,178 | 100.0% |
Internet Access in Melville
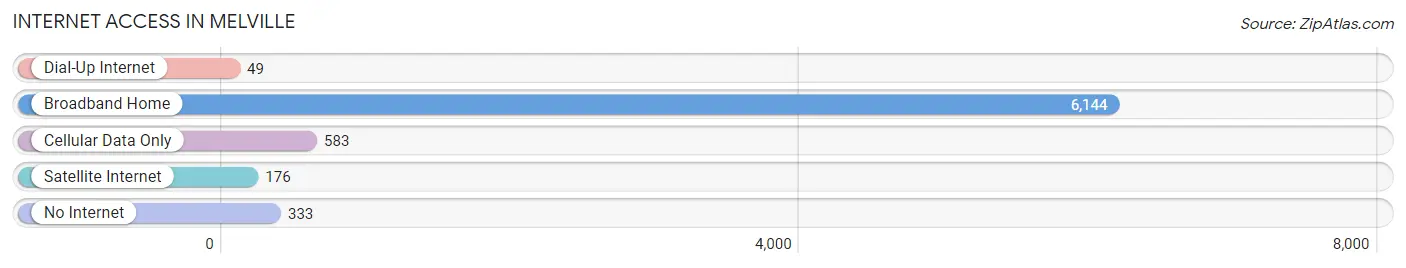
| Internet Type | # Households | % Households |
| Dial-Up Internet | 49 | 0.7% |
| Broadband Home | 6,144 | 85.6% |
| Cellular Data Only | 583 | 8.1% |
| Satellite Internet | 176 | 2.5% |
| No Internet | 333 | 4.6% |
| Total | 7,178 | 100.0% |
Melville Summary
Melville, NY is a hamlet located in the Town of Huntington in Suffolk County, New York. It is situated on the North Shore of Long Island, approximately 40 miles east of New York City. The hamlet is home to approximately 19,000 people and is part of the larger Huntington-Oyster Bay-East Northport metropolitan area.
History
The area that is now Melville was originally inhabited by the Matinecock Native American tribe. The first European settlers arrived in the area in the 1650s, and the hamlet was officially established in 1852. The hamlet was named after the Melville family, who were prominent landowners in the area.
In the late 19th century, Melville became a popular summer resort destination for wealthy New Yorkers. The hamlet was home to several large estates, including the estate of William K. Vanderbilt, which was later converted into a golf course.
In the early 20th century, Melville began to develop into a residential community. The hamlet was home to several large estates, including the estate of William K. Vanderbilt, which was later converted into a golf course.
Geography
Melville is located on the North Shore of Long Island, approximately 40 miles east of New York City. The hamlet is bordered by the Town of Huntington to the west, the Town of Babylon to the east, and the Town of Smithtown to the south. The hamlet is situated on the northern edge of the Long Island Sound, and is home to several parks and beaches.
The hamlet is home to several parks and beaches, including the Vanderbilt Estate Park, the Cold Spring Harbor State Park, and the Sunken Meadow State Park. The hamlet is also home to several golf courses, including the Melville Country Club and the Huntington Country Club.
Economy
Melville is home to several large businesses, including Canon USA, Nikon USA, and Northrop Grumman. The hamlet is also home to several smaller businesses, including restaurants, retail stores, and professional services.
The hamlet is home to several large shopping centers, including the Melville Mall and the Walt Whitman Shops. The hamlet is also home to several smaller shopping centers, including the Melville Plaza and the Melville Shopping Center.
Demographics
As of the 2010 census, the population of Melville was 19,039. The racial makeup of the hamlet was 79.3% White, 8.2% African American, 0.2% Native American, 8.2% Asian, and 4.1% from other races. The median household income was $107,817, and the median family income was $125,917.
The largest age group in Melville was 25-44, which made up 33.3% of the population. The median age was 40.7 years. The hamlet was home to 8,945 households, and the average household size was 2.17.
Conclusion
Melville, NY is a hamlet located in the Town of Huntington in Suffolk County, New York. It is situated on the North Shore of Long Island, approximately 40 miles east of New York City. The hamlet is home to approximately 19,000 people and is part of the larger Huntington-Oyster Bay-East Northport metropolitan area. The area was originally inhabited by the Matinecock Native American tribe, and was later developed into a residential community in the early 20th century. The hamlet is home to several large businesses, including Canon USA, Nikon USA, and Northrop Grumman. The population of Melville was 19,039 as of the 2010 census, and the median household income was $107,817. The hamlet is home to several parks and beaches, as well as several shopping centers.
Common Questions
What is Per Capita Income in Melville?
Per Capita income in Melville is $85,127.
What is the Median Family Income in Melville?
Median Family Income in Melville is $189,022.
What is the Median Household income in Melville?
Median Household Income in Melville is $146,302.
What is Income or Wage Gap in Melville?
Income or Wage Gap in Melville is 38.3%.
Women in Melville earn 61.7 cents for every dollar earned by a man.
What is Family Income Deficit in Melville?
Family Income Deficit in Melville is $12,315.
Families that are below poverty line in Melville earn $12,315 less on average than the poverty threshold level.
What is Inequality or Gini Index in Melville?
Inequality or Gini Index in Melville is 0.51.
What is the Total Population of Melville?
Total Population of Melville is 18,526.
What is the Total Male Population of Melville?
Total Male Population of Melville is 8,362.
What is the Total Female Population of Melville?
Total Female Population of Melville is 10,164.
What is the Ratio of Males per 100 Females in Melville?
There are 82.27 Males per 100 Females in Melville.
What is the Ratio of Females per 100 Males in Melville?
There are 121.55 Females per 100 Males in Melville.
What is the Median Population Age in Melville?
Median Population Age in Melville is 51.1 Years.
What is the Average Family Size in Melville
Average Family Size in Melville is 3.1 People.
What is the Average Household Size in Melville
Average Household Size in Melville is 2.5 People.
How Large is the Labor Force in Melville?
There are 10,036 People in the Labor Forcein in Melville.
What is the Percentage of People in the Labor Force in Melville?
64.5% of People are in the Labor Force in Melville.
What is the Unemployment Rate in Melville?
Unemployment Rate in Melville is 8.3%.