Cove Neck, NY Map & Demographics
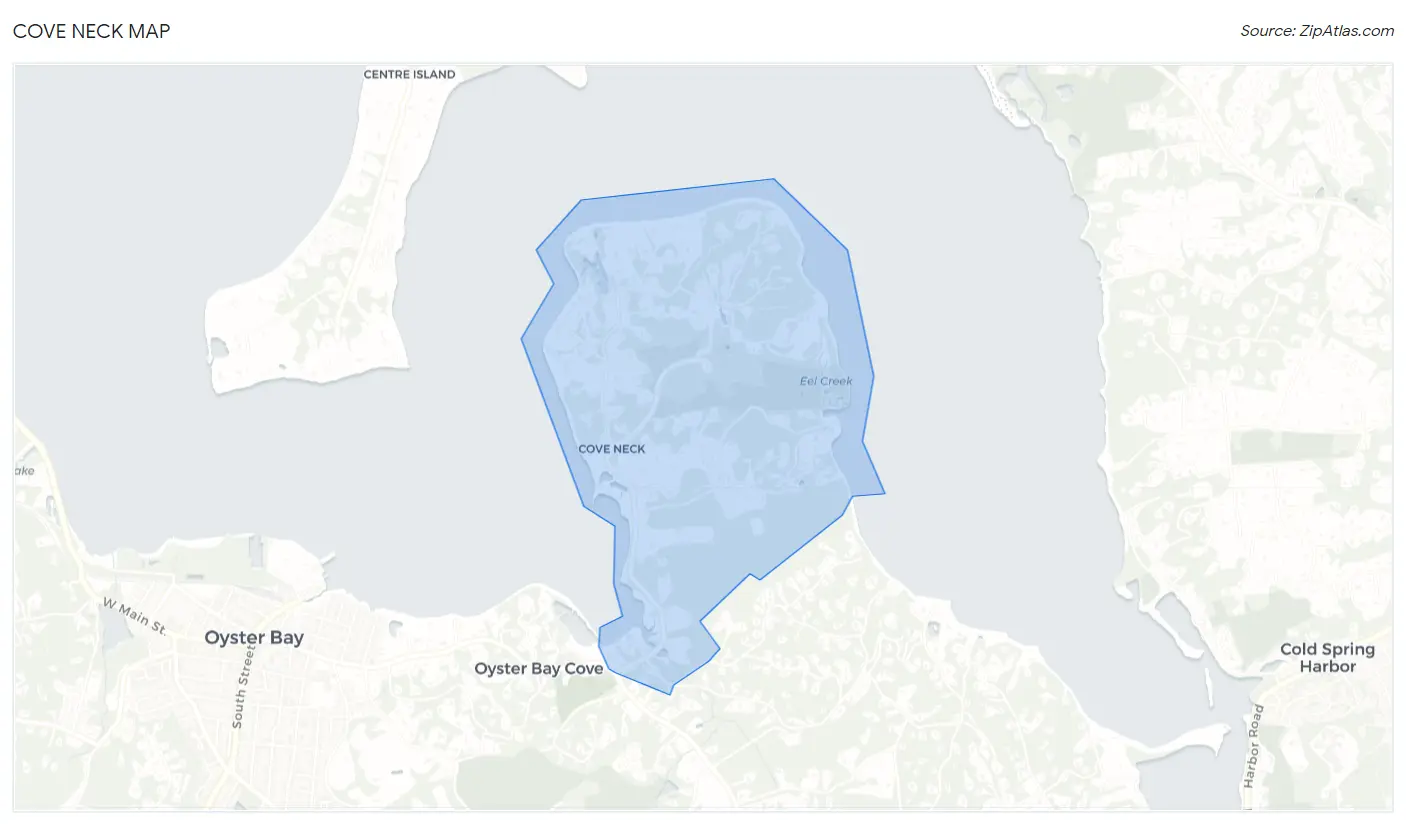
Cove Neck Map
Cove Neck Overview
$182,753
PER CAPITA INCOME
$232,000
AVG FAMILY INCOME
$209,375
AVG HOUSEHOLD INCOME
0.60
INEQUALITY / GINI INDEX
255
TOTAL POPULATION
147
MALE POPULATION
108
FEMALE POPULATION
136.11
MALES / 100 FEMALES
73.47
FEMALES / 100 MALES
53.3
MEDIAN AGE
3.0
AVG FAMILY SIZE
2.5
AVG HOUSEHOLD SIZE
134
LABOR FORCE [ PEOPLE ]
59.8%
PERCENT IN LABOR FORCE
2.2%
UNEMPLOYMENT RATE
Income in Cove Neck
Income Overview in Cove Neck
Per Capita Income in Cove Neck is $182,753, while median incomes of families and households are $232,000 and $209,375 respectively.
| Characteristic | Number | Measure |
| Per Capita Income | 255 | $182,753 |
| Median Family Income | 72 | $232,000 |
| Mean Family Income | 72 | $598,936 |
| Median Household Income | 101 | $209,375 |
| Mean Household Income | 101 | $450,560 |
| Income Deficit | 72 | $0 |
| Wage / Income Gap (%) | 255 | 0.00% |
| Wage / Income Gap ($) | 255 | 100.00¢ per $1 |
| Gini / Inequality Index | 255 | 0.60 |
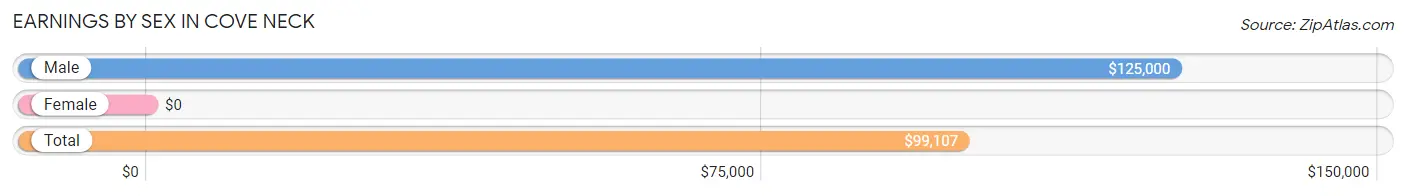
Earnings by Sex in Cove Neck
| Sex | Number | Average Earnings |
| Male | 94 (63.1%) | $125,000 |
| Female | 55 (36.9%) | $0 |
| Total | 149 (100.0%) | $99,107 |
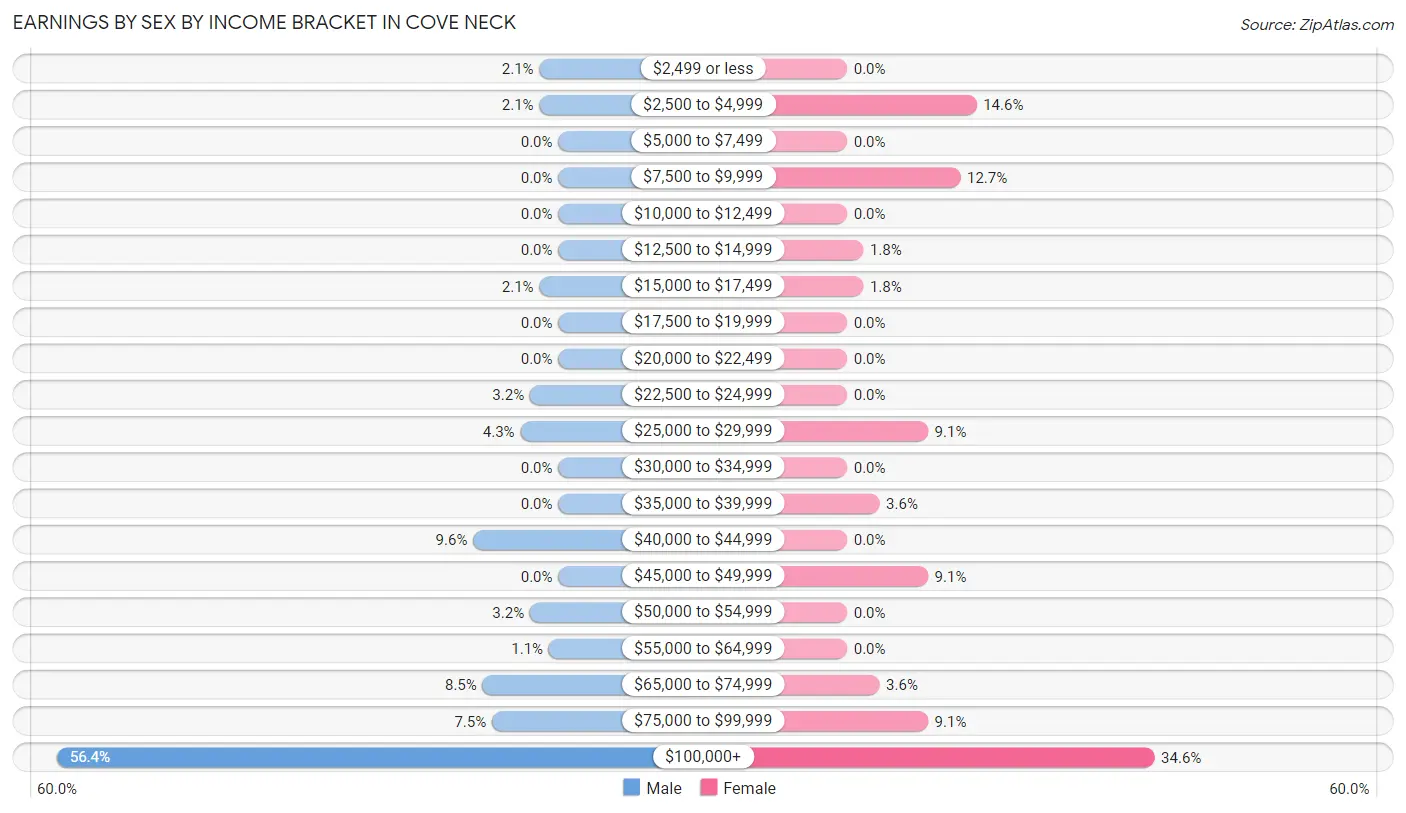
Earnings by Sex by Income Bracket in Cove Neck
The most common earnings brackets in Cove Neck are $100,000+ for men (53 | 56.4%) and $100,000+ for women (19 | 34.5%).
| Income | Male | Female |
| $2,499 or less | 2 (2.1%) | 0 (0.0%) |
| $2,500 to $4,999 | 2 (2.1%) | 8 (14.5%) |
| $5,000 to $7,499 | 0 (0.0%) | 0 (0.0%) |
| $7,500 to $9,999 | 0 (0.0%) | 7 (12.7%) |
| $10,000 to $12,499 | 0 (0.0%) | 0 (0.0%) |
| $12,500 to $14,999 | 0 (0.0%) | 1 (1.8%) |
| $15,000 to $17,499 | 2 (2.1%) | 1 (1.8%) |
| $17,500 to $19,999 | 0 (0.0%) | 0 (0.0%) |
| $20,000 to $22,499 | 0 (0.0%) | 0 (0.0%) |
| $22,500 to $24,999 | 3 (3.2%) | 0 (0.0%) |
| $25,000 to $29,999 | 4 (4.3%) | 5 (9.1%) |
| $30,000 to $34,999 | 0 (0.0%) | 0 (0.0%) |
| $35,000 to $39,999 | 0 (0.0%) | 2 (3.6%) |
| $40,000 to $44,999 | 9 (9.6%) | 0 (0.0%) |
| $45,000 to $49,999 | 0 (0.0%) | 5 (9.1%) |
| $50,000 to $54,999 | 3 (3.2%) | 0 (0.0%) |
| $55,000 to $64,999 | 1 (1.1%) | 0 (0.0%) |
| $65,000 to $74,999 | 8 (8.5%) | 2 (3.6%) |
| $75,000 to $99,999 | 7 (7.4%) | 5 (9.1%) |
| $100,000+ | 53 (56.4%) | 19 (34.5%) |
| Total | 94 (100.0%) | 55 (100.0%) |
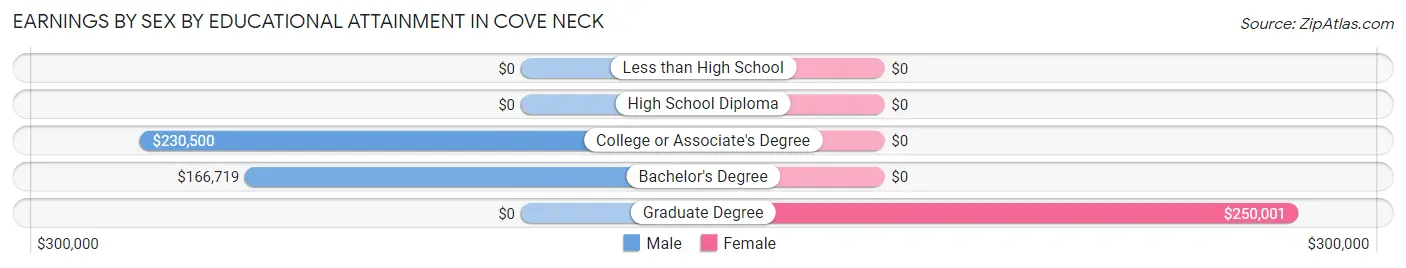
Earnings by Sex by Educational Attainment in Cove Neck
| Educational Attainment | Male Income | Female Income |
| Less than High School | - | - |
| High School Diploma | - | - |
| College or Associate's Degree | $230,500 | $0 |
| Bachelor's Degree | $166,719 | $0 |
| Graduate Degree | - | - |
| Total | $165,313 | $0 |
Family Income in Cove Neck
Family Income Brackets in Cove Neck
According to the Cove Neck family income data, there are 57 families falling into the $200,000+ income range, which is the most common income bracket and makes up 79.2% of all families.
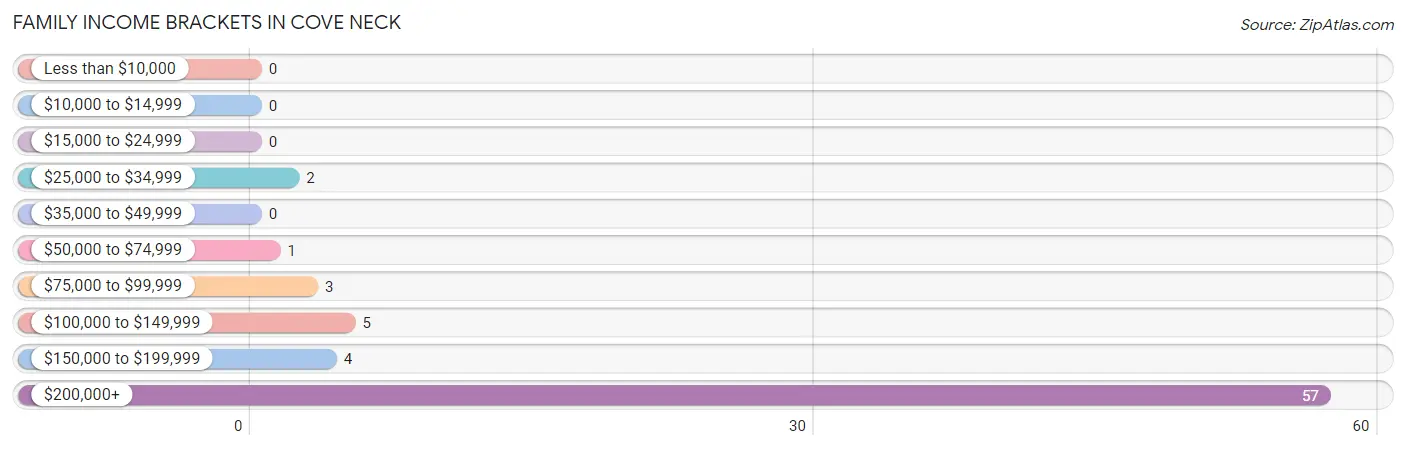
| Income Bracket | # Families | % Families |
| Less than $10,000 | 0 | 0.0% |
| $10,000 to $14,999 | 0 | 0.0% |
| $15,000 to $24,999 | 0 | 0.0% |
| $25,000 to $34,999 | 2 | 2.8% |
| $35,000 to $49,999 | 0 | 0.0% |
| $50,000 to $74,999 | 1 | 1.4% |
| $75,000 to $99,999 | 3 | 4.2% |
| $100,000 to $149,999 | 5 | 6.9% |
| $150,000 to $199,999 | 4 | 5.6% |
| $200,000+ | 57 | 79.2% |
Family Income by Famaliy Size in Cove Neck
2-person families (44 | 61.1%) account for the highest median family income in Cove Neck with $247,500 per family, while 2-person families (44 | 61.1%) have the highest median income of $123,750 per family member.
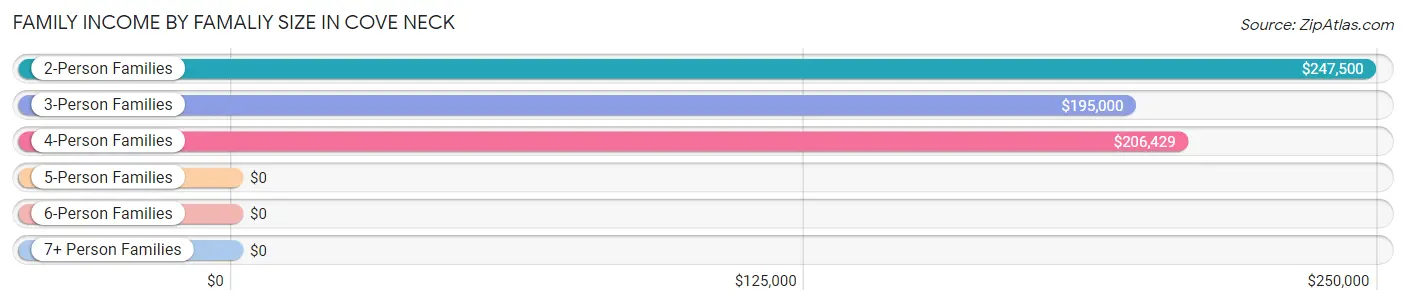
| Income Bracket | # Families | Median Income |
| 2-Person Families | 44 (61.1%) | $247,500 |
| 3-Person Families | 10 (13.9%) | $195,000 |
| 4-Person Families | 12 (16.7%) | $206,429 |
| 5-Person Families | 3 (4.2%) | $0 |
| 6-Person Families | 1 (1.4%) | $0 |
| 7+ Person Families | 2 (2.8%) | $0 |
| Total | 72 (100.0%) | $232,000 |
Family Income by Number of Earners in Cove Neck
The median family income in Cove Neck is $232,000, with families comprising 1 earner (17) having the highest median family income of $250,001, while families with 3+ earners (10) have the lowest median family income of $195,000, accounting for 23.6% and 13.9% of families, respectively.
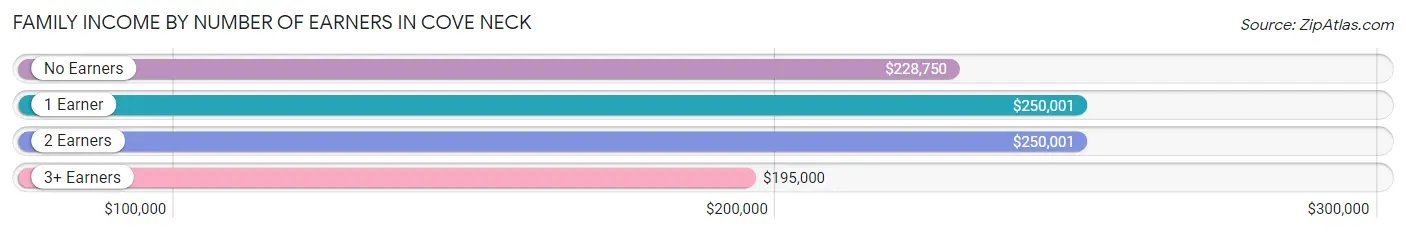
| Number of Earners | # Families | Median Income |
| No Earners | 4 (5.6%) | $228,750 |
| 1 Earner | 17 (23.6%) | $250,001 |
| 2 Earners | 41 (56.9%) | $250,001 |
| 3+ Earners | 10 (13.9%) | $195,000 |
| Total | 72 (100.0%) | $232,000 |
Household Income in Cove Neck
Household Income Brackets in Cove Neck
With 61 households falling in the category, the $200,000+ income range is the most frequent in Cove Neck, accounting for 60.4% of all households.
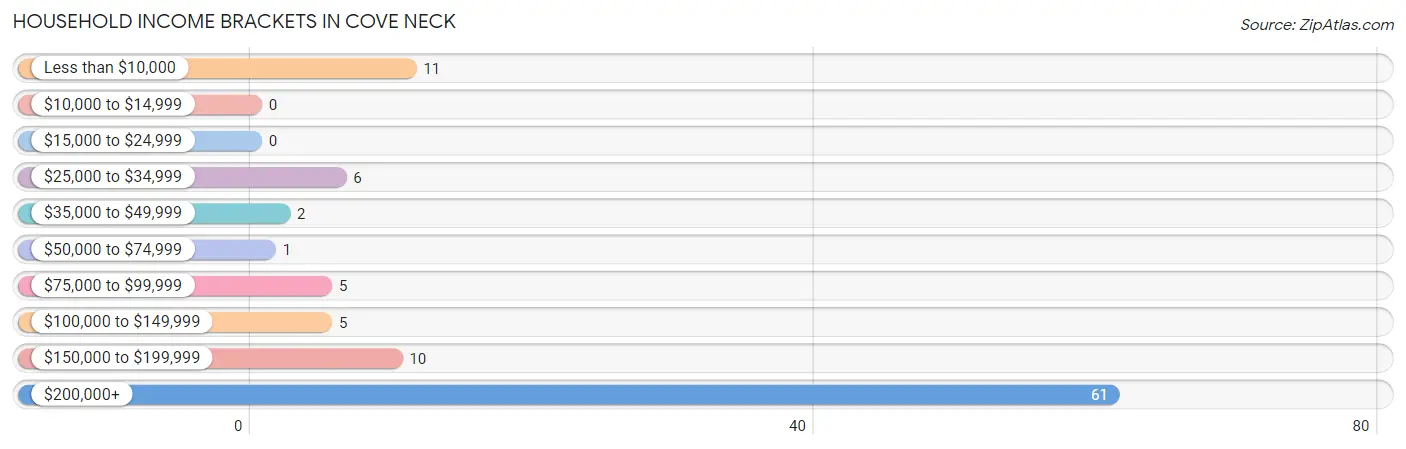
| Income Bracket | # Households | % Households |
| Less than $10,000 | 11 | 10.9% |
| $10,000 to $14,999 | 0 | 0.0% |
| $15,000 to $24,999 | 0 | 0.0% |
| $25,000 to $34,999 | 6 | 5.9% |
| $35,000 to $49,999 | 2 | 2.0% |
| $50,000 to $74,999 | 1 | 1.0% |
| $75,000 to $99,999 | 5 | 5.0% |
| $100,000 to $149,999 | 5 | 5.0% |
| $150,000 to $199,999 | 10 | 9.9% |
| $200,000+ | 61 | 60.4% |
Household Income by Householder Age in Cove Neck
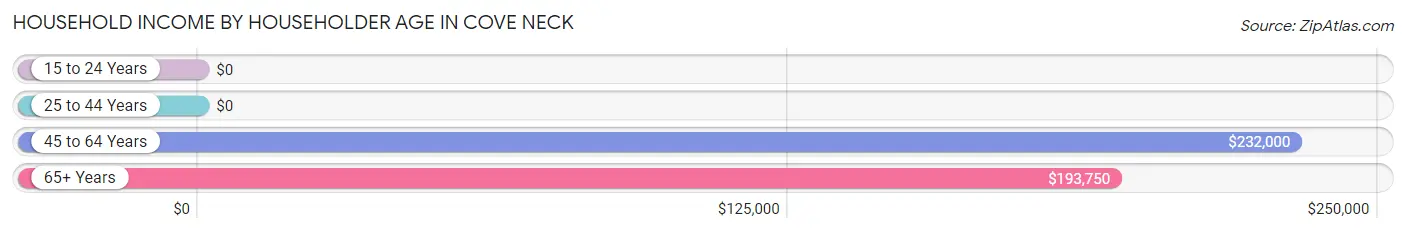
The median household income in Cove Neck is $209,375, with the highest median household income of $232,000 found in the 45 to 64 years age bracket for the primary householder. A total of 36 households (35.6%) fall into this category. Meanwhile, the 15 to 24 years age bracket for the primary householder has the lowest median household income of $0, with 3 households (3.0%) in this group.
| Income Bracket | # Households | Median Income |
| 15 to 24 Years | 3 (3.0%) | $0 |
| 25 to 44 Years | 8 (7.9%) | $0 |
| 45 to 64 Years | 36 (35.6%) | $232,000 |
| 65+ Years | 54 (53.5%) | $193,750 |
| Total | 101 (100.0%) | $209,375 |
Poverty in Cove Neck
Income Below Poverty by Sex and Age in Cove Neck
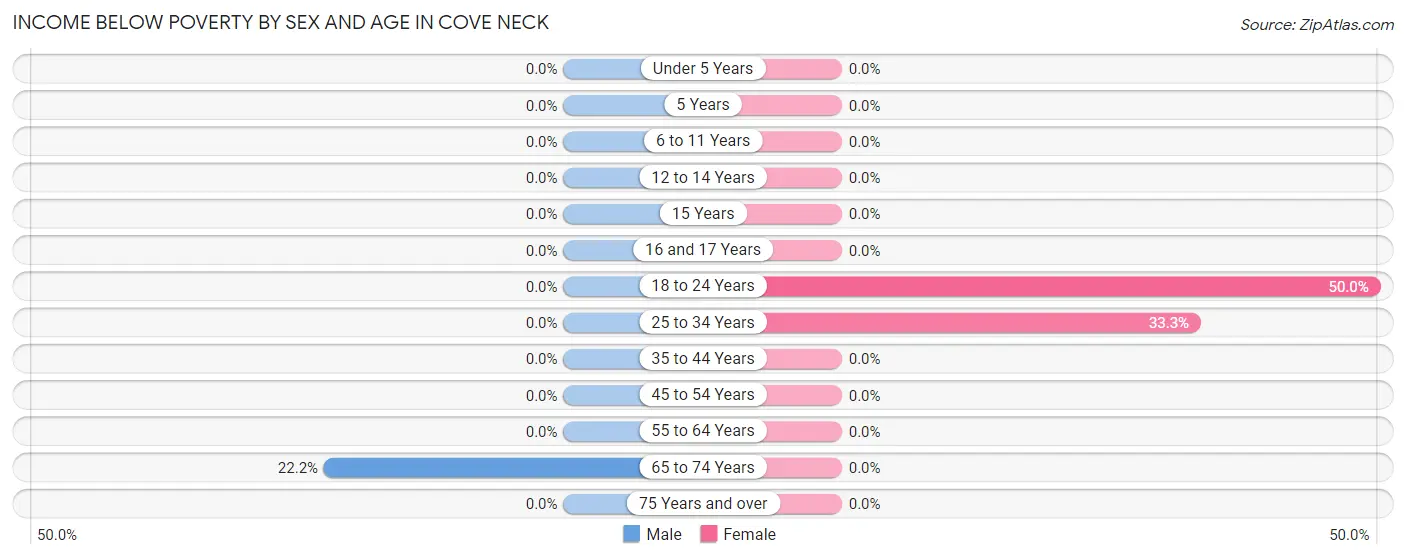
With 5.4% poverty level for males and 6.6% for females among the residents of Cove Neck, 65 to 74 year old males and 18 to 24 year old females are the most vulnerable to poverty, with 8 males (22.2%) and 4 females (50.0%) in their respective age groups living below the poverty level.
| Age Bracket | Male | Female |
| Under 5 Years | 0 (0.0%) | 0 (0.0%) |
| 5 Years | 0 (0.0%) | 0 (0.0%) |
| 6 to 11 Years | 0 (0.0%) | 0 (0.0%) |
| 12 to 14 Years | 0 (0.0%) | 0 (0.0%) |
| 15 Years | 0 (0.0%) | 0 (0.0%) |
| 16 and 17 Years | 0 (0.0%) | 0 (0.0%) |
| 18 to 24 Years | 0 (0.0%) | 4 (50.0%) |
| 25 to 34 Years | 0 (0.0%) | 3 (33.3%) |
| 35 to 44 Years | 0 (0.0%) | 0 (0.0%) |
| 45 to 54 Years | 0 (0.0%) | 0 (0.0%) |
| 55 to 64 Years | 0 (0.0%) | 0 (0.0%) |
| 65 to 74 Years | 8 (22.2%) | 0 (0.0%) |
| 75 Years and over | 0 (0.0%) | 0 (0.0%) |
| Total | 8 (5.4%) | 7 (6.6%) |
Income Above Poverty by Sex and Age in Cove Neck
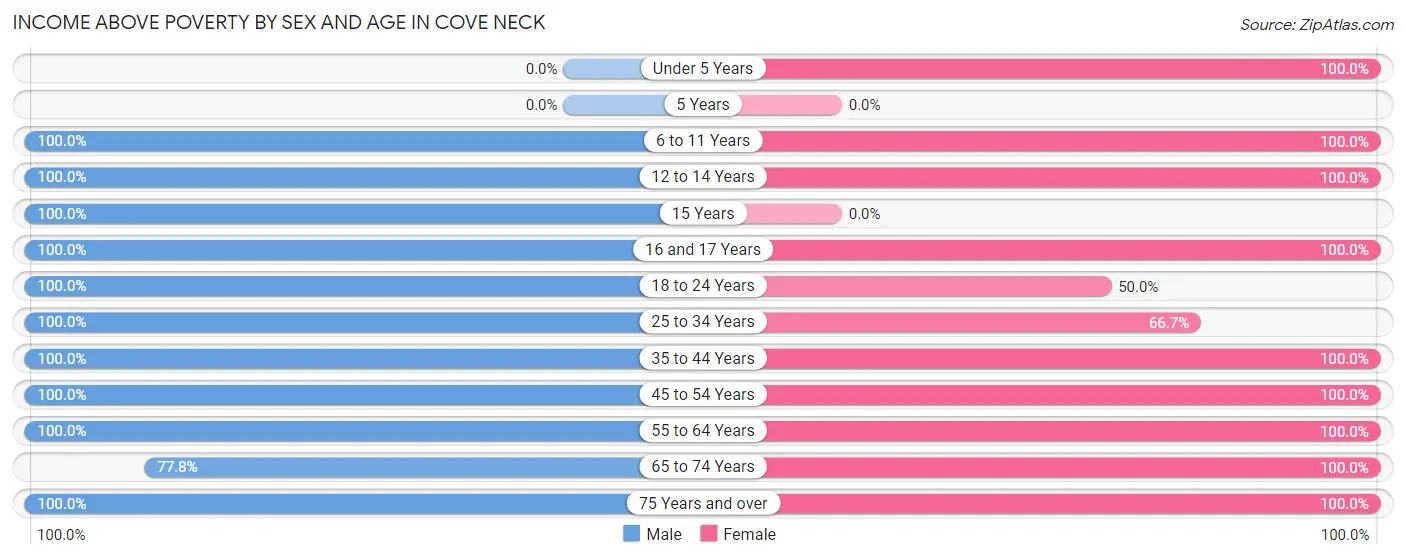
According to the poverty statistics in Cove Neck, males aged 6 to 11 years and females aged under 5 years are the age groups that are most secure financially, with 100.0% of males and 100.0% of females in these age groups living above the poverty line.
| Age Bracket | Male | Female |
| Under 5 Years | 0 (0.0%) | 1 (100.0%) |
| 5 Years | 0 (0.0%) | 0 (0.0%) |
| 6 to 11 Years | 6 (100.0%) | 7 (100.0%) |
| 12 to 14 Years | 4 (100.0%) | 5 (100.0%) |
| 15 Years | 6 (100.0%) | 0 (0.0%) |
| 16 and 17 Years | 3 (100.0%) | 2 (100.0%) |
| 18 to 24 Years | 27 (100.0%) | 4 (50.0%) |
| 25 to 34 Years | 5 (100.0%) | 6 (66.7%) |
| 35 to 44 Years | 7 (100.0%) | 6 (100.0%) |
| 45 to 54 Years | 22 (100.0%) | 15 (100.0%) |
| 55 to 64 Years | 17 (100.0%) | 23 (100.0%) |
| 65 to 74 Years | 28 (77.8%) | 16 (100.0%) |
| 75 Years and over | 14 (100.0%) | 14 (100.0%) |
| Total | 139 (94.6%) | 99 (93.4%) |
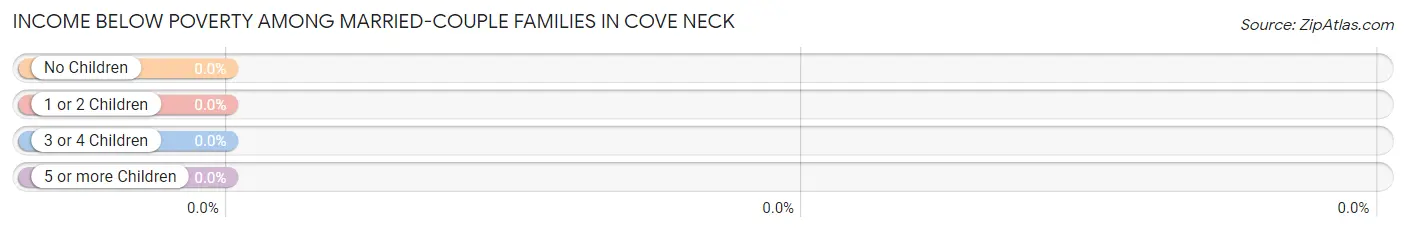
Income Below Poverty Among Married-Couple Families in Cove Neck
| Children | Above Poverty | Below Poverty |
| No Children | 56 (100.0%) | 0 (0.0%) |
| 1 or 2 Children | 5 (100.0%) | 0 (0.0%) |
| 3 or 4 Children | 6 (100.0%) | 0 (0.0%) |
| 5 or more Children | 0 (0.0%) | 0 (0.0%) |
| Total | 67 (100.0%) | 0 (0.0%) |
Income Below Poverty Among Single-Parent Households in Cove Neck
| Children | Single Father | Single Mother |
| No Children | 0 (0.0%) | 0 (0.0%) |
| 1 or 2 Children | 0 (0.0%) | 0 (0.0%) |
| 3 or 4 Children | 0 (0.0%) | 0 (0.0%) |
| 5 or more Children | 0 (0.0%) | 0 (0.0%) |
| Total | 0 (0.0%) | 0 (0.0%) |
Income Below Poverty Among Married-Couple vs Single-Parent Households in Cove Neck
| Children | Married-Couple Families | Single-Parent Households |
| No Children | 0 (0.0%) | 0 (0.0%) |
| 1 or 2 Children | 0 (0.0%) | 0 (0.0%) |
| 3 or 4 Children | 0 (0.0%) | 0 (0.0%) |
| 5 or more Children | 0 (0.0%) | 0 (0.0%) |
| Total | 0 (0.0%) | 0 (0.0%) |
Race in Cove Neck
The most populous races in Cove Neck are White / Caucasian (232 | 91.0%), Two or more Races (20 | 7.8%), and Hispanic or Latino (10 | 3.9%).
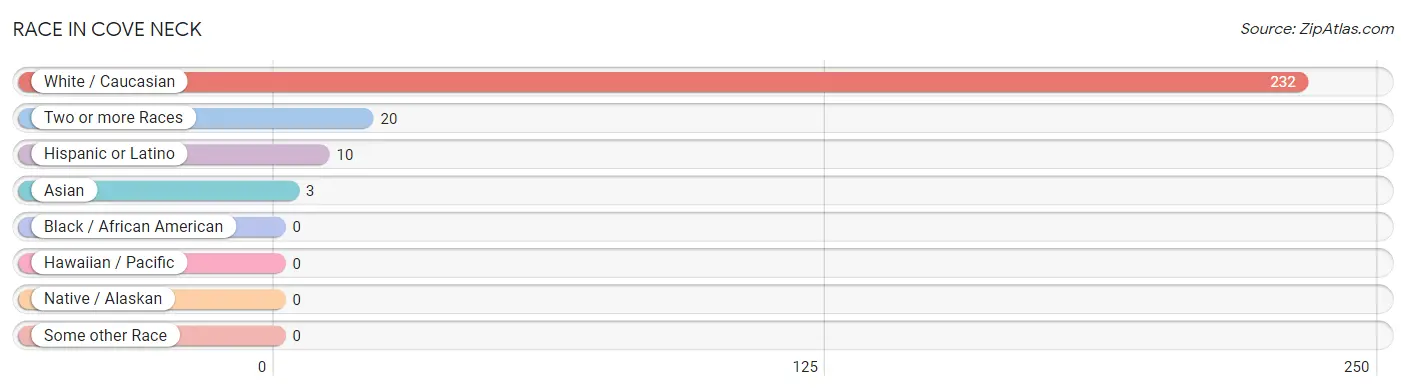
| Race | # Population | % Population |
| Asian | 3 | 1.2% |
| Black / African American | 0 | 0.0% |
| Hawaiian / Pacific | 0 | 0.0% |
| Hispanic or Latino | 10 | 3.9% |
| Native / Alaskan | 0 | 0.0% |
| White / Caucasian | 232 | 91.0% |
| Two or more Races | 20 | 7.8% |
| Some other Race | 0 | 0.0% |
| Total | 255 | 100.0% |
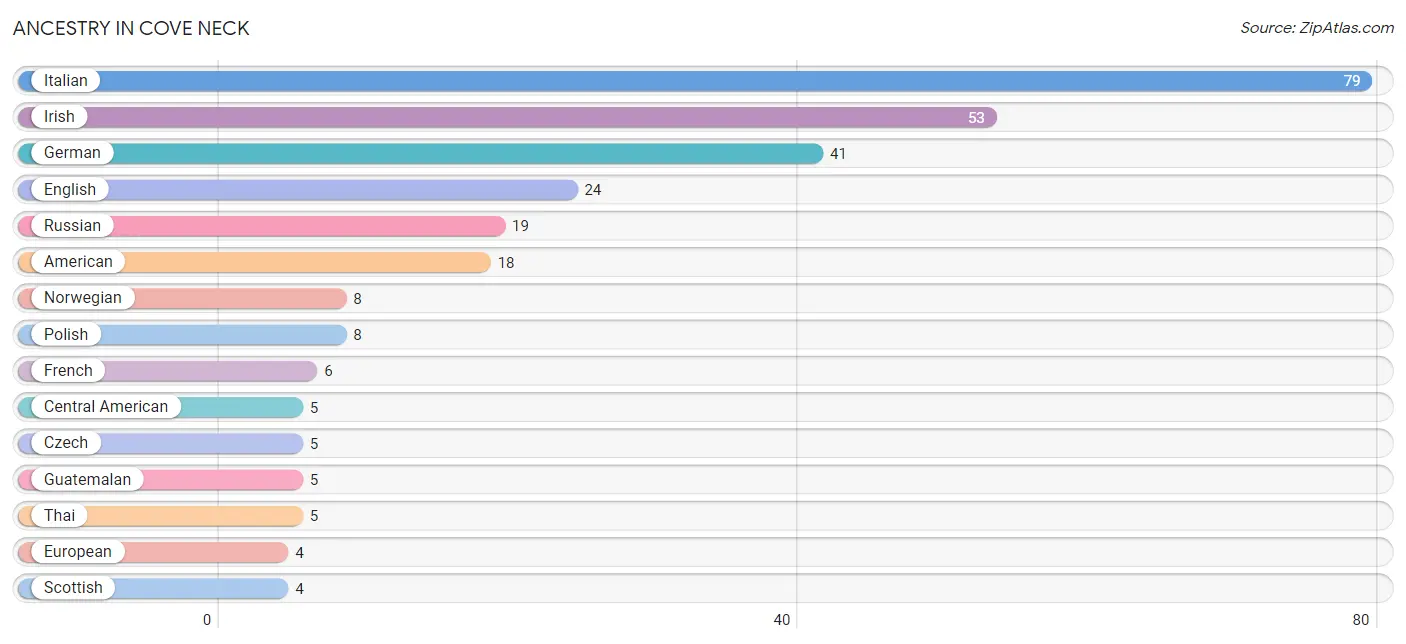
Ancestry in Cove Neck
The most populous ancestries reported in Cove Neck are Italian (79 | 31.0%), Irish (53 | 20.8%), German (41 | 16.1%), English (24 | 9.4%), and Russian (19 | 7.4%), together accounting for 84.7% of all Cove Neck residents.
| Ancestry | # Population | % Population |
| American | 18 | 7.1% |
| Austrian | 2 | 0.8% |
| Central American | 5 | 2.0% |
| Czech | 5 | 2.0% |
| Dutch | 1 | 0.4% |
| English | 24 | 9.4% |
| European | 4 | 1.6% |
| Finnish | 1 | 0.4% |
| French | 6 | 2.4% |
| French Canadian | 1 | 0.4% |
| German | 41 | 16.1% |
| Guatemalan | 5 | 2.0% |
| Iranian | 1 | 0.4% |
| Irish | 53 | 20.8% |
| Italian | 79 | 31.0% |
| Mexican | 3 | 1.2% |
| Norwegian | 8 | 3.1% |
| Polish | 8 | 3.1% |
| Russian | 19 | 7.4% |
| Scottish | 4 | 1.6% |
| Slovak | 4 | 1.6% |
| South American | 2 | 0.8% |
| Swiss | 2 | 0.8% |
| Thai | 5 | 2.0% |
| Ukrainian | 4 | 1.6% |
| Uruguayan | 2 | 0.8% | View All 26 Rows |
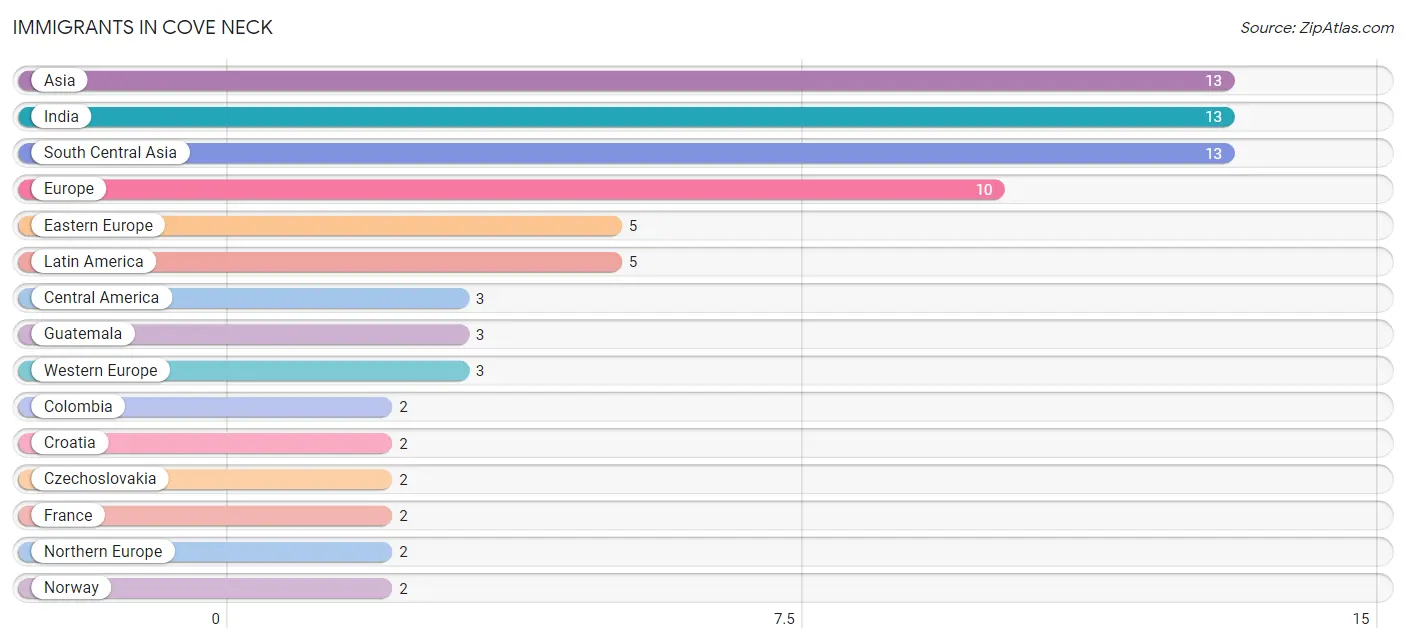
Immigrants in Cove Neck
The most numerous immigrant groups reported in Cove Neck came from Asia (13 | 5.1%), India (13 | 5.1%), South Central Asia (13 | 5.1%), Europe (10 | 3.9%), and Eastern Europe (5 | 2.0%), together accounting for 21.2% of all Cove Neck residents.
| Immigration Origin | # Population | % Population |
| Asia | 13 | 5.1% |
| Central America | 3 | 1.2% |
| Colombia | 2 | 0.8% |
| Croatia | 2 | 0.8% |
| Czechoslovakia | 2 | 0.8% |
| Eastern Europe | 5 | 2.0% |
| Europe | 10 | 3.9% |
| France | 2 | 0.8% |
| Germany | 1 | 0.4% |
| Guatemala | 3 | 1.2% |
| India | 13 | 5.1% |
| Latin America | 5 | 2.0% |
| Northern Europe | 2 | 0.8% |
| Norway | 2 | 0.8% |
| Poland | 1 | 0.4% |
| South America | 2 | 0.8% |
| South Central Asia | 13 | 5.1% |
| Western Europe | 3 | 1.2% | View All 18 Rows |
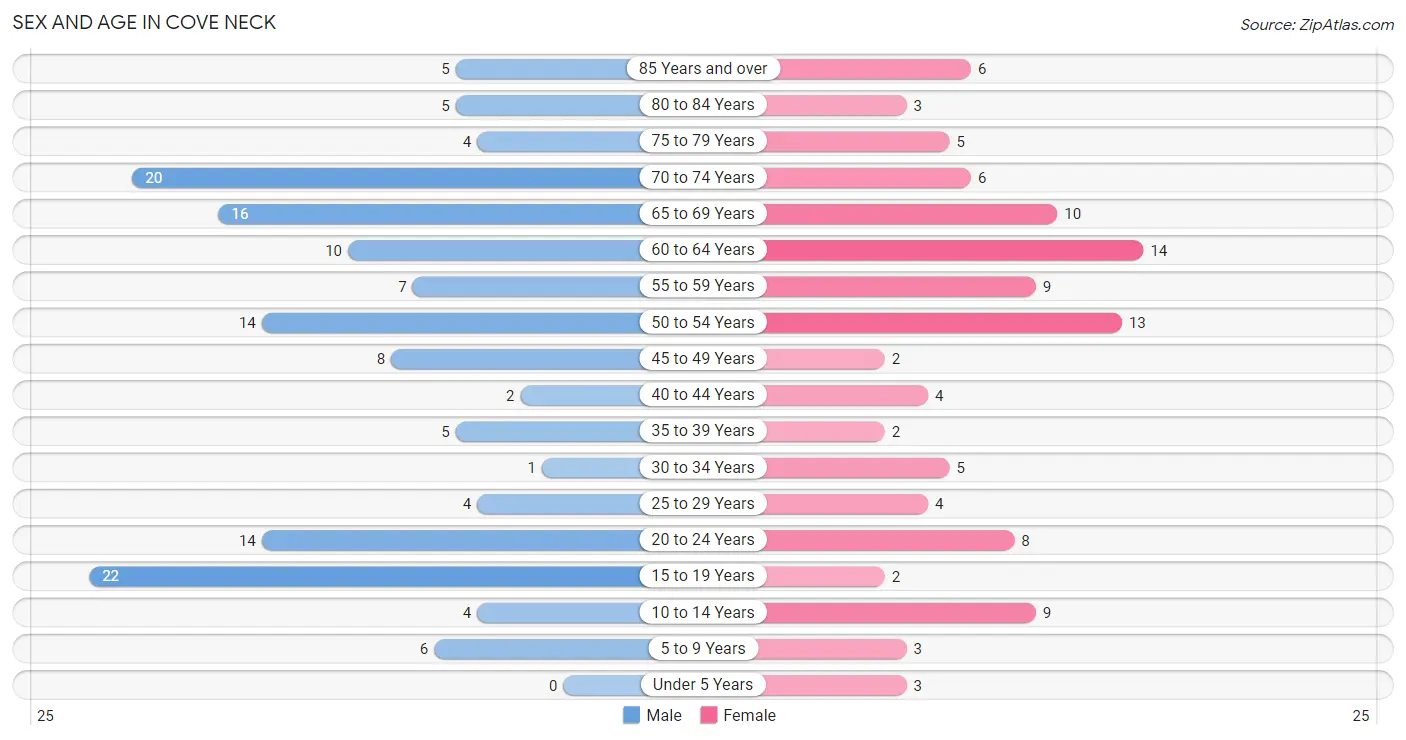
Sex and Age in Cove Neck
Sex and Age in Cove Neck
The most populous age groups in Cove Neck are 15 to 19 Years (22 | 15.0%) for men and 60 to 64 Years (14 | 13.0%) for women.
| Age Bracket | Male | Female |
| Under 5 Years | 0 (0.0%) | 3 (2.8%) |
| 5 to 9 Years | 6 (4.1%) | 3 (2.8%) |
| 10 to 14 Years | 4 (2.7%) | 9 (8.3%) |
| 15 to 19 Years | 22 (15.0%) | 2 (1.8%) |
| 20 to 24 Years | 14 (9.5%) | 8 (7.4%) |
| 25 to 29 Years | 4 (2.7%) | 4 (3.7%) |
| 30 to 34 Years | 1 (0.7%) | 5 (4.6%) |
| 35 to 39 Years | 5 (3.4%) | 2 (1.8%) |
| 40 to 44 Years | 2 (1.4%) | 4 (3.7%) |
| 45 to 49 Years | 8 (5.4%) | 2 (1.8%) |
| 50 to 54 Years | 14 (9.5%) | 13 (12.0%) |
| 55 to 59 Years | 7 (4.8%) | 9 (8.3%) |
| 60 to 64 Years | 10 (6.8%) | 14 (13.0%) |
| 65 to 69 Years | 16 (10.9%) | 10 (9.3%) |
| 70 to 74 Years | 20 (13.6%) | 6 (5.6%) |
| 75 to 79 Years | 4 (2.7%) | 5 (4.6%) |
| 80 to 84 Years | 5 (3.4%) | 3 (2.8%) |
| 85 Years and over | 5 (3.4%) | 6 (5.6%) |
| Total | 147 (100.0%) | 108 (100.0%) |
Families and Households in Cove Neck
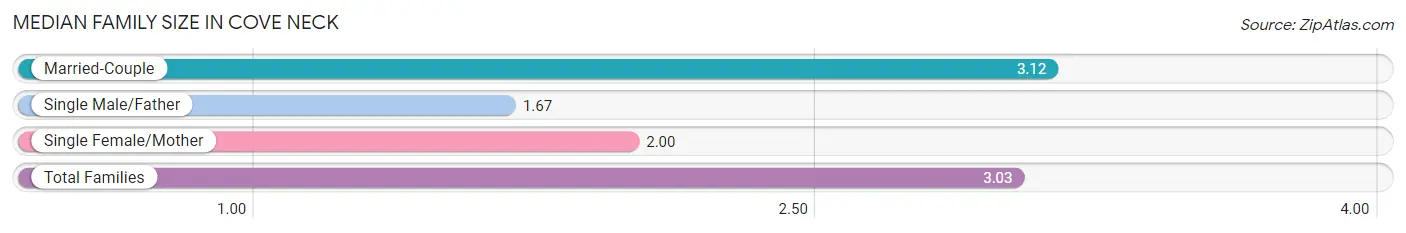
Median Family Size in Cove Neck
The median family size in Cove Neck is 3.03 persons per family, with married-couple families (67 | 93.1%) accounting for the largest median family size of 3.12 persons per family. On the other hand, single male/father families (3 | 4.2%) represent the smallest median family size with 1.67 persons per family.
| Family Type | # Families | Family Size |
| Married-Couple | 67 (93.1%) | 3.12 |
| Single Male/Father | 3 (4.2%) | 1.67 |
| Single Female/Mother | 2 (2.8%) | 2.00 |
| Total Families | 72 (100.0%) | 3.03 |
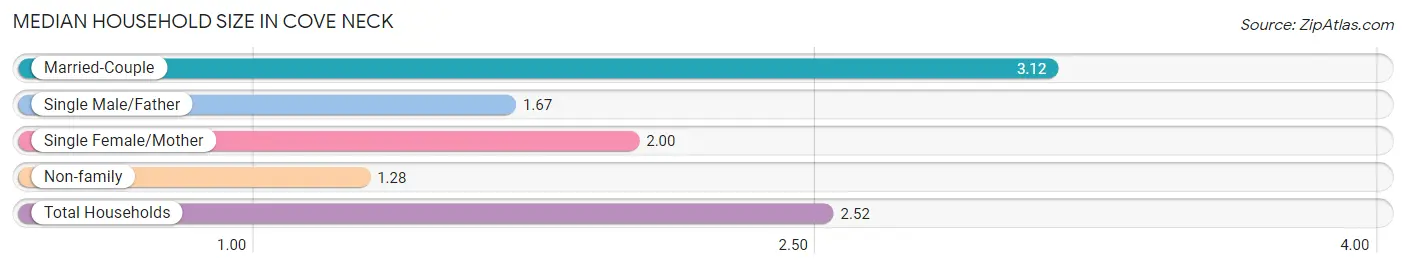
Median Household Size in Cove Neck
The median household size in Cove Neck is 2.52 persons per household, with married-couple households (67 | 66.3%) accounting for the largest median household size of 3.12 persons per household. non-family households (29 | 28.7%) represent the smallest median household size with 1.28 persons per household.
| Household Type | # Households | Household Size |
| Married-Couple | 67 (66.3%) | 3.12 |
| Single Male/Father | 3 (3.0%) | 1.67 |
| Single Female/Mother | 2 (2.0%) | 2.00 |
| Non-family | 29 (28.7%) | 1.28 |
| Total Households | 101 (100.0%) | 2.52 |
Household Size by Marriage Status in Cove Neck
Out of a total of 101 households in Cove Neck, 72 (71.3%) are family households, while 29 (28.7%) are nonfamily households. The most numerous type of family households are 2-person households, comprising 44, and the most common type of nonfamily households are 1-person households, comprising 24.
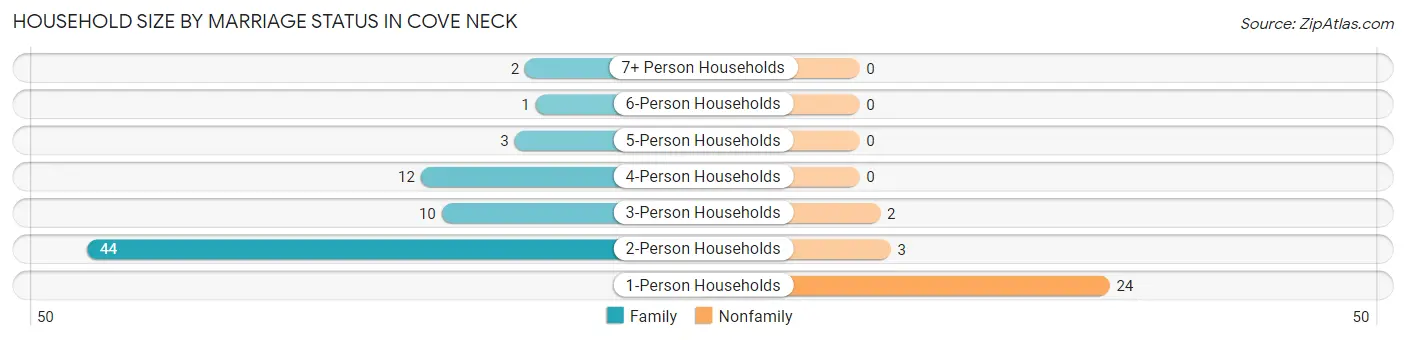
| Household Size | Family Households | Nonfamily Households |
| 1-Person Households | - | 24 (23.8%) |
| 2-Person Households | 44 (43.6%) | 3 (3.0%) |
| 3-Person Households | 10 (9.9%) | 2 (2.0%) |
| 4-Person Households | 12 (11.9%) | 0 (0.0%) |
| 5-Person Households | 3 (3.0%) | 0 (0.0%) |
| 6-Person Households | 1 (1.0%) | 0 (0.0%) |
| 7+ Person Households | 2 (2.0%) | 0 (0.0%) |
| Total | 72 (71.3%) | 29 (28.7%) |
Female Fertility in Cove Neck
Fertility by Age in Cove Neck
| Age Bracket | Women with Births | Births / 1,000 Women |
| 15 to 19 years | 0 (0.0%) | 0.0 |
| 20 to 34 years | 0 (0.0%) | 0.0 |
| 35 to 50 years | 0 (0.0%) | 0.0 |
| Total | 0 (0.0%) | 0.0 |
Fertility by Age by Marriage Status in Cove Neck
| Age Bracket | Married | Unmarried |
| 15 to 19 years | 0 (0.0%) | 0 (0.0%) |
| 20 to 34 years | 0 (0.0%) | 0 (0.0%) |
| 35 to 50 years | 0 (0.0%) | 0 (0.0%) |
| Total | 0 (0.0%) | 0 (0.0%) |
Fertility by Education in Cove Neck
| Educational Attainment | Women with Births | Births / 1,000 Women |
| Less than High School | 0 (0.0%) | 0.0 |
| High School Diploma | 0 (0.0%) | 0.0 |
| College or Associate's Degree | 0 (0.0%) | 0.0 |
| Bachelor's Degree | 0 (0.0%) | 0.0 |
| Graduate Degree | 0 (0.0%) | 0.0 |
| Total | 0 (0.0%) | 0.0 |
Fertility by Education by Marriage Status in Cove Neck
| Educational Attainment | Married | Unmarried |
| Less than High School | 0 (0.0%) | 0 (0.0%) |
| High School Diploma | 0 (0.0%) | 0 (0.0%) |
| College or Associate's Degree | 0 (0.0%) | 0 (0.0%) |
| Bachelor's Degree | 0 (0.0%) | 0 (0.0%) |
| Graduate Degree | 0 (0.0%) | 0 (0.0%) |
| Total | 0 (0.0%) | 0 (0.0%) |
Employment Characteristics in Cove Neck
Employment by Class of Employer in Cove Neck
Among the 131 employed individuals in Cove Neck, private company employees (67 | 51.1%), self-employed (incorporated) (31 | 23.7%), and state government employees (11 | 8.4%) make up the most common classes of employment.
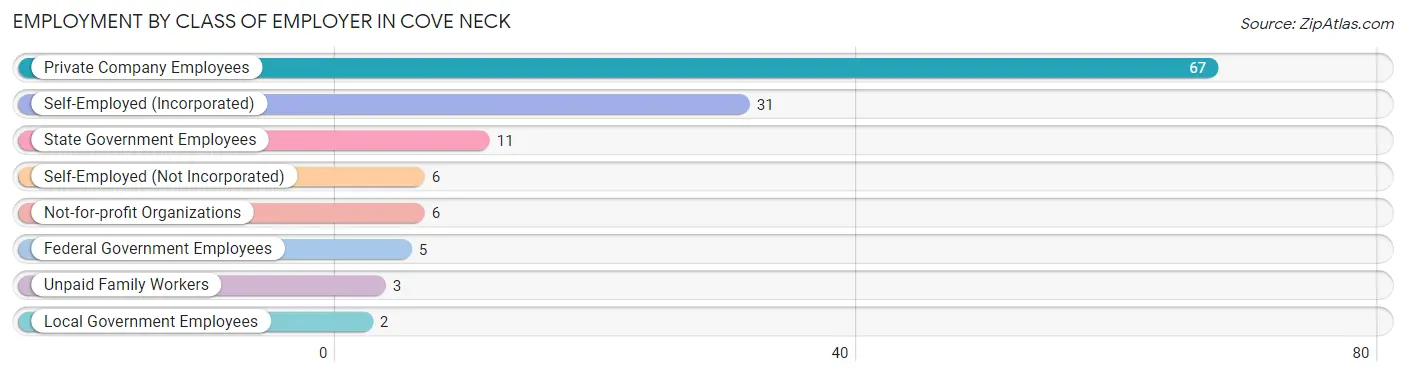
| Employer Class | # Employees | % Employees |
| Private Company Employees | 67 | 51.1% |
| Self-Employed (Incorporated) | 31 | 23.7% |
| Self-Employed (Not Incorporated) | 6 | 4.6% |
| Not-for-profit Organizations | 6 | 4.6% |
| Local Government Employees | 2 | 1.5% |
| State Government Employees | 11 | 8.4% |
| Federal Government Employees | 5 | 3.8% |
| Unpaid Family Workers | 3 | 2.3% |
| Total | 131 | 100.0% |
Employment Status by Age in Cove Neck
According to the labor force statistics for Cove Neck, out of the total population over 16 years of age (224), 59.8% or 134 individuals are in the labor force, with 2.2% or 3 of them unemployed. The age group with the highest labor force participation rate is 35 to 44 years, with 92.3% or 12 individuals in the labor force. Within the labor force, the 65 to 74 years age range has the highest percentage of unemployed individuals, with 10.0% or 3 of them being unemployed.
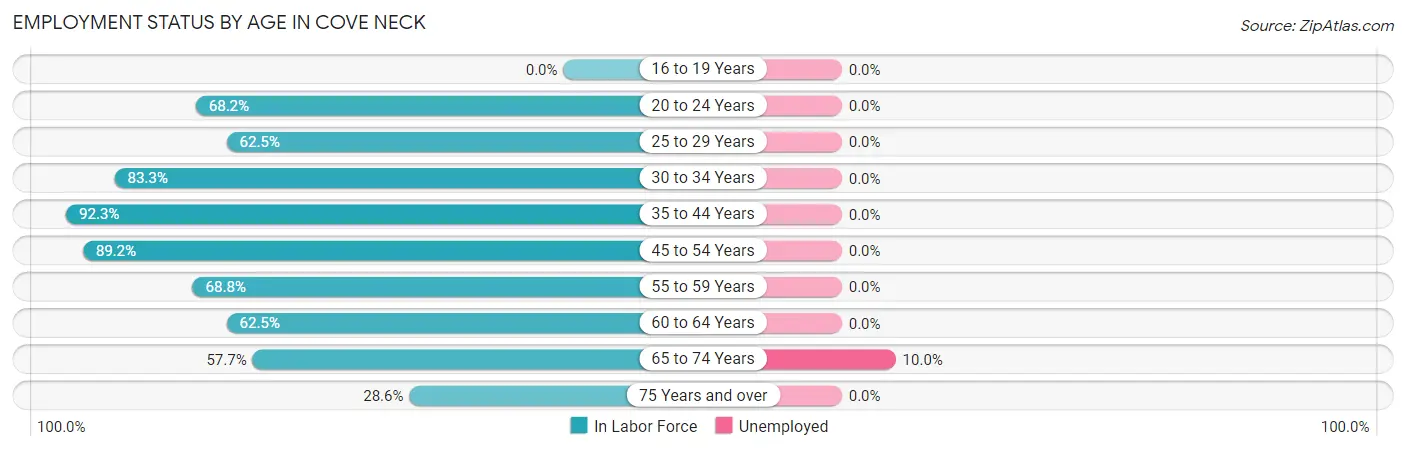
| Age Bracket | In Labor Force | Unemployed |
| 16 to 19 Years | 0 (0.0%) | 0 (0.0%) |
| 20 to 24 Years | 15 (68.2%) | 0 (0.0%) |
| 25 to 29 Years | 5 (62.5%) | 0 (0.0%) |
| 30 to 34 Years | 5 (83.3%) | 0 (0.0%) |
| 35 to 44 Years | 12 (92.3%) | 0 (0.0%) |
| 45 to 54 Years | 33 (89.2%) | 0 (0.0%) |
| 55 to 59 Years | 11 (68.8%) | 0 (0.0%) |
| 60 to 64 Years | 15 (62.5%) | 0 (0.0%) |
| 65 to 74 Years | 30 (57.7%) | 3 (10.0%) |
| 75 Years and over | 8 (28.6%) | 0 (0.0%) |
| Total | 134 (59.8%) | 3 (2.2%) |
Employment Status by Educational Attainment in Cove Neck
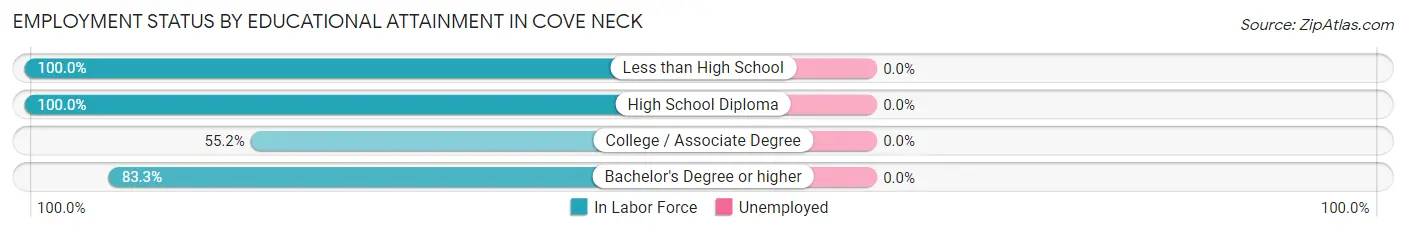
| Educational Attainment | In Labor Force | Unemployed |
| Less than High School | 3 (100.0%) | 0 (0.0%) |
| High School Diploma | 12 (100.0%) | 0 (0.0%) |
| College / Associate Degree | 16 (55.2%) | 0 (0.0%) |
| Bachelor's Degree or higher | 50 (83.3%) | 0 (0.0%) |
| Total | 81 (77.9%) | 0 (0.0%) |
Employment Occupations by Sex in Cove Neck
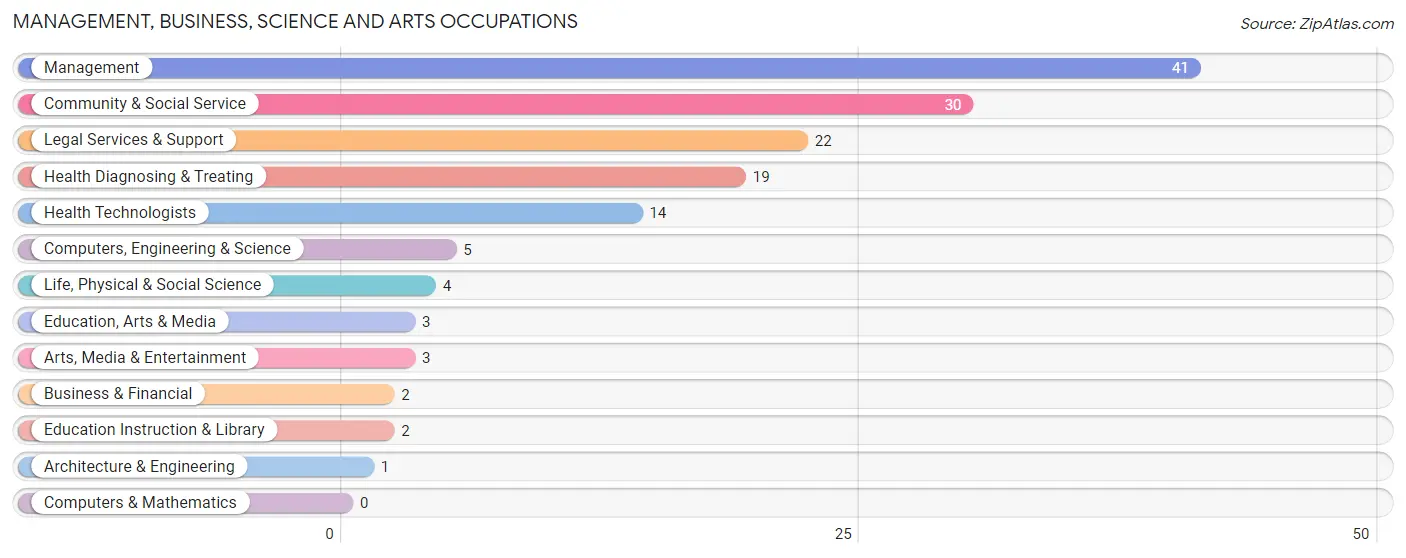
Management, Business, Science and Arts Occupations
The most common Management, Business, Science and Arts occupations in Cove Neck are Management (41 | 31.3%), Community & Social Service (30 | 22.9%), Legal Services & Support (22 | 16.8%), Health Diagnosing & Treating (19 | 14.5%), and Health Technologists (14 | 10.7%).
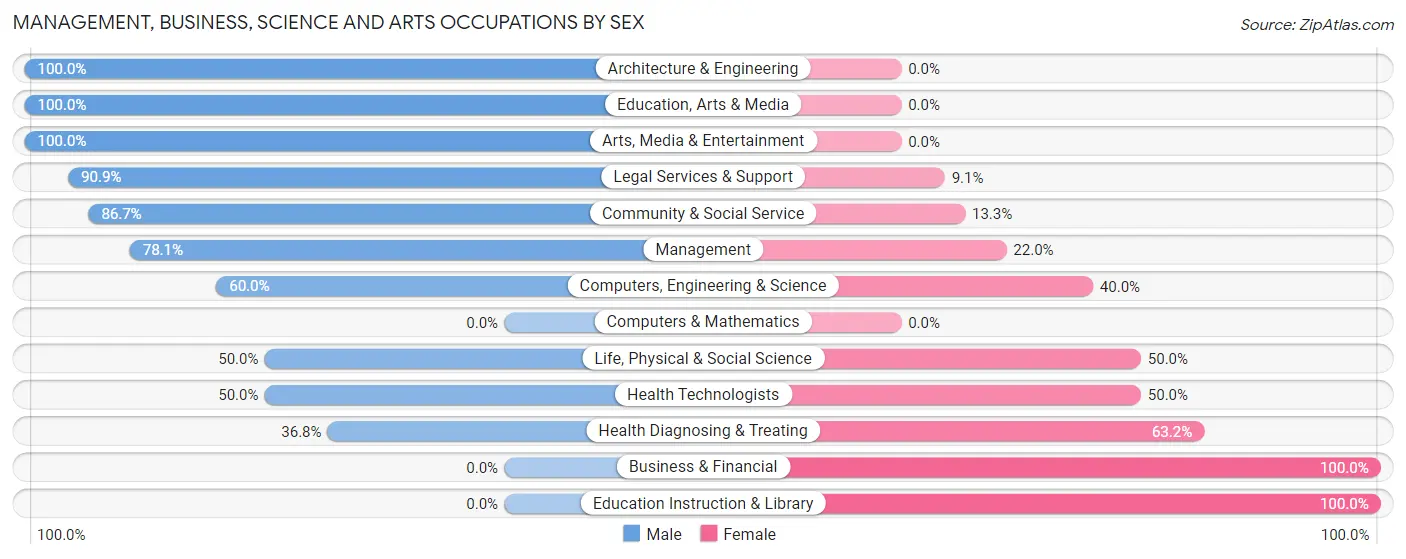
Management, Business, Science and Arts Occupations by Sex
Within the Management, Business, Science and Arts occupations in Cove Neck, the most male-oriented occupations are Architecture & Engineering (100.0%), Education, Arts & Media (100.0%), and Arts, Media & Entertainment (100.0%), while the most female-oriented occupations are Business & Financial (100.0%), Education Instruction & Library (100.0%), and Health Diagnosing & Treating (63.2%).
| Occupation | Male | Female |
| Management | 32 (78.0%) | 9 (22.0%) |
| Business & Financial | 0 (0.0%) | 2 (100.0%) |
| Computers, Engineering & Science | 3 (60.0%) | 2 (40.0%) |
| Computers & Mathematics | 0 (0.0%) | 0 (0.0%) |
| Architecture & Engineering | 1 (100.0%) | 0 (0.0%) |
| Life, Physical & Social Science | 2 (50.0%) | 2 (50.0%) |
| Community & Social Service | 26 (86.7%) | 4 (13.3%) |
| Education, Arts & Media | 3 (100.0%) | 0 (0.0%) |
| Legal Services & Support | 20 (90.9%) | 2 (9.1%) |
| Education Instruction & Library | 0 (0.0%) | 2 (100.0%) |
| Arts, Media & Entertainment | 3 (100.0%) | 0 (0.0%) |
| Health Diagnosing & Treating | 7 (36.8%) | 12 (63.2%) |
| Health Technologists | 7 (50.0%) | 7 (50.0%) |
| Total (Category) | 68 (70.1%) | 29 (29.9%) |
| Total (Overall) | 88 (67.2%) | 43 (32.8%) |
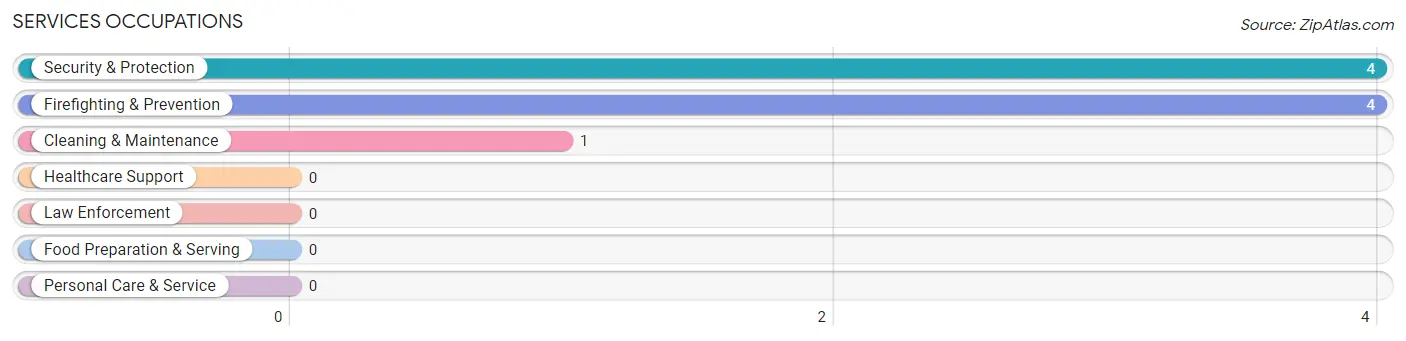
Services Occupations
The most common Services occupations in Cove Neck are Security & Protection (4 | 3.0%), Firefighting & Prevention (4 | 3.0%), and Cleaning & Maintenance (1 | 0.8%).
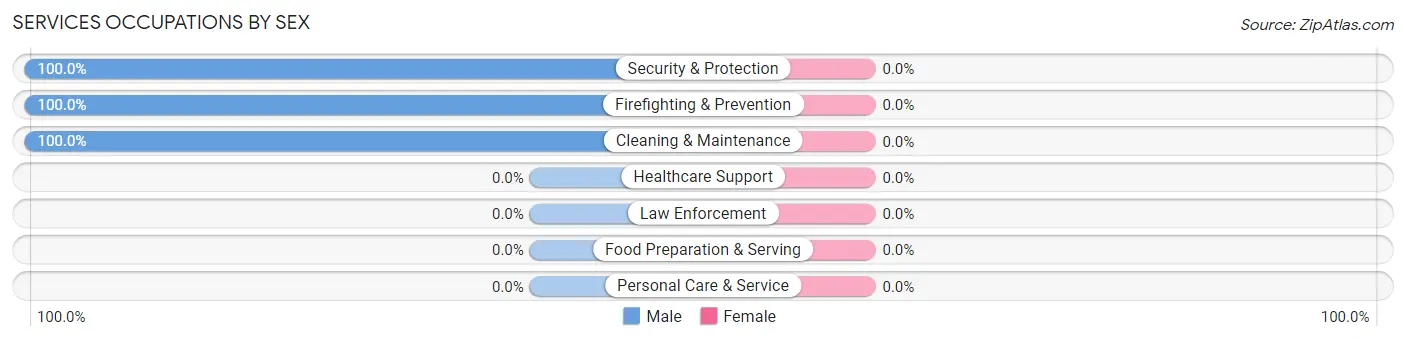
Services Occupations by Sex
| Occupation | Male | Female |
| Healthcare Support | 0 (0.0%) | 0 (0.0%) |
| Security & Protection | 4 (100.0%) | 0 (0.0%) |
| Firefighting & Prevention | 4 (100.0%) | 0 (0.0%) |
| Law Enforcement | 0 (0.0%) | 0 (0.0%) |
| Food Preparation & Serving | 0 (0.0%) | 0 (0.0%) |
| Cleaning & Maintenance | 1 (100.0%) | 0 (0.0%) |
| Personal Care & Service | 0 (0.0%) | 0 (0.0%) |
| Total (Category) | 5 (100.0%) | 0 (0.0%) |
| Total (Overall) | 88 (67.2%) | 43 (32.8%) |
Sales and Office Occupations
The most common Sales and Office occupations in Cove Neck are Sales & Related (12 | 9.2%), and Office & Administration (7 | 5.3%).

Sales and Office Occupations by Sex
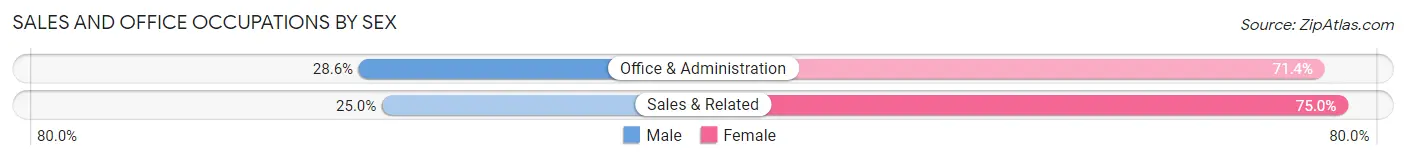
| Occupation | Male | Female |
| Sales & Related | 3 (25.0%) | 9 (75.0%) |
| Office & Administration | 2 (28.6%) | 5 (71.4%) |
| Total (Category) | 5 (26.3%) | 14 (73.7%) |
| Total (Overall) | 88 (67.2%) | 43 (32.8%) |
Natural Resources, Construction and Maintenance Occupations
The most common Natural Resources, Construction and Maintenance occupations in Cove Neck are , and Construction & Extraction (5 | 3.8%).
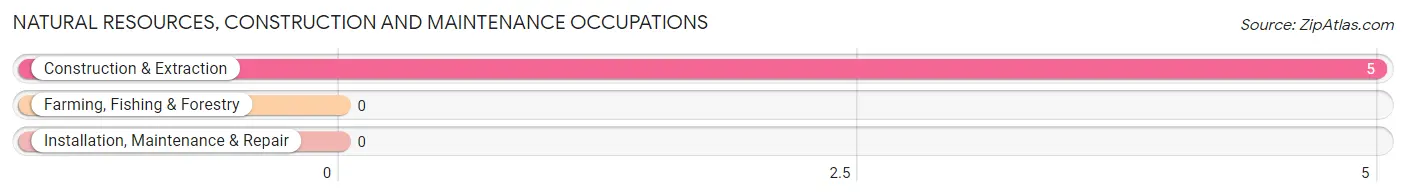
Natural Resources, Construction and Maintenance Occupations by Sex
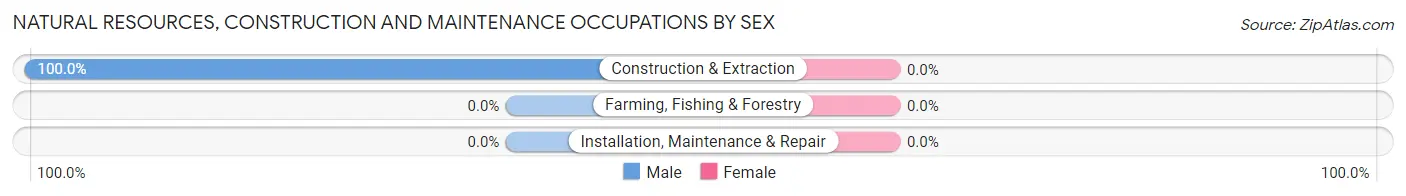
| Occupation | Male | Female |
| Farming, Fishing & Forestry | 0 (0.0%) | 0 (0.0%) |
| Construction & Extraction | 5 (100.0%) | 0 (0.0%) |
| Installation, Maintenance & Repair | 0 (0.0%) | 0 (0.0%) |
| Total (Category) | 5 (100.0%) | 0 (0.0%) |
| Total (Overall) | 88 (67.2%) | 43 (32.8%) |
Production, Transportation and Moving Occupations
The most common Production, Transportation and Moving occupations in Cove Neck are , and Material Moving (5 | 3.8%).
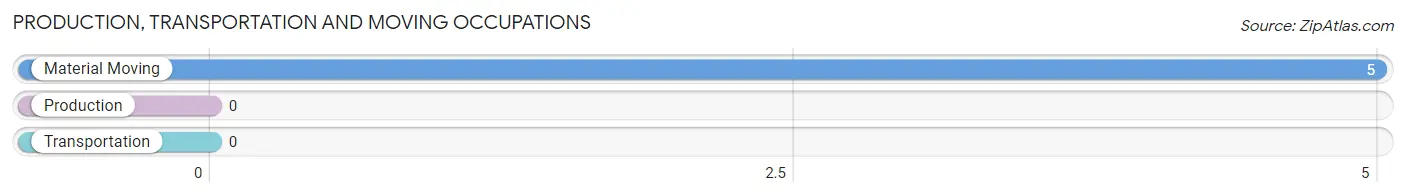
Production, Transportation and Moving Occupations by Sex
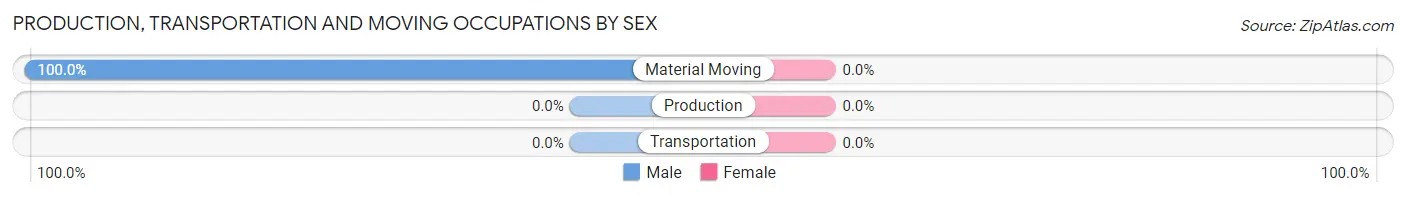
| Occupation | Male | Female |
| Production | 0 (0.0%) | 0 (0.0%) |
| Transportation | 0 (0.0%) | 0 (0.0%) |
| Material Moving | 5 (100.0%) | 0 (0.0%) |
| Total (Category) | 5 (100.0%) | 0 (0.0%) |
| Total (Overall) | 88 (67.2%) | 43 (32.8%) |
Employment Industries by Sex in Cove Neck
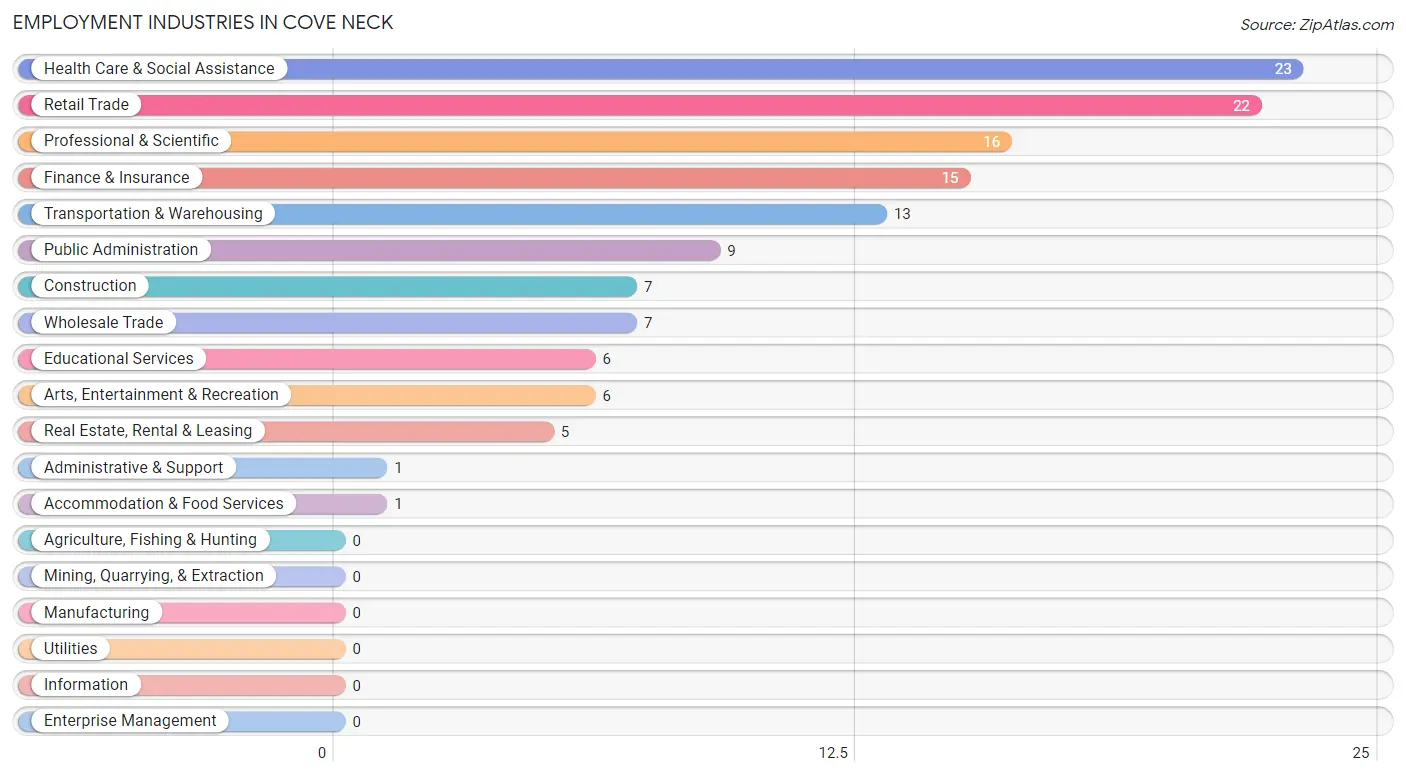
Employment Industries in Cove Neck
The major employment industries in Cove Neck include Health Care & Social Assistance (23 | 17.6%), Retail Trade (22 | 16.8%), Professional & Scientific (16 | 12.2%), Finance & Insurance (15 | 11.5%), and Transportation & Warehousing (13 | 9.9%).
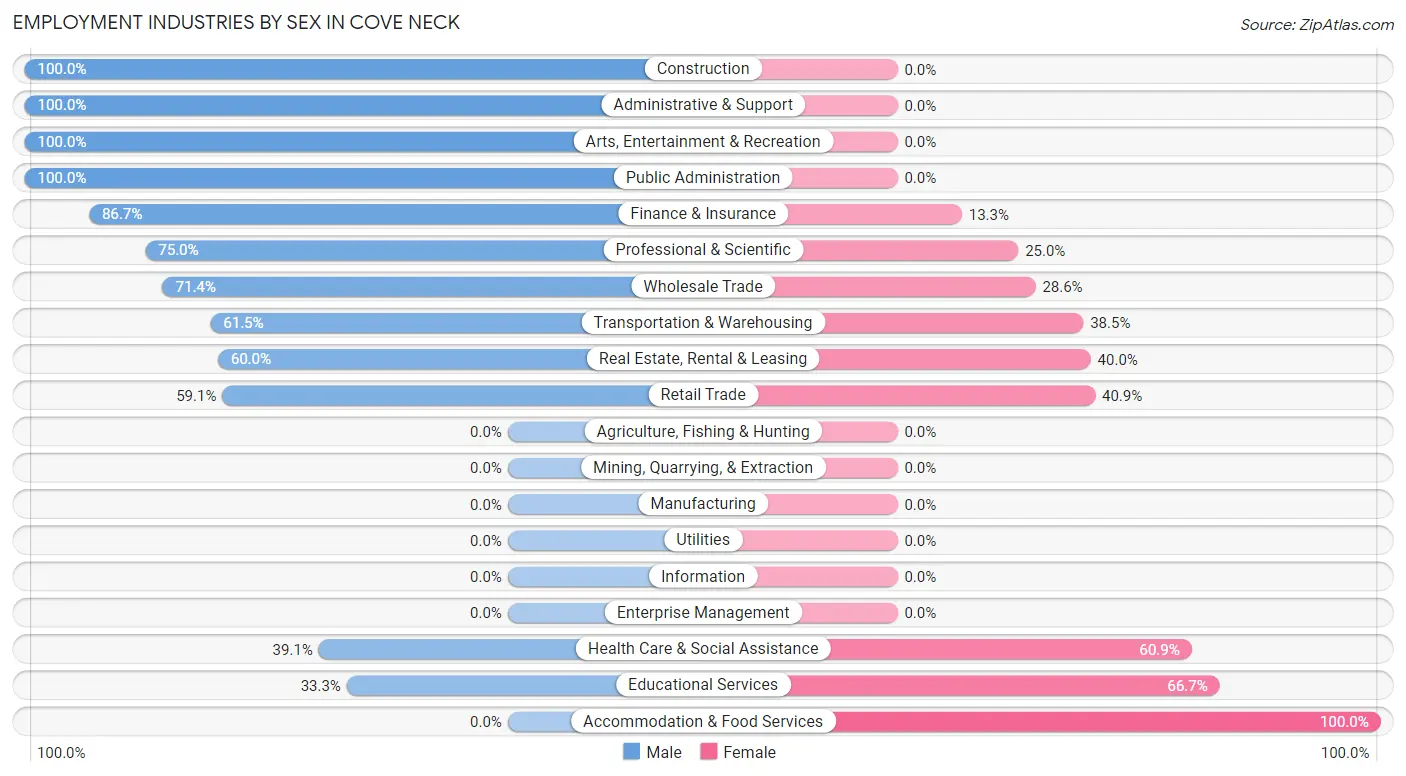
Employment Industries by Sex in Cove Neck
The Cove Neck industries that see more men than women are Construction (100.0%), Administrative & Support (100.0%), and Arts, Entertainment & Recreation (100.0%), whereas the industries that tend to have a higher number of women are Accommodation & Food Services (100.0%), Educational Services (66.7%), and Health Care & Social Assistance (60.9%).
| Industry | Male | Female |
| Agriculture, Fishing & Hunting | 0 (0.0%) | 0 (0.0%) |
| Mining, Quarrying, & Extraction | 0 (0.0%) | 0 (0.0%) |
| Construction | 7 (100.0%) | 0 (0.0%) |
| Manufacturing | 0 (0.0%) | 0 (0.0%) |
| Wholesale Trade | 5 (71.4%) | 2 (28.6%) |
| Retail Trade | 13 (59.1%) | 9 (40.9%) |
| Transportation & Warehousing | 8 (61.5%) | 5 (38.5%) |
| Utilities | 0 (0.0%) | 0 (0.0%) |
| Information | 0 (0.0%) | 0 (0.0%) |
| Finance & Insurance | 13 (86.7%) | 2 (13.3%) |
| Real Estate, Rental & Leasing | 3 (60.0%) | 2 (40.0%) |
| Professional & Scientific | 12 (75.0%) | 4 (25.0%) |
| Enterprise Management | 0 (0.0%) | 0 (0.0%) |
| Administrative & Support | 1 (100.0%) | 0 (0.0%) |
| Educational Services | 2 (33.3%) | 4 (66.7%) |
| Health Care & Social Assistance | 9 (39.1%) | 14 (60.9%) |
| Arts, Entertainment & Recreation | 6 (100.0%) | 0 (0.0%) |
| Accommodation & Food Services | 0 (0.0%) | 1 (100.0%) |
| Public Administration | 9 (100.0%) | 0 (0.0%) |
| Total | 88 (67.2%) | 43 (32.8%) |
Education in Cove Neck
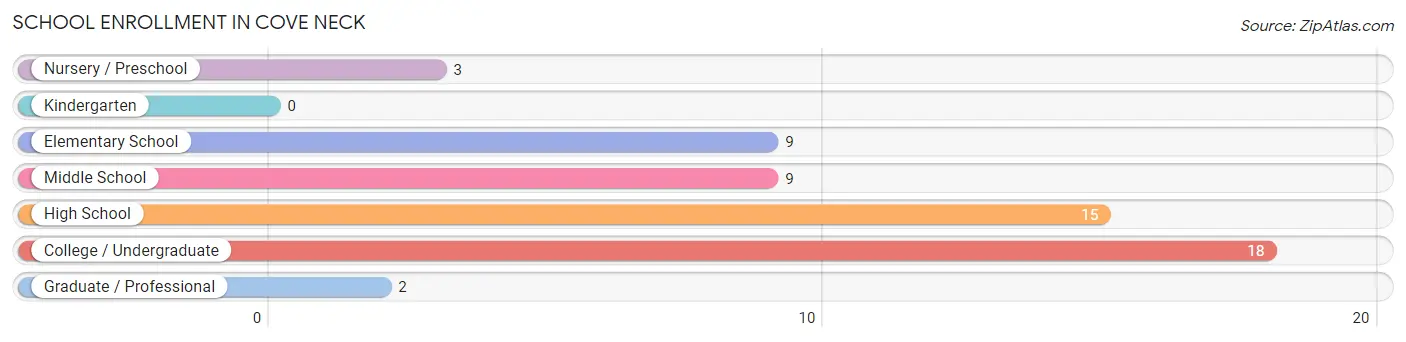
School Enrollment in Cove Neck
The most common levels of schooling among the 56 students in Cove Neck are college / undergraduate (18 | 32.1%), high school (15 | 26.8%), and elementary school (9 | 16.1%).
| School Level | # Students | % Students |
| Nursery / Preschool | 3 | 5.4% |
| Kindergarten | 0 | 0.0% |
| Elementary School | 9 | 16.1% |
| Middle School | 9 | 16.1% |
| High School | 15 | 26.8% |
| College / Undergraduate | 18 | 32.1% |
| Graduate / Professional | 2 | 3.6% |
| Total | 56 | 100.0% |
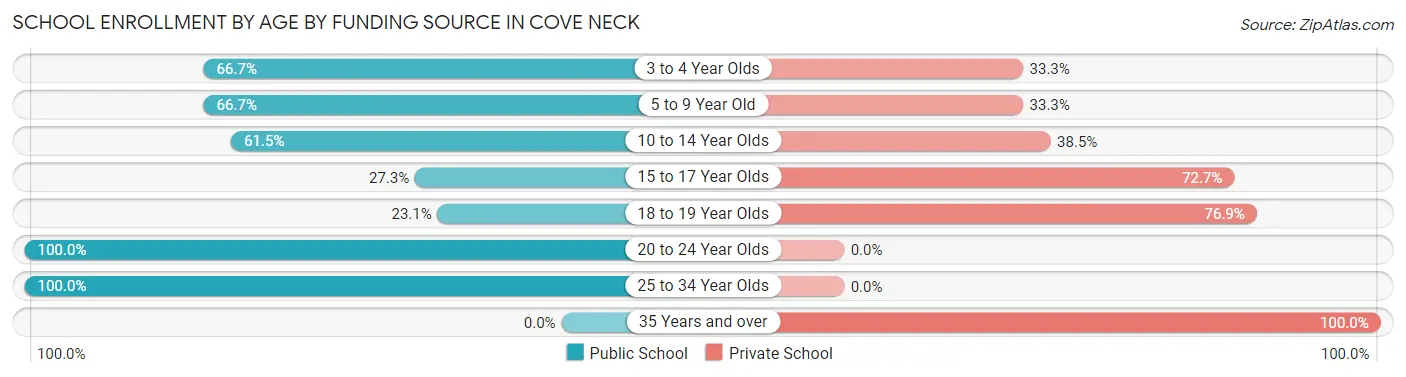
School Enrollment by Age by Funding Source in Cove Neck
Out of a total of 56 students who are enrolled in schools in Cove Neck, 28 (50.0%) attend a private institution, while the remaining 28 (50.0%) are enrolled in public schools. The age group of 35 years and over has the highest likelihood of being enrolled in private schools, with 1 (100.0% in the age bracket) enrolled. Conversely, the age group of 20 to 24 year olds has the lowest likelihood of being enrolled in a private school, with 5 (100.0% in the age bracket) attending a public institution.
| Age Bracket | Public School | Private School |
| 3 to 4 Year Olds | 2 (66.7%) | 1 (33.3%) |
| 5 to 9 Year Old | 6 (66.7%) | 3 (33.3%) |
| 10 to 14 Year Olds | 8 (61.5%) | 5 (38.5%) |
| 15 to 17 Year Olds | 3 (27.3%) | 8 (72.7%) |
| 18 to 19 Year Olds | 3 (23.1%) | 10 (76.9%) |
| 20 to 24 Year Olds | 5 (100.0%) | 0 (0.0%) |
| 25 to 34 Year Olds | 1 (100.0%) | 0 (0.0%) |
| 35 Years and over | 0 (0.0%) | 1 (100.0%) |
| Total | 28 (50.0%) | 28 (50.0%) |
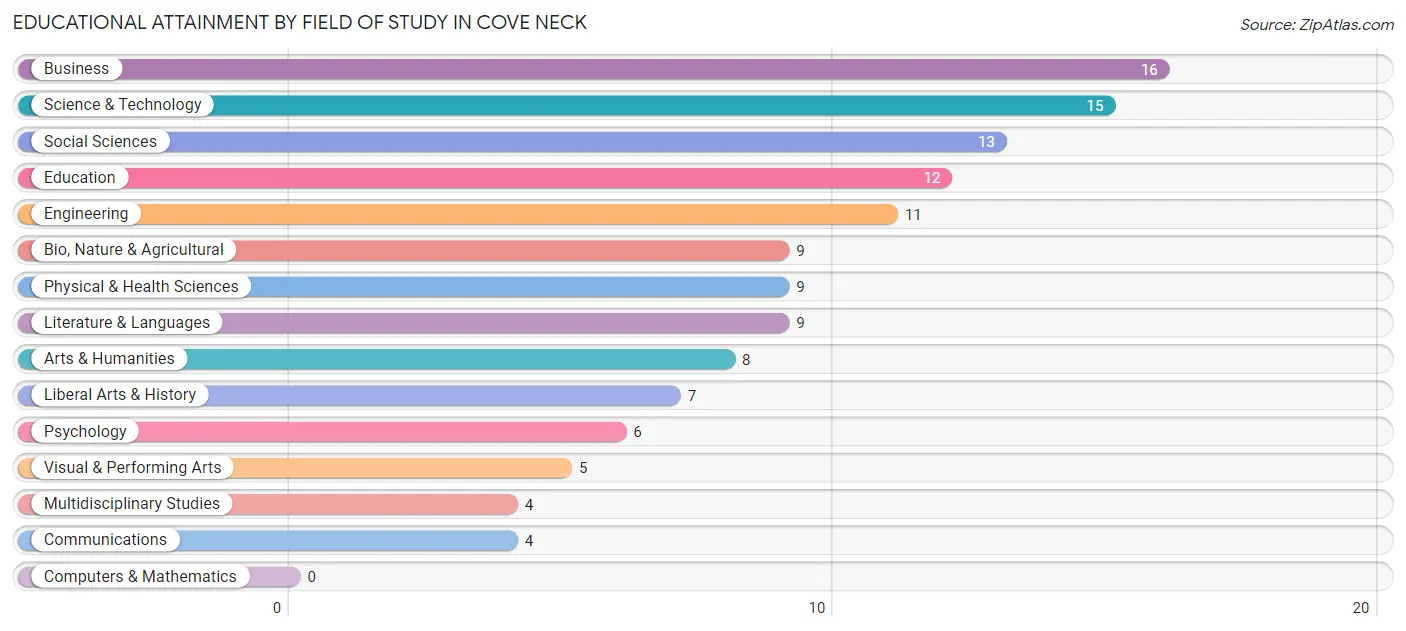
Educational Attainment by Field of Study in Cove Neck
Business (16 | 12.5%), science & technology (15 | 11.7%), social sciences (13 | 10.2%), education (12 | 9.4%), and engineering (11 | 8.6%) are the most common fields of study among 128 individuals in Cove Neck who have obtained a bachelor's degree or higher.
| Field of Study | # Graduates | % Graduates |
| Computers & Mathematics | 0 | 0.0% |
| Bio, Nature & Agricultural | 9 | 7.0% |
| Physical & Health Sciences | 9 | 7.0% |
| Psychology | 6 | 4.7% |
| Social Sciences | 13 | 10.2% |
| Engineering | 11 | 8.6% |
| Multidisciplinary Studies | 4 | 3.1% |
| Science & Technology | 15 | 11.7% |
| Business | 16 | 12.5% |
| Education | 12 | 9.4% |
| Literature & Languages | 9 | 7.0% |
| Liberal Arts & History | 7 | 5.5% |
| Visual & Performing Arts | 5 | 3.9% |
| Communications | 4 | 3.1% |
| Arts & Humanities | 8 | 6.2% |
| Total | 128 | 100.0% |
Transportation & Commute in Cove Neck
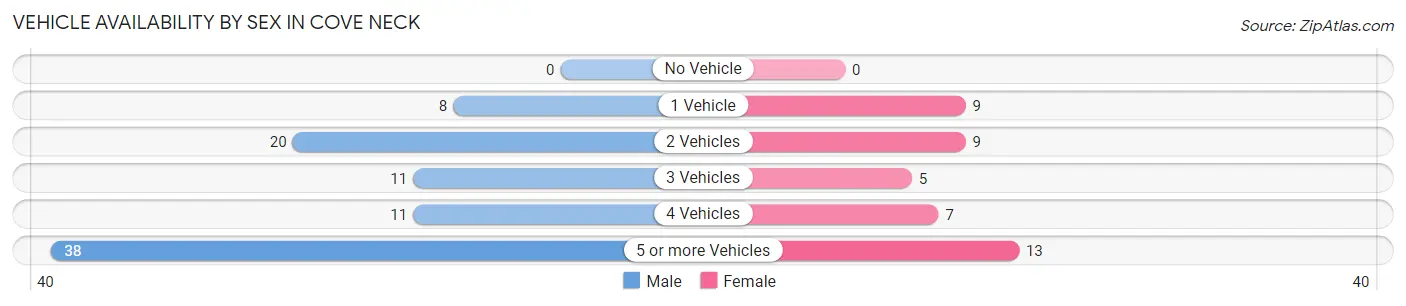
Vehicle Availability by Sex in Cove Neck
The most prevalent vehicle ownership categories in Cove Neck are males with 5 or more vehicles (38, accounting for 43.2%) and females with 5 or more vehicles (13, making up 88.4%).
| Vehicles Available | Male | Female |
| No Vehicle | 0 (0.0%) | 0 (0.0%) |
| 1 Vehicle | 8 (9.1%) | 9 (20.9%) |
| 2 Vehicles | 20 (22.7%) | 9 (20.9%) |
| 3 Vehicles | 11 (12.5%) | 5 (11.6%) |
| 4 Vehicles | 11 (12.5%) | 7 (16.3%) |
| 5 or more Vehicles | 38 (43.2%) | 13 (30.2%) |
| Total | 88 (100.0%) | 43 (100.0%) |
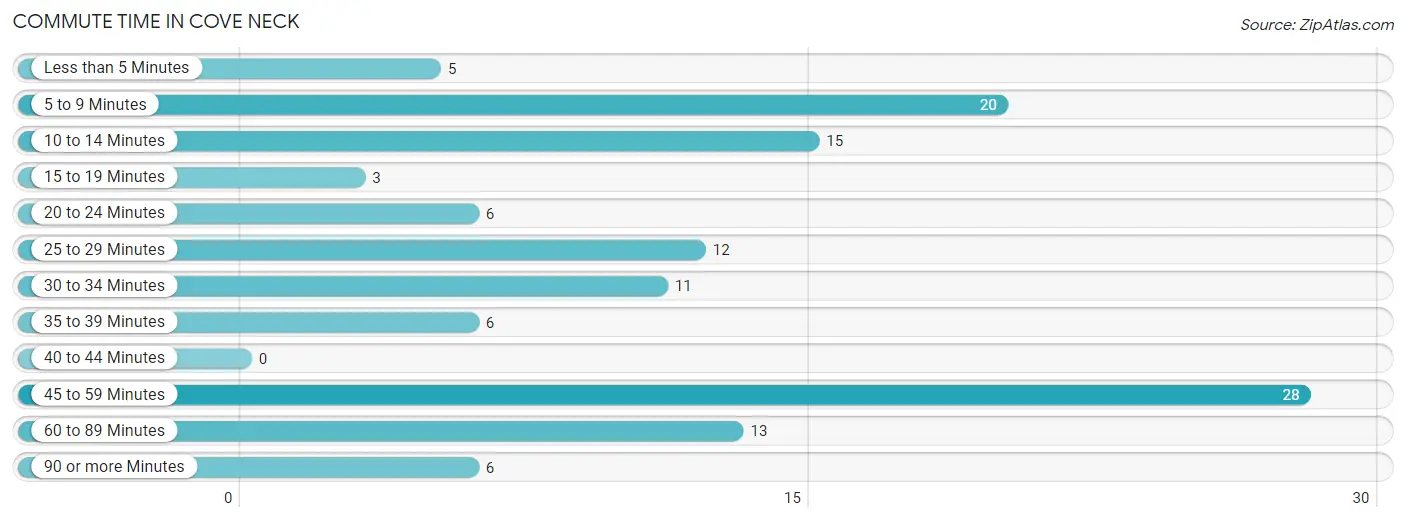
Commute Time in Cove Neck
The most frequently occuring commute durations in Cove Neck are 45 to 59 minutes (28 commuters, 22.4%), 5 to 9 minutes (20 commuters, 16.0%), and 10 to 14 minutes (15 commuters, 12.0%).
| Commute Time | # Commuters | % Commuters |
| Less than 5 Minutes | 5 | 4.0% |
| 5 to 9 Minutes | 20 | 16.0% |
| 10 to 14 Minutes | 15 | 12.0% |
| 15 to 19 Minutes | 3 | 2.4% |
| 20 to 24 Minutes | 6 | 4.8% |
| 25 to 29 Minutes | 12 | 9.6% |
| 30 to 34 Minutes | 11 | 8.8% |
| 35 to 39 Minutes | 6 | 4.8% |
| 40 to 44 Minutes | 0 | 0.0% |
| 45 to 59 Minutes | 28 | 22.4% |
| 60 to 89 Minutes | 13 | 10.4% |
| 90 or more Minutes | 6 | 4.8% |
Commute Time by Sex in Cove Neck
The most common commute times in Cove Neck are 45 to 59 minutes (23 commuters, 28.1%) for males and 10 to 14 minutes (9 commuters, 20.9%) for females.
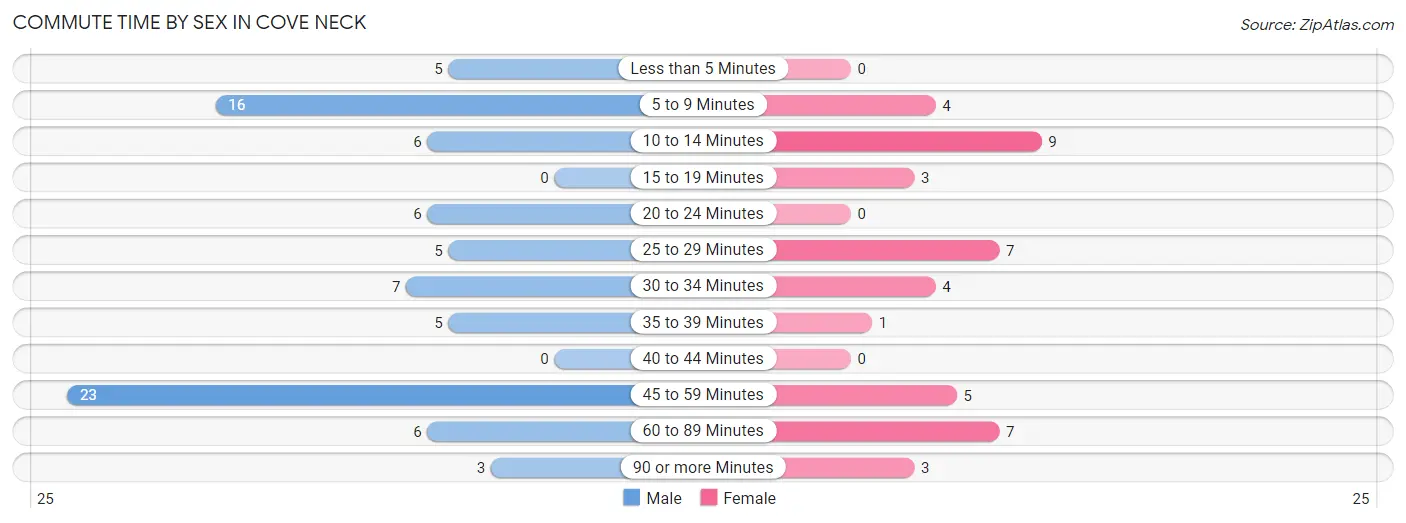
| Commute Time | Male | Female |
| Less than 5 Minutes | 5 (6.1%) | 0 (0.0%) |
| 5 to 9 Minutes | 16 (19.5%) | 4 (9.3%) |
| 10 to 14 Minutes | 6 (7.3%) | 9 (20.9%) |
| 15 to 19 Minutes | 0 (0.0%) | 3 (7.0%) |
| 20 to 24 Minutes | 6 (7.3%) | 0 (0.0%) |
| 25 to 29 Minutes | 5 (6.1%) | 7 (16.3%) |
| 30 to 34 Minutes | 7 (8.5%) | 4 (9.3%) |
| 35 to 39 Minutes | 5 (6.1%) | 1 (2.3%) |
| 40 to 44 Minutes | 0 (0.0%) | 0 (0.0%) |
| 45 to 59 Minutes | 23 (28.1%) | 5 (11.6%) |
| 60 to 89 Minutes | 6 (7.3%) | 7 (16.3%) |
| 90 or more Minutes | 3 (3.7%) | 3 (7.0%) |
Time of Departure to Work by Sex in Cove Neck
The most frequent times of departure to work in Cove Neck are 8:00 AM to 8:29 AM (20, 24.4%) for males and 9:00 AM to 9:59 AM (11, 25.6%) for females.
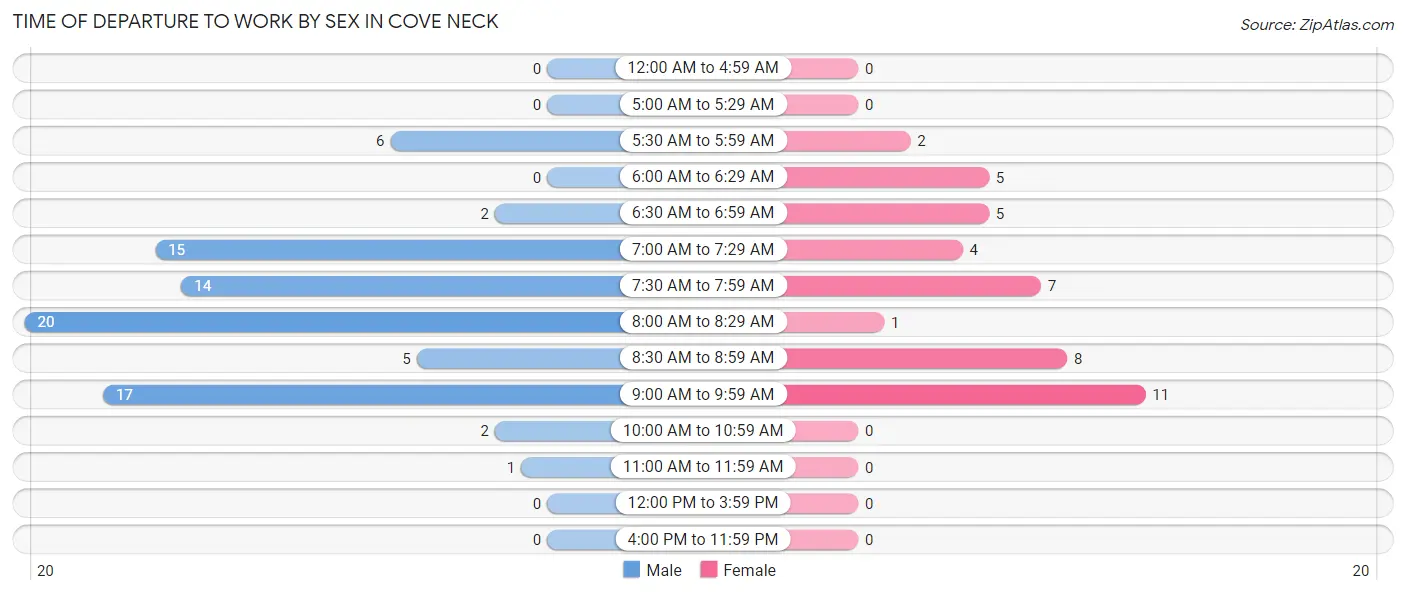
| Time of Departure | Male | Female |
| 12:00 AM to 4:59 AM | 0 (0.0%) | 0 (0.0%) |
| 5:00 AM to 5:29 AM | 0 (0.0%) | 0 (0.0%) |
| 5:30 AM to 5:59 AM | 6 (7.3%) | 2 (4.6%) |
| 6:00 AM to 6:29 AM | 0 (0.0%) | 5 (11.6%) |
| 6:30 AM to 6:59 AM | 2 (2.4%) | 5 (11.6%) |
| 7:00 AM to 7:29 AM | 15 (18.3%) | 4 (9.3%) |
| 7:30 AM to 7:59 AM | 14 (17.1%) | 7 (16.3%) |
| 8:00 AM to 8:29 AM | 20 (24.4%) | 1 (2.3%) |
| 8:30 AM to 8:59 AM | 5 (6.1%) | 8 (18.6%) |
| 9:00 AM to 9:59 AM | 17 (20.7%) | 11 (25.6%) |
| 10:00 AM to 10:59 AM | 2 (2.4%) | 0 (0.0%) |
| 11:00 AM to 11:59 AM | 1 (1.2%) | 0 (0.0%) |
| 12:00 PM to 3:59 PM | 0 (0.0%) | 0 (0.0%) |
| 4:00 PM to 11:59 PM | 0 (0.0%) | 0 (0.0%) |
| Total | 82 (100.0%) | 43 (100.0%) |
Housing Occupancy in Cove Neck
Occupancy by Ownership in Cove Neck
Of the total 101 dwellings in Cove Neck, owner-occupied units account for 71 (70.3%), while renter-occupied units make up 30 (29.7%).
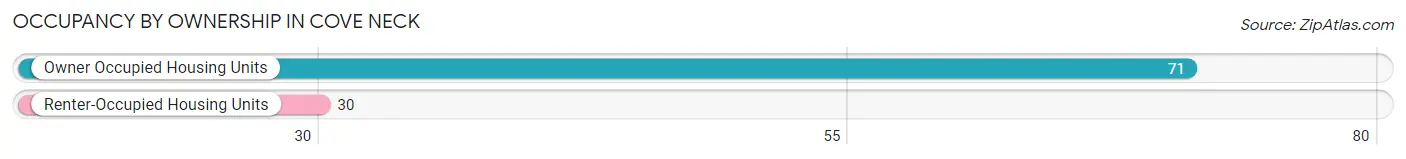
| Occupancy | # Housing Units | % Housing Units |
| Owner Occupied Housing Units | 71 | 70.3% |
| Renter-Occupied Housing Units | 30 | 29.7% |
| Total Occupied Housing Units | 101 | 100.0% |
Occupancy by Household Size in Cove Neck
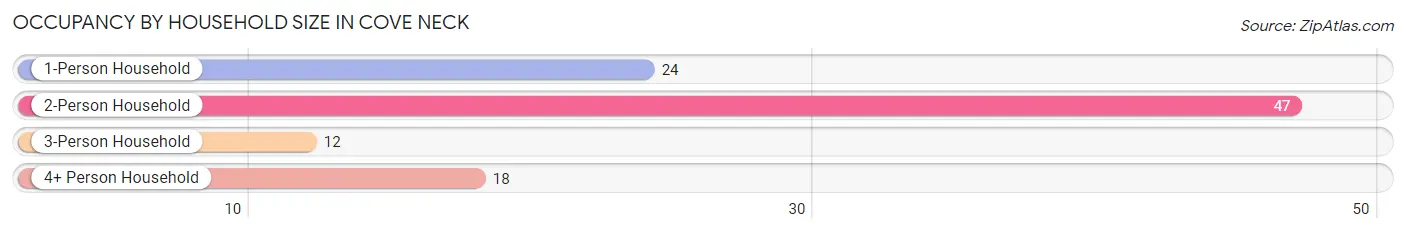
| Household Size | # Housing Units | % Housing Units |
| 1-Person Household | 24 | 23.8% |
| 2-Person Household | 47 | 46.5% |
| 3-Person Household | 12 | 11.9% |
| 4+ Person Household | 18 | 17.8% |
| Total Housing Units | 101 | 100.0% |
Occupancy by Ownership by Household Size in Cove Neck
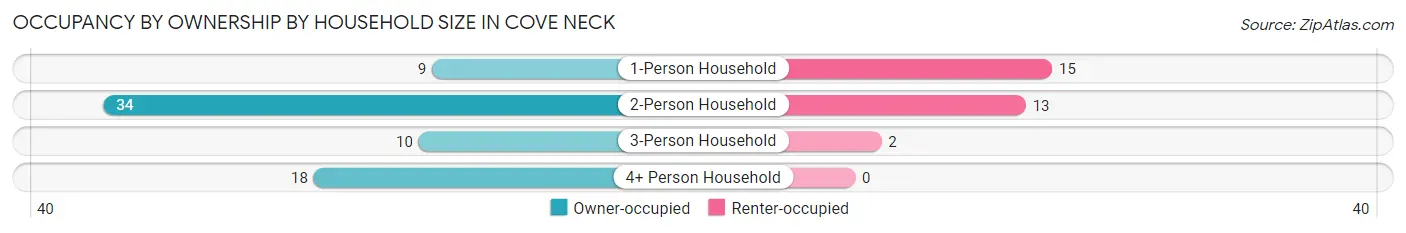
| Household Size | Owner-occupied | Renter-occupied |
| 1-Person Household | 9 (37.5%) | 15 (62.5%) |
| 2-Person Household | 34 (72.3%) | 13 (27.7%) |
| 3-Person Household | 10 (83.3%) | 2 (16.7%) |
| 4+ Person Household | 18 (100.0%) | 0 (0.0%) |
| Total Housing Units | 71 (70.3%) | 30 (29.7%) |
Occupancy by Educational Attainment in Cove Neck
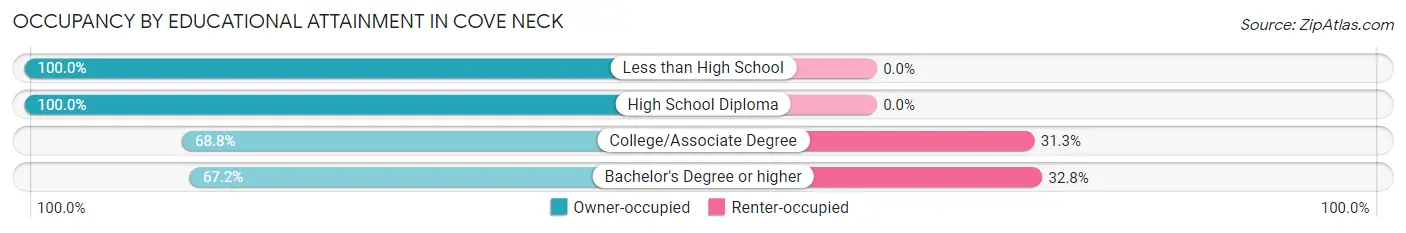
| Household Size | Owner-occupied | Renter-occupied |
| Less than High School | 3 (100.0%) | 0 (0.0%) |
| High School Diploma | 5 (100.0%) | 0 (0.0%) |
| College/Associate Degree | 22 (68.8%) | 10 (31.2%) |
| Bachelor's Degree or higher | 41 (67.2%) | 20 (32.8%) |
Occupancy by Age of Householder in Cove Neck
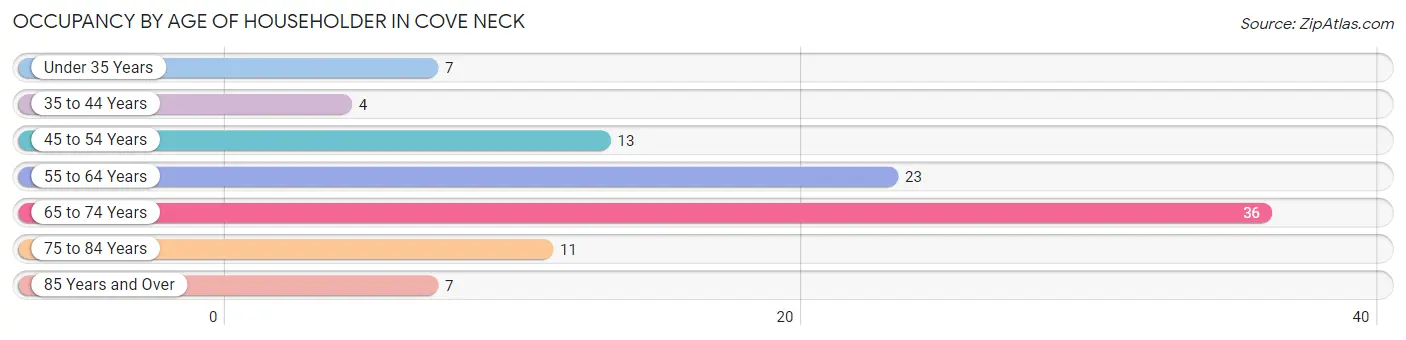
| Age Bracket | # Households | % Households |
| Under 35 Years | 7 | 6.9% |
| 35 to 44 Years | 4 | 4.0% |
| 45 to 54 Years | 13 | 12.9% |
| 55 to 64 Years | 23 | 22.8% |
| 65 to 74 Years | 36 | 35.6% |
| 75 to 84 Years | 11 | 10.9% |
| 85 Years and Over | 7 | 6.9% |
| Total | 101 | 100.0% |
Housing Finances in Cove Neck
Median Income by Occupancy in Cove Neck
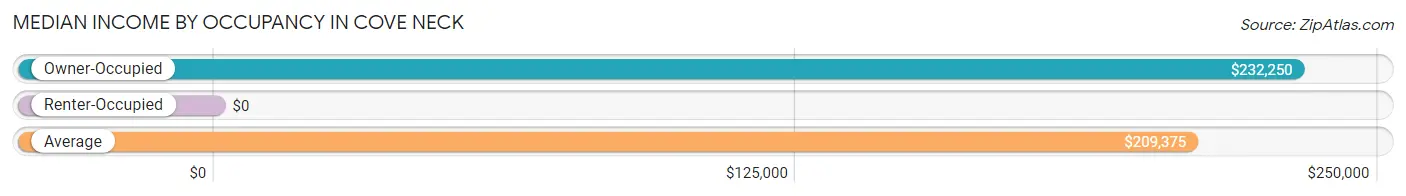
| Occupancy Type | # Households | Median Income |
| Owner-Occupied | 71 (70.3%) | $232,250 |
| Renter-Occupied | 30 (29.7%) | $0 |
| Average | 101 (100.0%) | $209,375 |
Occupancy by Householder Income Bracket in Cove Neck
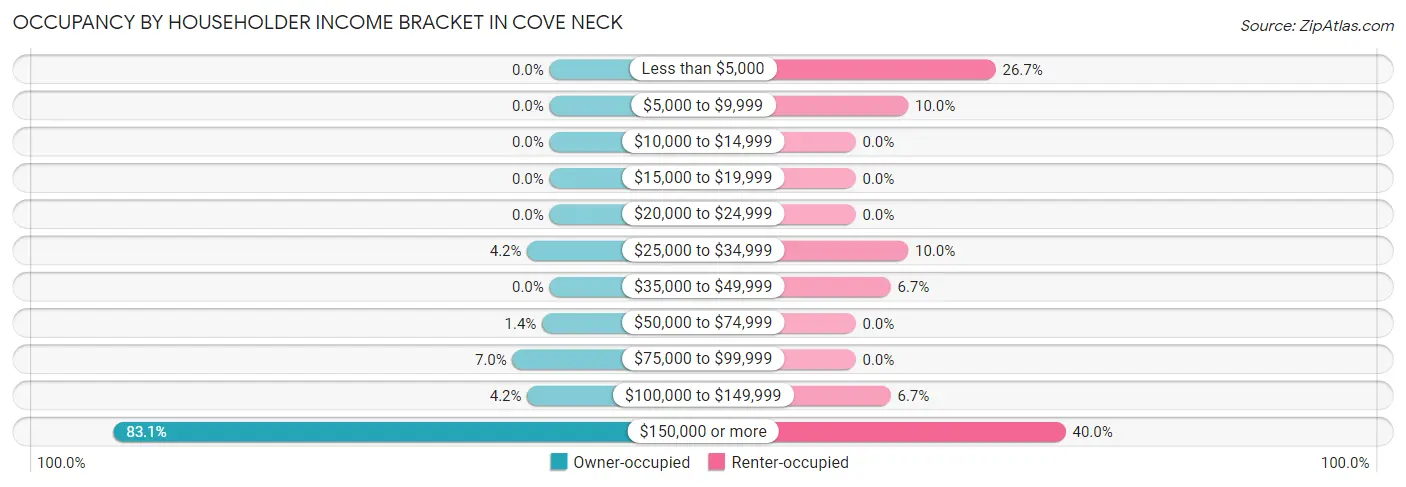
| Income Bracket | Owner-occupied | Renter-occupied |
| Less than $5,000 | 0 (0.0%) | 8 (26.7%) |
| $5,000 to $9,999 | 0 (0.0%) | 3 (10.0%) |
| $10,000 to $14,999 | 0 (0.0%) | 0 (0.0%) |
| $15,000 to $19,999 | 0 (0.0%) | 0 (0.0%) |
| $20,000 to $24,999 | 0 (0.0%) | 0 (0.0%) |
| $25,000 to $34,999 | 3 (4.2%) | 3 (10.0%) |
| $35,000 to $49,999 | 0 (0.0%) | 2 (6.7%) |
| $50,000 to $74,999 | 1 (1.4%) | 0 (0.0%) |
| $75,000 to $99,999 | 5 (7.0%) | 0 (0.0%) |
| $100,000 to $149,999 | 3 (4.2%) | 2 (6.7%) |
| $150,000 or more | 59 (83.1%) | 12 (40.0%) |
| Total | 71 (100.0%) | 30 (100.0%) |
Monthly Housing Cost Tiers in Cove Neck
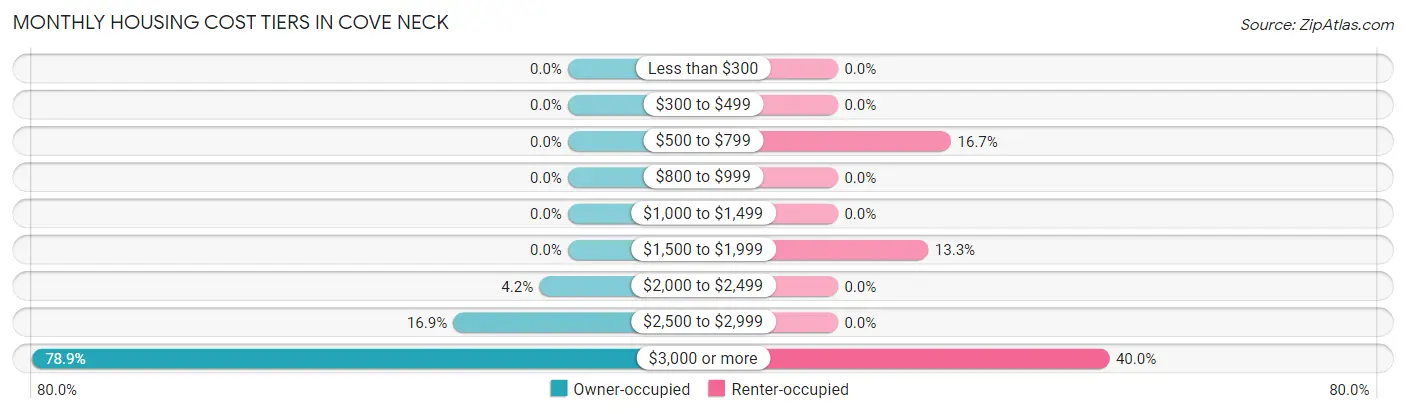
| Monthly Cost | Owner-occupied | Renter-occupied |
| Less than $300 | 0 (0.0%) | 0 (0.0%) |
| $300 to $499 | 0 (0.0%) | 0 (0.0%) |
| $500 to $799 | 0 (0.0%) | 5 (16.7%) |
| $800 to $999 | 0 (0.0%) | 0 (0.0%) |
| $1,000 to $1,499 | 0 (0.0%) | 0 (0.0%) |
| $1,500 to $1,999 | 0 (0.0%) | 4 (13.3%) |
| $2,000 to $2,499 | 3 (4.2%) | 0 (0.0%) |
| $2,500 to $2,999 | 12 (16.9%) | 0 (0.0%) |
| $3,000 or more | 56 (78.9%) | 12 (40.0%) |
| Total | 71 (100.0%) | 30 (100.0%) |
Physical Housing Characteristics in Cove Neck
Housing Structures in Cove Neck
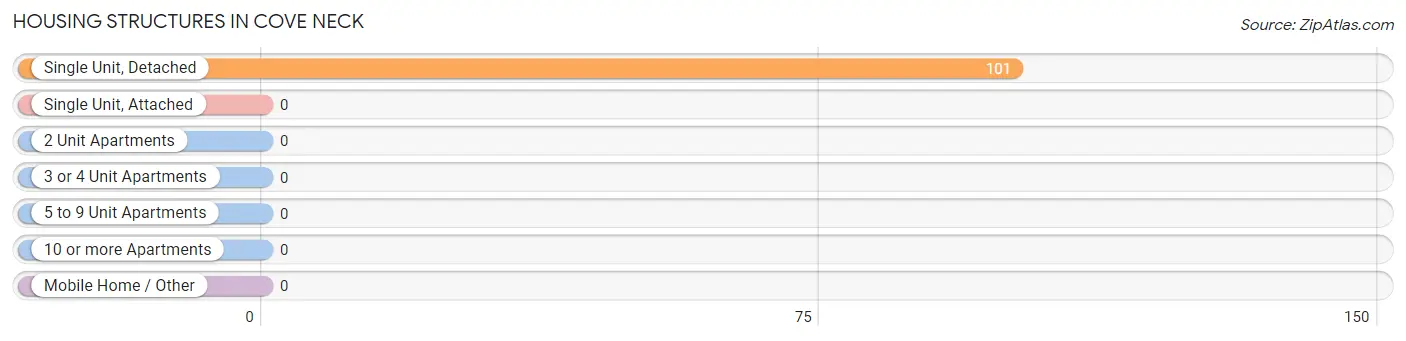
| Structure Type | # Housing Units | % Housing Units |
| Single Unit, Detached | 101 | 100.0% |
| Single Unit, Attached | 0 | 0.0% |
| 2 Unit Apartments | 0 | 0.0% |
| 3 or 4 Unit Apartments | 0 | 0.0% |
| 5 to 9 Unit Apartments | 0 | 0.0% |
| 10 or more Apartments | 0 | 0.0% |
| Mobile Home / Other | 0 | 0.0% |
| Total | 101 | 100.0% |
Housing Structures by Occupancy in Cove Neck
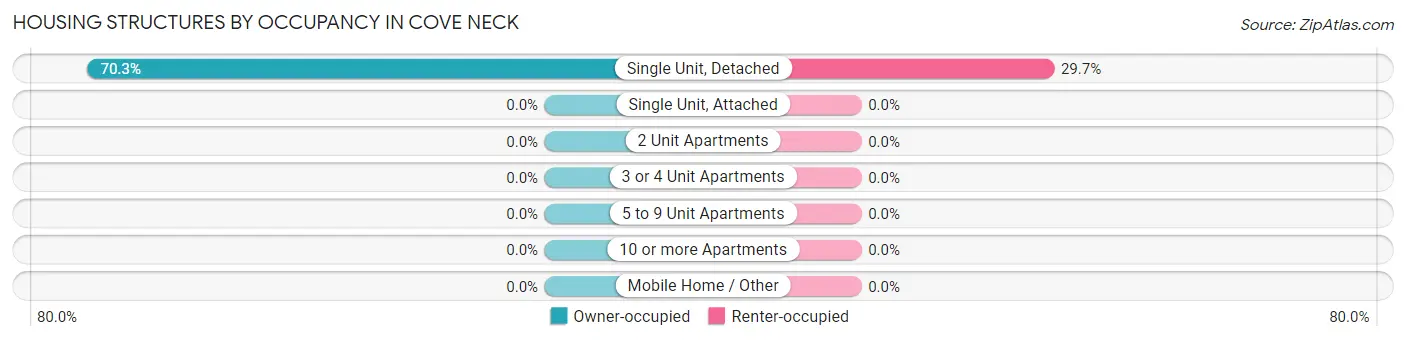
| Structure Type | Owner-occupied | Renter-occupied |
| Single Unit, Detached | 71 (70.3%) | 30 (29.7%) |
| Single Unit, Attached | 0 (0.0%) | 0 (0.0%) |
| 2 Unit Apartments | 0 (0.0%) | 0 (0.0%) |
| 3 or 4 Unit Apartments | 0 (0.0%) | 0 (0.0%) |
| 5 to 9 Unit Apartments | 0 (0.0%) | 0 (0.0%) |
| 10 or more Apartments | 0 (0.0%) | 0 (0.0%) |
| Mobile Home / Other | 0 (0.0%) | 0 (0.0%) |
| Total | 71 (70.3%) | 30 (29.7%) |
Housing Structures by Number of Rooms in Cove Neck
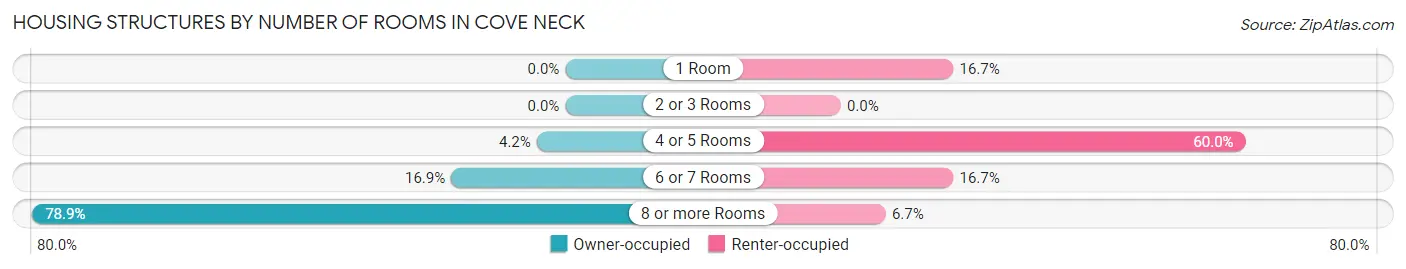
| Number of Rooms | Owner-occupied | Renter-occupied |
| 1 Room | 0 (0.0%) | 5 (16.7%) |
| 2 or 3 Rooms | 0 (0.0%) | 0 (0.0%) |
| 4 or 5 Rooms | 3 (4.2%) | 18 (60.0%) |
| 6 or 7 Rooms | 12 (16.9%) | 5 (16.7%) |
| 8 or more Rooms | 56 (78.9%) | 2 (6.7%) |
| Total | 71 (100.0%) | 30 (100.0%) |
Housing Structure by Heating Type in Cove Neck
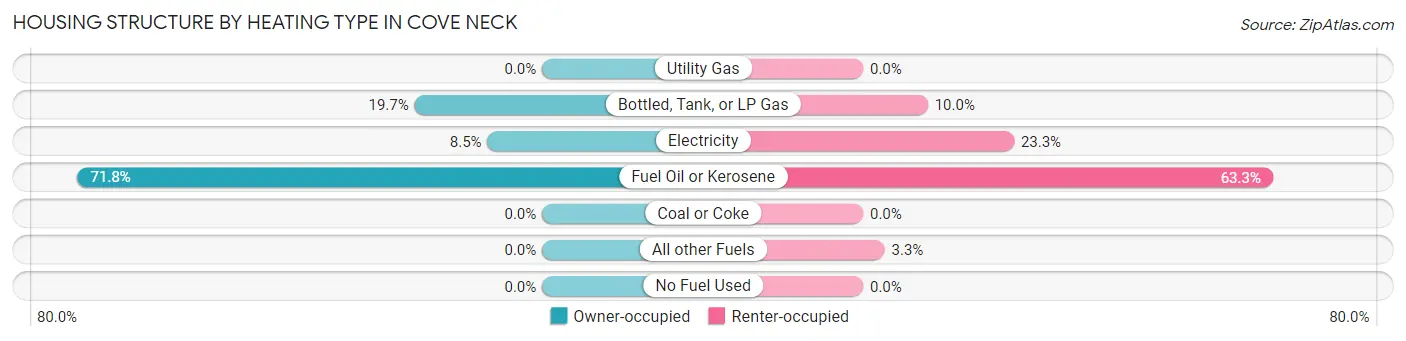
| Heating Type | Owner-occupied | Renter-occupied |
| Utility Gas | 0 (0.0%) | 0 (0.0%) |
| Bottled, Tank, or LP Gas | 14 (19.7%) | 3 (10.0%) |
| Electricity | 6 (8.5%) | 7 (23.3%) |
| Fuel Oil or Kerosene | 51 (71.8%) | 19 (63.3%) |
| Coal or Coke | 0 (0.0%) | 0 (0.0%) |
| All other Fuels | 0 (0.0%) | 1 (3.3%) |
| No Fuel Used | 0 (0.0%) | 0 (0.0%) |
| Total | 71 (100.0%) | 30 (100.0%) |
Household Vehicle Usage in Cove Neck
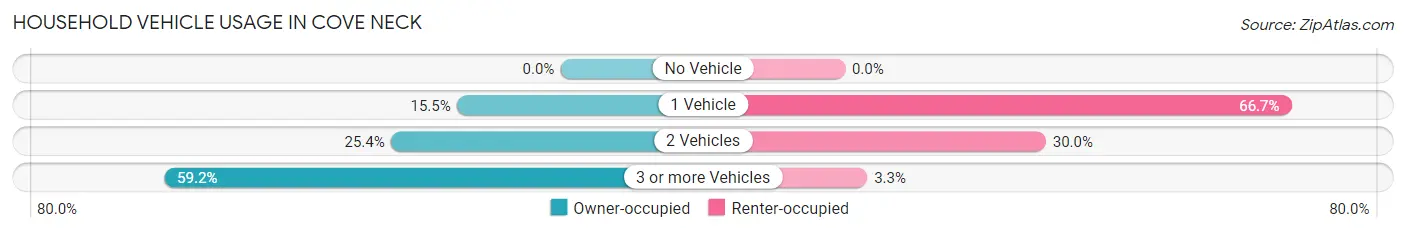
| Vehicles per Household | Owner-occupied | Renter-occupied |
| No Vehicle | 0 (0.0%) | 0 (0.0%) |
| 1 Vehicle | 11 (15.5%) | 20 (66.7%) |
| 2 Vehicles | 18 (25.4%) | 9 (30.0%) |
| 3 or more Vehicles | 42 (59.2%) | 1 (3.3%) |
| Total | 71 (100.0%) | 30 (100.0%) |
Real Estate & Mortgages in Cove Neck
Real Estate and Mortgage Overview in Cove Neck
| Characteristic | Without Mortgage | With Mortgage |
| Housing Units | 36 | 35 |
| Median Property Value | $2,000,001 | $1,429,700 |
| Median Household Income | $250,001 | $29 |
| Monthly Housing Costs | $1,501 | $35 |
| Real Estate Taxes | $10,001 | $0 |
Property Value by Mortgage Status in Cove Neck
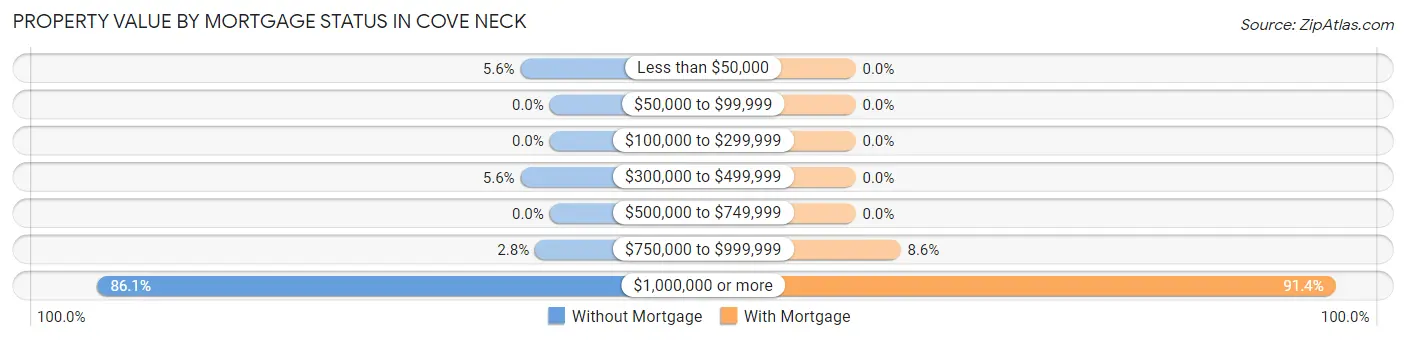
| Property Value | Without Mortgage | With Mortgage |
| Less than $50,000 | 2 (5.6%) | 0 (0.0%) |
| $50,000 to $99,999 | 0 (0.0%) | 0 (0.0%) |
| $100,000 to $299,999 | 0 (0.0%) | 0 (0.0%) |
| $300,000 to $499,999 | 2 (5.6%) | 0 (0.0%) |
| $500,000 to $749,999 | 0 (0.0%) | 0 (0.0%) |
| $750,000 to $999,999 | 1 (2.8%) | 3 (8.6%) |
| $1,000,000 or more | 31 (86.1%) | 32 (91.4%) |
| Total | 36 (100.0%) | 35 (100.0%) |
Household Income by Mortgage Status in Cove Neck
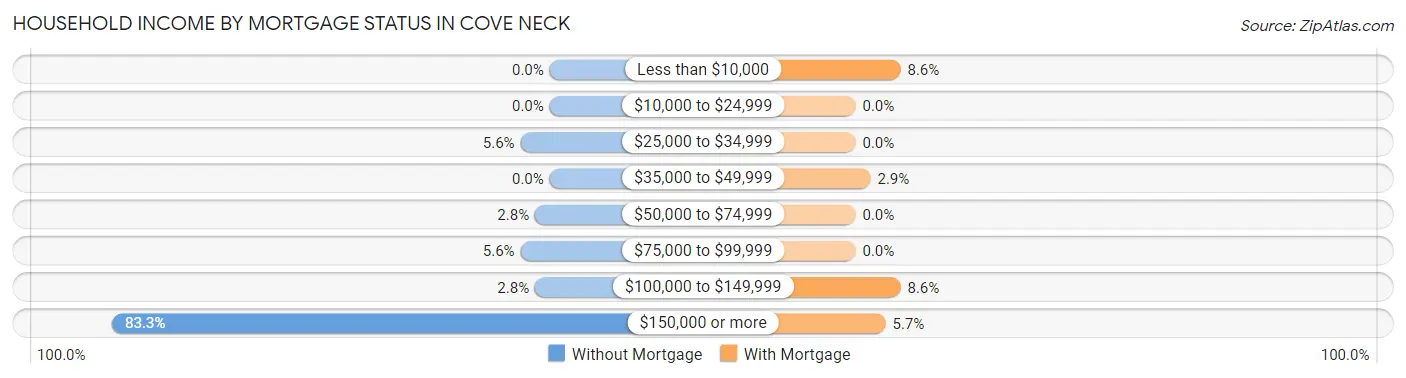
| Household Income | Without Mortgage | With Mortgage |
| Less than $10,000 | 0 (0.0%) | 3 (8.6%) |
| $10,000 to $24,999 | 0 (0.0%) | 0 (0.0%) |
| $25,000 to $34,999 | 2 (5.6%) | 0 (0.0%) |
| $35,000 to $49,999 | 0 (0.0%) | 1 (2.9%) |
| $50,000 to $74,999 | 1 (2.8%) | 0 (0.0%) |
| $75,000 to $99,999 | 2 (5.6%) | 0 (0.0%) |
| $100,000 to $149,999 | 1 (2.8%) | 3 (8.6%) |
| $150,000 or more | 30 (83.3%) | 2 (5.7%) |
| Total | 36 (100.0%) | 35 (100.0%) |
Property Value to Household Income Ratio in Cove Neck
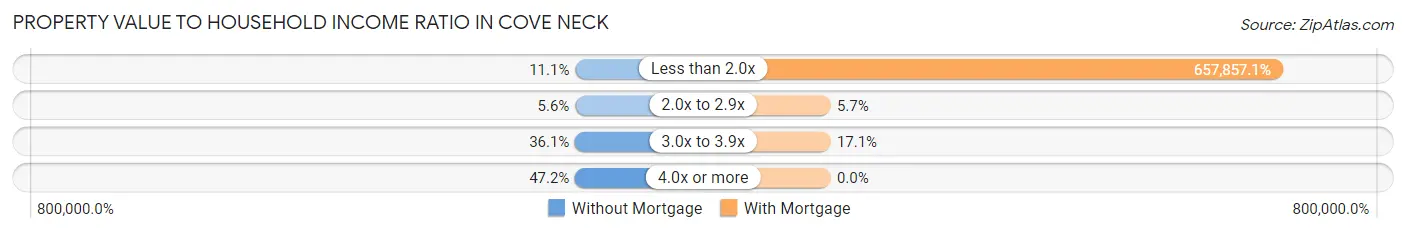
| Value-to-Income Ratio | Without Mortgage | With Mortgage |
| Less than 2.0x | 4 (11.1%) | 230,250 (657,857.1%) |
| 2.0x to 2.9x | 2 (5.6%) | 2 (5.7%) |
| 3.0x to 3.9x | 13 (36.1%) | 6 (17.1%) |
| 4.0x or more | 17 (47.2%) | 0 (0.0%) |
| Total | 36 (100.0%) | 35 (100.0%) |
Real Estate Taxes by Mortgage Status in Cove Neck
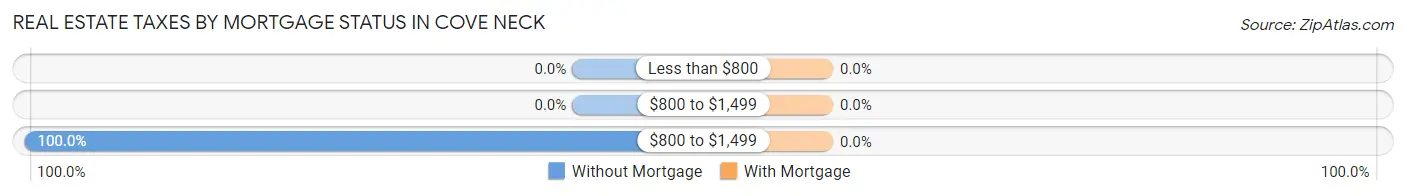
| Property Taxes | Without Mortgage | With Mortgage |
| Less than $800 | 0 (0.0%) | 0 (0.0%) |
| $800 to $1,499 | 0 (0.0%) | 0 (0.0%) |
| $800 to $1,499 | 36 (100.0%) | 0 (0.0%) |
| Total | 36 (100.0%) | 35 (100.0%) |
Health & Disability in Cove Neck
Health Insurance Coverage by Age in Cove Neck
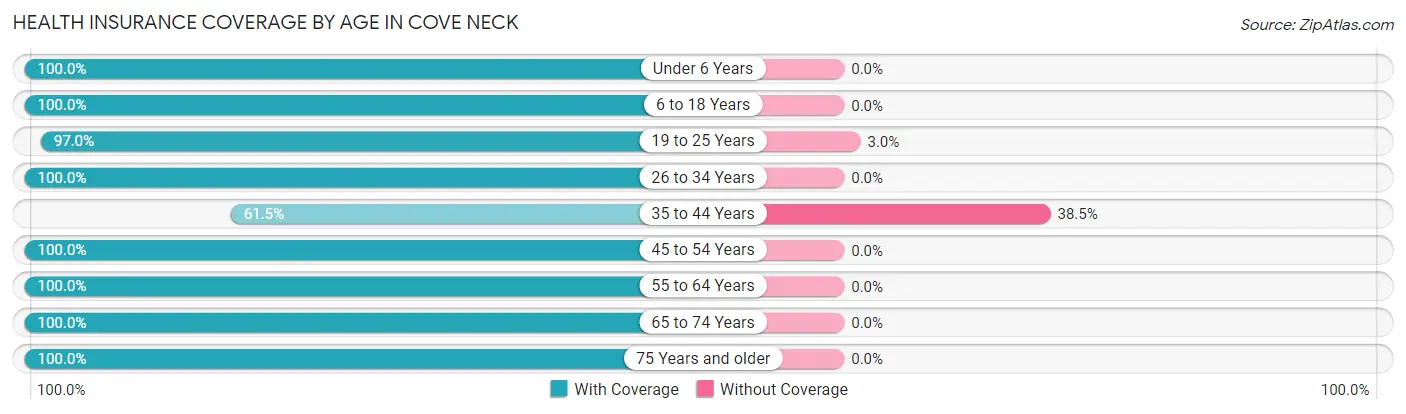
| Age Bracket | With Coverage | Without Coverage |
| Under 6 Years | 3 (100.0%) | 0 (0.0%) |
| 6 to 18 Years | 36 (100.0%) | 0 (0.0%) |
| 19 to 25 Years | 32 (97.0%) | 1 (3.0%) |
| 26 to 34 Years | 13 (100.0%) | 0 (0.0%) |
| 35 to 44 Years | 8 (61.5%) | 5 (38.5%) |
| 45 to 54 Years | 37 (100.0%) | 0 (0.0%) |
| 55 to 64 Years | 40 (100.0%) | 0 (0.0%) |
| 65 to 74 Years | 52 (100.0%) | 0 (0.0%) |
| 75 Years and older | 28 (100.0%) | 0 (0.0%) |
| Total | 249 (97.7%) | 6 (2.4%) |
Health Insurance Coverage by Citizenship Status in Cove Neck
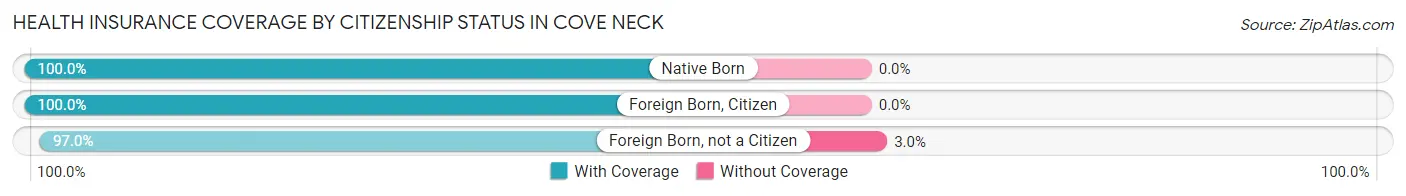
| Citizenship Status | With Coverage | Without Coverage |
| Native Born | 3 (100.0%) | 0 (0.0%) |
| Foreign Born, Citizen | 36 (100.0%) | 0 (0.0%) |
| Foreign Born, not a Citizen | 32 (97.0%) | 1 (3.0%) |
Health Insurance Coverage by Household Income in Cove Neck
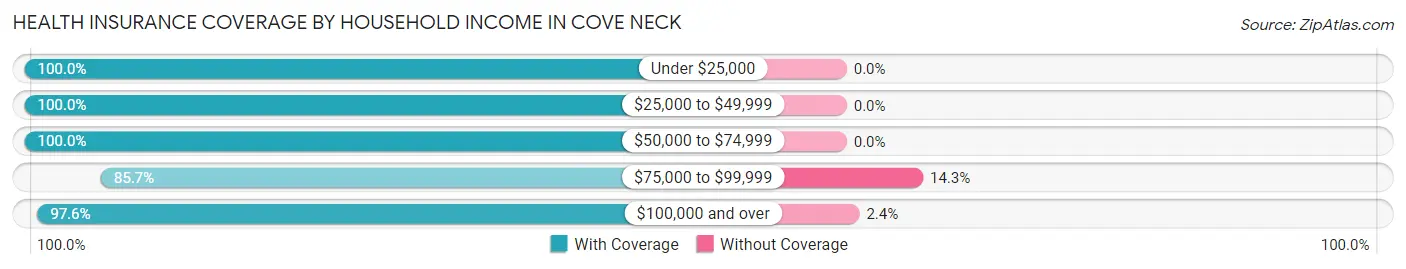
| Household Income | With Coverage | Without Coverage |
| Under $25,000 | 11 (100.0%) | 0 (0.0%) |
| $25,000 to $49,999 | 20 (100.0%) | 0 (0.0%) |
| $50,000 to $74,999 | 7 (100.0%) | 0 (0.0%) |
| $75,000 to $99,999 | 6 (85.7%) | 1 (14.3%) |
| $100,000 and over | 205 (97.6%) | 5 (2.4%) |
Public vs Private Health Insurance Coverage by Age in Cove Neck
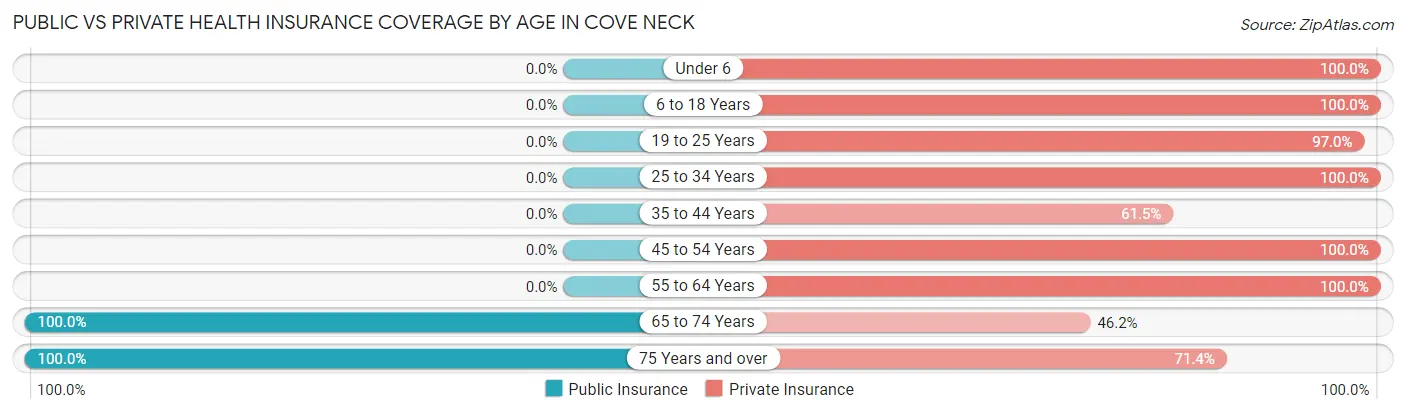
| Age Bracket | Public Insurance | Private Insurance |
| Under 6 | 0 (0.0%) | 3 (100.0%) |
| 6 to 18 Years | 0 (0.0%) | 36 (100.0%) |
| 19 to 25 Years | 0 (0.0%) | 32 (97.0%) |
| 25 to 34 Years | 0 (0.0%) | 13 (100.0%) |
| 35 to 44 Years | 0 (0.0%) | 8 (61.5%) |
| 45 to 54 Years | 0 (0.0%) | 37 (100.0%) |
| 55 to 64 Years | 0 (0.0%) | 40 (100.0%) |
| 65 to 74 Years | 52 (100.0%) | 24 (46.2%) |
| 75 Years and over | 28 (100.0%) | 20 (71.4%) |
| Total | 80 (31.4%) | 213 (83.5%) |
Disability Status by Sex by Age in Cove Neck
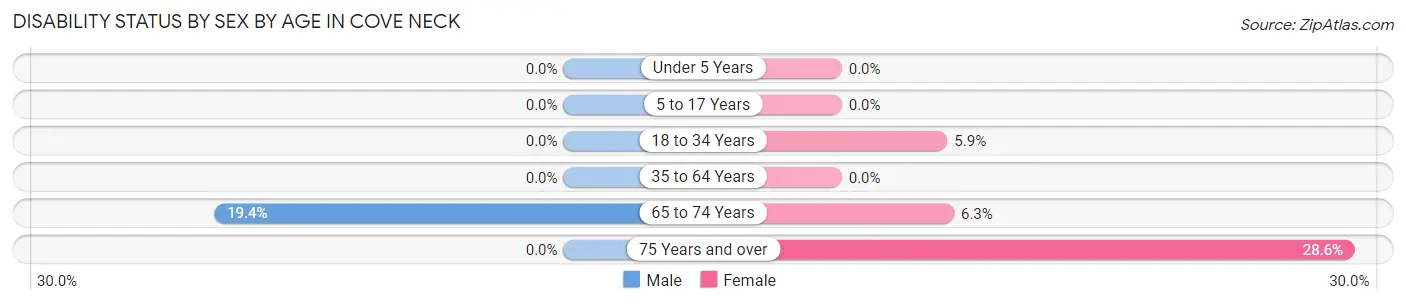
| Age Bracket | Male | Female |
| Under 5 Years | 0 (0.0%) | 0 (0.0%) |
| 5 to 17 Years | 0 (0.0%) | 0 (0.0%) |
| 18 to 34 Years | 0 (0.0%) | 1 (5.9%) |
| 35 to 64 Years | 0 (0.0%) | 0 (0.0%) |
| 65 to 74 Years | 7 (19.4%) | 1 (6.2%) |
| 75 Years and over | 0 (0.0%) | 4 (28.6%) |
Disability Class by Sex by Age in Cove Neck
Disability Class: Hearing Difficulty
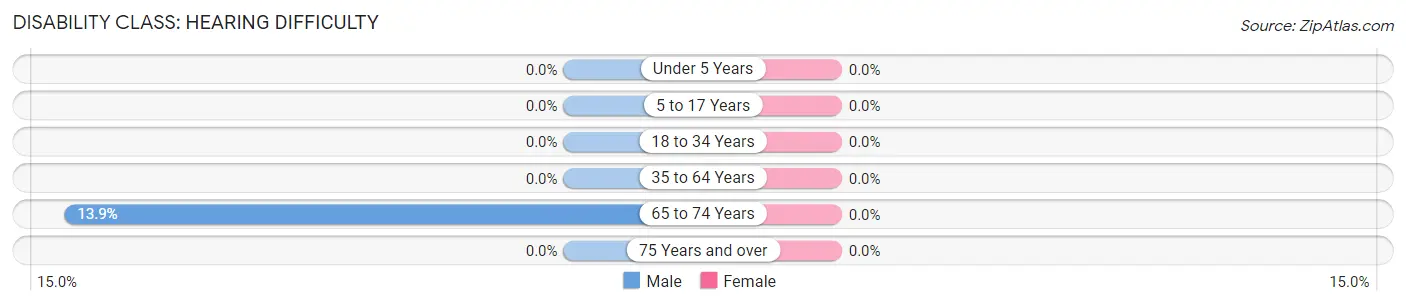
| Age Bracket | Male | Female |
| Under 5 Years | 0 (0.0%) | 0 (0.0%) |
| 5 to 17 Years | 0 (0.0%) | 0 (0.0%) |
| 18 to 34 Years | 0 (0.0%) | 0 (0.0%) |
| 35 to 64 Years | 0 (0.0%) | 0 (0.0%) |
| 65 to 74 Years | 5 (13.9%) | 0 (0.0%) |
| 75 Years and over | 0 (0.0%) | 0 (0.0%) |
Disability Class: Vision Difficulty
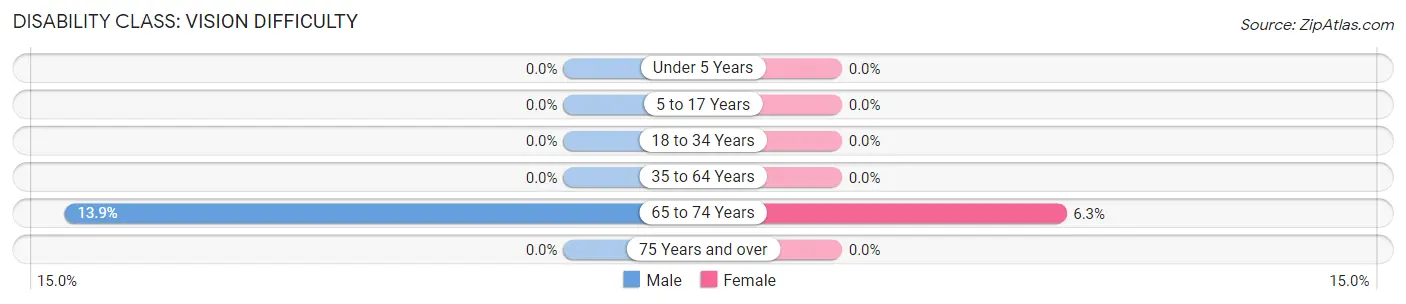
| Age Bracket | Male | Female |
| Under 5 Years | 0 (0.0%) | 0 (0.0%) |
| 5 to 17 Years | 0 (0.0%) | 0 (0.0%) |
| 18 to 34 Years | 0 (0.0%) | 0 (0.0%) |
| 35 to 64 Years | 0 (0.0%) | 0 (0.0%) |
| 65 to 74 Years | 5 (13.9%) | 1 (6.2%) |
| 75 Years and over | 0 (0.0%) | 0 (0.0%) |
Disability Class: Cognitive Difficulty
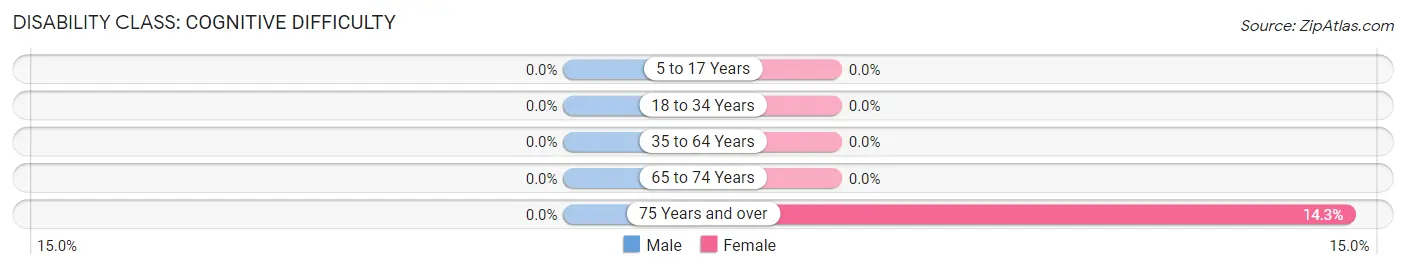
| Age Bracket | Male | Female |
| 5 to 17 Years | 0 (0.0%) | 0 (0.0%) |
| 18 to 34 Years | 0 (0.0%) | 0 (0.0%) |
| 35 to 64 Years | 0 (0.0%) | 0 (0.0%) |
| 65 to 74 Years | 0 (0.0%) | 0 (0.0%) |
| 75 Years and over | 0 (0.0%) | 2 (14.3%) |
Disability Class: Ambulatory Difficulty
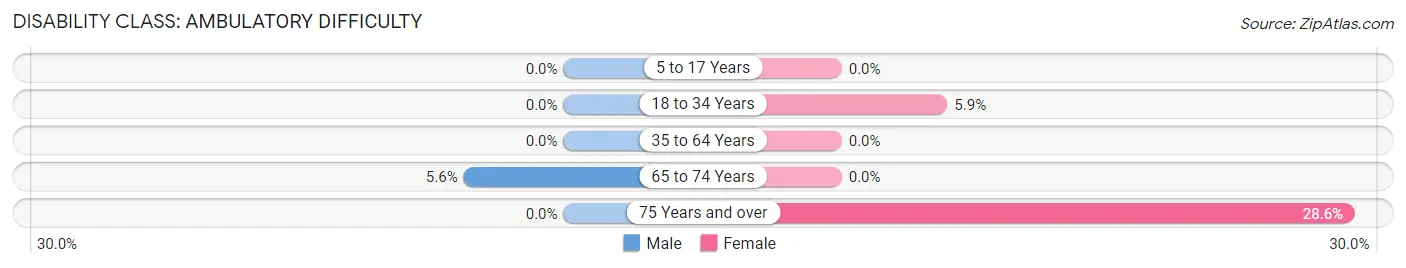
| Age Bracket | Male | Female |
| 5 to 17 Years | 0 (0.0%) | 0 (0.0%) |
| 18 to 34 Years | 0 (0.0%) | 1 (5.9%) |
| 35 to 64 Years | 0 (0.0%) | 0 (0.0%) |
| 65 to 74 Years | 2 (5.6%) | 0 (0.0%) |
| 75 Years and over | 0 (0.0%) | 4 (28.6%) |
Disability Class: Self-Care Difficulty
| Age Bracket | Male | Female |
| 5 to 17 Years | 0 (0.0%) | 0 (0.0%) |
| 18 to 34 Years | 0 (0.0%) | 0 (0.0%) |
| 35 to 64 Years | 0 (0.0%) | 0 (0.0%) |
| 65 to 74 Years | 0 (0.0%) | 0 (0.0%) |
| 75 Years and over | 0 (0.0%) | 0 (0.0%) |
Technology Access in Cove Neck
Computing Device Access in Cove Neck
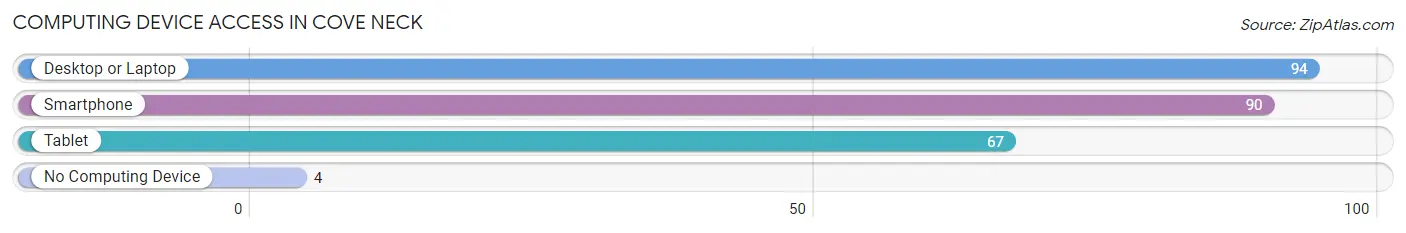
| Device Type | # Households | % Households |
| Desktop or Laptop | 94 | 93.1% |
| Smartphone | 90 | 89.1% |
| Tablet | 67 | 66.3% |
| No Computing Device | 4 | 4.0% |
| Total | 101 | 100.0% |
Internet Access in Cove Neck
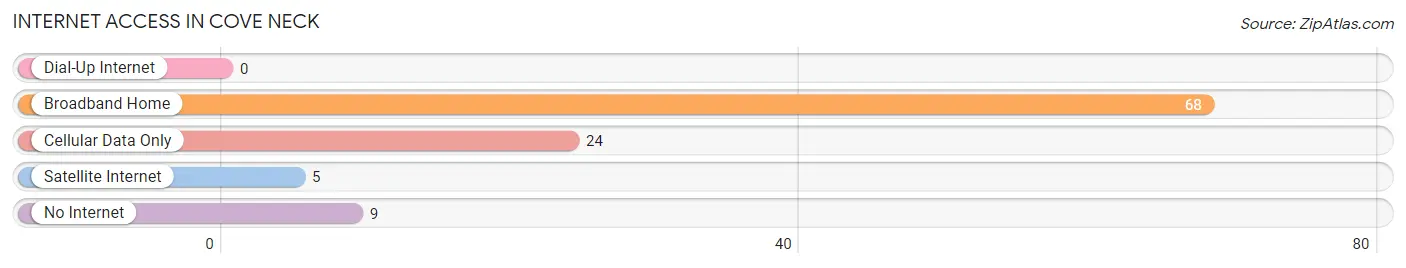
| Internet Type | # Households | % Households |
| Dial-Up Internet | 0 | 0.0% |
| Broadband Home | 68 | 67.3% |
| Cellular Data Only | 24 | 23.8% |
| Satellite Internet | 5 | 5.0% |
| No Internet | 9 | 8.9% |
| Total | 101 | 100.0% |
Cove Neck Summary
Cove Neck is a hamlet located in the Town of Oyster Bay in Nassau County, New York. It is situated on the north shore of Long Island, approximately 25 miles east of Manhattan. The hamlet is bordered by the villages of Lattingtown and Bayville to the west, Centre Island to the east, and Oyster Bay to the south.
Geography
Cove Neck is located on the north shore of Long Island, approximately 25 miles east of Manhattan. The hamlet is bordered by the villages of Lattingtown and Bayville to the west, Centre Island to the east, and Oyster Bay to the south. The hamlet is situated on a peninsula that juts out into the Long Island Sound. The peninsula is surrounded by the Oyster Bay Harbor to the north and east, and Cold Spring Harbor to the south. The hamlet is home to several small coves, including Cove Neck Cove, which is located on the western side of the peninsula.
The hamlet is mostly residential, with a few small businesses located along the main road, Cove Neck Road. The hamlet is home to several historic sites, including the Theodore Roosevelt Estate, which is now a museum, and the historic Oyster Bay Railroad Station.
History
Cove Neck was originally inhabited by the Matinecock Native American tribe. The area was first settled by Europeans in the late 17th century. The hamlet was originally known as “Cove Neck Landing”, and was a popular spot for fishing and oystering.
In the late 19th century, the hamlet began to attract wealthy New Yorkers, who built large estates along the waterfront. One of the most famous of these estates was the Theodore Roosevelt Estate, which was built in 1885. The estate is now a museum, and is open to the public.
In the early 20th century, the hamlet began to attract more residents, and several small businesses opened up along Cove Neck Road. The hamlet was officially incorporated in the Town of Oyster Bay in 1921.
Economy
Cove Neck is a primarily residential community, with a few small businesses located along Cove Neck Road. The hamlet is home to several historic sites, including the Theodore Roosevelt Estate, which is now a museum, and the historic Oyster Bay Railroad Station.
The hamlet is also home to several marinas, which provide services to boaters in the area. The hamlet is also home to several yacht clubs, including the Oyster Bay Yacht Club and the Centre Island Yacht Club.
Demographics
As of the 2010 census, the population of Cove Neck was 1,845. The median household income was $125,000, and the median home value was $1,000,000. The population is primarily white (94.3%), with a small percentage of African Americans (2.2%) and Asians (2.2%).
Conclusion
Cove Neck is a small hamlet located on the north shore of Long Island, approximately 25 miles east of Manhattan. The hamlet is mostly residential, with a few small businesses located along the main road, Cove Neck Road. The hamlet is home to several historic sites, including the Theodore Roosevelt Estate, which is now a museum, and the historic Oyster Bay Railroad Station. The population of Cove Neck is primarily white, with a small percentage of African Americans and Asians. The median household income is $125,000, and the median home value is $1,000,000.
Common Questions
What is Per Capita Income in Cove Neck?
Per Capita income in Cove Neck is $182,753.
What is the Median Family Income in Cove Neck?
Median Family Income in Cove Neck is $232,000.
What is the Median Household income in Cove Neck?
Median Household Income in Cove Neck is $209,375.
What is Inequality or Gini Index in Cove Neck?
Inequality or Gini Index in Cove Neck is 0.60.
What is the Total Population of Cove Neck?
Total Population of Cove Neck is 255.
What is the Total Male Population of Cove Neck?
Total Male Population of Cove Neck is 147.
What is the Total Female Population of Cove Neck?
Total Female Population of Cove Neck is 108.
What is the Ratio of Males per 100 Females in Cove Neck?
There are 136.11 Males per 100 Females in Cove Neck.
What is the Ratio of Females per 100 Males in Cove Neck?
There are 73.47 Females per 100 Males in Cove Neck.
What is the Median Population Age in Cove Neck?
Median Population Age in Cove Neck is 53.3 Years.
What is the Average Family Size in Cove Neck
Average Family Size in Cove Neck is 3.0 People.
What is the Average Household Size in Cove Neck
Average Household Size in Cove Neck is 2.5 People.
How Large is the Labor Force in Cove Neck?
There are 134 People in the Labor Forcein in Cove Neck.
What is the Percentage of People in the Labor Force in Cove Neck?
59.8% of People are in the Labor Force in Cove Neck.
What is the Unemployment Rate in Cove Neck?
Unemployment Rate in Cove Neck is 2.2%.