Clarence Center, NY Map & Demographics
Clarence Center Map
Clarence Center Overview
$65,485
PER CAPITA INCOME
$134,170
AVG FAMILY INCOME
$133,653
AVG HOUSEHOLD INCOME
16.9%
WAGE / INCOME GAP [ % ]
83.1¢/ $1
WAGE / INCOME GAP [ $ ]
0.42
INEQUALITY / GINI INDEX
3,264
TOTAL POPULATION
1,548
MALE POPULATION
1,716
FEMALE POPULATION
90.21
MALES / 100 FEMALES
110.85
FEMALES / 100 MALES
42.0
MEDIAN AGE
3.1
AVG FAMILY SIZE
3.0
AVG HOUSEHOLD SIZE
1,678
LABOR FORCE [ PEOPLE ]
67.7%
PERCENT IN LABOR FORCE
5.8%
UNEMPLOYMENT RATE
Clarence Center Zip Codes
Clarence Center Area Codes
Income in Clarence Center
Income Overview in Clarence Center
Per Capita Income in Clarence Center is $65,485, while median incomes of families and households are $134,170 and $133,653 respectively.
| Characteristic | Number | Measure |
| Per Capita Income | 3,264 | $65,485 |
| Median Family Income | 995 | $134,170 |
| Mean Family Income | 995 | $186,670 |
| Median Household Income | 1,105 | $133,653 |
| Mean Household Income | 1,105 | $194,673 |
| Income Deficit | 995 | $0 |
| Wage / Income Gap (%) | 3,264 | 16.90% |
| Wage / Income Gap ($) | 3,264 | 83.10¢ per $1 |
| Gini / Inequality Index | 3,264 | 0.42 |
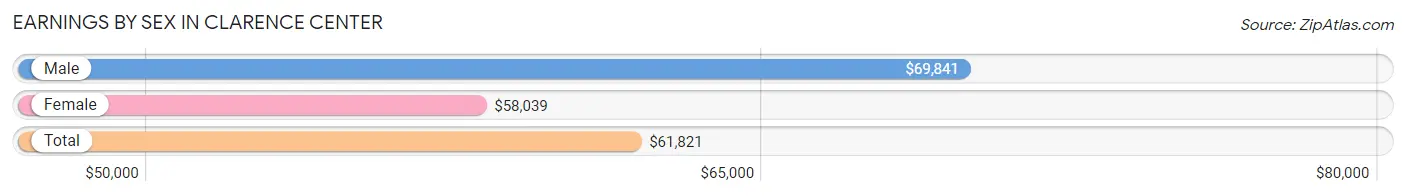
Earnings by Sex in Clarence Center
Average Earnings in Clarence Center are $61,821, $69,841 for men and $58,039 for women, a difference of 16.9%.
| Sex | Number | Average Earnings |
| Male | 1,095 (57.4%) | $69,841 |
| Female | 814 (42.6%) | $58,039 |
| Total | 1,909 (100.0%) | $61,821 |
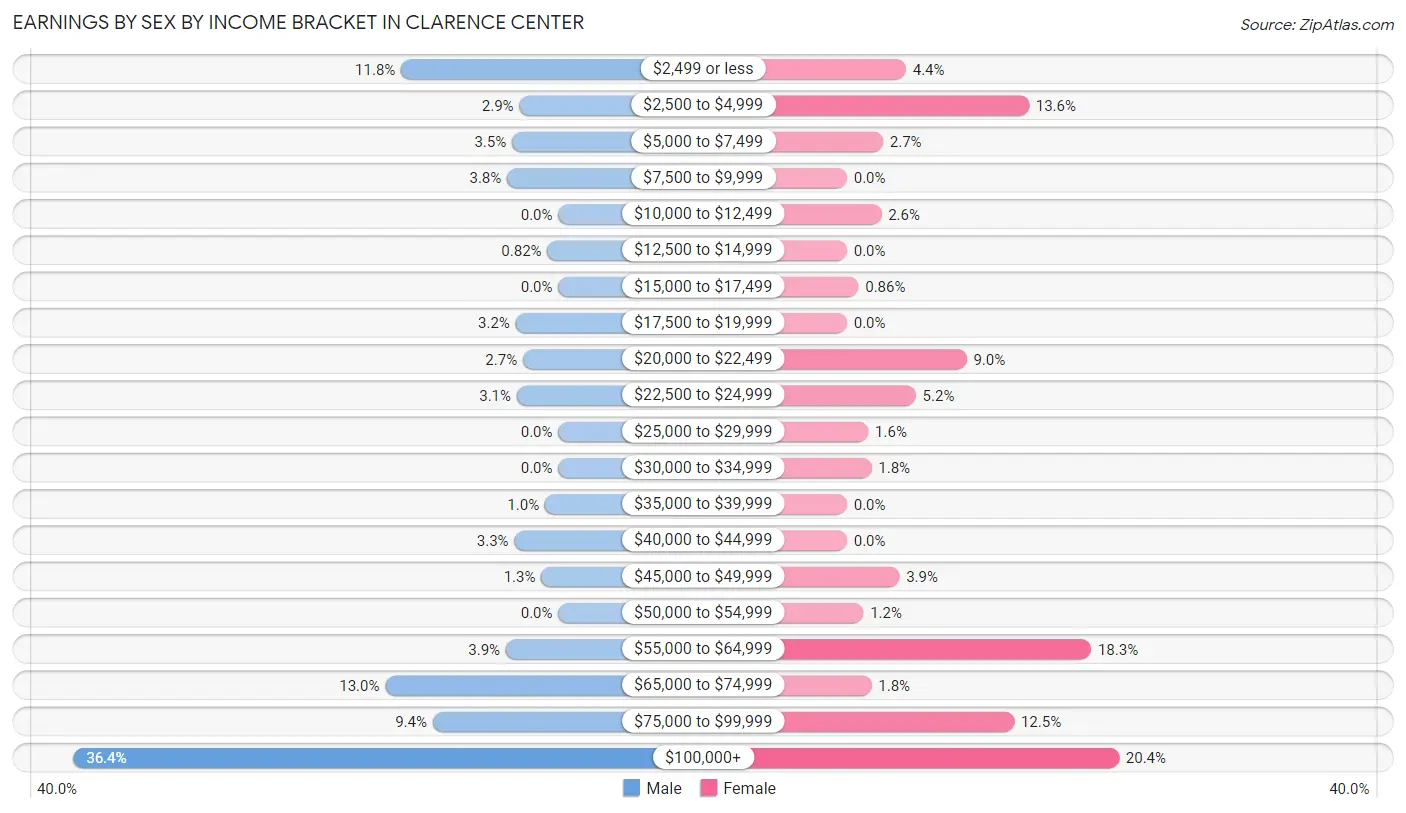
Earnings by Sex by Income Bracket in Clarence Center
The most common earnings brackets in Clarence Center are $100,000+ for men (398 | 36.3%) and $100,000+ for women (166 | 20.4%).
| Income | Male | Female |
| $2,499 or less | 129 (11.8%) | 36 (4.4%) |
| $2,500 to $4,999 | 32 (2.9%) | 111 (13.6%) |
| $5,000 to $7,499 | 38 (3.5%) | 22 (2.7%) |
| $7,500 to $9,999 | 42 (3.8%) | 0 (0.0%) |
| $10,000 to $12,499 | 0 (0.0%) | 21 (2.6%) |
| $12,500 to $14,999 | 9 (0.8%) | 0 (0.0%) |
| $15,000 to $17,499 | 0 (0.0%) | 7 (0.9%) |
| $17,500 to $19,999 | 35 (3.2%) | 0 (0.0%) |
| $20,000 to $22,499 | 29 (2.6%) | 73 (9.0%) |
| $22,500 to $24,999 | 34 (3.1%) | 42 (5.2%) |
| $25,000 to $29,999 | 0 (0.0%) | 13 (1.6%) |
| $30,000 to $34,999 | 0 (0.0%) | 15 (1.8%) |
| $35,000 to $39,999 | 11 (1.0%) | 0 (0.0%) |
| $40,000 to $44,999 | 36 (3.3%) | 0 (0.0%) |
| $45,000 to $49,999 | 14 (1.3%) | 32 (3.9%) |
| $50,000 to $54,999 | 0 (0.0%) | 10 (1.2%) |
| $55,000 to $64,999 | 43 (3.9%) | 149 (18.3%) |
| $65,000 to $74,999 | 142 (13.0%) | 15 (1.8%) |
| $75,000 to $99,999 | 103 (9.4%) | 102 (12.5%) |
| $100,000+ | 398 (36.3%) | 166 (20.4%) |
| Total | 1,095 (100.0%) | 814 (100.0%) |
Earnings by Sex by Educational Attainment in Clarence Center
Average earnings in Clarence Center are $83,914 for men and $59,246 for women, a difference of 29.4%. Men with an educational attainment of bachelor's degree enjoy the highest average annual earnings of $115,504, while those with high school diploma education earn the least with $20,156. Women with an educational attainment of graduate degree earn the most with the average annual earnings of $112,083, while those with college or associate's degree education have the smallest earnings of $23,500.

| Educational Attainment | Male Income | Female Income |
| Less than High School | - | - |
| High School Diploma | $20,156 | $0 |
| College or Associate's Degree | $62,083 | $23,500 |
| Bachelor's Degree | $115,504 | $80,353 |
| Graduate Degree | $84,148 | $112,083 |
| Total | $83,914 | $59,246 |
Family Income in Clarence Center
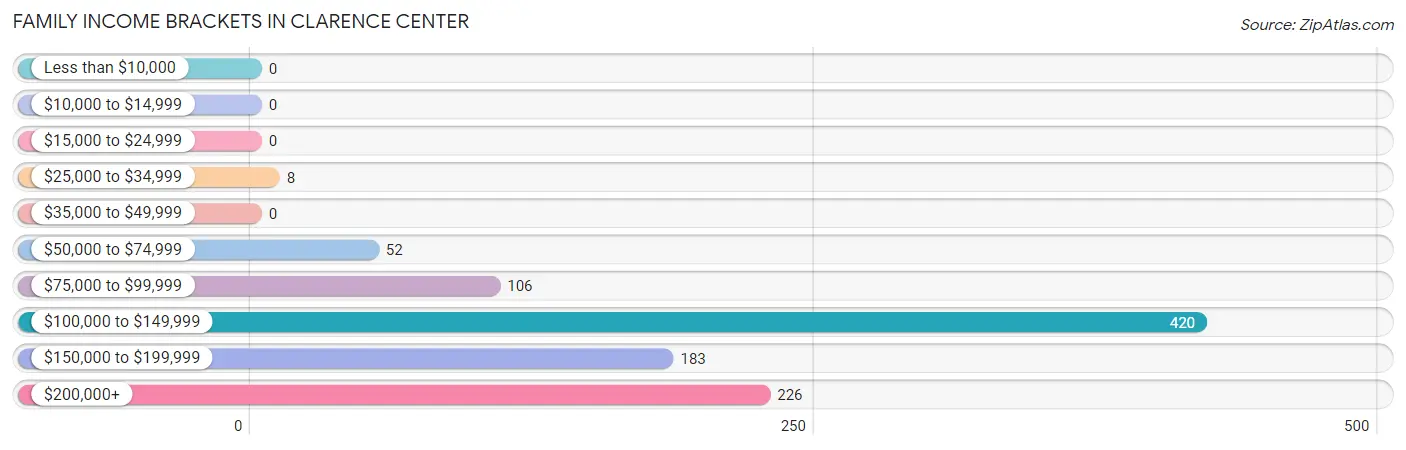
Family Income Brackets in Clarence Center
According to the Clarence Center family income data, there are 420 families falling into the $100,000 to $149,999 income range, which is the most common income bracket and makes up 42.2% of all families.
| Income Bracket | # Families | % Families |
| Less than $10,000 | 0 | 0.0% |
| $10,000 to $14,999 | 0 | 0.0% |
| $15,000 to $24,999 | 0 | 0.0% |
| $25,000 to $34,999 | 8 | 0.8% |
| $35,000 to $49,999 | 0 | 0.0% |
| $50,000 to $74,999 | 52 | 5.2% |
| $75,000 to $99,999 | 106 | 10.7% |
| $100,000 to $149,999 | 420 | 42.2% |
| $150,000 to $199,999 | 183 | 18.4% |
| $200,000+ | 226 | 22.7% |
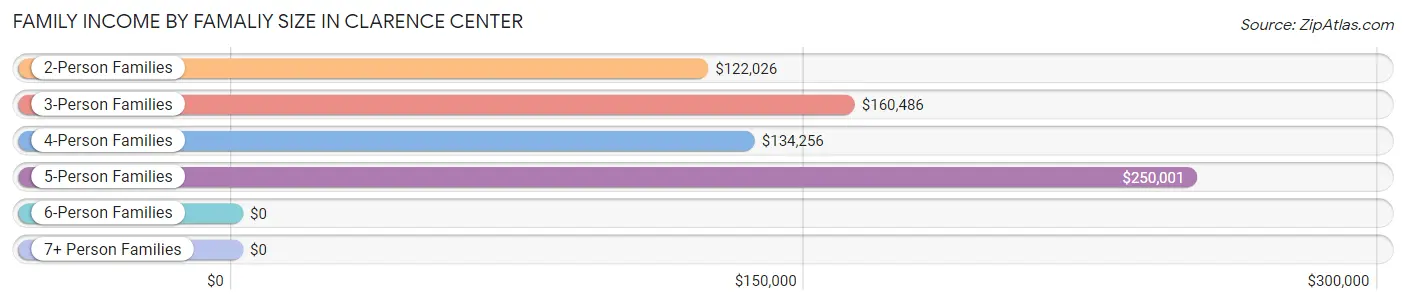
Family Income by Famaliy Size in Clarence Center
5-person families (56 | 5.6%) account for the highest median family income in Clarence Center with $250,001 per family, while 2-person families (423 | 42.5%) have the highest median income of $61,013 per family member.
| Income Bracket | # Families | Median Income |
| 2-Person Families | 423 (42.5%) | $122,026 |
| 3-Person Families | 98 (9.9%) | $160,486 |
| 4-Person Families | 351 (35.3%) | $134,256 |
| 5-Person Families | 56 (5.6%) | $250,001 |
| 6-Person Families | 67 (6.7%) | $0 |
| 7+ Person Families | 0 (0.0%) | $0 |
| Total | 995 (100.0%) | $134,170 |
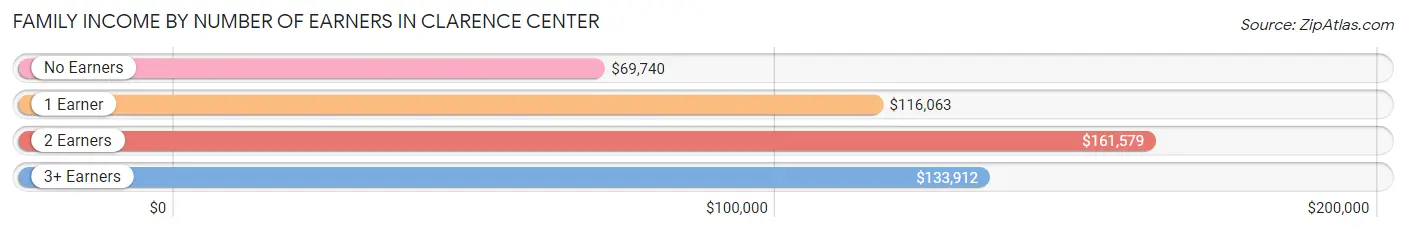
Family Income by Number of Earners in Clarence Center
The median family income in Clarence Center is $134,170, with families comprising 2 earners (442) having the highest median family income of $161,579, while families with no earners (59) have the lowest median family income of $69,740, accounting for 44.4% and 5.9% of families, respectively.
| Number of Earners | # Families | Median Income |
| No Earners | 59 (5.9%) | $69,740 |
| 1 Earner | 279 (28.0%) | $116,063 |
| 2 Earners | 442 (44.4%) | $161,579 |
| 3+ Earners | 215 (21.6%) | $133,912 |
| Total | 995 (100.0%) | $134,170 |
Household Income in Clarence Center
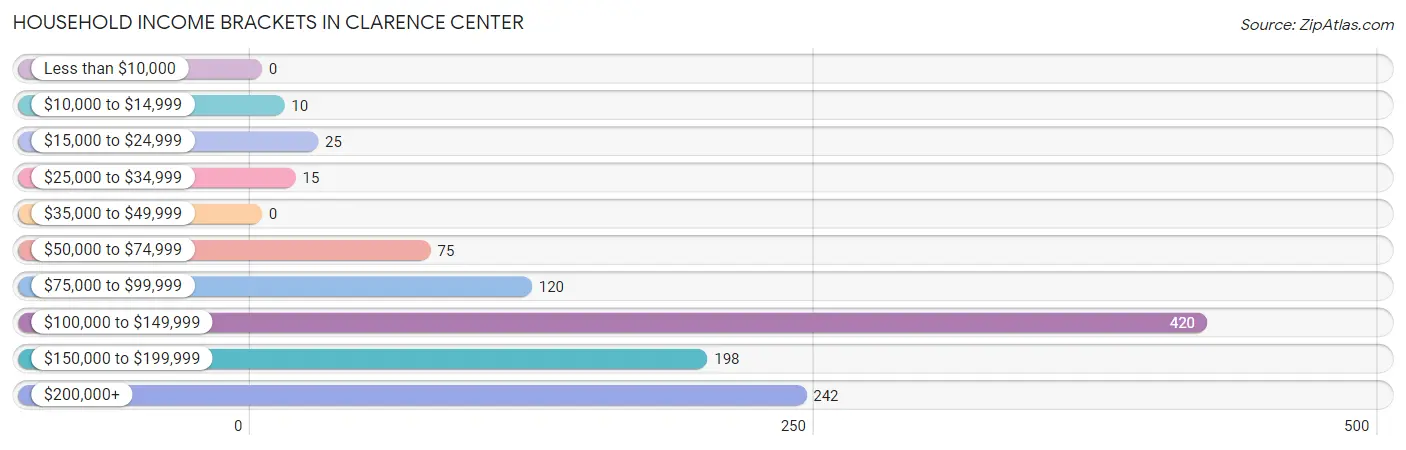
Household Income Brackets in Clarence Center
With 420 households falling in the category, the $100,000 to $149,999 income range is the most frequent in Clarence Center, accounting for 38.0% of all households.
| Income Bracket | # Households | % Households |
| Less than $10,000 | 0 | 0.0% |
| $10,000 to $14,999 | 10 | 0.9% |
| $15,000 to $24,999 | 25 | 2.3% |
| $25,000 to $34,999 | 15 | 1.4% |
| $35,000 to $49,999 | 0 | 0.0% |
| $50,000 to $74,999 | 75 | 6.8% |
| $75,000 to $99,999 | 120 | 10.9% |
| $100,000 to $149,999 | 420 | 38.0% |
| $150,000 to $199,999 | 198 | 17.9% |
| $200,000+ | 242 | 21.9% |
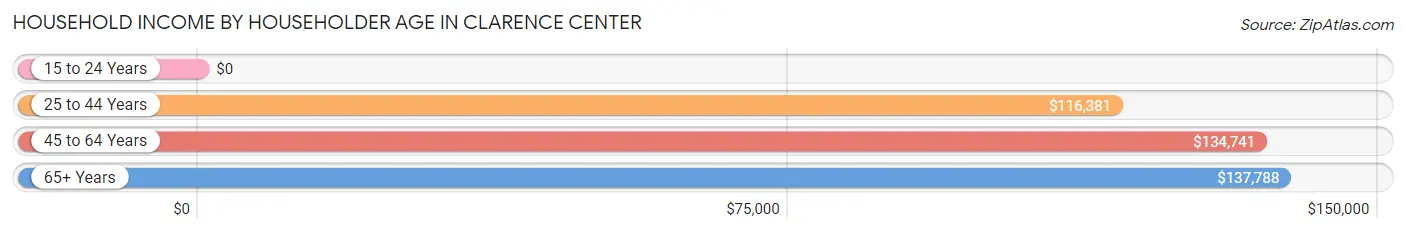
Household Income by Householder Age in Clarence Center
The median household income in Clarence Center is $133,653, with the highest median household income of $137,788 found in the 65+ years age bracket for the primary householder. A total of 221 households (20.0%) fall into this category.
| Income Bracket | # Households | Median Income |
| 15 to 24 Years | 0 (0.0%) | $0 |
| 25 to 44 Years | 322 (29.1%) | $116,381 |
| 45 to 64 Years | 562 (50.9%) | $134,741 |
| 65+ Years | 221 (20.0%) | $137,788 |
| Total | 1,105 (100.0%) | $133,653 |
Poverty in Clarence Center
Income Below Poverty by Sex and Age in Clarence Center
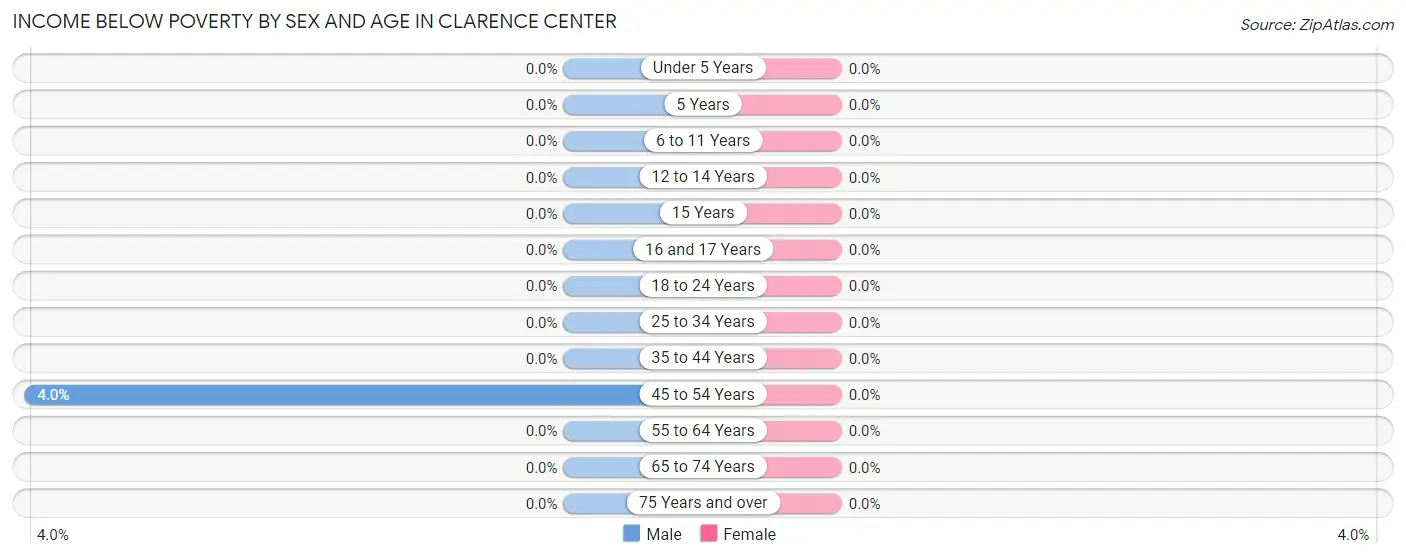
| Age Bracket | Male | Female |
| Under 5 Years | 0 (0.0%) | 0 (0.0%) |
| 5 Years | 0 (0.0%) | 0 (0.0%) |
| 6 to 11 Years | 0 (0.0%) | 0 (0.0%) |
| 12 to 14 Years | 0 (0.0%) | 0 (0.0%) |
| 15 Years | 0 (0.0%) | 0 (0.0%) |
| 16 and 17 Years | 0 (0.0%) | 0 (0.0%) |
| 18 to 24 Years | 0 (0.0%) | 0 (0.0%) |
| 25 to 34 Years | 0 (0.0%) | 0 (0.0%) |
| 35 to 44 Years | 0 (0.0%) | 0 (0.0%) |
| 45 to 54 Years | 10 (4.0%) | 0 (0.0%) |
| 55 to 64 Years | 0 (0.0%) | 0 (0.0%) |
| 65 to 74 Years | 0 (0.0%) | 0 (0.0%) |
| 75 Years and over | 0 (0.0%) | 0 (0.0%) |
| Total | 10 (0.7%) | 0 (0.0%) |
Income Above Poverty by Sex and Age in Clarence Center
According to the poverty statistics in Clarence Center, males aged under 5 years and females aged under 5 years are the age groups that are most secure financially, with 100.0% of males and 100.0% of females in these age groups living above the poverty line.
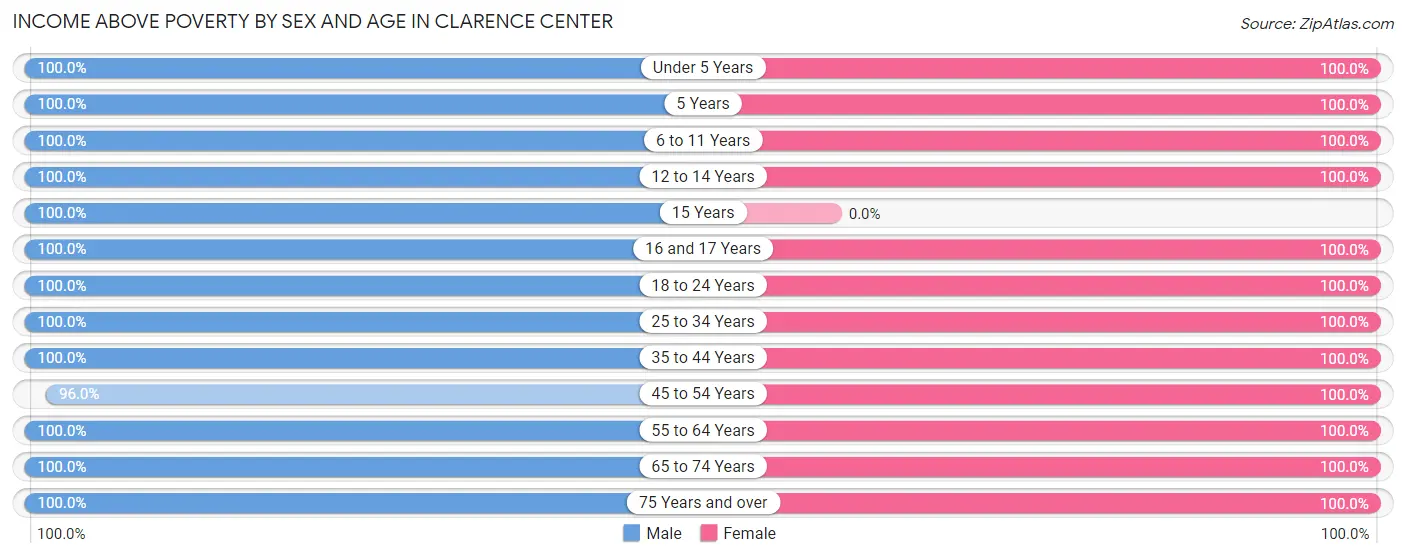
| Age Bracket | Male | Female |
| Under 5 Years | 14 (100.0%) | 186 (100.0%) |
| 5 Years | 14 (100.0%) | 43 (100.0%) |
| 6 to 11 Years | 114 (100.0%) | 134 (100.0%) |
| 12 to 14 Years | 93 (100.0%) | 92 (100.0%) |
| 15 Years | 50 (100.0%) | 0 (0.0%) |
| 16 and 17 Years | 116 (100.0%) | 21 (100.0%) |
| 18 to 24 Years | 84 (100.0%) | 164 (100.0%) |
| 25 to 34 Years | 69 (100.0%) | 105 (100.0%) |
| 35 to 44 Years | 237 (100.0%) | 217 (100.0%) |
| 45 to 54 Years | 240 (96.0%) | 299 (100.0%) |
| 55 to 64 Years | 242 (100.0%) | 241 (100.0%) |
| 65 to 74 Years | 146 (100.0%) | 124 (100.0%) |
| 75 Years and over | 74 (100.0%) | 90 (100.0%) |
| Total | 1,493 (99.3%) | 1,716 (100.0%) |
Income Below Poverty Among Married-Couple Families in Clarence Center
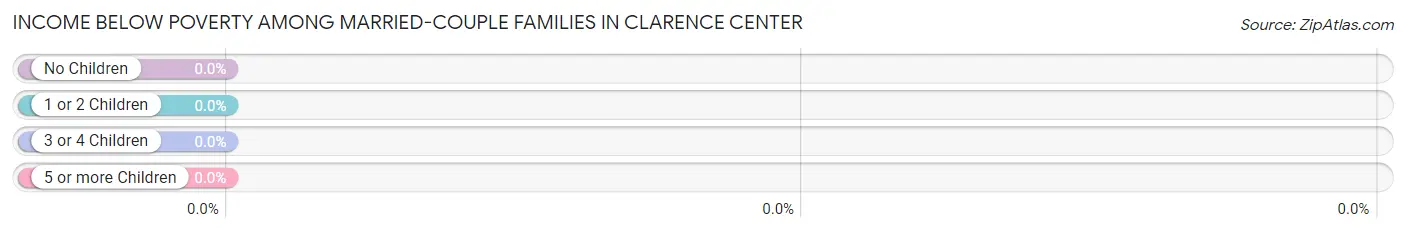
| Children | Above Poverty | Below Poverty |
| No Children | 435 (100.0%) | 0 (0.0%) |
| 1 or 2 Children | 332 (100.0%) | 0 (0.0%) |
| 3 or 4 Children | 123 (100.0%) | 0 (0.0%) |
| 5 or more Children | 0 (0.0%) | 0 (0.0%) |
| Total | 890 (100.0%) | 0 (0.0%) |
Income Below Poverty Among Single-Parent Households in Clarence Center
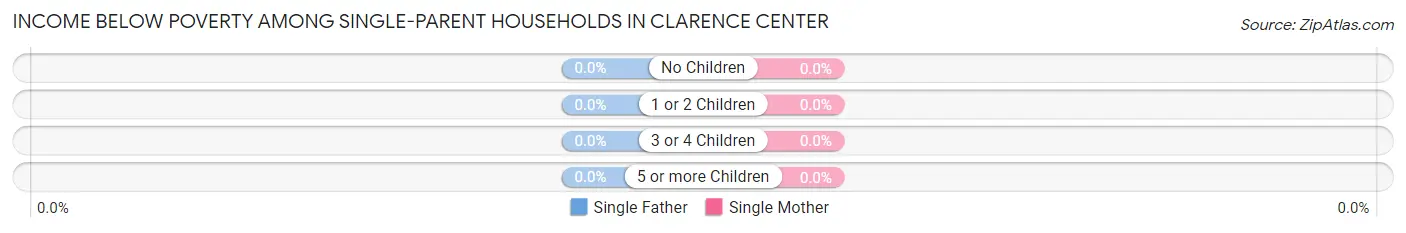
| Children | Single Father | Single Mother |
| No Children | 0 (0.0%) | 0 (0.0%) |
| 1 or 2 Children | 0 (0.0%) | 0 (0.0%) |
| 3 or 4 Children | 0 (0.0%) | 0 (0.0%) |
| 5 or more Children | 0 (0.0%) | 0 (0.0%) |
| Total | 0 (0.0%) | 0 (0.0%) |
Income Below Poverty Among Married-Couple vs Single-Parent Households in Clarence Center
| Children | Married-Couple Families | Single-Parent Households |
| No Children | 0 (0.0%) | 0 (0.0%) |
| 1 or 2 Children | 0 (0.0%) | 0 (0.0%) |
| 3 or 4 Children | 0 (0.0%) | 0 (0.0%) |
| 5 or more Children | 0 (0.0%) | 0 (0.0%) |
| Total | 0 (0.0%) | 0 (0.0%) |
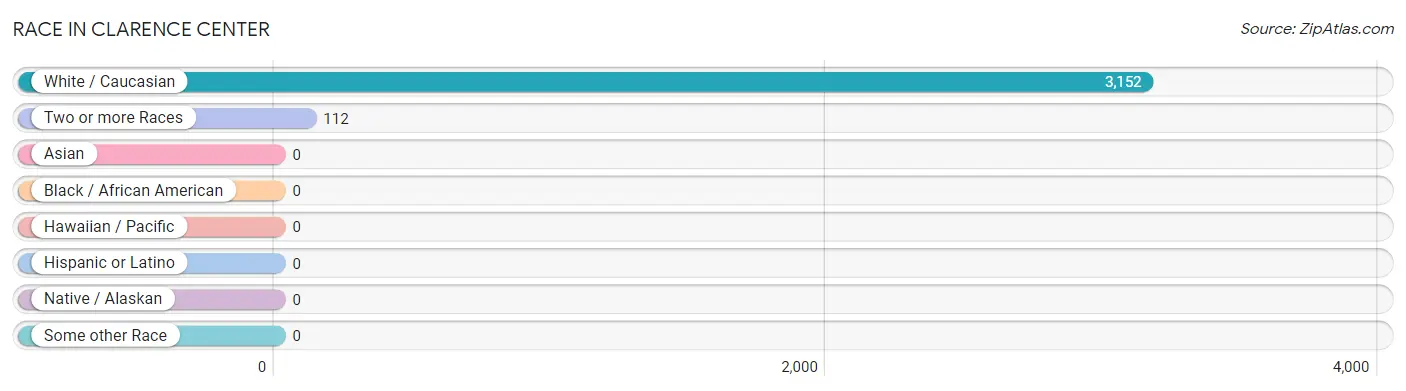
Race in Clarence Center
The most populous races in Clarence Center are White / Caucasian (3,152 | 96.6%), and Two or more Races (112 | 3.4%).
| Race | # Population | % Population |
| Asian | 0 | 0.0% |
| Black / African American | 0 | 0.0% |
| Hawaiian / Pacific | 0 | 0.0% |
| Hispanic or Latino | 0 | 0.0% |
| Native / Alaskan | 0 | 0.0% |
| White / Caucasian | 3,152 | 96.6% |
| Two or more Races | 112 | 3.4% |
| Some other Race | 0 | 0.0% |
| Total | 3,264 | 100.0% |
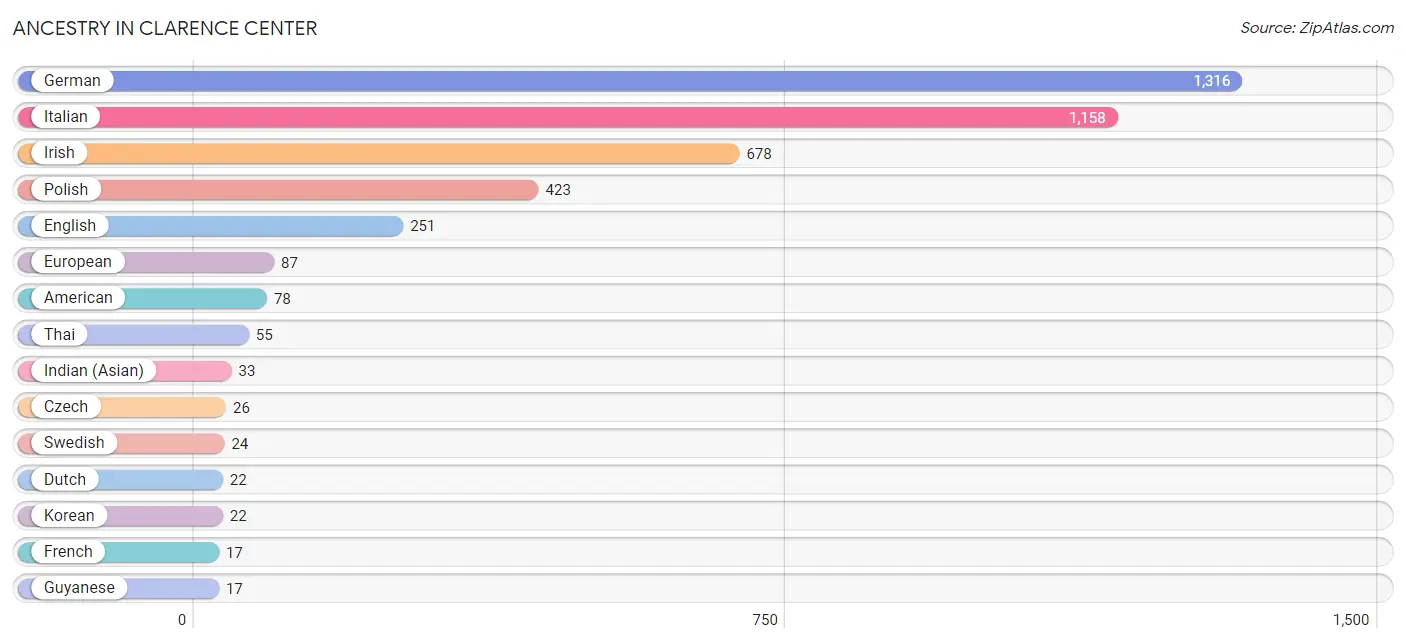
Ancestry in Clarence Center
The most populous ancestries reported in Clarence Center are German (1,316 | 40.3%), Italian (1,158 | 35.5%), Irish (678 | 20.8%), Polish (423 | 13.0%), and English (251 | 7.7%), together accounting for 117.2% of all Clarence Center residents.
| Ancestry | # Population | % Population |
| American | 78 | 2.4% |
| Canadian | 13 | 0.4% |
| Czech | 26 | 0.8% |
| Dutch | 22 | 0.7% |
| English | 251 | 7.7% |
| European | 87 | 2.7% |
| French | 17 | 0.5% |
| German | 1,316 | 40.3% |
| Guyanese | 17 | 0.5% |
| Hungarian | 10 | 0.3% |
| Indian (Asian) | 33 | 1.0% |
| Irish | 678 | 20.8% |
| Italian | 1,158 | 35.5% |
| Korean | 22 | 0.7% |
| Polish | 423 | 13.0% |
| Russian | 15 | 0.5% |
| Scotch-Irish | 16 | 0.5% |
| Scottish | 11 | 0.3% |
| Swedish | 24 | 0.7% |
| Thai | 55 | 1.7% | View All 20 Rows |
Immigrants in Clarence Center
The most numerous immigrant groups reported in Clarence Center came from , and Canada (51 | 1.6%), together accounting for 1.6% of all Clarence Center residents.

| Immigration Origin | # Population | % Population |
| Canada | 51 | 1.6% | View All 1 Rows |
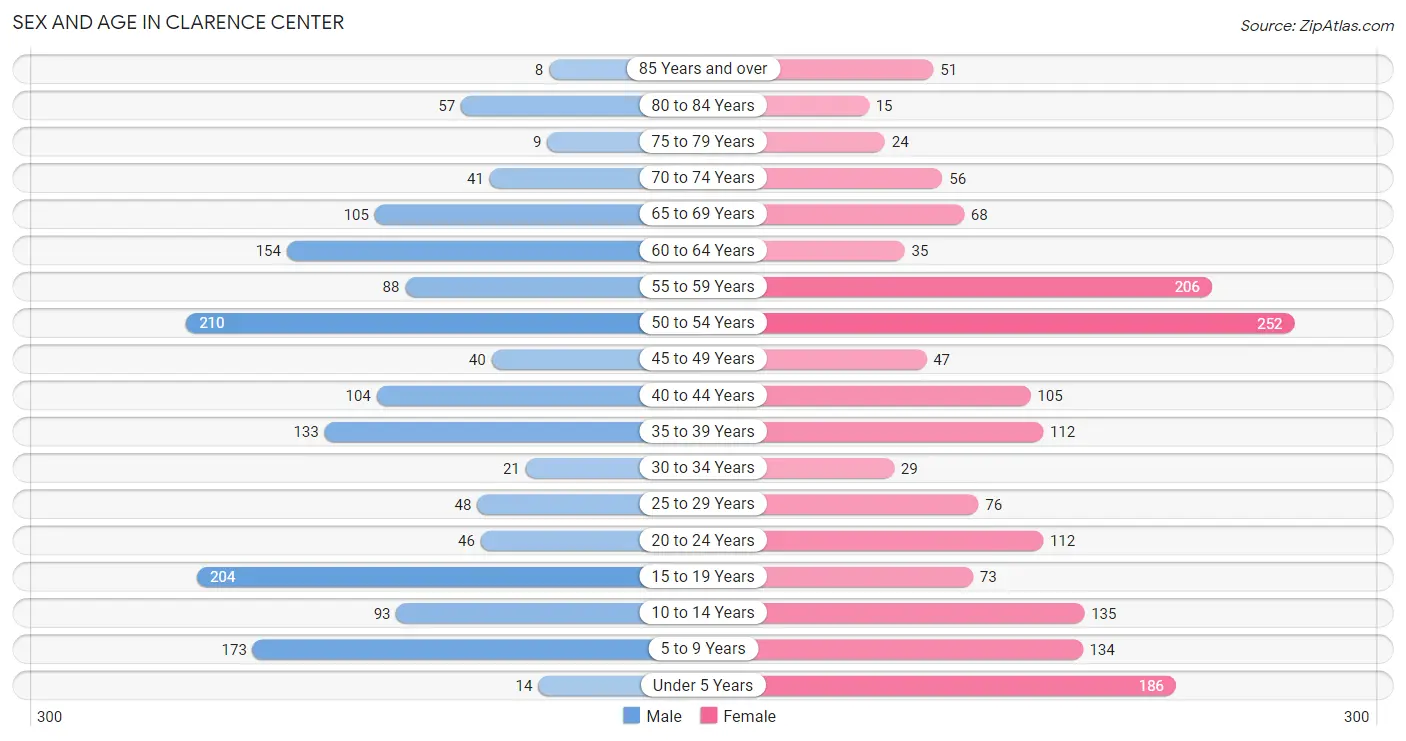
Sex and Age in Clarence Center
Sex and Age in Clarence Center
The most populous age groups in Clarence Center are 50 to 54 Years (210 | 13.6%) for men and 50 to 54 Years (252 | 14.7%) for women.
| Age Bracket | Male | Female |
| Under 5 Years | 14 (0.9%) | 186 (10.8%) |
| 5 to 9 Years | 173 (11.2%) | 134 (7.8%) |
| 10 to 14 Years | 93 (6.0%) | 135 (7.9%) |
| 15 to 19 Years | 204 (13.2%) | 73 (4.3%) |
| 20 to 24 Years | 46 (3.0%) | 112 (6.5%) |
| 25 to 29 Years | 48 (3.1%) | 76 (4.4%) |
| 30 to 34 Years | 21 (1.4%) | 29 (1.7%) |
| 35 to 39 Years | 133 (8.6%) | 112 (6.5%) |
| 40 to 44 Years | 104 (6.7%) | 105 (6.1%) |
| 45 to 49 Years | 40 (2.6%) | 47 (2.7%) |
| 50 to 54 Years | 210 (13.6%) | 252 (14.7%) |
| 55 to 59 Years | 88 (5.7%) | 206 (12.0%) |
| 60 to 64 Years | 154 (10.0%) | 35 (2.0%) |
| 65 to 69 Years | 105 (6.8%) | 68 (4.0%) |
| 70 to 74 Years | 41 (2.6%) | 56 (3.3%) |
| 75 to 79 Years | 9 (0.6%) | 24 (1.4%) |
| 80 to 84 Years | 57 (3.7%) | 15 (0.9%) |
| 85 Years and over | 8 (0.5%) | 51 (3.0%) |
| Total | 1,548 (100.0%) | 1,716 (100.0%) |
Families and Households in Clarence Center
Median Family Size in Clarence Center
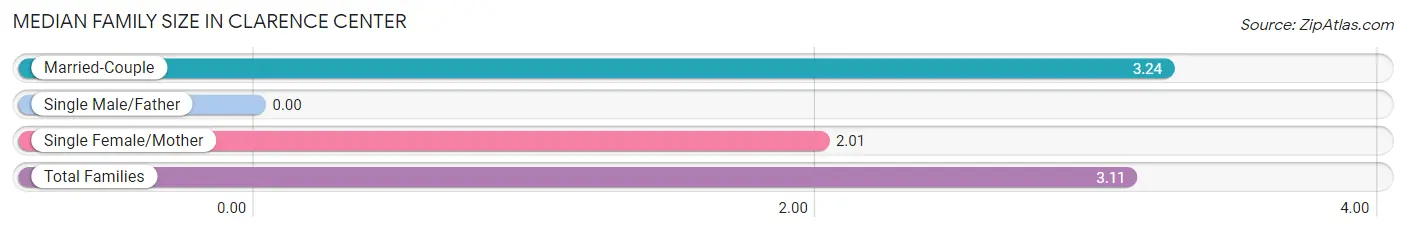
| Family Type | # Families | Family Size |
| Married-Couple | 890 (89.4%) | 3.24 |
| Single Male/Father | 0 (0.0%) | - |
| Single Female/Mother | 105 (10.5%) | 2.01 |
| Total Families | 995 (100.0%) | 3.11 |
Median Household Size in Clarence Center
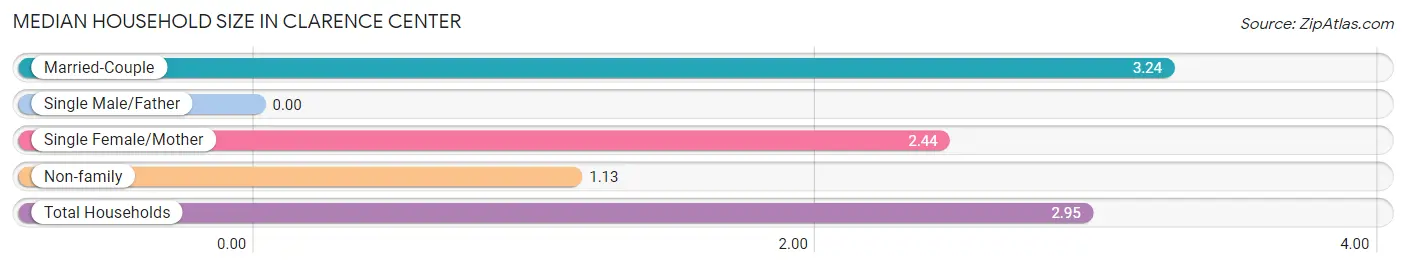
| Household Type | # Households | Household Size |
| Married-Couple | 890 (80.5%) | 3.24 |
| Single Male/Father | 0 (0.0%) | - |
| Single Female/Mother | 105 (9.5%) | 2.44 |
| Non-family | 110 (10.0%) | 1.13 |
| Total Households | 1,105 (100.0%) | 2.95 |
Household Size by Marriage Status in Clarence Center
Out of a total of 1,105 households in Clarence Center, 995 (90.0%) are family households, while 110 (10.0%) are nonfamily households. The most numerous type of family households are 2-person households, comprising 377, and the most common type of nonfamily households are 1-person households, comprising 96.
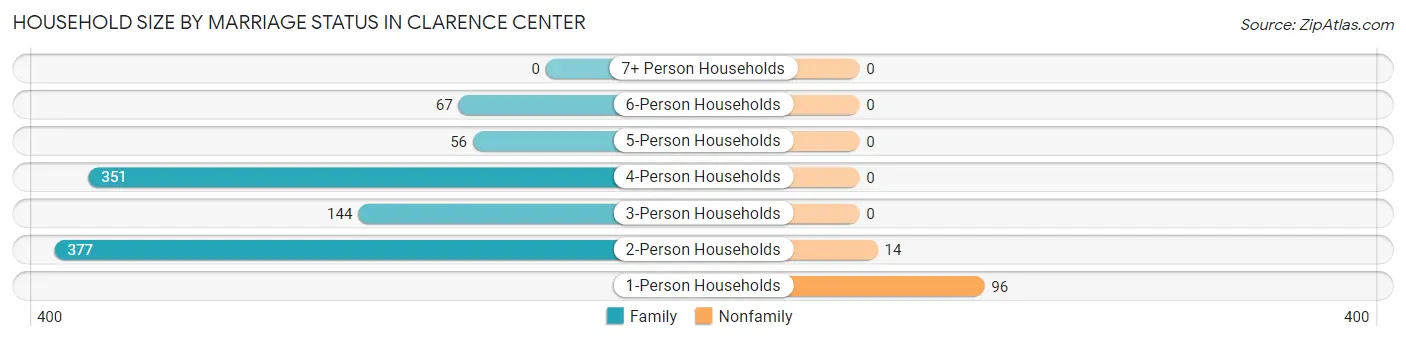
| Household Size | Family Households | Nonfamily Households |
| 1-Person Households | - | 96 (8.7%) |
| 2-Person Households | 377 (34.1%) | 14 (1.3%) |
| 3-Person Households | 144 (13.0%) | 0 (0.0%) |
| 4-Person Households | 351 (31.8%) | 0 (0.0%) |
| 5-Person Households | 56 (5.1%) | 0 (0.0%) |
| 6-Person Households | 67 (6.1%) | 0 (0.0%) |
| 7+ Person Households | 0 (0.0%) | 0 (0.0%) |
| Total | 995 (90.0%) | 110 (10.0%) |
Female Fertility in Clarence Center
Fertility by Age in Clarence Center
Average fertility rate in Clarence Center is 44.0 births per 1,000 women. Women in the age bracket of 20 to 34 years have the highest fertility rate with 134.0 births per 1,000 women. Women in the age bracket of 20 to 34 years acount for 100.0% of all women with births.
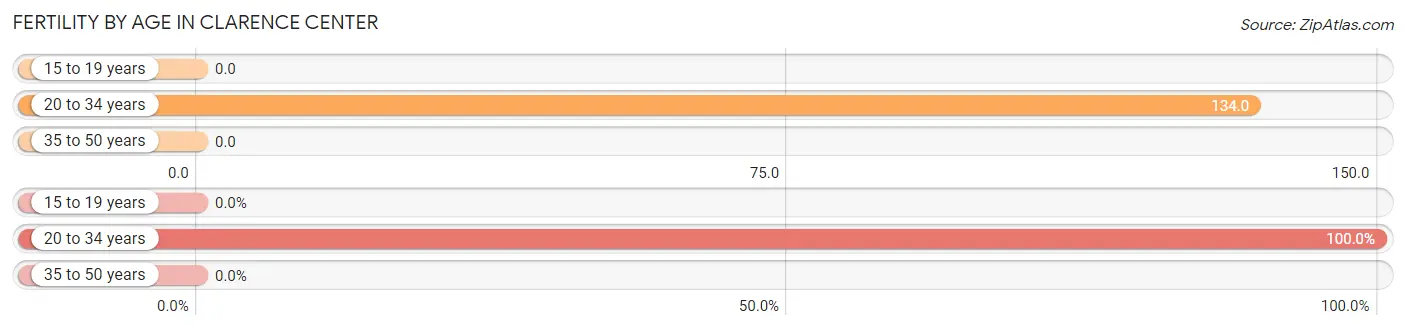
| Age Bracket | Women with Births | Births / 1,000 Women |
| 15 to 19 years | 0 (0.0%) | 0.0 |
| 20 to 34 years | 29 (100.0%) | 134.0 |
| 35 to 50 years | 0 (0.0%) | 0.0 |
| Total | 29 (100.0%) | 44.0 |
Fertility by Age by Marriage Status in Clarence Center
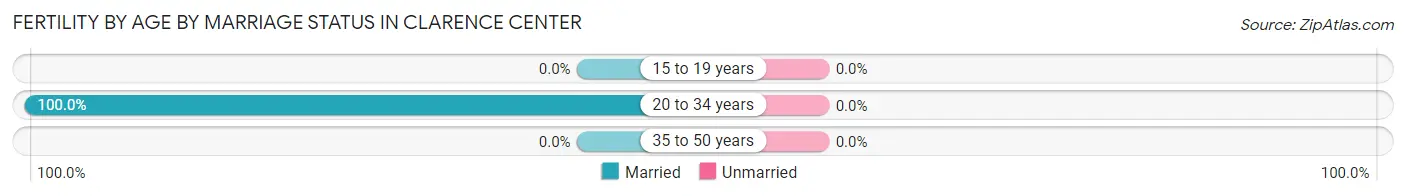
| Age Bracket | Married | Unmarried |
| 15 to 19 years | 0 (0.0%) | 0 (0.0%) |
| 20 to 34 years | 29 (100.0%) | 0 (0.0%) |
| 35 to 50 years | 0 (0.0%) | 0 (0.0%) |
| Total | 29 (100.0%) | 0 (0.0%) |
Fertility by Education in Clarence Center
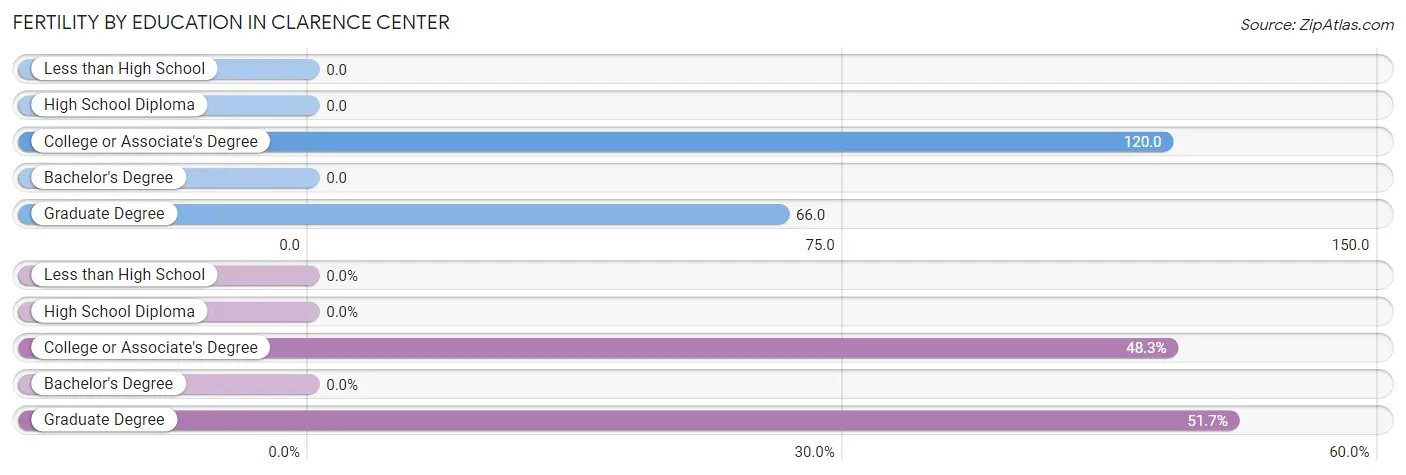
| Educational Attainment | Women with Births | Births / 1,000 Women |
| Less than High School | 0 (0.0%) | 0.0 |
| High School Diploma | 0 (0.0%) | 0.0 |
| College or Associate's Degree | 14 (48.3%) | 120.0 |
| Bachelor's Degree | 0 (0.0%) | 0.0 |
| Graduate Degree | 15 (51.7%) | 66.0 |
| Total | 29 (100.0%) | 44.0 |
Fertility by Education by Marriage Status in Clarence Center
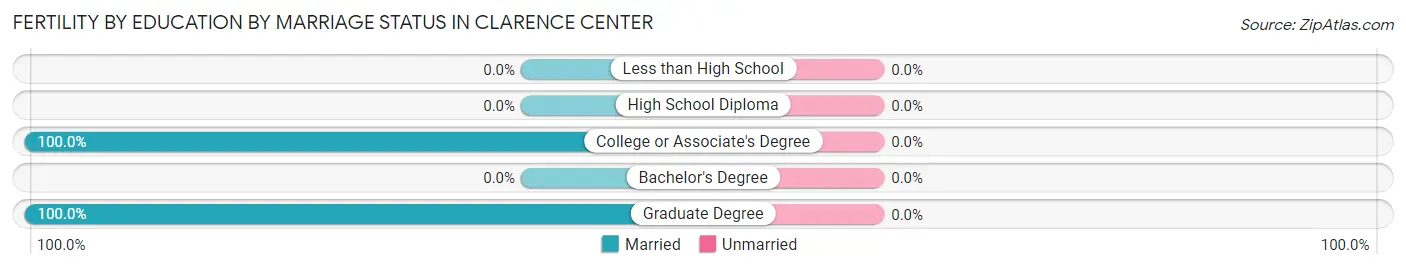
| Educational Attainment | Married | Unmarried |
| Less than High School | 0 (0.0%) | 0 (0.0%) |
| High School Diploma | 0 (0.0%) | 0 (0.0%) |
| College or Associate's Degree | 14 (100.0%) | 0 (0.0%) |
| Bachelor's Degree | 0 (0.0%) | 0 (0.0%) |
| Graduate Degree | 15 (100.0%) | 0 (0.0%) |
| Total | 29 (100.0%) | 0 (0.0%) |
Employment Characteristics in Clarence Center
Employment by Class of Employer in Clarence Center
Among the 1,581 employed individuals in Clarence Center, private company employees (852 | 53.9%), self-employed (incorporated) (245 | 15.5%), and local government employees (146 | 9.2%) make up the most common classes of employment.
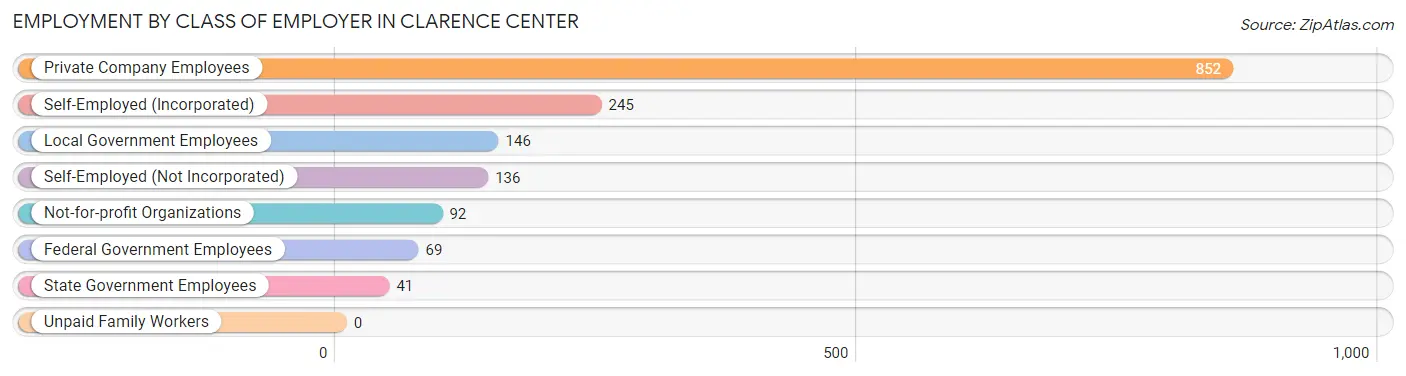
| Employer Class | # Employees | % Employees |
| Private Company Employees | 852 | 53.9% |
| Self-Employed (Incorporated) | 245 | 15.5% |
| Self-Employed (Not Incorporated) | 136 | 8.6% |
| Not-for-profit Organizations | 92 | 5.8% |
| Local Government Employees | 146 | 9.2% |
| State Government Employees | 41 | 2.6% |
| Federal Government Employees | 69 | 4.4% |
| Unpaid Family Workers | 0 | 0.0% |
| Total | 1,581 | 100.0% |
Employment Status by Age in Clarence Center
According to the labor force statistics for Clarence Center, out of the total population over 16 years of age (2,479), 67.7% or 1,678 individuals are in the labor force, with 5.8% or 97 of them unemployed. The age group with the highest labor force participation rate is 25 to 29 years, with 100.0% or 124 individuals in the labor force. Within the labor force, the 65 to 74 years age range has the highest percentage of unemployed individuals, with 25.9% or 38 of them being unemployed.
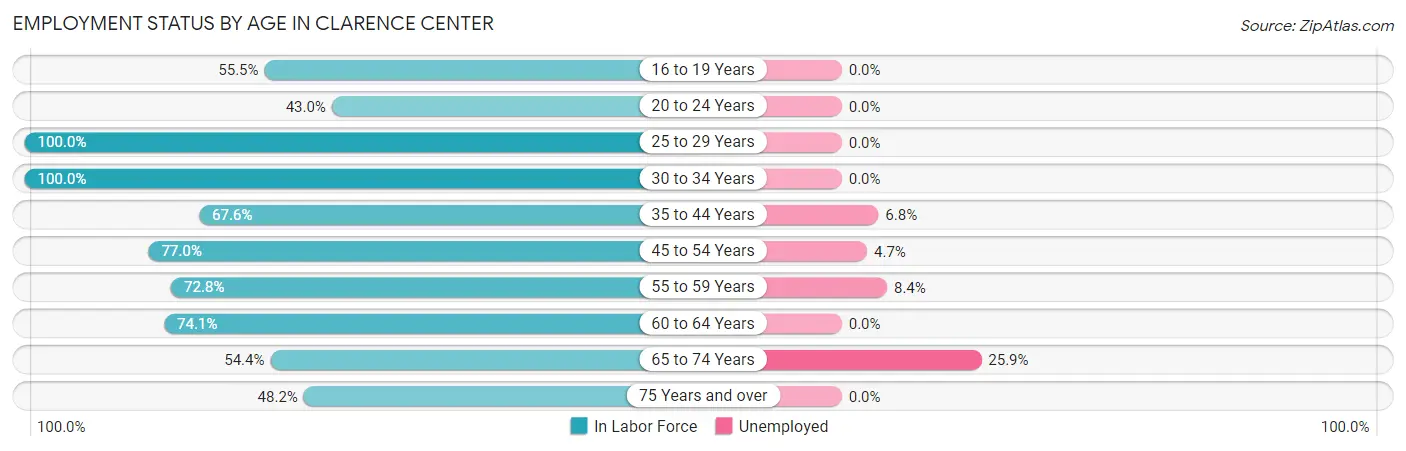
| Age Bracket | In Labor Force | Unemployed |
| 16 to 19 Years | 126 (55.5%) | 0 (0.0%) |
| 20 to 24 Years | 68 (43.0%) | 0 (0.0%) |
| 25 to 29 Years | 124 (100.0%) | 0 (0.0%) |
| 30 to 34 Years | 50 (100.0%) | 0 (0.0%) |
| 35 to 44 Years | 307 (67.6%) | 21 (6.8%) |
| 45 to 54 Years | 423 (77.0%) | 20 (4.7%) |
| 55 to 59 Years | 214 (72.8%) | 18 (8.4%) |
| 60 to 64 Years | 140 (74.1%) | 0 (0.0%) |
| 65 to 74 Years | 147 (54.4%) | 38 (25.9%) |
| 75 Years and over | 79 (48.2%) | 0 (0.0%) |
| Total | 1,678 (67.7%) | 97 (5.8%) |
Employment Status by Educational Attainment in Clarence Center
According to labor force statistics for Clarence Center, 75.8% of individuals (1,258) out of the total population between 25 and 64 years of age (1,660) are in the labor force, with 4.7% or 59 of them being unemployed. The group with the highest labor force participation rate are those with the educational attainment of bachelor's degree or higher, with 83.0% or 949 individuals in the labor force. Within the labor force, individuals with college / associate degree education have the highest percentage of unemployment, with 15.1% or 41 of them being unemployed.
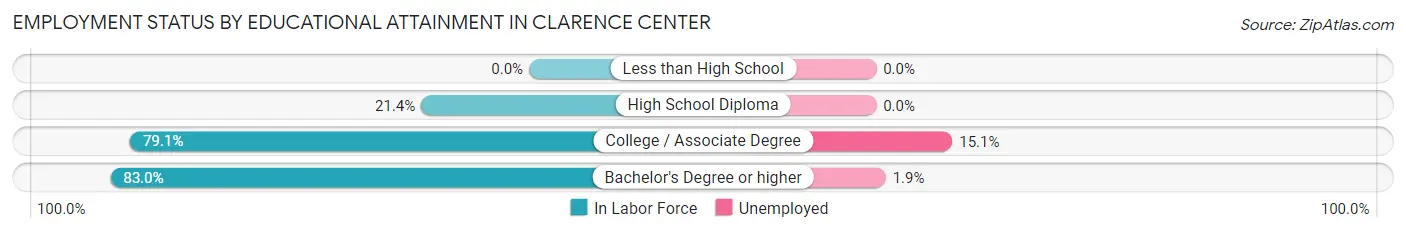
| Educational Attainment | In Labor Force | Unemployed |
| Less than High School | 0 (0.0%) | 0 (0.0%) |
| High School Diploma | 37 (21.4%) | 0 (0.0%) |
| College / Associate Degree | 272 (79.1%) | 52 (15.1%) |
| Bachelor's Degree or higher | 949 (83.0%) | 22 (1.9%) |
| Total | 1,258 (75.8%) | 78 (4.7%) |
Employment Occupations by Sex in Clarence Center
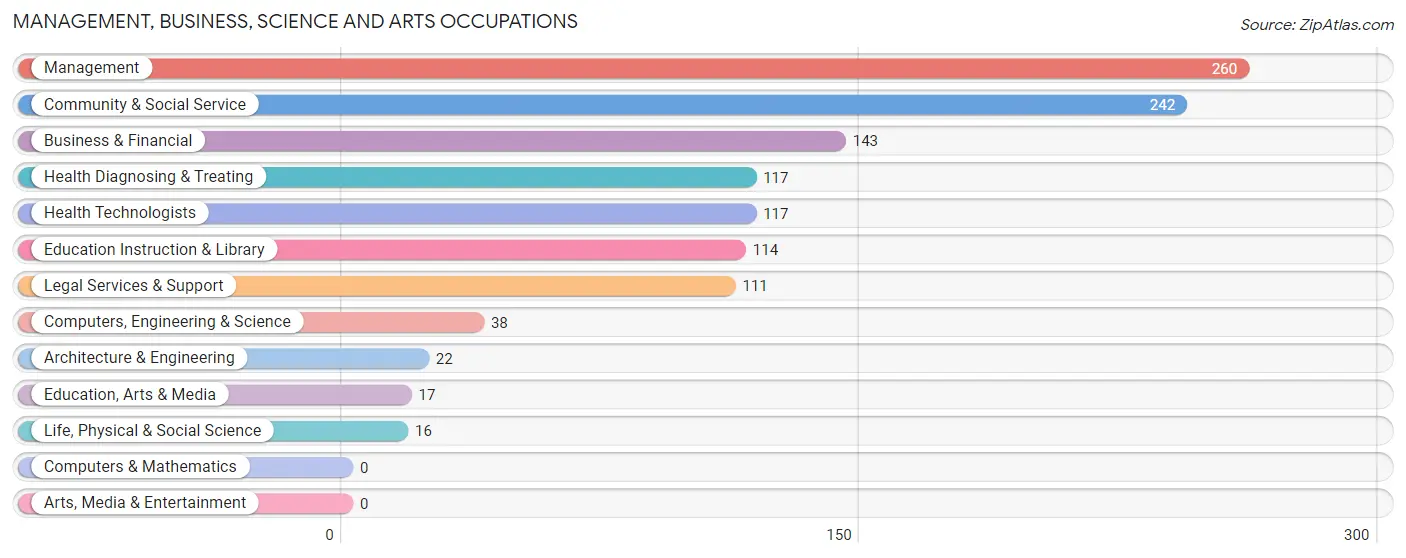
Management, Business, Science and Arts Occupations
The most common Management, Business, Science and Arts occupations in Clarence Center are Management (260 | 16.5%), Community & Social Service (242 | 15.3%), Business & Financial (143 | 9.0%), Health Diagnosing & Treating (117 | 7.4%), and Health Technologists (117 | 7.4%).
Management, Business, Science and Arts Occupations by Sex
Within the Management, Business, Science and Arts occupations in Clarence Center, the most male-oriented occupations are Computers, Engineering & Science (100.0%), Architecture & Engineering (100.0%), and Life, Physical & Social Science (100.0%), while the most female-oriented occupations are Health Diagnosing & Treating (70.9%), Health Technologists (70.9%), and Education Instruction & Library (45.6%).
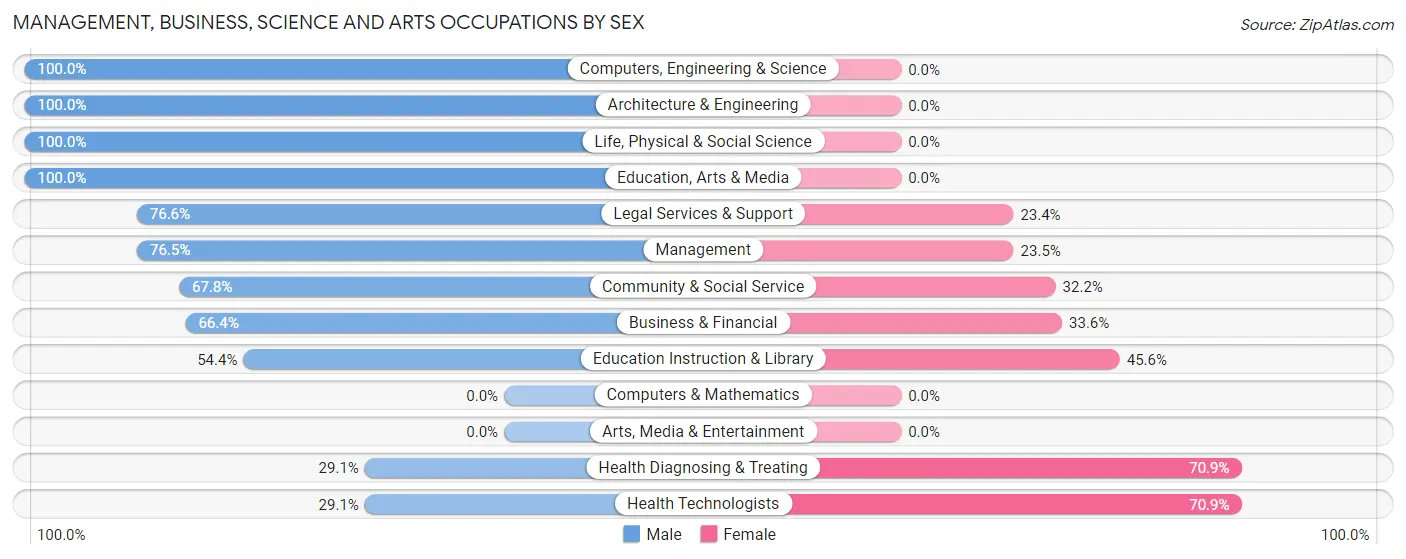
| Occupation | Male | Female |
| Management | 199 (76.5%) | 61 (23.5%) |
| Business & Financial | 95 (66.4%) | 48 (33.6%) |
| Computers, Engineering & Science | 38 (100.0%) | 0 (0.0%) |
| Computers & Mathematics | 0 (0.0%) | 0 (0.0%) |
| Architecture & Engineering | 22 (100.0%) | 0 (0.0%) |
| Life, Physical & Social Science | 16 (100.0%) | 0 (0.0%) |
| Community & Social Service | 164 (67.8%) | 78 (32.2%) |
| Education, Arts & Media | 17 (100.0%) | 0 (0.0%) |
| Legal Services & Support | 85 (76.6%) | 26 (23.4%) |
| Education Instruction & Library | 62 (54.4%) | 52 (45.6%) |
| Arts, Media & Entertainment | 0 (0.0%) | 0 (0.0%) |
| Health Diagnosing & Treating | 34 (29.1%) | 83 (70.9%) |
| Health Technologists | 34 (29.1%) | 83 (70.9%) |
| Total (Category) | 530 (66.2%) | 270 (33.8%) |
| Total (Overall) | 1,011 (63.9%) | 570 (36.0%) |
Services Occupations
The most common Services occupations in Clarence Center are Food Preparation & Serving (88 | 5.6%), Personal Care & Service (59 | 3.7%), Security & Protection (35 | 2.2%), and Firefighting & Prevention (35 | 2.2%).
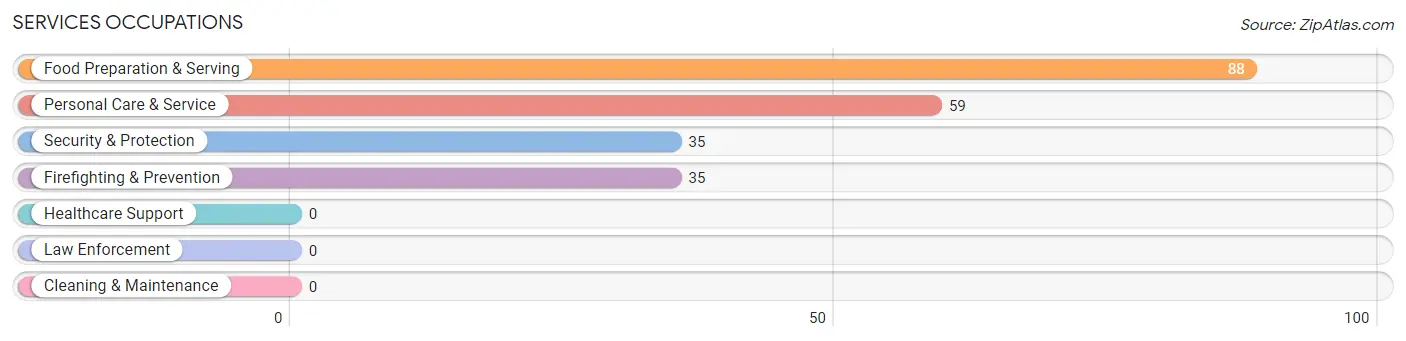
Services Occupations by Sex
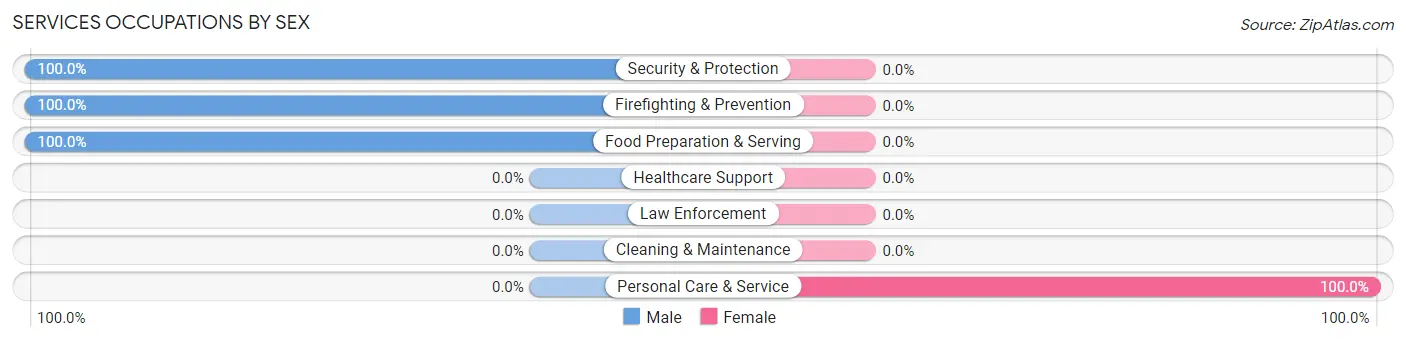
| Occupation | Male | Female |
| Healthcare Support | 0 (0.0%) | 0 (0.0%) |
| Security & Protection | 35 (100.0%) | 0 (0.0%) |
| Firefighting & Prevention | 35 (100.0%) | 0 (0.0%) |
| Law Enforcement | 0 (0.0%) | 0 (0.0%) |
| Food Preparation & Serving | 88 (100.0%) | 0 (0.0%) |
| Cleaning & Maintenance | 0 (0.0%) | 0 (0.0%) |
| Personal Care & Service | 0 (0.0%) | 59 (100.0%) |
| Total (Category) | 123 (67.6%) | 59 (32.4%) |
| Total (Overall) | 1,011 (63.9%) | 570 (36.0%) |
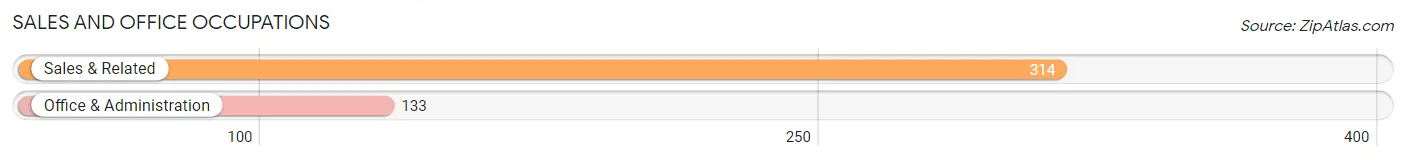
Sales and Office Occupations
The most common Sales and Office occupations in Clarence Center are Sales & Related (314 | 19.9%), and Office & Administration (133 | 8.4%).
Sales and Office Occupations by Sex
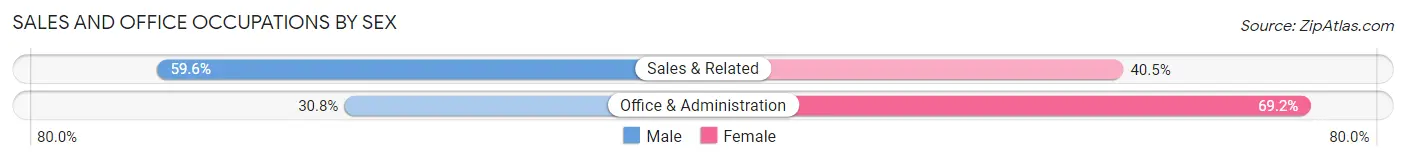
| Occupation | Male | Female |
| Sales & Related | 187 (59.6%) | 127 (40.5%) |
| Office & Administration | 41 (30.8%) | 92 (69.2%) |
| Total (Category) | 228 (51.0%) | 219 (49.0%) |
| Total (Overall) | 1,011 (63.9%) | 570 (36.0%) |
Natural Resources, Construction and Maintenance Occupations
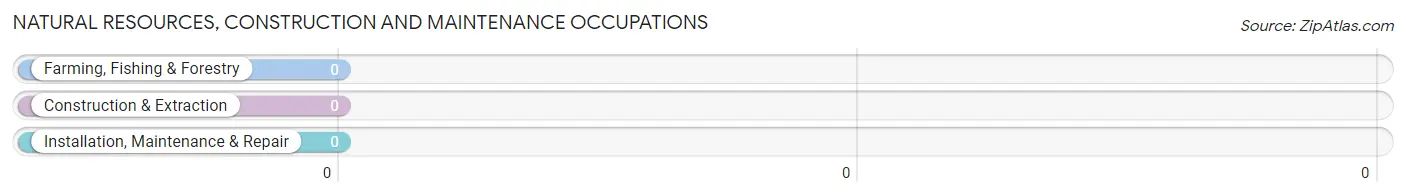
Natural Resources, Construction and Maintenance Occupations by Sex
| Occupation | Male | Female |
| Farming, Fishing & Forestry | 0 (0.0%) | 0 (0.0%) |
| Construction & Extraction | 0 (0.0%) | 0 (0.0%) |
| Installation, Maintenance & Repair | 0 (0.0%) | 0 (0.0%) |
| Total (Category) | 0 (0.0%) | 0 (0.0%) |
| Total (Overall) | 1,011 (63.9%) | 570 (36.0%) |
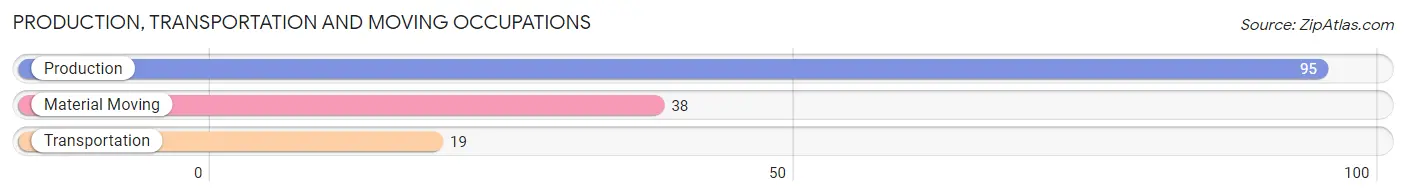
Production, Transportation and Moving Occupations
The most common Production, Transportation and Moving occupations in Clarence Center are Production (95 | 6.0%), Material Moving (38 | 2.4%), and Transportation (19 | 1.2%).
Production, Transportation and Moving Occupations by Sex
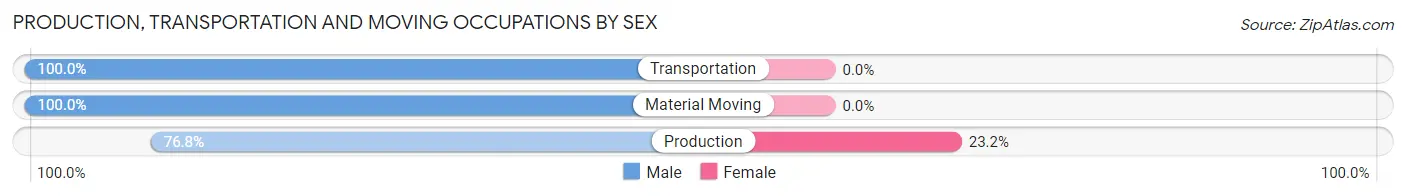
| Occupation | Male | Female |
| Production | 73 (76.8%) | 22 (23.2%) |
| Transportation | 19 (100.0%) | 0 (0.0%) |
| Material Moving | 38 (100.0%) | 0 (0.0%) |
| Total (Category) | 130 (85.5%) | 22 (14.5%) |
| Total (Overall) | 1,011 (63.9%) | 570 (36.0%) |
Employment Industries by Sex in Clarence Center
Employment Industries in Clarence Center
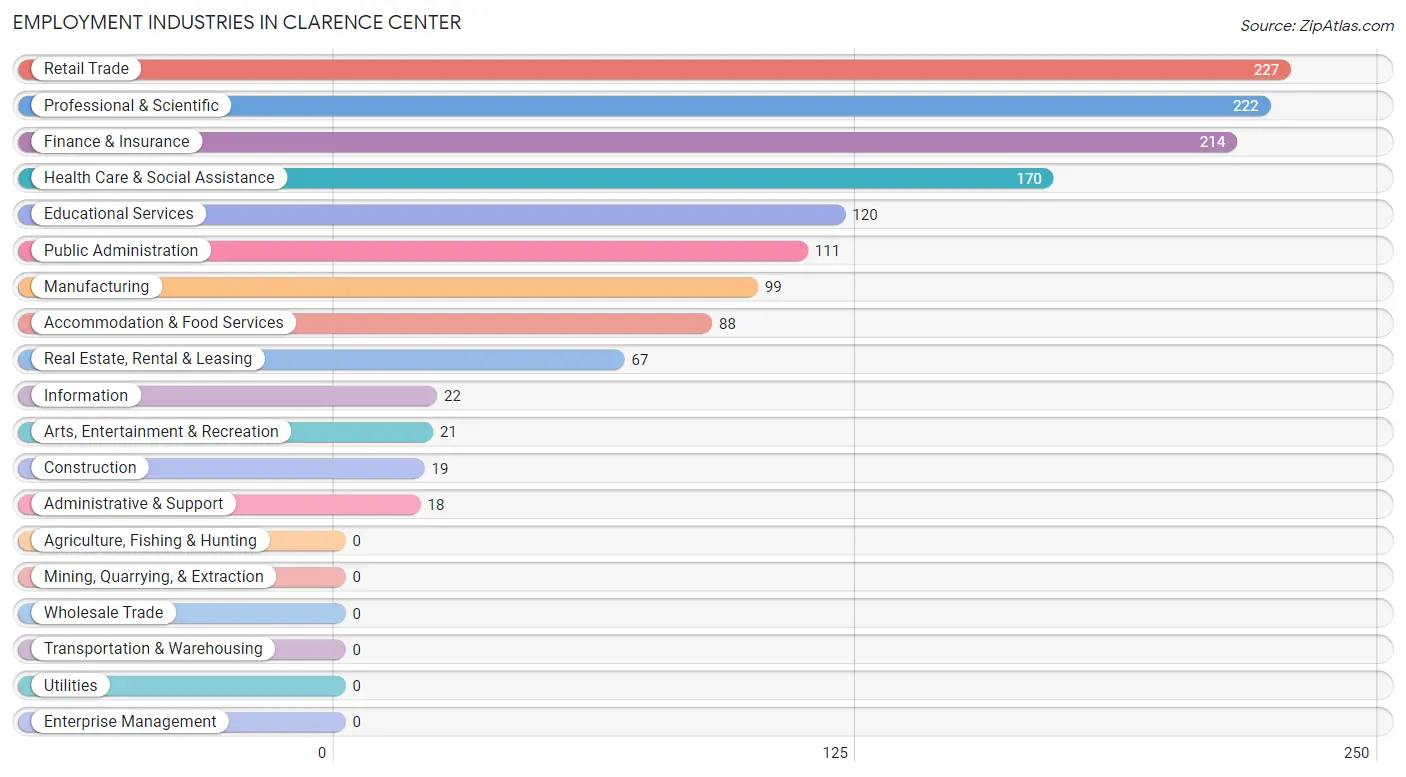
The major employment industries in Clarence Center include Retail Trade (227 | 14.4%), Professional & Scientific (222 | 14.0%), Finance & Insurance (214 | 13.5%), Health Care & Social Assistance (170 | 10.7%), and Educational Services (120 | 7.6%).
Employment Industries by Sex in Clarence Center
The Clarence Center industries that see more men than women are Construction (100.0%), Information (100.0%), and Real Estate, Rental & Leasing (100.0%), whereas the industries that tend to have a higher number of women are Administrative & Support (100.0%), Arts, Entertainment & Recreation (100.0%), and Health Care & Social Assistance (67.1%).
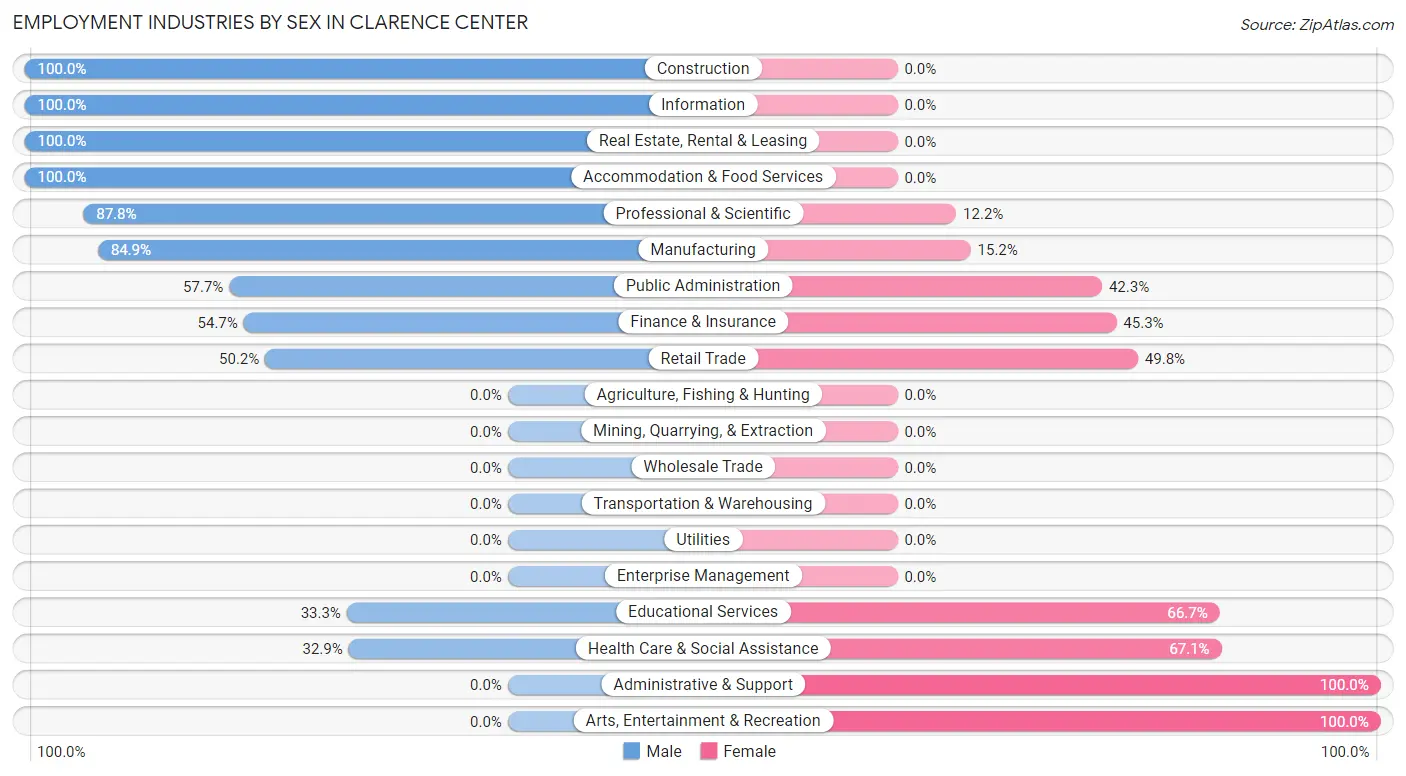
| Industry | Male | Female |
| Agriculture, Fishing & Hunting | 0 (0.0%) | 0 (0.0%) |
| Mining, Quarrying, & Extraction | 0 (0.0%) | 0 (0.0%) |
| Construction | 19 (100.0%) | 0 (0.0%) |
| Manufacturing | 84 (84.9%) | 15 (15.1%) |
| Wholesale Trade | 0 (0.0%) | 0 (0.0%) |
| Retail Trade | 114 (50.2%) | 113 (49.8%) |
| Transportation & Warehousing | 0 (0.0%) | 0 (0.0%) |
| Utilities | 0 (0.0%) | 0 (0.0%) |
| Information | 22 (100.0%) | 0 (0.0%) |
| Finance & Insurance | 117 (54.7%) | 97 (45.3%) |
| Real Estate, Rental & Leasing | 67 (100.0%) | 0 (0.0%) |
| Professional & Scientific | 195 (87.8%) | 27 (12.2%) |
| Enterprise Management | 0 (0.0%) | 0 (0.0%) |
| Administrative & Support | 0 (0.0%) | 18 (100.0%) |
| Educational Services | 40 (33.3%) | 80 (66.7%) |
| Health Care & Social Assistance | 56 (32.9%) | 114 (67.1%) |
| Arts, Entertainment & Recreation | 0 (0.0%) | 21 (100.0%) |
| Accommodation & Food Services | 88 (100.0%) | 0 (0.0%) |
| Public Administration | 64 (57.7%) | 47 (42.3%) |
| Total | 1,011 (63.9%) | 570 (36.0%) |
Education in Clarence Center
School Enrollment in Clarence Center
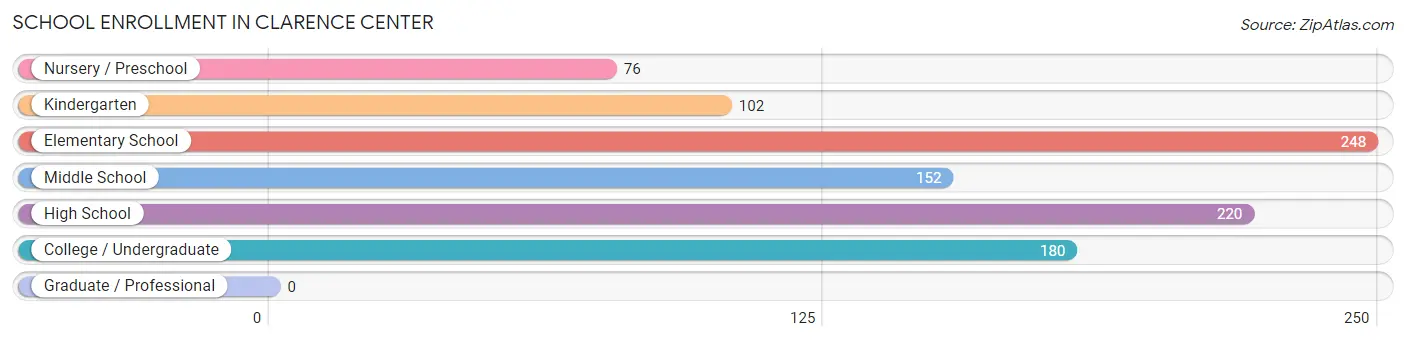
The most common levels of schooling among the 978 students in Clarence Center are elementary school (248 | 25.4%), high school (220 | 22.5%), and college / undergraduate (180 | 18.4%).
| School Level | # Students | % Students |
| Nursery / Preschool | 76 | 7.8% |
| Kindergarten | 102 | 10.4% |
| Elementary School | 248 | 25.4% |
| Middle School | 152 | 15.5% |
| High School | 220 | 22.5% |
| College / Undergraduate | 180 | 18.4% |
| Graduate / Professional | 0 | 0.0% |
| Total | 978 | 100.0% |
School Enrollment by Age by Funding Source in Clarence Center
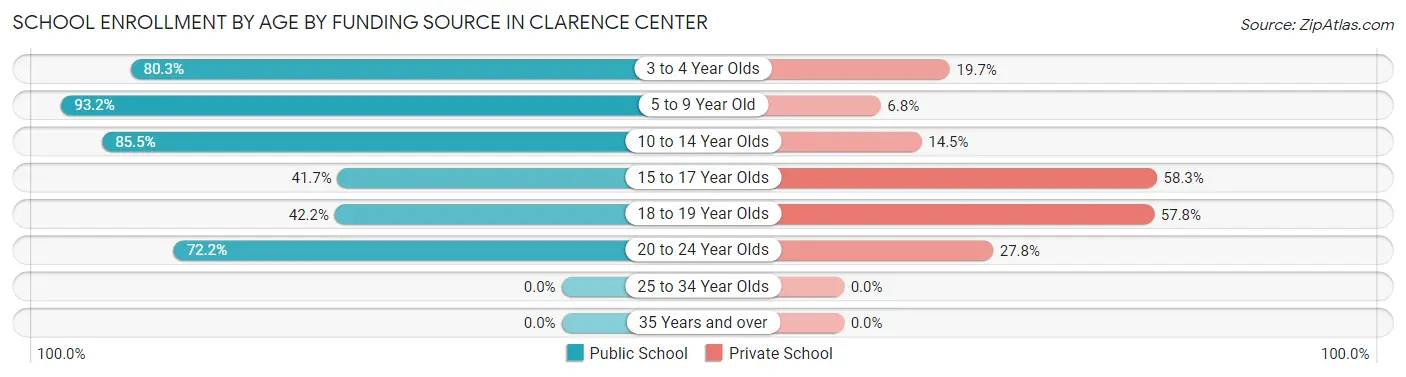
Out of a total of 978 students who are enrolled in schools in Clarence Center, 255 (26.1%) attend a private institution, while the remaining 723 (73.9%) are enrolled in public schools. The age group of 15 to 17 year olds has the highest likelihood of being enrolled in private schools, with 109 (58.3% in the age bracket) enrolled. Conversely, the age group of 5 to 9 year old has the lowest likelihood of being enrolled in a private school, with 286 (93.2% in the age bracket) attending a public institution.
| Age Bracket | Public School | Private School |
| 3 to 4 Year Olds | 61 (80.3%) | 15 (19.7%) |
| 5 to 9 Year Old | 286 (93.2%) | 21 (6.8%) |
| 10 to 14 Year Olds | 195 (85.5%) | 33 (14.5%) |
| 15 to 17 Year Olds | 78 (41.7%) | 109 (58.3%) |
| 18 to 19 Year Olds | 38 (42.2%) | 52 (57.8%) |
| 20 to 24 Year Olds | 65 (72.2%) | 25 (27.8%) |
| 25 to 34 Year Olds | 0 (0.0%) | 0 (0.0%) |
| 35 Years and over | 0 (0.0%) | 0 (0.0%) |
| Total | 723 (73.9%) | 255 (26.1%) |
Educational Attainment by Field of Study in Clarence Center
Business (521 | 35.3%), education (297 | 20.1%), science & technology (193 | 13.1%), liberal arts & history (149 | 10.1%), and engineering (103 | 7.0%) are the most common fields of study among 1,475 individuals in Clarence Center who have obtained a bachelor's degree or higher.
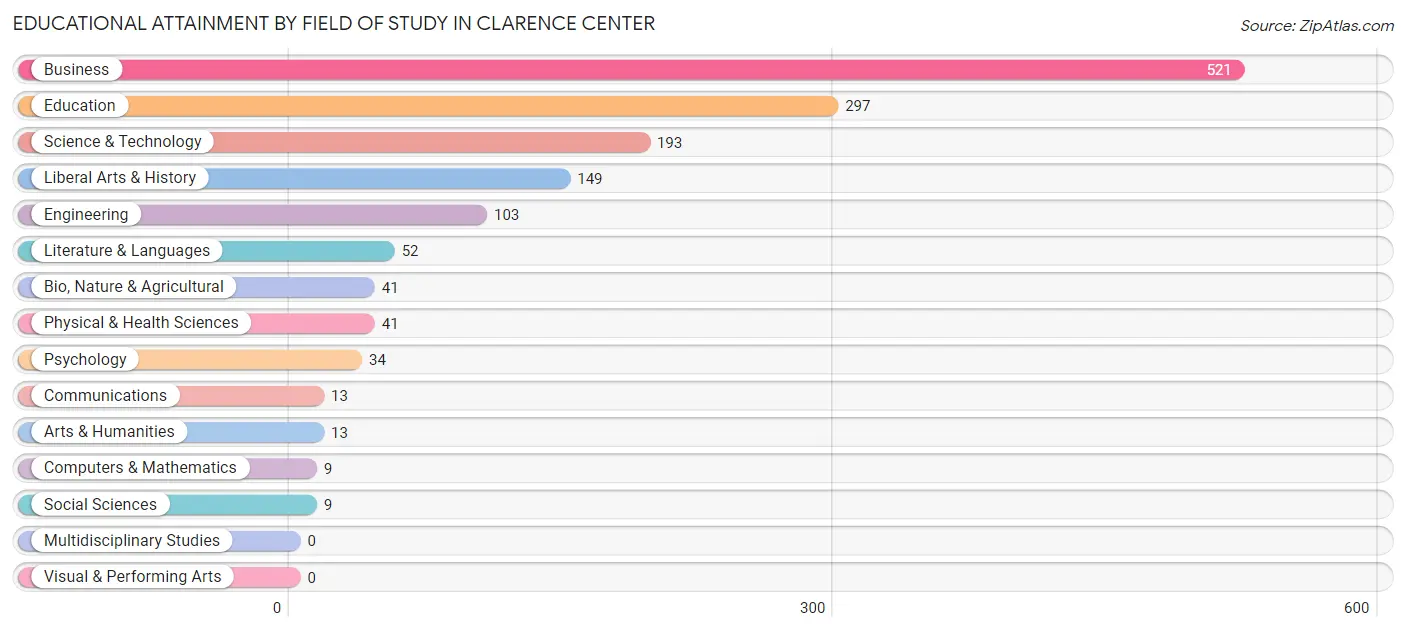
| Field of Study | # Graduates | % Graduates |
| Computers & Mathematics | 9 | 0.6% |
| Bio, Nature & Agricultural | 41 | 2.8% |
| Physical & Health Sciences | 41 | 2.8% |
| Psychology | 34 | 2.3% |
| Social Sciences | 9 | 0.6% |
| Engineering | 103 | 7.0% |
| Multidisciplinary Studies | 0 | 0.0% |
| Science & Technology | 193 | 13.1% |
| Business | 521 | 35.3% |
| Education | 297 | 20.1% |
| Literature & Languages | 52 | 3.5% |
| Liberal Arts & History | 149 | 10.1% |
| Visual & Performing Arts | 0 | 0.0% |
| Communications | 13 | 0.9% |
| Arts & Humanities | 13 | 0.9% |
| Total | 1,475 | 100.0% |
Transportation & Commute in Clarence Center
Vehicle Availability by Sex in Clarence Center
The most prevalent vehicle ownership categories in Clarence Center are males with 2 vehicles (495, accounting for 49.0%) and females with 2 vehicles (351, making up 86.8%).
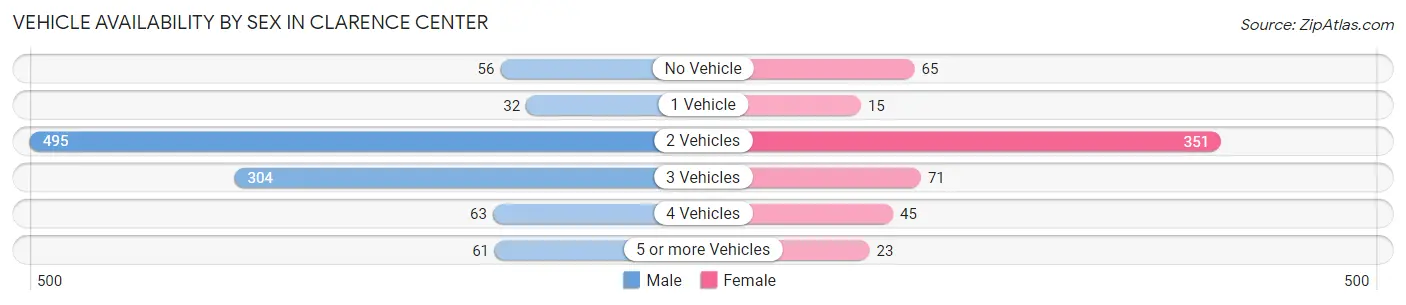
| Vehicles Available | Male | Female |
| No Vehicle | 56 (5.5%) | 65 (11.4%) |
| 1 Vehicle | 32 (3.2%) | 15 (2.6%) |
| 2 Vehicles | 495 (49.0%) | 351 (61.6%) |
| 3 Vehicles | 304 (30.1%) | 71 (12.5%) |
| 4 Vehicles | 63 (6.2%) | 45 (7.9%) |
| 5 or more Vehicles | 61 (6.0%) | 23 (4.0%) |
| Total | 1,011 (100.0%) | 570 (100.0%) |
Commute Time in Clarence Center
The most frequently occuring commute durations in Clarence Center are 5 to 9 minutes (253 commuters, 19.0%), 15 to 19 minutes (251 commuters, 18.9%), and less than 5 minutes (189 commuters, 14.2%).
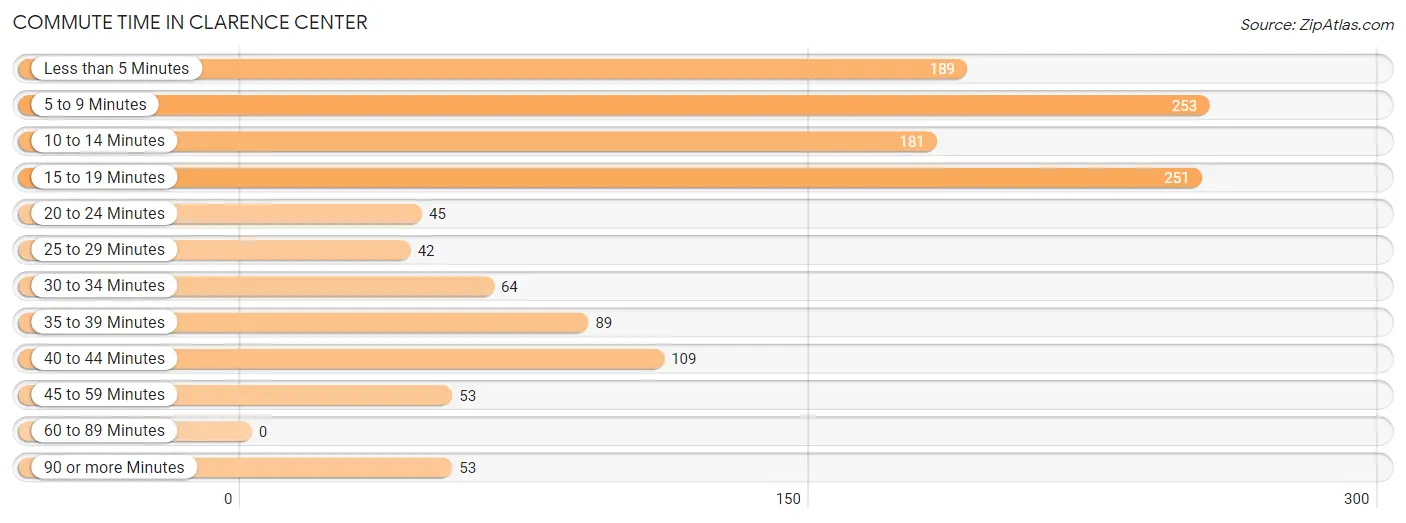
| Commute Time | # Commuters | % Commuters |
| Less than 5 Minutes | 189 | 14.2% |
| 5 to 9 Minutes | 253 | 19.0% |
| 10 to 14 Minutes | 181 | 13.6% |
| 15 to 19 Minutes | 251 | 18.9% |
| 20 to 24 Minutes | 45 | 3.4% |
| 25 to 29 Minutes | 42 | 3.2% |
| 30 to 34 Minutes | 64 | 4.8% |
| 35 to 39 Minutes | 89 | 6.7% |
| 40 to 44 Minutes | 109 | 8.2% |
| 45 to 59 Minutes | 53 | 4.0% |
| 60 to 89 Minutes | 0 | 0.0% |
| 90 or more Minutes | 53 | 4.0% |
Commute Time by Sex in Clarence Center
The most common commute times in Clarence Center are less than 5 minutes (164 commuters, 20.0%) for males and 10 to 14 minutes (129 commuters, 25.4%) for females.
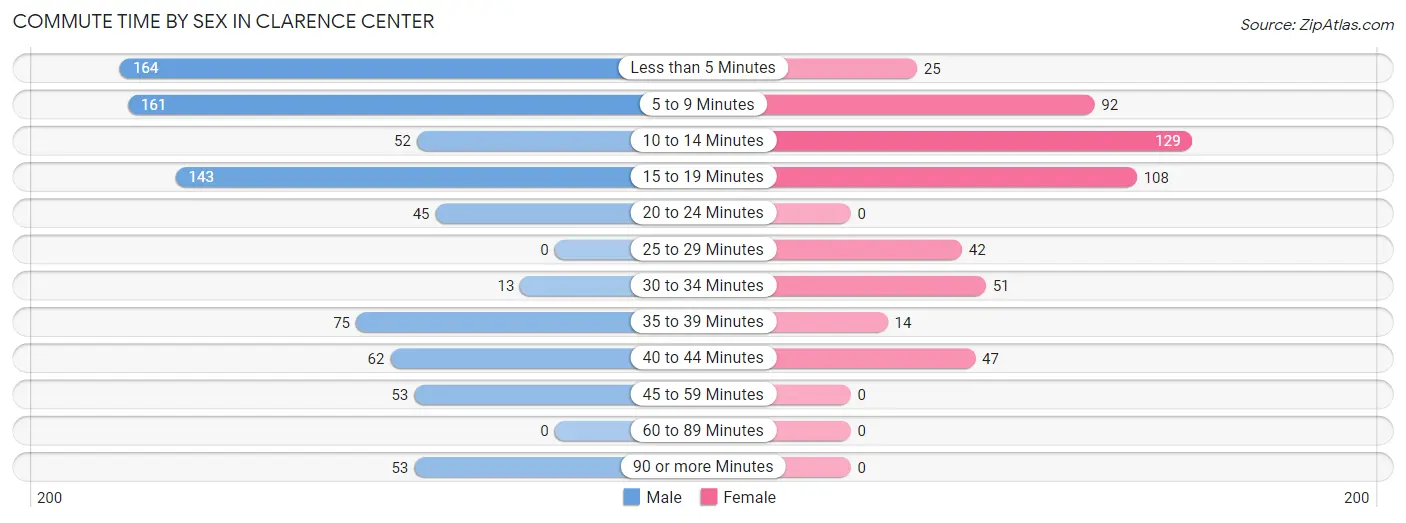
| Commute Time | Male | Female |
| Less than 5 Minutes | 164 (20.0%) | 25 (4.9%) |
| 5 to 9 Minutes | 161 (19.6%) | 92 (18.1%) |
| 10 to 14 Minutes | 52 (6.3%) | 129 (25.4%) |
| 15 to 19 Minutes | 143 (17.4%) | 108 (21.3%) |
| 20 to 24 Minutes | 45 (5.5%) | 0 (0.0%) |
| 25 to 29 Minutes | 0 (0.0%) | 42 (8.3%) |
| 30 to 34 Minutes | 13 (1.6%) | 51 (10.0%) |
| 35 to 39 Minutes | 75 (9.1%) | 14 (2.8%) |
| 40 to 44 Minutes | 62 (7.5%) | 47 (9.2%) |
| 45 to 59 Minutes | 53 (6.5%) | 0 (0.0%) |
| 60 to 89 Minutes | 0 (0.0%) | 0 (0.0%) |
| 90 or more Minutes | 53 (6.5%) | 0 (0.0%) |
Time of Departure to Work by Sex in Clarence Center
The most frequent times of departure to work in Clarence Center are 6:30 AM to 6:59 AM (322, 39.2%) for males and 9:00 AM to 9:59 AM (121, 23.8%) for females.
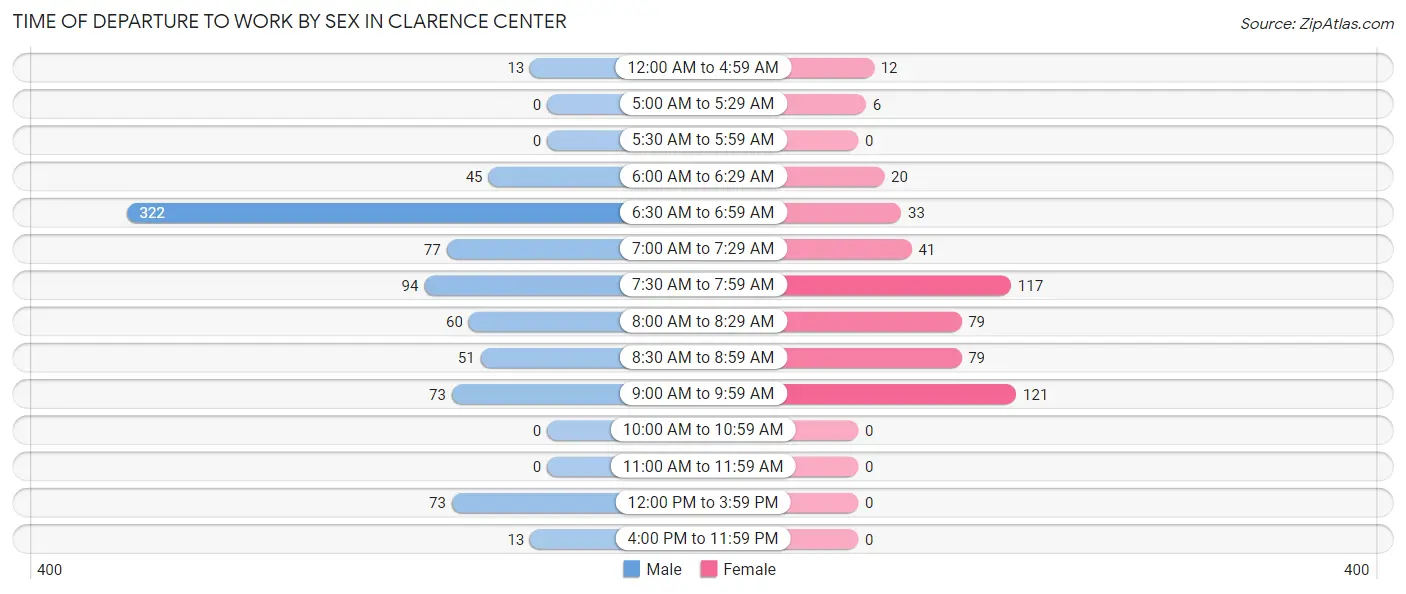
| Time of Departure | Male | Female |
| 12:00 AM to 4:59 AM | 13 (1.6%) | 12 (2.4%) |
| 5:00 AM to 5:29 AM | 0 (0.0%) | 6 (1.2%) |
| 5:30 AM to 5:59 AM | 0 (0.0%) | 0 (0.0%) |
| 6:00 AM to 6:29 AM | 45 (5.5%) | 20 (3.9%) |
| 6:30 AM to 6:59 AM | 322 (39.2%) | 33 (6.5%) |
| 7:00 AM to 7:29 AM | 77 (9.4%) | 41 (8.1%) |
| 7:30 AM to 7:59 AM | 94 (11.5%) | 117 (23.0%) |
| 8:00 AM to 8:29 AM | 60 (7.3%) | 79 (15.5%) |
| 8:30 AM to 8:59 AM | 51 (6.2%) | 79 (15.5%) |
| 9:00 AM to 9:59 AM | 73 (8.9%) | 121 (23.8%) |
| 10:00 AM to 10:59 AM | 0 (0.0%) | 0 (0.0%) |
| 11:00 AM to 11:59 AM | 0 (0.0%) | 0 (0.0%) |
| 12:00 PM to 3:59 PM | 73 (8.9%) | 0 (0.0%) |
| 4:00 PM to 11:59 PM | 13 (1.6%) | 0 (0.0%) |
| Total | 821 (100.0%) | 508 (100.0%) |
Housing Occupancy in Clarence Center
Occupancy by Ownership in Clarence Center
Of the total 1,105 dwellings in Clarence Center, owner-occupied units account for 1,029 (93.1%), while renter-occupied units make up 76 (6.9%).
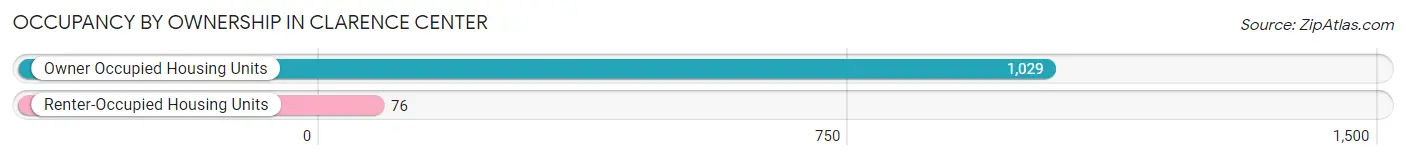
| Occupancy | # Housing Units | % Housing Units |
| Owner Occupied Housing Units | 1,029 | 93.1% |
| Renter-Occupied Housing Units | 76 | 6.9% |
| Total Occupied Housing Units | 1,105 | 100.0% |
Occupancy by Household Size in Clarence Center
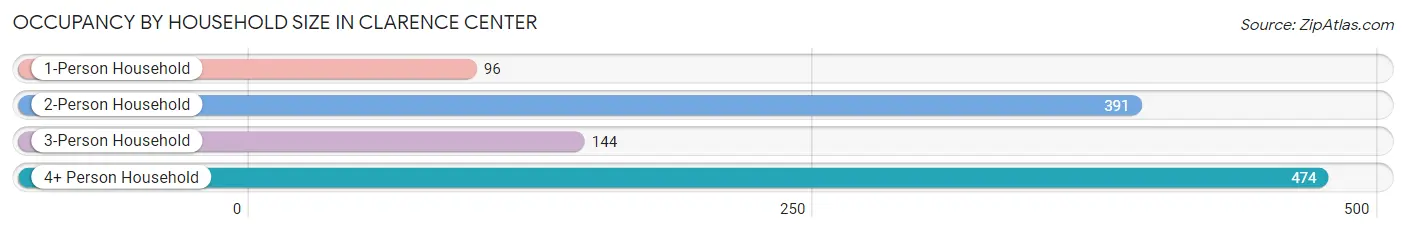
| Household Size | # Housing Units | % Housing Units |
| 1-Person Household | 96 | 8.7% |
| 2-Person Household | 391 | 35.4% |
| 3-Person Household | 144 | 13.0% |
| 4+ Person Household | 474 | 42.9% |
| Total Housing Units | 1,105 | 100.0% |
Occupancy by Ownership by Household Size in Clarence Center
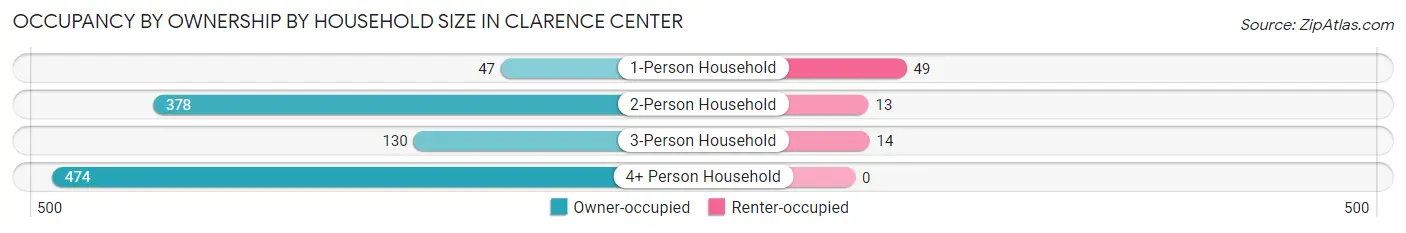
| Household Size | Owner-occupied | Renter-occupied |
| 1-Person Household | 47 (49.0%) | 49 (51.0%) |
| 2-Person Household | 378 (96.7%) | 13 (3.3%) |
| 3-Person Household | 130 (90.3%) | 14 (9.7%) |
| 4+ Person Household | 474 (100.0%) | 0 (0.0%) |
| Total Housing Units | 1,029 (93.1%) | 76 (6.9%) |
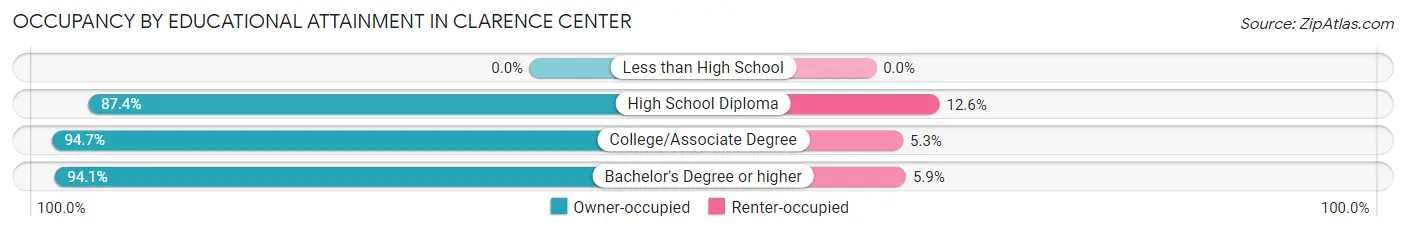
Occupancy by Educational Attainment in Clarence Center
| Household Size | Owner-occupied | Renter-occupied |
| Less than High School | 0 (0.0%) | 0 (0.0%) |
| High School Diploma | 160 (87.4%) | 23 (12.6%) |
| College/Associate Degree | 248 (94.7%) | 14 (5.3%) |
| Bachelor's Degree or higher | 621 (94.1%) | 39 (5.9%) |
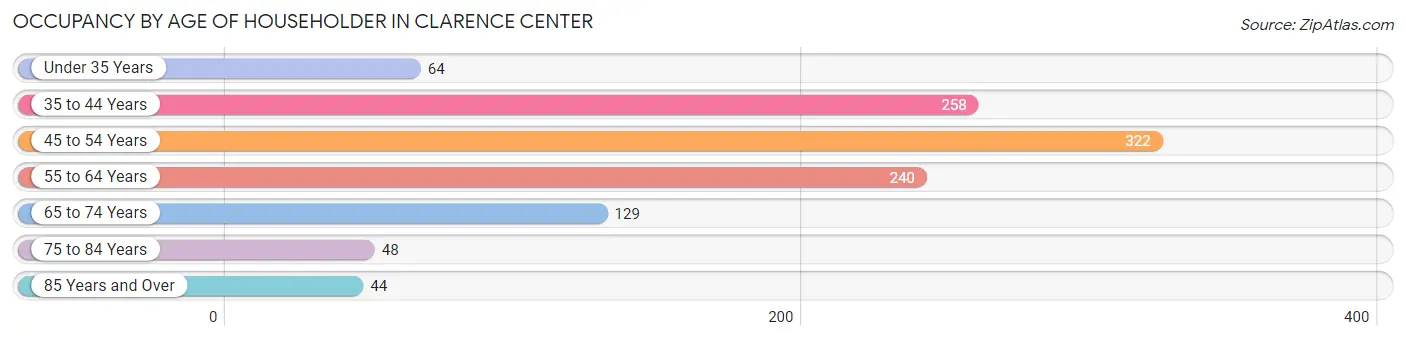
Occupancy by Age of Householder in Clarence Center
| Age Bracket | # Households | % Households |
| Under 35 Years | 64 | 5.8% |
| 35 to 44 Years | 258 | 23.4% |
| 45 to 54 Years | 322 | 29.1% |
| 55 to 64 Years | 240 | 21.7% |
| 65 to 74 Years | 129 | 11.7% |
| 75 to 84 Years | 48 | 4.3% |
| 85 Years and Over | 44 | 4.0% |
| Total | 1,105 | 100.0% |
Housing Finances in Clarence Center
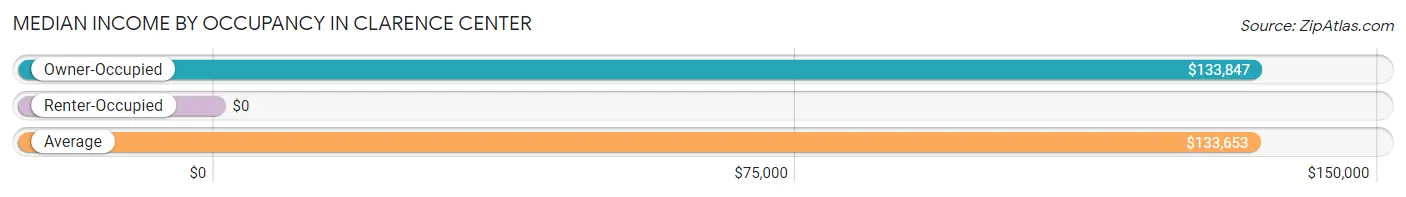
Median Income by Occupancy in Clarence Center
| Occupancy Type | # Households | Median Income |
| Owner-Occupied | 1,029 (93.1%) | $133,847 |
| Renter-Occupied | 76 (6.9%) | $0 |
| Average | 1,105 (100.0%) | $133,653 |
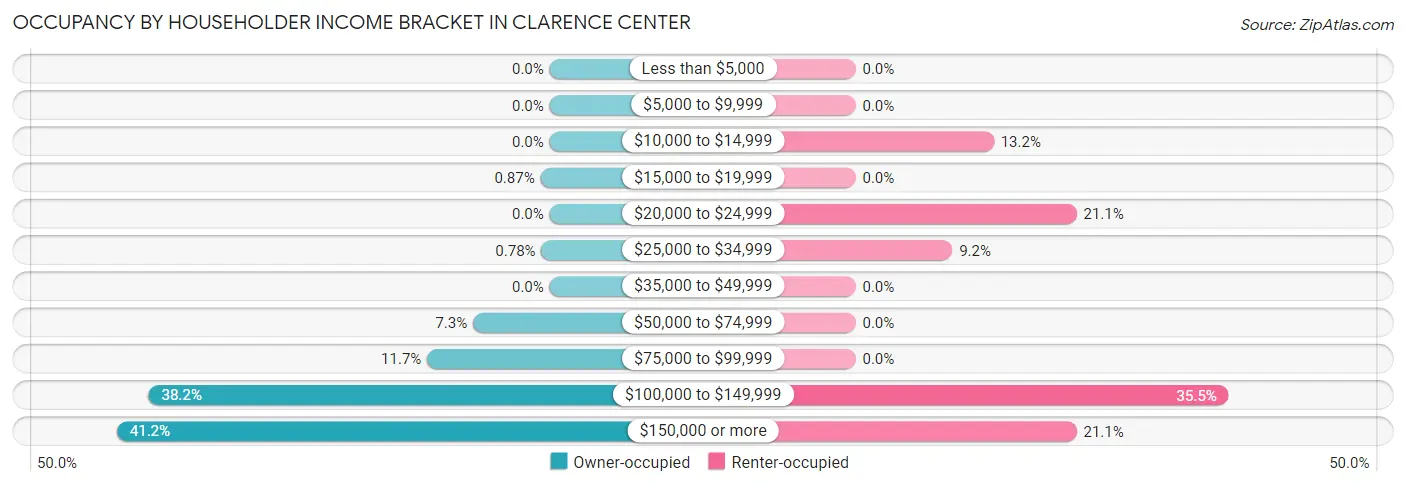
Occupancy by Householder Income Bracket in Clarence Center
| Income Bracket | Owner-occupied | Renter-occupied |
| Less than $5,000 | 0 (0.0%) | 0 (0.0%) |
| $5,000 to $9,999 | 0 (0.0%) | 0 (0.0%) |
| $10,000 to $14,999 | 0 (0.0%) | 10 (13.2%) |
| $15,000 to $19,999 | 9 (0.9%) | 0 (0.0%) |
| $20,000 to $24,999 | 0 (0.0%) | 16 (21.0%) |
| $25,000 to $34,999 | 8 (0.8%) | 7 (9.2%) |
| $35,000 to $49,999 | 0 (0.0%) | 0 (0.0%) |
| $50,000 to $74,999 | 75 (7.3%) | 0 (0.0%) |
| $75,000 to $99,999 | 120 (11.7%) | 0 (0.0%) |
| $100,000 to $149,999 | 393 (38.2%) | 27 (35.5%) |
| $150,000 or more | 424 (41.2%) | 16 (21.0%) |
| Total | 1,029 (100.0%) | 76 (100.0%) |
Monthly Housing Cost Tiers in Clarence Center
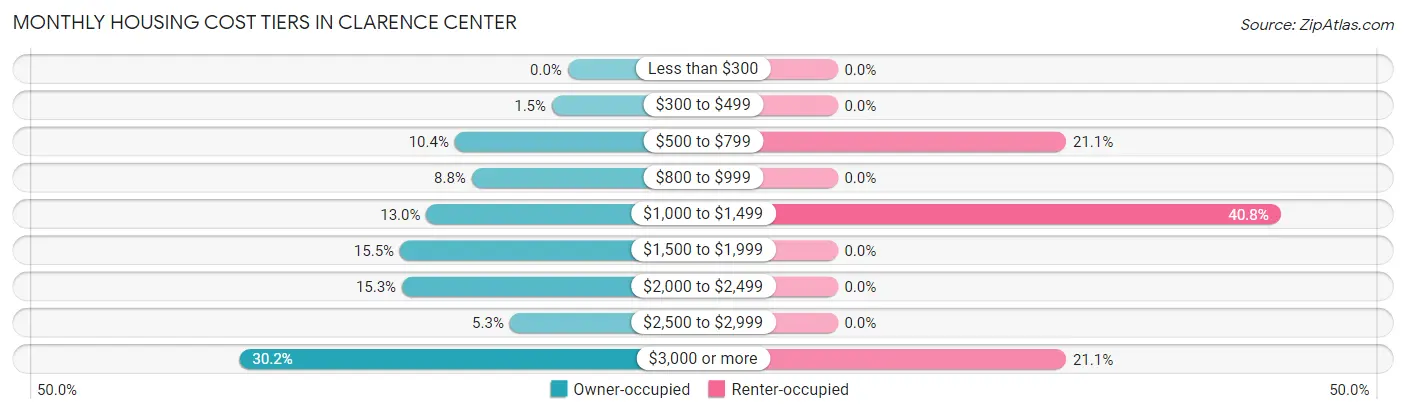
| Monthly Cost | Owner-occupied | Renter-occupied |
| Less than $300 | 0 (0.0%) | 0 (0.0%) |
| $300 to $499 | 15 (1.5%) | 0 (0.0%) |
| $500 to $799 | 107 (10.4%) | 16 (21.0%) |
| $800 to $999 | 91 (8.8%) | 0 (0.0%) |
| $1,000 to $1,499 | 134 (13.0%) | 31 (40.8%) |
| $1,500 to $1,999 | 159 (15.4%) | 0 (0.0%) |
| $2,000 to $2,499 | 157 (15.3%) | 0 (0.0%) |
| $2,500 to $2,999 | 55 (5.3%) | 0 (0.0%) |
| $3,000 or more | 311 (30.2%) | 16 (21.0%) |
| Total | 1,029 (100.0%) | 76 (100.0%) |
Physical Housing Characteristics in Clarence Center
Housing Structures in Clarence Center
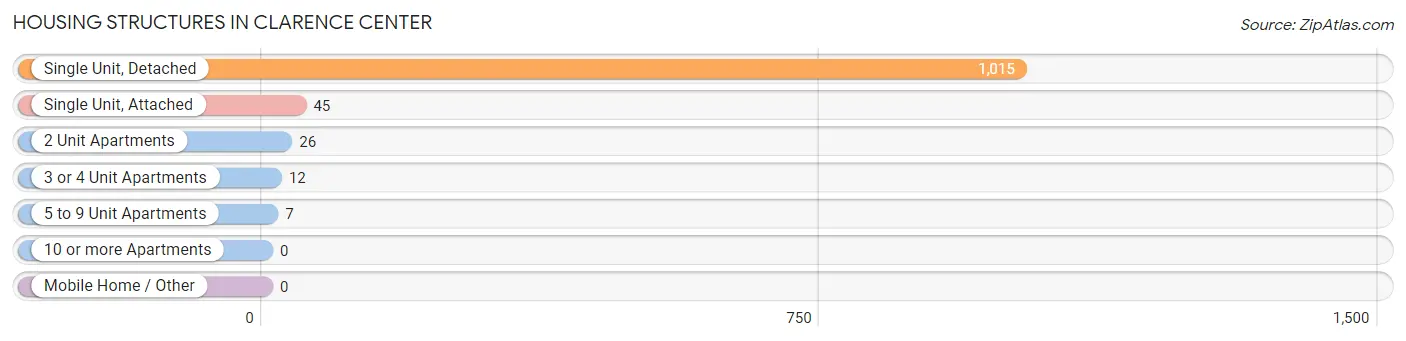
| Structure Type | # Housing Units | % Housing Units |
| Single Unit, Detached | 1,015 | 91.9% |
| Single Unit, Attached | 45 | 4.1% |
| 2 Unit Apartments | 26 | 2.4% |
| 3 or 4 Unit Apartments | 12 | 1.1% |
| 5 to 9 Unit Apartments | 7 | 0.6% |
| 10 or more Apartments | 0 | 0.0% |
| Mobile Home / Other | 0 | 0.0% |
| Total | 1,105 | 100.0% |
Housing Structures by Occupancy in Clarence Center
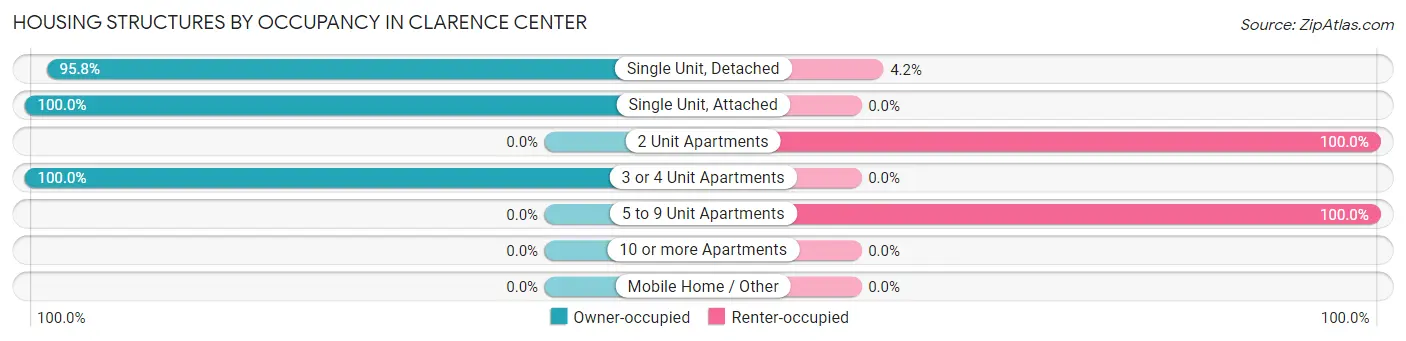
| Structure Type | Owner-occupied | Renter-occupied |
| Single Unit, Detached | 972 (95.8%) | 43 (4.2%) |
| Single Unit, Attached | 45 (100.0%) | 0 (0.0%) |
| 2 Unit Apartments | 0 (0.0%) | 26 (100.0%) |
| 3 or 4 Unit Apartments | 12 (100.0%) | 0 (0.0%) |
| 5 to 9 Unit Apartments | 0 (0.0%) | 7 (100.0%) |
| 10 or more Apartments | 0 (0.0%) | 0 (0.0%) |
| Mobile Home / Other | 0 (0.0%) | 0 (0.0%) |
| Total | 1,029 (93.1%) | 76 (6.9%) |
Housing Structures by Number of Rooms in Clarence Center
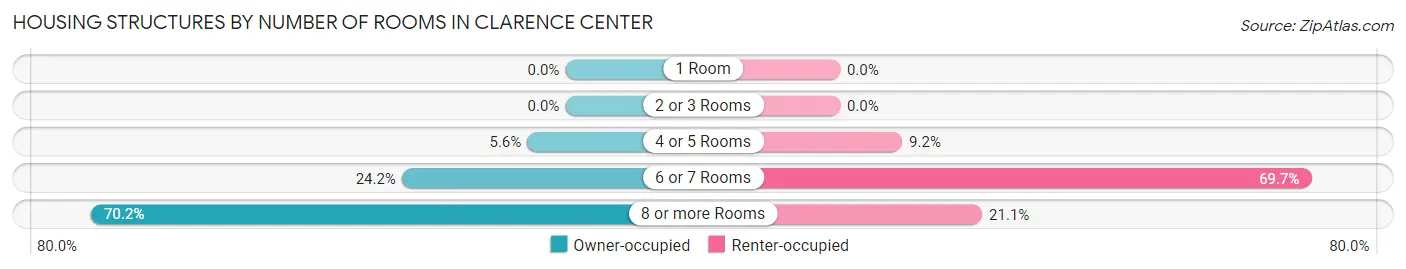
| Number of Rooms | Owner-occupied | Renter-occupied |
| 1 Room | 0 (0.0%) | 0 (0.0%) |
| 2 or 3 Rooms | 0 (0.0%) | 0 (0.0%) |
| 4 or 5 Rooms | 58 (5.6%) | 7 (9.2%) |
| 6 or 7 Rooms | 249 (24.2%) | 53 (69.7%) |
| 8 or more Rooms | 722 (70.2%) | 16 (21.0%) |
| Total | 1,029 (100.0%) | 76 (100.0%) |
Housing Structure by Heating Type in Clarence Center
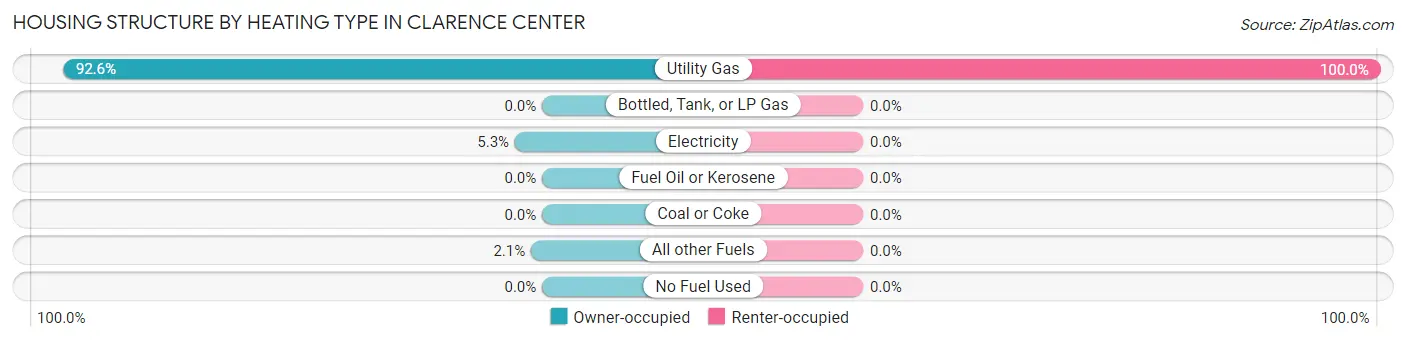
| Heating Type | Owner-occupied | Renter-occupied |
| Utility Gas | 953 (92.6%) | 76 (100.0%) |
| Bottled, Tank, or LP Gas | 0 (0.0%) | 0 (0.0%) |
| Electricity | 54 (5.2%) | 0 (0.0%) |
| Fuel Oil or Kerosene | 0 (0.0%) | 0 (0.0%) |
| Coal or Coke | 0 (0.0%) | 0 (0.0%) |
| All other Fuels | 22 (2.1%) | 0 (0.0%) |
| No Fuel Used | 0 (0.0%) | 0 (0.0%) |
| Total | 1,029 (100.0%) | 76 (100.0%) |
Household Vehicle Usage in Clarence Center
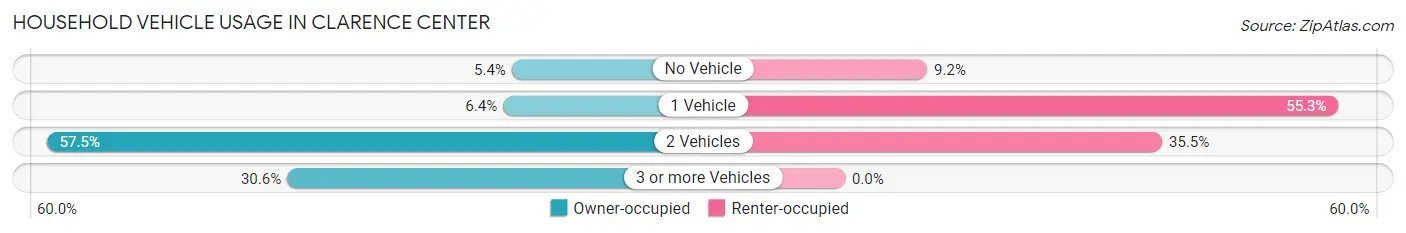
| Vehicles per Household | Owner-occupied | Renter-occupied |
| No Vehicle | 56 (5.4%) | 7 (9.2%) |
| 1 Vehicle | 66 (6.4%) | 42 (55.3%) |
| 2 Vehicles | 592 (57.5%) | 27 (35.5%) |
| 3 or more Vehicles | 315 (30.6%) | 0 (0.0%) |
| Total | 1,029 (100.0%) | 76 (100.0%) |
Real Estate & Mortgages in Clarence Center
Real Estate and Mortgage Overview in Clarence Center
| Characteristic | Without Mortgage | With Mortgage |
| Housing Units | 295 | 734 |
| Median Property Value | $367,900 | $439,300 |
| Median Household Income | $117,171 | $308 |
| Monthly Housing Costs | $928 | $311 |
| Real Estate Taxes | $6,169 | $0 |
Property Value by Mortgage Status in Clarence Center
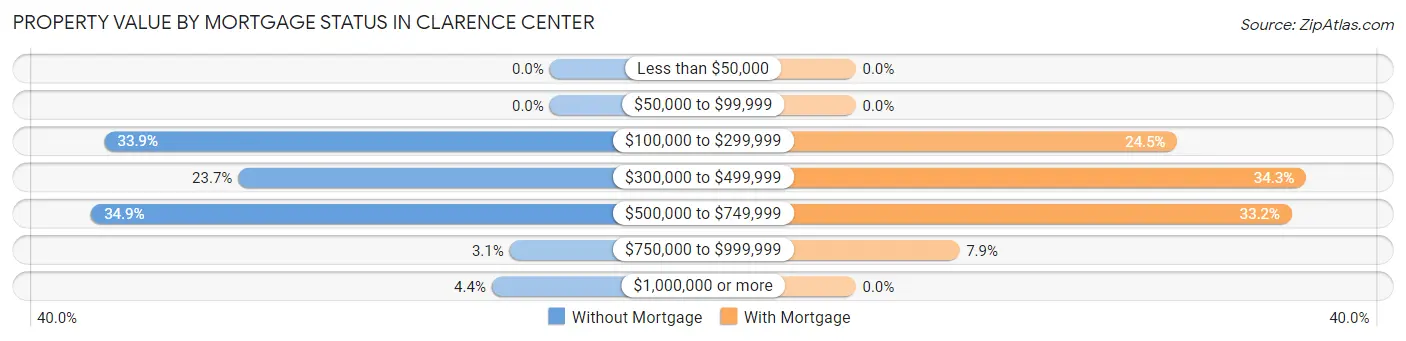
| Property Value | Without Mortgage | With Mortgage |
| Less than $50,000 | 0 (0.0%) | 0 (0.0%) |
| $50,000 to $99,999 | 0 (0.0%) | 0 (0.0%) |
| $100,000 to $299,999 | 100 (33.9%) | 180 (24.5%) |
| $300,000 to $499,999 | 70 (23.7%) | 252 (34.3%) |
| $500,000 to $749,999 | 103 (34.9%) | 244 (33.2%) |
| $750,000 to $999,999 | 9 (3.0%) | 58 (7.9%) |
| $1,000,000 or more | 13 (4.4%) | 0 (0.0%) |
| Total | 295 (100.0%) | 734 (100.0%) |
Household Income by Mortgage Status in Clarence Center
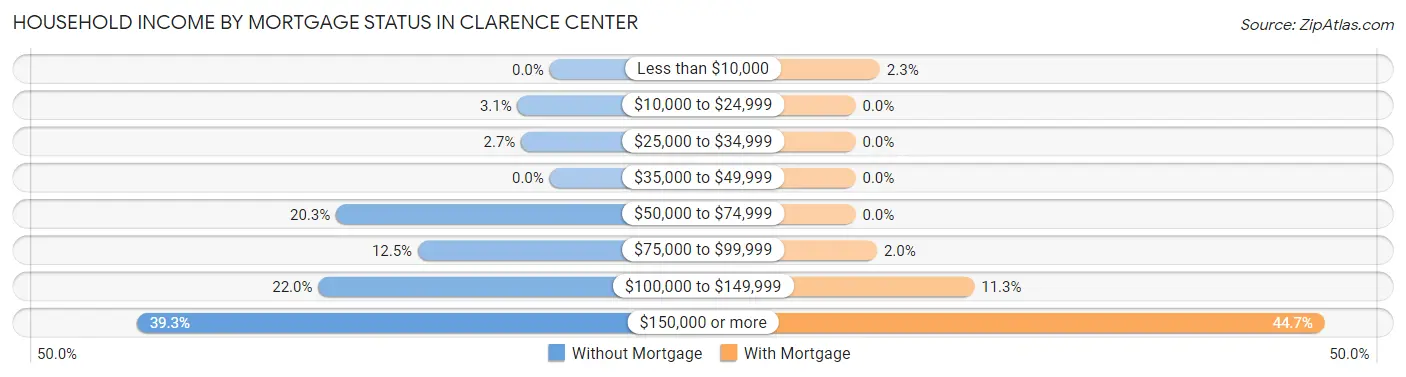
| Household Income | Without Mortgage | With Mortgage |
| Less than $10,000 | 0 (0.0%) | 17 (2.3%) |
| $10,000 to $24,999 | 9 (3.0%) | 0 (0.0%) |
| $25,000 to $34,999 | 8 (2.7%) | 0 (0.0%) |
| $35,000 to $49,999 | 0 (0.0%) | 0 (0.0%) |
| $50,000 to $74,999 | 60 (20.3%) | 0 (0.0%) |
| $75,000 to $99,999 | 37 (12.5%) | 15 (2.0%) |
| $100,000 to $149,999 | 65 (22.0%) | 83 (11.3%) |
| $150,000 or more | 116 (39.3%) | 328 (44.7%) |
| Total | 295 (100.0%) | 734 (100.0%) |
Property Value to Household Income Ratio in Clarence Center
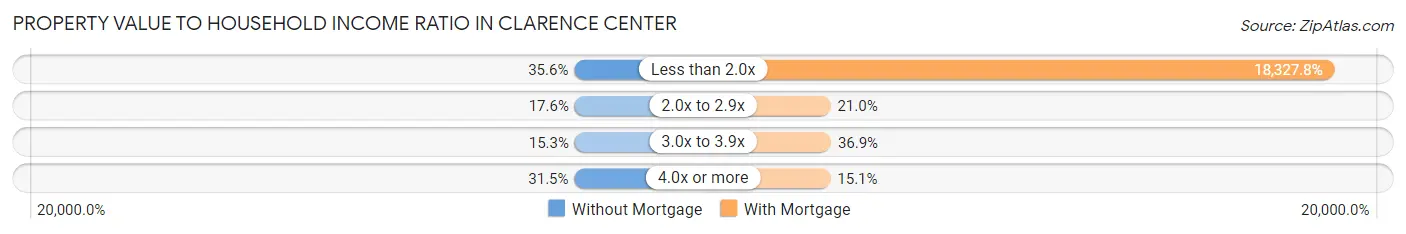
| Value-to-Income Ratio | Without Mortgage | With Mortgage |
| Less than 2.0x | 105 (35.6%) | 134,526 (18,327.8%) |
| 2.0x to 2.9x | 52 (17.6%) | 154 (21.0%) |
| 3.0x to 3.9x | 45 (15.2%) | 271 (36.9%) |
| 4.0x or more | 93 (31.5%) | 111 (15.1%) |
| Total | 295 (100.0%) | 734 (100.0%) |
Real Estate Taxes by Mortgage Status in Clarence Center
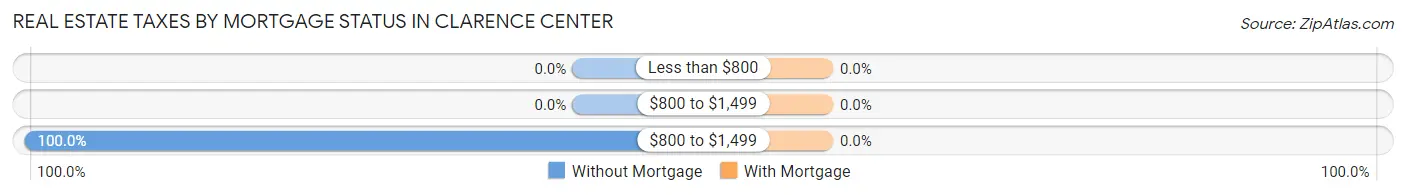
| Property Taxes | Without Mortgage | With Mortgage |
| Less than $800 | 0 (0.0%) | 0 (0.0%) |
| $800 to $1,499 | 0 (0.0%) | 0 (0.0%) |
| $800 to $1,499 | 295 (100.0%) | 0 (0.0%) |
| Total | 295 (100.0%) | 734 (100.0%) |
Health & Disability in Clarence Center
Health Insurance Coverage by Age in Clarence Center
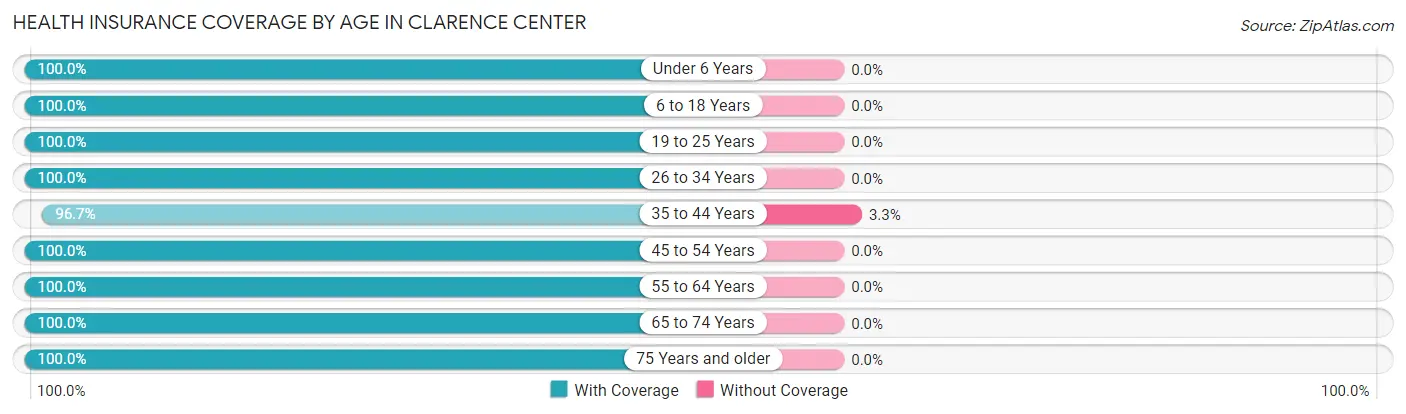
| Age Bracket | With Coverage | Without Coverage |
| Under 6 Years | 302 (100.0%) | 0 (0.0%) |
| 6 to 18 Years | 710 (100.0%) | 0 (0.0%) |
| 19 to 25 Years | 215 (100.0%) | 0 (0.0%) |
| 26 to 34 Years | 117 (100.0%) | 0 (0.0%) |
| 35 to 44 Years | 439 (96.7%) | 15 (3.3%) |
| 45 to 54 Years | 549 (100.0%) | 0 (0.0%) |
| 55 to 64 Years | 483 (100.0%) | 0 (0.0%) |
| 65 to 74 Years | 270 (100.0%) | 0 (0.0%) |
| 75 Years and older | 164 (100.0%) | 0 (0.0%) |
| Total | 3,249 (99.5%) | 15 (0.5%) |
Health Insurance Coverage by Citizenship Status in Clarence Center
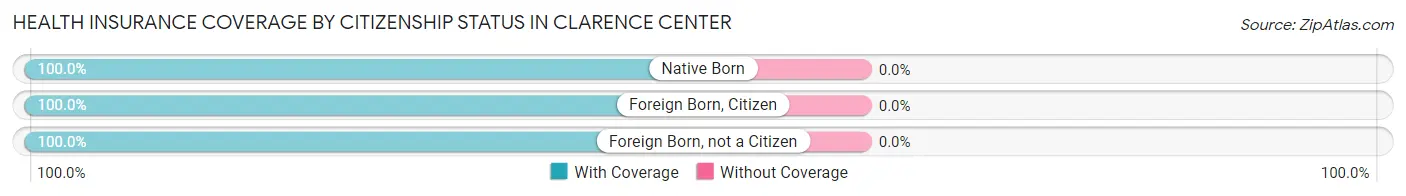
| Citizenship Status | With Coverage | Without Coverage |
| Native Born | 302 (100.0%) | 0 (0.0%) |
| Foreign Born, Citizen | 710 (100.0%) | 0 (0.0%) |
| Foreign Born, not a Citizen | 215 (100.0%) | 0 (0.0%) |
Health Insurance Coverage by Household Income in Clarence Center
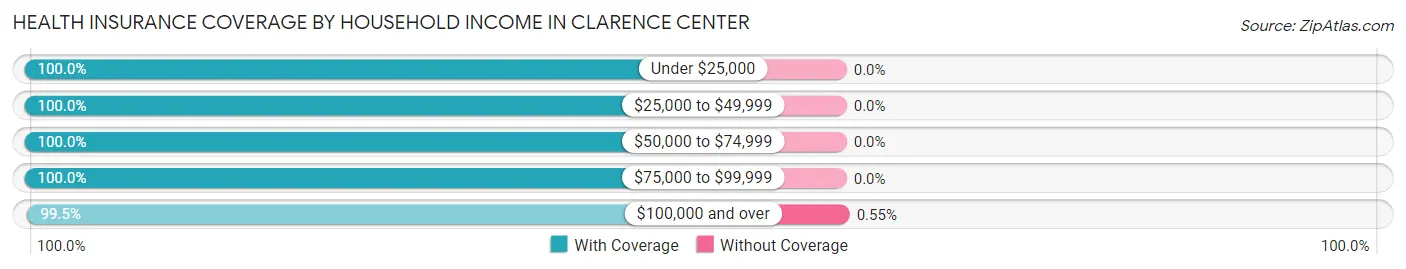
| Household Income | With Coverage | Without Coverage |
| Under $25,000 | 35 (100.0%) | 0 (0.0%) |
| $25,000 to $49,999 | 23 (100.0%) | 0 (0.0%) |
| $50,000 to $74,999 | 181 (100.0%) | 0 (0.0%) |
| $75,000 to $99,999 | 305 (100.0%) | 0 (0.0%) |
| $100,000 and over | 2,705 (99.5%) | 15 (0.5%) |
Public vs Private Health Insurance Coverage by Age in Clarence Center
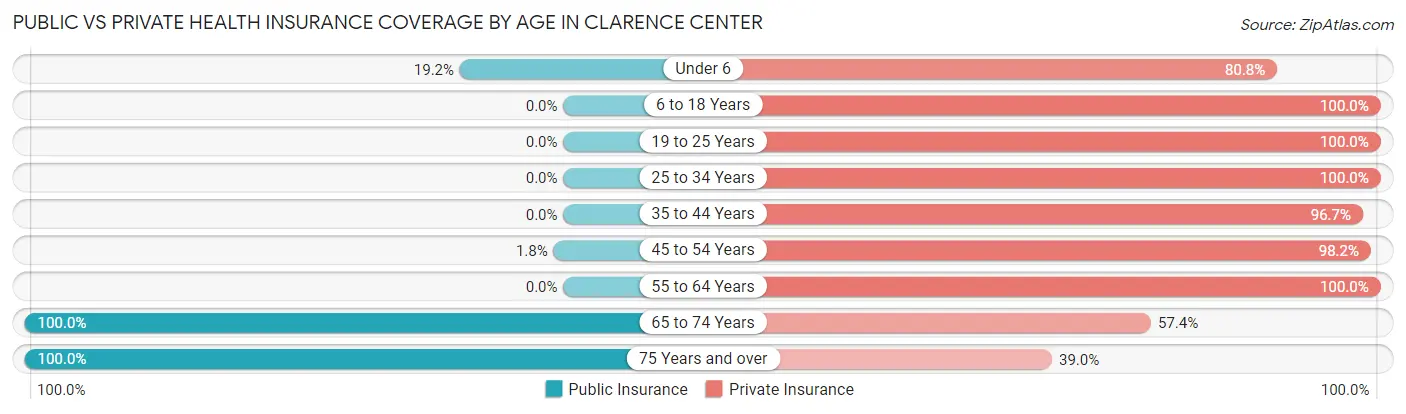
| Age Bracket | Public Insurance | Private Insurance |
| Under 6 | 58 (19.2%) | 244 (80.8%) |
| 6 to 18 Years | 0 (0.0%) | 710 (100.0%) |
| 19 to 25 Years | 0 (0.0%) | 215 (100.0%) |
| 25 to 34 Years | 0 (0.0%) | 117 (100.0%) |
| 35 to 44 Years | 0 (0.0%) | 439 (96.7%) |
| 45 to 54 Years | 10 (1.8%) | 539 (98.2%) |
| 55 to 64 Years | 0 (0.0%) | 483 (100.0%) |
| 65 to 74 Years | 270 (100.0%) | 155 (57.4%) |
| 75 Years and over | 164 (100.0%) | 64 (39.0%) |
| Total | 502 (15.4%) | 2,966 (90.9%) |
Disability Status by Sex by Age in Clarence Center
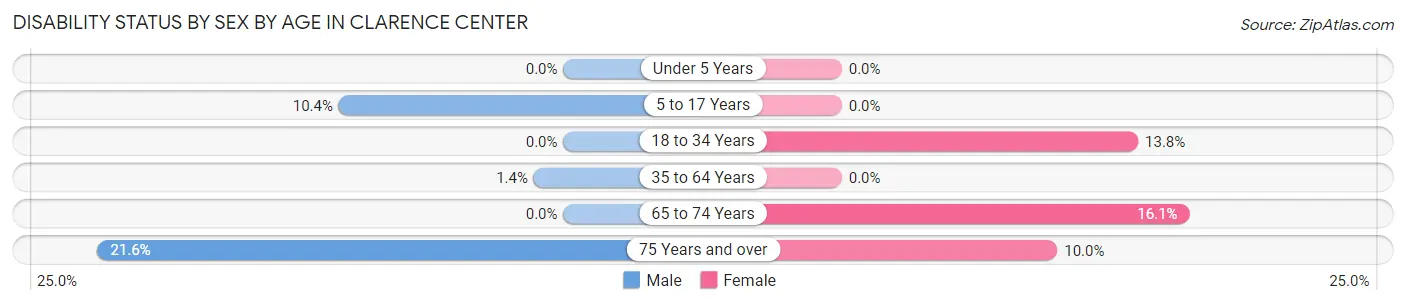
| Age Bracket | Male | Female |
| Under 5 Years | 0 (0.0%) | 0 (0.0%) |
| 5 to 17 Years | 45 (10.4%) | 0 (0.0%) |
| 18 to 34 Years | 0 (0.0%) | 37 (13.8%) |
| 35 to 64 Years | 10 (1.4%) | 0 (0.0%) |
| 65 to 74 Years | 0 (0.0%) | 20 (16.1%) |
| 75 Years and over | 16 (21.6%) | 9 (10.0%) |
Disability Class by Sex by Age in Clarence Center
Disability Class: Hearing Difficulty
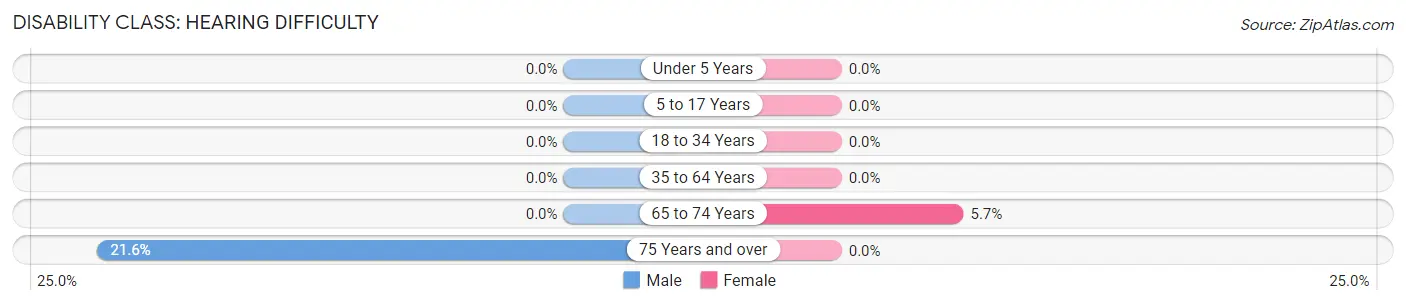
| Age Bracket | Male | Female |
| Under 5 Years | 0 (0.0%) | 0 (0.0%) |
| 5 to 17 Years | 0 (0.0%) | 0 (0.0%) |
| 18 to 34 Years | 0 (0.0%) | 0 (0.0%) |
| 35 to 64 Years | 0 (0.0%) | 0 (0.0%) |
| 65 to 74 Years | 0 (0.0%) | 7 (5.7%) |
| 75 Years and over | 16 (21.6%) | 0 (0.0%) |
Disability Class: Vision Difficulty
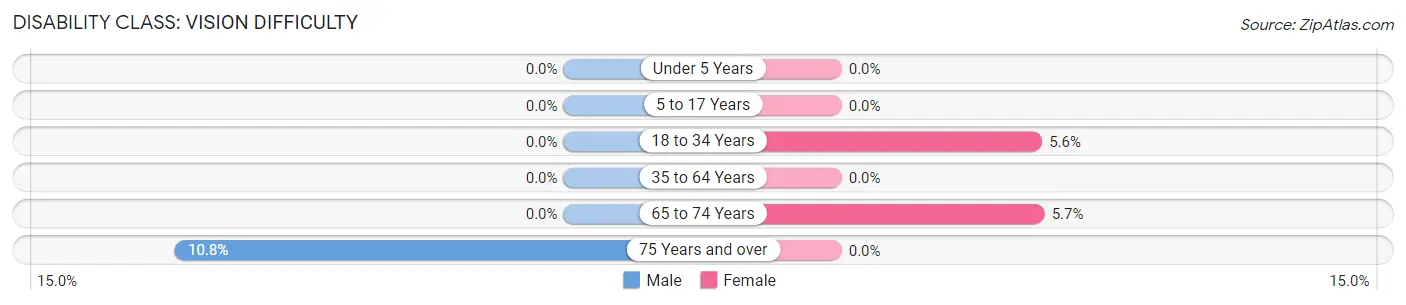
| Age Bracket | Male | Female |
| Under 5 Years | 0 (0.0%) | 0 (0.0%) |
| 5 to 17 Years | 0 (0.0%) | 0 (0.0%) |
| 18 to 34 Years | 0 (0.0%) | 15 (5.6%) |
| 35 to 64 Years | 0 (0.0%) | 0 (0.0%) |
| 65 to 74 Years | 0 (0.0%) | 7 (5.7%) |
| 75 Years and over | 8 (10.8%) | 0 (0.0%) |
Disability Class: Cognitive Difficulty
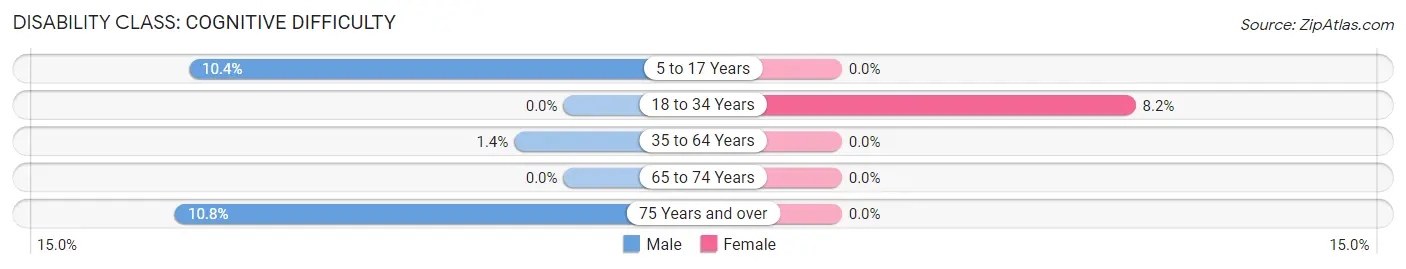
| Age Bracket | Male | Female |
| 5 to 17 Years | 45 (10.4%) | 0 (0.0%) |
| 18 to 34 Years | 0 (0.0%) | 22 (8.2%) |
| 35 to 64 Years | 10 (1.4%) | 0 (0.0%) |
| 65 to 74 Years | 0 (0.0%) | 0 (0.0%) |
| 75 Years and over | 8 (10.8%) | 0 (0.0%) |
Disability Class: Ambulatory Difficulty
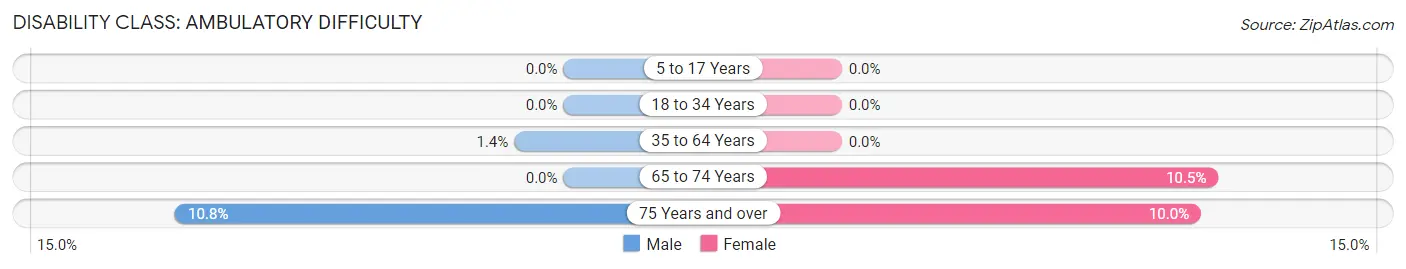
| Age Bracket | Male | Female |
| 5 to 17 Years | 0 (0.0%) | 0 (0.0%) |
| 18 to 34 Years | 0 (0.0%) | 0 (0.0%) |
| 35 to 64 Years | 10 (1.4%) | 0 (0.0%) |
| 65 to 74 Years | 0 (0.0%) | 13 (10.5%) |
| 75 Years and over | 8 (10.8%) | 9 (10.0%) |
Disability Class: Self-Care Difficulty
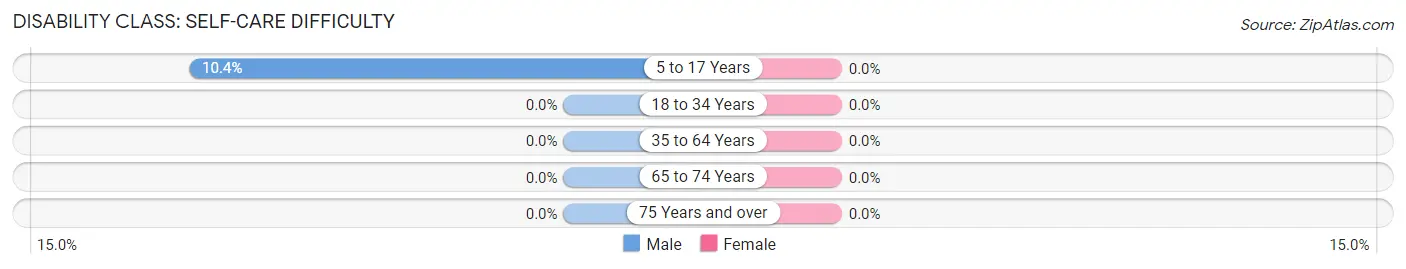
| Age Bracket | Male | Female |
| 5 to 17 Years | 45 (10.4%) | 0 (0.0%) |
| 18 to 34 Years | 0 (0.0%) | 0 (0.0%) |
| 35 to 64 Years | 0 (0.0%) | 0 (0.0%) |
| 65 to 74 Years | 0 (0.0%) | 0 (0.0%) |
| 75 Years and over | 0 (0.0%) | 0 (0.0%) |
Technology Access in Clarence Center
Computing Device Access in Clarence Center
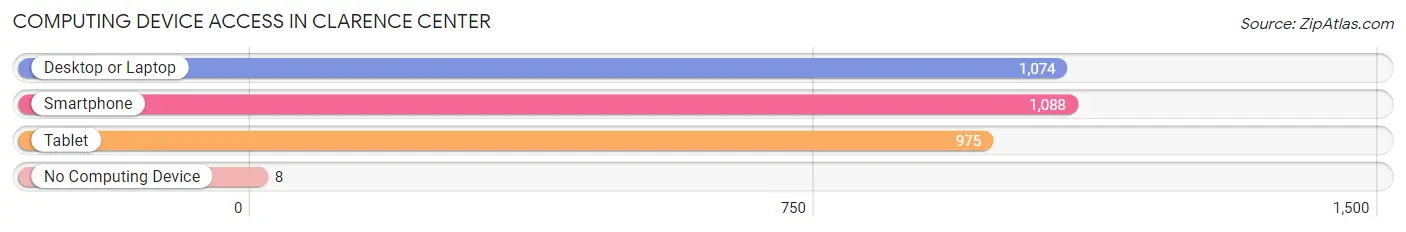
| Device Type | # Households | % Households |
| Desktop or Laptop | 1,074 | 97.2% |
| Smartphone | 1,088 | 98.5% |
| Tablet | 975 | 88.2% |
| No Computing Device | 8 | 0.7% |
| Total | 1,105 | 100.0% |
Internet Access in Clarence Center
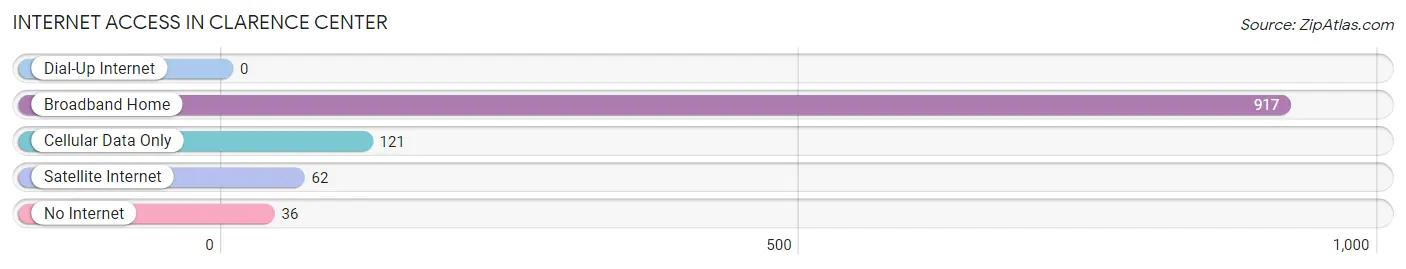
| Internet Type | # Households | % Households |
| Dial-Up Internet | 0 | 0.0% |
| Broadband Home | 917 | 83.0% |
| Cellular Data Only | 121 | 11.0% |
| Satellite Internet | 62 | 5.6% |
| No Internet | 36 | 3.3% |
| Total | 1,105 | 100.0% |
Clarence Center Summary
Clarence Center is a hamlet located in the town of Clarence in Erie County, New York. It is located in the northeast corner of the town, just south of the village of Williamsville. The hamlet is situated on the banks of Ellicott Creek, and is bordered by the towns of Amherst and Newstead. The population of Clarence Center was 2,845 at the 2010 census.
History
Clarence Center was first settled in 1804 by a group of settlers from Connecticut. The hamlet was originally known as "Clarence Hollow" and was part of the town of Willink, which was later renamed Clarence. The hamlet was officially incorporated in 1820.
In the early 19th century, the hamlet was a thriving agricultural community. The hamlet was home to several mills, including a grist mill, a saw mill, and a woolen mill. The hamlet also had a blacksmith shop, a general store, and a post office.
In the late 19th century, the hamlet began to grow and develop. The hamlet was home to several churches, including the First Presbyterian Church, the Methodist Episcopal Church, and the St. Paul's Lutheran Church. The hamlet also had a school, a library, and a fire department.
Geography
Clarence Center is located at 42°57'45"N 78°41'45"W (42.9625, -78.6958). The hamlet is situated on the banks of Ellicott Creek, and is bordered by the towns of Amherst and Newstead. The hamlet is located approximately 10 miles east of Buffalo, and is part of the Buffalo-Niagara Falls metropolitan area.
The total area of Clarence Center is 2.2 square miles, all of which is land. The hamlet is located in a hilly region, with an elevation of 690 feet above sea level.
Economy
The economy of Clarence Center is largely based on agriculture and light industry. The hamlet is home to several farms, which produce a variety of crops, including corn, soybeans, and hay. The hamlet is also home to several light industrial businesses, including a printing company, a plastics manufacturer, and a metal fabrication shop.
Demographics
As of the 2010 census, the population of Clarence Center was 2,845. The racial makeup of the hamlet was 94.3% White, 1.7% African American, 0.3% Native American, 1.2% Asian, 0.1% Pacific Islander, 0.9% from other races, and 1.5% from two or more races. Hispanic or Latino of any race were 3.2% of the population.
The median household income in Clarence Center was $63,958, and the median family income was $76,944. The per capita income was $30,945. About 4.2% of families and 5.7% of the population were below the poverty line, including 6.3% of those under age 18 and 4.2% of those age 65 or over.
Common Questions
What is Per Capita Income in Clarence Center?
Per Capita income in Clarence Center is $65,485.
What is the Median Family Income in Clarence Center?
Median Family Income in Clarence Center is $134,170.
What is the Median Household income in Clarence Center?
Median Household Income in Clarence Center is $133,653.
What is Income or Wage Gap in Clarence Center?
Income or Wage Gap in Clarence Center is 16.9%.
Women in Clarence Center earn 83.1 cents for every dollar earned by a man.
What is Inequality or Gini Index in Clarence Center?
Inequality or Gini Index in Clarence Center is 0.42.
What is the Total Population of Clarence Center?
Total Population of Clarence Center is 3,264.
What is the Total Male Population of Clarence Center?
Total Male Population of Clarence Center is 1,548.
What is the Total Female Population of Clarence Center?
Total Female Population of Clarence Center is 1,716.
What is the Ratio of Males per 100 Females in Clarence Center?
There are 90.21 Males per 100 Females in Clarence Center.
What is the Ratio of Females per 100 Males in Clarence Center?
There are 110.85 Females per 100 Males in Clarence Center.
What is the Median Population Age in Clarence Center?
Median Population Age in Clarence Center is 42.0 Years.
What is the Average Family Size in Clarence Center
Average Family Size in Clarence Center is 3.1 People.
What is the Average Household Size in Clarence Center
Average Household Size in Clarence Center is 3.0 People.
How Large is the Labor Force in Clarence Center?
There are 1,678 People in the Labor Forcein in Clarence Center.
What is the Percentage of People in the Labor Force in Clarence Center?
67.7% of People are in the Labor Force in Clarence Center.
What is the Unemployment Rate in Clarence Center?
Unemployment Rate in Clarence Center is 5.8%.