Upper Nyack, NY Map & Demographics
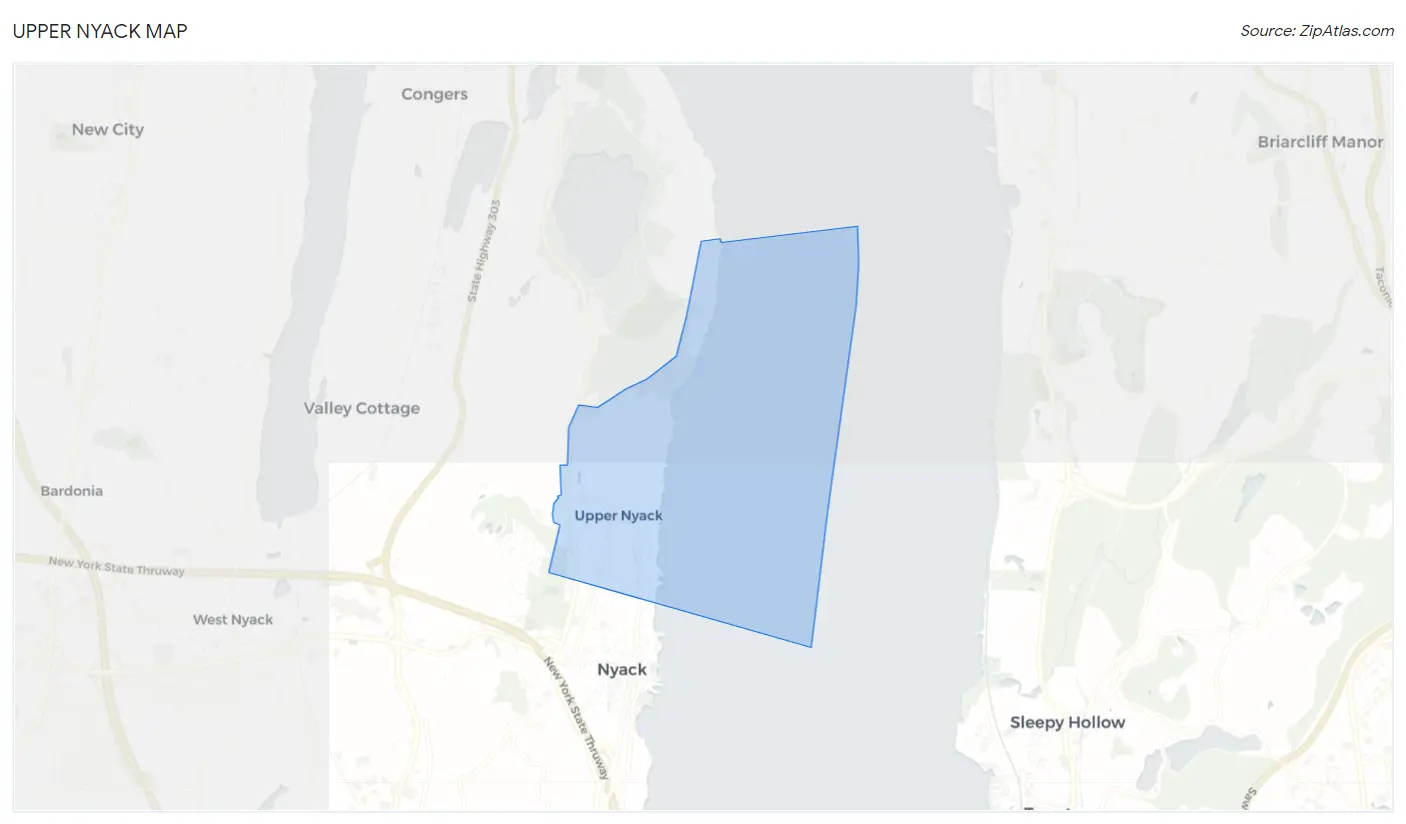
Upper Nyack Map
Upper Nyack Overview
$79,230
PER CAPITA INCOME
$230,135
AVG FAMILY INCOME
$188,229
AVG HOUSEHOLD INCOME
44.3%
WAGE / INCOME GAP [ % ]
55.7¢/ $1
WAGE / INCOME GAP [ $ ]
0.47
INEQUALITY / GINI INDEX
2,142
TOTAL POPULATION
1,052
MALE POPULATION
1,090
FEMALE POPULATION
96.51
MALES / 100 FEMALES
103.61
FEMALES / 100 MALES
49.5
MEDIAN AGE
3.2
AVG FAMILY SIZE
2.8
AVG HOUSEHOLD SIZE
1,112
LABOR FORCE [ PEOPLE ]
61.7%
PERCENT IN LABOR FORCE
6.3%
UNEMPLOYMENT RATE
Income in Upper Nyack
Income Overview in Upper Nyack
Per Capita Income in Upper Nyack is $79,230, while median incomes of families and households are $230,135 and $188,229 respectively.
| Characteristic | Number | Measure |
| Per Capita Income | 2,142 | $79,230 |
| Median Family Income | 560 | $230,135 |
| Mean Family Income | 560 | $251,071 |
| Median Household Income | 737 | $188,229 |
| Mean Household Income | 737 | $224,550 |
| Income Deficit | 560 | $0 |
| Wage / Income Gap (%) | 2,142 | 44.30% |
| Wage / Income Gap ($) | 2,142 | 55.70¢ per $1 |
| Gini / Inequality Index | 2,142 | 0.47 |
Earnings by Sex in Upper Nyack
Average Earnings in Upper Nyack are $79,063, $104,875 for men and $58,413 for women, a difference of 44.3%.
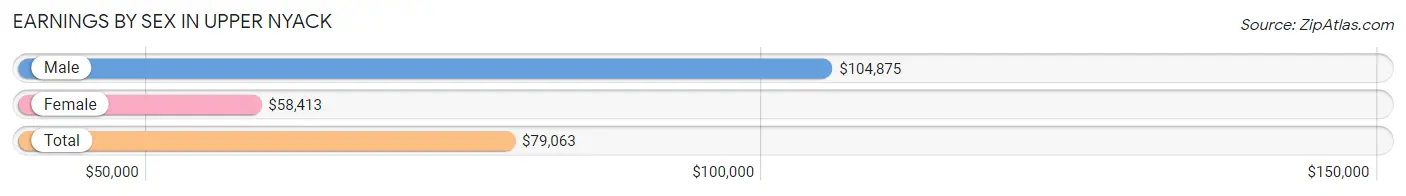
| Sex | Number | Average Earnings |
| Male | 581 (49.9%) | $104,875 |
| Female | 583 (50.1%) | $58,413 |
| Total | 1,164 (100.0%) | $79,063 |
Earnings by Sex by Income Bracket in Upper Nyack
The most common earnings brackets in Upper Nyack are $100,000+ for men (306 | 52.7%) and $100,000+ for women (126 | 21.6%).
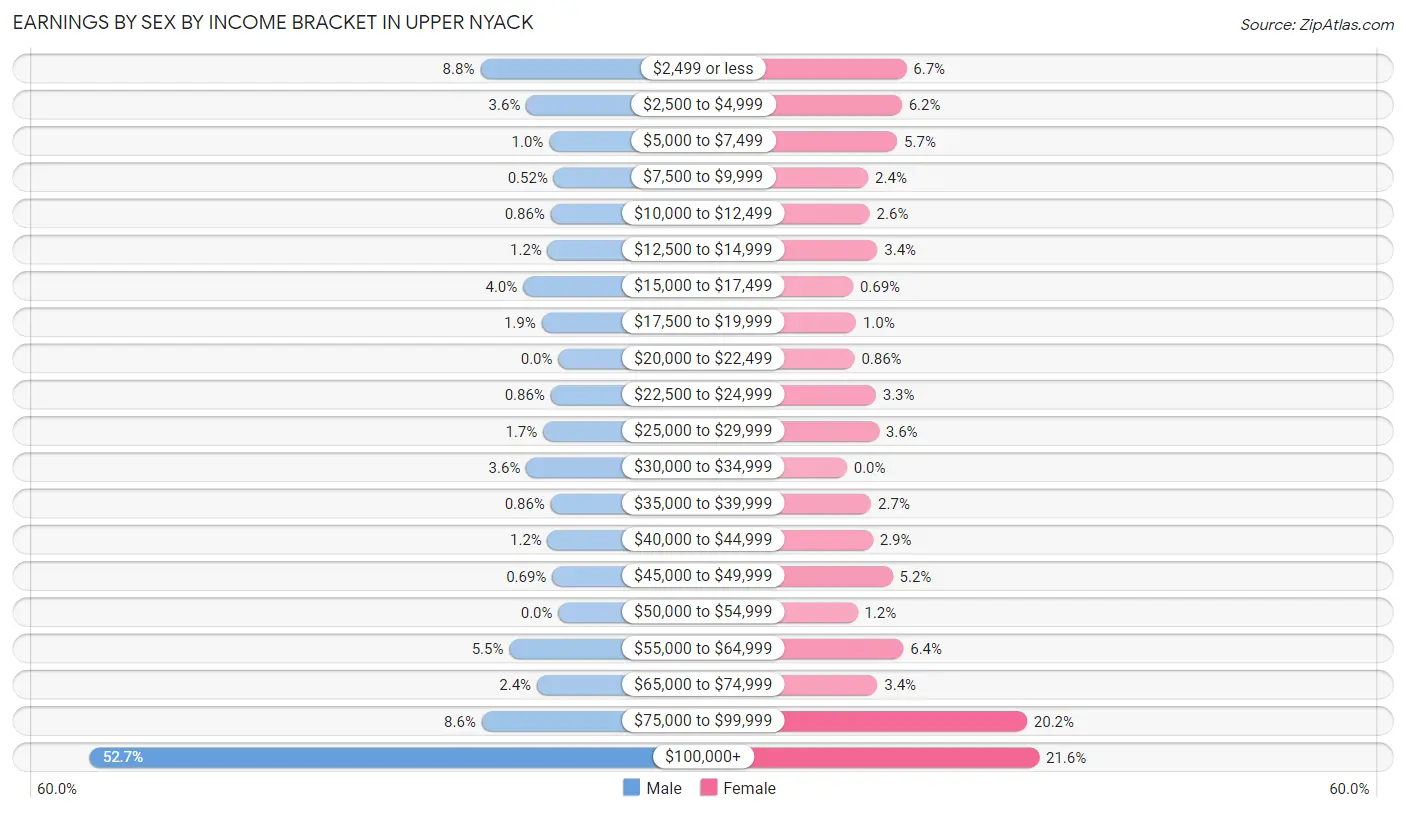
| Income | Male | Female |
| $2,499 or less | 51 (8.8%) | 39 (6.7%) |
| $2,500 to $4,999 | 21 (3.6%) | 36 (6.2%) |
| $5,000 to $7,499 | 6 (1.0%) | 33 (5.7%) |
| $7,500 to $9,999 | 3 (0.5%) | 14 (2.4%) |
| $10,000 to $12,499 | 5 (0.9%) | 15 (2.6%) |
| $12,500 to $14,999 | 7 (1.2%) | 20 (3.4%) |
| $15,000 to $17,499 | 23 (4.0%) | 4 (0.7%) |
| $17,500 to $19,999 | 11 (1.9%) | 6 (1.0%) |
| $20,000 to $22,499 | 0 (0.0%) | 5 (0.9%) |
| $22,500 to $24,999 | 5 (0.9%) | 19 (3.3%) |
| $25,000 to $29,999 | 10 (1.7%) | 21 (3.6%) |
| $30,000 to $34,999 | 21 (3.6%) | 0 (0.0%) |
| $35,000 to $39,999 | 5 (0.9%) | 16 (2.7%) |
| $40,000 to $44,999 | 7 (1.2%) | 17 (2.9%) |
| $45,000 to $49,999 | 4 (0.7%) | 30 (5.1%) |
| $50,000 to $54,999 | 0 (0.0%) | 7 (1.2%) |
| $55,000 to $64,999 | 32 (5.5%) | 37 (6.4%) |
| $65,000 to $74,999 | 14 (2.4%) | 20 (3.4%) |
| $75,000 to $99,999 | 50 (8.6%) | 118 (20.2%) |
| $100,000+ | 306 (52.7%) | 126 (21.6%) |
| Total | 581 (100.0%) | 583 (100.0%) |
Earnings by Sex by Educational Attainment in Upper Nyack
Average earnings in Upper Nyack are $129,583 for men and $75,865 for women, a difference of 41.4%. Men with an educational attainment of bachelor's degree enjoy the highest average annual earnings of $145,893, while those with college or associate's degree education earn the least with $60,417. Women with an educational attainment of graduate degree earn the most with the average annual earnings of $86,389, while those with college or associate's degree education have the smallest earnings of $41,875.
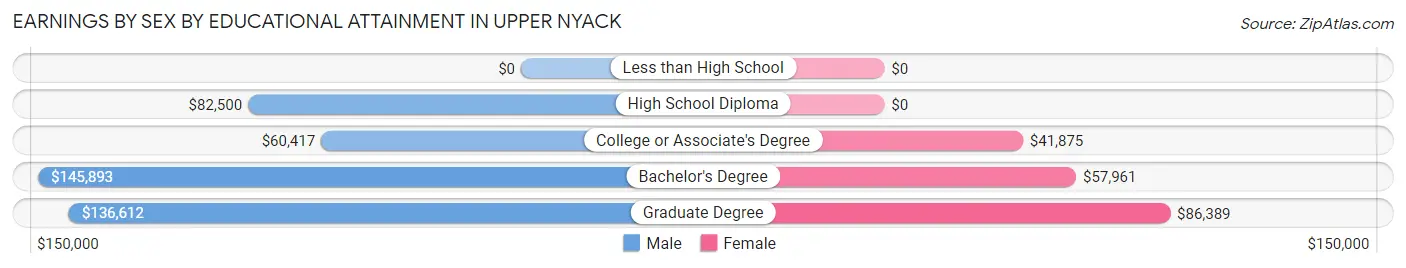
| Educational Attainment | Male Income | Female Income |
| Less than High School | - | - |
| High School Diploma | $82,500 | $0 |
| College or Associate's Degree | $60,417 | $41,875 |
| Bachelor's Degree | $145,893 | $57,961 |
| Graduate Degree | $136,612 | $86,389 |
| Total | $129,583 | $75,865 |
Family Income in Upper Nyack
Family Income Brackets in Upper Nyack
According to the Upper Nyack family income data, there are 327 families falling into the $200,000+ income range, which is the most common income bracket and makes up 58.4% of all families.
| Income Bracket | # Families | % Families |
| Less than $10,000 | 14 | 2.5% |
| $10,000 to $14,999 | 0 | 0.0% |
| $15,000 to $24,999 | 0 | 0.0% |
| $25,000 to $34,999 | 40 | 7.1% |
| $35,000 to $49,999 | 8 | 1.4% |
| $50,000 to $74,999 | 30 | 5.4% |
| $75,000 to $99,999 | 32 | 5.7% |
| $100,000 to $149,999 | 42 | 7.5% |
| $150,000 to $199,999 | 67 | 12.0% |
| $200,000+ | 327 | 58.4% |
Family Income by Famaliy Size in Upper Nyack
5-person families (33 | 5.9%) account for the highest median family income in Upper Nyack with $250,001 per family, while 2-person families (227 | 40.5%) have the highest median income of $100,938 per family member.
| Income Bracket | # Families | Median Income |
| 2-Person Families | 227 (40.5%) | $201,875 |
| 3-Person Families | 138 (24.6%) | $213,056 |
| 4-Person Families | 128 (22.9%) | $231,176 |
| 5-Person Families | 33 (5.9%) | $250,001 |
| 6-Person Families | 27 (4.8%) | $0 |
| 7+ Person Families | 7 (1.3%) | $0 |
| Total | 560 (100.0%) | $230,135 |
Family Income by Number of Earners in Upper Nyack
The median family income in Upper Nyack is $230,135, with families comprising 3+ earners (82) having the highest median family income of $250,001, while families with no earners (62) have the lowest median family income of $121,250, accounting for 14.6% and 11.1% of families, respectively.
| Number of Earners | # Families | Median Income |
| No Earners | 62 (11.1%) | $121,250 |
| 1 Earner | 116 (20.7%) | $153,750 |
| 2 Earners | 300 (53.6%) | $231,622 |
| 3+ Earners | 82 (14.6%) | $250,001 |
| Total | 560 (100.0%) | $230,135 |
Household Income in Upper Nyack
Household Income Brackets in Upper Nyack
With 355 households falling in the category, the $200,000+ income range is the most frequent in Upper Nyack, accounting for 48.2% of all households. In contrast, only 6 households (0.8%) fall into the $10,000 to $14,999 income bracket, making it the least populous group.
| Income Bracket | # Households | % Households |
| Less than $10,000 | 34 | 4.6% |
| $10,000 to $14,999 | 6 | 0.8% |
| $15,000 to $24,999 | 23 | 3.1% |
| $25,000 to $34,999 | 53 | 7.2% |
| $35,000 to $49,999 | 20 | 2.7% |
| $50,000 to $74,999 | 51 | 6.9% |
| $75,000 to $99,999 | 60 | 8.1% |
| $100,000 to $149,999 | 67 | 9.1% |
| $150,000 to $199,999 | 68 | 9.2% |
| $200,000+ | 355 | 48.2% |
Household Income by Householder Age in Upper Nyack
The median household income in Upper Nyack is $188,229, with the highest median household income of $231,728 found in the 45 to 64 years age bracket for the primary householder. A total of 373 households (50.6%) fall into this category.
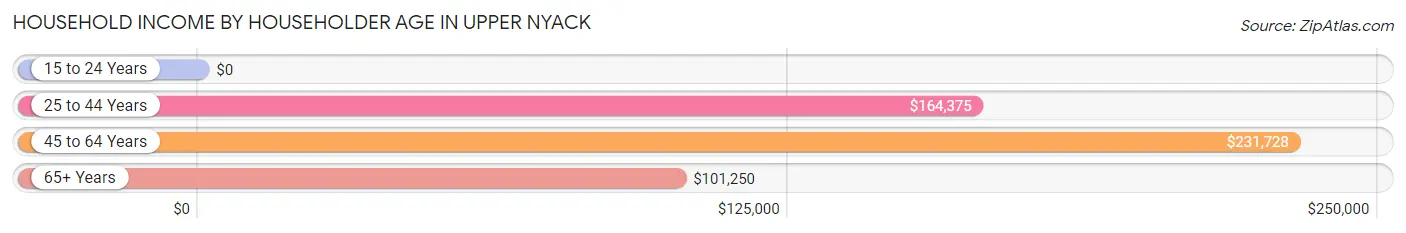
| Income Bracket | # Households | Median Income |
| 15 to 24 Years | 0 (0.0%) | $0 |
| 25 to 44 Years | 114 (15.5%) | $164,375 |
| 45 to 64 Years | 373 (50.6%) | $231,728 |
| 65+ Years | 250 (33.9%) | $101,250 |
| Total | 737 (100.0%) | $188,229 |
Poverty in Upper Nyack
Income Below Poverty by Sex and Age in Upper Nyack
With 7.6% poverty level for males and 8.7% for females among the residents of Upper Nyack, 6 to 11 year old males and 16 and 17 year old females are the most vulnerable to poverty, with 11 males (35.5%) and 15 females (25.9%) in their respective age groups living below the poverty level.
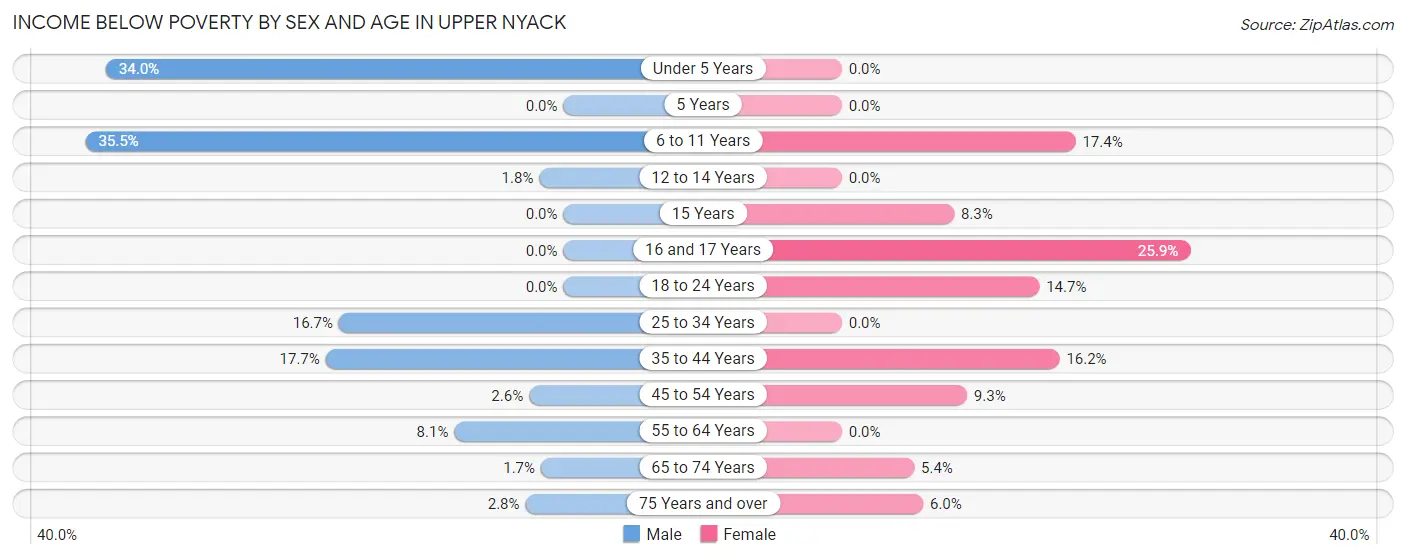
| Age Bracket | Male | Female |
| Under 5 Years | 18 (34.0%) | 0 (0.0%) |
| 5 Years | 0 (0.0%) | 0 (0.0%) |
| 6 to 11 Years | 11 (35.5%) | 17 (17.3%) |
| 12 to 14 Years | 1 (1.8%) | 0 (0.0%) |
| 15 Years | 0 (0.0%) | 2 (8.3%) |
| 16 and 17 Years | 0 (0.0%) | 15 (25.9%) |
| 18 to 24 Years | 0 (0.0%) | 17 (14.7%) |
| 25 to 34 Years | 5 (16.7%) | 0 (0.0%) |
| 35 to 44 Years | 15 (17.6%) | 16 (16.2%) |
| 45 to 54 Years | 4 (2.5%) | 13 (9.3%) |
| 55 to 64 Years | 17 (8.1%) | 0 (0.0%) |
| 65 to 74 Years | 2 (1.7%) | 8 (5.4%) |
| 75 Years and over | 2 (2.8%) | 7 (6.0%) |
| Total | 75 (7.6%) | 95 (8.7%) |
Income Above Poverty by Sex and Age in Upper Nyack
According to the poverty statistics in Upper Nyack, males aged 5 years and females aged under 5 years are the age groups that are most secure financially, with 100.0% of males and 100.0% of females in these age groups living above the poverty line.
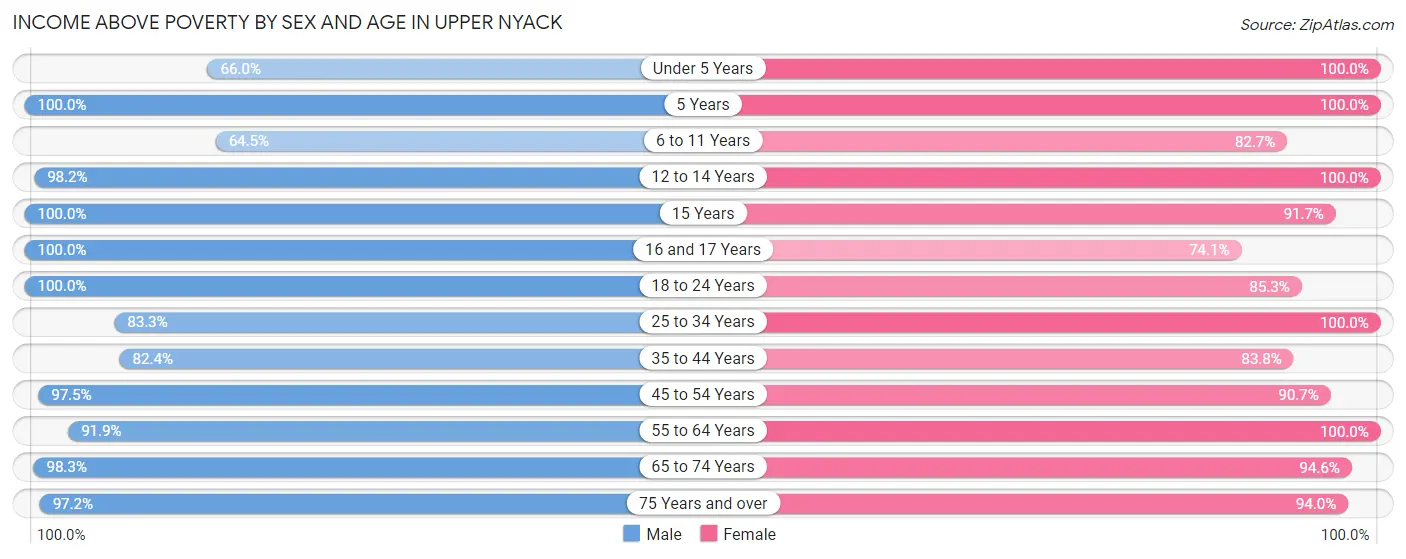
| Age Bracket | Male | Female |
| Under 5 Years | 35 (66.0%) | 10 (100.0%) |
| 5 Years | 2 (100.0%) | 9 (100.0%) |
| 6 to 11 Years | 20 (64.5%) | 81 (82.7%) |
| 12 to 14 Years | 55 (98.2%) | 24 (100.0%) |
| 15 Years | 17 (100.0%) | 22 (91.7%) |
| 16 and 17 Years | 72 (100.0%) | 43 (74.1%) |
| 18 to 24 Years | 77 (100.0%) | 99 (85.3%) |
| 25 to 34 Years | 25 (83.3%) | 35 (100.0%) |
| 35 to 44 Years | 70 (82.4%) | 83 (83.8%) |
| 45 to 54 Years | 153 (97.5%) | 127 (90.7%) |
| 55 to 64 Years | 193 (91.9%) | 212 (100.0%) |
| 65 to 74 Years | 118 (98.3%) | 141 (94.6%) |
| 75 Years and over | 69 (97.2%) | 109 (94.0%) |
| Total | 906 (92.3%) | 995 (91.3%) |
Income Below Poverty Among Married-Couple Families in Upper Nyack
The poverty statistics for married-couple families in Upper Nyack show that 3.5% or 17 of the total 487 families live below the poverty line. Families with 3 or 4 children have the highest poverty rate of 48.4%, comprising of 15 families. On the other hand, families with 1 or 2 children have the lowest poverty rate of 0.0%, which includes 0 families.
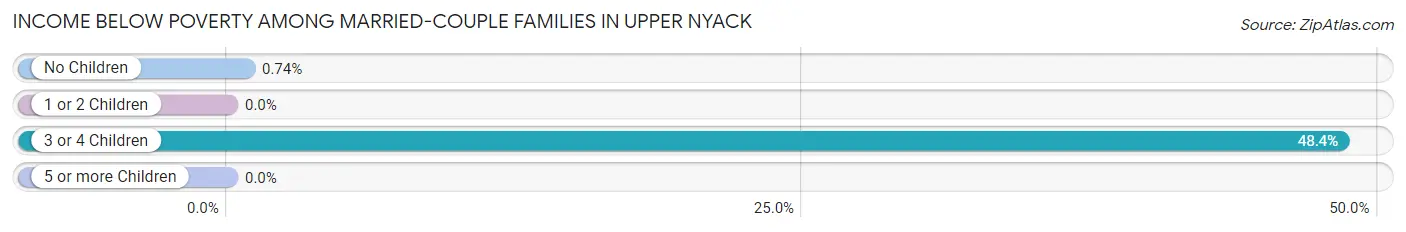
| Children | Above Poverty | Below Poverty |
| No Children | 267 (99.3%) | 2 (0.7%) |
| 1 or 2 Children | 180 (100.0%) | 0 (0.0%) |
| 3 or 4 Children | 16 (51.6%) | 15 (48.4%) |
| 5 or more Children | 7 (100.0%) | 0 (0.0%) |
| Total | 470 (96.5%) | 17 (3.5%) |
Income Below Poverty Among Single-Parent Households in Upper Nyack
According to the poverty data in Upper Nyack, 12.5% or 1 single-father households and 16.9% or 11 single-mother households are living below the poverty line. Among single-father households, those with 1 or 2 children have the highest poverty rate, with 1 households (33.3%) experiencing poverty. Likewise, among single-mother households, those with 1 or 2 children have the highest poverty rate, with 11 households (40.7%) falling below the poverty line.
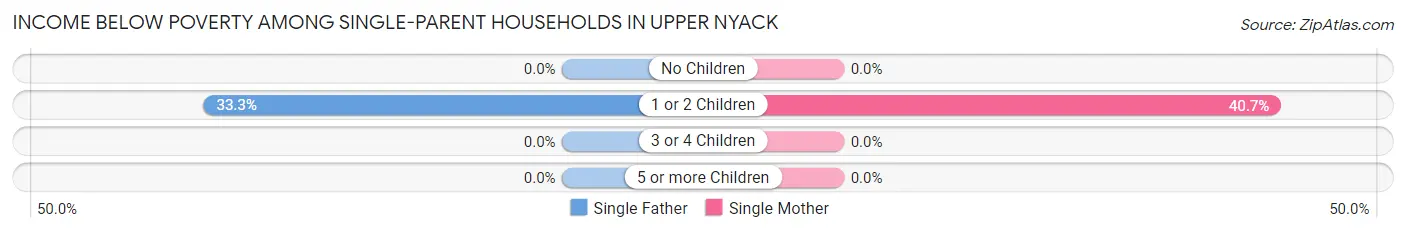
| Children | Single Father | Single Mother |
| No Children | 0 (0.0%) | 0 (0.0%) |
| 1 or 2 Children | 1 (33.3%) | 11 (40.7%) |
| 3 or 4 Children | 0 (0.0%) | 0 (0.0%) |
| 5 or more Children | 0 (0.0%) | 0 (0.0%) |
| Total | 1 (12.5%) | 11 (16.9%) |
Income Below Poverty Among Married-Couple vs Single-Parent Households in Upper Nyack
The poverty data for Upper Nyack shows that 17 of the married-couple family households (3.5%) and 12 of the single-parent households (16.4%) are living below the poverty level. Within the married-couple family households, those with 3 or 4 children have the highest poverty rate, with 15 households (48.4%) falling below the poverty line. Among the single-parent households, those with 1 or 2 children have the highest poverty rate, with 12 household (40.0%) living below poverty.
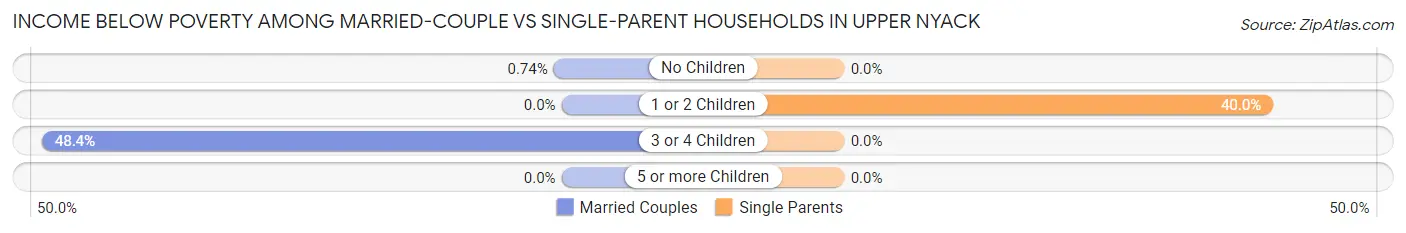
| Children | Married-Couple Families | Single-Parent Households |
| No Children | 2 (0.7%) | 0 (0.0%) |
| 1 or 2 Children | 0 (0.0%) | 12 (40.0%) |
| 3 or 4 Children | 15 (48.4%) | 0 (0.0%) |
| 5 or more Children | 0 (0.0%) | 0 (0.0%) |
| Total | 17 (3.5%) | 12 (16.4%) |
Race in Upper Nyack
The most populous races in Upper Nyack are White / Caucasian (1,549 | 72.3%), Hispanic or Latino (305 | 14.2%), and Black / African American (260 | 12.1%).
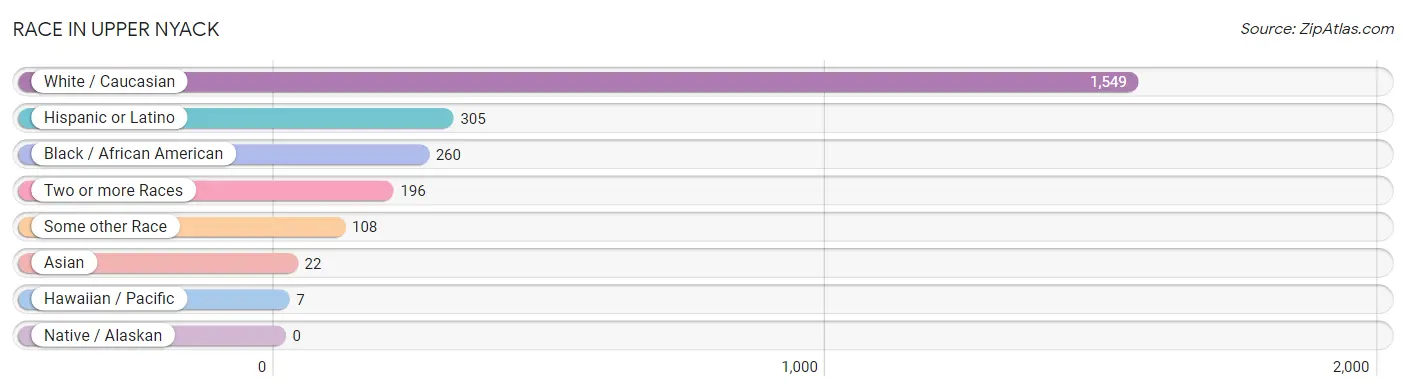
| Race | # Population | % Population |
| Asian | 22 | 1.0% |
| Black / African American | 260 | 12.1% |
| Hawaiian / Pacific | 7 | 0.3% |
| Hispanic or Latino | 305 | 14.2% |
| Native / Alaskan | 0 | 0.0% |
| White / Caucasian | 1,549 | 72.3% |
| Two or more Races | 196 | 9.1% |
| Some other Race | 108 | 5.0% |
| Total | 2,142 | 100.0% |
Ancestry in Upper Nyack
The most populous ancestries reported in Upper Nyack are Irish (314 | 14.7%), Italian (302 | 14.1%), Haitian (225 | 10.5%), German (206 | 9.6%), and American (145 | 6.8%), together accounting for 55.6% of all Upper Nyack residents.
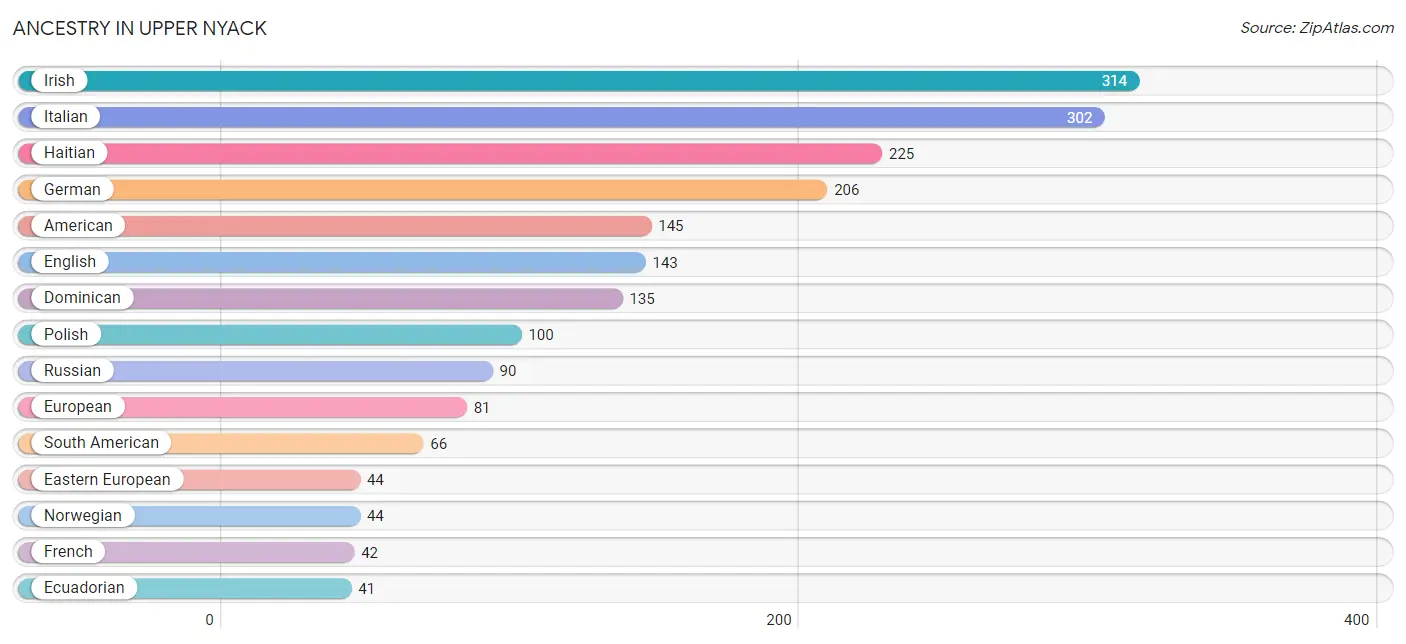
| Ancestry | # Population | % Population |
| African | 13 | 0.6% |
| American | 145 | 6.8% |
| Arab | 31 | 1.5% |
| Argentinean | 25 | 1.2% |
| Armenian | 9 | 0.4% |
| Austrian | 35 | 1.6% |
| Barbadian | 3 | 0.1% |
| Belgian | 12 | 0.6% |
| British | 10 | 0.5% |
| Burmese | 2 | 0.1% |
| Central American | 39 | 1.8% |
| Costa Rican | 8 | 0.4% |
| Croatian | 11 | 0.5% |
| Cuban | 7 | 0.3% |
| Czech | 7 | 0.3% |
| Czechoslovakian | 3 | 0.1% |
| Danish | 10 | 0.5% |
| Dominican | 135 | 6.3% |
| Dutch | 38 | 1.8% |
| Eastern European | 44 | 2.1% |
| Ecuadorian | 41 | 1.9% |
| English | 143 | 6.7% |
| European | 81 | 3.8% |
| French | 42 | 2.0% |
| French Canadian | 6 | 0.3% |
| German | 206 | 9.6% |
| Greek | 15 | 0.7% |
| Guatemalan | 12 | 0.6% |
| Haitian | 225 | 10.5% |
| Hungarian | 26 | 1.2% |
| Indian (Asian) | 21 | 1.0% |
| Irish | 314 | 14.7% |
| Israeli | 7 | 0.3% |
| Italian | 302 | 14.1% |
| Korean | 21 | 1.0% |
| Lebanese | 18 | 0.8% |
| Lithuanian | 9 | 0.4% |
| Mexican | 3 | 0.1% |
| Native Hawaiian | 7 | 0.3% |
| Nicaraguan | 2 | 0.1% |
| Norwegian | 44 | 2.1% |
| Polish | 100 | 4.7% |
| Puerto Rican | 36 | 1.7% |
| Romanian | 3 | 0.1% |
| Russian | 90 | 4.2% |
| Salvadoran | 17 | 0.8% |
| Scotch-Irish | 9 | 0.4% |
| Scottish | 6 | 0.3% |
| Slovak | 2 | 0.1% |
| South American | 66 | 3.1% |
| Spaniard | 19 | 0.9% |
| Subsaharan African | 13 | 0.6% |
| Swedish | 12 | 0.6% |
| Swiss | 33 | 1.5% |
| Thai | 6 | 0.3% |
| Turkish | 3 | 0.1% |
| Ukrainian | 5 | 0.2% |
| Welsh | 11 | 0.5% |
| West Indian | 4 | 0.2% | View All 59 Rows |
Immigrants in Upper Nyack
The most numerous immigrant groups reported in Upper Nyack came from Latin America (142 | 6.6%), Caribbean (88 | 4.1%), Haiti (72 | 3.4%), Europe (55 | 2.6%), and Asia (43 | 2.0%), together accounting for 18.7% of all Upper Nyack residents.
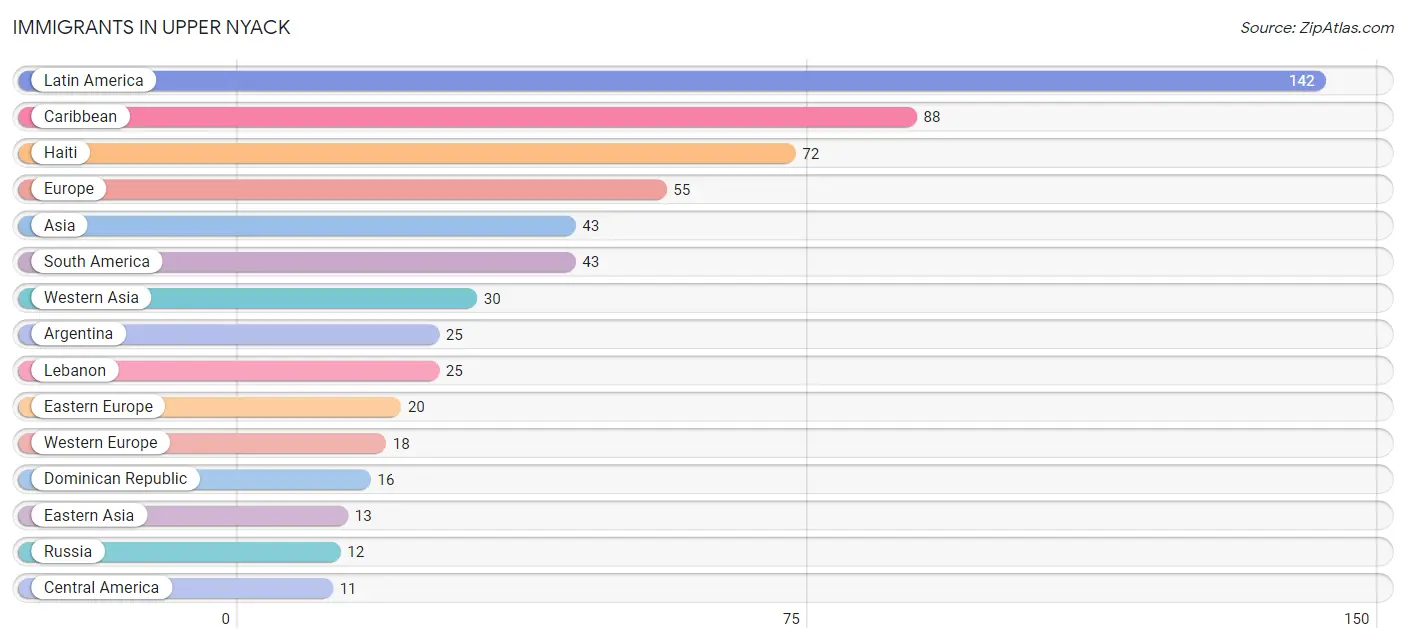
| Immigration Origin | # Population | % Population |
| Africa | 2 | 0.1% |
| Argentina | 25 | 1.2% |
| Asia | 43 | 2.0% |
| Austria | 4 | 0.2% |
| Belgium | 4 | 0.2% |
| Brazil | 7 | 0.3% |
| Canada | 2 | 0.1% |
| Caribbean | 88 | 4.1% |
| Central America | 11 | 0.5% |
| Chile | 2 | 0.1% |
| China | 11 | 0.5% |
| Costa Rica | 6 | 0.3% |
| Dominican Republic | 16 | 0.7% |
| Eastern Asia | 13 | 0.6% |
| Eastern Europe | 20 | 0.9% |
| Ecuador | 9 | 0.4% |
| Egypt | 2 | 0.1% |
| England | 9 | 0.4% |
| Europe | 55 | 2.6% |
| France | 2 | 0.1% |
| Germany | 6 | 0.3% |
| Greece | 1 | 0.1% |
| Guatemala | 5 | 0.2% |
| Haiti | 72 | 3.4% |
| Hong Kong | 8 | 0.4% |
| Hungary | 2 | 0.1% |
| Israel | 2 | 0.1% |
| Italy | 4 | 0.2% |
| Korea | 2 | 0.1% |
| Kuwait | 3 | 0.1% |
| Latin America | 142 | 6.6% |
| Lebanon | 25 | 1.2% |
| Northern Africa | 2 | 0.1% |
| Northern Europe | 9 | 0.4% |
| Poland | 6 | 0.3% |
| Russia | 12 | 0.6% |
| South America | 43 | 2.0% |
| Southern Europe | 8 | 0.4% |
| Spain | 3 | 0.1% |
| Switzerland | 2 | 0.1% |
| Western Asia | 30 | 1.4% |
| Western Europe | 18 | 0.8% | View All 42 Rows |
Sex and Age in Upper Nyack
Sex and Age in Upper Nyack
The most populous age groups in Upper Nyack are 60 to 64 Years (140 | 13.3%) for men and 55 to 59 Years (135 | 12.4%) for women.
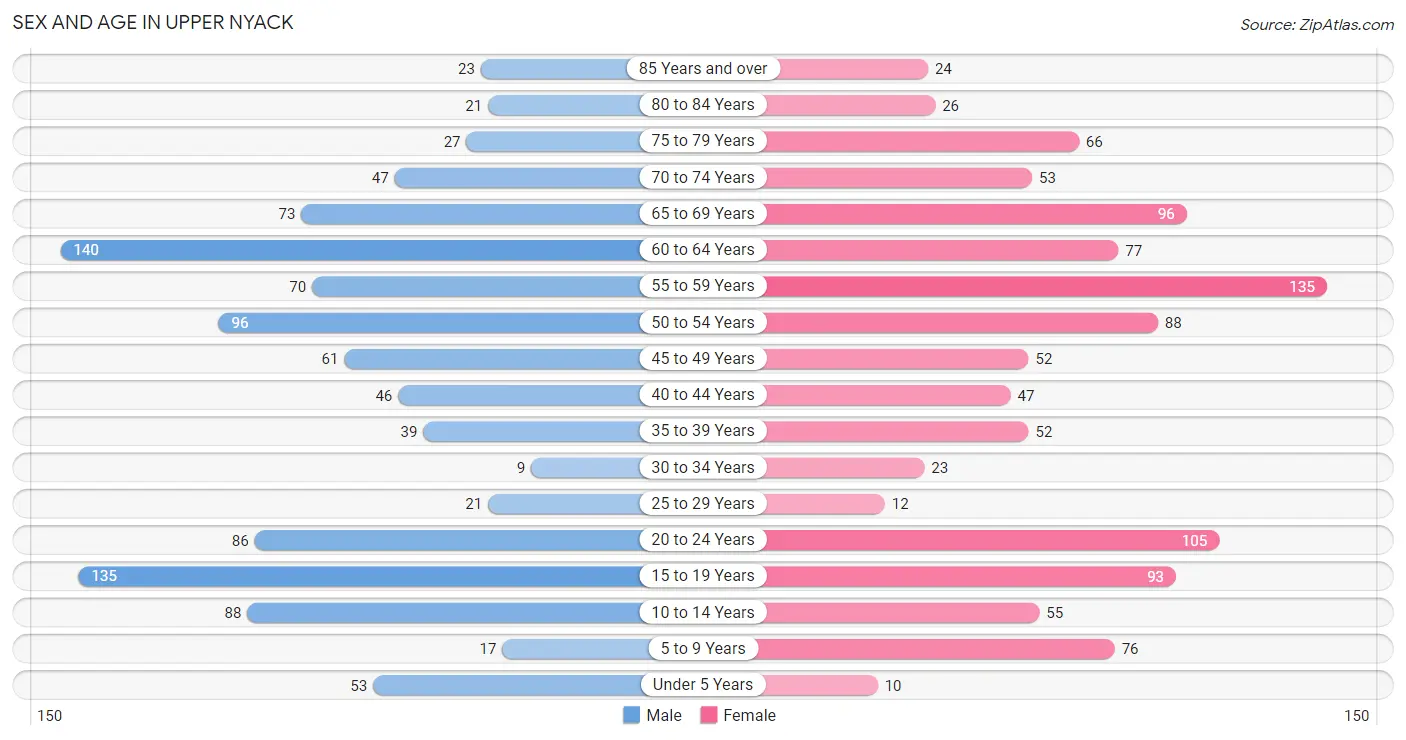
| Age Bracket | Male | Female |
| Under 5 Years | 53 (5.0%) | 10 (0.9%) |
| 5 to 9 Years | 17 (1.6%) | 76 (7.0%) |
| 10 to 14 Years | 88 (8.4%) | 55 (5.1%) |
| 15 to 19 Years | 135 (12.8%) | 93 (8.5%) |
| 20 to 24 Years | 86 (8.2%) | 105 (9.6%) |
| 25 to 29 Years | 21 (2.0%) | 12 (1.1%) |
| 30 to 34 Years | 9 (0.9%) | 23 (2.1%) |
| 35 to 39 Years | 39 (3.7%) | 52 (4.8%) |
| 40 to 44 Years | 46 (4.4%) | 47 (4.3%) |
| 45 to 49 Years | 61 (5.8%) | 52 (4.8%) |
| 50 to 54 Years | 96 (9.1%) | 88 (8.1%) |
| 55 to 59 Years | 70 (6.7%) | 135 (12.4%) |
| 60 to 64 Years | 140 (13.3%) | 77 (7.1%) |
| 65 to 69 Years | 73 (6.9%) | 96 (8.8%) |
| 70 to 74 Years | 47 (4.5%) | 53 (4.9%) |
| 75 to 79 Years | 27 (2.6%) | 66 (6.1%) |
| 80 to 84 Years | 21 (2.0%) | 26 (2.4%) |
| 85 Years and over | 23 (2.2%) | 24 (2.2%) |
| Total | 1,052 (100.0%) | 1,090 (100.0%) |
Families and Households in Upper Nyack
Median Family Size in Upper Nyack
The median family size in Upper Nyack is 3.24 persons per family, with married-couple families (487 | 87.0%) accounting for the largest median family size of 3.32 persons per family. On the other hand, single male/father families (8 | 1.4%) represent the smallest median family size with 2.00 persons per family.
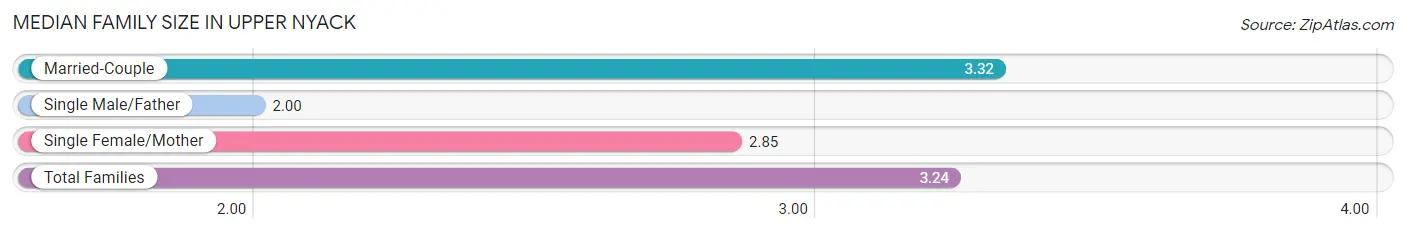
| Family Type | # Families | Family Size |
| Married-Couple | 487 (87.0%) | 3.32 |
| Single Male/Father | 8 (1.4%) | 2.00 |
| Single Female/Mother | 65 (11.6%) | 2.85 |
| Total Families | 560 (100.0%) | 3.24 |
Median Household Size in Upper Nyack
The median household size in Upper Nyack is 2.78 persons per household, with married-couple households (487 | 66.1%) accounting for the largest median household size of 3.35 persons per household. non-family households (177 | 24.0%) represent the smallest median household size with 1.21 persons per household.
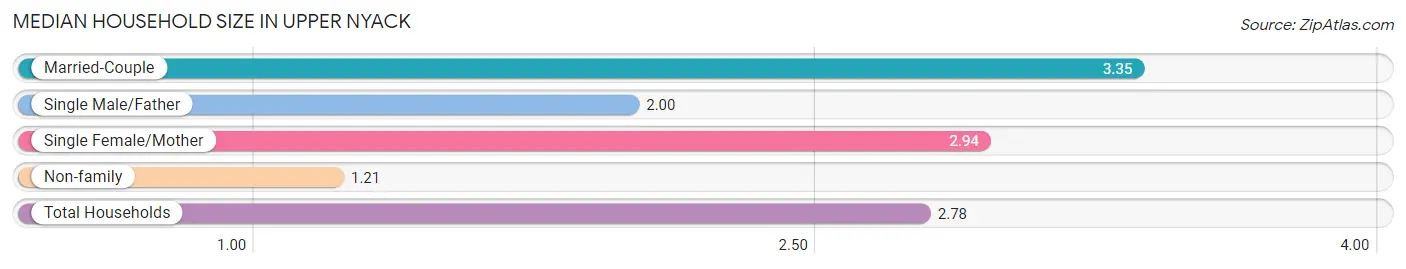
| Household Type | # Households | Household Size |
| Married-Couple | 487 (66.1%) | 3.35 |
| Single Male/Father | 8 (1.1%) | 2.00 |
| Single Female/Mother | 65 (8.8%) | 2.94 |
| Non-family | 177 (24.0%) | 1.21 |
| Total Households | 737 (100.0%) | 2.78 |
Household Size by Marriage Status in Upper Nyack
Out of a total of 737 households in Upper Nyack, 560 (76.0%) are family households, while 177 (24.0%) are nonfamily households. The most numerous type of family households are 2-person households, comprising 217, and the most common type of nonfamily households are 1-person households, comprising 154.
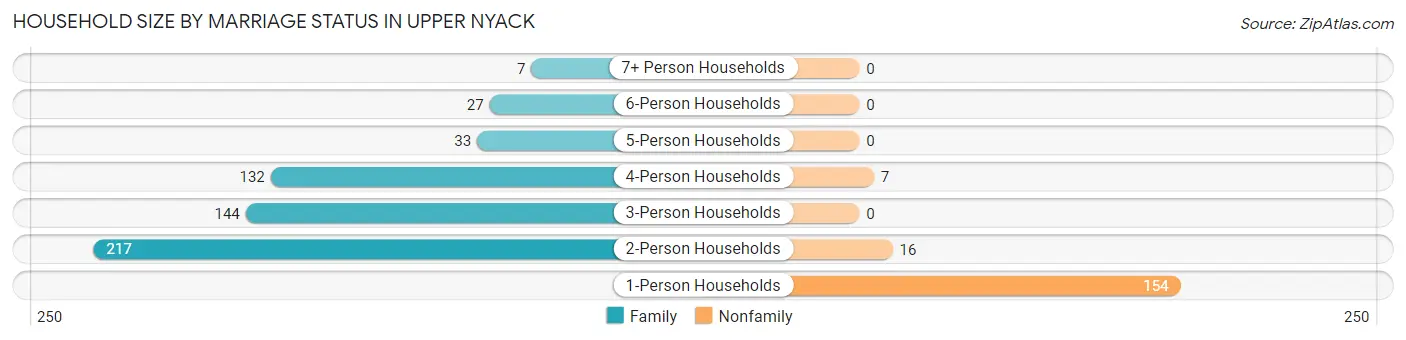
| Household Size | Family Households | Nonfamily Households |
| 1-Person Households | - | 154 (20.9%) |
| 2-Person Households | 217 (29.4%) | 16 (2.2%) |
| 3-Person Households | 144 (19.5%) | 0 (0.0%) |
| 4-Person Households | 132 (17.9%) | 7 (0.9%) |
| 5-Person Households | 33 (4.5%) | 0 (0.0%) |
| 6-Person Households | 27 (3.7%) | 0 (0.0%) |
| 7+ Person Households | 7 (0.9%) | 0 (0.0%) |
| Total | 560 (76.0%) | 177 (24.0%) |
Female Fertility in Upper Nyack
Fertility by Age in Upper Nyack
Average fertility rate in Upper Nyack is 13.0 births per 1,000 women. Women in the age bracket of 35 to 50 years have the highest fertility rate with 19.0 births per 1,000 women. Women in the age bracket of 35 to 50 years acount for 60.0% of all women with births.
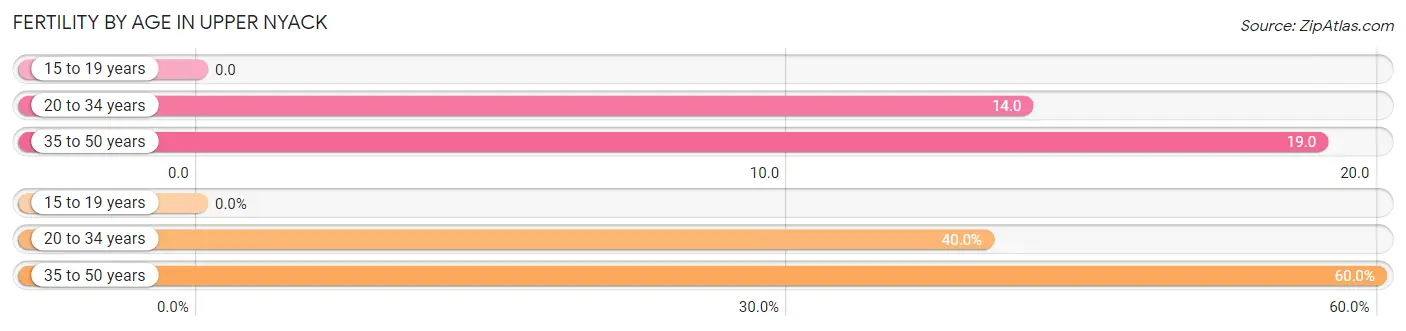
| Age Bracket | Women with Births | Births / 1,000 Women |
| 15 to 19 years | 0 (0.0%) | 0.0 |
| 20 to 34 years | 2 (40.0%) | 14.0 |
| 35 to 50 years | 3 (60.0%) | 19.0 |
| Total | 5 (100.0%) | 13.0 |
Fertility by Age by Marriage Status in Upper Nyack
40.0% of women with births (5) in Upper Nyack are married. The highest percentage of unmarried women with births falls into 35 to 50 years age bracket with 100.0% of them unmarried at the time of birth, while the lowest percentage of unmarried women with births belong to 20 to 34 years age bracket with 0.0% of them unmarried.
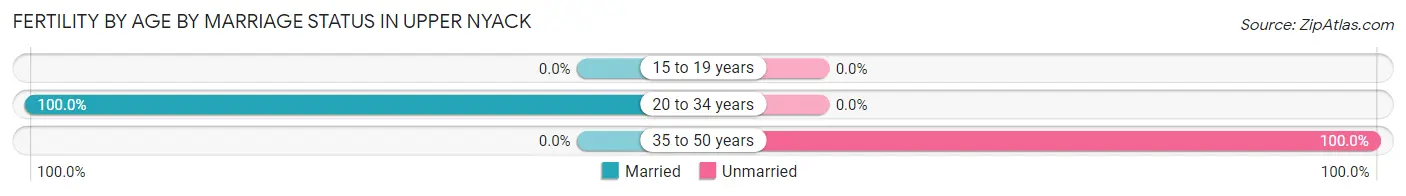
| Age Bracket | Married | Unmarried |
| 15 to 19 years | 0 (0.0%) | 0 (0.0%) |
| 20 to 34 years | 2 (100.0%) | 0 (0.0%) |
| 35 to 50 years | 0 (0.0%) | 3 (100.0%) |
| Total | 2 (40.0%) | 3 (60.0%) |
Fertility by Education in Upper Nyack
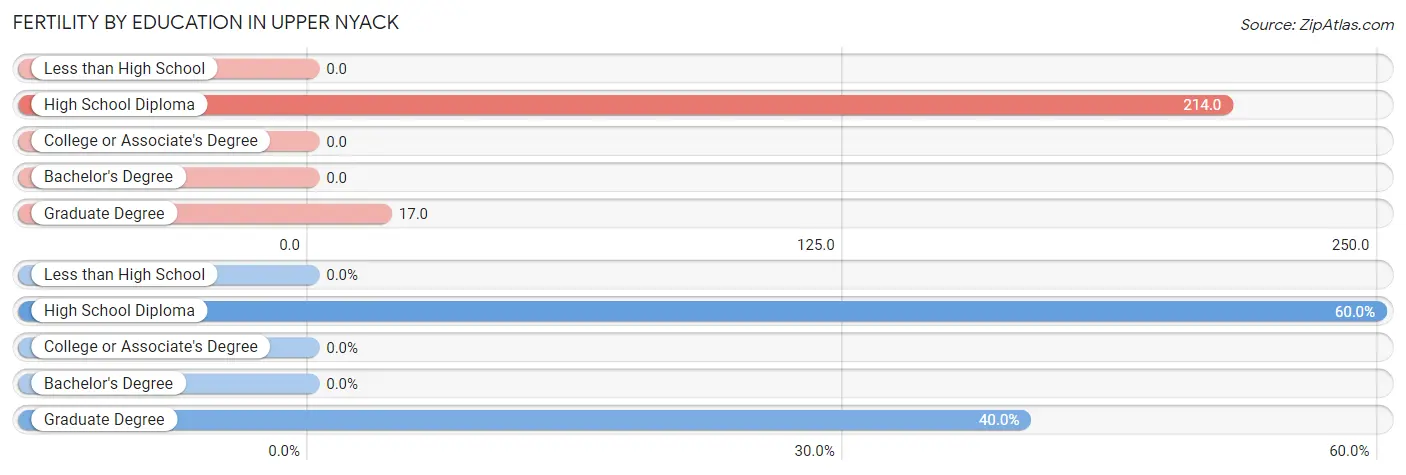
| Educational Attainment | Women with Births | Births / 1,000 Women |
| Less than High School | 0 (0.0%) | 0.0 |
| High School Diploma | 3 (60.0%) | 214.0 |
| College or Associate's Degree | 0 (0.0%) | 0.0 |
| Bachelor's Degree | 0 (0.0%) | 0.0 |
| Graduate Degree | 2 (40.0%) | 17.0 |
| Total | 5 (100.0%) | 13.0 |
Fertility by Education by Marriage Status in Upper Nyack
60.0% of women with births in Upper Nyack are unmarried. Women with the educational attainment of graduate degree are most likely to be married with 100.0% of them married at childbirth, while women with the educational attainment of high school diploma are least likely to be married with 100.0% of them unmarried at childbirth.
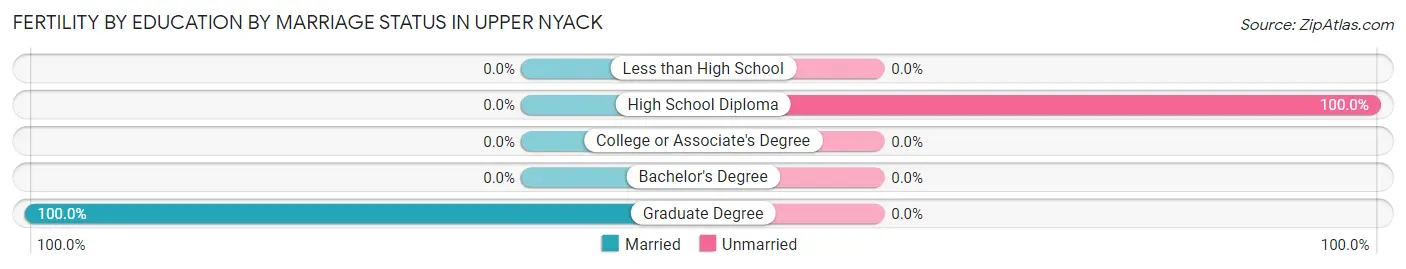
| Educational Attainment | Married | Unmarried |
| Less than High School | 0 (0.0%) | 0 (0.0%) |
| High School Diploma | 0 (0.0%) | 3 (100.0%) |
| College or Associate's Degree | 0 (0.0%) | 0 (0.0%) |
| Bachelor's Degree | 0 (0.0%) | 0 (0.0%) |
| Graduate Degree | 2 (100.0%) | 0 (0.0%) |
| Total | 2 (40.0%) | 3 (60.0%) |
Employment Characteristics in Upper Nyack
Employment by Class of Employer in Upper Nyack
Among the 1,001 employed individuals in Upper Nyack, private company employees (469 | 46.9%), not-for-profit organizations (159 | 15.9%), and local government employees (115 | 11.5%) make up the most common classes of employment.
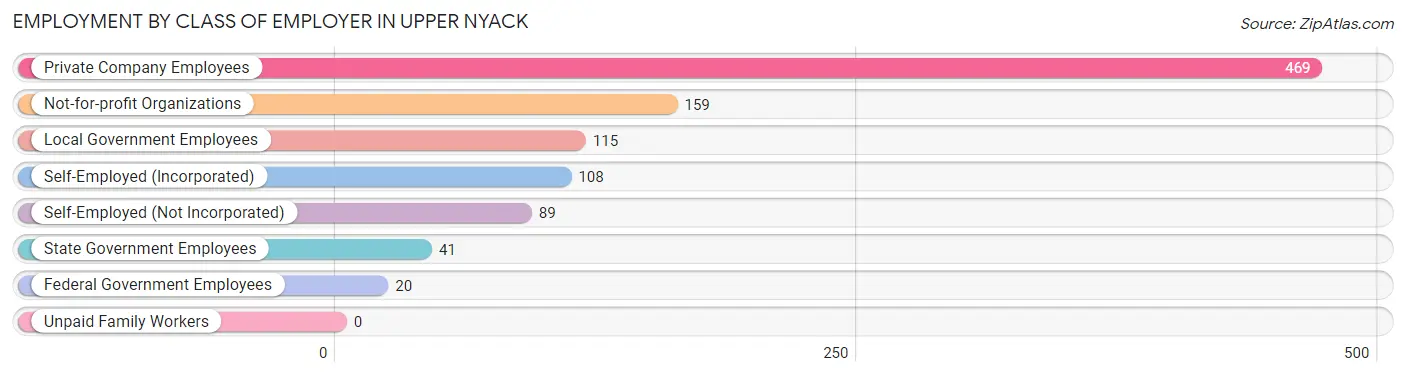
| Employer Class | # Employees | % Employees |
| Private Company Employees | 469 | 46.9% |
| Self-Employed (Incorporated) | 108 | 10.8% |
| Self-Employed (Not Incorporated) | 89 | 8.9% |
| Not-for-profit Organizations | 159 | 15.9% |
| Local Government Employees | 115 | 11.5% |
| State Government Employees | 41 | 4.1% |
| Federal Government Employees | 20 | 2.0% |
| Unpaid Family Workers | 0 | 0.0% |
| Total | 1,001 | 100.0% |
Employment Status by Age in Upper Nyack
According to the labor force statistics for Upper Nyack, out of the total population over 16 years of age (1,802), 61.7% or 1,112 individuals are in the labor force, with 6.3% or 70 of them unemployed. The age group with the highest labor force participation rate is 25 to 29 years, with 100.0% or 33 individuals in the labor force. Within the labor force, the 25 to 29 years age range has the highest percentage of unemployed individuals, with 24.2% or 8 of them being unemployed.
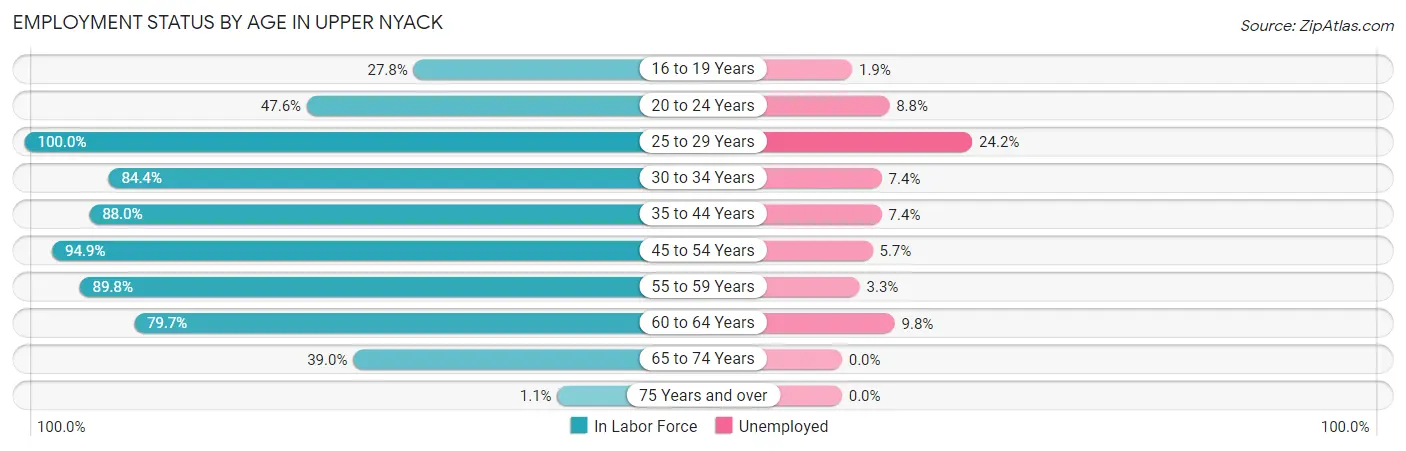
| Age Bracket | In Labor Force | Unemployed |
| 16 to 19 Years | 52 (27.8%) | 1 (1.9%) |
| 20 to 24 Years | 91 (47.6%) | 8 (8.8%) |
| 25 to 29 Years | 33 (100.0%) | 8 (24.2%) |
| 30 to 34 Years | 27 (84.4%) | 2 (7.4%) |
| 35 to 44 Years | 162 (88.0%) | 12 (7.4%) |
| 45 to 54 Years | 282 (94.9%) | 16 (5.7%) |
| 55 to 59 Years | 184 (89.8%) | 6 (3.3%) |
| 60 to 64 Years | 173 (79.7%) | 17 (9.8%) |
| 65 to 74 Years | 105 (39.0%) | 0 (0.0%) |
| 75 Years and over | 2 (1.1%) | 0 (0.0%) |
| Total | 1,112 (61.7%) | 70 (6.3%) |
Employment Status by Educational Attainment in Upper Nyack
According to labor force statistics for Upper Nyack, 88.9% of individuals (861) out of the total population between 25 and 64 years of age (968) are in the labor force, with 7.1% or 61 of them being unemployed. The group with the highest labor force participation rate are those with the educational attainment of less than high school, with 100.0% or 3 individuals in the labor force. Within the labor force, individuals with high school diploma education have the highest percentage of unemployment, with 24.5% or 12 of them being unemployed.
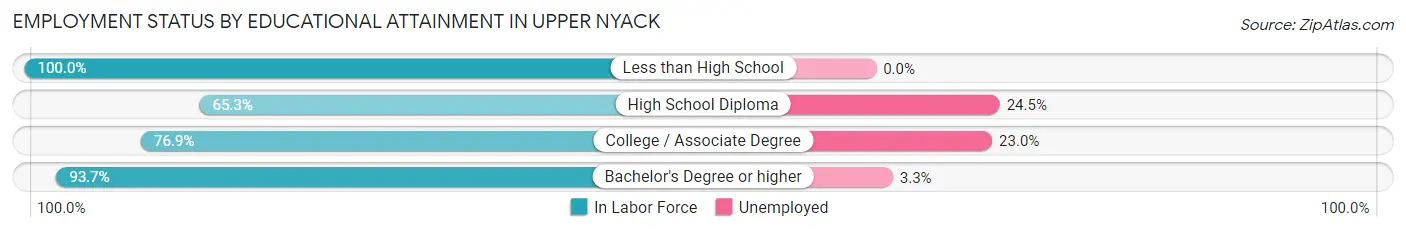
| Educational Attainment | In Labor Force | Unemployed |
| Less than High School | 3 (100.0%) | 0 (0.0%) |
| High School Diploma | 49 (65.3%) | 18 (24.5%) |
| College / Associate Degree | 113 (76.9%) | 34 (23.0%) |
| Bachelor's Degree or higher | 696 (93.7%) | 25 (3.3%) |
| Total | 861 (88.9%) | 69 (7.1%) |
Employment Occupations by Sex in Upper Nyack
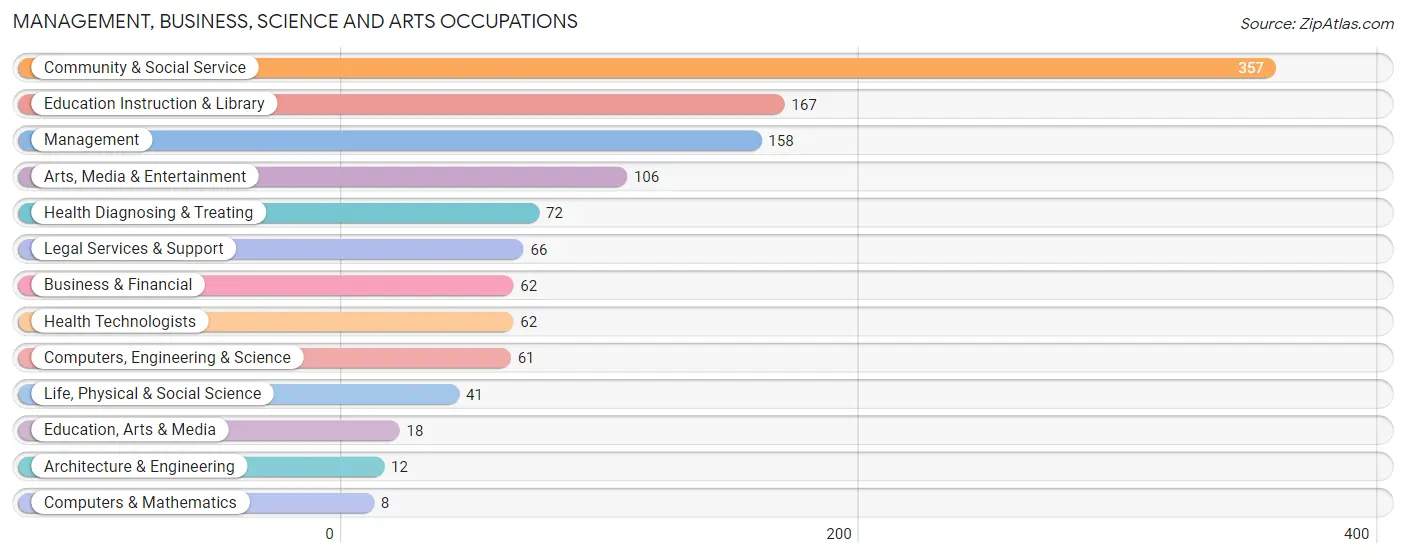
Management, Business, Science and Arts Occupations
The most common Management, Business, Science and Arts occupations in Upper Nyack are Community & Social Service (357 | 34.3%), Education Instruction & Library (167 | 16.0%), Management (158 | 15.2%), Arts, Media & Entertainment (106 | 10.2%), and Health Diagnosing & Treating (72 | 6.9%).
Management, Business, Science and Arts Occupations by Sex
Within the Management, Business, Science and Arts occupations in Upper Nyack, the most male-oriented occupations are Architecture & Engineering (100.0%), Health Technologists (82.3%), and Health Diagnosing & Treating (80.6%), while the most female-oriented occupations are Legal Services & Support (90.9%), Education, Arts & Media (83.3%), and Education Instruction & Library (64.7%).
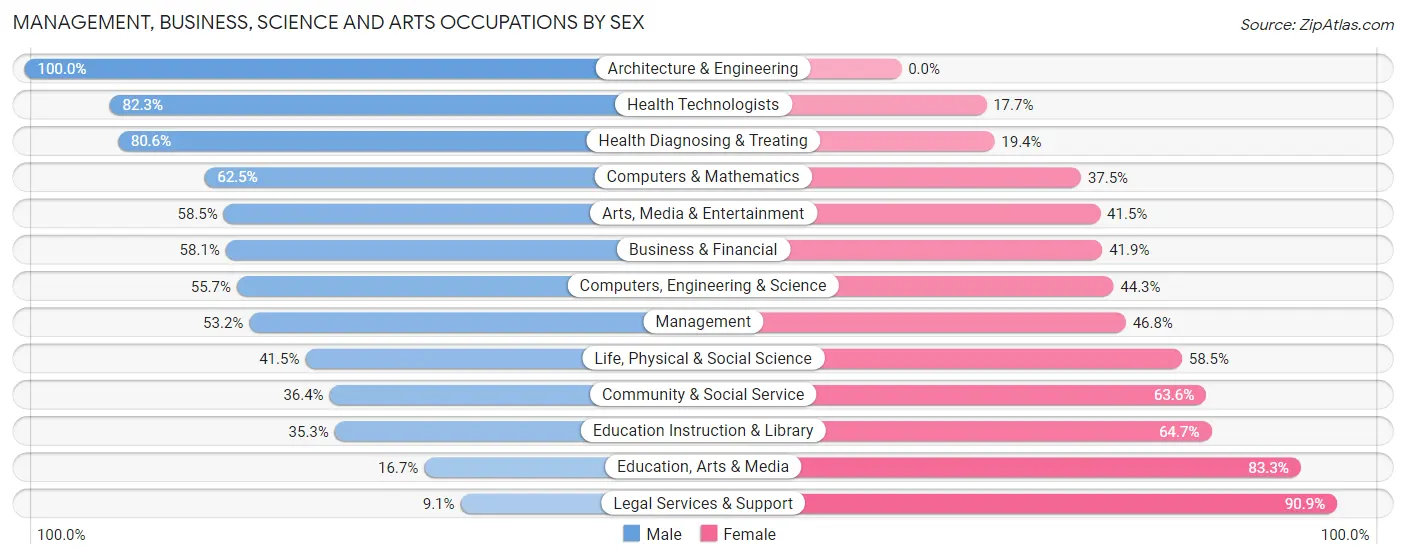
| Occupation | Male | Female |
| Management | 84 (53.2%) | 74 (46.8%) |
| Business & Financial | 36 (58.1%) | 26 (41.9%) |
| Computers, Engineering & Science | 34 (55.7%) | 27 (44.3%) |
| Computers & Mathematics | 5 (62.5%) | 3 (37.5%) |
| Architecture & Engineering | 12 (100.0%) | 0 (0.0%) |
| Life, Physical & Social Science | 17 (41.5%) | 24 (58.5%) |
| Community & Social Service | 130 (36.4%) | 227 (63.6%) |
| Education, Arts & Media | 3 (16.7%) | 15 (83.3%) |
| Legal Services & Support | 6 (9.1%) | 60 (90.9%) |
| Education Instruction & Library | 59 (35.3%) | 108 (64.7%) |
| Arts, Media & Entertainment | 62 (58.5%) | 44 (41.5%) |
| Health Diagnosing & Treating | 58 (80.6%) | 14 (19.4%) |
| Health Technologists | 51 (82.3%) | 11 (17.7%) |
| Total (Category) | 342 (48.2%) | 368 (51.8%) |
| Total (Overall) | 516 (49.6%) | 525 (50.4%) |
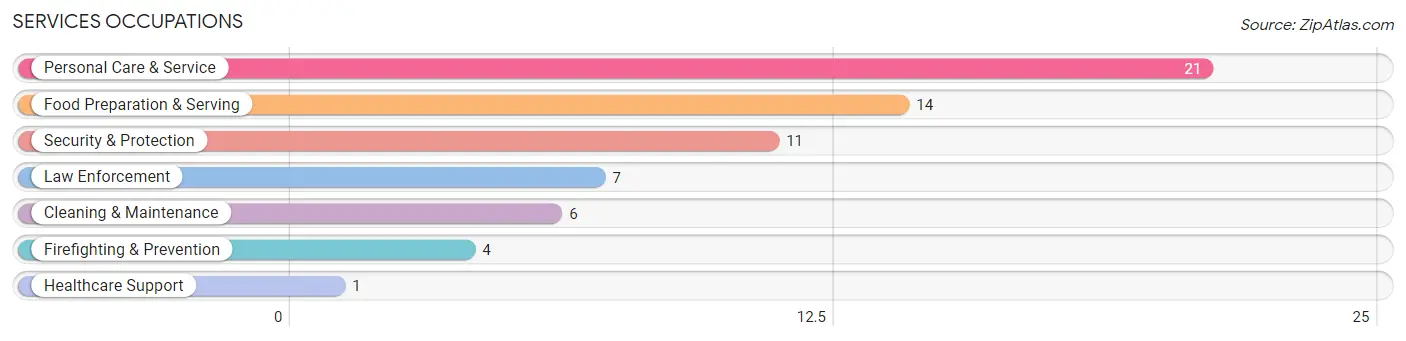
Services Occupations
The most common Services occupations in Upper Nyack are Personal Care & Service (21 | 2.0%), Food Preparation & Serving (14 | 1.3%), Security & Protection (11 | 1.1%), Law Enforcement (7 | 0.7%), and Cleaning & Maintenance (6 | 0.6%).
Services Occupations by Sex
Within the Services occupations in Upper Nyack, the most male-oriented occupations are Law Enforcement (100.0%), Cleaning & Maintenance (100.0%), and Security & Protection (63.6%), while the most female-oriented occupations are Healthcare Support (100.0%), Firefighting & Prevention (100.0%), and Food Preparation & Serving (100.0%).
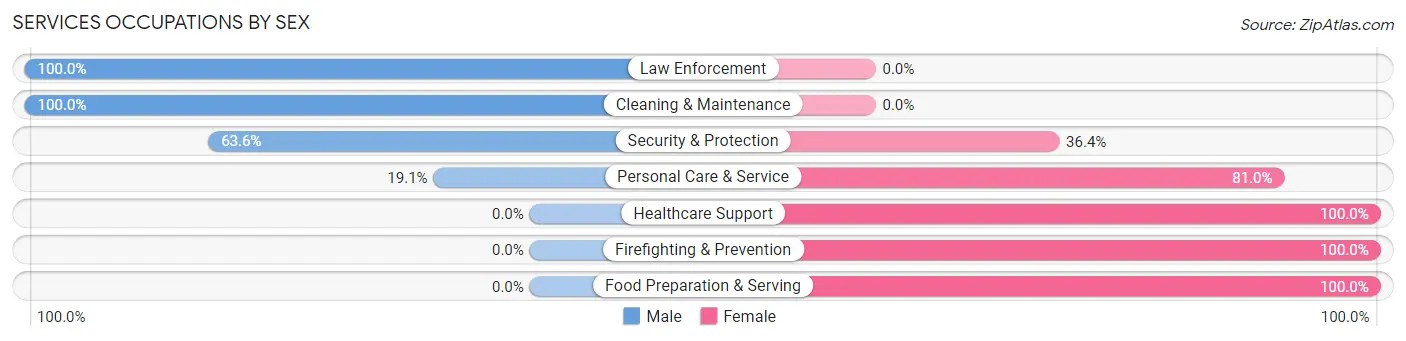
| Occupation | Male | Female |
| Healthcare Support | 0 (0.0%) | 1 (100.0%) |
| Security & Protection | 7 (63.6%) | 4 (36.4%) |
| Firefighting & Prevention | 0 (0.0%) | 4 (100.0%) |
| Law Enforcement | 7 (100.0%) | 0 (0.0%) |
| Food Preparation & Serving | 0 (0.0%) | 14 (100.0%) |
| Cleaning & Maintenance | 6 (100.0%) | 0 (0.0%) |
| Personal Care & Service | 4 (19.1%) | 17 (80.9%) |
| Total (Category) | 17 (32.1%) | 36 (67.9%) |
| Total (Overall) | 516 (49.6%) | 525 (50.4%) |
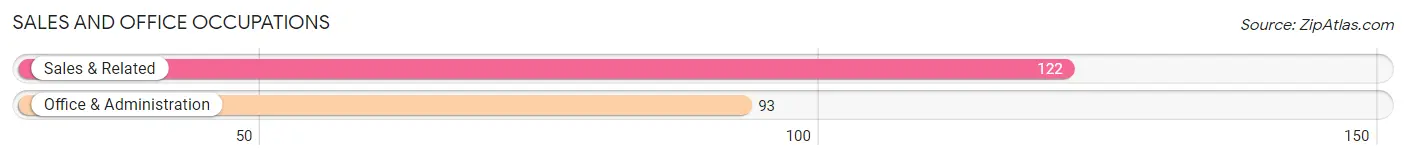
Sales and Office Occupations
The most common Sales and Office occupations in Upper Nyack are Sales & Related (122 | 11.7%), and Office & Administration (93 | 8.9%).
Sales and Office Occupations by Sex
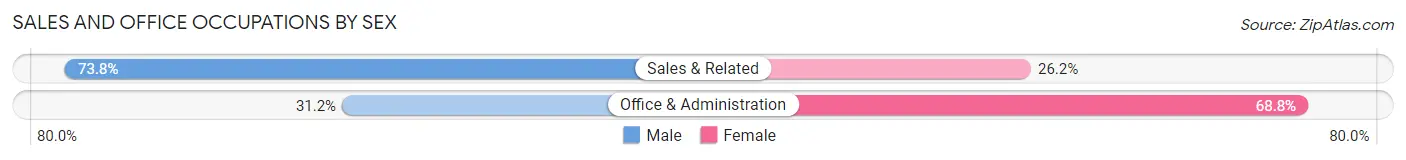
| Occupation | Male | Female |
| Sales & Related | 90 (73.8%) | 32 (26.2%) |
| Office & Administration | 29 (31.2%) | 64 (68.8%) |
| Total (Category) | 119 (55.3%) | 96 (44.7%) |
| Total (Overall) | 516 (49.6%) | 525 (50.4%) |
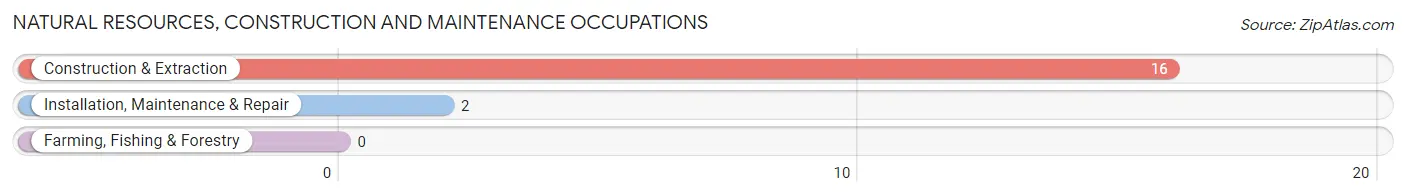
Natural Resources, Construction and Maintenance Occupations
The most common Natural Resources, Construction and Maintenance occupations in Upper Nyack are Construction & Extraction (16 | 1.5%), and Installation, Maintenance & Repair (2 | 0.2%).
Natural Resources, Construction and Maintenance Occupations by Sex
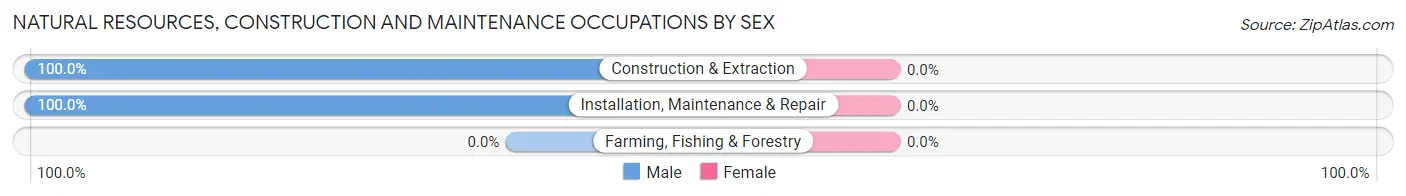
| Occupation | Male | Female |
| Farming, Fishing & Forestry | 0 (0.0%) | 0 (0.0%) |
| Construction & Extraction | 16 (100.0%) | 0 (0.0%) |
| Installation, Maintenance & Repair | 2 (100.0%) | 0 (0.0%) |
| Total (Category) | 18 (100.0%) | 0 (0.0%) |
| Total (Overall) | 516 (49.6%) | 525 (50.4%) |
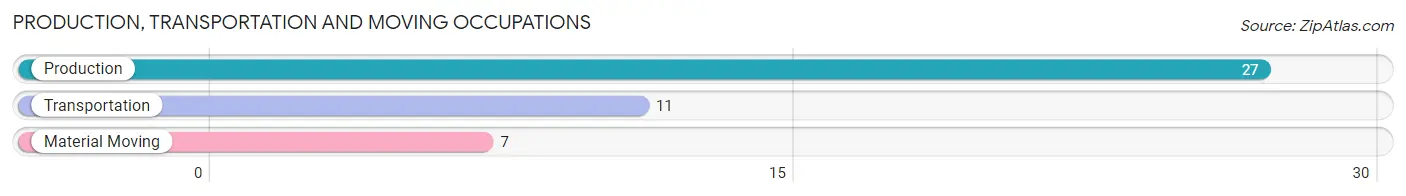
Production, Transportation and Moving Occupations
The most common Production, Transportation and Moving occupations in Upper Nyack are Production (27 | 2.6%), Transportation (11 | 1.1%), and Material Moving (7 | 0.7%).
Production, Transportation and Moving Occupations by Sex
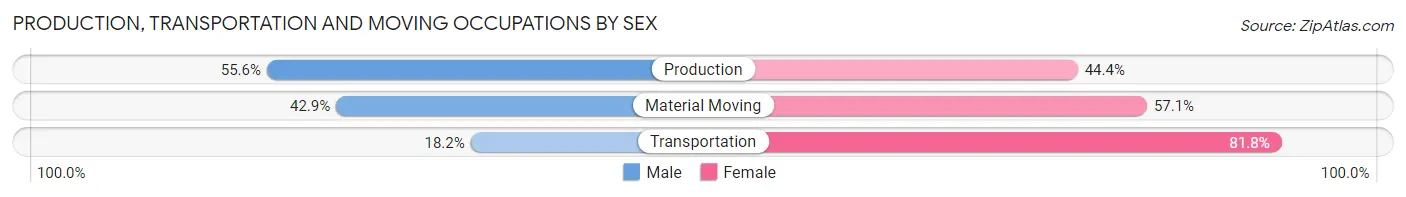
| Occupation | Male | Female |
| Production | 15 (55.6%) | 12 (44.4%) |
| Transportation | 2 (18.2%) | 9 (81.8%) |
| Material Moving | 3 (42.9%) | 4 (57.1%) |
| Total (Category) | 20 (44.4%) | 25 (55.6%) |
| Total (Overall) | 516 (49.6%) | 525 (50.4%) |
Employment Industries by Sex in Upper Nyack
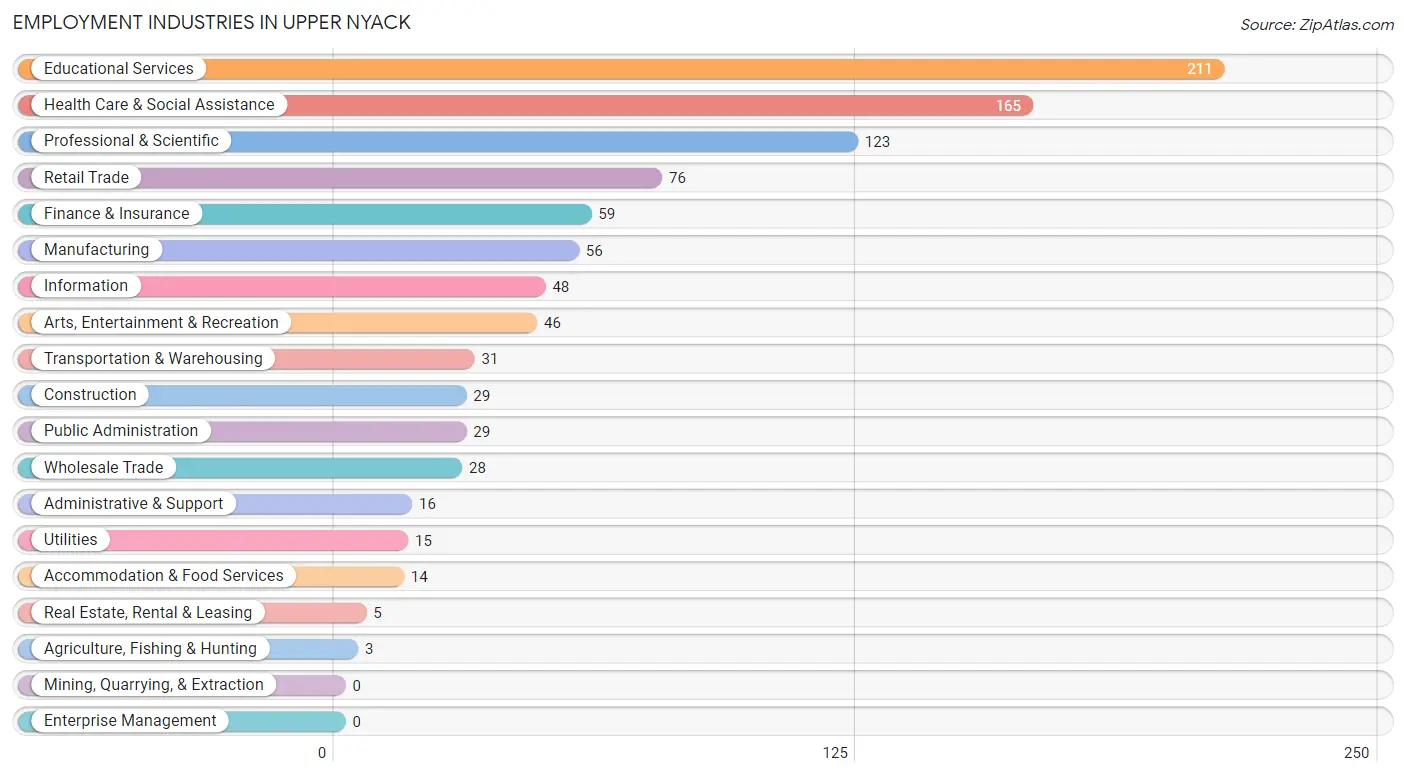
Employment Industries in Upper Nyack
The major employment industries in Upper Nyack include Educational Services (211 | 20.3%), Health Care & Social Assistance (165 | 15.9%), Professional & Scientific (123 | 11.8%), Retail Trade (76 | 7.3%), and Finance & Insurance (59 | 5.7%).
Employment Industries by Sex in Upper Nyack
The Upper Nyack industries that see more men than women are Utilities (100.0%), Real Estate, Rental & Leasing (100.0%), and Finance & Insurance (91.5%), whereas the industries that tend to have a higher number of women are Agriculture, Fishing & Hunting (100.0%), Accommodation & Food Services (100.0%), and Educational Services (64.0%).
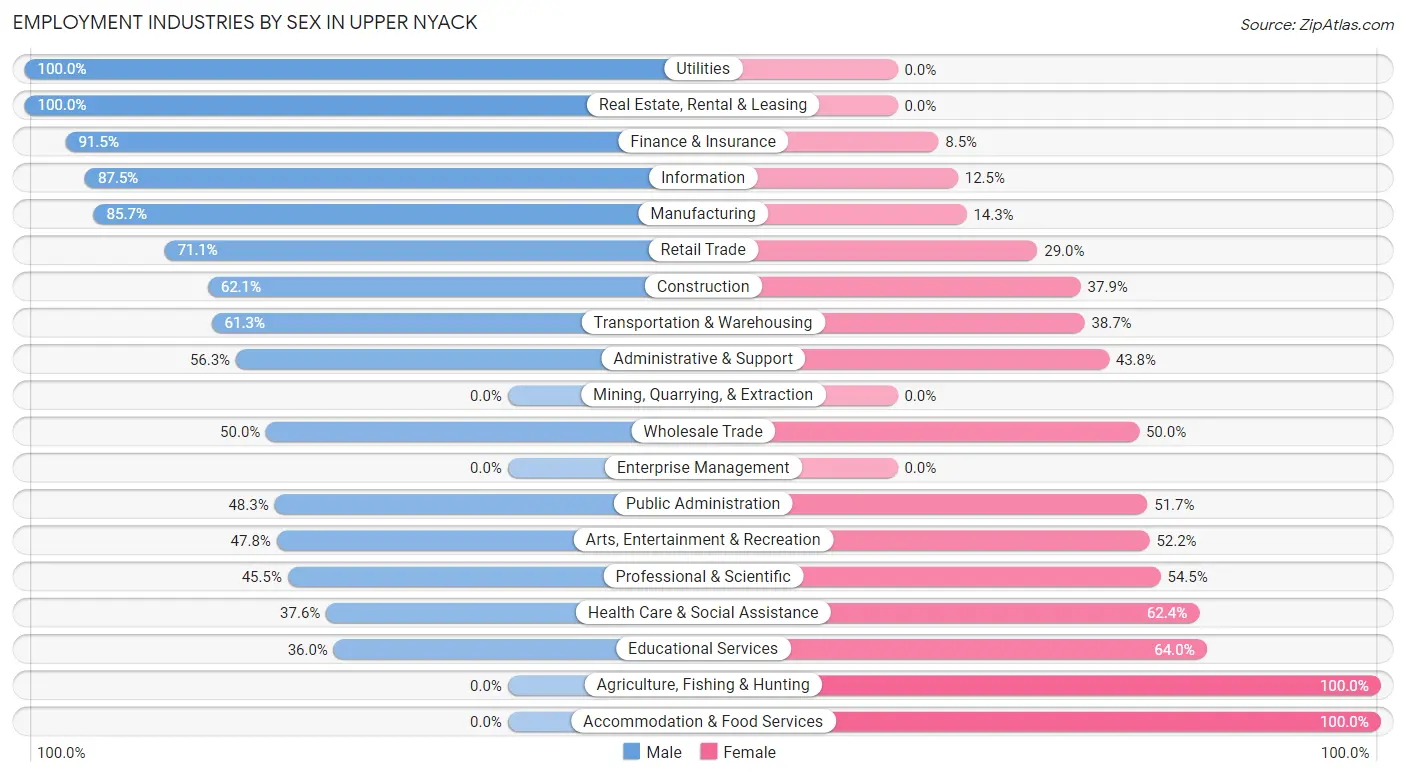
| Industry | Male | Female |
| Agriculture, Fishing & Hunting | 0 (0.0%) | 3 (100.0%) |
| Mining, Quarrying, & Extraction | 0 (0.0%) | 0 (0.0%) |
| Construction | 18 (62.1%) | 11 (37.9%) |
| Manufacturing | 48 (85.7%) | 8 (14.3%) |
| Wholesale Trade | 14 (50.0%) | 14 (50.0%) |
| Retail Trade | 54 (71.1%) | 22 (28.9%) |
| Transportation & Warehousing | 19 (61.3%) | 12 (38.7%) |
| Utilities | 15 (100.0%) | 0 (0.0%) |
| Information | 42 (87.5%) | 6 (12.5%) |
| Finance & Insurance | 54 (91.5%) | 5 (8.5%) |
| Real Estate, Rental & Leasing | 5 (100.0%) | 0 (0.0%) |
| Professional & Scientific | 56 (45.5%) | 67 (54.5%) |
| Enterprise Management | 0 (0.0%) | 0 (0.0%) |
| Administrative & Support | 9 (56.2%) | 7 (43.8%) |
| Educational Services | 76 (36.0%) | 135 (64.0%) |
| Health Care & Social Assistance | 62 (37.6%) | 103 (62.4%) |
| Arts, Entertainment & Recreation | 22 (47.8%) | 24 (52.2%) |
| Accommodation & Food Services | 0 (0.0%) | 14 (100.0%) |
| Public Administration | 14 (48.3%) | 15 (51.7%) |
| Total | 516 (49.6%) | 525 (50.4%) |
Education in Upper Nyack
School Enrollment in Upper Nyack
The most common levels of schooling among the 645 students in Upper Nyack are high school (237 | 36.7%), college / undergraduate (133 | 20.6%), and middle school (120 | 18.6%).
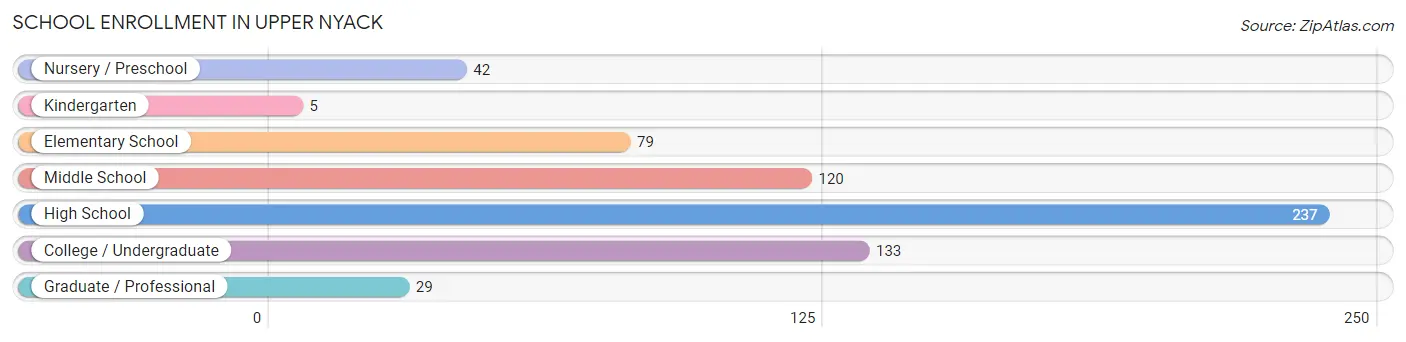
| School Level | # Students | % Students |
| Nursery / Preschool | 42 | 6.5% |
| Kindergarten | 5 | 0.8% |
| Elementary School | 79 | 12.2% |
| Middle School | 120 | 18.6% |
| High School | 237 | 36.7% |
| College / Undergraduate | 133 | 20.6% |
| Graduate / Professional | 29 | 4.5% |
| Total | 645 | 100.0% |
School Enrollment by Age by Funding Source in Upper Nyack
Out of a total of 645 students who are enrolled in schools in Upper Nyack, 234 (36.3%) attend a private institution, while the remaining 411 (63.7%) are enrolled in public schools. The age group of 3 to 4 year olds has the highest likelihood of being enrolled in private schools, with 35 (92.1% in the age bracket) enrolled. Conversely, the age group of 25 to 34 year olds has the lowest likelihood of being enrolled in a private school, with 9 (100.0% in the age bracket) attending a public institution.
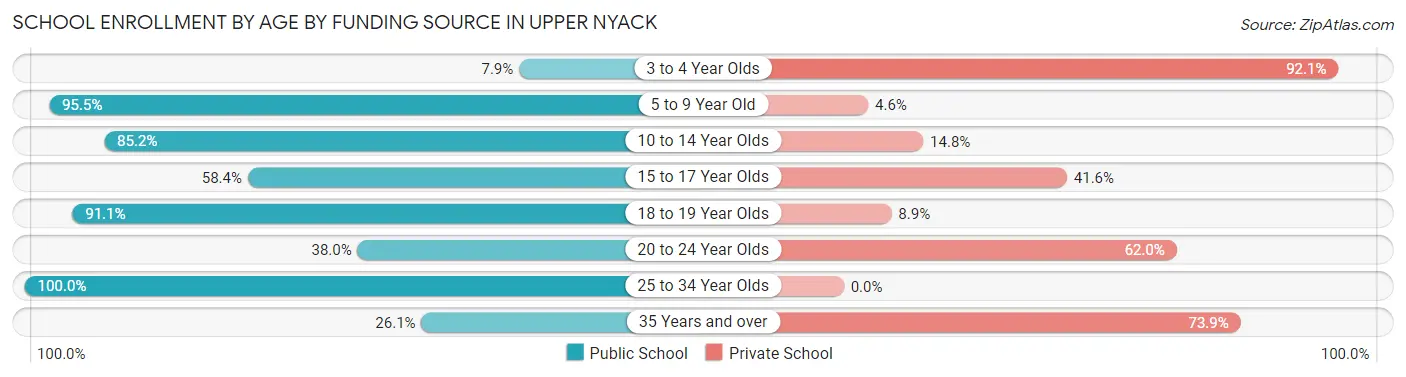
| Age Bracket | Public School | Private School |
| 3 to 4 Year Olds | 3 (7.9%) | 35 (92.1%) |
| 5 to 9 Year Old | 84 (95.5%) | 4 (4.5%) |
| 10 to 14 Year Olds | 115 (85.2%) | 20 (14.8%) |
| 15 to 17 Year Olds | 104 (58.4%) | 74 (41.6%) |
| 18 to 19 Year Olds | 41 (91.1%) | 4 (8.9%) |
| 20 to 24 Year Olds | 49 (38.0%) | 80 (62.0%) |
| 25 to 34 Year Olds | 9 (100.0%) | 0 (0.0%) |
| 35 Years and over | 6 (26.1%) | 17 (73.9%) |
| Total | 411 (63.7%) | 234 (36.3%) |
Educational Attainment by Field of Study in Upper Nyack
Business (148 | 13.1%), visual & performing arts (145 | 12.8%), education (140 | 12.4%), liberal arts & history (129 | 11.4%), and social sciences (116 | 10.3%) are the most common fields of study among 1,129 individuals in Upper Nyack who have obtained a bachelor's degree or higher.
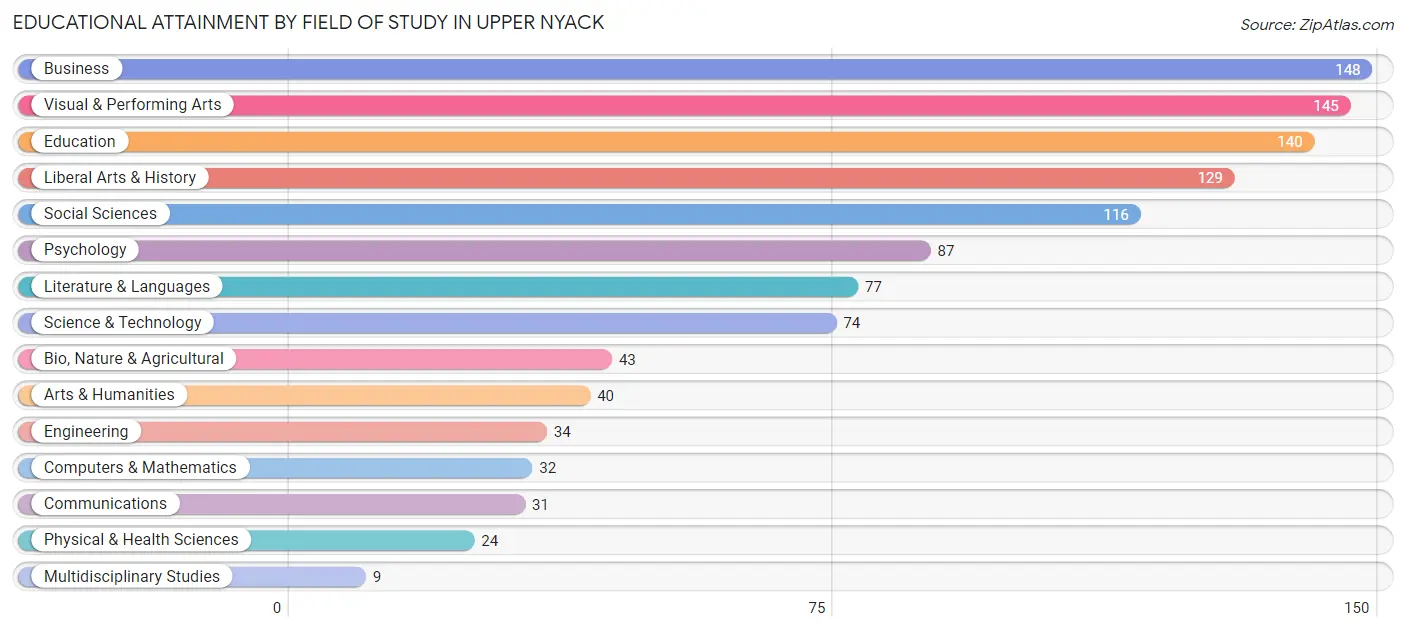
| Field of Study | # Graduates | % Graduates |
| Computers & Mathematics | 32 | 2.8% |
| Bio, Nature & Agricultural | 43 | 3.8% |
| Physical & Health Sciences | 24 | 2.1% |
| Psychology | 87 | 7.7% |
| Social Sciences | 116 | 10.3% |
| Engineering | 34 | 3.0% |
| Multidisciplinary Studies | 9 | 0.8% |
| Science & Technology | 74 | 6.6% |
| Business | 148 | 13.1% |
| Education | 140 | 12.4% |
| Literature & Languages | 77 | 6.8% |
| Liberal Arts & History | 129 | 11.4% |
| Visual & Performing Arts | 145 | 12.8% |
| Communications | 31 | 2.8% |
| Arts & Humanities | 40 | 3.5% |
| Total | 1,129 | 100.0% |
Transportation & Commute in Upper Nyack
Vehicle Availability by Sex in Upper Nyack
The most prevalent vehicle ownership categories in Upper Nyack are males with 2 vehicles (256, accounting for 50.1%) and females with 2 vehicles (218, making up 52.6%).
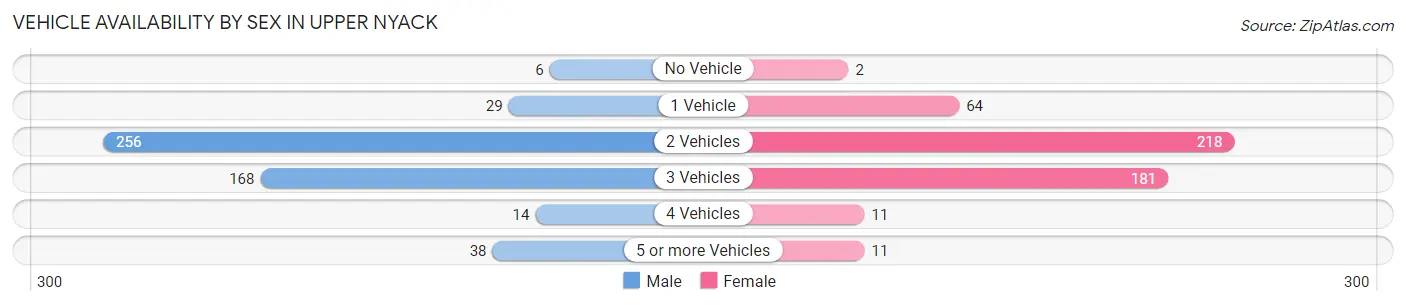
| Vehicles Available | Male | Female |
| No Vehicle | 6 (1.2%) | 2 (0.4%) |
| 1 Vehicle | 29 (5.7%) | 64 (13.1%) |
| 2 Vehicles | 256 (50.1%) | 218 (44.8%) |
| 3 Vehicles | 168 (32.9%) | 181 (37.2%) |
| 4 Vehicles | 14 (2.7%) | 11 (2.3%) |
| 5 or more Vehicles | 38 (7.4%) | 11 (2.3%) |
| Total | 511 (100.0%) | 487 (100.0%) |
Commute Time in Upper Nyack
The most frequently occuring commute durations in Upper Nyack are 45 to 59 minutes (125 commuters, 17.3%), 15 to 19 minutes (120 commuters, 16.6%), and 60 to 89 minutes (112 commuters, 15.5%).
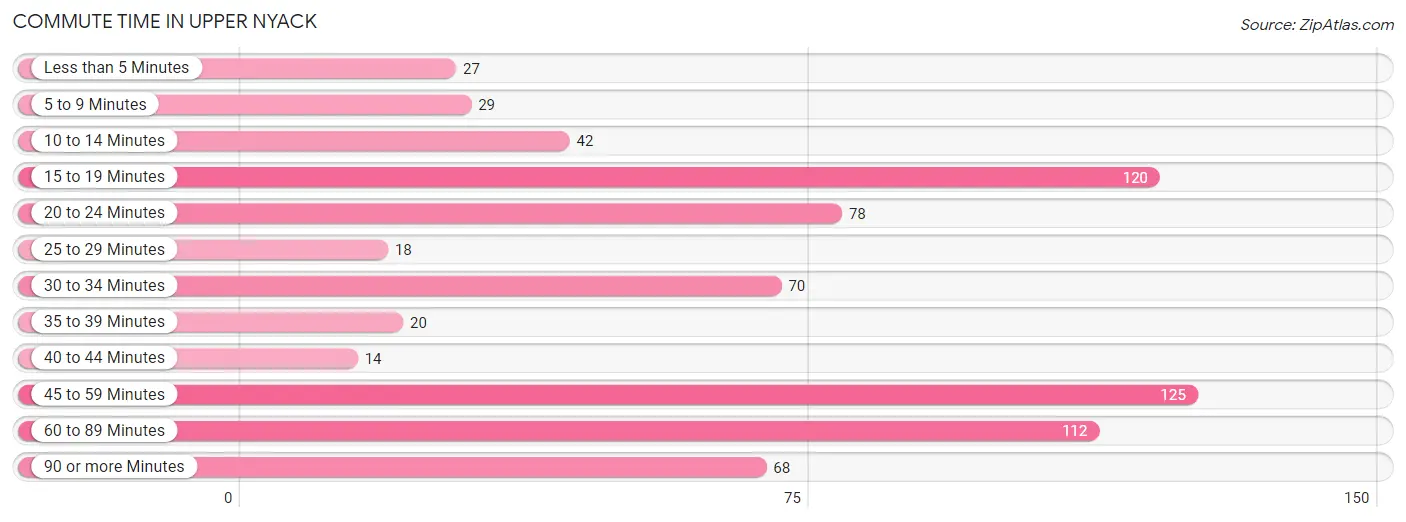
| Commute Time | # Commuters | % Commuters |
| Less than 5 Minutes | 27 | 3.7% |
| 5 to 9 Minutes | 29 | 4.0% |
| 10 to 14 Minutes | 42 | 5.8% |
| 15 to 19 Minutes | 120 | 16.6% |
| 20 to 24 Minutes | 78 | 10.8% |
| 25 to 29 Minutes | 18 | 2.5% |
| 30 to 34 Minutes | 70 | 9.7% |
| 35 to 39 Minutes | 20 | 2.8% |
| 40 to 44 Minutes | 14 | 1.9% |
| 45 to 59 Minutes | 125 | 17.3% |
| 60 to 89 Minutes | 112 | 15.5% |
| 90 or more Minutes | 68 | 9.4% |
Commute Time by Sex in Upper Nyack
The most common commute times in Upper Nyack are 45 to 59 minutes (84 commuters, 20.9%) for males and 15 to 19 minutes (85 commuters, 26.5%) for females.
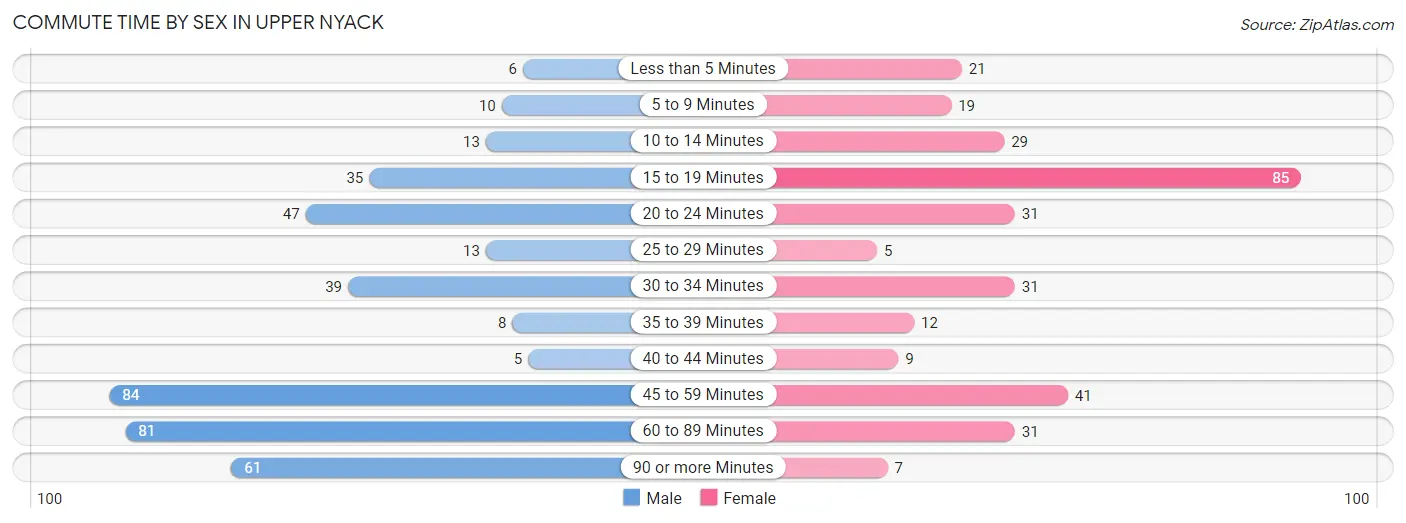
| Commute Time | Male | Female |
| Less than 5 Minutes | 6 (1.5%) | 21 (6.5%) |
| 5 to 9 Minutes | 10 (2.5%) | 19 (5.9%) |
| 10 to 14 Minutes | 13 (3.2%) | 29 (9.0%) |
| 15 to 19 Minutes | 35 (8.7%) | 85 (26.5%) |
| 20 to 24 Minutes | 47 (11.7%) | 31 (9.7%) |
| 25 to 29 Minutes | 13 (3.2%) | 5 (1.6%) |
| 30 to 34 Minutes | 39 (9.7%) | 31 (9.7%) |
| 35 to 39 Minutes | 8 (2.0%) | 12 (3.7%) |
| 40 to 44 Minutes | 5 (1.2%) | 9 (2.8%) |
| 45 to 59 Minutes | 84 (20.9%) | 41 (12.8%) |
| 60 to 89 Minutes | 81 (20.2%) | 31 (9.7%) |
| 90 or more Minutes | 61 (15.2%) | 7 (2.2%) |
Time of Departure to Work by Sex in Upper Nyack
The most frequent times of departure to work in Upper Nyack are 6:00 AM to 6:29 AM (88, 21.9%) for males and 8:00 AM to 8:29 AM (60, 18.7%) for females.
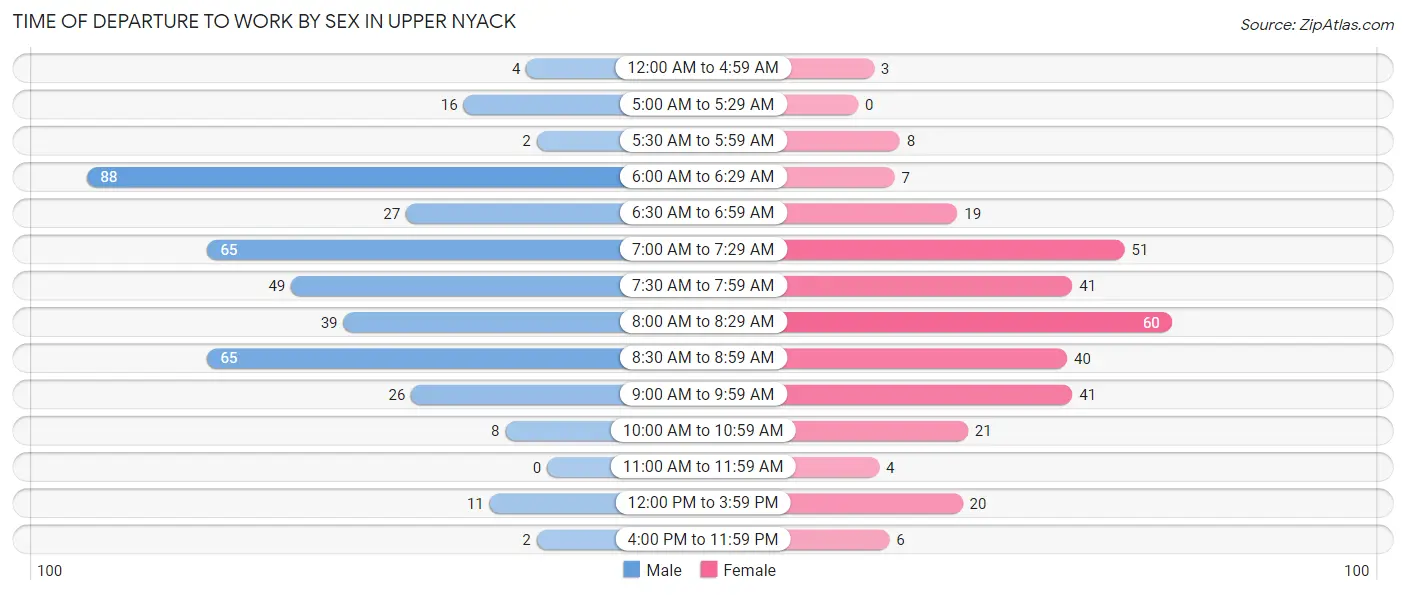
| Time of Departure | Male | Female |
| 12:00 AM to 4:59 AM | 4 (1.0%) | 3 (0.9%) |
| 5:00 AM to 5:29 AM | 16 (4.0%) | 0 (0.0%) |
| 5:30 AM to 5:59 AM | 2 (0.5%) | 8 (2.5%) |
| 6:00 AM to 6:29 AM | 88 (21.9%) | 7 (2.2%) |
| 6:30 AM to 6:59 AM | 27 (6.7%) | 19 (5.9%) |
| 7:00 AM to 7:29 AM | 65 (16.2%) | 51 (15.9%) |
| 7:30 AM to 7:59 AM | 49 (12.2%) | 41 (12.8%) |
| 8:00 AM to 8:29 AM | 39 (9.7%) | 60 (18.7%) |
| 8:30 AM to 8:59 AM | 65 (16.2%) | 40 (12.5%) |
| 9:00 AM to 9:59 AM | 26 (6.5%) | 41 (12.8%) |
| 10:00 AM to 10:59 AM | 8 (2.0%) | 21 (6.5%) |
| 11:00 AM to 11:59 AM | 0 (0.0%) | 4 (1.3%) |
| 12:00 PM to 3:59 PM | 11 (2.7%) | 20 (6.2%) |
| 4:00 PM to 11:59 PM | 2 (0.5%) | 6 (1.9%) |
| Total | 402 (100.0%) | 321 (100.0%) |
Housing Occupancy in Upper Nyack
Occupancy by Ownership in Upper Nyack
Of the total 737 dwellings in Upper Nyack, owner-occupied units account for 688 (93.3%), while renter-occupied units make up 49 (6.7%).
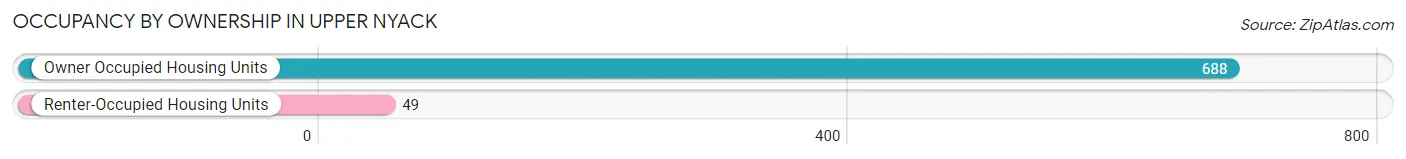
| Occupancy | # Housing Units | % Housing Units |
| Owner Occupied Housing Units | 688 | 93.3% |
| Renter-Occupied Housing Units | 49 | 6.7% |
| Total Occupied Housing Units | 737 | 100.0% |
Occupancy by Household Size in Upper Nyack
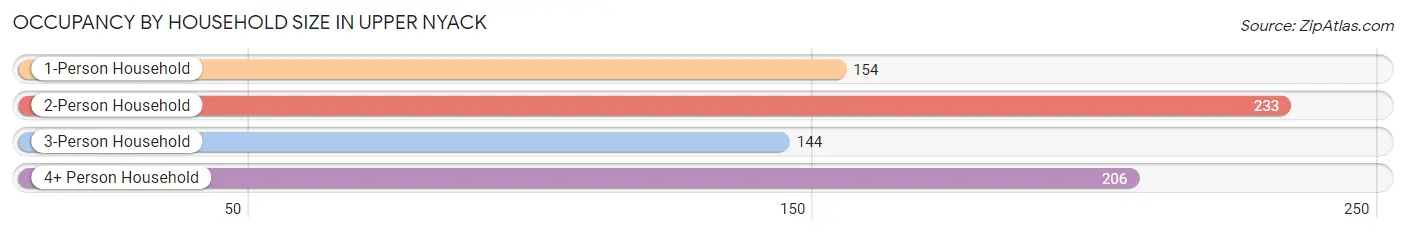
| Household Size | # Housing Units | % Housing Units |
| 1-Person Household | 154 | 20.9% |
| 2-Person Household | 233 | 31.6% |
| 3-Person Household | 144 | 19.5% |
| 4+ Person Household | 206 | 28.0% |
| Total Housing Units | 737 | 100.0% |
Occupancy by Ownership by Household Size in Upper Nyack
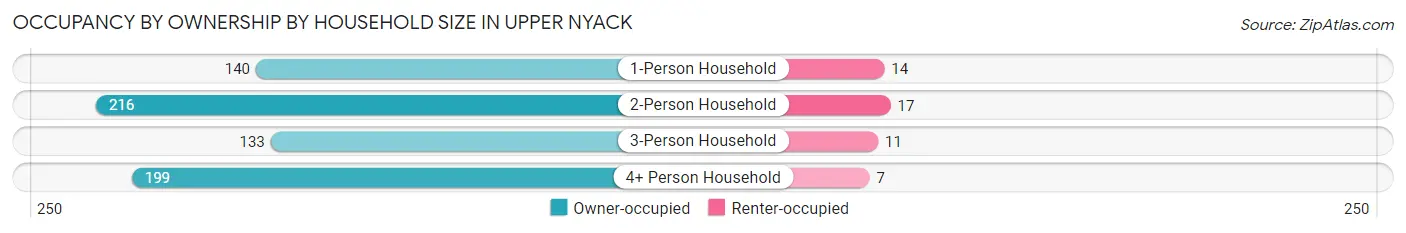
| Household Size | Owner-occupied | Renter-occupied |
| 1-Person Household | 140 (90.9%) | 14 (9.1%) |
| 2-Person Household | 216 (92.7%) | 17 (7.3%) |
| 3-Person Household | 133 (92.4%) | 11 (7.6%) |
| 4+ Person Household | 199 (96.6%) | 7 (3.4%) |
| Total Housing Units | 688 (93.3%) | 49 (6.7%) |
Occupancy by Educational Attainment in Upper Nyack
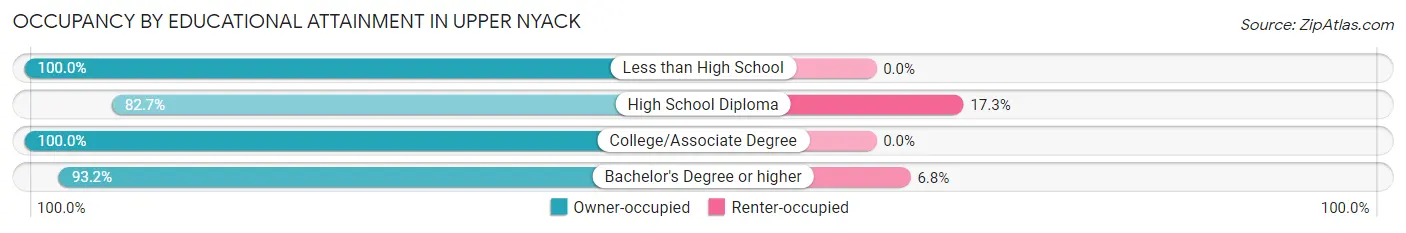
| Household Size | Owner-occupied | Renter-occupied |
| Less than High School | 20 (100.0%) | 0 (0.0%) |
| High School Diploma | 43 (82.7%) | 9 (17.3%) |
| College/Associate Degree | 77 (100.0%) | 0 (0.0%) |
| Bachelor's Degree or higher | 548 (93.2%) | 40 (6.8%) |
Occupancy by Age of Householder in Upper Nyack
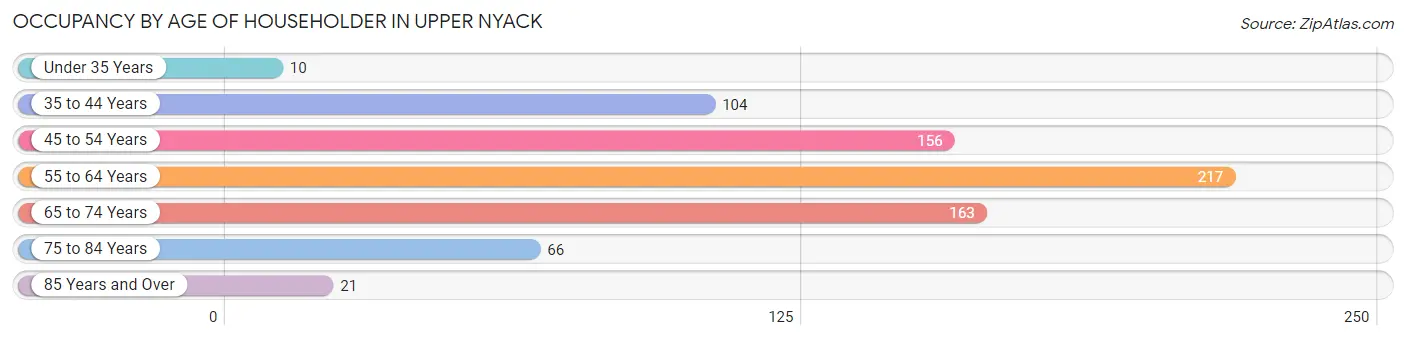
| Age Bracket | # Households | % Households |
| Under 35 Years | 10 | 1.4% |
| 35 to 44 Years | 104 | 14.1% |
| 45 to 54 Years | 156 | 21.2% |
| 55 to 64 Years | 217 | 29.4% |
| 65 to 74 Years | 163 | 22.1% |
| 75 to 84 Years | 66 | 9.0% |
| 85 Years and Over | 21 | 2.9% |
| Total | 737 | 100.0% |
Housing Finances in Upper Nyack
Median Income by Occupancy in Upper Nyack
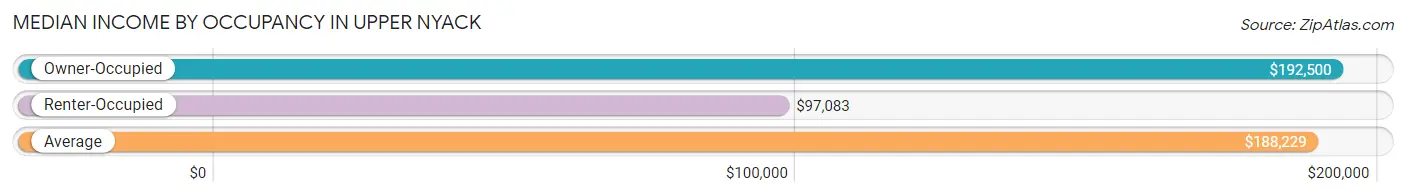
| Occupancy Type | # Households | Median Income |
| Owner-Occupied | 688 (93.3%) | $192,500 |
| Renter-Occupied | 49 (6.7%) | $97,083 |
| Average | 737 (100.0%) | $188,229 |
Occupancy by Householder Income Bracket in Upper Nyack
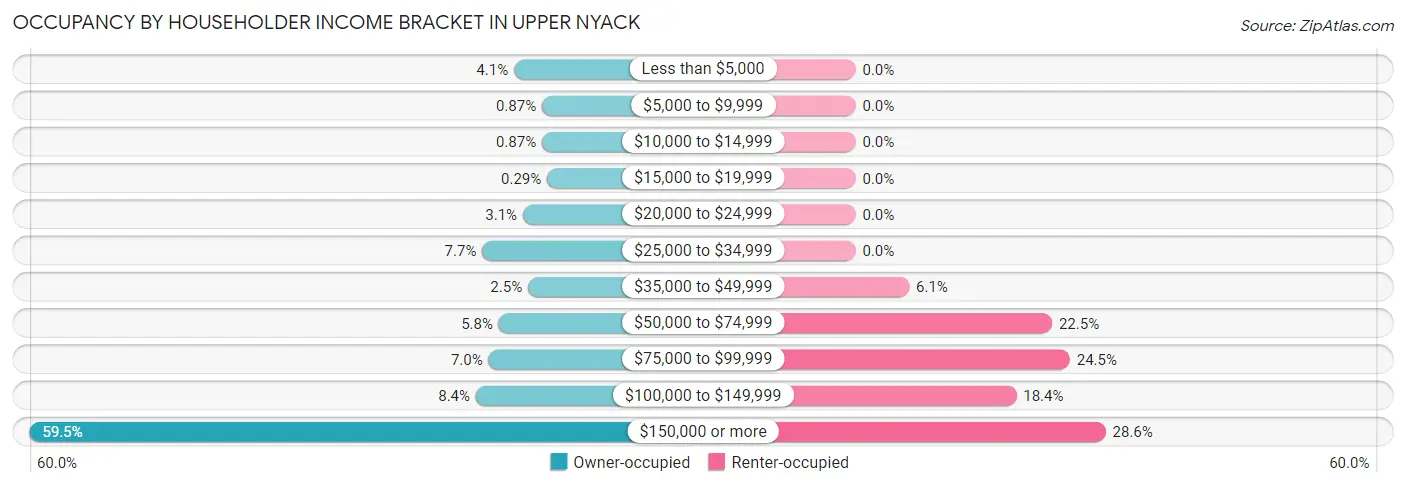
| Income Bracket | Owner-occupied | Renter-occupied |
| Less than $5,000 | 28 (4.1%) | 0 (0.0%) |
| $5,000 to $9,999 | 6 (0.9%) | 0 (0.0%) |
| $10,000 to $14,999 | 6 (0.9%) | 0 (0.0%) |
| $15,000 to $19,999 | 2 (0.3%) | 0 (0.0%) |
| $20,000 to $24,999 | 21 (3.0%) | 0 (0.0%) |
| $25,000 to $34,999 | 53 (7.7%) | 0 (0.0%) |
| $35,000 to $49,999 | 17 (2.5%) | 3 (6.1%) |
| $50,000 to $74,999 | 40 (5.8%) | 11 (22.5%) |
| $75,000 to $99,999 | 48 (7.0%) | 12 (24.5%) |
| $100,000 to $149,999 | 58 (8.4%) | 9 (18.4%) |
| $150,000 or more | 409 (59.5%) | 14 (28.6%) |
| Total | 688 (100.0%) | 49 (100.0%) |
Monthly Housing Cost Tiers in Upper Nyack
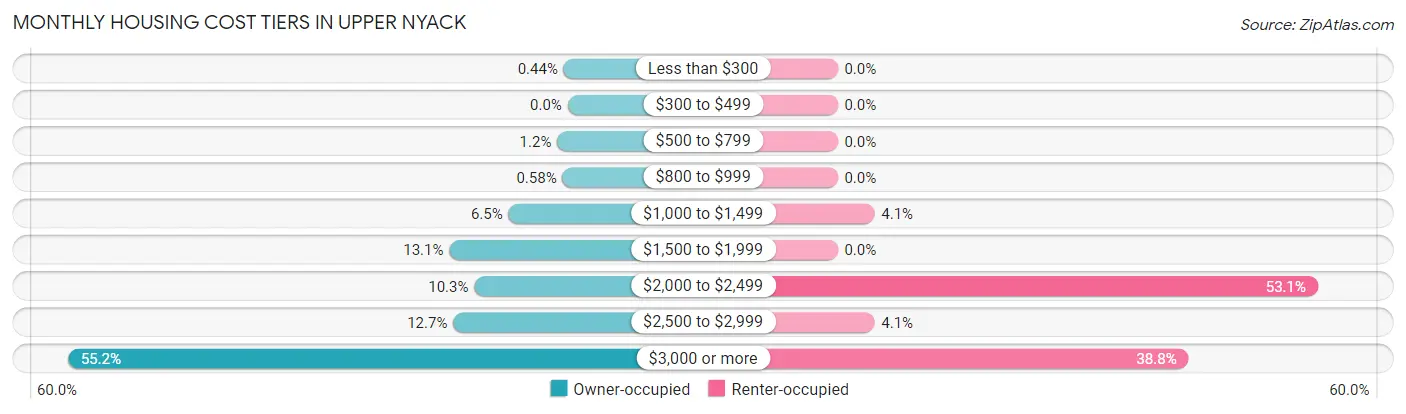
| Monthly Cost | Owner-occupied | Renter-occupied |
| Less than $300 | 3 (0.4%) | 0 (0.0%) |
| $300 to $499 | 0 (0.0%) | 0 (0.0%) |
| $500 to $799 | 8 (1.2%) | 0 (0.0%) |
| $800 to $999 | 4 (0.6%) | 0 (0.0%) |
| $1,000 to $1,499 | 45 (6.5%) | 2 (4.1%) |
| $1,500 to $1,999 | 90 (13.1%) | 0 (0.0%) |
| $2,000 to $2,499 | 71 (10.3%) | 26 (53.1%) |
| $2,500 to $2,999 | 87 (12.7%) | 2 (4.1%) |
| $3,000 or more | 380 (55.2%) | 19 (38.8%) |
| Total | 688 (100.0%) | 49 (100.0%) |
Physical Housing Characteristics in Upper Nyack
Housing Structures in Upper Nyack
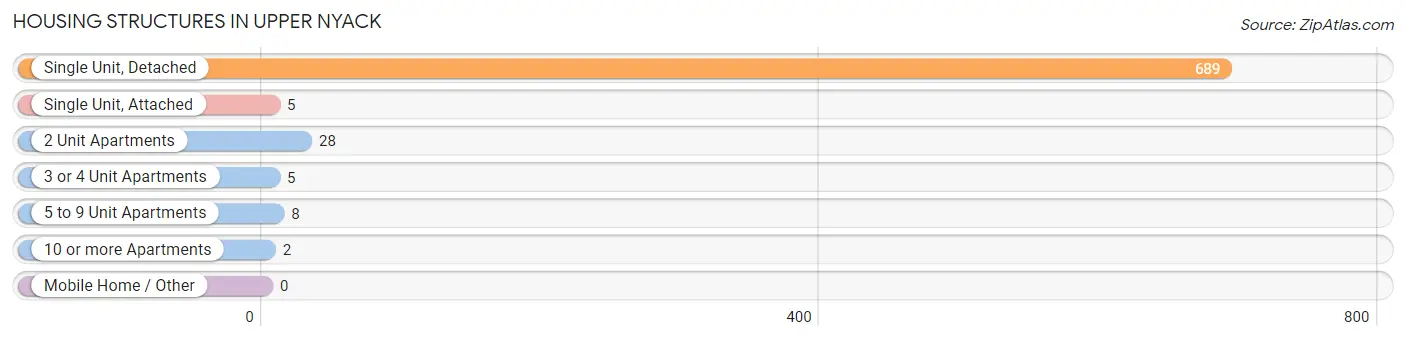
| Structure Type | # Housing Units | % Housing Units |
| Single Unit, Detached | 689 | 93.5% |
| Single Unit, Attached | 5 | 0.7% |
| 2 Unit Apartments | 28 | 3.8% |
| 3 or 4 Unit Apartments | 5 | 0.7% |
| 5 to 9 Unit Apartments | 8 | 1.1% |
| 10 or more Apartments | 2 | 0.3% |
| Mobile Home / Other | 0 | 0.0% |
| Total | 737 | 100.0% |
Housing Structures by Occupancy in Upper Nyack
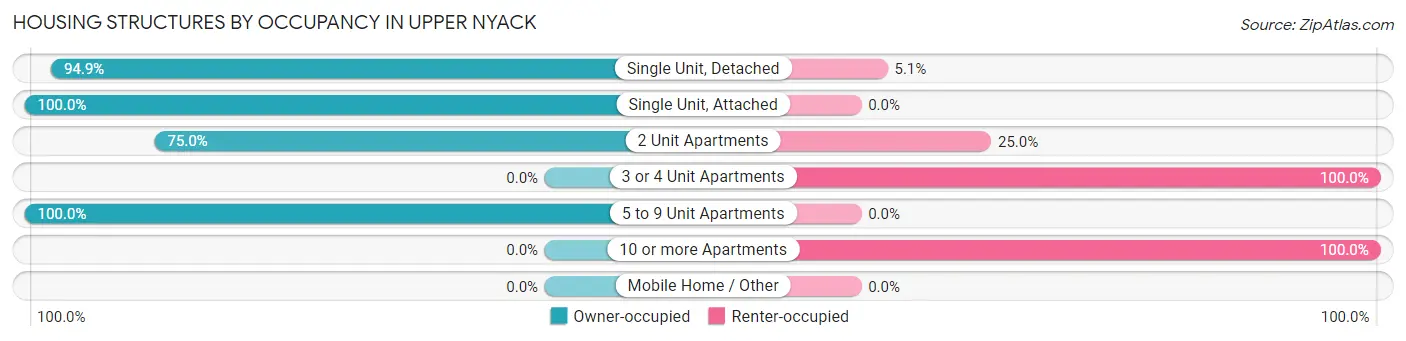
| Structure Type | Owner-occupied | Renter-occupied |
| Single Unit, Detached | 654 (94.9%) | 35 (5.1%) |
| Single Unit, Attached | 5 (100.0%) | 0 (0.0%) |
| 2 Unit Apartments | 21 (75.0%) | 7 (25.0%) |
| 3 or 4 Unit Apartments | 0 (0.0%) | 5 (100.0%) |
| 5 to 9 Unit Apartments | 8 (100.0%) | 0 (0.0%) |
| 10 or more Apartments | 0 (0.0%) | 2 (100.0%) |
| Mobile Home / Other | 0 (0.0%) | 0 (0.0%) |
| Total | 688 (93.3%) | 49 (6.7%) |
Housing Structures by Number of Rooms in Upper Nyack
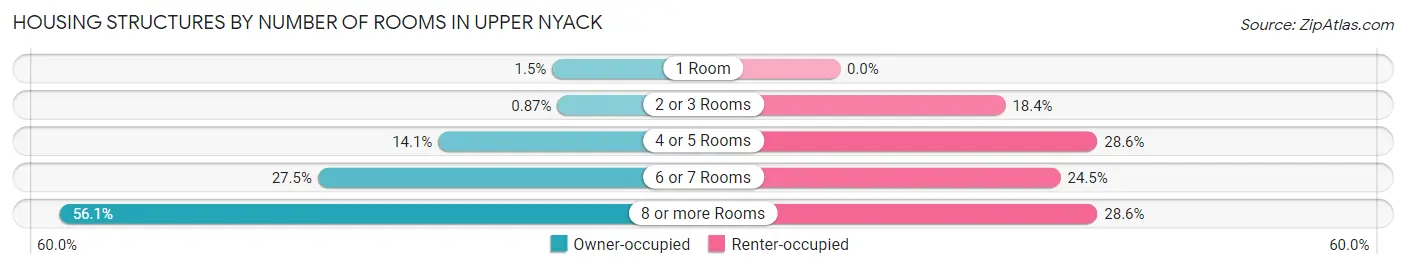
| Number of Rooms | Owner-occupied | Renter-occupied |
| 1 Room | 10 (1.5%) | 0 (0.0%) |
| 2 or 3 Rooms | 6 (0.9%) | 9 (18.4%) |
| 4 or 5 Rooms | 97 (14.1%) | 14 (28.6%) |
| 6 or 7 Rooms | 189 (27.5%) | 12 (24.5%) |
| 8 or more Rooms | 386 (56.1%) | 14 (28.6%) |
| Total | 688 (100.0%) | 49 (100.0%) |
Housing Structure by Heating Type in Upper Nyack
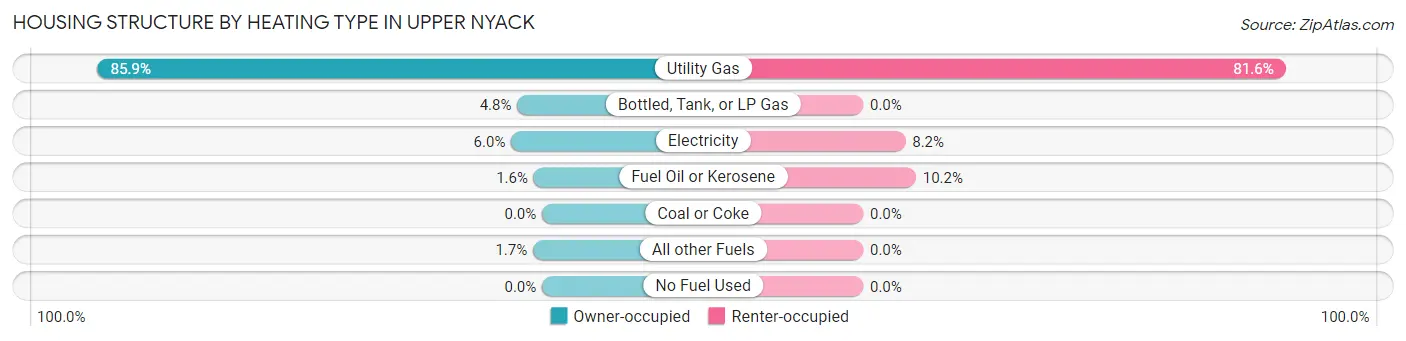
| Heating Type | Owner-occupied | Renter-occupied |
| Utility Gas | 591 (85.9%) | 40 (81.6%) |
| Bottled, Tank, or LP Gas | 33 (4.8%) | 0 (0.0%) |
| Electricity | 41 (6.0%) | 4 (8.2%) |
| Fuel Oil or Kerosene | 11 (1.6%) | 5 (10.2%) |
| Coal or Coke | 0 (0.0%) | 0 (0.0%) |
| All other Fuels | 12 (1.7%) | 0 (0.0%) |
| No Fuel Used | 0 (0.0%) | 0 (0.0%) |
| Total | 688 (100.0%) | 49 (100.0%) |
Household Vehicle Usage in Upper Nyack
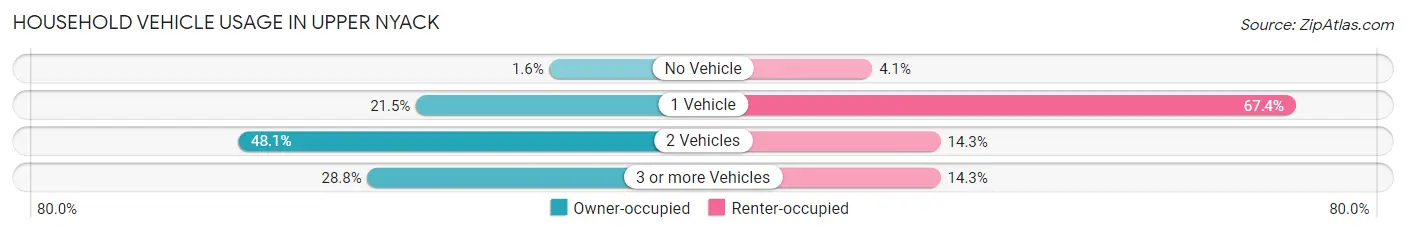
| Vehicles per Household | Owner-occupied | Renter-occupied |
| No Vehicle | 11 (1.6%) | 2 (4.1%) |
| 1 Vehicle | 148 (21.5%) | 33 (67.3%) |
| 2 Vehicles | 331 (48.1%) | 7 (14.3%) |
| 3 or more Vehicles | 198 (28.8%) | 7 (14.3%) |
| Total | 688 (100.0%) | 49 (100.0%) |
Real Estate & Mortgages in Upper Nyack
Real Estate and Mortgage Overview in Upper Nyack
| Characteristic | Without Mortgage | With Mortgage |
| Housing Units | 267 | 421 |
| Median Property Value | $683,900 | $663,300 |
| Median Household Income | $153,750 | $271 |
| Monthly Housing Costs | $1,501 | $323 |
| Real Estate Taxes | $10,001 | $0 |
Property Value by Mortgage Status in Upper Nyack
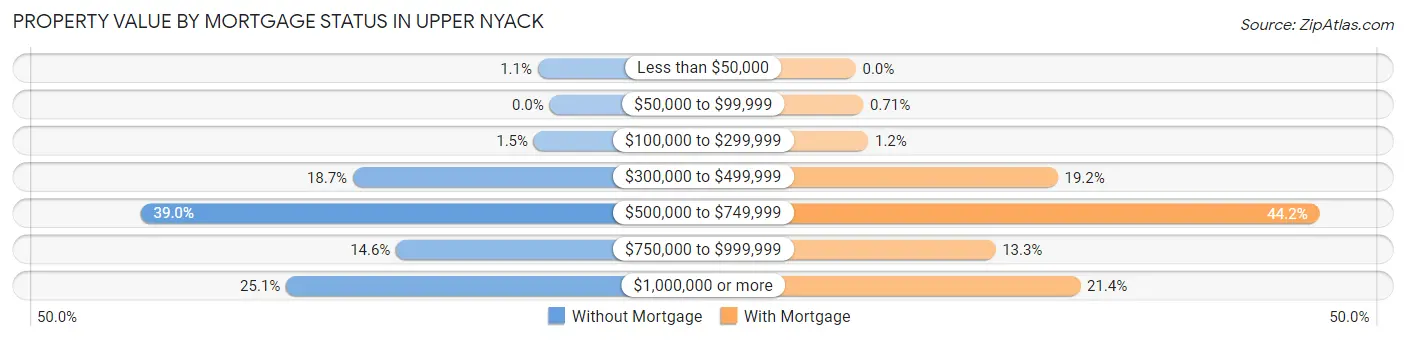
| Property Value | Without Mortgage | With Mortgage |
| Less than $50,000 | 3 (1.1%) | 0 (0.0%) |
| $50,000 to $99,999 | 0 (0.0%) | 3 (0.7%) |
| $100,000 to $299,999 | 4 (1.5%) | 5 (1.2%) |
| $300,000 to $499,999 | 50 (18.7%) | 81 (19.2%) |
| $500,000 to $749,999 | 104 (39.0%) | 186 (44.2%) |
| $750,000 to $999,999 | 39 (14.6%) | 56 (13.3%) |
| $1,000,000 or more | 67 (25.1%) | 90 (21.4%) |
| Total | 267 (100.0%) | 421 (100.0%) |
Household Income by Mortgage Status in Upper Nyack
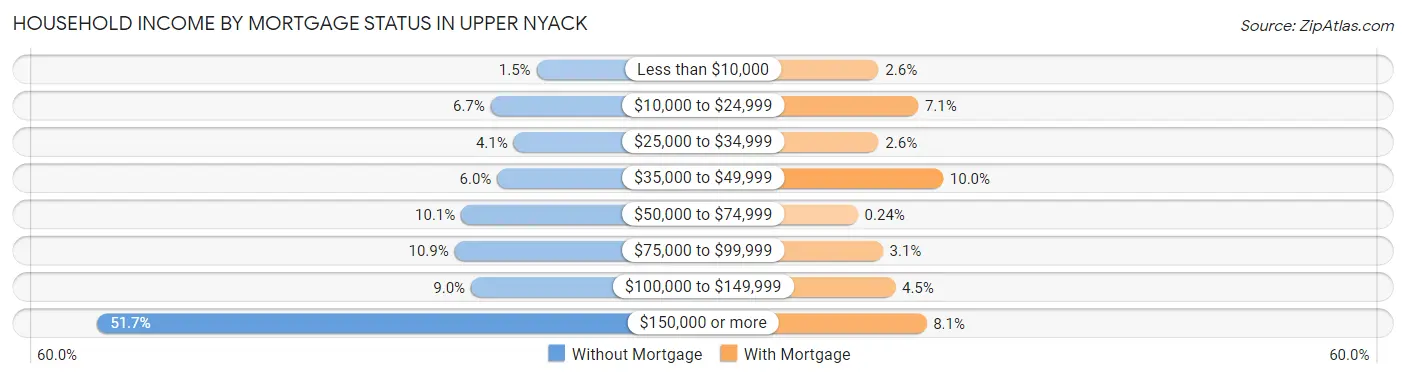
| Household Income | Without Mortgage | With Mortgage |
| Less than $10,000 | 4 (1.5%) | 11 (2.6%) |
| $10,000 to $24,999 | 18 (6.7%) | 30 (7.1%) |
| $25,000 to $34,999 | 11 (4.1%) | 11 (2.6%) |
| $35,000 to $49,999 | 16 (6.0%) | 42 (10.0%) |
| $50,000 to $74,999 | 27 (10.1%) | 1 (0.2%) |
| $75,000 to $99,999 | 29 (10.9%) | 13 (3.1%) |
| $100,000 to $149,999 | 24 (9.0%) | 19 (4.5%) |
| $150,000 or more | 138 (51.7%) | 34 (8.1%) |
| Total | 267 (100.0%) | 421 (100.0%) |
Property Value to Household Income Ratio in Upper Nyack
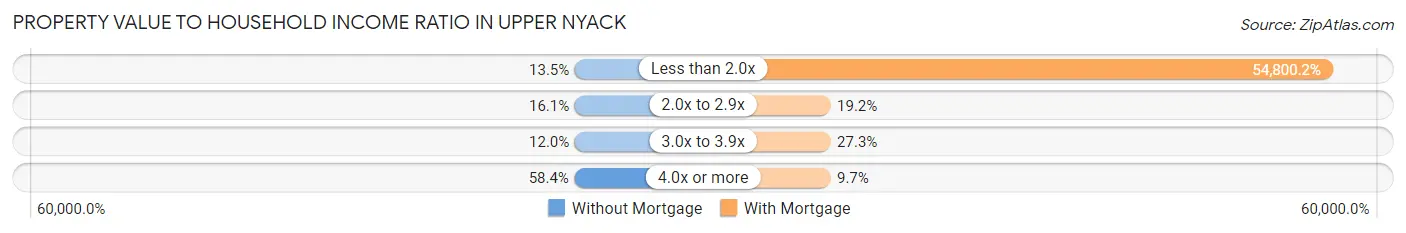
| Value-to-Income Ratio | Without Mortgage | With Mortgage |
| Less than 2.0x | 36 (13.5%) | 230,709 (54,800.2%) |
| 2.0x to 2.9x | 43 (16.1%) | 81 (19.2%) |
| 3.0x to 3.9x | 32 (12.0%) | 115 (27.3%) |
| 4.0x or more | 156 (58.4%) | 41 (9.7%) |
| Total | 267 (100.0%) | 421 (100.0%) |
Real Estate Taxes by Mortgage Status in Upper Nyack
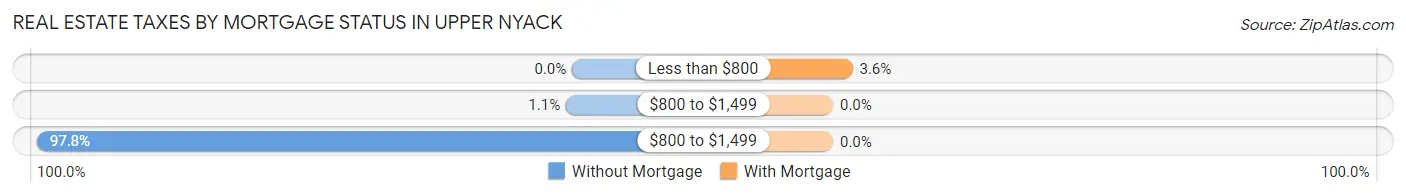
| Property Taxes | Without Mortgage | With Mortgage |
| Less than $800 | 0 (0.0%) | 15 (3.6%) |
| $800 to $1,499 | 3 (1.1%) | 0 (0.0%) |
| $800 to $1,499 | 261 (97.8%) | 0 (0.0%) |
| Total | 267 (100.0%) | 421 (100.0%) |
Health & Disability in Upper Nyack
Health Insurance Coverage by Age in Upper Nyack
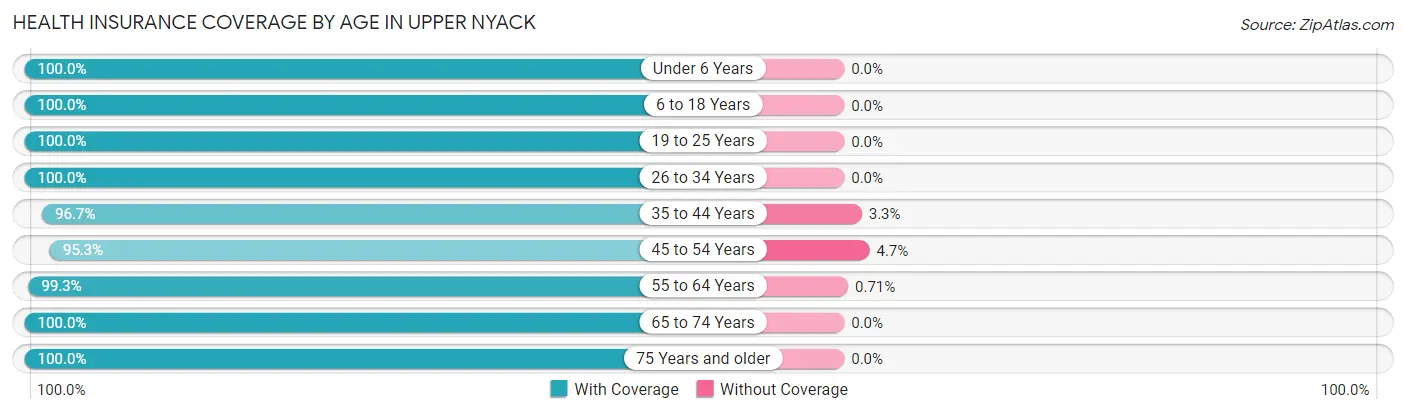
| Age Bracket | With Coverage | Without Coverage |
| Under 6 Years | 74 (100.0%) | 0 (0.0%) |
| 6 to 18 Years | 419 (100.0%) | 0 (0.0%) |
| 19 to 25 Years | 167 (100.0%) | 0 (0.0%) |
| 26 to 34 Years | 54 (100.0%) | 0 (0.0%) |
| 35 to 44 Years | 178 (96.7%) | 6 (3.3%) |
| 45 to 54 Years | 283 (95.3%) | 14 (4.7%) |
| 55 to 64 Years | 419 (99.3%) | 3 (0.7%) |
| 65 to 74 Years | 269 (100.0%) | 0 (0.0%) |
| 75 Years and older | 187 (100.0%) | 0 (0.0%) |
| Total | 2,050 (98.9%) | 23 (1.1%) |
Health Insurance Coverage by Citizenship Status in Upper Nyack
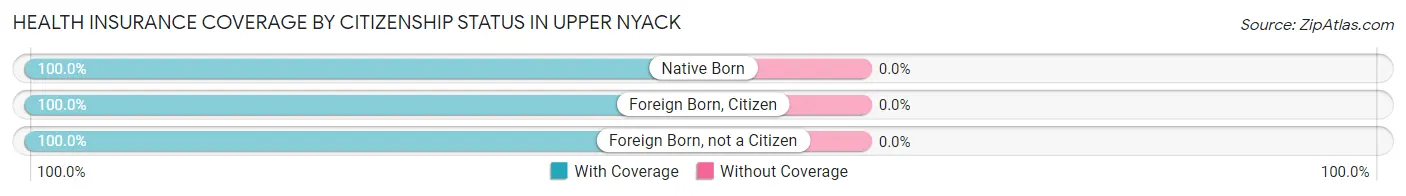
| Citizenship Status | With Coverage | Without Coverage |
| Native Born | 74 (100.0%) | 0 (0.0%) |
| Foreign Born, Citizen | 419 (100.0%) | 0 (0.0%) |
| Foreign Born, not a Citizen | 167 (100.0%) | 0 (0.0%) |
Health Insurance Coverage by Household Income in Upper Nyack
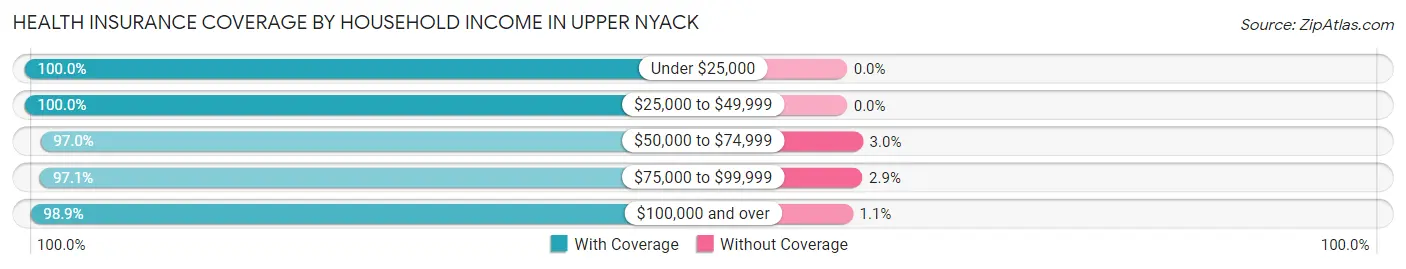
| Household Income | With Coverage | Without Coverage |
| Under $25,000 | 83 (100.0%) | 0 (0.0%) |
| $25,000 to $49,999 | 198 (100.0%) | 0 (0.0%) |
| $50,000 to $74,999 | 98 (97.0%) | 3 (3.0%) |
| $75,000 to $99,999 | 101 (97.1%) | 3 (2.9%) |
| $100,000 and over | 1,548 (98.9%) | 17 (1.1%) |
Public vs Private Health Insurance Coverage by Age in Upper Nyack
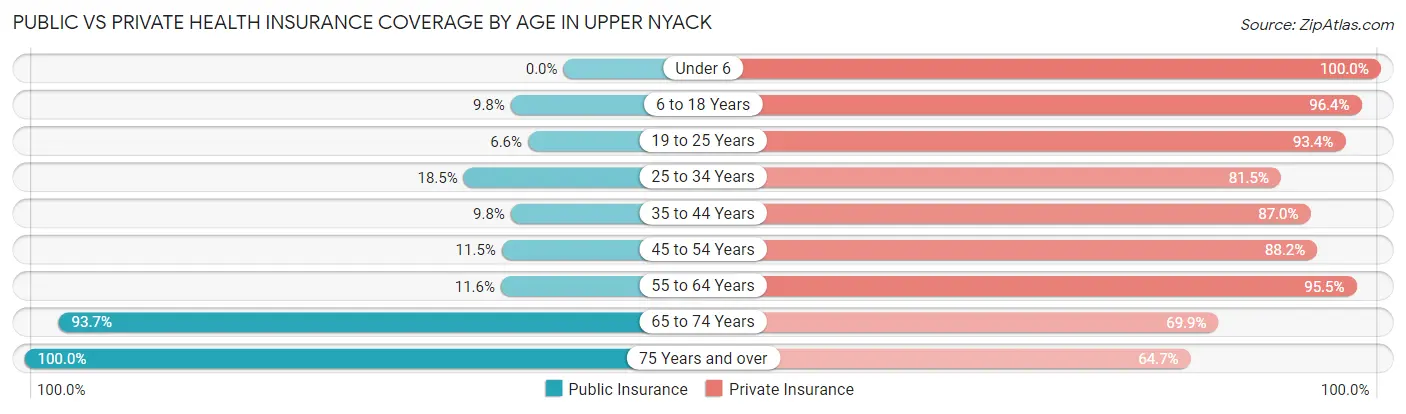
| Age Bracket | Public Insurance | Private Insurance |
| Under 6 | 0 (0.0%) | 74 (100.0%) |
| 6 to 18 Years | 41 (9.8%) | 404 (96.4%) |
| 19 to 25 Years | 11 (6.6%) | 156 (93.4%) |
| 25 to 34 Years | 10 (18.5%) | 44 (81.5%) |
| 35 to 44 Years | 18 (9.8%) | 160 (87.0%) |
| 45 to 54 Years | 34 (11.5%) | 262 (88.2%) |
| 55 to 64 Years | 49 (11.6%) | 403 (95.5%) |
| 65 to 74 Years | 252 (93.7%) | 188 (69.9%) |
| 75 Years and over | 187 (100.0%) | 121 (64.7%) |
| Total | 602 (29.0%) | 1,812 (87.4%) |
Disability Status by Sex by Age in Upper Nyack
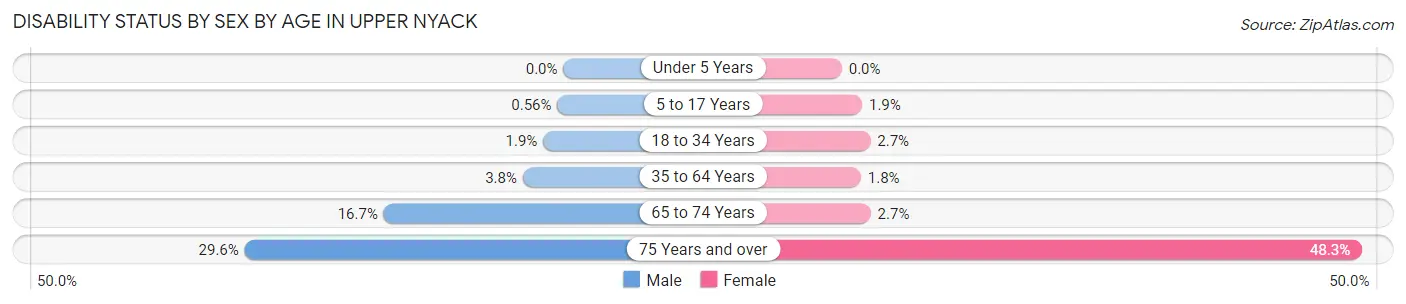
| Age Bracket | Male | Female |
| Under 5 Years | 0 (0.0%) | 0 (0.0%) |
| 5 to 17 Years | 1 (0.6%) | 4 (1.9%) |
| 18 to 34 Years | 2 (1.9%) | 4 (2.6%) |
| 35 to 64 Years | 17 (3.8%) | 8 (1.8%) |
| 65 to 74 Years | 20 (16.7%) | 4 (2.7%) |
| 75 Years and over | 21 (29.6%) | 56 (48.3%) |
Disability Class by Sex by Age in Upper Nyack
Disability Class: Hearing Difficulty
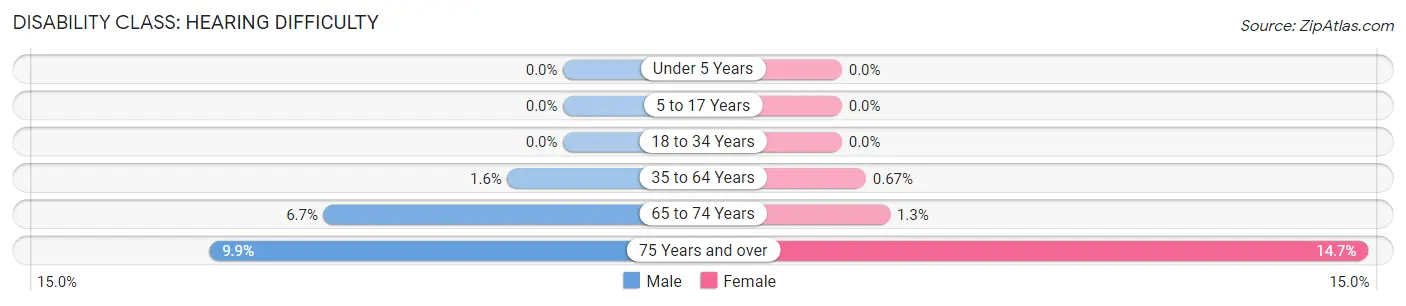
| Age Bracket | Male | Female |
| Under 5 Years | 0 (0.0%) | 0 (0.0%) |
| 5 to 17 Years | 0 (0.0%) | 0 (0.0%) |
| 18 to 34 Years | 0 (0.0%) | 0 (0.0%) |
| 35 to 64 Years | 7 (1.5%) | 3 (0.7%) |
| 65 to 74 Years | 8 (6.7%) | 2 (1.3%) |
| 75 Years and over | 7 (9.9%) | 17 (14.7%) |
Disability Class: Vision Difficulty
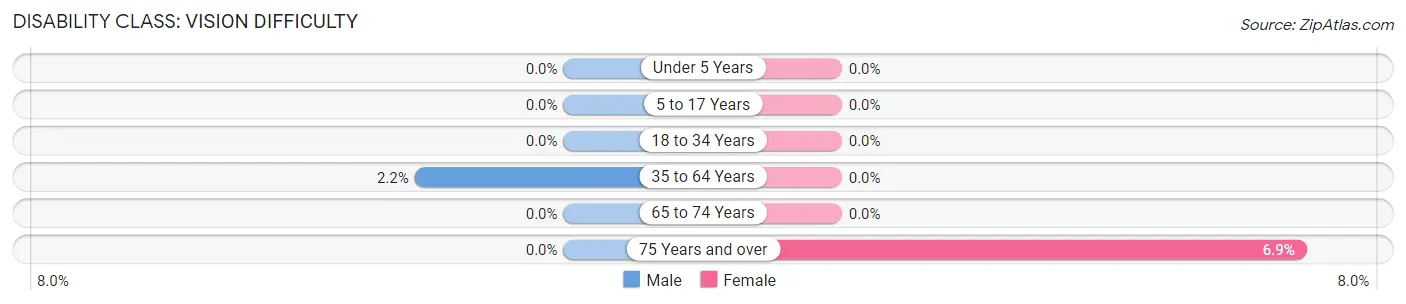
| Age Bracket | Male | Female |
| Under 5 Years | 0 (0.0%) | 0 (0.0%) |
| 5 to 17 Years | 0 (0.0%) | 0 (0.0%) |
| 18 to 34 Years | 0 (0.0%) | 0 (0.0%) |
| 35 to 64 Years | 10 (2.2%) | 0 (0.0%) |
| 65 to 74 Years | 0 (0.0%) | 0 (0.0%) |
| 75 Years and over | 0 (0.0%) | 8 (6.9%) |
Disability Class: Cognitive Difficulty
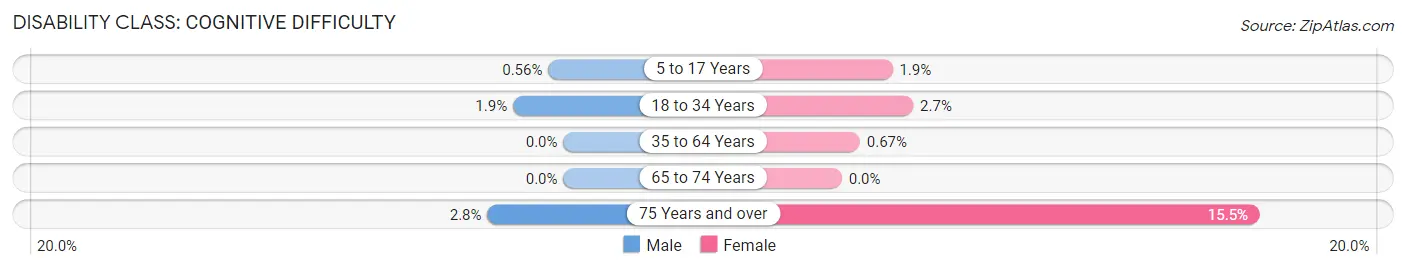
| Age Bracket | Male | Female |
| 5 to 17 Years | 1 (0.6%) | 4 (1.9%) |
| 18 to 34 Years | 2 (1.9%) | 4 (2.6%) |
| 35 to 64 Years | 0 (0.0%) | 3 (0.7%) |
| 65 to 74 Years | 0 (0.0%) | 0 (0.0%) |
| 75 Years and over | 2 (2.8%) | 18 (15.5%) |
Disability Class: Ambulatory Difficulty
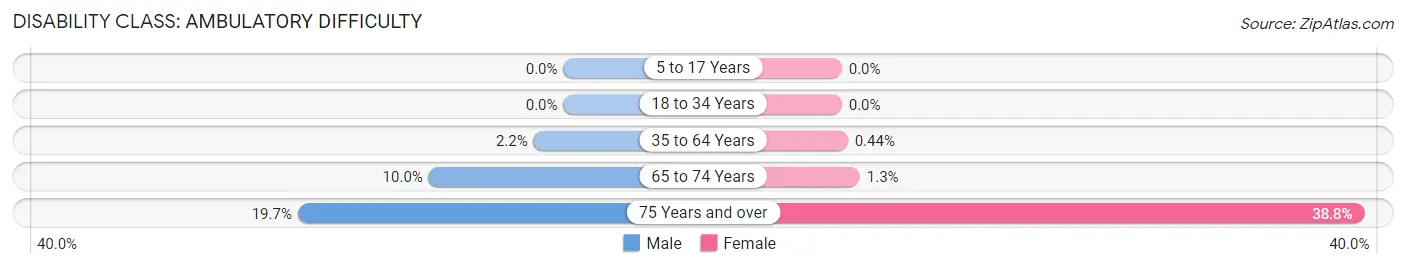
| Age Bracket | Male | Female |
| 5 to 17 Years | 0 (0.0%) | 0 (0.0%) |
| 18 to 34 Years | 0 (0.0%) | 0 (0.0%) |
| 35 to 64 Years | 10 (2.2%) | 2 (0.4%) |
| 65 to 74 Years | 12 (10.0%) | 2 (1.3%) |
| 75 Years and over | 14 (19.7%) | 45 (38.8%) |
Disability Class: Self-Care Difficulty
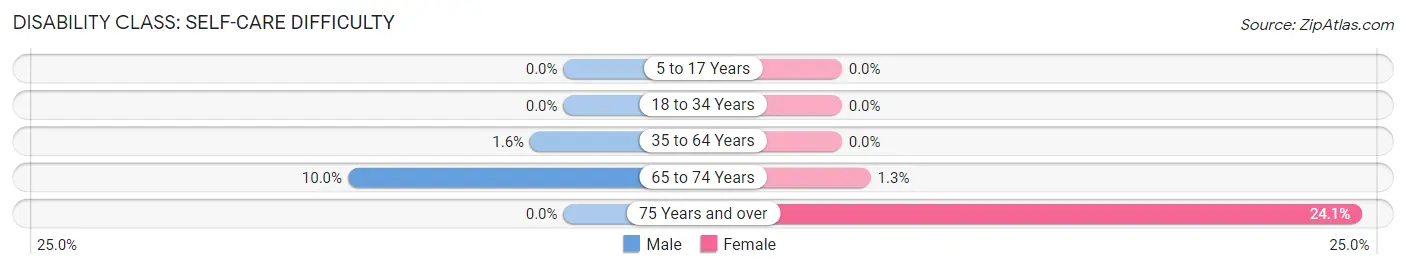
| Age Bracket | Male | Female |
| 5 to 17 Years | 0 (0.0%) | 0 (0.0%) |
| 18 to 34 Years | 0 (0.0%) | 0 (0.0%) |
| 35 to 64 Years | 7 (1.5%) | 0 (0.0%) |
| 65 to 74 Years | 12 (10.0%) | 2 (1.3%) |
| 75 Years and over | 0 (0.0%) | 28 (24.1%) |
Technology Access in Upper Nyack
Computing Device Access in Upper Nyack
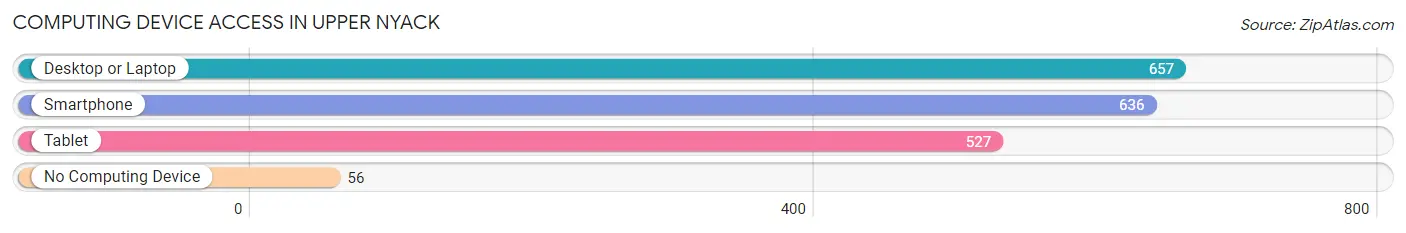
| Device Type | # Households | % Households |
| Desktop or Laptop | 657 | 89.1% |
| Smartphone | 636 | 86.3% |
| Tablet | 527 | 71.5% |
| No Computing Device | 56 | 7.6% |
| Total | 737 | 100.0% |
Internet Access in Upper Nyack
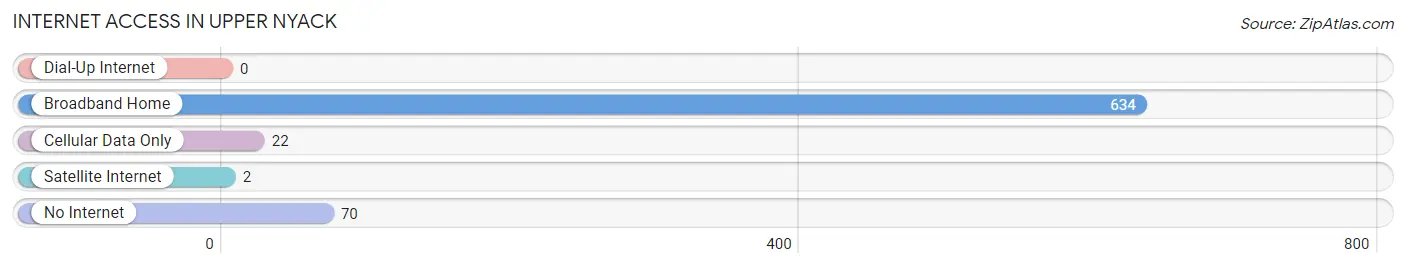
| Internet Type | # Households | % Households |
| Dial-Up Internet | 0 | 0.0% |
| Broadband Home | 634 | 86.0% |
| Cellular Data Only | 22 | 3.0% |
| Satellite Internet | 2 | 0.3% |
| No Internet | 70 | 9.5% |
| Total | 737 | 100.0% |
Upper Nyack Summary
Upper Nyack is a village located in the town of Clarkstown in Rockland County, New York. It is situated on the west bank of the Hudson River, about 25 miles north of New York City. The village has a population of approximately 3,000 people and covers an area of 1.2 square miles.
History
Upper Nyack was first settled in the late 17th century by Dutch and English settlers. The village was originally known as Nyaack, which is derived from the Native American word for “land of many waters”. The village was incorporated in 1872 and was originally part of the town of Orangetown. In 1883, the village was annexed by the town of Clarkstown.
Geography
Upper Nyack is located in the Hudson Valley region of New York. The village is situated on the west bank of the Hudson River, about 25 miles north of New York City. The village is bordered by the towns of Orangetown to the north, Clarkstown to the east, and Ramapo to the south. The village is located in the foothills of the Ramapo Mountains and is home to several parks and nature preserves.
Economy
Upper Nyack is primarily a residential community, with most of its residents commuting to nearby cities for work. The village is home to several small businesses, including restaurants, shops, and professional services. The village is also home to several corporate offices, including the headquarters of the New York State Thruway Authority.
Demographics
As of the 2010 census, the population of Upper Nyack was 3,037. The racial makeup of the village was 87.3% White, 5.2% African American, 0.3% Native American, 2.7% Asian, and 4.5% from other races. The median household income was $90,945, and the median family income was $106,945.
Upper Nyack is a diverse community, with a variety of religious and cultural backgrounds. The village is home to several churches, including the First Presbyterian Church of Upper Nyack, the Upper Nyack United Methodist Church, and the Upper Nyack Reformed Church. The village is also home to several synagogues, including the Congregation B’nai Yisrael and the Congregation Sons of Israel.
Conclusion
Upper Nyack is a small village located in the Hudson Valley region of New York. The village has a population of approximately 3,000 people and covers an area of 1.2 square miles. The village is primarily a residential community, with most of its residents commuting to nearby cities for work. The village is home to several small businesses, corporate offices, churches, and synagogues. The racial makeup of the village is 87.3% White, 5.2% African American, 0.3% Native American, 2.7% Asian, and 4.5% from other races. The median household income was $90,945, and the median family income was $106,945.
Common Questions
What is Per Capita Income in Upper Nyack?
Per Capita income in Upper Nyack is $79,230.
What is the Median Family Income in Upper Nyack?
Median Family Income in Upper Nyack is $230,135.
What is the Median Household income in Upper Nyack?
Median Household Income in Upper Nyack is $188,229.
What is Income or Wage Gap in Upper Nyack?
Income or Wage Gap in Upper Nyack is 44.3%.
Women in Upper Nyack earn 55.7 cents for every dollar earned by a man.
What is Inequality or Gini Index in Upper Nyack?
Inequality or Gini Index in Upper Nyack is 0.47.
What is the Total Population of Upper Nyack?
Total Population of Upper Nyack is 2,142.
What is the Total Male Population of Upper Nyack?
Total Male Population of Upper Nyack is 1,052.
What is the Total Female Population of Upper Nyack?
Total Female Population of Upper Nyack is 1,090.
What is the Ratio of Males per 100 Females in Upper Nyack?
There are 96.51 Males per 100 Females in Upper Nyack.
What is the Ratio of Females per 100 Males in Upper Nyack?
There are 103.61 Females per 100 Males in Upper Nyack.
What is the Median Population Age in Upper Nyack?
Median Population Age in Upper Nyack is 49.5 Years.
What is the Average Family Size in Upper Nyack
Average Family Size in Upper Nyack is 3.2 People.
What is the Average Household Size in Upper Nyack
Average Household Size in Upper Nyack is 2.8 People.
How Large is the Labor Force in Upper Nyack?
There are 1,112 People in the Labor Forcein in Upper Nyack.
What is the Percentage of People in the Labor Force in Upper Nyack?
61.7% of People are in the Labor Force in Upper Nyack.
What is the Unemployment Rate in Upper Nyack?
Unemployment Rate in Upper Nyack is 6.3%.