West Hurley, NY Map & Demographics
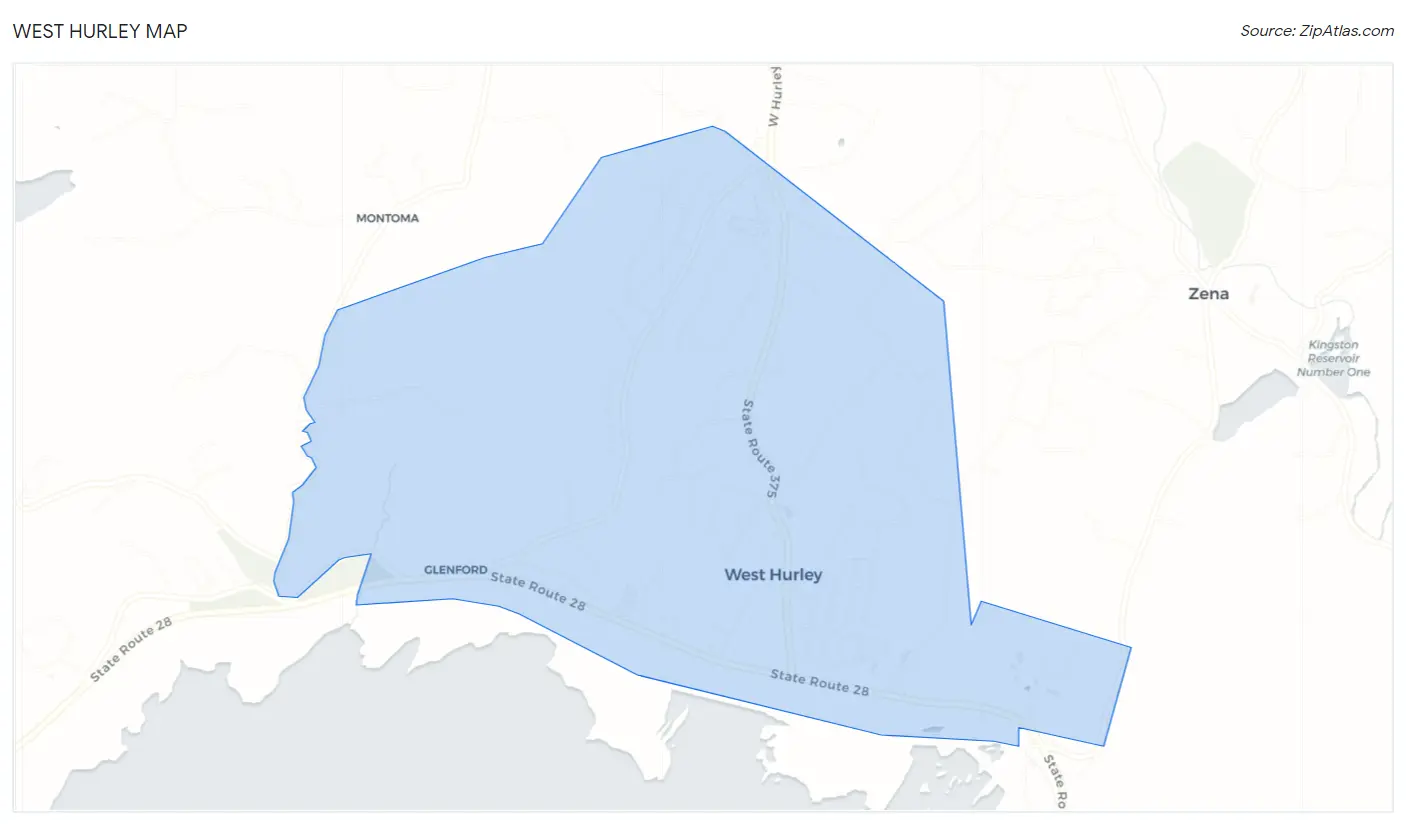
West Hurley Map
West Hurley Overview
$50,514
PER CAPITA INCOME
$87,139
AVG FAMILY INCOME
$68,990
AVG HOUSEHOLD INCOME
0.4%
WAGE / INCOME GAP [ % ]
99.6¢/ $1
WAGE / INCOME GAP [ $ ]
0.48
INEQUALITY / GINI INDEX
1,608
TOTAL POPULATION
804
MALE POPULATION
804
FEMALE POPULATION
100.00
MALES / 100 FEMALES
100.00
FEMALES / 100 MALES
57.0
MEDIAN AGE
2.6
AVG FAMILY SIZE
2.0
AVG HOUSEHOLD SIZE
785
LABOR FORCE [ PEOPLE ]
55.5%
PERCENT IN LABOR FORCE
2.9%
UNEMPLOYMENT RATE
West Hurley Zip Codes
West Hurley Area Codes
Income in West Hurley
Income Overview in West Hurley
Per Capita Income in West Hurley is $50,514, while median incomes of families and households are $87,139 and $68,990 respectively.
| Characteristic | Number | Measure |
| Per Capita Income | 1,608 | $50,514 |
| Median Family Income | 441 | $87,139 |
| Mean Family Income | 441 | $124,417 |
| Median Household Income | 804 | $68,990 |
| Mean Household Income | 804 | $99,992 |
| Income Deficit | 441 | $0 |
| Wage / Income Gap (%) | 1,608 | 0.43% |
| Wage / Income Gap ($) | 1,608 | 99.57¢ per $1 |
| Gini / Inequality Index | 1,608 | 0.48 |
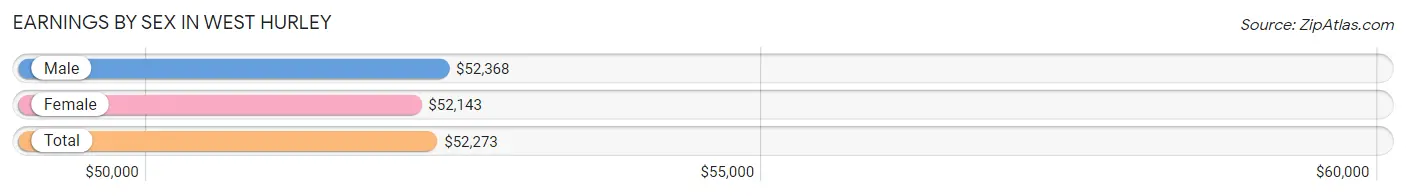
Earnings by Sex in West Hurley
Average Earnings in West Hurley are $52,273, $52,368 for men and $52,143 for women, a difference of 0.4%.
| Sex | Number | Average Earnings |
| Male | 482 (58.8%) | $52,368 |
| Female | 338 (41.2%) | $52,143 |
| Total | 820 (100.0%) | $52,273 |
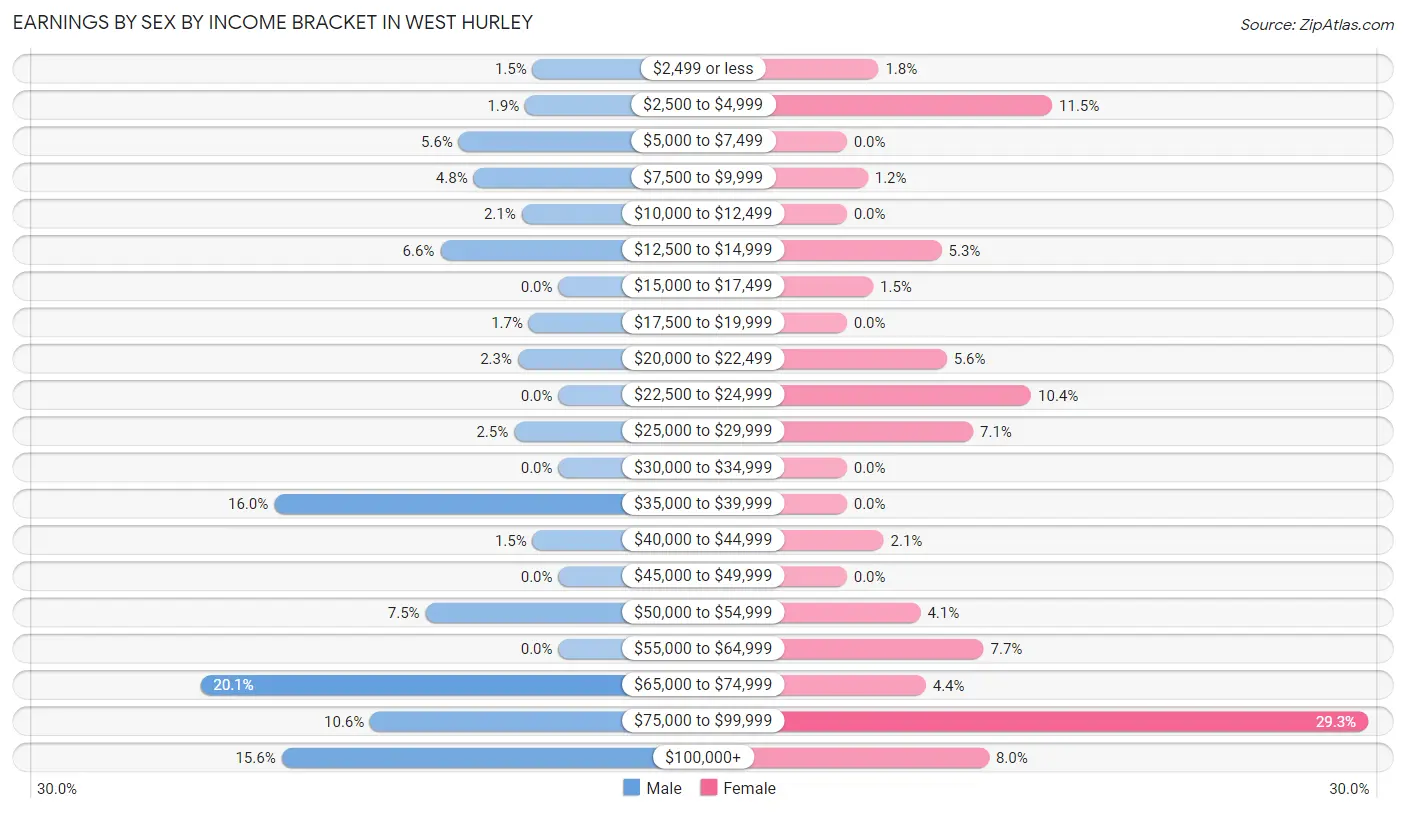
Earnings by Sex by Income Bracket in West Hurley
The most common earnings brackets in West Hurley are $65,000 to $74,999 for men (97 | 20.1%) and $75,000 to $99,999 for women (99 | 29.3%).
| Income | Male | Female |
| $2,499 or less | 7 (1.5%) | 6 (1.8%) |
| $2,500 to $4,999 | 9 (1.9%) | 39 (11.5%) |
| $5,000 to $7,499 | 27 (5.6%) | 0 (0.0%) |
| $7,500 to $9,999 | 23 (4.8%) | 4 (1.2%) |
| $10,000 to $12,499 | 10 (2.1%) | 0 (0.0%) |
| $12,500 to $14,999 | 32 (6.6%) | 18 (5.3%) |
| $15,000 to $17,499 | 0 (0.0%) | 5 (1.5%) |
| $17,500 to $19,999 | 8 (1.7%) | 0 (0.0%) |
| $20,000 to $22,499 | 11 (2.3%) | 19 (5.6%) |
| $22,500 to $24,999 | 0 (0.0%) | 35 (10.4%) |
| $25,000 to $29,999 | 12 (2.5%) | 24 (7.1%) |
| $30,000 to $34,999 | 0 (0.0%) | 0 (0.0%) |
| $35,000 to $39,999 | 77 (16.0%) | 0 (0.0%) |
| $40,000 to $44,999 | 7 (1.5%) | 7 (2.1%) |
| $45,000 to $49,999 | 0 (0.0%) | 0 (0.0%) |
| $50,000 to $54,999 | 36 (7.5%) | 14 (4.1%) |
| $55,000 to $64,999 | 0 (0.0%) | 26 (7.7%) |
| $65,000 to $74,999 | 97 (20.1%) | 15 (4.4%) |
| $75,000 to $99,999 | 51 (10.6%) | 99 (29.3%) |
| $100,000+ | 75 (15.6%) | 27 (8.0%) |
| Total | 482 (100.0%) | 338 (100.0%) |
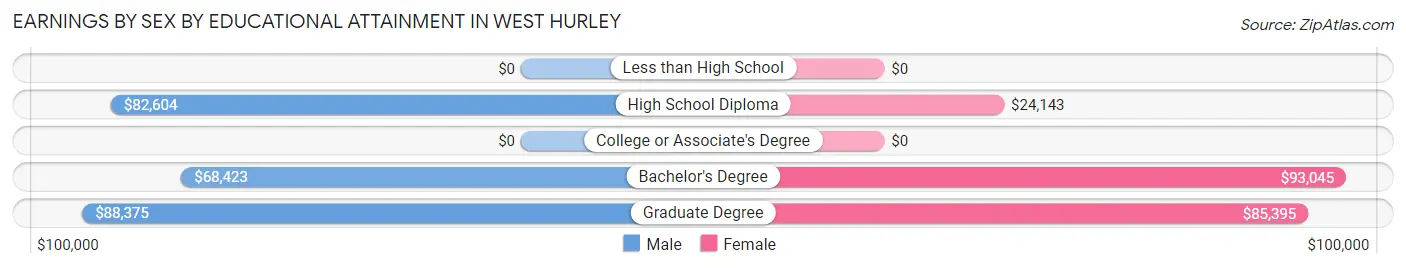
Earnings by Sex by Educational Attainment in West Hurley
Average earnings in West Hurley are $67,545 for men and $58,269 for women, a difference of 13.7%. Men with an educational attainment of graduate degree enjoy the highest average annual earnings of $88,375, while those with bachelor's degree education earn the least with $68,423. Women with an educational attainment of bachelor's degree earn the most with the average annual earnings of $93,045, while those with high school diploma education have the smallest earnings of $24,143.
| Educational Attainment | Male Income | Female Income |
| Less than High School | - | - |
| High School Diploma | $82,604 | $24,143 |
| College or Associate's Degree | - | - |
| Bachelor's Degree | $68,423 | $93,045 |
| Graduate Degree | $88,375 | $85,395 |
| Total | $67,545 | $58,269 |
Family Income in West Hurley
Family Income Brackets in West Hurley
According to the West Hurley family income data, there are 103 families falling into the $100,000 to $149,999 income range, which is the most common income bracket and makes up 23.4% of all families. Conversely, the less than $10,000 income bracket is the least frequent group with only 4 families (0.9%) belonging to this category.
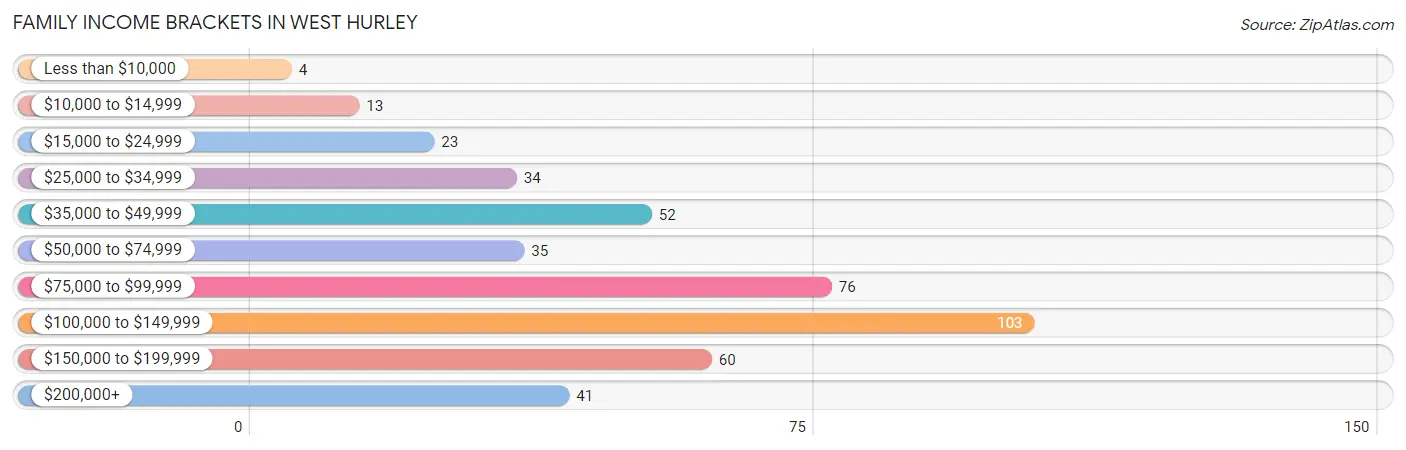
| Income Bracket | # Families | % Families |
| Less than $10,000 | 4 | 0.9% |
| $10,000 to $14,999 | 13 | 2.9% |
| $15,000 to $24,999 | 23 | 5.2% |
| $25,000 to $34,999 | 34 | 7.7% |
| $35,000 to $49,999 | 52 | 11.8% |
| $50,000 to $74,999 | 35 | 7.9% |
| $75,000 to $99,999 | 76 | 17.2% |
| $100,000 to $149,999 | 103 | 23.4% |
| $150,000 to $199,999 | 60 | 13.6% |
| $200,000+ | 41 | 9.3% |
Family Income by Famaliy Size in West Hurley
4-person families (67 | 15.2%) account for the highest median family income in West Hurley with $103,393 per family, while 2-person families (284 | 64.4%) have the highest median income of $42,212 per family member.
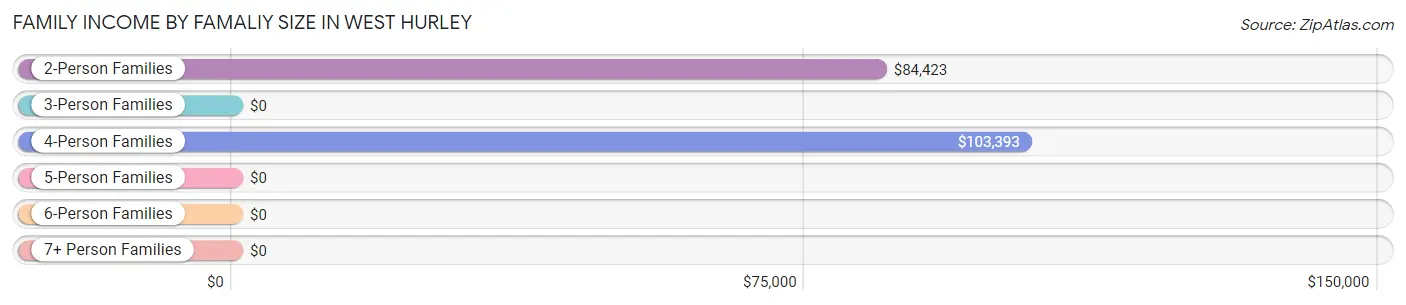
| Income Bracket | # Families | Median Income |
| 2-Person Families | 284 (64.4%) | $84,423 |
| 3-Person Families | 90 (20.4%) | $0 |
| 4-Person Families | 67 (15.2%) | $103,393 |
| 5-Person Families | 0 (0.0%) | $0 |
| 6-Person Families | 0 (0.0%) | $0 |
| 7+ Person Families | 0 (0.0%) | $0 |
| Total | 441 (100.0%) | $87,139 |
Family Income by Number of Earners in West Hurley
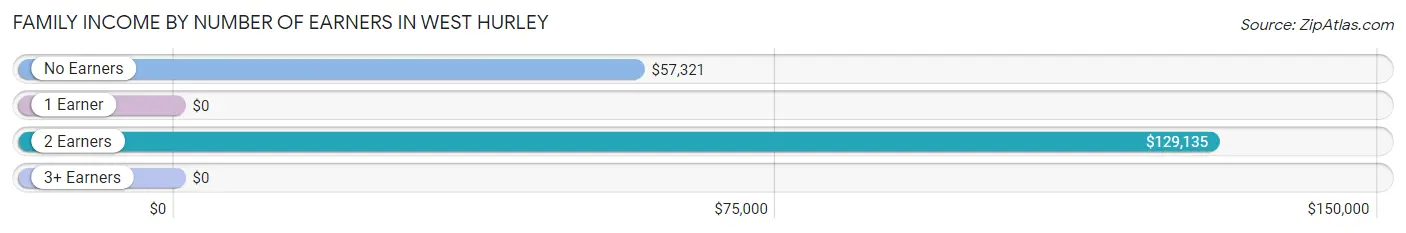
| Number of Earners | # Families | Median Income |
| No Earners | 95 (21.5%) | $57,321 |
| 1 Earner | 189 (42.9%) | $0 |
| 2 Earners | 122 (27.7%) | $129,135 |
| 3+ Earners | 35 (7.9%) | $0 |
| Total | 441 (100.0%) | $87,139 |
Household Income in West Hurley
Household Income Brackets in West Hurley
With 190 households falling in the category, the $50,000 to $74,999 income range is the most frequent in West Hurley, accounting for 23.6% of all households. In contrast, only 27 households (3.4%) fall into the $10,000 to $14,999 income bracket, making it the least populous group.
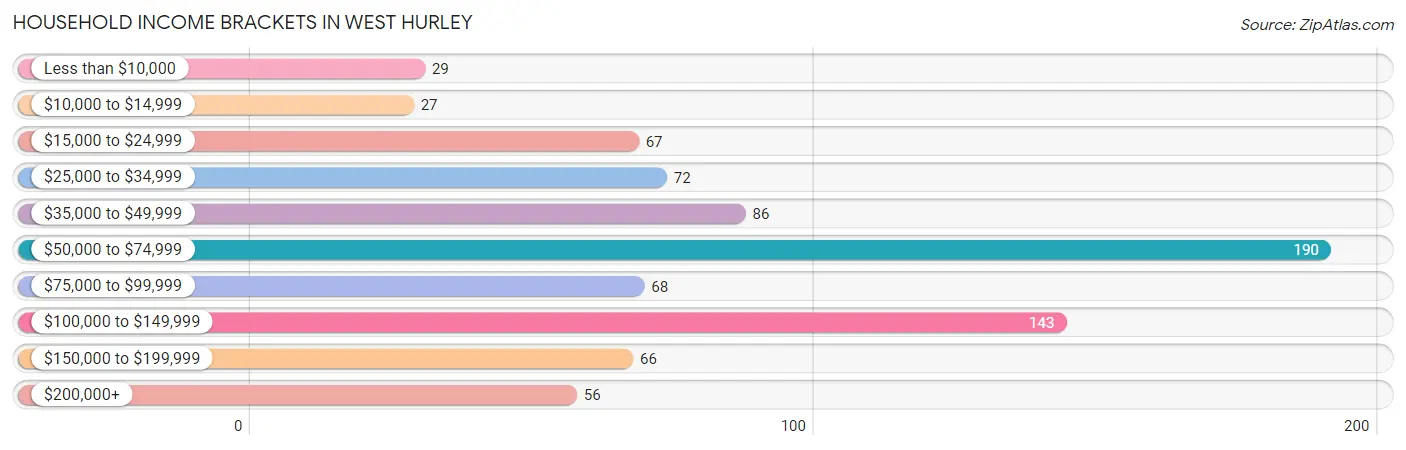
| Income Bracket | # Households | % Households |
| Less than $10,000 | 29 | 3.6% |
| $10,000 to $14,999 | 27 | 3.4% |
| $15,000 to $24,999 | 67 | 8.3% |
| $25,000 to $34,999 | 72 | 9.0% |
| $35,000 to $49,999 | 86 | 10.7% |
| $50,000 to $74,999 | 190 | 23.6% |
| $75,000 to $99,999 | 68 | 8.5% |
| $100,000 to $149,999 | 143 | 17.8% |
| $150,000 to $199,999 | 66 | 8.2% |
| $200,000+ | 56 | 7.0% |
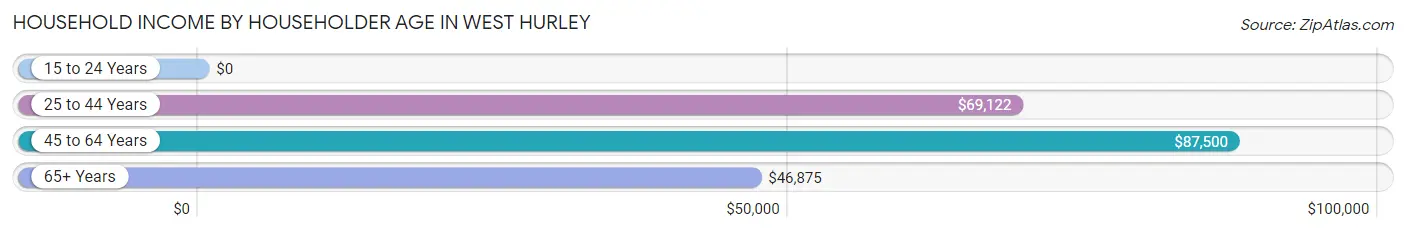
Household Income by Householder Age in West Hurley
The median household income in West Hurley is $68,990, with the highest median household income of $87,500 found in the 45 to 64 years age bracket for the primary householder. A total of 362 households (45.0%) fall into this category.
| Income Bracket | # Households | Median Income |
| 15 to 24 Years | 0 (0.0%) | $0 |
| 25 to 44 Years | 143 (17.8%) | $69,122 |
| 45 to 64 Years | 362 (45.0%) | $87,500 |
| 65+ Years | 299 (37.2%) | $46,875 |
| Total | 804 (100.0%) | $68,990 |
Poverty in West Hurley
Income Below Poverty by Sex and Age in West Hurley
With 6.7% poverty level for males and 10.4% for females among the residents of West Hurley, 18 to 24 year old males and under 5 year old females are the most vulnerable to poverty, with 28 males (30.1%) and 14 females (73.7%) in their respective age groups living below the poverty level.
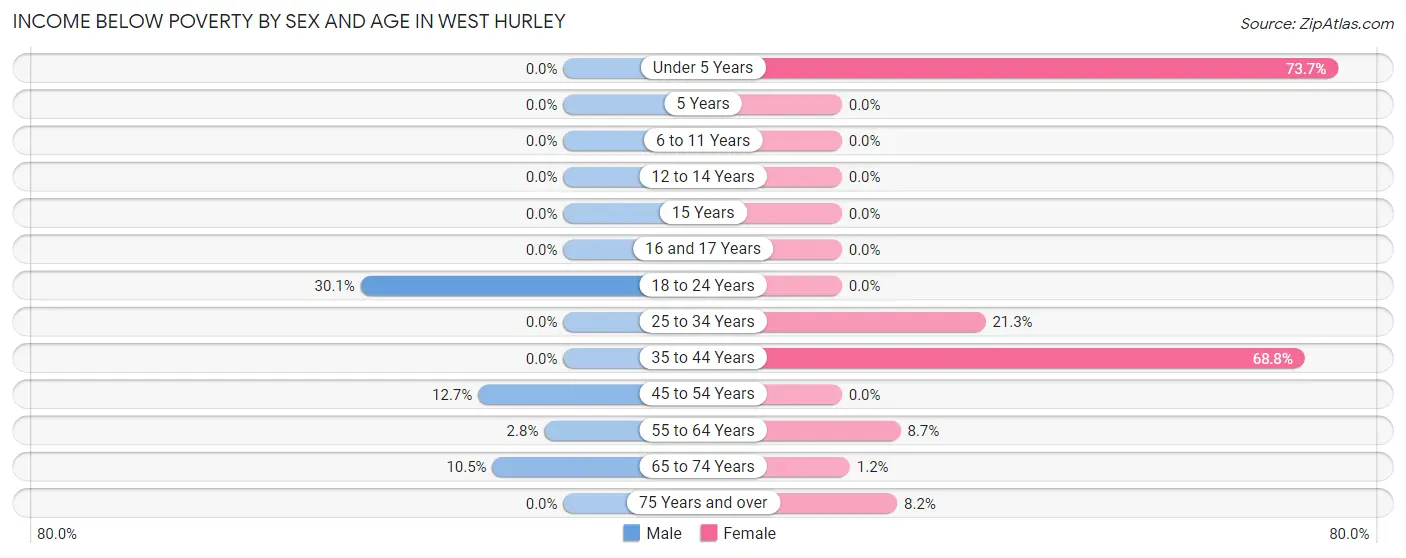
| Age Bracket | Male | Female |
| Under 5 Years | 0 (0.0%) | 14 (73.7%) |
| 5 Years | 0 (0.0%) | 0 (0.0%) |
| 6 to 11 Years | 0 (0.0%) | 0 (0.0%) |
| 12 to 14 Years | 0 (0.0%) | 0 (0.0%) |
| 15 Years | 0 (0.0%) | 0 (0.0%) |
| 16 and 17 Years | 0 (0.0%) | 0 (0.0%) |
| 18 to 24 Years | 28 (30.1%) | 0 (0.0%) |
| 25 to 34 Years | 0 (0.0%) | 16 (21.3%) |
| 35 to 44 Years | 0 (0.0%) | 22 (68.8%) |
| 45 to 54 Years | 10 (12.7%) | 0 (0.0%) |
| 55 to 64 Years | 4 (2.8%) | 19 (8.7%) |
| 65 to 74 Years | 12 (10.5%) | 2 (1.2%) |
| 75 Years and over | 0 (0.0%) | 11 (8.2%) |
| Total | 54 (6.7%) | 84 (10.4%) |
Income Above Poverty by Sex and Age in West Hurley
According to the poverty statistics in West Hurley, males aged 6 to 11 years and females aged 12 to 14 years are the age groups that are most secure financially, with 100.0% of males and 100.0% of females in these age groups living above the poverty line.
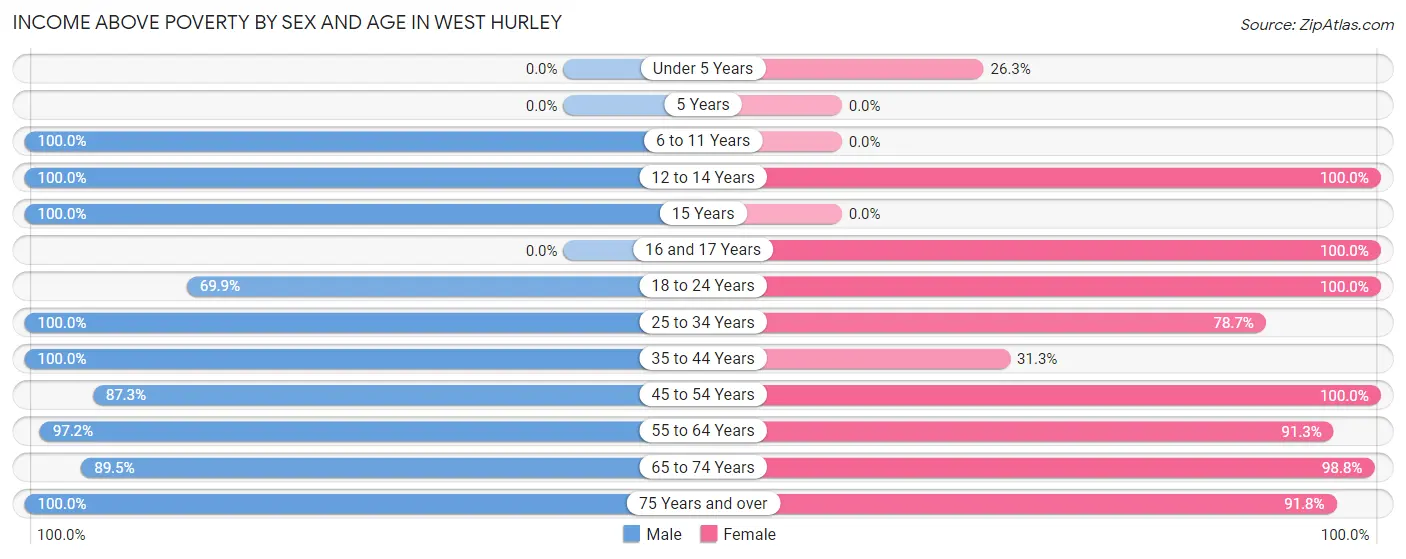
| Age Bracket | Male | Female |
| Under 5 Years | 0 (0.0%) | 5 (26.3%) |
| 5 Years | 0 (0.0%) | 0 (0.0%) |
| 6 to 11 Years | 92 (100.0%) | 0 (0.0%) |
| 12 to 14 Years | 24 (100.0%) | 20 (100.0%) |
| 15 Years | 38 (100.0%) | 0 (0.0%) |
| 16 and 17 Years | 0 (0.0%) | 22 (100.0%) |
| 18 to 24 Years | 65 (69.9%) | 12 (100.0%) |
| 25 to 34 Years | 129 (100.0%) | 59 (78.7%) |
| 35 to 44 Years | 51 (100.0%) | 10 (31.2%) |
| 45 to 54 Years | 69 (87.3%) | 104 (100.0%) |
| 55 to 64 Years | 137 (97.2%) | 199 (91.3%) |
| 65 to 74 Years | 102 (89.5%) | 166 (98.8%) |
| 75 Years and over | 43 (100.0%) | 123 (91.8%) |
| Total | 750 (93.3%) | 720 (89.5%) |
Income Below Poverty Among Married-Couple Families in West Hurley
The poverty statistics for married-couple families in West Hurley show that 4.3% or 13 of the total 306 families live below the poverty line. Families with 1 or 2 children have the highest poverty rate of 17.8%, comprising of 13 families. On the other hand, families with no children have the lowest poverty rate of 0.0%, which includes 0 families.
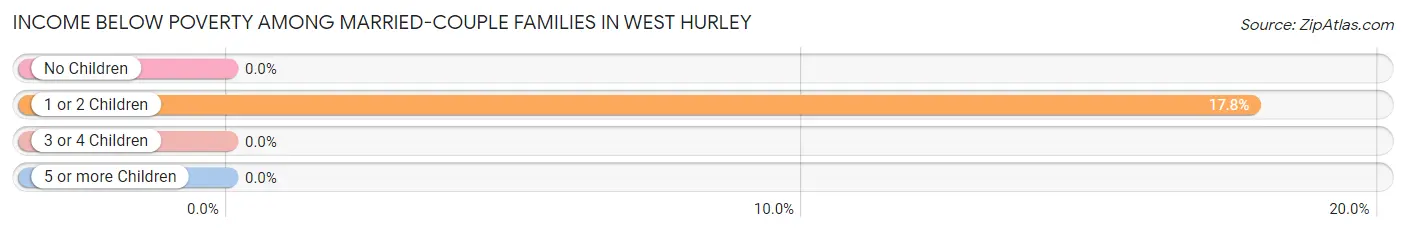
| Children | Above Poverty | Below Poverty |
| No Children | 233 (100.0%) | 0 (0.0%) |
| 1 or 2 Children | 60 (82.2%) | 13 (17.8%) |
| 3 or 4 Children | 0 (0.0%) | 0 (0.0%) |
| 5 or more Children | 0 (0.0%) | 0 (0.0%) |
| Total | 293 (95.8%) | 13 (4.3%) |
Income Below Poverty Among Single-Parent Households in West Hurley
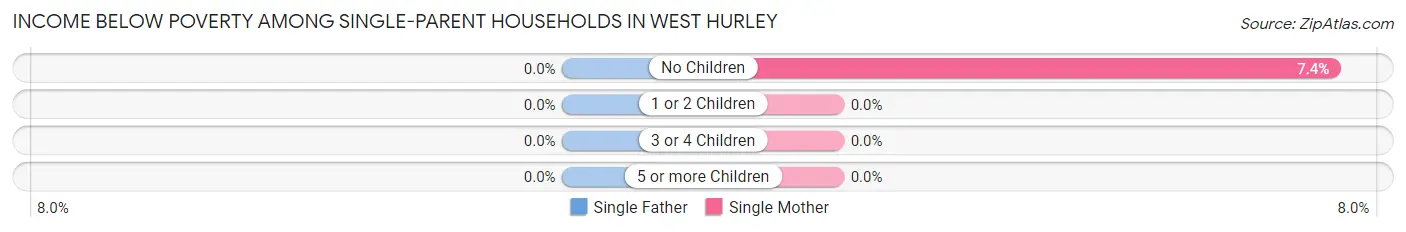
| Children | Single Father | Single Mother |
| No Children | 0 (0.0%) | 4 (7.4%) |
| 1 or 2 Children | 0 (0.0%) | 0 (0.0%) |
| 3 or 4 Children | 0 (0.0%) | 0 (0.0%) |
| 5 or more Children | 0 (0.0%) | 0 (0.0%) |
| Total | 0 (0.0%) | 4 (3.5%) |
Income Below Poverty Among Married-Couple vs Single-Parent Households in West Hurley
The poverty data for West Hurley shows that 13 of the married-couple family households (4.3%) and 4 of the single-parent households (3.0%) are living below the poverty level. Within the married-couple family households, those with 1 or 2 children have the highest poverty rate, with 13 households (17.8%) falling below the poverty line. Among the single-parent households, those with no children have the highest poverty rate, with 4 household (7.4%) living below poverty.
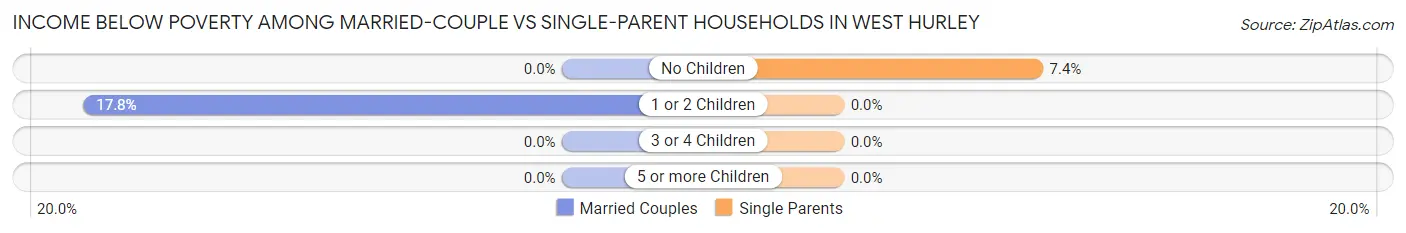
| Children | Married-Couple Families | Single-Parent Households |
| No Children | 0 (0.0%) | 4 (7.4%) |
| 1 or 2 Children | 13 (17.8%) | 0 (0.0%) |
| 3 or 4 Children | 0 (0.0%) | 0 (0.0%) |
| 5 or more Children | 0 (0.0%) | 0 (0.0%) |
| Total | 13 (4.3%) | 4 (3.0%) |
Race in West Hurley
The most populous races in West Hurley are White / Caucasian (1,499 | 93.2%), Two or more Races (104 | 6.5%), and Hispanic or Latino (16 | 1.0%).
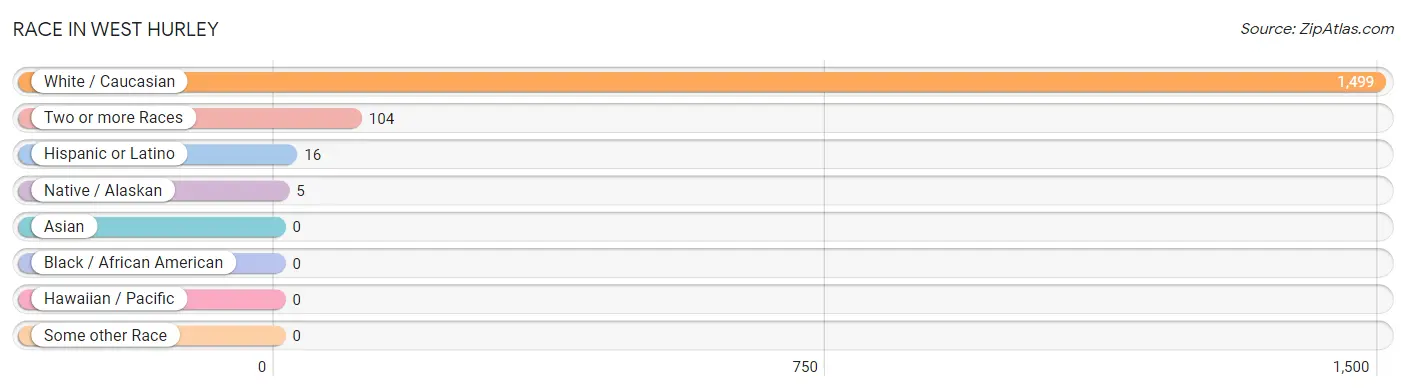
| Race | # Population | % Population |
| Asian | 0 | 0.0% |
| Black / African American | 0 | 0.0% |
| Hawaiian / Pacific | 0 | 0.0% |
| Hispanic or Latino | 16 | 1.0% |
| Native / Alaskan | 5 | 0.3% |
| White / Caucasian | 1,499 | 93.2% |
| Two or more Races | 104 | 6.5% |
| Some other Race | 0 | 0.0% |
| Total | 1,608 | 100.0% |
Ancestry in West Hurley
The most populous ancestries reported in West Hurley are German (633 | 39.4%), Italian (370 | 23.0%), Irish (324 | 20.2%), English (198 | 12.3%), and French (193 | 12.0%), together accounting for 106.8% of all West Hurley residents.
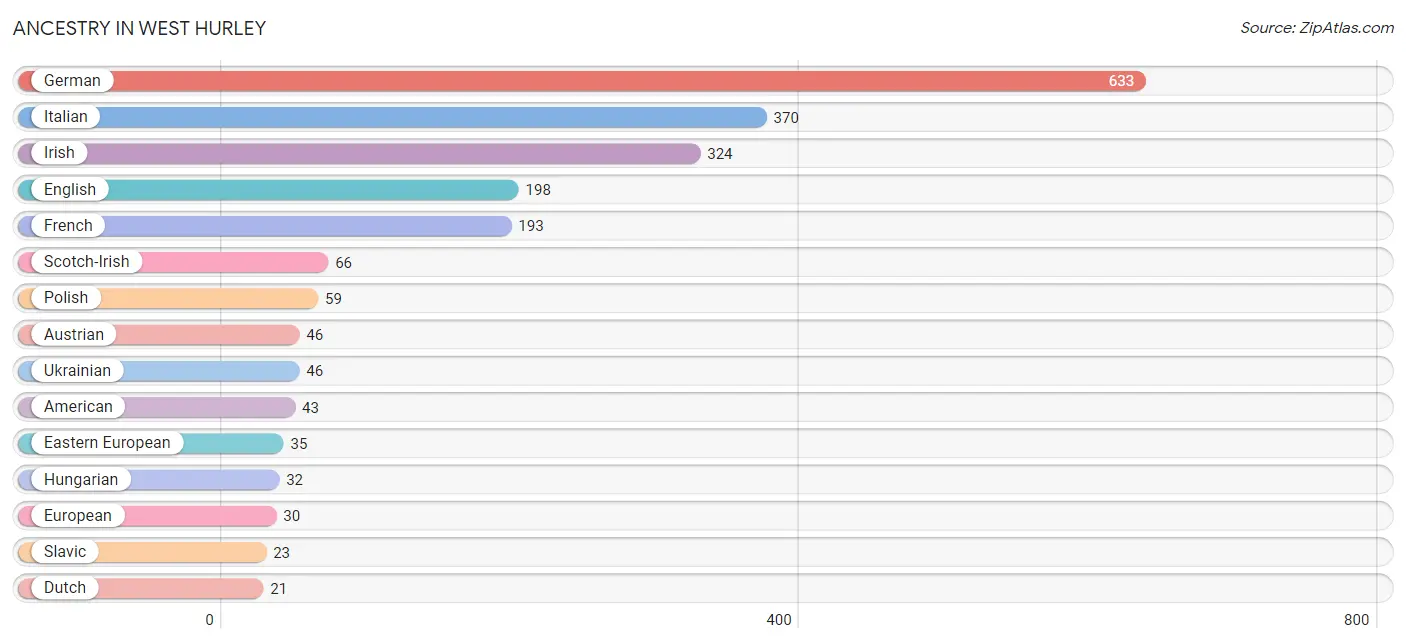
| Ancestry | # Population | % Population |
| American | 43 | 2.7% |
| Austrian | 46 | 2.9% |
| Basque | 10 | 0.6% |
| British | 5 | 0.3% |
| Cambodian | 15 | 0.9% |
| Canadian | 8 | 0.5% |
| Colombian | 14 | 0.9% |
| Czech | 8 | 0.5% |
| Danish | 14 | 0.9% |
| Dutch | 21 | 1.3% |
| Eastern European | 35 | 2.2% |
| English | 198 | 12.3% |
| European | 30 | 1.9% |
| French | 193 | 12.0% |
| French Canadian | 14 | 0.9% |
| German | 633 | 39.4% |
| Greek | 13 | 0.8% |
| Hungarian | 32 | 2.0% |
| Irish | 324 | 20.2% |
| Iroquois | 10 | 0.6% |
| Italian | 370 | 23.0% |
| Macedonian | 8 | 0.5% |
| Norwegian | 13 | 0.8% |
| Pennsylvania German | 13 | 0.8% |
| Polish | 59 | 3.7% |
| Puerto Rican | 2 | 0.1% |
| Romanian | 9 | 0.6% |
| Russian | 7 | 0.4% |
| Scandinavian | 6 | 0.4% |
| Scotch-Irish | 66 | 4.1% |
| Scottish | 8 | 0.5% |
| Slavic | 23 | 1.4% |
| South American | 14 | 0.9% |
| Swedish | 7 | 0.4% |
| Ukrainian | 46 | 2.9% |
| Welsh | 14 | 0.9% |
| Yugoslavian | 12 | 0.7% | View All 37 Rows |
Immigrants in West Hurley
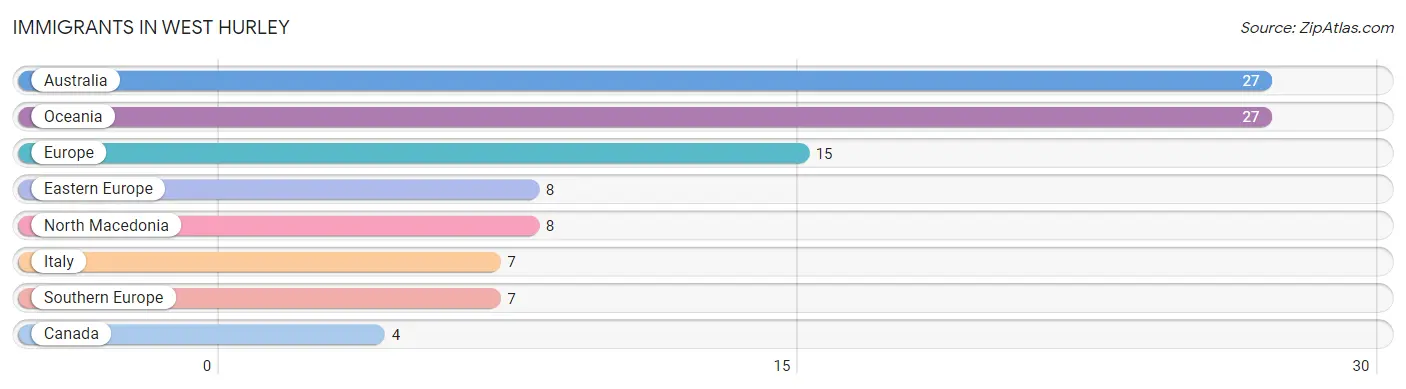
The most numerous immigrant groups reported in West Hurley came from Australia (27 | 1.7%), Oceania (27 | 1.7%), Europe (15 | 0.9%), Eastern Europe (8 | 0.5%), and North Macedonia (8 | 0.5%), together accounting for 5.3% of all West Hurley residents.
| Immigration Origin | # Population | % Population |
| Australia | 27 | 1.7% |
| Canada | 4 | 0.3% |
| Eastern Europe | 8 | 0.5% |
| Europe | 15 | 0.9% |
| Italy | 7 | 0.4% |
| North Macedonia | 8 | 0.5% |
| Oceania | 27 | 1.7% |
| Southern Europe | 7 | 0.4% | View All 8 Rows |
Sex and Age in West Hurley
Sex and Age in West Hurley
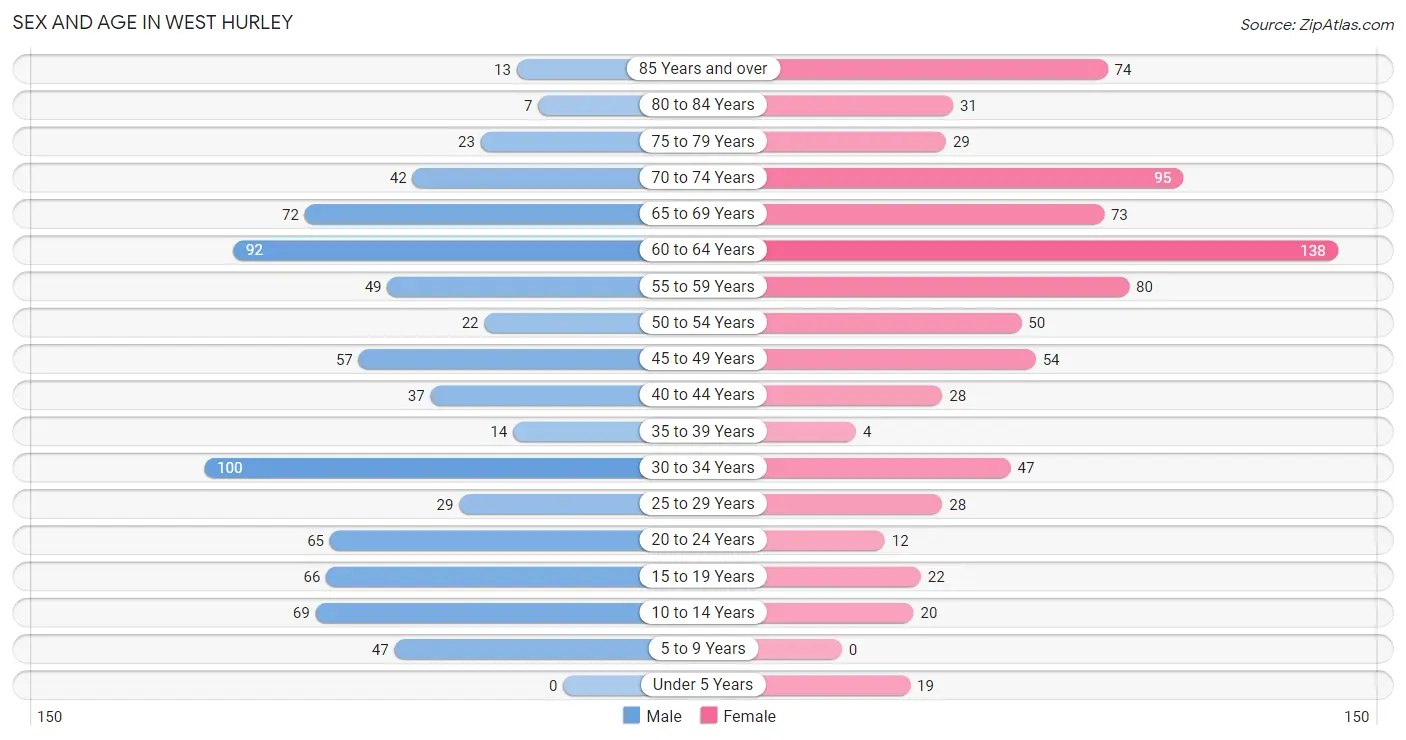
The most populous age groups in West Hurley are 30 to 34 Years (100 | 12.4%) for men and 60 to 64 Years (138 | 17.2%) for women.
| Age Bracket | Male | Female |
| Under 5 Years | 0 (0.0%) | 19 (2.4%) |
| 5 to 9 Years | 47 (5.9%) | 0 (0.0%) |
| 10 to 14 Years | 69 (8.6%) | 20 (2.5%) |
| 15 to 19 Years | 66 (8.2%) | 22 (2.7%) |
| 20 to 24 Years | 65 (8.1%) | 12 (1.5%) |
| 25 to 29 Years | 29 (3.6%) | 28 (3.5%) |
| 30 to 34 Years | 100 (12.4%) | 47 (5.9%) |
| 35 to 39 Years | 14 (1.7%) | 4 (0.5%) |
| 40 to 44 Years | 37 (4.6%) | 28 (3.5%) |
| 45 to 49 Years | 57 (7.1%) | 54 (6.7%) |
| 50 to 54 Years | 22 (2.7%) | 50 (6.2%) |
| 55 to 59 Years | 49 (6.1%) | 80 (10.0%) |
| 60 to 64 Years | 92 (11.4%) | 138 (17.2%) |
| 65 to 69 Years | 72 (9.0%) | 73 (9.1%) |
| 70 to 74 Years | 42 (5.2%) | 95 (11.8%) |
| 75 to 79 Years | 23 (2.9%) | 29 (3.6%) |
| 80 to 84 Years | 7 (0.9%) | 31 (3.9%) |
| 85 Years and over | 13 (1.6%) | 74 (9.2%) |
| Total | 804 (100.0%) | 804 (100.0%) |
Families and Households in West Hurley
Median Family Size in West Hurley
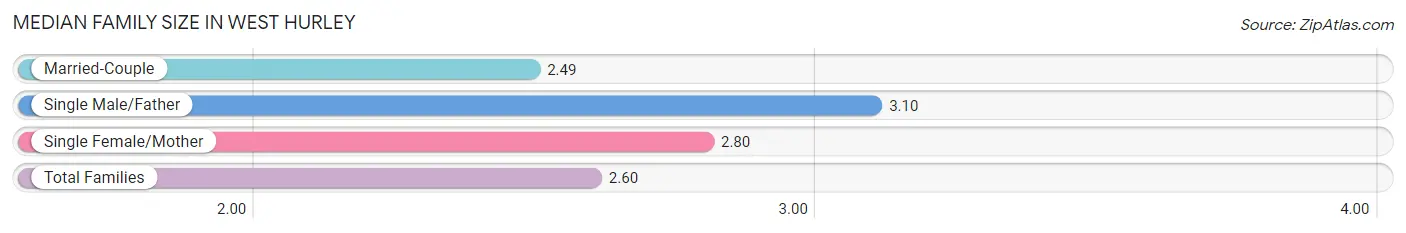
The median family size in West Hurley is 2.60 persons per family, with single male/father families (20 | 4.5%) accounting for the largest median family size of 3.1 persons per family. On the other hand, married-couple families (306 | 69.4%) represent the smallest median family size with 2.49 persons per family.
| Family Type | # Families | Family Size |
| Married-Couple | 306 (69.4%) | 2.49 |
| Single Male/Father | 20 (4.5%) | 3.10 |
| Single Female/Mother | 115 (26.1%) | 2.80 |
| Total Families | 441 (100.0%) | 2.60 |
Median Household Size in West Hurley
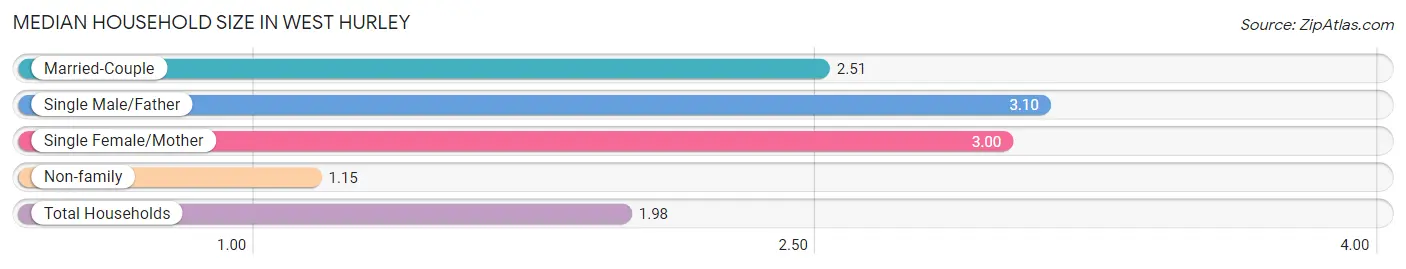
The median household size in West Hurley is 1.98 persons per household, with single male/father households (20 | 2.5%) accounting for the largest median household size of 3.1 persons per household. non-family households (363 | 45.2%) represent the smallest median household size with 1.15 persons per household.
| Household Type | # Households | Household Size |
| Married-Couple | 306 (38.1%) | 2.51 |
| Single Male/Father | 20 (2.5%) | 3.10 |
| Single Female/Mother | 115 (14.3%) | 3.00 |
| Non-family | 363 (45.2%) | 1.15 |
| Total Households | 804 (100.0%) | 1.98 |
Household Size by Marriage Status in West Hurley
Out of a total of 804 households in West Hurley, 441 (54.8%) are family households, while 363 (45.2%) are nonfamily households. The most numerous type of family households are 2-person households, comprising 284, and the most common type of nonfamily households are 1-person households, comprising 310.
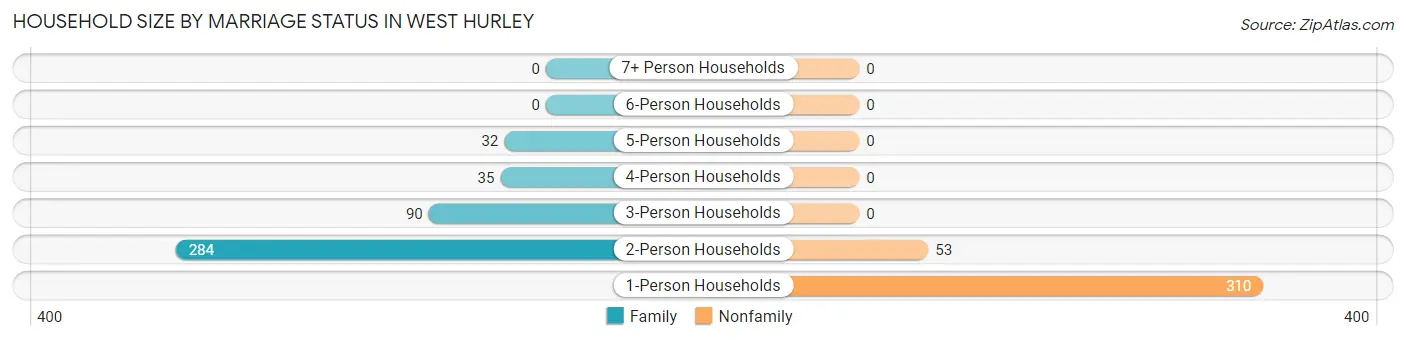
| Household Size | Family Households | Nonfamily Households |
| 1-Person Households | - | 310 (38.6%) |
| 2-Person Households | 284 (35.3%) | 53 (6.6%) |
| 3-Person Households | 90 (11.2%) | 0 (0.0%) |
| 4-Person Households | 35 (4.3%) | 0 (0.0%) |
| 5-Person Households | 32 (4.0%) | 0 (0.0%) |
| 6-Person Households | 0 (0.0%) | 0 (0.0%) |
| 7+ Person Households | 0 (0.0%) | 0 (0.0%) |
| Total | 441 (54.8%) | 363 (45.2%) |
Female Fertility in West Hurley
Fertility by Age in West Hurley
| Age Bracket | Women with Births | Births / 1,000 Women |
| 15 to 19 years | 0 (0.0%) | 0.0 |
| 20 to 34 years | 0 (0.0%) | 0.0 |
| 35 to 50 years | 0 (0.0%) | 0.0 |
| Total | 0 (0.0%) | 0.0 |
Fertility by Age by Marriage Status in West Hurley
| Age Bracket | Married | Unmarried |
| 15 to 19 years | 0 (0.0%) | 0 (0.0%) |
| 20 to 34 years | 0 (0.0%) | 0 (0.0%) |
| 35 to 50 years | 0 (0.0%) | 0 (0.0%) |
| Total | 0 (0.0%) | 0 (0.0%) |
Fertility by Education in West Hurley
| Educational Attainment | Women with Births | Births / 1,000 Women |
| Less than High School | 0 (0.0%) | 0.0 |
| High School Diploma | 0 (0.0%) | 0.0 |
| College or Associate's Degree | 0 (0.0%) | 0.0 |
| Bachelor's Degree | 0 (0.0%) | 0.0 |
| Graduate Degree | 0 (0.0%) | 0.0 |
| Total | 0 (0.0%) | 0.0 |
Fertility by Education by Marriage Status in West Hurley
| Educational Attainment | Married | Unmarried |
| Less than High School | 0 (0.0%) | 0 (0.0%) |
| High School Diploma | 0 (0.0%) | 0 (0.0%) |
| College or Associate's Degree | 0 (0.0%) | 0 (0.0%) |
| Bachelor's Degree | 0 (0.0%) | 0 (0.0%) |
| Graduate Degree | 0 (0.0%) | 0 (0.0%) |
| Total | 0 (0.0%) | 0 (0.0%) |
Employment Characteristics in West Hurley
Employment by Class of Employer in West Hurley
Among the 763 employed individuals in West Hurley, private company employees (343 | 45.0%), not-for-profit organizations (186 | 24.4%), and self-employed (incorporated) (99 | 13.0%) make up the most common classes of employment.
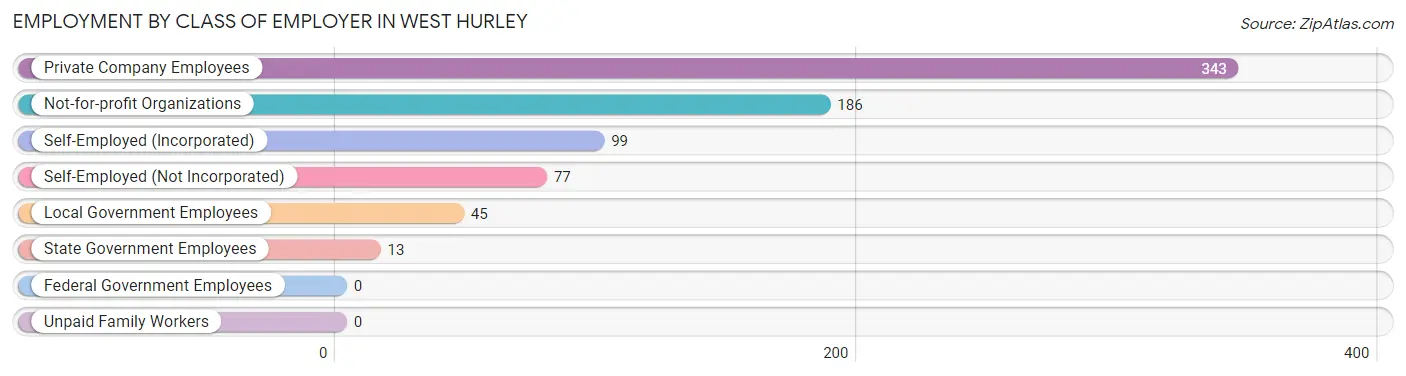
| Employer Class | # Employees | % Employees |
| Private Company Employees | 343 | 45.0% |
| Self-Employed (Incorporated) | 99 | 13.0% |
| Self-Employed (Not Incorporated) | 77 | 10.1% |
| Not-for-profit Organizations | 186 | 24.4% |
| Local Government Employees | 45 | 5.9% |
| State Government Employees | 13 | 1.7% |
| Federal Government Employees | 0 | 0.0% |
| Unpaid Family Workers | 0 | 0.0% |
| Total | 763 | 100.0% |
Employment Status by Age in West Hurley
According to the labor force statistics for West Hurley, out of the total population over 16 years of age (1,415), 55.5% or 785 individuals are in the labor force, with 2.9% or 23 of them unemployed. The age group with the highest labor force participation rate is 20 to 24 years, with 100.0% or 77 individuals in the labor force. Within the labor force, the 60 to 64 years age range has the highest percentage of unemployed individuals, with 9.2% or 14 of them being unemployed.
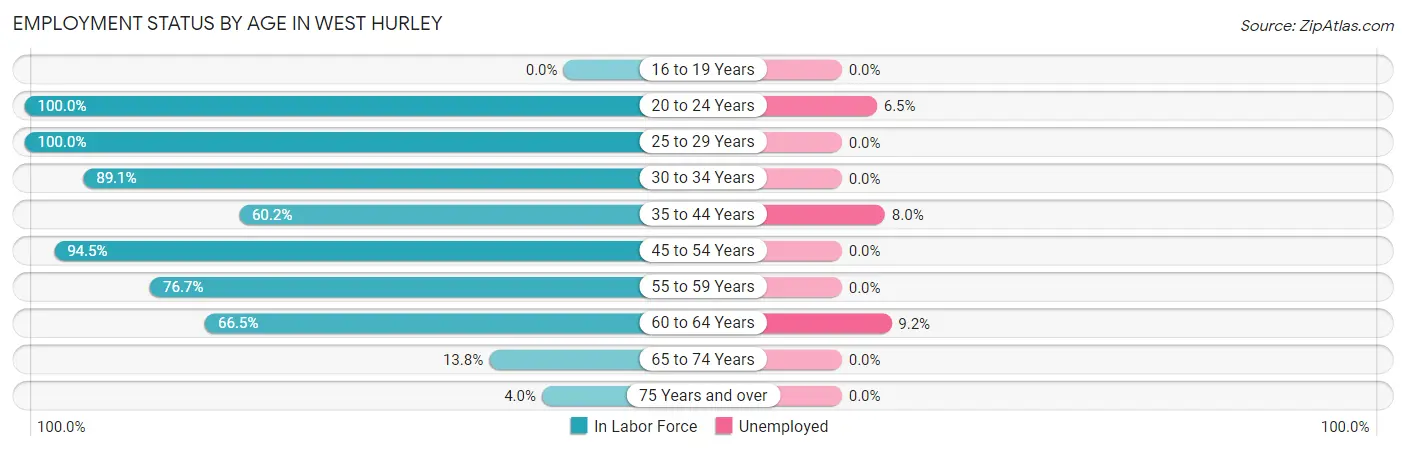
| Age Bracket | In Labor Force | Unemployed |
| 16 to 19 Years | 0 (0.0%) | 0 (0.0%) |
| 20 to 24 Years | 77 (100.0%) | 5 (6.5%) |
| 25 to 29 Years | 57 (100.0%) | 0 (0.0%) |
| 30 to 34 Years | 131 (89.1%) | 0 (0.0%) |
| 35 to 44 Years | 50 (60.2%) | 4 (8.0%) |
| 45 to 54 Years | 173 (94.5%) | 0 (0.0%) |
| 55 to 59 Years | 99 (76.7%) | 0 (0.0%) |
| 60 to 64 Years | 153 (66.5%) | 14 (9.2%) |
| 65 to 74 Years | 39 (13.8%) | 0 (0.0%) |
| 75 Years and over | 7 (4.0%) | 0 (0.0%) |
| Total | 785 (55.5%) | 23 (2.9%) |
Employment Status by Educational Attainment in West Hurley
According to labor force statistics for West Hurley, 80.0% of individuals (663) out of the total population between 25 and 64 years of age (829) are in the labor force, with 2.7% or 18 of them being unemployed. The group with the highest labor force participation rate are those with the educational attainment of high school diploma, with 85.5% or 141 individuals in the labor force. Within the labor force, individuals with bachelor's degree or higher education have the highest percentage of unemployment, with 3.9% or 14 of them being unemployed.
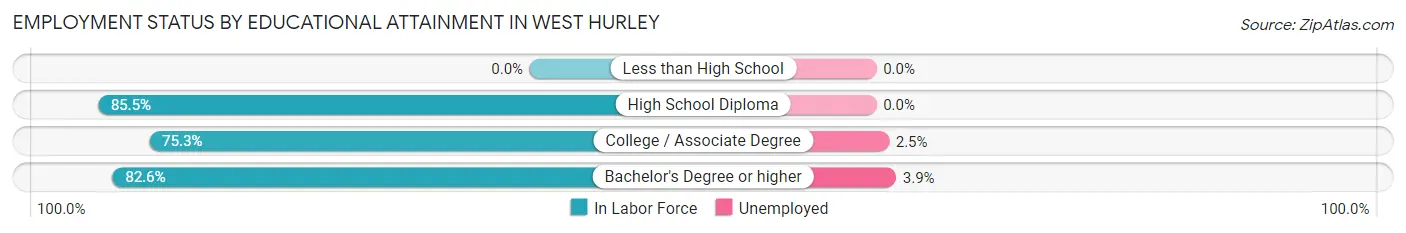
| Educational Attainment | In Labor Force | Unemployed |
| Less than High School | 0 (0.0%) | 0 (0.0%) |
| High School Diploma | 141 (85.5%) | 0 (0.0%) |
| College / Associate Degree | 162 (75.3%) | 5 (2.5%) |
| Bachelor's Degree or higher | 360 (82.6%) | 17 (3.9%) |
| Total | 663 (80.0%) | 22 (2.7%) |
Employment Occupations by Sex in West Hurley
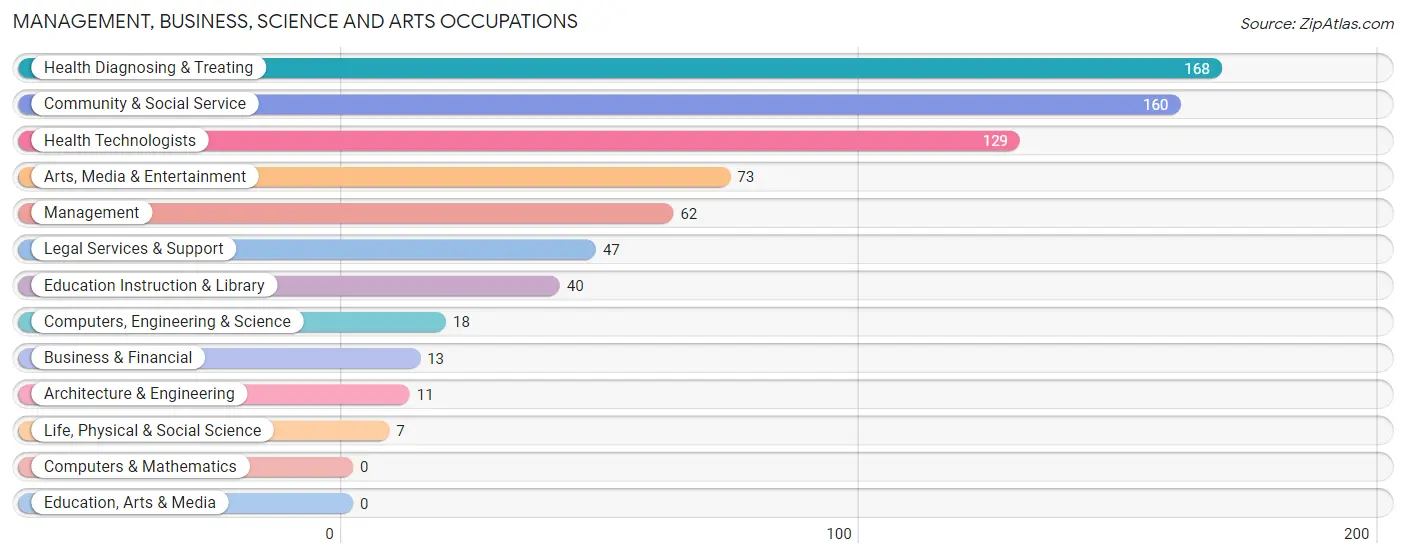
Management, Business, Science and Arts Occupations
The most common Management, Business, Science and Arts occupations in West Hurley are Health Diagnosing & Treating (168 | 22.0%), Community & Social Service (160 | 21.0%), Health Technologists (129 | 16.9%), Arts, Media & Entertainment (73 | 9.6%), and Management (62 | 8.1%).
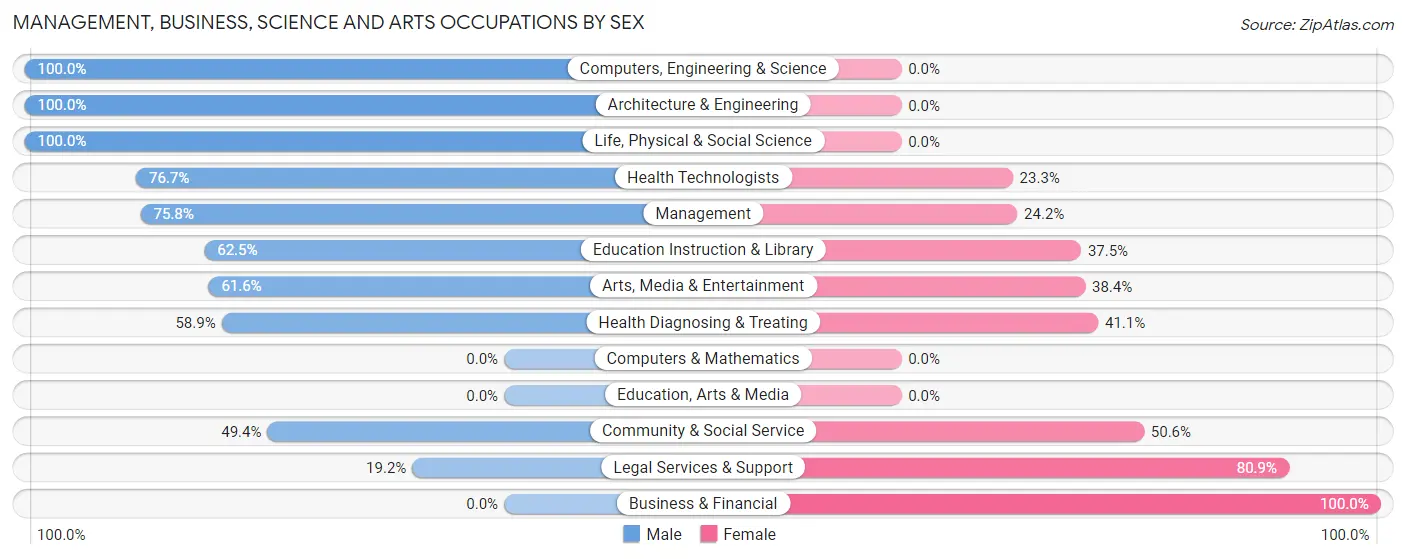
Management, Business, Science and Arts Occupations by Sex
Within the Management, Business, Science and Arts occupations in West Hurley, the most male-oriented occupations are Computers, Engineering & Science (100.0%), Architecture & Engineering (100.0%), and Life, Physical & Social Science (100.0%), while the most female-oriented occupations are Business & Financial (100.0%), Legal Services & Support (80.8%), and Community & Social Service (50.6%).
| Occupation | Male | Female |
| Management | 47 (75.8%) | 15 (24.2%) |
| Business & Financial | 0 (0.0%) | 13 (100.0%) |
| Computers, Engineering & Science | 18 (100.0%) | 0 (0.0%) |
| Computers & Mathematics | 0 (0.0%) | 0 (0.0%) |
| Architecture & Engineering | 11 (100.0%) | 0 (0.0%) |
| Life, Physical & Social Science | 7 (100.0%) | 0 (0.0%) |
| Community & Social Service | 79 (49.4%) | 81 (50.6%) |
| Education, Arts & Media | 0 (0.0%) | 0 (0.0%) |
| Legal Services & Support | 9 (19.2%) | 38 (80.8%) |
| Education Instruction & Library | 25 (62.5%) | 15 (37.5%) |
| Arts, Media & Entertainment | 45 (61.6%) | 28 (38.4%) |
| Health Diagnosing & Treating | 99 (58.9%) | 69 (41.1%) |
| Health Technologists | 99 (76.7%) | 30 (23.3%) |
| Total (Category) | 243 (57.7%) | 178 (42.3%) |
| Total (Overall) | 456 (59.8%) | 307 (40.2%) |
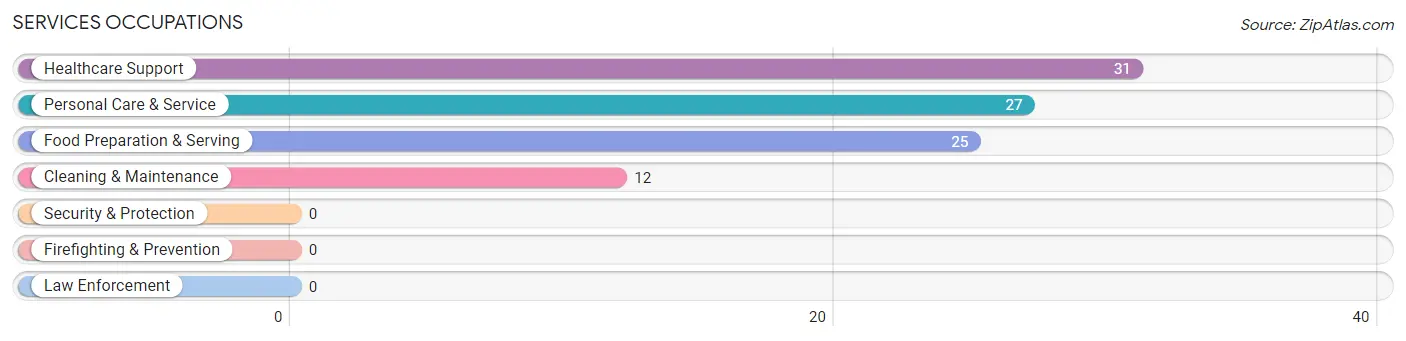
Services Occupations
The most common Services occupations in West Hurley are Healthcare Support (31 | 4.1%), Personal Care & Service (27 | 3.5%), Food Preparation & Serving (25 | 3.3%), and Cleaning & Maintenance (12 | 1.6%).
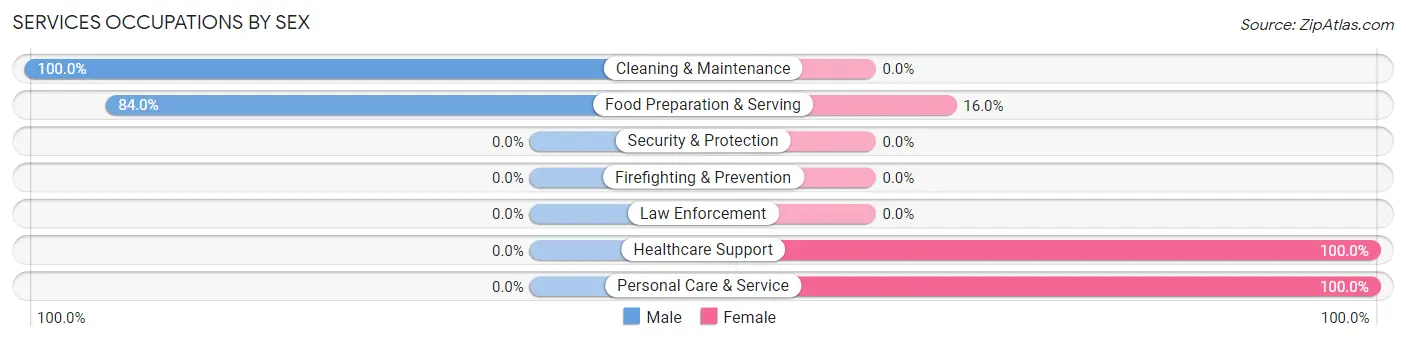
Services Occupations by Sex
Within the Services occupations in West Hurley, the most male-oriented occupations are Cleaning & Maintenance (100.0%), and Food Preparation & Serving (84.0%), while the most female-oriented occupations are Healthcare Support (100.0%), Personal Care & Service (100.0%), and Food Preparation & Serving (16.0%).
| Occupation | Male | Female |
| Healthcare Support | 0 (0.0%) | 31 (100.0%) |
| Security & Protection | 0 (0.0%) | 0 (0.0%) |
| Firefighting & Prevention | 0 (0.0%) | 0 (0.0%) |
| Law Enforcement | 0 (0.0%) | 0 (0.0%) |
| Food Preparation & Serving | 21 (84.0%) | 4 (16.0%) |
| Cleaning & Maintenance | 12 (100.0%) | 0 (0.0%) |
| Personal Care & Service | 0 (0.0%) | 27 (100.0%) |
| Total (Category) | 33 (34.7%) | 62 (65.3%) |
| Total (Overall) | 456 (59.8%) | 307 (40.2%) |
Sales and Office Occupations
The most common Sales and Office occupations in West Hurley are Sales & Related (55 | 7.2%), and Office & Administration (52 | 6.8%).
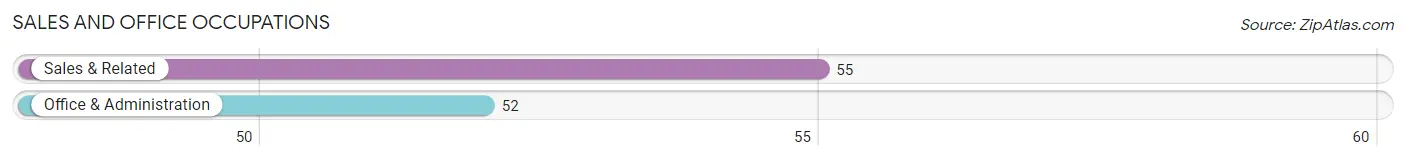
Sales and Office Occupations by Sex
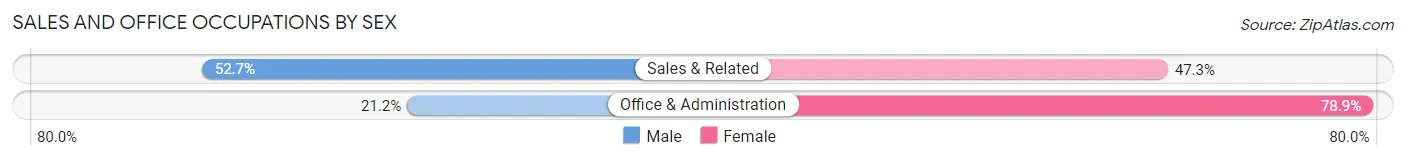
| Occupation | Male | Female |
| Sales & Related | 29 (52.7%) | 26 (47.3%) |
| Office & Administration | 11 (21.1%) | 41 (78.8%) |
| Total (Category) | 40 (37.4%) | 67 (62.6%) |
| Total (Overall) | 456 (59.8%) | 307 (40.2%) |
Natural Resources, Construction and Maintenance Occupations
The most common Natural Resources, Construction and Maintenance occupations in West Hurley are Construction & Extraction (89 | 11.7%), and Installation, Maintenance & Repair (19 | 2.5%).
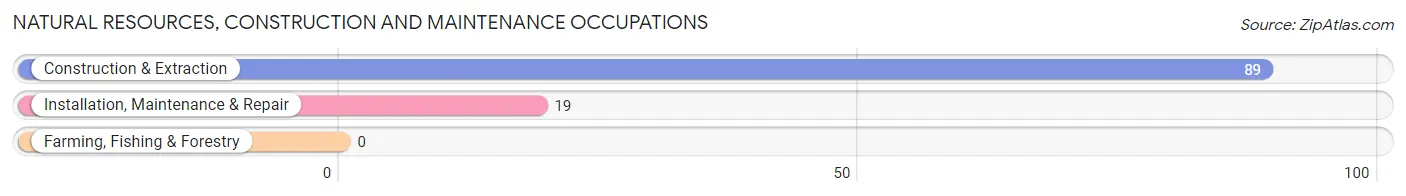
Natural Resources, Construction and Maintenance Occupations by Sex
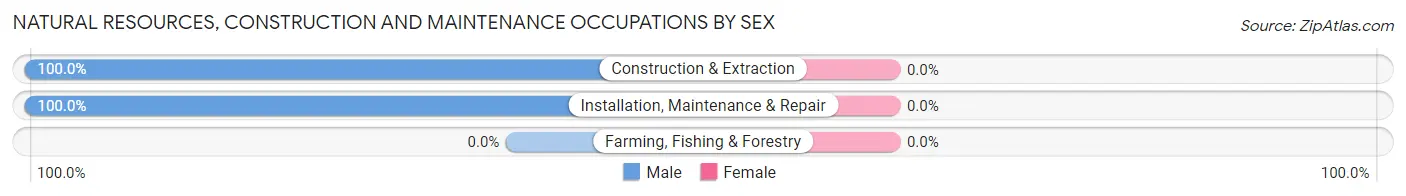
| Occupation | Male | Female |
| Farming, Fishing & Forestry | 0 (0.0%) | 0 (0.0%) |
| Construction & Extraction | 89 (100.0%) | 0 (0.0%) |
| Installation, Maintenance & Repair | 19 (100.0%) | 0 (0.0%) |
| Total (Category) | 108 (100.0%) | 0 (0.0%) |
| Total (Overall) | 456 (59.8%) | 307 (40.2%) |
Production, Transportation and Moving Occupations
The most common Production, Transportation and Moving occupations in West Hurley are , and Production (32 | 4.2%).
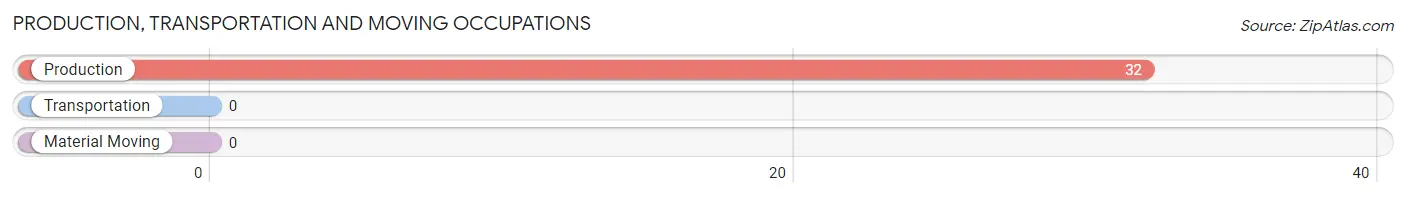
Production, Transportation and Moving Occupations by Sex
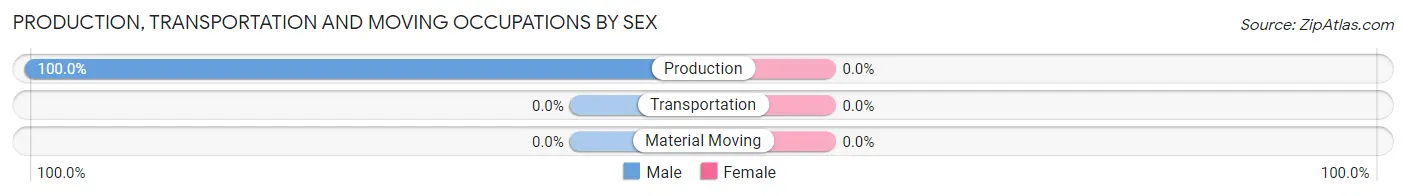
| Occupation | Male | Female |
| Production | 32 (100.0%) | 0 (0.0%) |
| Transportation | 0 (0.0%) | 0 (0.0%) |
| Material Moving | 0 (0.0%) | 0 (0.0%) |
| Total (Category) | 32 (100.0%) | 0 (0.0%) |
| Total (Overall) | 456 (59.8%) | 307 (40.2%) |
Employment Industries by Sex in West Hurley
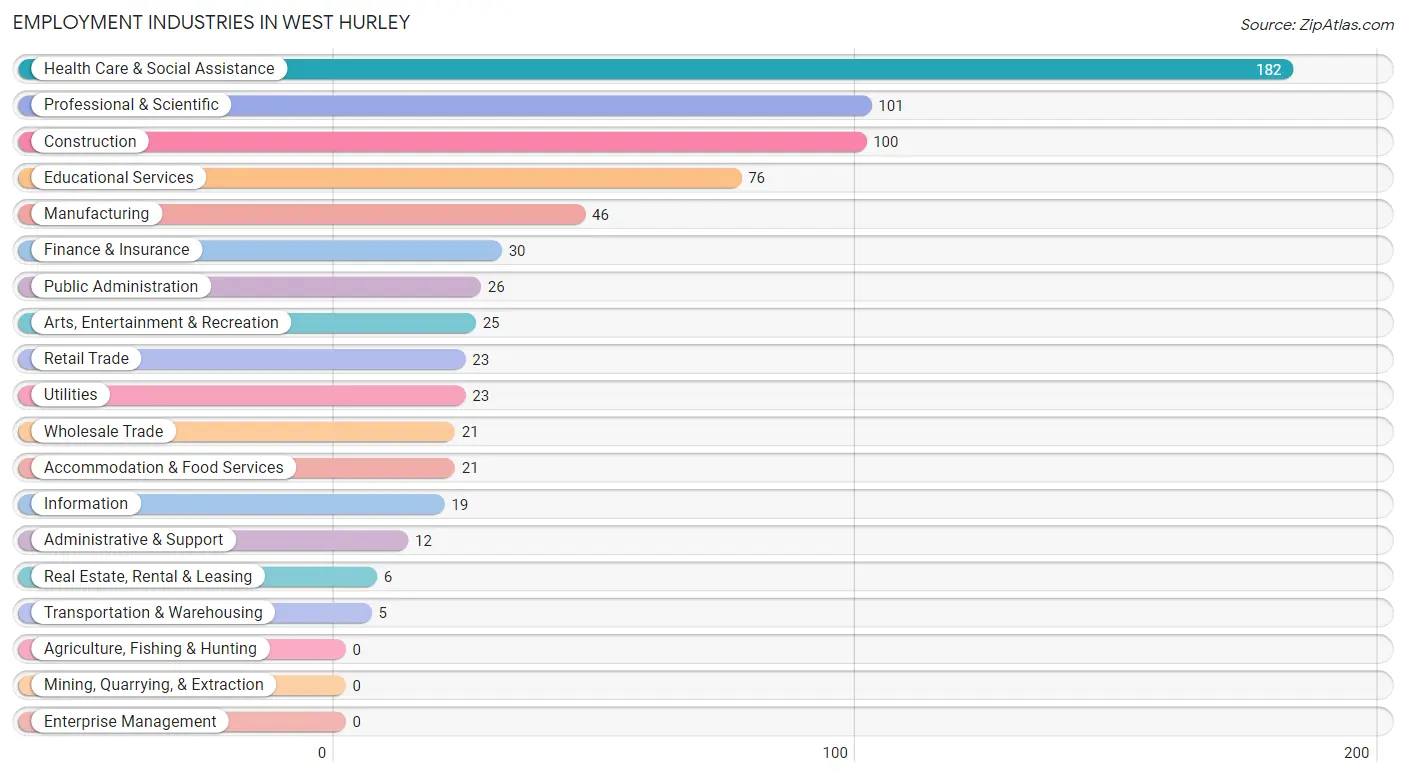
Employment Industries in West Hurley
The major employment industries in West Hurley include Health Care & Social Assistance (182 | 23.8%), Professional & Scientific (101 | 13.2%), Construction (100 | 13.1%), Educational Services (76 | 10.0%), and Manufacturing (46 | 6.0%).
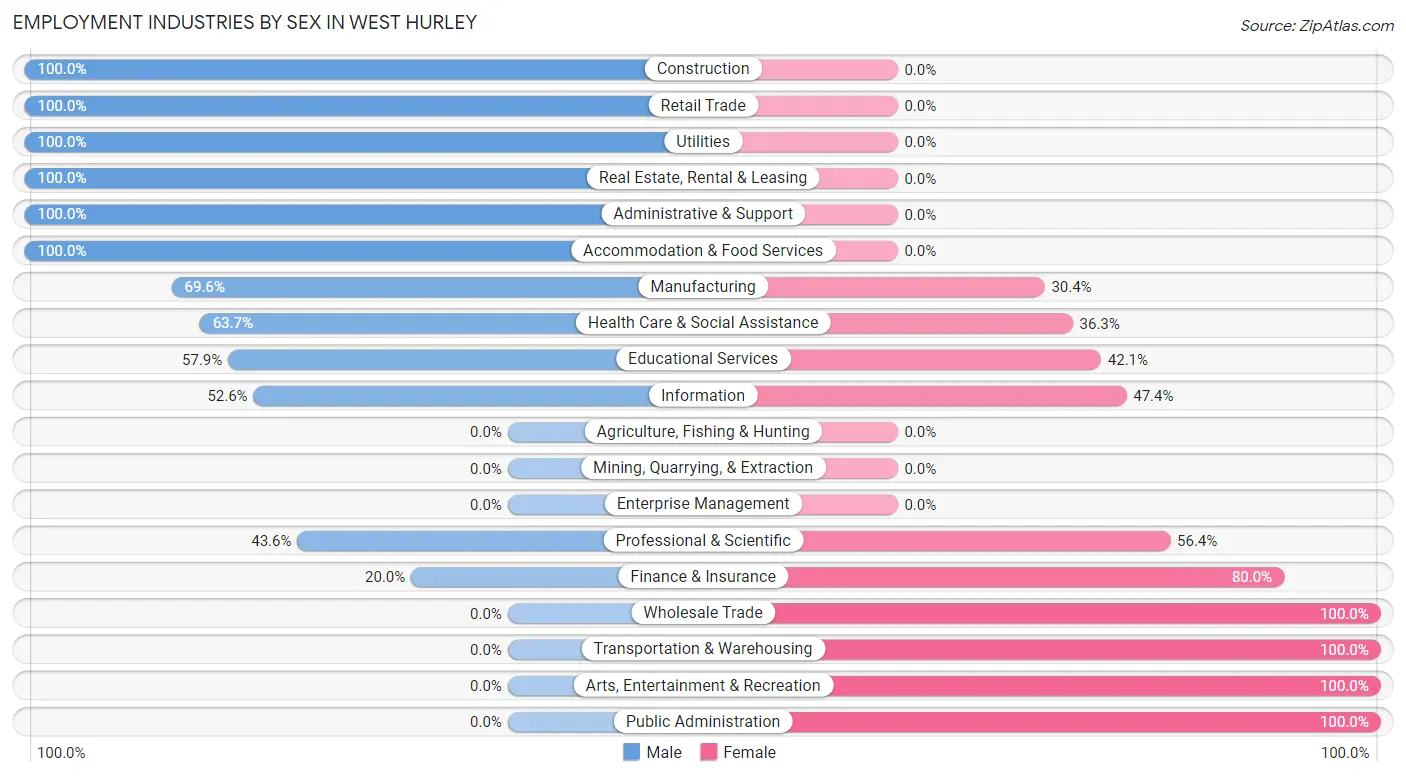
Employment Industries by Sex in West Hurley
The West Hurley industries that see more men than women are Construction (100.0%), Retail Trade (100.0%), and Utilities (100.0%), whereas the industries that tend to have a higher number of women are Wholesale Trade (100.0%), Transportation & Warehousing (100.0%), and Arts, Entertainment & Recreation (100.0%).
| Industry | Male | Female |
| Agriculture, Fishing & Hunting | 0 (0.0%) | 0 (0.0%) |
| Mining, Quarrying, & Extraction | 0 (0.0%) | 0 (0.0%) |
| Construction | 100 (100.0%) | 0 (0.0%) |
| Manufacturing | 32 (69.6%) | 14 (30.4%) |
| Wholesale Trade | 0 (0.0%) | 21 (100.0%) |
| Retail Trade | 23 (100.0%) | 0 (0.0%) |
| Transportation & Warehousing | 0 (0.0%) | 5 (100.0%) |
| Utilities | 23 (100.0%) | 0 (0.0%) |
| Information | 10 (52.6%) | 9 (47.4%) |
| Finance & Insurance | 6 (20.0%) | 24 (80.0%) |
| Real Estate, Rental & Leasing | 6 (100.0%) | 0 (0.0%) |
| Professional & Scientific | 44 (43.6%) | 57 (56.4%) |
| Enterprise Management | 0 (0.0%) | 0 (0.0%) |
| Administrative & Support | 12 (100.0%) | 0 (0.0%) |
| Educational Services | 44 (57.9%) | 32 (42.1%) |
| Health Care & Social Assistance | 116 (63.7%) | 66 (36.3%) |
| Arts, Entertainment & Recreation | 0 (0.0%) | 25 (100.0%) |
| Accommodation & Food Services | 21 (100.0%) | 0 (0.0%) |
| Public Administration | 0 (0.0%) | 26 (100.0%) |
| Total | 456 (59.8%) | 307 (40.2%) |
Education in West Hurley
School Enrollment in West Hurley
The most common levels of schooling among the 267 students in West Hurley are middle school (89 | 33.3%), high school (60 | 22.5%), and college / undergraduate (58 | 21.7%).
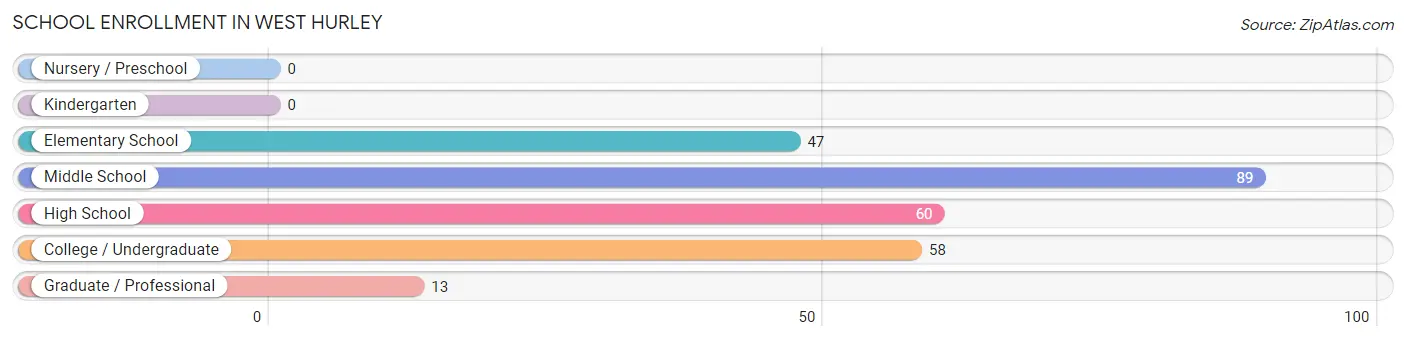
| School Level | # Students | % Students |
| Nursery / Preschool | 0 | 0.0% |
| Kindergarten | 0 | 0.0% |
| Elementary School | 47 | 17.6% |
| Middle School | 89 | 33.3% |
| High School | 60 | 22.5% |
| College / Undergraduate | 58 | 21.7% |
| Graduate / Professional | 13 | 4.9% |
| Total | 267 | 100.0% |
School Enrollment by Age by Funding Source in West Hurley
Out of a total of 267 students who are enrolled in schools in West Hurley, 80 (30.0%) attend a private institution, while the remaining 187 (70.0%) are enrolled in public schools. The age group of 18 to 19 year olds has the highest likelihood of being enrolled in private schools, with 28 (100.0% in the age bracket) enrolled. Conversely, the age group of 15 to 17 year olds has the lowest likelihood of being enrolled in a private school, with 60 (100.0% in the age bracket) attending a public institution.
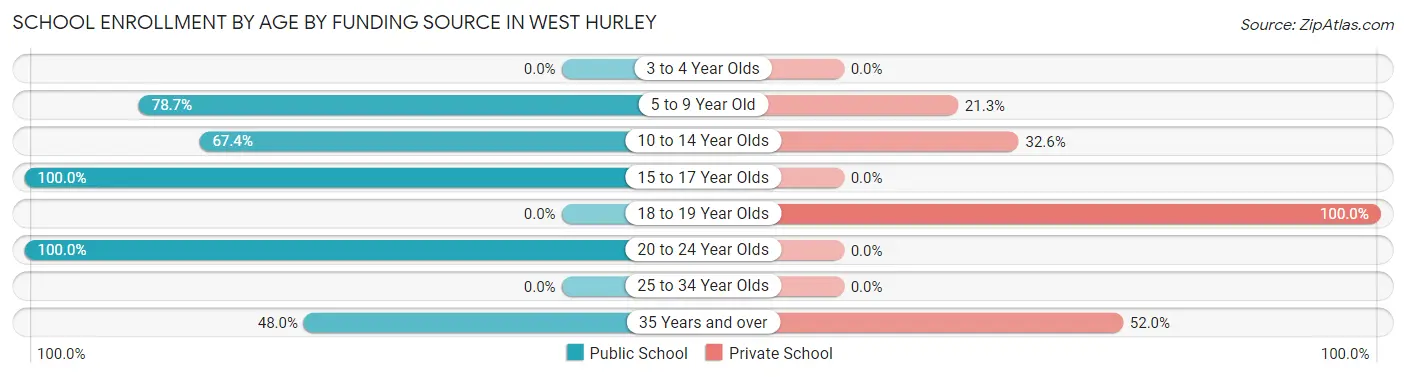
| Age Bracket | Public School | Private School |
| 3 to 4 Year Olds | 0 (0.0%) | 0 (0.0%) |
| 5 to 9 Year Old | 37 (78.7%) | 10 (21.3%) |
| 10 to 14 Year Olds | 60 (67.4%) | 29 (32.6%) |
| 15 to 17 Year Olds | 60 (100.0%) | 0 (0.0%) |
| 18 to 19 Year Olds | 0 (0.0%) | 28 (100.0%) |
| 20 to 24 Year Olds | 18 (100.0%) | 0 (0.0%) |
| 25 to 34 Year Olds | 0 (0.0%) | 0 (0.0%) |
| 35 Years and over | 12 (48.0%) | 13 (52.0%) |
| Total | 187 (70.0%) | 80 (30.0%) |
Educational Attainment by Field of Study in West Hurley
Education (122 | 17.3%), communications (117 | 16.6%), social sciences (91 | 12.9%), business (85 | 12.1%), and visual & performing arts (66 | 9.4%) are the most common fields of study among 705 individuals in West Hurley who have obtained a bachelor's degree or higher.
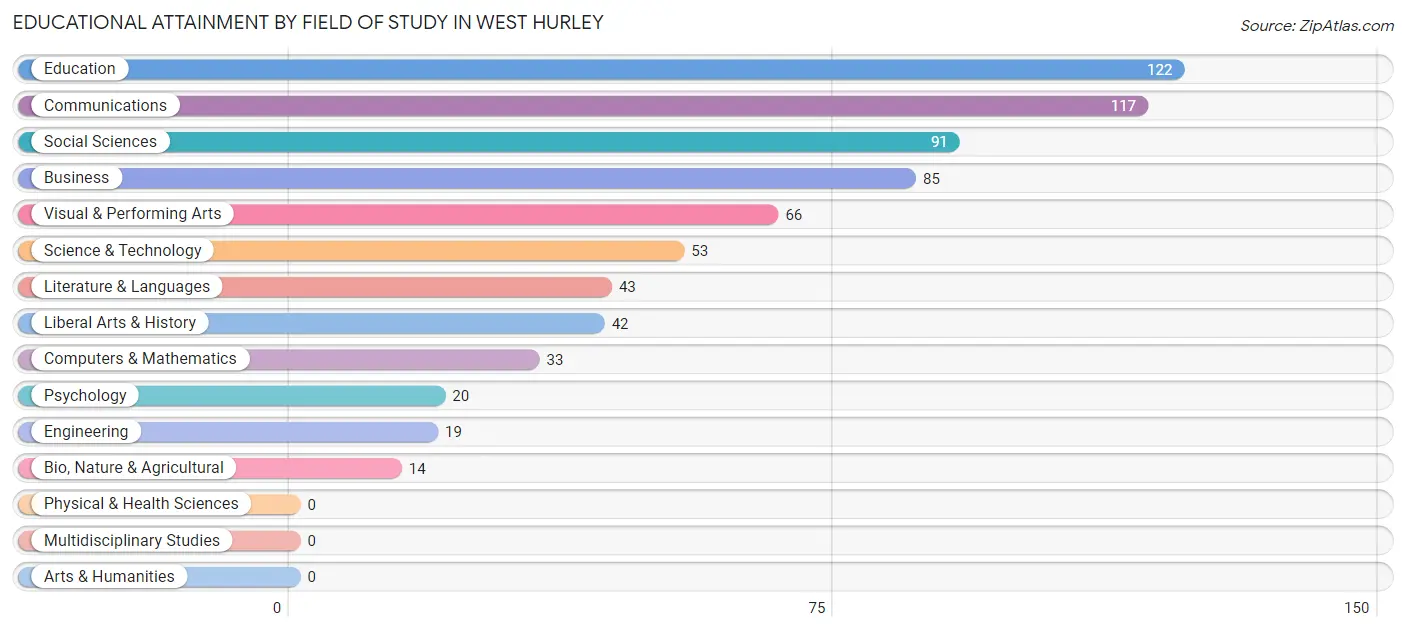
| Field of Study | # Graduates | % Graduates |
| Computers & Mathematics | 33 | 4.7% |
| Bio, Nature & Agricultural | 14 | 2.0% |
| Physical & Health Sciences | 0 | 0.0% |
| Psychology | 20 | 2.8% |
| Social Sciences | 91 | 12.9% |
| Engineering | 19 | 2.7% |
| Multidisciplinary Studies | 0 | 0.0% |
| Science & Technology | 53 | 7.5% |
| Business | 85 | 12.1% |
| Education | 122 | 17.3% |
| Literature & Languages | 43 | 6.1% |
| Liberal Arts & History | 42 | 6.0% |
| Visual & Performing Arts | 66 | 9.4% |
| Communications | 117 | 16.6% |
| Arts & Humanities | 0 | 0.0% |
| Total | 705 | 100.0% |
Transportation & Commute in West Hurley
Vehicle Availability by Sex in West Hurley
The most prevalent vehicle ownership categories in West Hurley are males with 2 vehicles (315, accounting for 69.1%) and females with 2 vehicles (188, making up 104.3%).
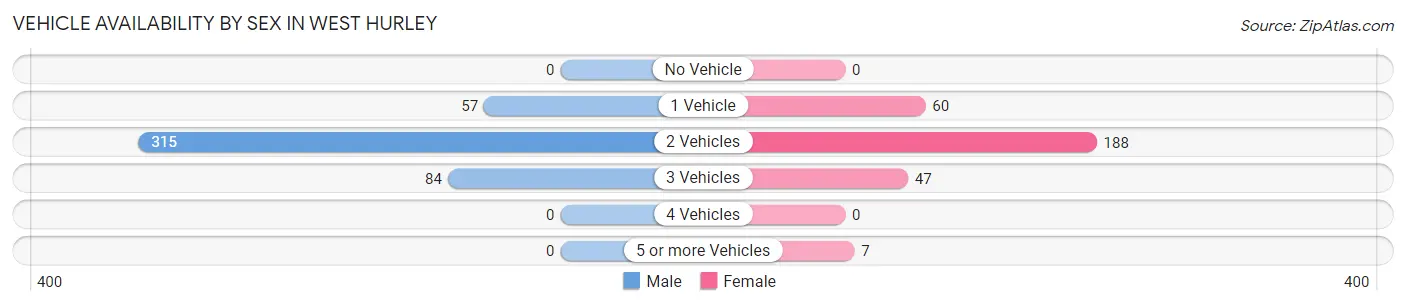
| Vehicles Available | Male | Female |
| No Vehicle | 0 (0.0%) | 0 (0.0%) |
| 1 Vehicle | 57 (12.5%) | 60 (19.9%) |
| 2 Vehicles | 315 (69.1%) | 188 (62.3%) |
| 3 Vehicles | 84 (18.4%) | 47 (15.6%) |
| 4 Vehicles | 0 (0.0%) | 0 (0.0%) |
| 5 or more Vehicles | 0 (0.0%) | 7 (2.3%) |
| Total | 456 (100.0%) | 302 (100.0%) |
Commute Time in West Hurley
The most frequently occuring commute durations in West Hurley are 45 to 59 minutes (156 commuters, 22.4%), 30 to 34 minutes (123 commuters, 17.7%), and 15 to 19 minutes (107 commuters, 15.4%).
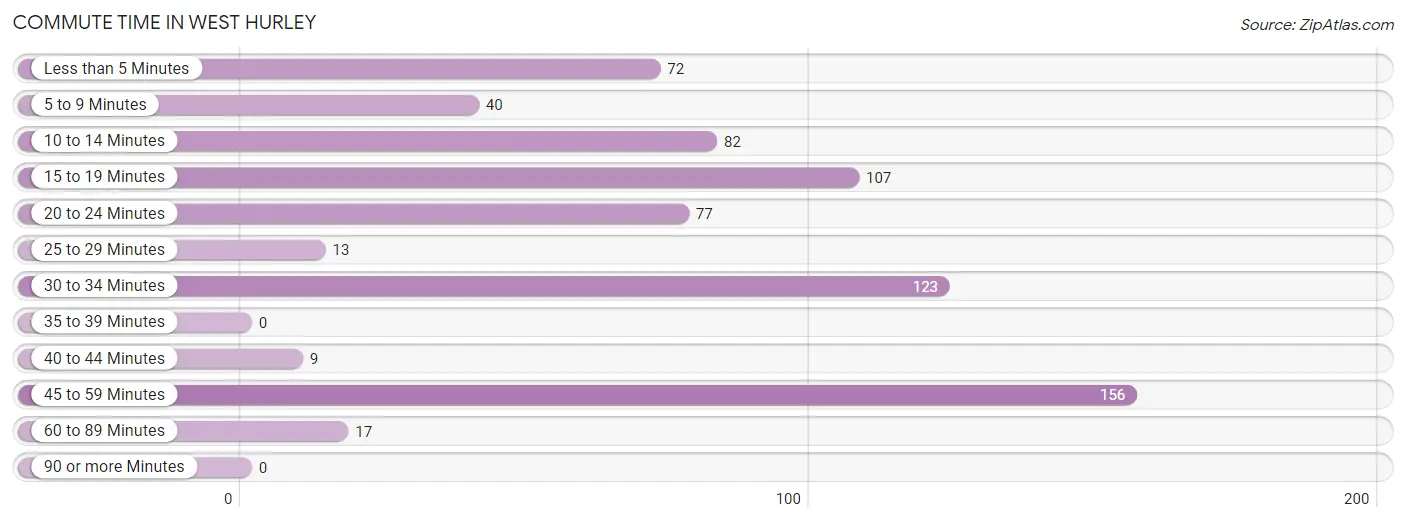
| Commute Time | # Commuters | % Commuters |
| Less than 5 Minutes | 72 | 10.3% |
| 5 to 9 Minutes | 40 | 5.8% |
| 10 to 14 Minutes | 82 | 11.8% |
| 15 to 19 Minutes | 107 | 15.4% |
| 20 to 24 Minutes | 77 | 11.1% |
| 25 to 29 Minutes | 13 | 1.9% |
| 30 to 34 Minutes | 123 | 17.7% |
| 35 to 39 Minutes | 0 | 0.0% |
| 40 to 44 Minutes | 9 | 1.3% |
| 45 to 59 Minutes | 156 | 22.4% |
| 60 to 89 Minutes | 17 | 2.4% |
| 90 or more Minutes | 0 | 0.0% |
Commute Time by Sex in West Hurley
The most common commute times in West Hurley are 45 to 59 minutes (146 commuters, 34.9%) for males and 15 to 19 minutes (94 commuters, 33.8%) for females.
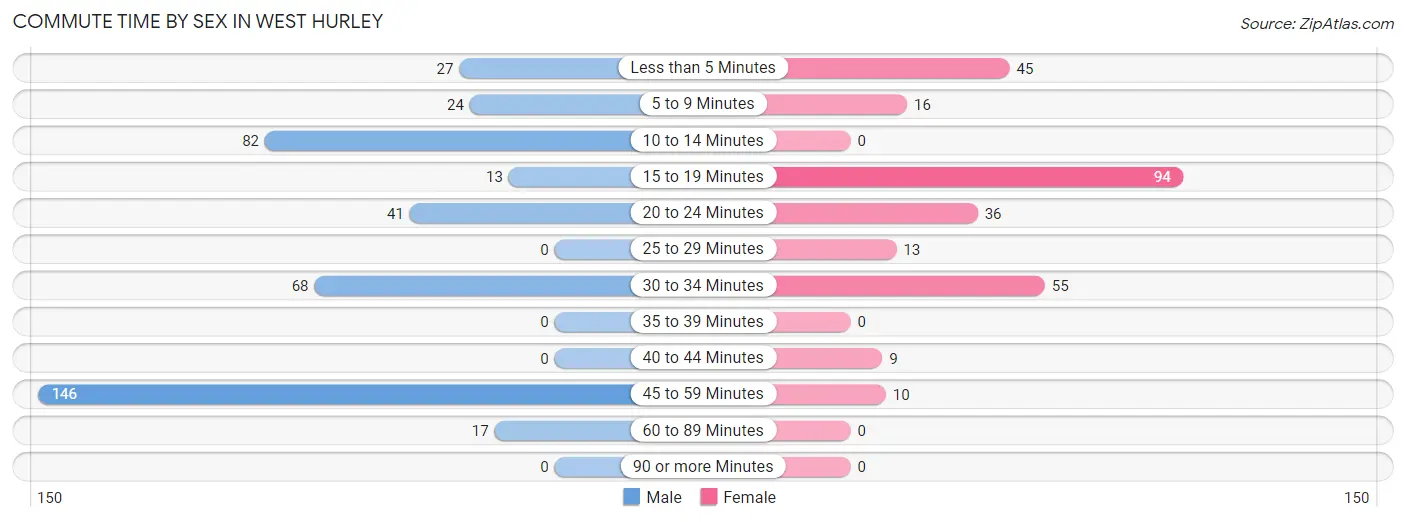
| Commute Time | Male | Female |
| Less than 5 Minutes | 27 (6.5%) | 45 (16.2%) |
| 5 to 9 Minutes | 24 (5.7%) | 16 (5.8%) |
| 10 to 14 Minutes | 82 (19.6%) | 0 (0.0%) |
| 15 to 19 Minutes | 13 (3.1%) | 94 (33.8%) |
| 20 to 24 Minutes | 41 (9.8%) | 36 (13.0%) |
| 25 to 29 Minutes | 0 (0.0%) | 13 (4.7%) |
| 30 to 34 Minutes | 68 (16.3%) | 55 (19.8%) |
| 35 to 39 Minutes | 0 (0.0%) | 0 (0.0%) |
| 40 to 44 Minutes | 0 (0.0%) | 9 (3.2%) |
| 45 to 59 Minutes | 146 (34.9%) | 10 (3.6%) |
| 60 to 89 Minutes | 17 (4.1%) | 0 (0.0%) |
| 90 or more Minutes | 0 (0.0%) | 0 (0.0%) |
Time of Departure to Work by Sex in West Hurley
The most frequent times of departure to work in West Hurley are 8:30 AM to 8:59 AM (107, 25.6%) for males and 6:00 AM to 6:29 AM (47, 16.9%) for females.
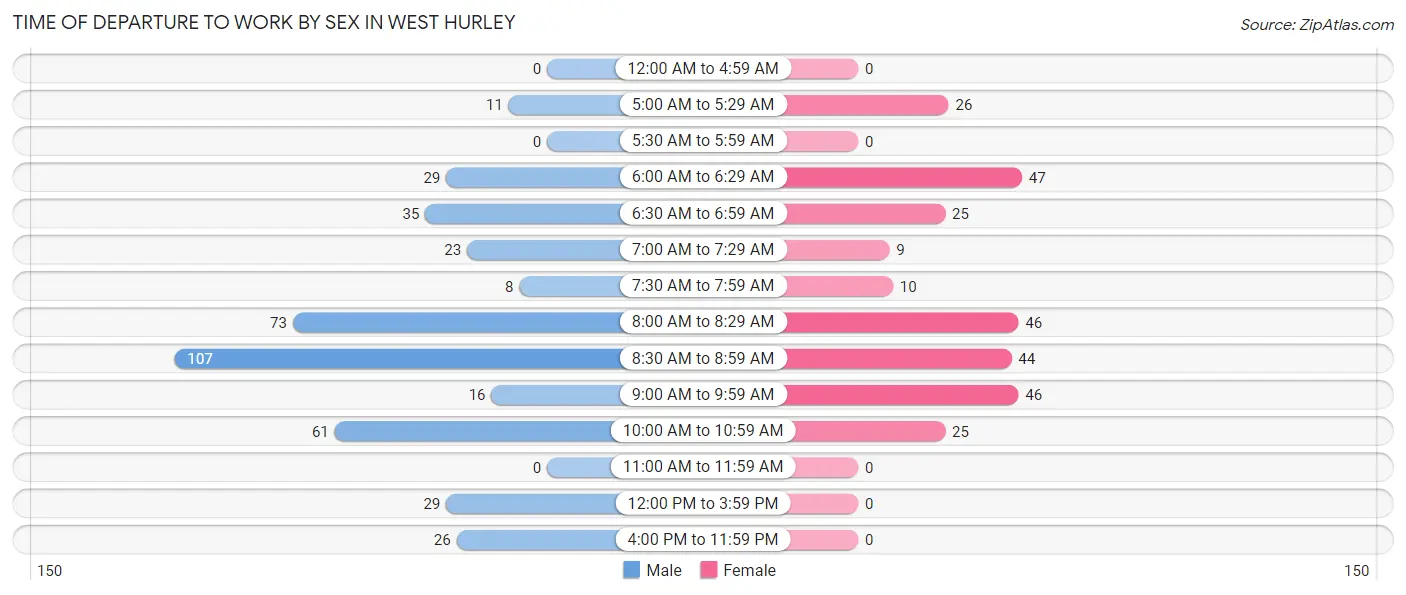
| Time of Departure | Male | Female |
| 12:00 AM to 4:59 AM | 0 (0.0%) | 0 (0.0%) |
| 5:00 AM to 5:29 AM | 11 (2.6%) | 26 (9.3%) |
| 5:30 AM to 5:59 AM | 0 (0.0%) | 0 (0.0%) |
| 6:00 AM to 6:29 AM | 29 (6.9%) | 47 (16.9%) |
| 6:30 AM to 6:59 AM | 35 (8.4%) | 25 (9.0%) |
| 7:00 AM to 7:29 AM | 23 (5.5%) | 9 (3.2%) |
| 7:30 AM to 7:59 AM | 8 (1.9%) | 10 (3.6%) |
| 8:00 AM to 8:29 AM | 73 (17.5%) | 46 (16.6%) |
| 8:30 AM to 8:59 AM | 107 (25.6%) | 44 (15.8%) |
| 9:00 AM to 9:59 AM | 16 (3.8%) | 46 (16.6%) |
| 10:00 AM to 10:59 AM | 61 (14.6%) | 25 (9.0%) |
| 11:00 AM to 11:59 AM | 0 (0.0%) | 0 (0.0%) |
| 12:00 PM to 3:59 PM | 29 (6.9%) | 0 (0.0%) |
| 4:00 PM to 11:59 PM | 26 (6.2%) | 0 (0.0%) |
| Total | 418 (100.0%) | 278 (100.0%) |
Housing Occupancy in West Hurley
Occupancy by Ownership in West Hurley
Of the total 804 dwellings in West Hurley, owner-occupied units account for 731 (90.9%), while renter-occupied units make up 73 (9.1%).
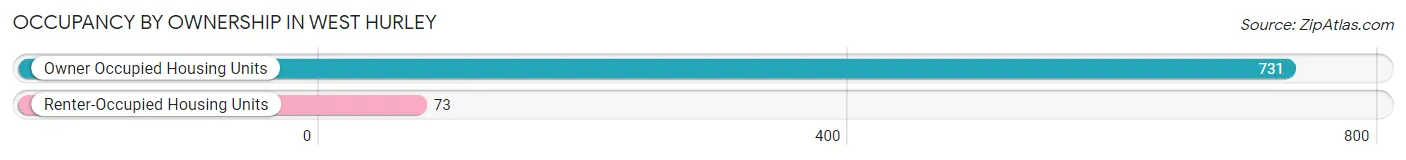
| Occupancy | # Housing Units | % Housing Units |
| Owner Occupied Housing Units | 731 | 90.9% |
| Renter-Occupied Housing Units | 73 | 9.1% |
| Total Occupied Housing Units | 804 | 100.0% |
Occupancy by Household Size in West Hurley
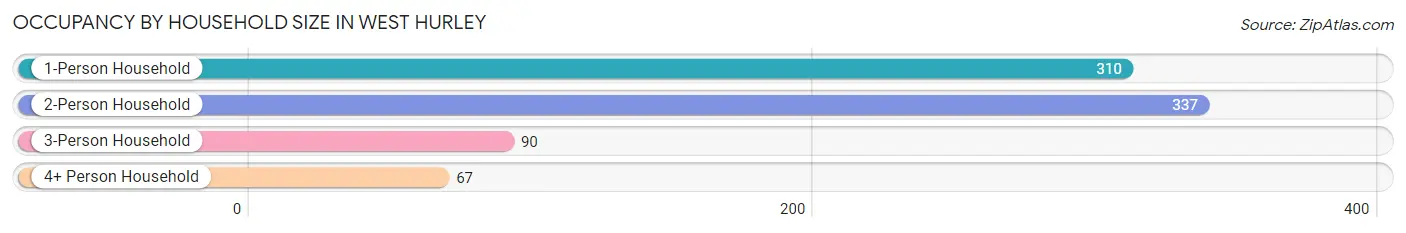
| Household Size | # Housing Units | % Housing Units |
| 1-Person Household | 310 | 38.6% |
| 2-Person Household | 337 | 41.9% |
| 3-Person Household | 90 | 11.2% |
| 4+ Person Household | 67 | 8.3% |
| Total Housing Units | 804 | 100.0% |
Occupancy by Ownership by Household Size in West Hurley
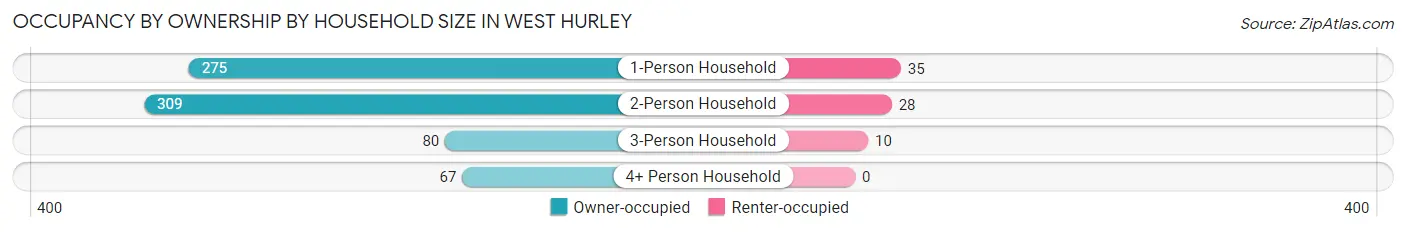
| Household Size | Owner-occupied | Renter-occupied |
| 1-Person Household | 275 (88.7%) | 35 (11.3%) |
| 2-Person Household | 309 (91.7%) | 28 (8.3%) |
| 3-Person Household | 80 (88.9%) | 10 (11.1%) |
| 4+ Person Household | 67 (100.0%) | 0 (0.0%) |
| Total Housing Units | 731 (90.9%) | 73 (9.1%) |
Occupancy by Educational Attainment in West Hurley
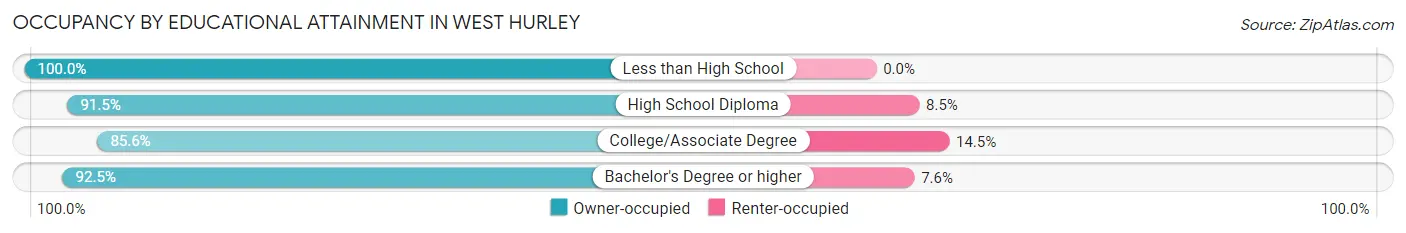
| Household Size | Owner-occupied | Renter-occupied |
| Less than High School | 13 (100.0%) | 0 (0.0%) |
| High School Diploma | 129 (91.5%) | 12 (8.5%) |
| College/Associate Degree | 148 (85.6%) | 25 (14.4%) |
| Bachelor's Degree or higher | 441 (92.4%) | 36 (7.5%) |
Occupancy by Age of Householder in West Hurley
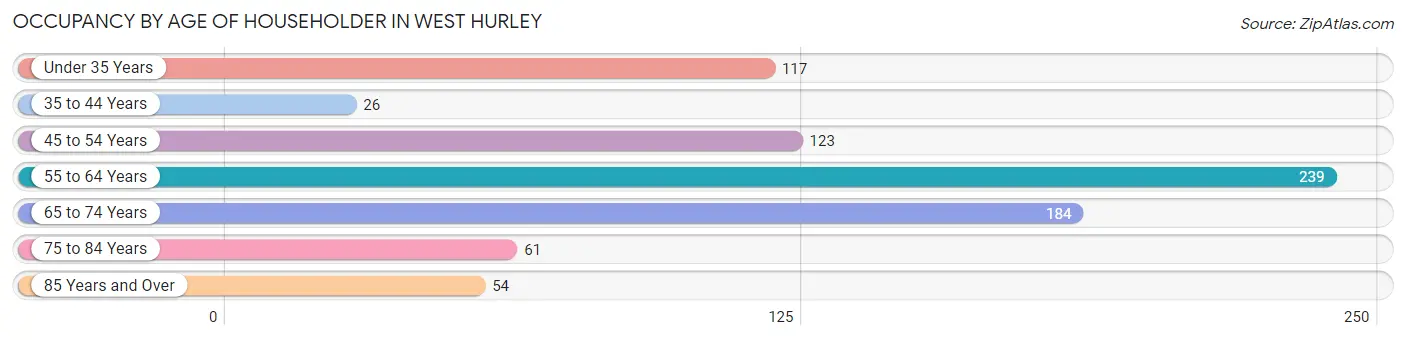
| Age Bracket | # Households | % Households |
| Under 35 Years | 117 | 14.5% |
| 35 to 44 Years | 26 | 3.2% |
| 45 to 54 Years | 123 | 15.3% |
| 55 to 64 Years | 239 | 29.7% |
| 65 to 74 Years | 184 | 22.9% |
| 75 to 84 Years | 61 | 7.6% |
| 85 Years and Over | 54 | 6.7% |
| Total | 804 | 100.0% |
Housing Finances in West Hurley
Median Income by Occupancy in West Hurley
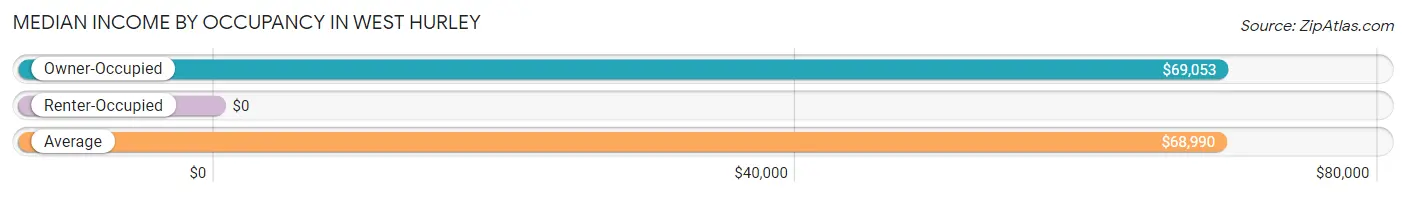
| Occupancy Type | # Households | Median Income |
| Owner-Occupied | 731 (90.9%) | $69,053 |
| Renter-Occupied | 73 (9.1%) | $0 |
| Average | 804 (100.0%) | $68,990 |
Occupancy by Householder Income Bracket in West Hurley
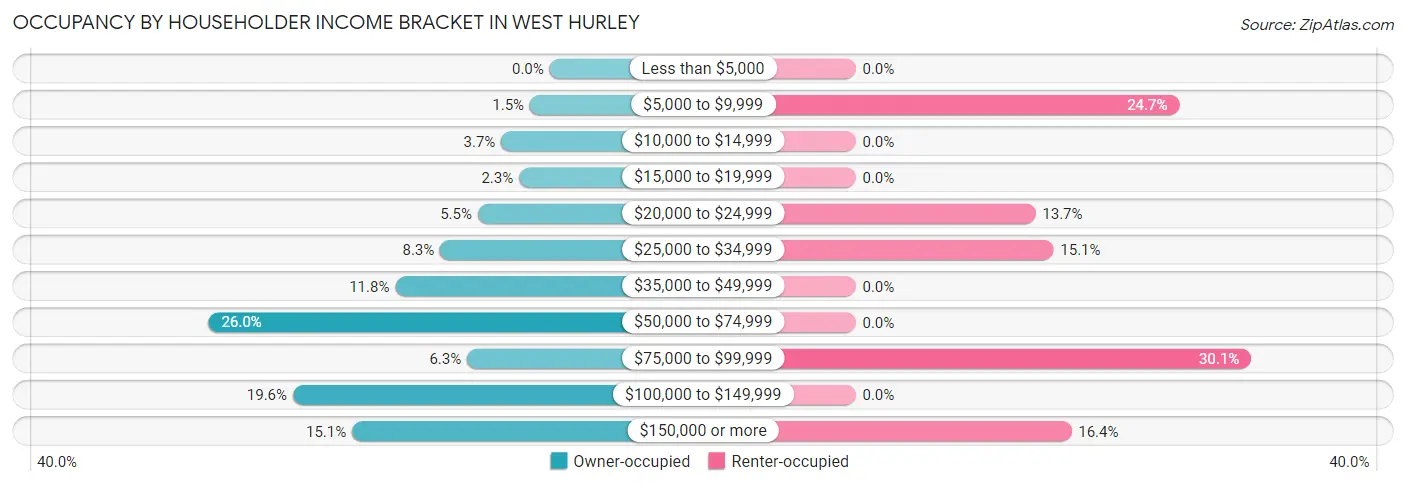
| Income Bracket | Owner-occupied | Renter-occupied |
| Less than $5,000 | 0 (0.0%) | 0 (0.0%) |
| $5,000 to $9,999 | 11 (1.5%) | 18 (24.7%) |
| $10,000 to $14,999 | 27 (3.7%) | 0 (0.0%) |
| $15,000 to $19,999 | 17 (2.3%) | 0 (0.0%) |
| $20,000 to $24,999 | 40 (5.5%) | 10 (13.7%) |
| $25,000 to $34,999 | 61 (8.3%) | 11 (15.1%) |
| $35,000 to $49,999 | 86 (11.8%) | 0 (0.0%) |
| $50,000 to $74,999 | 190 (26.0%) | 0 (0.0%) |
| $75,000 to $99,999 | 46 (6.3%) | 22 (30.1%) |
| $100,000 to $149,999 | 143 (19.6%) | 0 (0.0%) |
| $150,000 or more | 110 (15.0%) | 12 (16.4%) |
| Total | 731 (100.0%) | 73 (100.0%) |
Monthly Housing Cost Tiers in West Hurley
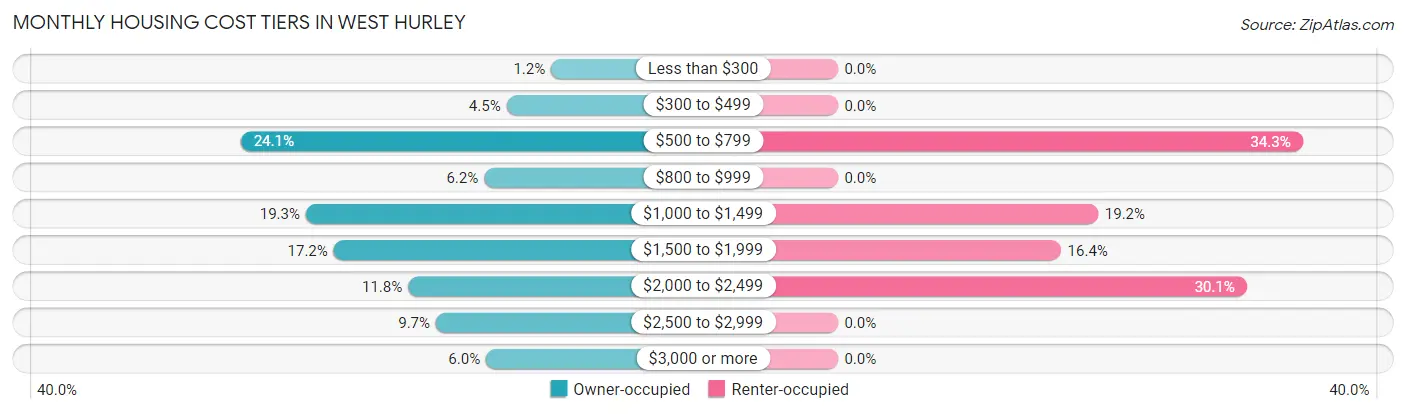
| Monthly Cost | Owner-occupied | Renter-occupied |
| Less than $300 | 9 (1.2%) | 0 (0.0%) |
| $300 to $499 | 33 (4.5%) | 0 (0.0%) |
| $500 to $799 | 176 (24.1%) | 25 (34.3%) |
| $800 to $999 | 45 (6.2%) | 0 (0.0%) |
| $1,000 to $1,499 | 141 (19.3%) | 14 (19.2%) |
| $1,500 to $1,999 | 126 (17.2%) | 12 (16.4%) |
| $2,000 to $2,499 | 86 (11.8%) | 22 (30.1%) |
| $2,500 to $2,999 | 71 (9.7%) | 0 (0.0%) |
| $3,000 or more | 44 (6.0%) | 0 (0.0%) |
| Total | 731 (100.0%) | 73 (100.0%) |
Physical Housing Characteristics in West Hurley
Housing Structures in West Hurley
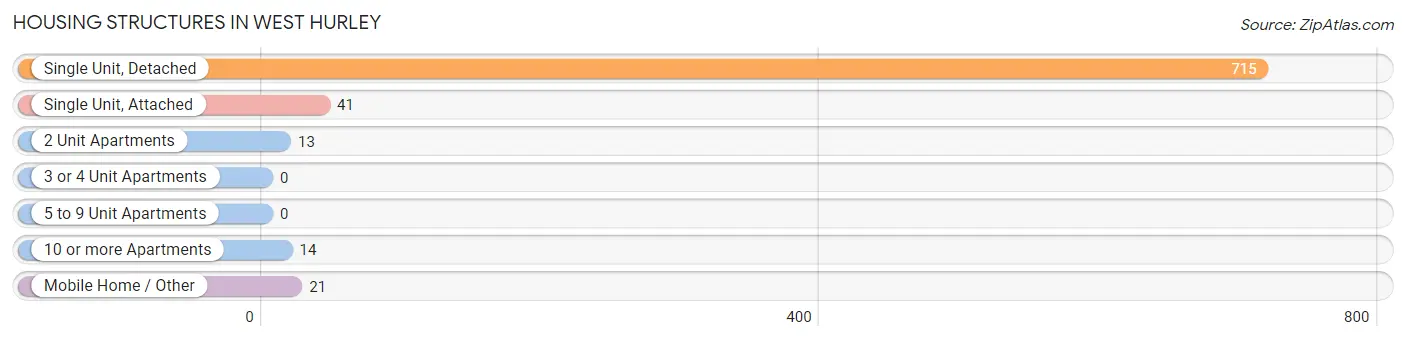
| Structure Type | # Housing Units | % Housing Units |
| Single Unit, Detached | 715 | 88.9% |
| Single Unit, Attached | 41 | 5.1% |
| 2 Unit Apartments | 13 | 1.6% |
| 3 or 4 Unit Apartments | 0 | 0.0% |
| 5 to 9 Unit Apartments | 0 | 0.0% |
| 10 or more Apartments | 14 | 1.7% |
| Mobile Home / Other | 21 | 2.6% |
| Total | 804 | 100.0% |
Housing Structures by Occupancy in West Hurley
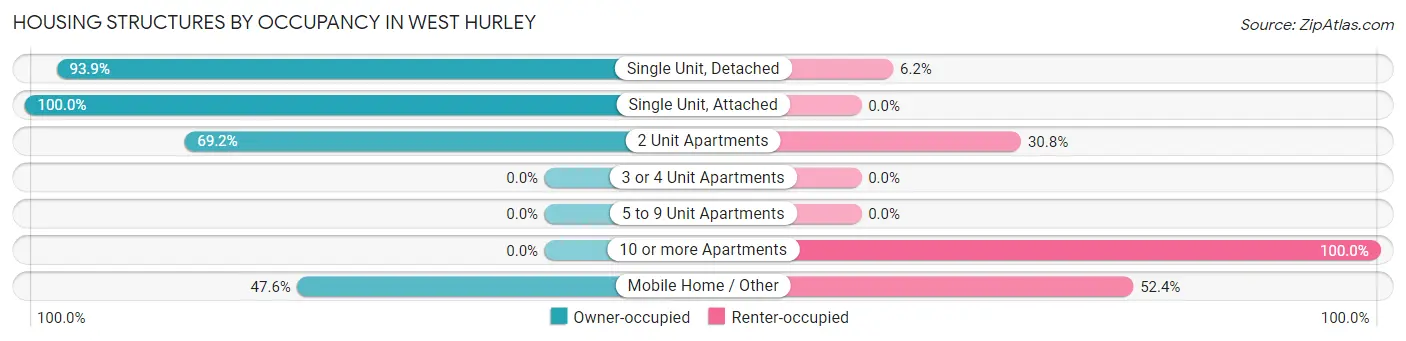
| Structure Type | Owner-occupied | Renter-occupied |
| Single Unit, Detached | 671 (93.9%) | 44 (6.1%) |
| Single Unit, Attached | 41 (100.0%) | 0 (0.0%) |
| 2 Unit Apartments | 9 (69.2%) | 4 (30.8%) |
| 3 or 4 Unit Apartments | 0 (0.0%) | 0 (0.0%) |
| 5 to 9 Unit Apartments | 0 (0.0%) | 0 (0.0%) |
| 10 or more Apartments | 0 (0.0%) | 14 (100.0%) |
| Mobile Home / Other | 10 (47.6%) | 11 (52.4%) |
| Total | 731 (90.9%) | 73 (9.1%) |
Housing Structures by Number of Rooms in West Hurley
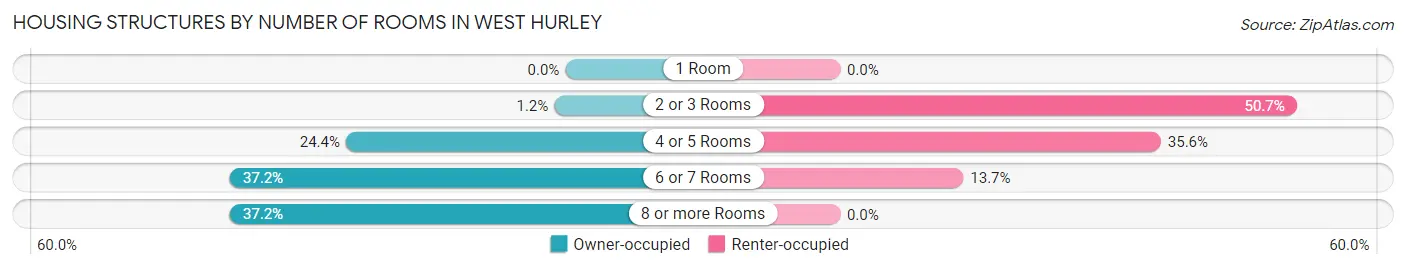
| Number of Rooms | Owner-occupied | Renter-occupied |
| 1 Room | 0 (0.0%) | 0 (0.0%) |
| 2 or 3 Rooms | 9 (1.2%) | 37 (50.7%) |
| 4 or 5 Rooms | 178 (24.3%) | 26 (35.6%) |
| 6 or 7 Rooms | 272 (37.2%) | 10 (13.7%) |
| 8 or more Rooms | 272 (37.2%) | 0 (0.0%) |
| Total | 731 (100.0%) | 73 (100.0%) |
Housing Structure by Heating Type in West Hurley
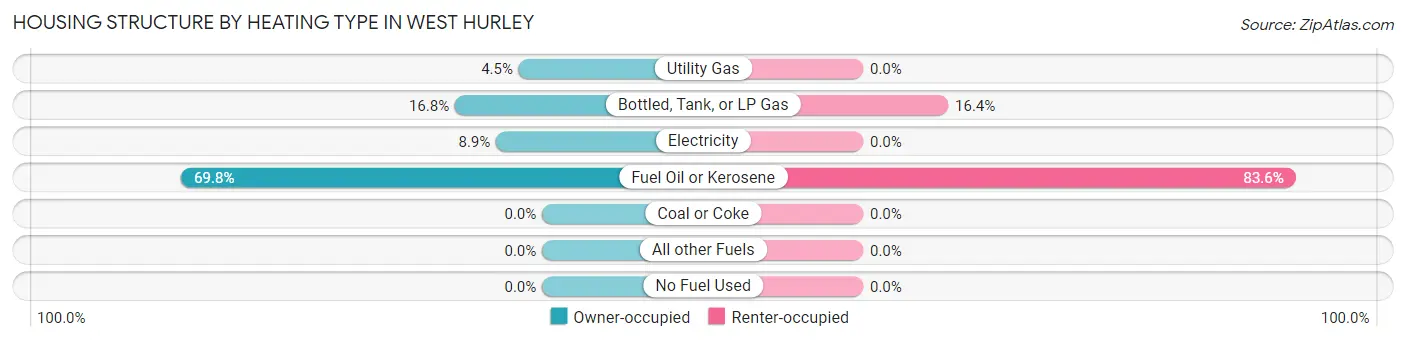
| Heating Type | Owner-occupied | Renter-occupied |
| Utility Gas | 33 (4.5%) | 0 (0.0%) |
| Bottled, Tank, or LP Gas | 123 (16.8%) | 12 (16.4%) |
| Electricity | 65 (8.9%) | 0 (0.0%) |
| Fuel Oil or Kerosene | 510 (69.8%) | 61 (83.6%) |
| Coal or Coke | 0 (0.0%) | 0 (0.0%) |
| All other Fuels | 0 (0.0%) | 0 (0.0%) |
| No Fuel Used | 0 (0.0%) | 0 (0.0%) |
| Total | 731 (100.0%) | 73 (100.0%) |
Household Vehicle Usage in West Hurley
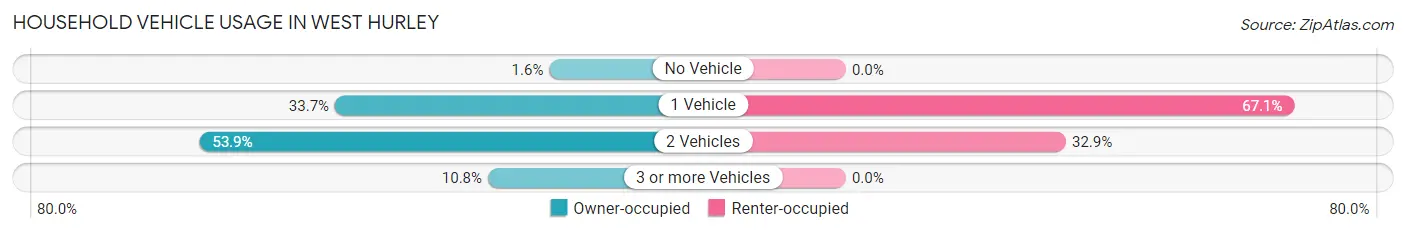
| Vehicles per Household | Owner-occupied | Renter-occupied |
| No Vehicle | 12 (1.6%) | 0 (0.0%) |
| 1 Vehicle | 246 (33.7%) | 49 (67.1%) |
| 2 Vehicles | 394 (53.9%) | 24 (32.9%) |
| 3 or more Vehicles | 79 (10.8%) | 0 (0.0%) |
| Total | 731 (100.0%) | 73 (100.0%) |
Real Estate & Mortgages in West Hurley
Real Estate and Mortgage Overview in West Hurley
| Characteristic | Without Mortgage | With Mortgage |
| Housing Units | 335 | 396 |
| Median Property Value | $310,200 | $346,300 |
| Median Household Income | $54,196 | $71 |
| Monthly Housing Costs | $689 | $44 |
| Real Estate Taxes | $4,384 | $0 |
Property Value by Mortgage Status in West Hurley
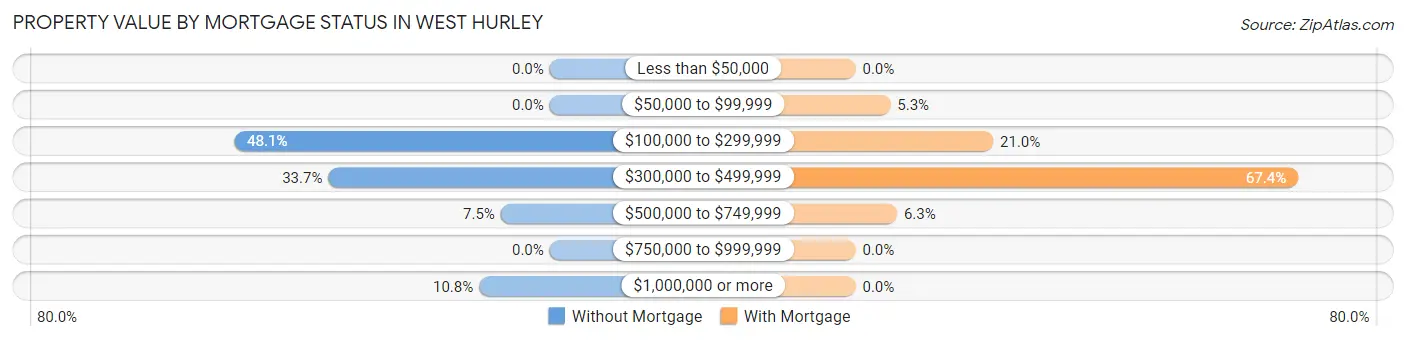
| Property Value | Without Mortgage | With Mortgage |
| Less than $50,000 | 0 (0.0%) | 0 (0.0%) |
| $50,000 to $99,999 | 0 (0.0%) | 21 (5.3%) |
| $100,000 to $299,999 | 161 (48.1%) | 83 (21.0%) |
| $300,000 to $499,999 | 113 (33.7%) | 267 (67.4%) |
| $500,000 to $749,999 | 25 (7.5%) | 25 (6.3%) |
| $750,000 to $999,999 | 0 (0.0%) | 0 (0.0%) |
| $1,000,000 or more | 36 (10.7%) | 0 (0.0%) |
| Total | 335 (100.0%) | 396 (100.0%) |
Household Income by Mortgage Status in West Hurley
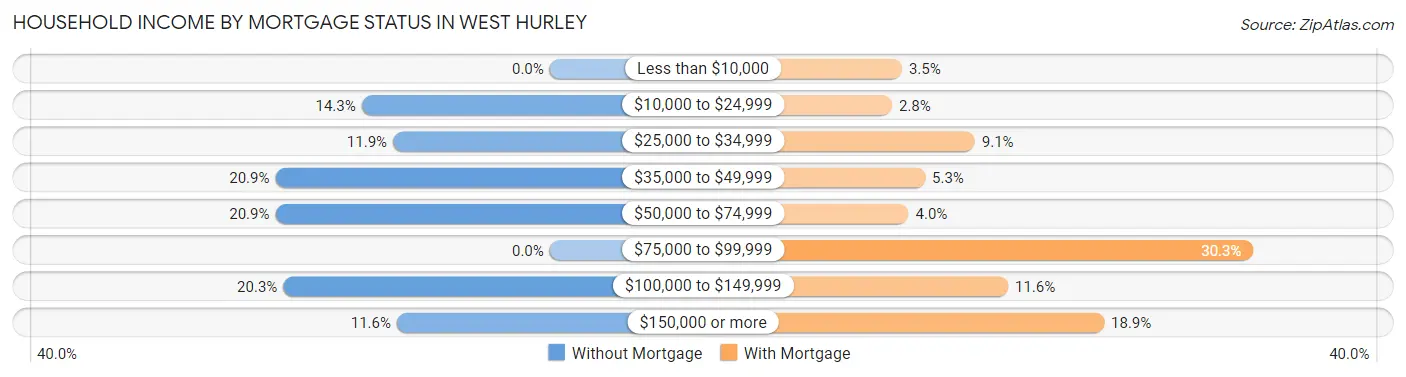
| Household Income | Without Mortgage | With Mortgage |
| Less than $10,000 | 0 (0.0%) | 14 (3.5%) |
| $10,000 to $24,999 | 48 (14.3%) | 11 (2.8%) |
| $25,000 to $34,999 | 40 (11.9%) | 36 (9.1%) |
| $35,000 to $49,999 | 70 (20.9%) | 21 (5.3%) |
| $50,000 to $74,999 | 70 (20.9%) | 16 (4.0%) |
| $75,000 to $99,999 | 0 (0.0%) | 120 (30.3%) |
| $100,000 to $149,999 | 68 (20.3%) | 46 (11.6%) |
| $150,000 or more | 39 (11.6%) | 75 (18.9%) |
| Total | 335 (100.0%) | 396 (100.0%) |
Property Value to Household Income Ratio in West Hurley
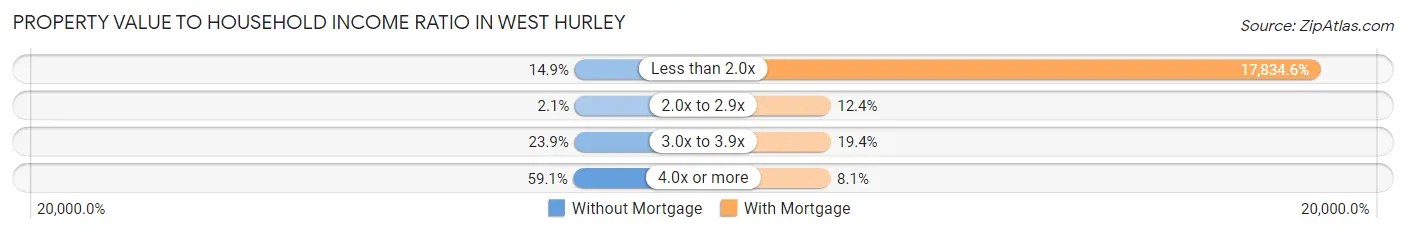
| Value-to-Income Ratio | Without Mortgage | With Mortgage |
| Less than 2.0x | 50 (14.9%) | 70,625 (17,834.6%) |
| 2.0x to 2.9x | 7 (2.1%) | 49 (12.4%) |
| 3.0x to 3.9x | 80 (23.9%) | 77 (19.4%) |
| 4.0x or more | 198 (59.1%) | 32 (8.1%) |
| Total | 335 (100.0%) | 396 (100.0%) |
Real Estate Taxes by Mortgage Status in West Hurley
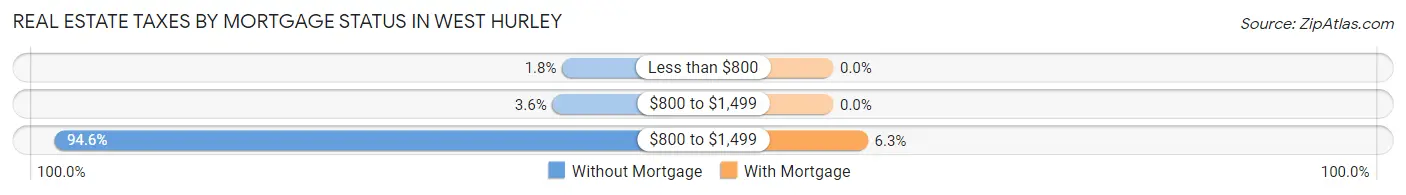
| Property Taxes | Without Mortgage | With Mortgage |
| Less than $800 | 6 (1.8%) | 0 (0.0%) |
| $800 to $1,499 | 12 (3.6%) | 0 (0.0%) |
| $800 to $1,499 | 317 (94.6%) | 25 (6.3%) |
| Total | 335 (100.0%) | 396 (100.0%) |
Health & Disability in West Hurley
Health Insurance Coverage by Age in West Hurley
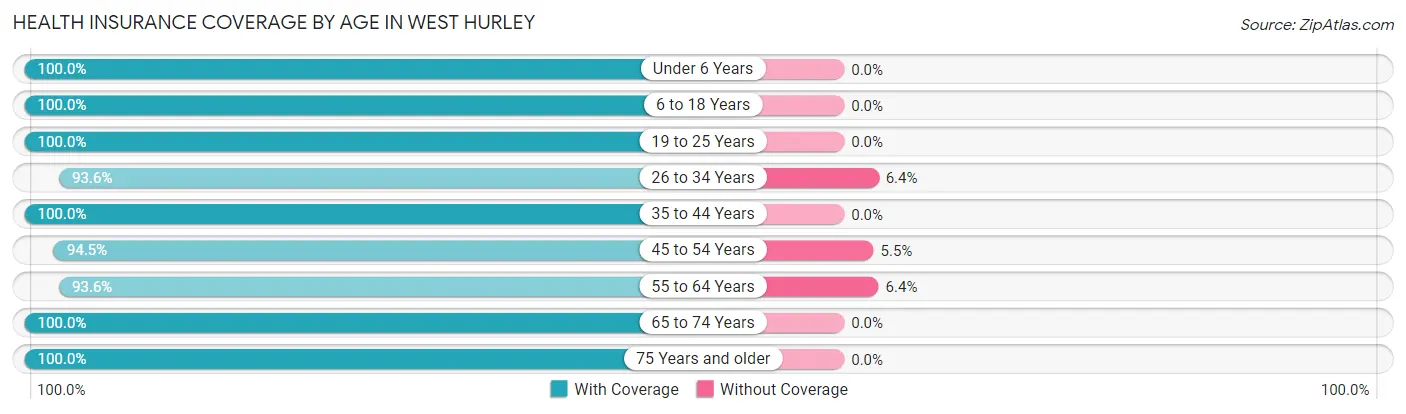
| Age Bracket | With Coverage | Without Coverage |
| Under 6 Years | 19 (100.0%) | 0 (0.0%) |
| 6 to 18 Years | 224 (100.0%) | 0 (0.0%) |
| 19 to 25 Years | 94 (100.0%) | 0 (0.0%) |
| 26 to 34 Years | 175 (93.6%) | 12 (6.4%) |
| 35 to 44 Years | 83 (100.0%) | 0 (0.0%) |
| 45 to 54 Years | 173 (94.5%) | 10 (5.5%) |
| 55 to 64 Years | 336 (93.6%) | 23 (6.4%) |
| 65 to 74 Years | 282 (100.0%) | 0 (0.0%) |
| 75 Years and older | 177 (100.0%) | 0 (0.0%) |
| Total | 1,563 (97.2%) | 45 (2.8%) |
Health Insurance Coverage by Citizenship Status in West Hurley
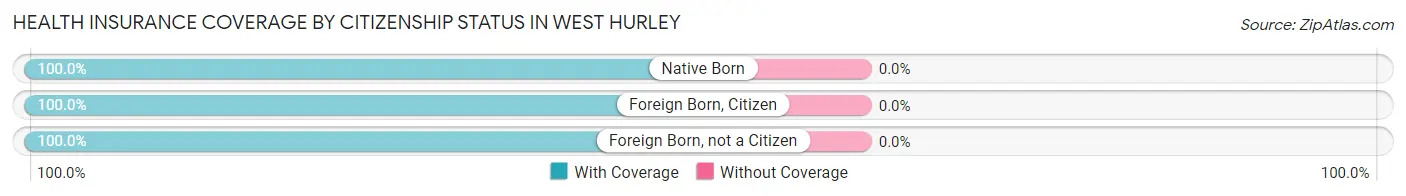
| Citizenship Status | With Coverage | Without Coverage |
| Native Born | 19 (100.0%) | 0 (0.0%) |
| Foreign Born, Citizen | 224 (100.0%) | 0 (0.0%) |
| Foreign Born, not a Citizen | 94 (100.0%) | 0 (0.0%) |
Health Insurance Coverage by Household Income in West Hurley
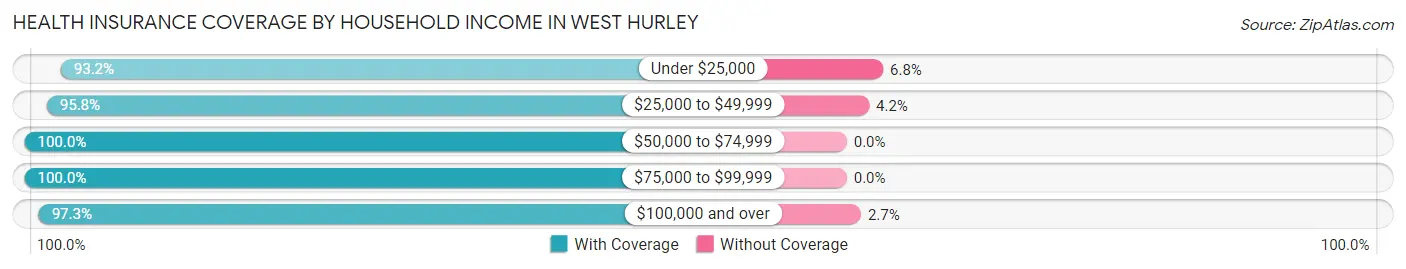
| Household Income | With Coverage | Without Coverage |
| Under $25,000 | 192 (93.2%) | 14 (6.8%) |
| $25,000 to $49,999 | 252 (95.8%) | 11 (4.2%) |
| $50,000 to $74,999 | 223 (100.0%) | 0 (0.0%) |
| $75,000 to $99,999 | 148 (100.0%) | 0 (0.0%) |
| $100,000 and over | 733 (97.3%) | 20 (2.7%) |
Public vs Private Health Insurance Coverage by Age in West Hurley
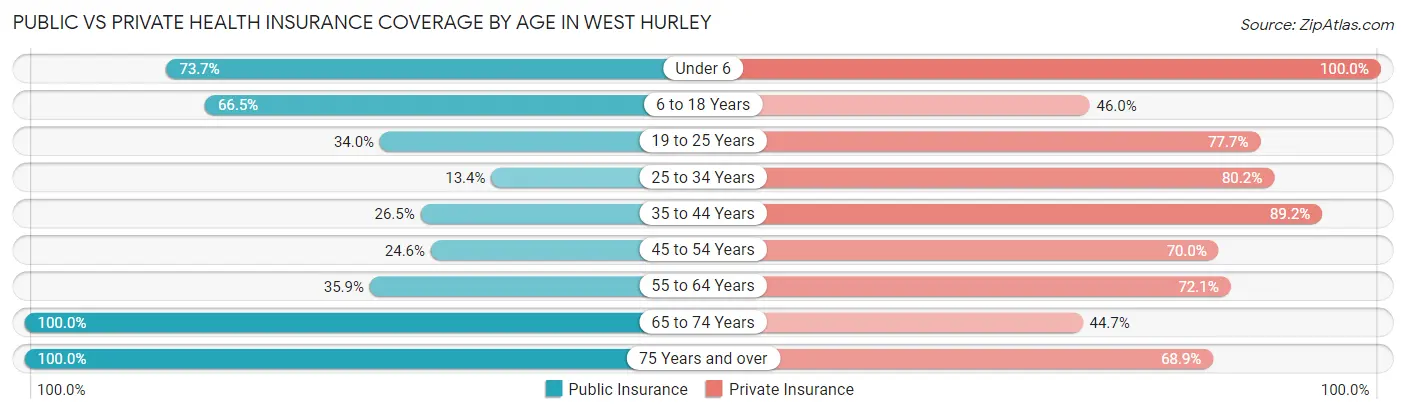
| Age Bracket | Public Insurance | Private Insurance |
| Under 6 | 14 (73.7%) | 19 (100.0%) |
| 6 to 18 Years | 149 (66.5%) | 103 (46.0%) |
| 19 to 25 Years | 32 (34.0%) | 73 (77.7%) |
| 25 to 34 Years | 25 (13.4%) | 150 (80.2%) |
| 35 to 44 Years | 22 (26.5%) | 74 (89.2%) |
| 45 to 54 Years | 45 (24.6%) | 128 (70.0%) |
| 55 to 64 Years | 129 (35.9%) | 259 (72.1%) |
| 65 to 74 Years | 282 (100.0%) | 126 (44.7%) |
| 75 Years and over | 177 (100.0%) | 122 (68.9%) |
| Total | 875 (54.4%) | 1,054 (65.5%) |
Disability Status by Sex by Age in West Hurley
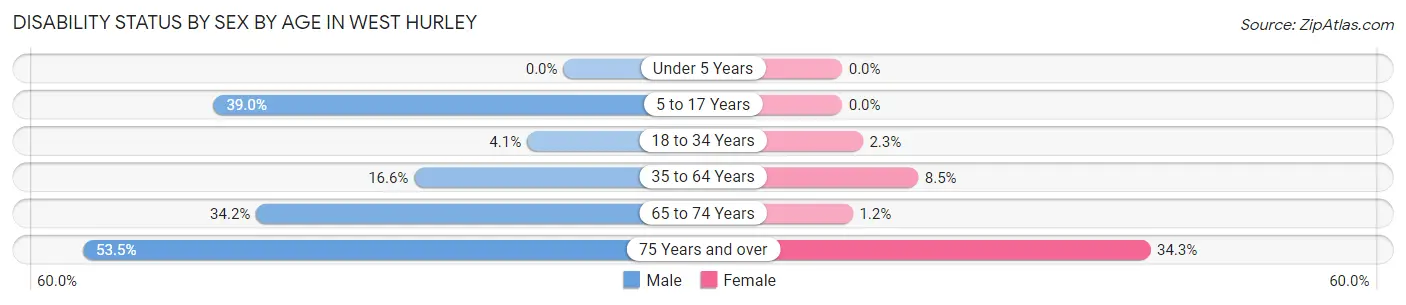
| Age Bracket | Male | Female |
| Under 5 Years | 0 (0.0%) | 0 (0.0%) |
| 5 to 17 Years | 60 (39.0%) | 0 (0.0%) |
| 18 to 34 Years | 9 (4.1%) | 2 (2.3%) |
| 35 to 64 Years | 45 (16.6%) | 30 (8.5%) |
| 65 to 74 Years | 39 (34.2%) | 2 (1.2%) |
| 75 Years and over | 23 (53.5%) | 46 (34.3%) |
Disability Class by Sex by Age in West Hurley
Disability Class: Hearing Difficulty
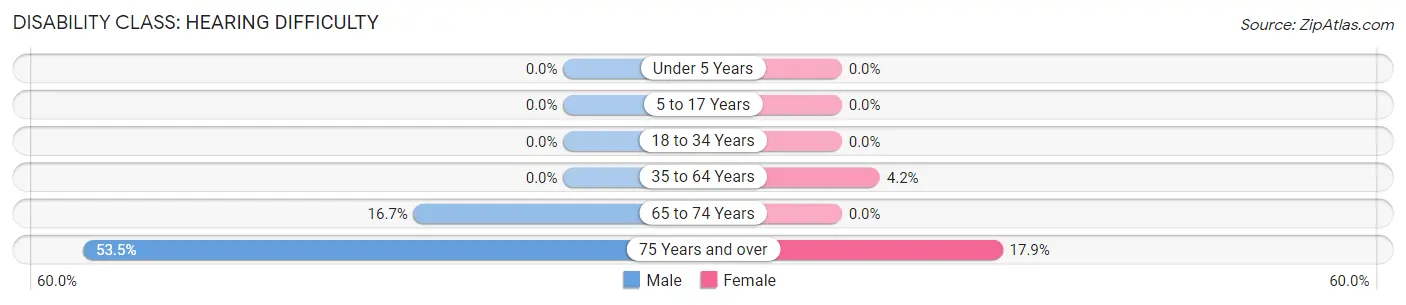
| Age Bracket | Male | Female |
| Under 5 Years | 0 (0.0%) | 0 (0.0%) |
| 5 to 17 Years | 0 (0.0%) | 0 (0.0%) |
| 18 to 34 Years | 0 (0.0%) | 0 (0.0%) |
| 35 to 64 Years | 0 (0.0%) | 15 (4.2%) |
| 65 to 74 Years | 19 (16.7%) | 0 (0.0%) |
| 75 Years and over | 23 (53.5%) | 24 (17.9%) |
Disability Class: Vision Difficulty
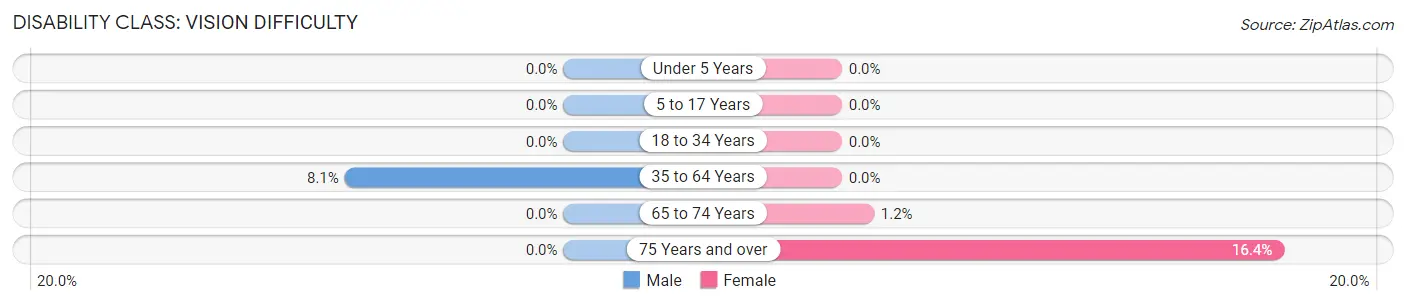
| Age Bracket | Male | Female |
| Under 5 Years | 0 (0.0%) | 0 (0.0%) |
| 5 to 17 Years | 0 (0.0%) | 0 (0.0%) |
| 18 to 34 Years | 0 (0.0%) | 0 (0.0%) |
| 35 to 64 Years | 22 (8.1%) | 0 (0.0%) |
| 65 to 74 Years | 0 (0.0%) | 2 (1.2%) |
| 75 Years and over | 0 (0.0%) | 22 (16.4%) |
Disability Class: Cognitive Difficulty
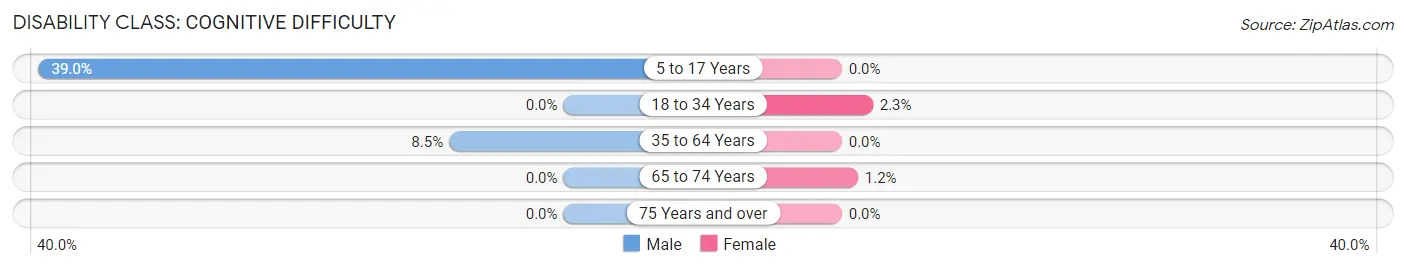
| Age Bracket | Male | Female |
| 5 to 17 Years | 60 (39.0%) | 0 (0.0%) |
| 18 to 34 Years | 0 (0.0%) | 2 (2.3%) |
| 35 to 64 Years | 23 (8.5%) | 0 (0.0%) |
| 65 to 74 Years | 0 (0.0%) | 2 (1.2%) |
| 75 Years and over | 0 (0.0%) | 0 (0.0%) |
Disability Class: Ambulatory Difficulty
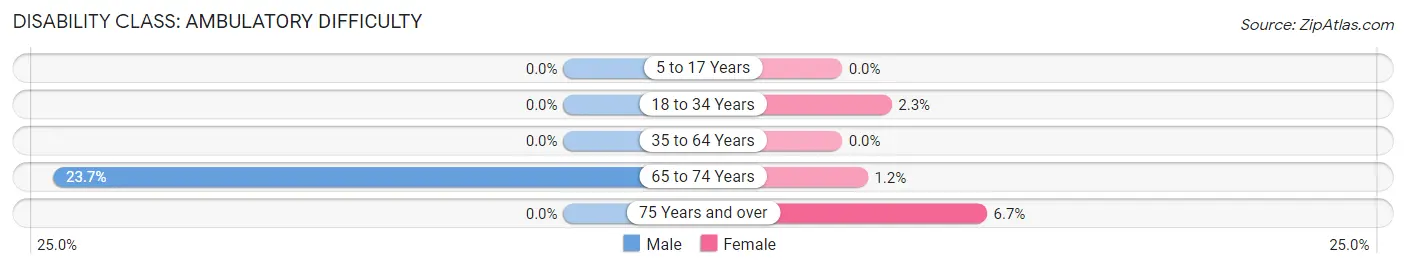
| Age Bracket | Male | Female |
| 5 to 17 Years | 0 (0.0%) | 0 (0.0%) |
| 18 to 34 Years | 0 (0.0%) | 2 (2.3%) |
| 35 to 64 Years | 0 (0.0%) | 0 (0.0%) |
| 65 to 74 Years | 27 (23.7%) | 2 (1.2%) |
| 75 Years and over | 0 (0.0%) | 9 (6.7%) |
Disability Class: Self-Care Difficulty
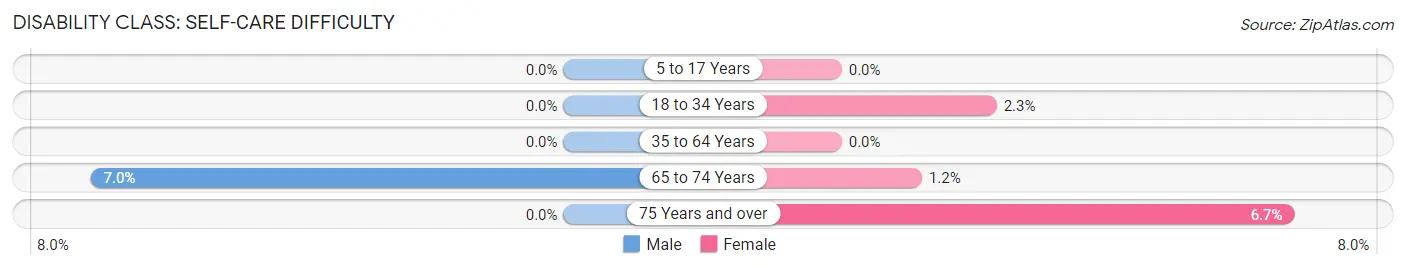
| Age Bracket | Male | Female |
| 5 to 17 Years | 0 (0.0%) | 0 (0.0%) |
| 18 to 34 Years | 0 (0.0%) | 2 (2.3%) |
| 35 to 64 Years | 0 (0.0%) | 0 (0.0%) |
| 65 to 74 Years | 8 (7.0%) | 2 (1.2%) |
| 75 Years and over | 0 (0.0%) | 9 (6.7%) |
Technology Access in West Hurley
Computing Device Access in West Hurley
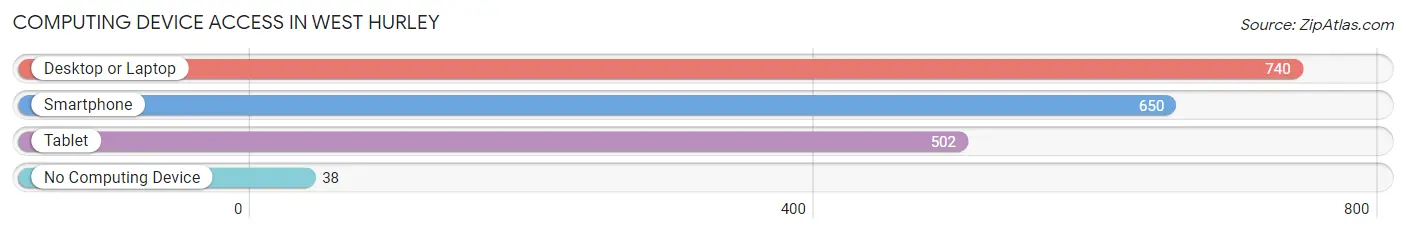
| Device Type | # Households | % Households |
| Desktop or Laptop | 740 | 92.0% |
| Smartphone | 650 | 80.8% |
| Tablet | 502 | 62.4% |
| No Computing Device | 38 | 4.7% |
| Total | 804 | 100.0% |
Internet Access in West Hurley
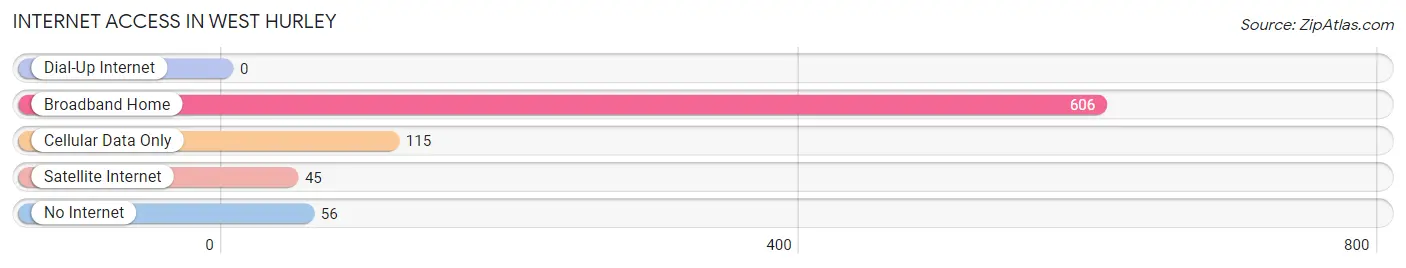
| Internet Type | # Households | % Households |
| Dial-Up Internet | 0 | 0.0% |
| Broadband Home | 606 | 75.4% |
| Cellular Data Only | 115 | 14.3% |
| Satellite Internet | 45 | 5.6% |
| No Internet | 56 | 7.0% |
| Total | 804 | 100.0% |
West Hurley Summary
History
West Hurley is a hamlet located in the town of Ulster in Ulster County, New York. It is situated on the west bank of the Esopus Creek, which is a tributary of the Hudson River. The hamlet was first settled in the late 1700s by Dutch and English settlers. The area was originally known as “West Shokan”, but was later changed to “West Hurley” in 1845.
The hamlet was an important industrial center in the 19th century. It was home to several mills, including a paper mill, a grist mill, and a saw mill. The paper mill was the largest employer in the area and was owned by the Hurley family. The Hurley family also owned a large amount of land in the area, which they used for farming and timber production.
The hamlet was also home to several other industries, including a tannery, a brickyard, and a blacksmith shop. The tannery was the largest employer in the area and was owned by the Hurley family. The brickyard was owned by the Van Deusen family and produced bricks for the construction of homes and businesses in the area. The blacksmith shop was owned by the Van Deusen family and was used to repair tools and equipment.
The hamlet was also home to several churches, including the Dutch Reformed Church, the Methodist Episcopal Church, and the Baptist Church. The Dutch Reformed Church was the oldest church in the area and was founded in 1790. The Methodist Episcopal Church was founded in 1820 and the Baptist Church was founded in 1845.
Geography
West Hurley is located in the town of Ulster in Ulster County, New York. It is situated on the west bank of the Esopus Creek, which is a tributary of the Hudson River. The hamlet is located approximately 25 miles south of Albany and approximately 75 miles north of New York City.
The hamlet is located in a rural area and is surrounded by forests and farmland. The terrain is mostly flat with some rolling hills. The climate is humid continental, with cold winters and warm summers.
Economy
West Hurley’s economy is largely based on agriculture and tourism. The hamlet is home to several farms, which produce a variety of crops, including apples, corn, and hay. The hamlet is also home to several wineries, which produce a variety of wines.
The hamlet is also home to several small businesses, including restaurants, shops, and galleries. The hamlet is also home to several bed and breakfasts, which attract tourists from all over the world.
Demographics
As of the 2010 census, the population of West Hurley was 1,845. The population is mostly white (94.3%) and the median age is 44. The median household income is $50,000 and the median home value is $179,000. The unemployment rate is 5.2%.
Conclusion
West Hurley is a small hamlet located in the town of Ulster in Ulster County, New York. It is situated on the west bank of the Esopus Creek, which is a tributary of the Hudson River. The hamlet was first settled in the late 1700s by Dutch and English settlers and was an important industrial center in the 19th century. The hamlet’s economy is largely based on agriculture and tourism and the population is mostly white.
Common Questions
What is Per Capita Income in West Hurley?
Per Capita income in West Hurley is $50,514.
What is the Median Family Income in West Hurley?
Median Family Income in West Hurley is $87,139.
What is the Median Household income in West Hurley?
Median Household Income in West Hurley is $68,990.
What is Income or Wage Gap in West Hurley?
Income or Wage Gap in West Hurley is 0.4%.
Women in West Hurley earn 99.6 cents for every dollar earned by a man.
What is Inequality or Gini Index in West Hurley?
Inequality or Gini Index in West Hurley is 0.48.
What is the Total Population of West Hurley?
Total Population of West Hurley is 1,608.
What is the Total Male Population of West Hurley?
Total Male Population of West Hurley is 804.
What is the Total Female Population of West Hurley?
Total Female Population of West Hurley is 804.
What is the Ratio of Males per 100 Females in West Hurley?
There are 100.00 Males per 100 Females in West Hurley.
What is the Ratio of Females per 100 Males in West Hurley?
There are 100.00 Females per 100 Males in West Hurley.
What is the Median Population Age in West Hurley?
Median Population Age in West Hurley is 57.0 Years.
What is the Average Family Size in West Hurley
Average Family Size in West Hurley is 2.6 People.
What is the Average Household Size in West Hurley
Average Household Size in West Hurley is 2.0 People.
How Large is the Labor Force in West Hurley?
There are 785 People in the Labor Forcein in West Hurley.
What is the Percentage of People in the Labor Force in West Hurley?
55.5% of People are in the Labor Force in West Hurley.
What is the Unemployment Rate in West Hurley?
Unemployment Rate in West Hurley is 2.9%.