Malden On Hudson, NY Map & Demographics
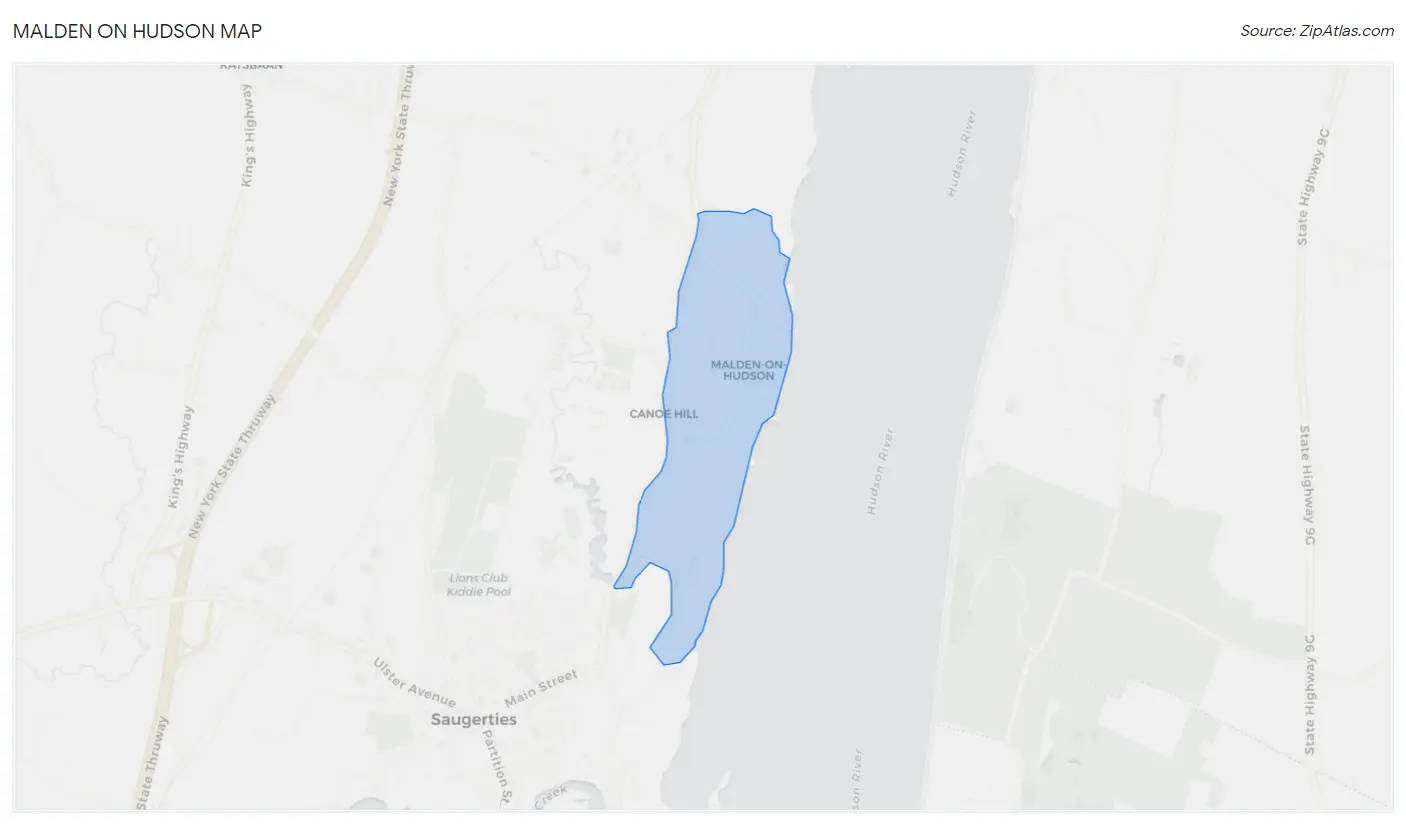
Malden On Hudson Map
Malden On Hudson Overview
$32,612
PER CAPITA INCOME
0.44
INEQUALITY / GINI INDEX
321
TOTAL POPULATION
178
MALE POPULATION
143
FEMALE POPULATION
124.48
MALES / 100 FEMALES
80.34
FEMALES / 100 MALES
82.2
MEDIAN AGE
2.3
AVG FAMILY SIZE
2.3
AVG HOUSEHOLD SIZE
121
LABOR FORCE [ PEOPLE ]
37.7%
PERCENT IN LABOR FORCE
Malden On Hudson Zip Codes
Malden On Hudson Area Codes
Income in Malden On Hudson
Income Overview in Malden On Hudson
| Characteristic | Number | Measure |
| Per Capita Income | 321 | $32,612 |
| Median Family Income | 139 | $0 |
| Mean Family Income | 139 | $64,632 |
| Median Household Income | 139 | $0 |
| Mean Household Income | 139 | $64,632 |
| Income Deficit | 139 | $0 |
| Wage / Income Gap (%) | 321 | 0.00% |
| Wage / Income Gap ($) | 321 | 100.00¢ per $1 |
| Gini / Inequality Index | 321 | 0.44 |
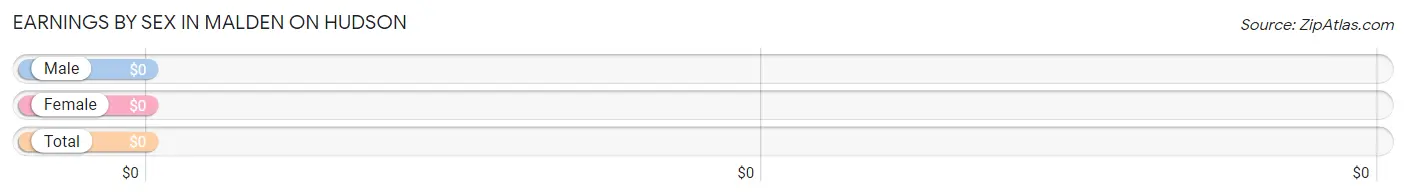
Earnings by Sex in Malden On Hudson
| Sex | Number | Average Earnings |
| Male | 95 (78.5%) | $0 |
| Female | 26 (21.5%) | $0 |
| Total | 121 (100.0%) | $0 |
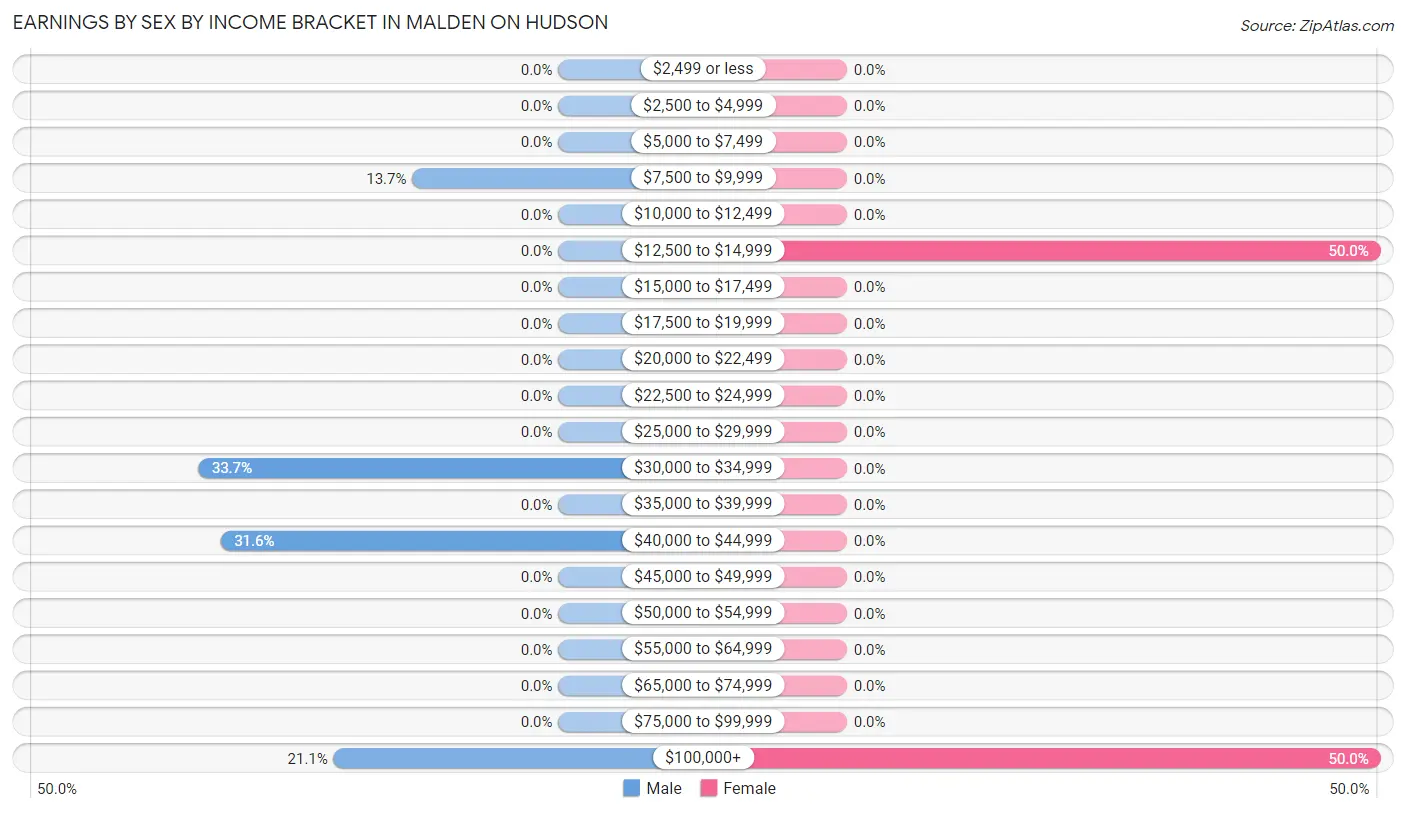
Earnings by Sex by Income Bracket in Malden On Hudson
The most common earnings brackets in Malden On Hudson are $30,000 to $34,999 for men (32 | 33.7%) and $12,500 to $14,999 for women (13 | 50.0%).
| Income | Male | Female |
| $2,499 or less | 0 (0.0%) | 0 (0.0%) |
| $2,500 to $4,999 | 0 (0.0%) | 0 (0.0%) |
| $5,000 to $7,499 | 0 (0.0%) | 0 (0.0%) |
| $7,500 to $9,999 | 13 (13.7%) | 0 (0.0%) |
| $10,000 to $12,499 | 0 (0.0%) | 0 (0.0%) |
| $12,500 to $14,999 | 0 (0.0%) | 13 (50.0%) |
| $15,000 to $17,499 | 0 (0.0%) | 0 (0.0%) |
| $17,500 to $19,999 | 0 (0.0%) | 0 (0.0%) |
| $20,000 to $22,499 | 0 (0.0%) | 0 (0.0%) |
| $22,500 to $24,999 | 0 (0.0%) | 0 (0.0%) |
| $25,000 to $29,999 | 0 (0.0%) | 0 (0.0%) |
| $30,000 to $34,999 | 32 (33.7%) | 0 (0.0%) |
| $35,000 to $39,999 | 0 (0.0%) | 0 (0.0%) |
| $40,000 to $44,999 | 30 (31.6%) | 0 (0.0%) |
| $45,000 to $49,999 | 0 (0.0%) | 0 (0.0%) |
| $50,000 to $54,999 | 0 (0.0%) | 0 (0.0%) |
| $55,000 to $64,999 | 0 (0.0%) | 0 (0.0%) |
| $65,000 to $74,999 | 0 (0.0%) | 0 (0.0%) |
| $75,000 to $99,999 | 0 (0.0%) | 0 (0.0%) |
| $100,000+ | 20 (21.0%) | 13 (50.0%) |
| Total | 95 (100.0%) | 26 (100.0%) |
Earnings by Sex by Educational Attainment in Malden On Hudson
| Educational Attainment | Male Income | Female Income |
| Less than High School | - | - |
| High School Diploma | - | - |
| College or Associate's Degree | - | - |
| Bachelor's Degree | - | - |
| Graduate Degree | - | - |
| Total | - | - |
Family Income in Malden On Hudson
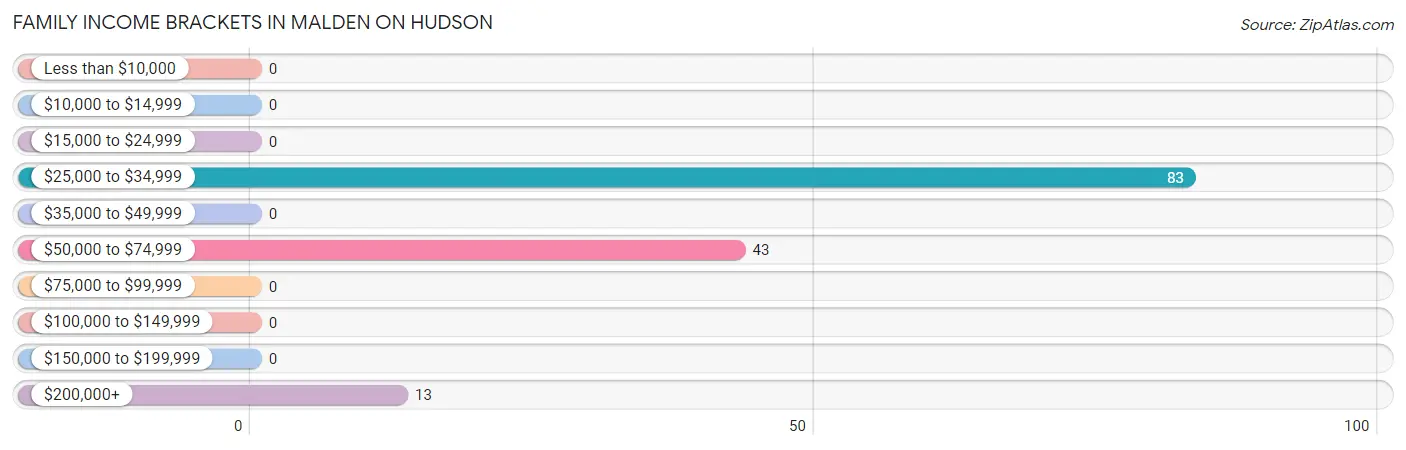
Family Income Brackets in Malden On Hudson
According to the Malden On Hudson family income data, there are 83 families falling into the $25,000 to $34,999 income range, which is the most common income bracket and makes up 59.7% of all families.
| Income Bracket | # Families | % Families |
| Less than $10,000 | 0 | 0.0% |
| $10,000 to $14,999 | 0 | 0.0% |
| $15,000 to $24,999 | 0 | 0.0% |
| $25,000 to $34,999 | 83 | 59.7% |
| $35,000 to $49,999 | 0 | 0.0% |
| $50,000 to $74,999 | 43 | 30.9% |
| $75,000 to $99,999 | 0 | 0.0% |
| $100,000 to $149,999 | 0 | 0.0% |
| $150,000 to $199,999 | 0 | 0.0% |
| $200,000+ | 13 | 9.4% |
Family Income by Famaliy Size in Malden On Hudson
| Income Bracket | # Families | Median Income |
| 2-Person Families | 139 (100.0%) | $0 |
| 3-Person Families | 0 (0.0%) | $0 |
| 4-Person Families | 0 (0.0%) | $0 |
| 5-Person Families | 0 (0.0%) | $0 |
| 6-Person Families | 0 (0.0%) | $0 |
| 7+ Person Families | 0 (0.0%) | $0 |
| Total | 139 (100.0%) | $0 |
Family Income by Number of Earners in Malden On Hudson
| Number of Earners | # Families | Median Income |
| No Earners | 83 (59.7%) | $0 |
| 1 Earner | 0 (0.0%) | $0 |
| 2 Earners | 56 (40.3%) | $0 |
| 3+ Earners | 0 (0.0%) | $0 |
| Total | 139 (100.0%) | $0 |
Household Income in Malden On Hudson
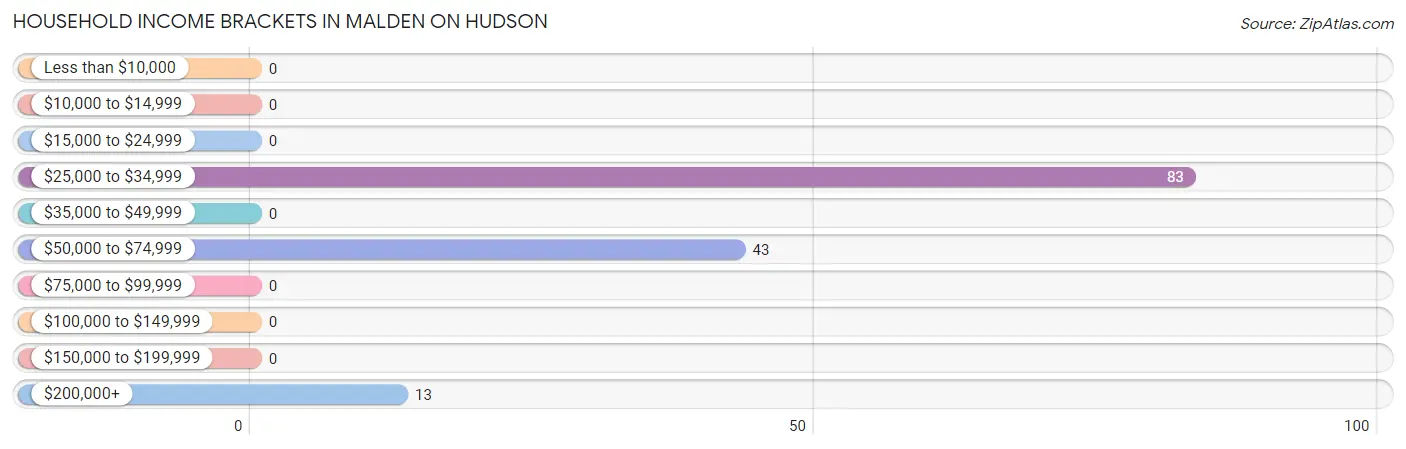
Household Income Brackets in Malden On Hudson
With 83 households falling in the category, the $25,000 to $34,999 income range is the most frequent in Malden On Hudson, accounting for 59.7% of all households.
| Income Bracket | # Households | % Households |
| Less than $10,000 | 0 | 0.0% |
| $10,000 to $14,999 | 0 | 0.0% |
| $15,000 to $24,999 | 0 | 0.0% |
| $25,000 to $34,999 | 83 | 59.7% |
| $35,000 to $49,999 | 0 | 0.0% |
| $50,000 to $74,999 | 43 | 30.9% |
| $75,000 to $99,999 | 0 | 0.0% |
| $100,000 to $149,999 | 0 | 0.0% |
| $150,000 to $199,999 | 0 | 0.0% |
| $200,000+ | 13 | 9.4% |
Household Income by Householder Age in Malden On Hudson
The median household income in Malden On Hudson is $0, with the highest median household income of $26,446 found in the 65+ years age bracket for the primary householder. A total of 96 households (69.1%) fall into this category.
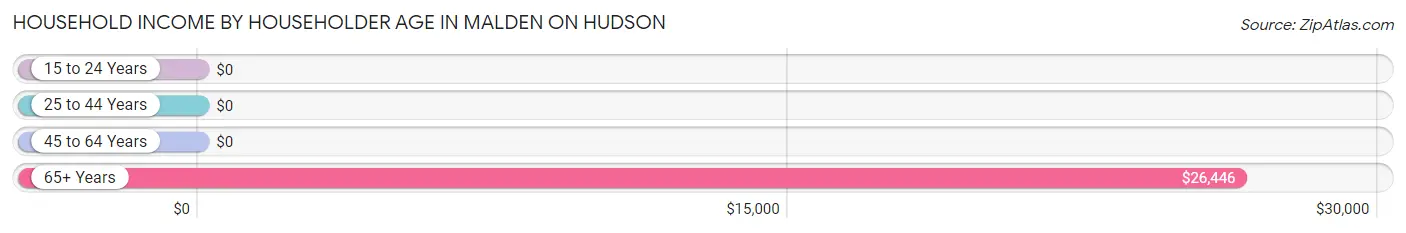
| Income Bracket | # Households | Median Income |
| 15 to 24 Years | 0 (0.0%) | $0 |
| 25 to 44 Years | 13 (9.3%) | $0 |
| 45 to 64 Years | 30 (21.6%) | $0 |
| 65+ Years | 96 (69.1%) | $26,446 |
| Total | 139 (100.0%) | $0 |
Poverty in Malden On Hudson
Income Below Poverty by Sex and Age in Malden On Hudson
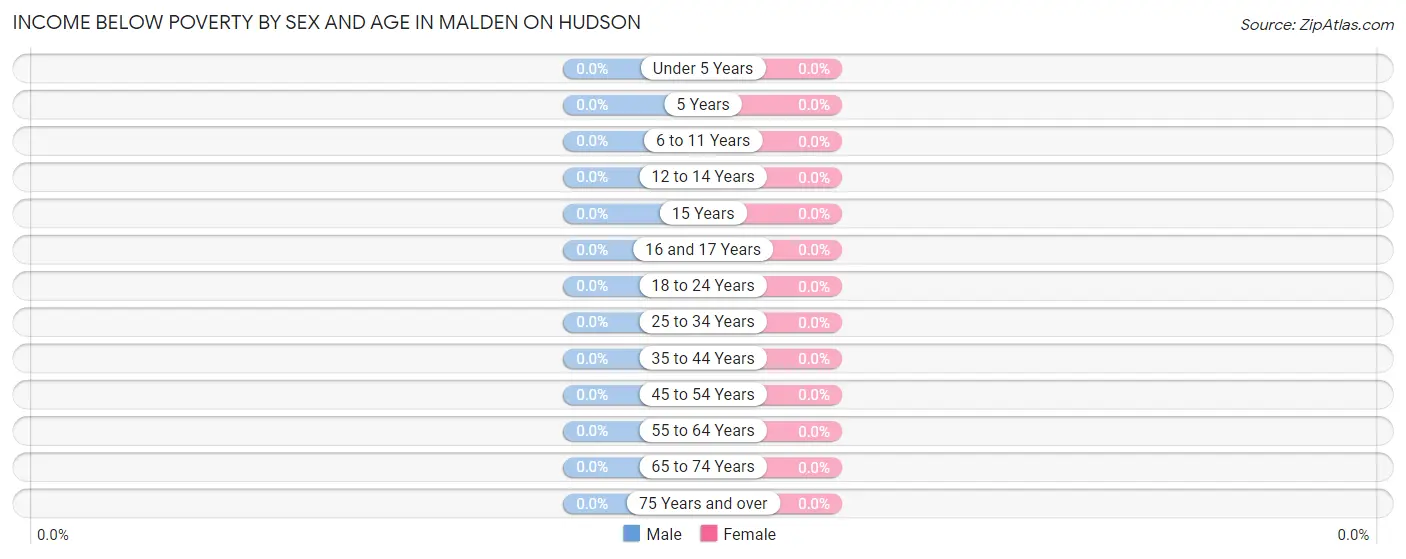
| Age Bracket | Male | Female |
| Under 5 Years | 0 (0.0%) | 0 (0.0%) |
| 5 Years | 0 (0.0%) | 0 (0.0%) |
| 6 to 11 Years | 0 (0.0%) | 0 (0.0%) |
| 12 to 14 Years | 0 (0.0%) | 0 (0.0%) |
| 15 Years | 0 (0.0%) | 0 (0.0%) |
| 16 and 17 Years | 0 (0.0%) | 0 (0.0%) |
| 18 to 24 Years | 0 (0.0%) | 0 (0.0%) |
| 25 to 34 Years | 0 (0.0%) | 0 (0.0%) |
| 35 to 44 Years | 0 (0.0%) | 0 (0.0%) |
| 45 to 54 Years | 0 (0.0%) | 0 (0.0%) |
| 55 to 64 Years | 0 (0.0%) | 0 (0.0%) |
| 65 to 74 Years | 0 (0.0%) | 0 (0.0%) |
| 75 Years and over | 0 (0.0%) | 0 (0.0%) |
| Total | 0 (0.0%) | 0 (0.0%) |
Income Above Poverty by Sex and Age in Malden On Hudson
According to the poverty statistics in Malden On Hudson, males aged 35 to 44 years and females aged 35 to 44 years are the age groups that are most secure financially, with 100.0% of males and 100.0% of females in these age groups living above the poverty line.
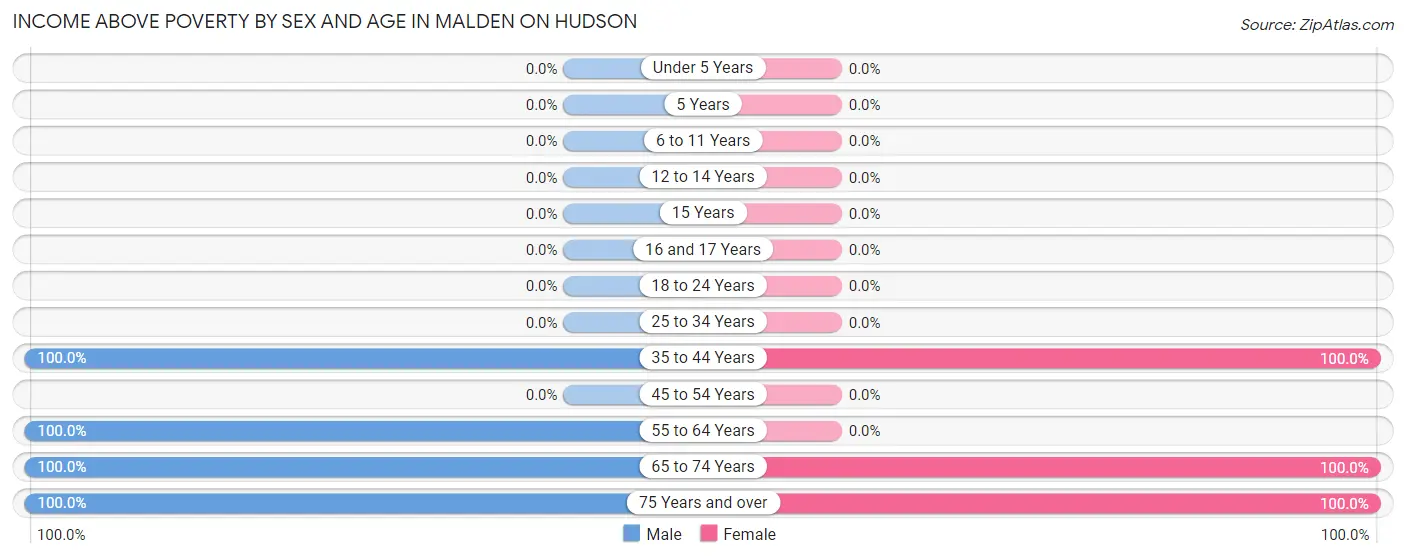
| Age Bracket | Male | Female |
| Under 5 Years | 0 (0.0%) | 0 (0.0%) |
| 5 Years | 0 (0.0%) | 0 (0.0%) |
| 6 to 11 Years | 0 (0.0%) | 0 (0.0%) |
| 12 to 14 Years | 0 (0.0%) | 0 (0.0%) |
| 15 Years | 0 (0.0%) | 0 (0.0%) |
| 16 and 17 Years | 0 (0.0%) | 0 (0.0%) |
| 18 to 24 Years | 0 (0.0%) | 0 (0.0%) |
| 25 to 34 Years | 0 (0.0%) | 0 (0.0%) |
| 35 to 44 Years | 20 (100.0%) | 13 (100.0%) |
| 45 to 54 Years | 0 (0.0%) | 0 (0.0%) |
| 55 to 64 Years | 62 (100.0%) | 0 (0.0%) |
| 65 to 74 Years | 13 (100.0%) | 13 (100.0%) |
| 75 Years and over | 83 (100.0%) | 117 (100.0%) |
| Total | 178 (100.0%) | 143 (100.0%) |
Income Below Poverty Among Married-Couple Families in Malden On Hudson
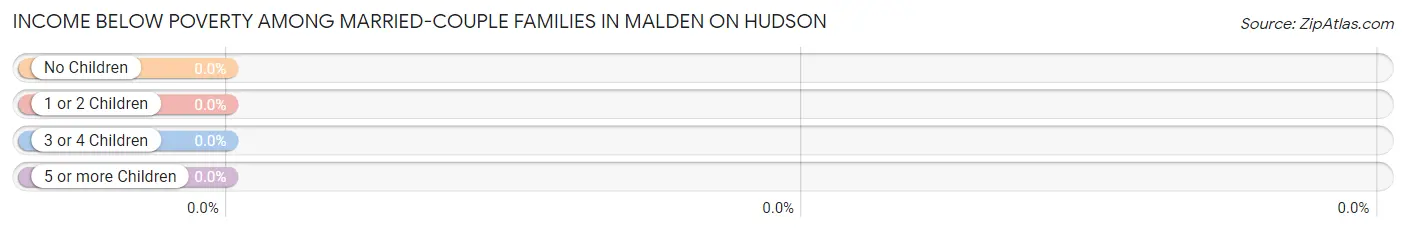
| Children | Above Poverty | Below Poverty |
| No Children | 109 (100.0%) | 0 (0.0%) |
| 1 or 2 Children | 0 (0.0%) | 0 (0.0%) |
| 3 or 4 Children | 0 (0.0%) | 0 (0.0%) |
| 5 or more Children | 0 (0.0%) | 0 (0.0%) |
| Total | 109 (100.0%) | 0 (0.0%) |
Income Below Poverty Among Single-Parent Households in Malden On Hudson
| Children | Single Father | Single Mother |
| No Children | 0 (0.0%) | 0 (0.0%) |
| 1 or 2 Children | 0 (0.0%) | 0 (0.0%) |
| 3 or 4 Children | 0 (0.0%) | 0 (0.0%) |
| 5 or more Children | 0 (0.0%) | 0 (0.0%) |
| Total | 0 (0.0%) | 0 (0.0%) |
Income Below Poverty Among Married-Couple vs Single-Parent Households in Malden On Hudson
| Children | Married-Couple Families | Single-Parent Households |
| No Children | 0 (0.0%) | 0 (0.0%) |
| 1 or 2 Children | 0 (0.0%) | 0 (0.0%) |
| 3 or 4 Children | 0 (0.0%) | 0 (0.0%) |
| 5 or more Children | 0 (0.0%) | 0 (0.0%) |
| Total | 0 (0.0%) | 0 (0.0%) |
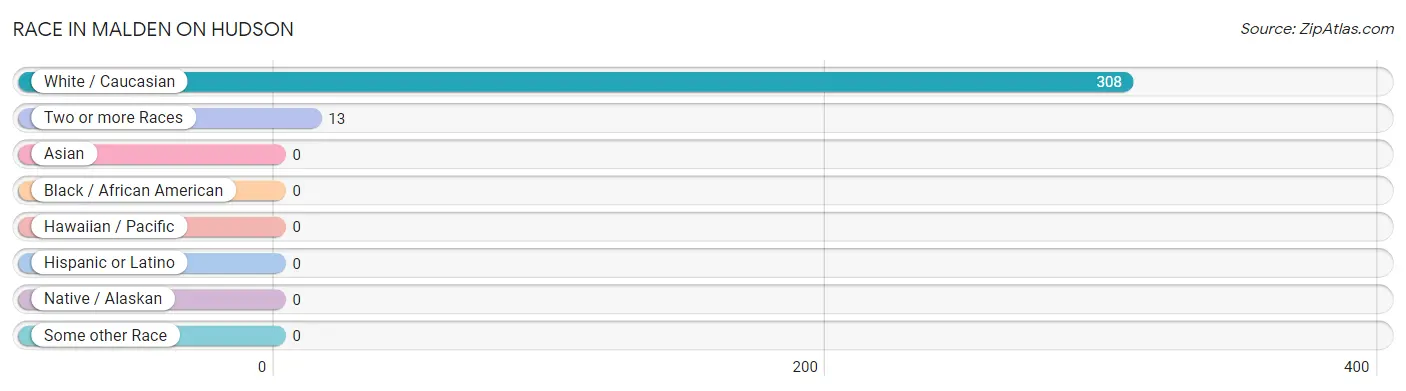
Race in Malden On Hudson
The most populous races in Malden On Hudson are White / Caucasian (308 | 96.0%), and Two or more Races (13 | 4.1%).
| Race | # Population | % Population |
| Asian | 0 | 0.0% |
| Black / African American | 0 | 0.0% |
| Hawaiian / Pacific | 0 | 0.0% |
| Hispanic or Latino | 0 | 0.0% |
| Native / Alaskan | 0 | 0.0% |
| White / Caucasian | 308 | 96.0% |
| Two or more Races | 13 | 4.1% |
| Some other Race | 0 | 0.0% |
| Total | 321 | 100.0% |
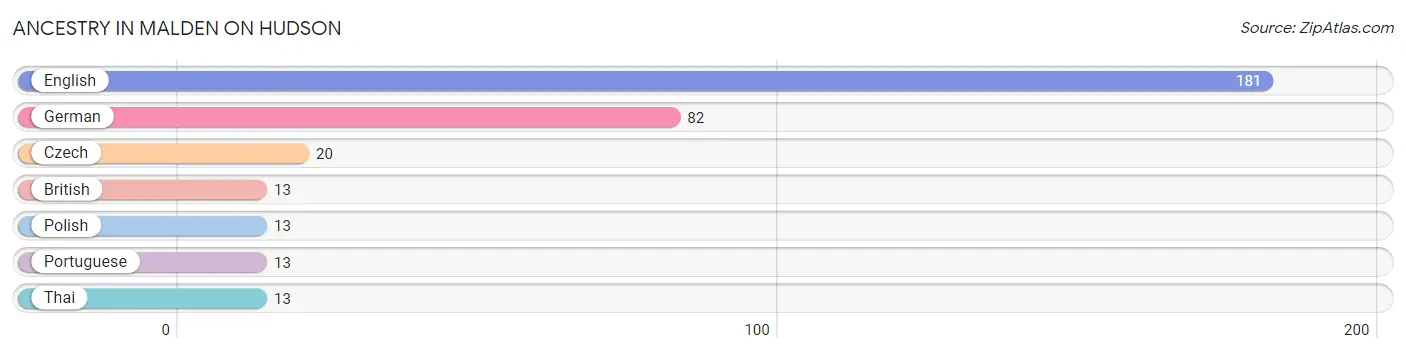
Ancestry in Malden On Hudson
The most populous ancestries reported in Malden On Hudson are English (181 | 56.4%), German (82 | 25.6%), Czech (20 | 6.2%), British (13 | 4.1%), and Polish (13 | 4.1%), together accounting for 96.3% of all Malden On Hudson residents.
| Ancestry | # Population | % Population |
| British | 13 | 4.1% |
| Czech | 20 | 6.2% |
| English | 181 | 56.4% |
| German | 82 | 25.6% |
| Polish | 13 | 4.1% |
| Portuguese | 13 | 4.1% |
| Thai | 13 | 4.1% | View All 7 Rows |
Immigrants in Malden On Hudson
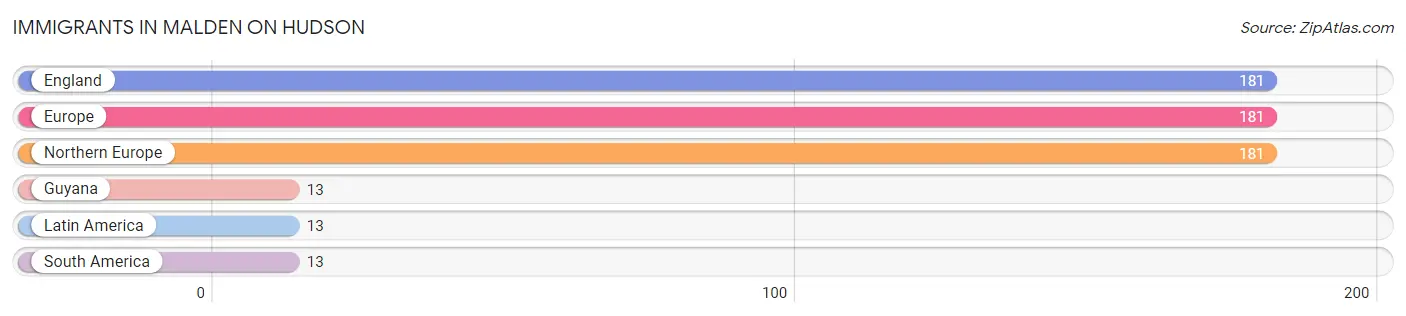
The most numerous immigrant groups reported in Malden On Hudson came from England (181 | 56.4%), Europe (181 | 56.4%), Northern Europe (181 | 56.4%), Guyana (13 | 4.1%), and Latin America (13 | 4.1%), together accounting for 177.3% of all Malden On Hudson residents.
| Immigration Origin | # Population | % Population |
| England | 181 | 56.4% |
| Europe | 181 | 56.4% |
| Guyana | 13 | 4.1% |
| Latin America | 13 | 4.1% |
| Northern Europe | 181 | 56.4% |
| South America | 13 | 4.1% | View All 6 Rows |
Sex and Age in Malden On Hudson
Sex and Age in Malden On Hudson
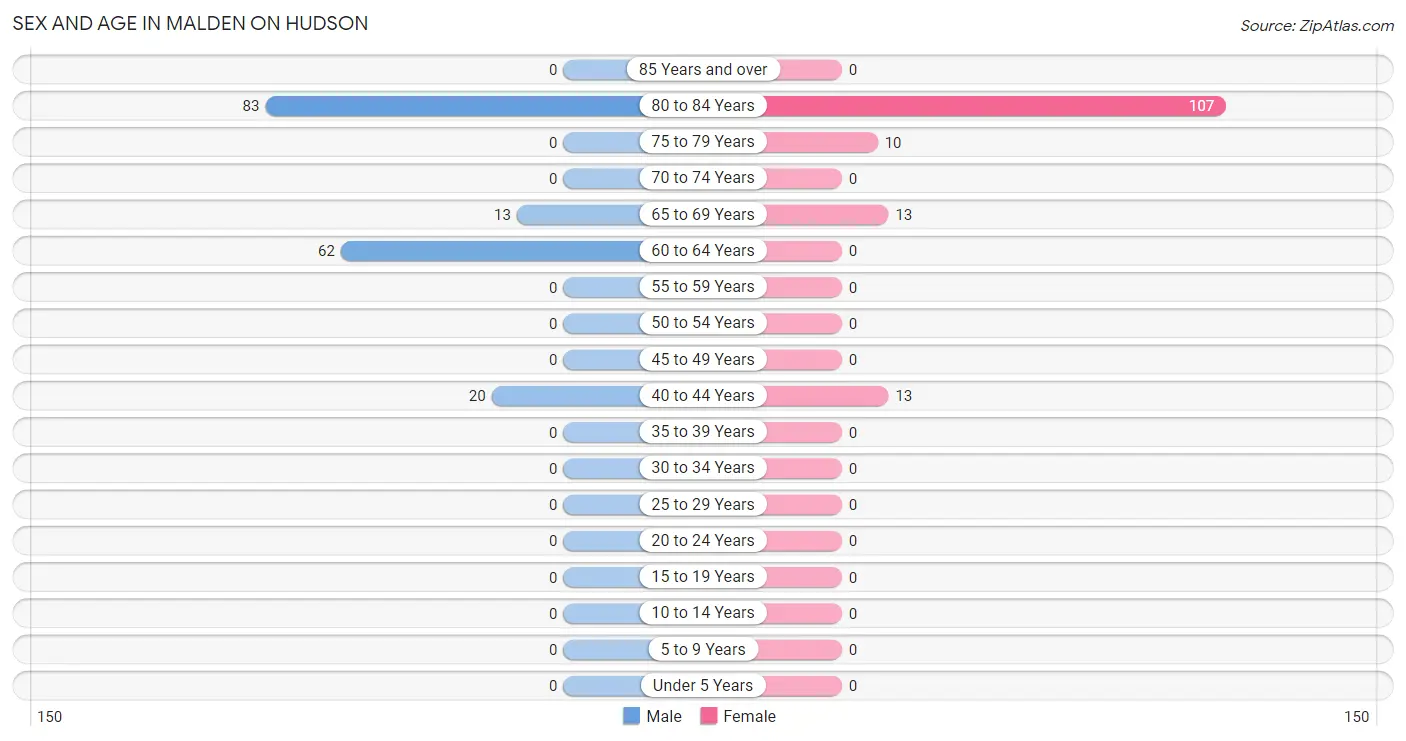
The most populous age groups in Malden On Hudson are 80 to 84 Years (83 | 46.6%) for men and 80 to 84 Years (107 | 74.8%) for women.
| Age Bracket | Male | Female |
| Under 5 Years | 0 (0.0%) | 0 (0.0%) |
| 5 to 9 Years | 0 (0.0%) | 0 (0.0%) |
| 10 to 14 Years | 0 (0.0%) | 0 (0.0%) |
| 15 to 19 Years | 0 (0.0%) | 0 (0.0%) |
| 20 to 24 Years | 0 (0.0%) | 0 (0.0%) |
| 25 to 29 Years | 0 (0.0%) | 0 (0.0%) |
| 30 to 34 Years | 0 (0.0%) | 0 (0.0%) |
| 35 to 39 Years | 0 (0.0%) | 0 (0.0%) |
| 40 to 44 Years | 20 (11.2%) | 13 (9.1%) |
| 45 to 49 Years | 0 (0.0%) | 0 (0.0%) |
| 50 to 54 Years | 0 (0.0%) | 0 (0.0%) |
| 55 to 59 Years | 0 (0.0%) | 0 (0.0%) |
| 60 to 64 Years | 62 (34.8%) | 0 (0.0%) |
| 65 to 69 Years | 13 (7.3%) | 13 (9.1%) |
| 70 to 74 Years | 0 (0.0%) | 0 (0.0%) |
| 75 to 79 Years | 0 (0.0%) | 10 (7.0%) |
| 80 to 84 Years | 83 (46.6%) | 107 (74.8%) |
| 85 Years and over | 0 (0.0%) | 0 (0.0%) |
| Total | 178 (100.0%) | 143 (100.0%) |
Families and Households in Malden On Hudson
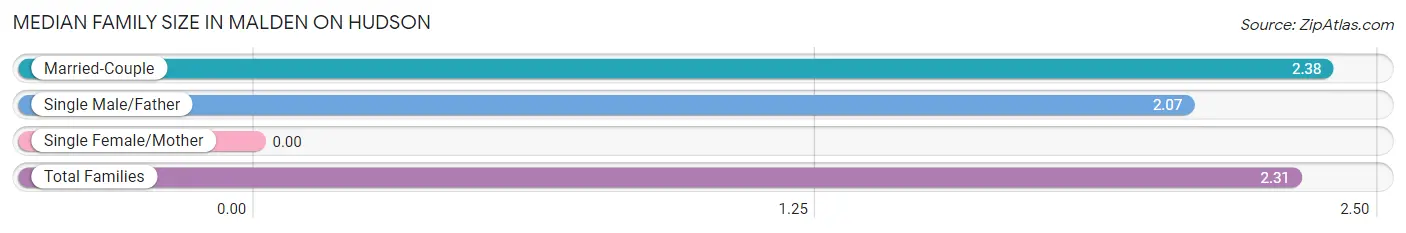
Median Family Size in Malden On Hudson
| Family Type | # Families | Family Size |
| Married-Couple | 109 (78.4%) | 2.38 |
| Single Male/Father | 30 (21.6%) | 2.07 |
| Single Female/Mother | 0 (0.0%) | - |
| Total Families | 139 (100.0%) | 2.31 |
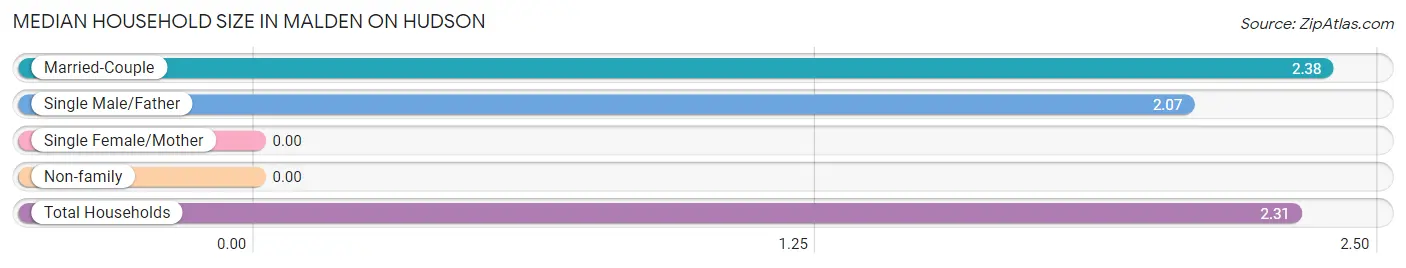
Median Household Size in Malden On Hudson
| Household Type | # Households | Household Size |
| Married-Couple | 109 (78.4%) | 2.38 |
| Single Male/Father | 30 (21.6%) | 2.07 |
| Single Female/Mother | 0 (0.0%) | - |
| Non-family | 0 (0.0%) | - |
| Total Households | 139 (100.0%) | 2.31 |
Household Size by Marriage Status in Malden On Hudson
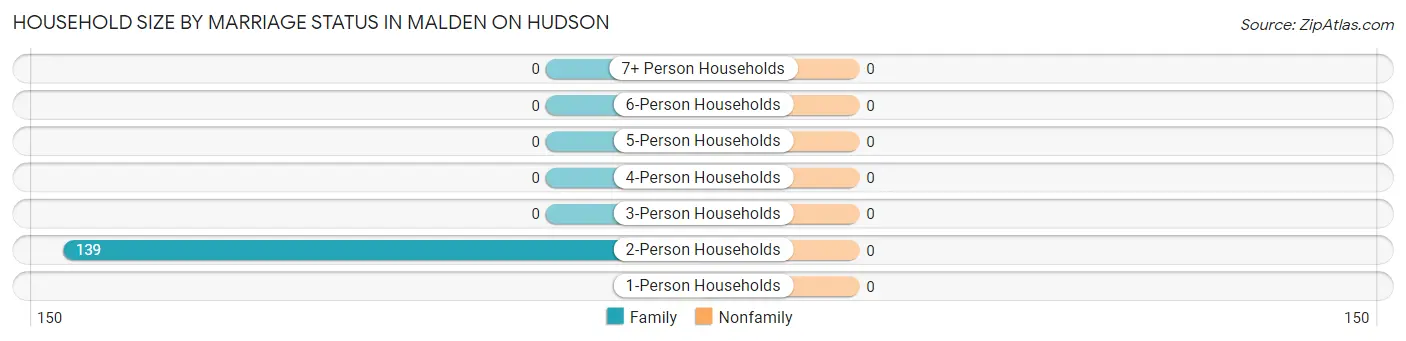
| Household Size | Family Households | Nonfamily Households |
| 1-Person Households | - | 0 (0.0%) |
| 2-Person Households | 139 (100.0%) | 0 (0.0%) |
| 3-Person Households | 0 (0.0%) | 0 (0.0%) |
| 4-Person Households | 0 (0.0%) | 0 (0.0%) |
| 5-Person Households | 0 (0.0%) | 0 (0.0%) |
| 6-Person Households | 0 (0.0%) | 0 (0.0%) |
| 7+ Person Households | 0 (0.0%) | 0 (0.0%) |
| Total | 139 (100.0%) | 0 (0.0%) |
Female Fertility in Malden On Hudson
Fertility by Age in Malden On Hudson
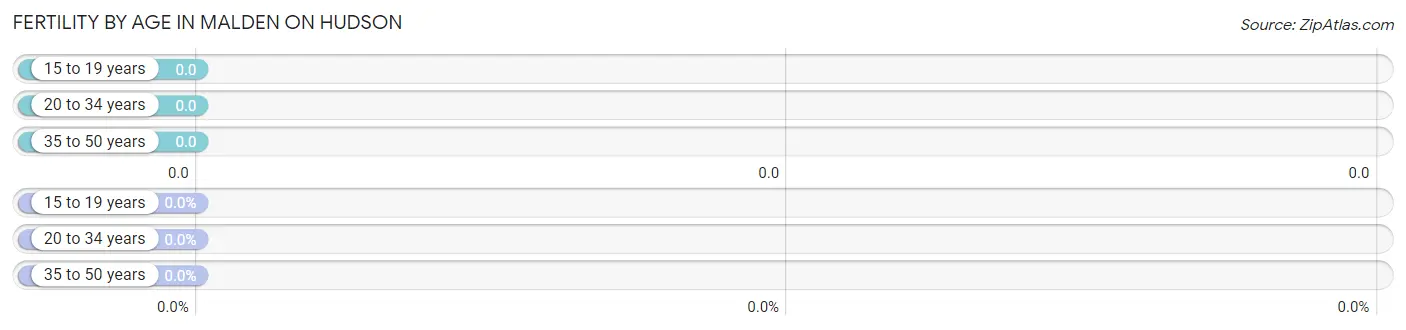
| Age Bracket | Women with Births | Births / 1,000 Women |
| 15 to 19 years | 0 (0.0%) | 0.0 |
| 20 to 34 years | 0 (0.0%) | 0.0 |
| 35 to 50 years | 0 (0.0%) | 0.0 |
| Total | 0 (0.0%) | 0.0 |
Fertility by Age by Marriage Status in Malden On Hudson
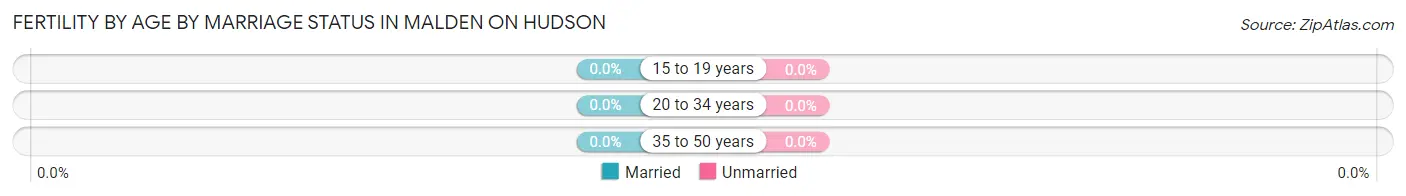
| Age Bracket | Married | Unmarried |
| 15 to 19 years | 0 (0.0%) | 0 (0.0%) |
| 20 to 34 years | 0 (0.0%) | 0 (0.0%) |
| 35 to 50 years | 0 (0.0%) | 0 (0.0%) |
| Total | 0 (0.0%) | 0 (0.0%) |
Fertility by Education in Malden On Hudson
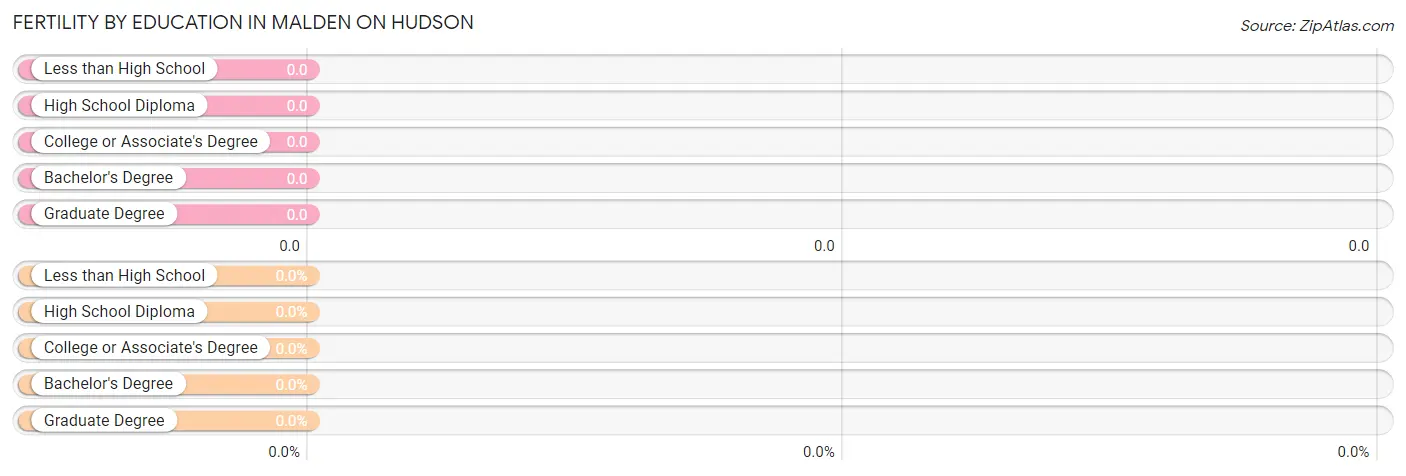
| Educational Attainment | Women with Births | Births / 1,000 Women |
| Less than High School | 0 (0.0%) | 0.0 |
| High School Diploma | 0 (0.0%) | 0.0 |
| College or Associate's Degree | 0 (0.0%) | 0.0 |
| Bachelor's Degree | 0 (0.0%) | 0.0 |
| Graduate Degree | 0 (0.0%) | 0.0 |
| Total | 0 (0.0%) | 0.0 |
Fertility by Education by Marriage Status in Malden On Hudson
| Educational Attainment | Married | Unmarried |
| Less than High School | 0 (0.0%) | 0 (0.0%) |
| High School Diploma | 0 (0.0%) | 0 (0.0%) |
| College or Associate's Degree | 0 (0.0%) | 0 (0.0%) |
| Bachelor's Degree | 0 (0.0%) | 0 (0.0%) |
| Graduate Degree | 0 (0.0%) | 0 (0.0%) |
| Total | 0 (0.0%) | 0 (0.0%) |
Employment Characteristics in Malden On Hudson
Employment by Class of Employer in Malden On Hudson
Among the 121 employed individuals in Malden On Hudson, private company employees (62 | 51.2%), local government employees (46 | 38.0%), and federal government employees (13 | 10.7%) make up the most common classes of employment.
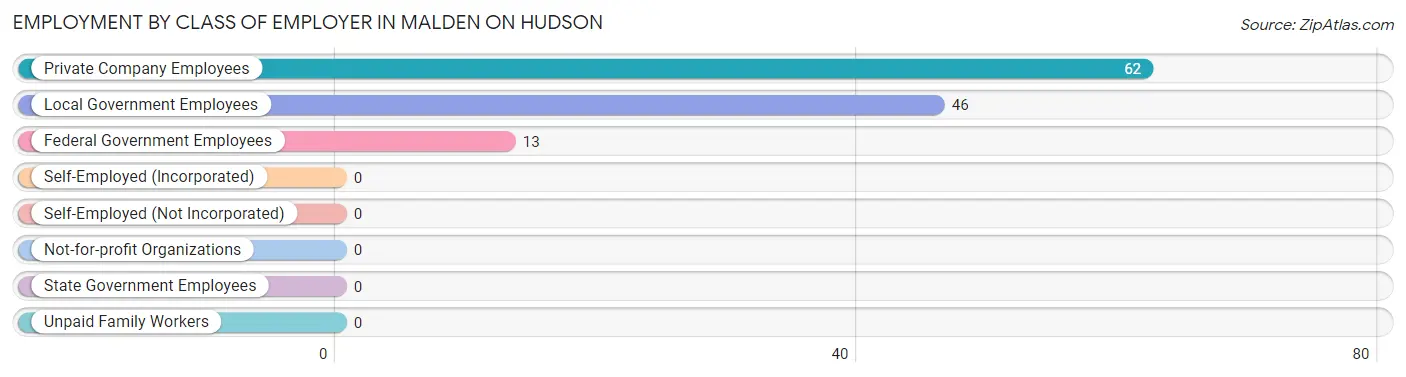
| Employer Class | # Employees | % Employees |
| Private Company Employees | 62 | 51.2% |
| Self-Employed (Incorporated) | 0 | 0.0% |
| Self-Employed (Not Incorporated) | 0 | 0.0% |
| Not-for-profit Organizations | 0 | 0.0% |
| Local Government Employees | 46 | 38.0% |
| State Government Employees | 0 | 0.0% |
| Federal Government Employees | 13 | 10.7% |
| Unpaid Family Workers | 0 | 0.0% |
| Total | 121 | 100.0% |
Employment Status by Age in Malden On Hudson
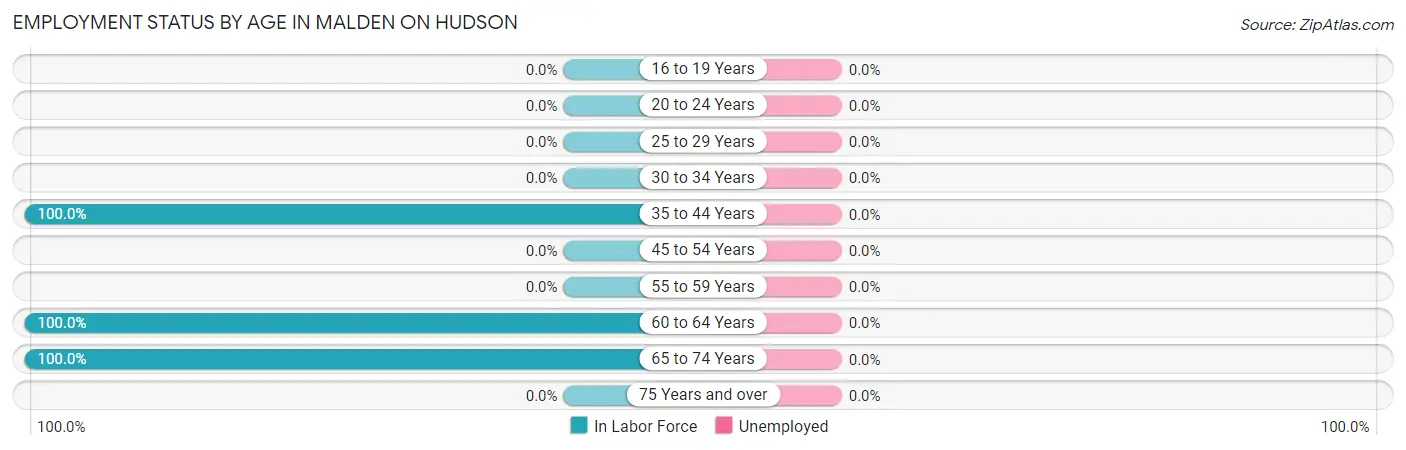
| Age Bracket | In Labor Force | Unemployed |
| 16 to 19 Years | 0 (0.0%) | 0 (0.0%) |
| 20 to 24 Years | 0 (0.0%) | 0 (0.0%) |
| 25 to 29 Years | 0 (0.0%) | 0 (0.0%) |
| 30 to 34 Years | 0 (0.0%) | 0 (0.0%) |
| 35 to 44 Years | 33 (100.0%) | 0 (0.0%) |
| 45 to 54 Years | 0 (0.0%) | 0 (0.0%) |
| 55 to 59 Years | 0 (0.0%) | 0 (0.0%) |
| 60 to 64 Years | 62 (100.0%) | 0 (0.0%) |
| 65 to 74 Years | 26 (100.0%) | 0 (0.0%) |
| 75 Years and over | 0 (0.0%) | 0 (0.0%) |
| Total | 121 (37.7%) | 0 (0.0%) |
Employment Status by Educational Attainment in Malden On Hudson
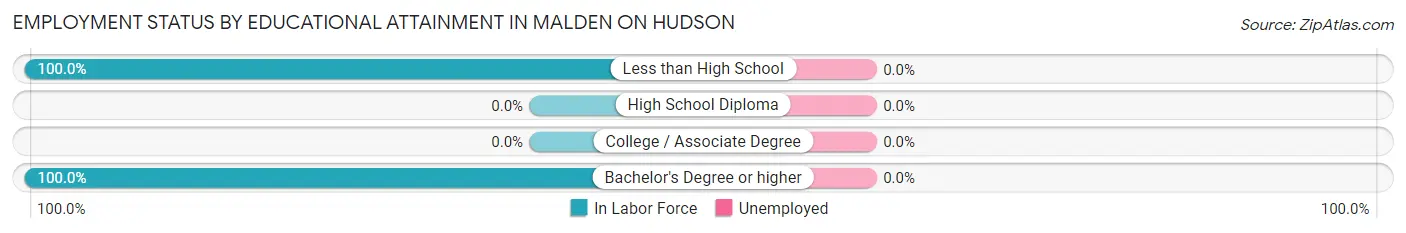
| Educational Attainment | In Labor Force | Unemployed |
| Less than High School | 30 (100.0%) | 0 (0.0%) |
| High School Diploma | 0 (0.0%) | 0 (0.0%) |
| College / Associate Degree | 0 (0.0%) | 0 (0.0%) |
| Bachelor's Degree or higher | 65 (100.0%) | 0 (0.0%) |
| Total | 95 (100.0%) | 0 (0.0%) |
Employment Occupations by Sex in Malden On Hudson
Management, Business, Science and Arts Occupations
The most common Management, Business, Science and Arts occupations in Malden On Hudson are Community & Social Service (20 | 16.5%), Legal Services & Support (20 | 16.5%), and Management (13 | 10.7%).
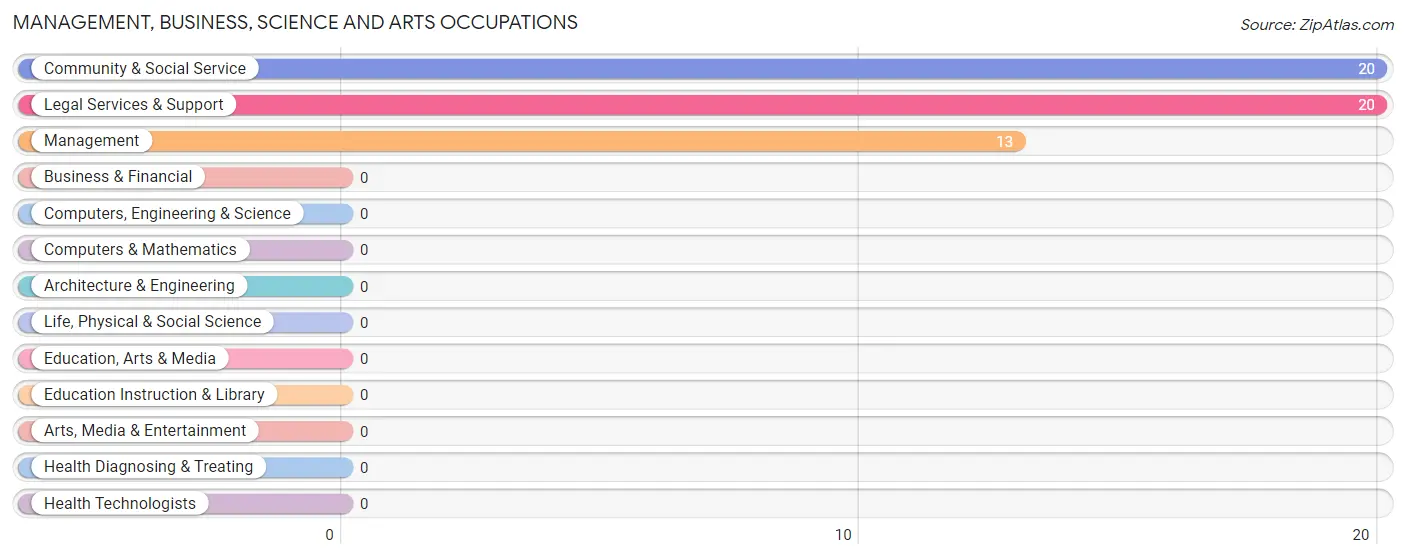
Management, Business, Science and Arts Occupations by Sex
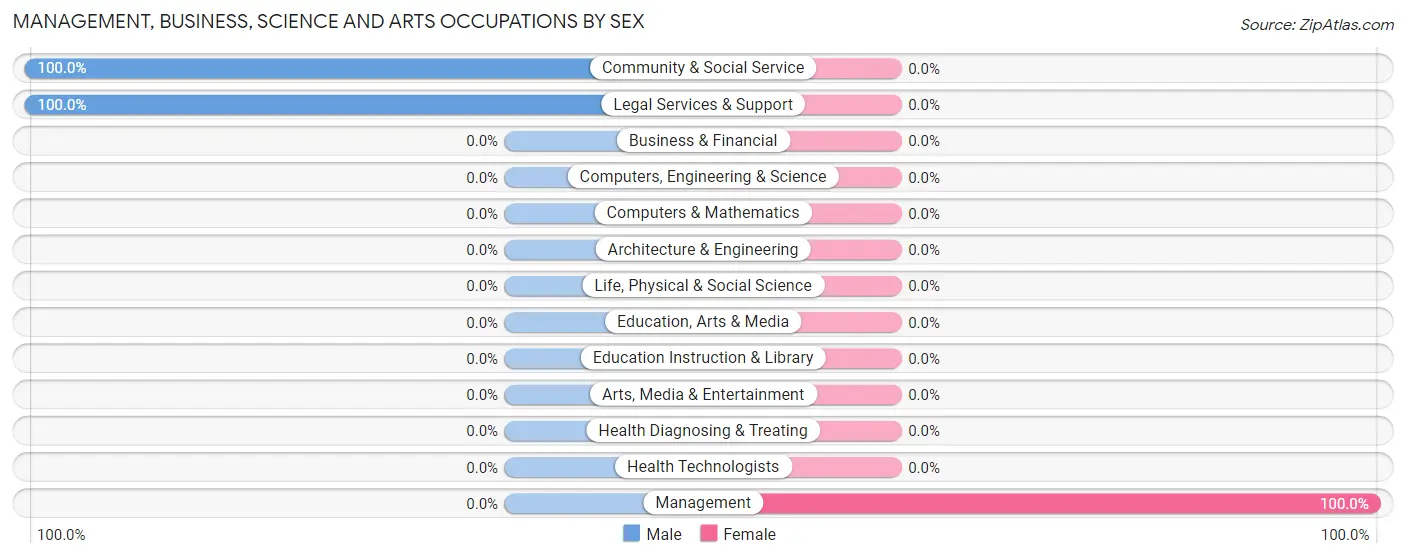
| Occupation | Male | Female |
| Management | 0 (0.0%) | 13 (100.0%) |
| Business & Financial | 0 (0.0%) | 0 (0.0%) |
| Computers, Engineering & Science | 0 (0.0%) | 0 (0.0%) |
| Computers & Mathematics | 0 (0.0%) | 0 (0.0%) |
| Architecture & Engineering | 0 (0.0%) | 0 (0.0%) |
| Life, Physical & Social Science | 0 (0.0%) | 0 (0.0%) |
| Community & Social Service | 20 (100.0%) | 0 (0.0%) |
| Education, Arts & Media | 0 (0.0%) | 0 (0.0%) |
| Legal Services & Support | 20 (100.0%) | 0 (0.0%) |
| Education Instruction & Library | 0 (0.0%) | 0 (0.0%) |
| Arts, Media & Entertainment | 0 (0.0%) | 0 (0.0%) |
| Health Diagnosing & Treating | 0 (0.0%) | 0 (0.0%) |
| Health Technologists | 0 (0.0%) | 0 (0.0%) |
| Total (Category) | 20 (60.6%) | 13 (39.4%) |
| Total (Overall) | 95 (78.5%) | 26 (21.5%) |
Services Occupations
The most common Services occupations in Malden On Hudson are Food Preparation & Serving (13 | 10.7%), and Personal Care & Service (13 | 10.7%).
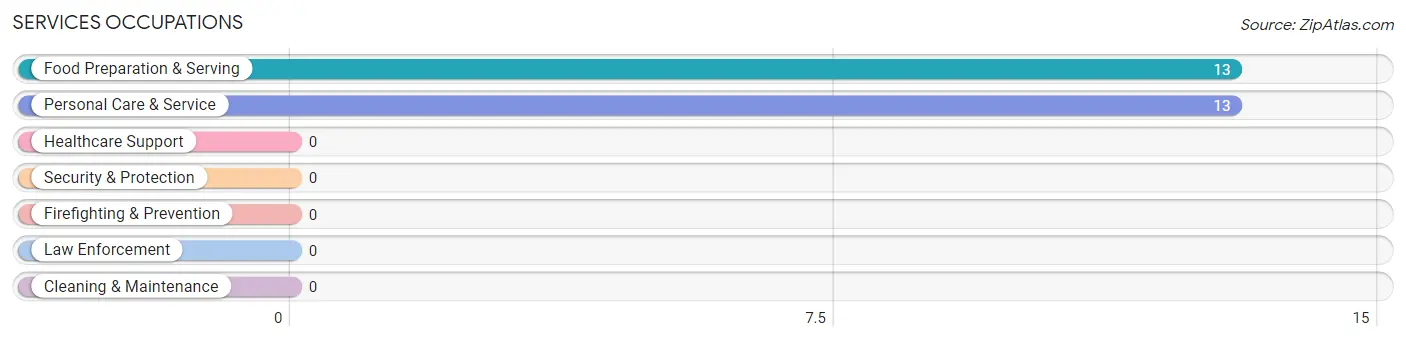
Services Occupations by Sex
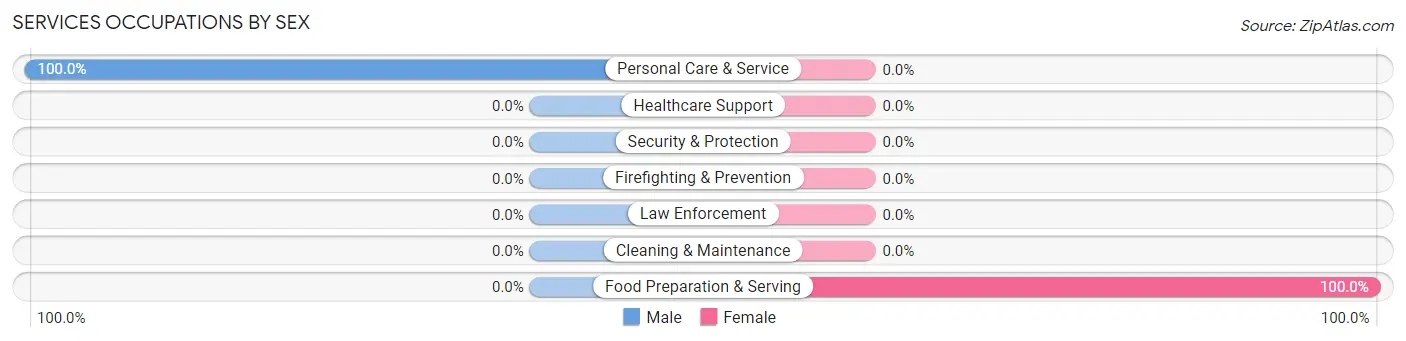
| Occupation | Male | Female |
| Healthcare Support | 0 (0.0%) | 0 (0.0%) |
| Security & Protection | 0 (0.0%) | 0 (0.0%) |
| Firefighting & Prevention | 0 (0.0%) | 0 (0.0%) |
| Law Enforcement | 0 (0.0%) | 0 (0.0%) |
| Food Preparation & Serving | 0 (0.0%) | 13 (100.0%) |
| Cleaning & Maintenance | 0 (0.0%) | 0 (0.0%) |
| Personal Care & Service | 13 (100.0%) | 0 (0.0%) |
| Total (Category) | 13 (50.0%) | 13 (50.0%) |
| Total (Overall) | 95 (78.5%) | 26 (21.5%) |
Sales and Office Occupations

Sales and Office Occupations by Sex

| Occupation | Male | Female |
| Sales & Related | 0 (0.0%) | 0 (0.0%) |
| Office & Administration | 0 (0.0%) | 0 (0.0%) |
| Total (Category) | 0 (0.0%) | 0 (0.0%) |
| Total (Overall) | 95 (78.5%) | 26 (21.5%) |
Natural Resources, Construction and Maintenance Occupations
Natural Resources, Construction and Maintenance Occupations by Sex
| Occupation | Male | Female |
| Farming, Fishing & Forestry | 0 (0.0%) | 0 (0.0%) |
| Construction & Extraction | 0 (0.0%) | 0 (0.0%) |
| Installation, Maintenance & Repair | 0 (0.0%) | 0 (0.0%) |
| Total (Category) | 0 (0.0%) | 0 (0.0%) |
| Total (Overall) | 95 (78.5%) | 26 (21.5%) |
Production, Transportation and Moving Occupations
The most common Production, Transportation and Moving occupations in Malden On Hudson are , and Production (62 | 51.2%).
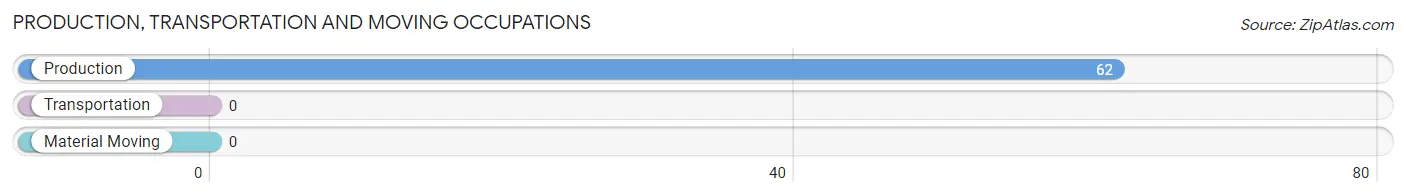
Production, Transportation and Moving Occupations by Sex
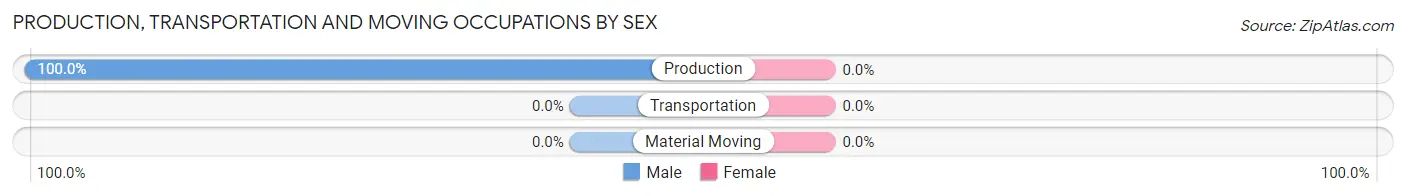
| Occupation | Male | Female |
| Production | 62 (100.0%) | 0 (0.0%) |
| Transportation | 0 (0.0%) | 0 (0.0%) |
| Material Moving | 0 (0.0%) | 0 (0.0%) |
| Total (Category) | 62 (100.0%) | 0 (0.0%) |
| Total (Overall) | 95 (78.5%) | 26 (21.5%) |
Employment Industries by Sex in Malden On Hudson
Employment Industries in Malden On Hudson
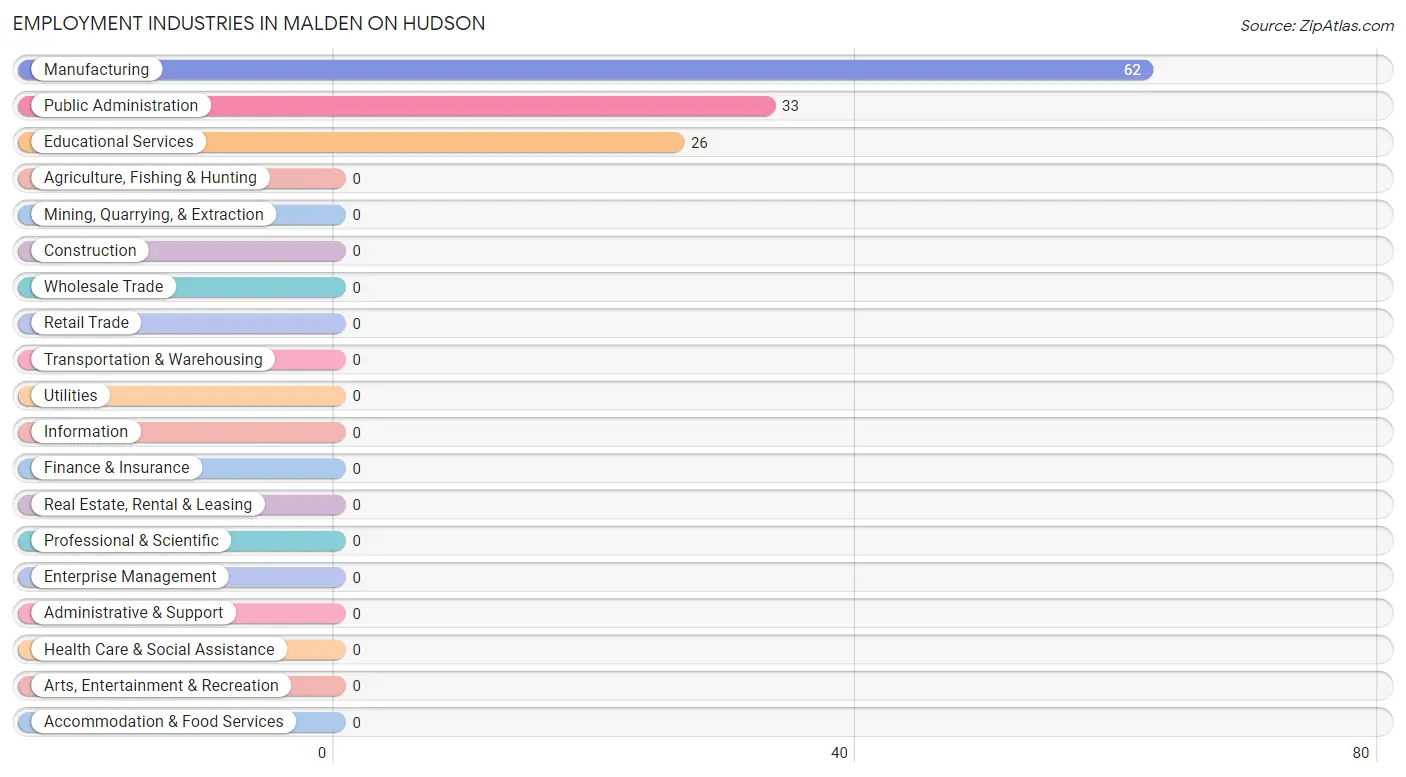
The major employment industries in Malden On Hudson include Manufacturing (62 | 51.2%), Public Administration (33 | 27.3%), and Educational Services (26 | 21.5%).
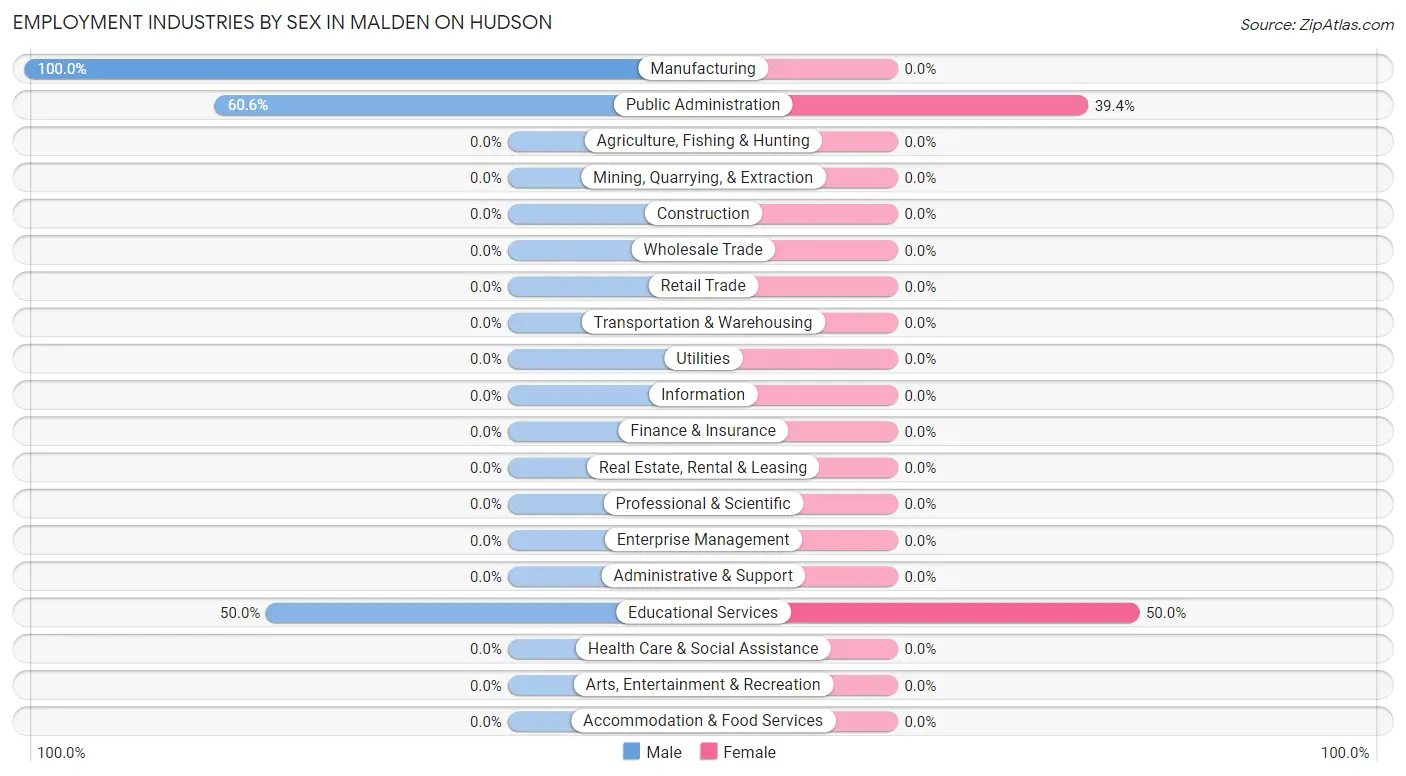
Employment Industries by Sex in Malden On Hudson
The Malden On Hudson industries that see more men than women are Manufacturing (100.0%), Public Administration (60.6%), and Educational Services (50.0%), whereas the industries that tend to have a higher number of women are Educational Services (50.0%), and Public Administration (39.4%).
| Industry | Male | Female |
| Agriculture, Fishing & Hunting | 0 (0.0%) | 0 (0.0%) |
| Mining, Quarrying, & Extraction | 0 (0.0%) | 0 (0.0%) |
| Construction | 0 (0.0%) | 0 (0.0%) |
| Manufacturing | 62 (100.0%) | 0 (0.0%) |
| Wholesale Trade | 0 (0.0%) | 0 (0.0%) |
| Retail Trade | 0 (0.0%) | 0 (0.0%) |
| Transportation & Warehousing | 0 (0.0%) | 0 (0.0%) |
| Utilities | 0 (0.0%) | 0 (0.0%) |
| Information | 0 (0.0%) | 0 (0.0%) |
| Finance & Insurance | 0 (0.0%) | 0 (0.0%) |
| Real Estate, Rental & Leasing | 0 (0.0%) | 0 (0.0%) |
| Professional & Scientific | 0 (0.0%) | 0 (0.0%) |
| Enterprise Management | 0 (0.0%) | 0 (0.0%) |
| Administrative & Support | 0 (0.0%) | 0 (0.0%) |
| Educational Services | 13 (50.0%) | 13 (50.0%) |
| Health Care & Social Assistance | 0 (0.0%) | 0 (0.0%) |
| Arts, Entertainment & Recreation | 0 (0.0%) | 0 (0.0%) |
| Accommodation & Food Services | 0 (0.0%) | 0 (0.0%) |
| Public Administration | 20 (60.6%) | 13 (39.4%) |
| Total | 95 (78.5%) | 26 (21.5%) |
Education in Malden On Hudson
School Enrollment in Malden On Hudson
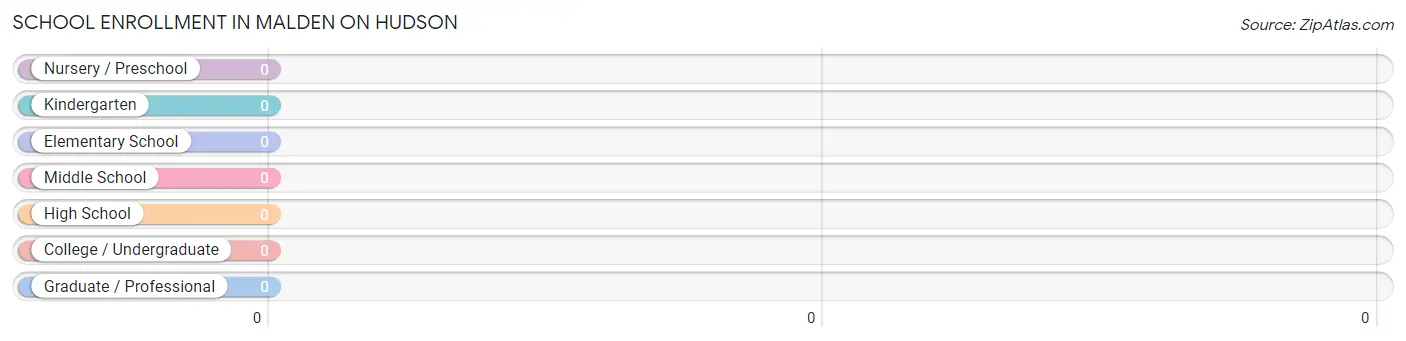
| School Level | # Students | % Students |
| Nursery / Preschool | 0 | 0.0% |
| Kindergarten | 0 | 0.0% |
| Elementary School | 0 | 0.0% |
| Middle School | 0 | 0.0% |
| High School | 0 | 0.0% |
| College / Undergraduate | 0 | 0.0% |
| Graduate / Professional | 0 | 0.0% |
| Total | 0 | 0.0% |
School Enrollment by Age by Funding Source in Malden On Hudson
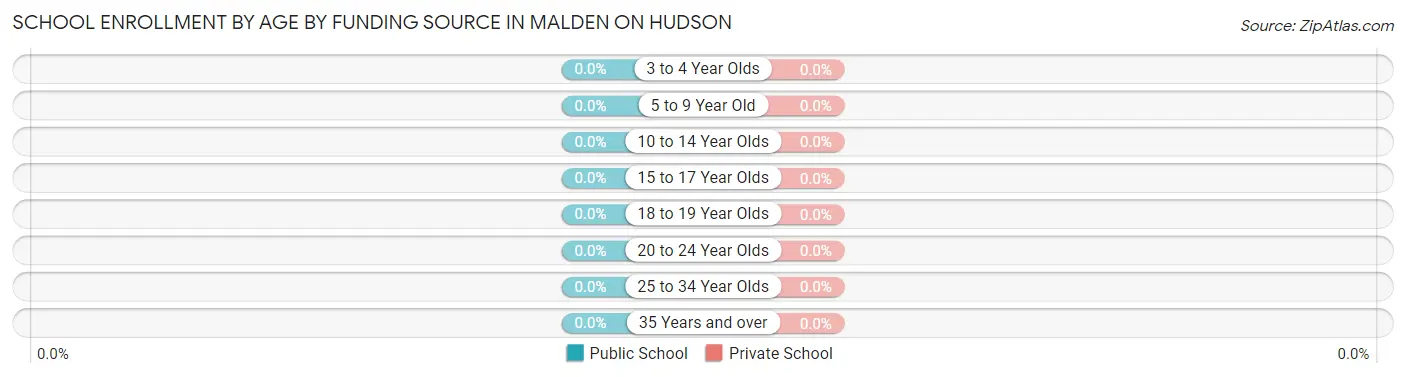
| Age Bracket | Public School | Private School |
| 3 to 4 Year Olds | 0 (0.0%) | 0 (0.0%) |
| 5 to 9 Year Old | 0 (0.0%) | 0 (0.0%) |
| 10 to 14 Year Olds | 0 (0.0%) | 0 (0.0%) |
| 15 to 17 Year Olds | 0 (0.0%) | 0 (0.0%) |
| 18 to 19 Year Olds | 0 (0.0%) | 0 (0.0%) |
| 20 to 24 Year Olds | 0 (0.0%) | 0 (0.0%) |
| 25 to 34 Year Olds | 0 (0.0%) | 0 (0.0%) |
| 35 Years and over | 0 (0.0%) | 0 (0.0%) |
| Total | 0 (0.0%) | 0 (0.0%) |
Educational Attainment by Field of Study in Malden On Hudson
Engineering (74 | 53.2%), social sciences (33 | 23.7%), and literature & languages (32 | 23.0%) are the most common fields of study among 139 individuals in Malden On Hudson who have obtained a bachelor's degree or higher.
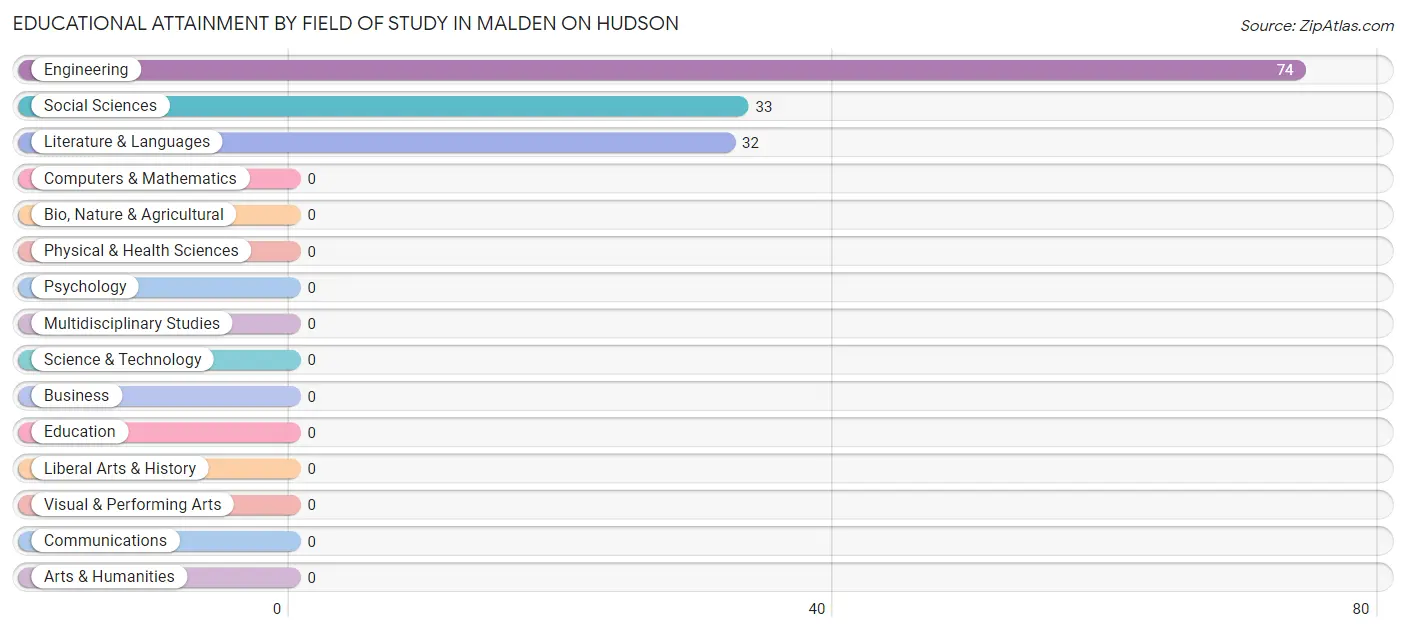
| Field of Study | # Graduates | % Graduates |
| Computers & Mathematics | 0 | 0.0% |
| Bio, Nature & Agricultural | 0 | 0.0% |
| Physical & Health Sciences | 0 | 0.0% |
| Psychology | 0 | 0.0% |
| Social Sciences | 33 | 23.7% |
| Engineering | 74 | 53.2% |
| Multidisciplinary Studies | 0 | 0.0% |
| Science & Technology | 0 | 0.0% |
| Business | 0 | 0.0% |
| Education | 0 | 0.0% |
| Literature & Languages | 32 | 23.0% |
| Liberal Arts & History | 0 | 0.0% |
| Visual & Performing Arts | 0 | 0.0% |
| Communications | 0 | 0.0% |
| Arts & Humanities | 0 | 0.0% |
| Total | 139 | 100.0% |
Transportation & Commute in Malden On Hudson
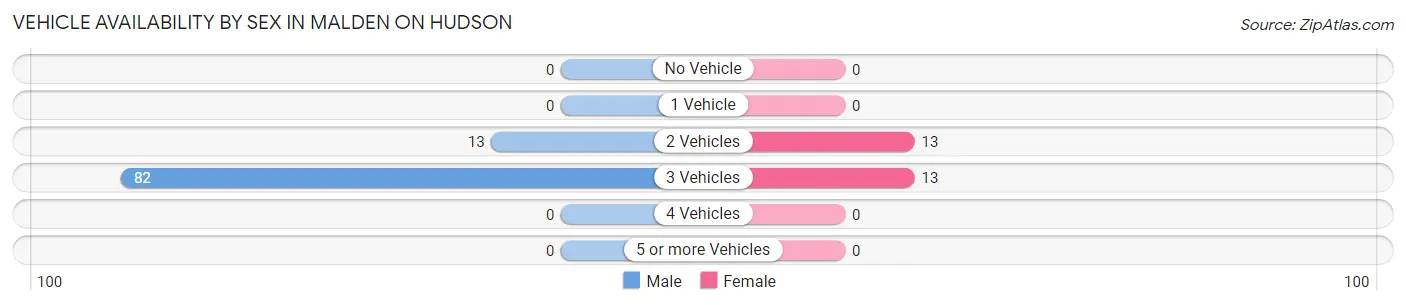
Vehicle Availability by Sex in Malden On Hudson
The most prevalent vehicle ownership categories in Malden On Hudson are males with 3 vehicles (82, accounting for 86.3%) and females with 3 vehicles (13, making up 315.4%).
| Vehicles Available | Male | Female |
| No Vehicle | 0 (0.0%) | 0 (0.0%) |
| 1 Vehicle | 0 (0.0%) | 0 (0.0%) |
| 2 Vehicles | 13 (13.7%) | 13 (50.0%) |
| 3 Vehicles | 82 (86.3%) | 13 (50.0%) |
| 4 Vehicles | 0 (0.0%) | 0 (0.0%) |
| 5 or more Vehicles | 0 (0.0%) | 0 (0.0%) |
| Total | 95 (100.0%) | 26 (100.0%) |
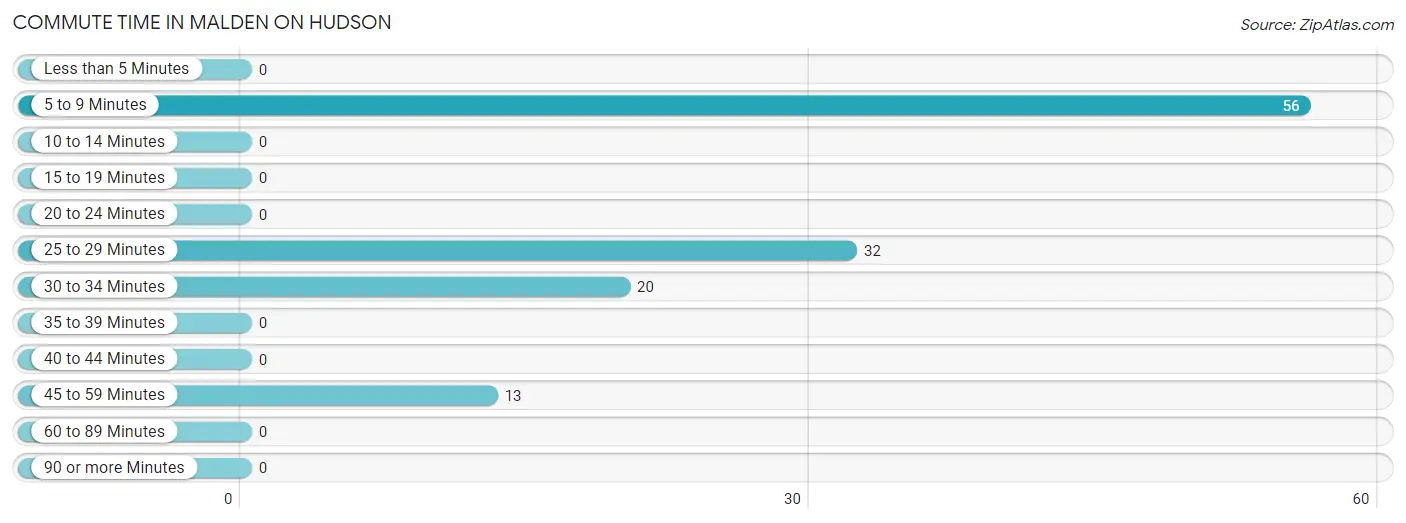
Commute Time in Malden On Hudson
The most frequently occuring commute durations in Malden On Hudson are 5 to 9 minutes (56 commuters, 46.3%), 25 to 29 minutes (32 commuters, 26.5%), and 30 to 34 minutes (20 commuters, 16.5%).
| Commute Time | # Commuters | % Commuters |
| Less than 5 Minutes | 0 | 0.0% |
| 5 to 9 Minutes | 56 | 46.3% |
| 10 to 14 Minutes | 0 | 0.0% |
| 15 to 19 Minutes | 0 | 0.0% |
| 20 to 24 Minutes | 0 | 0.0% |
| 25 to 29 Minutes | 32 | 26.5% |
| 30 to 34 Minutes | 20 | 16.5% |
| 35 to 39 Minutes | 0 | 0.0% |
| 40 to 44 Minutes | 0 | 0.0% |
| 45 to 59 Minutes | 13 | 10.7% |
| 60 to 89 Minutes | 0 | 0.0% |
| 90 or more Minutes | 0 | 0.0% |
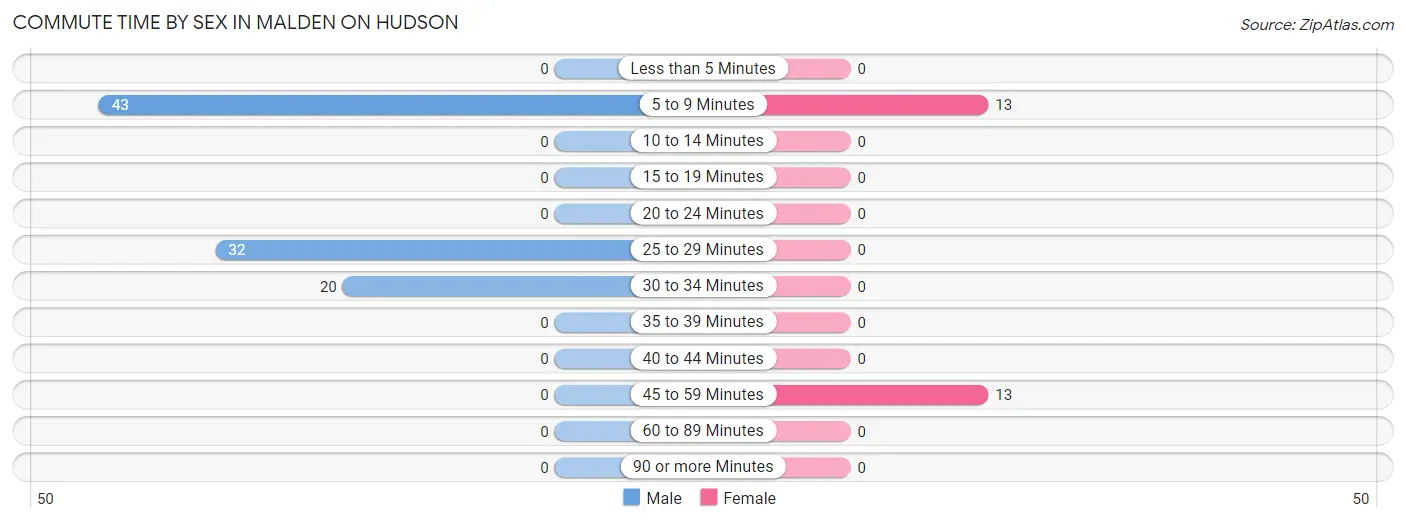
Commute Time by Sex in Malden On Hudson
The most common commute times in Malden On Hudson are 5 to 9 minutes (43 commuters, 45.3%) for males and 5 to 9 minutes (13 commuters, 50.0%) for females.
| Commute Time | Male | Female |
| Less than 5 Minutes | 0 (0.0%) | 0 (0.0%) |
| 5 to 9 Minutes | 43 (45.3%) | 13 (50.0%) |
| 10 to 14 Minutes | 0 (0.0%) | 0 (0.0%) |
| 15 to 19 Minutes | 0 (0.0%) | 0 (0.0%) |
| 20 to 24 Minutes | 0 (0.0%) | 0 (0.0%) |
| 25 to 29 Minutes | 32 (33.7%) | 0 (0.0%) |
| 30 to 34 Minutes | 20 (21.0%) | 0 (0.0%) |
| 35 to 39 Minutes | 0 (0.0%) | 0 (0.0%) |
| 40 to 44 Minutes | 0 (0.0%) | 0 (0.0%) |
| 45 to 59 Minutes | 0 (0.0%) | 13 (50.0%) |
| 60 to 89 Minutes | 0 (0.0%) | 0 (0.0%) |
| 90 or more Minutes | 0 (0.0%) | 0 (0.0%) |
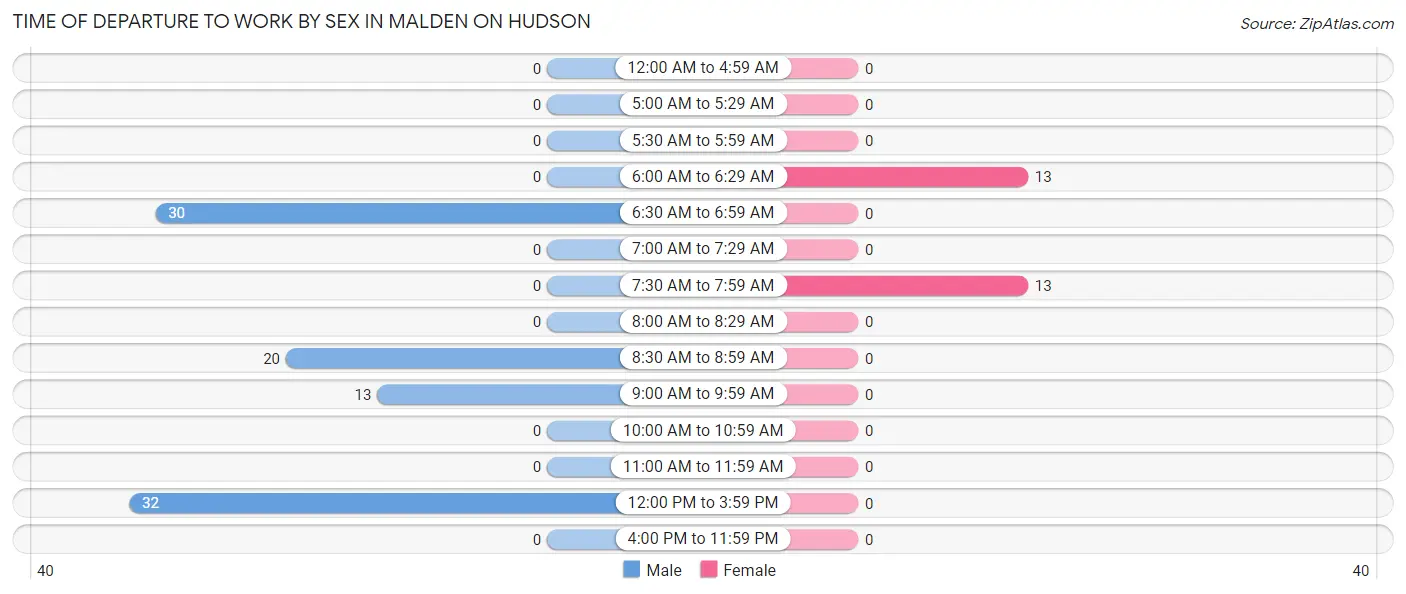
Time of Departure to Work by Sex in Malden On Hudson
The most frequent times of departure to work in Malden On Hudson are 12:00 PM to 3:59 PM (32, 33.7%) for males and 6:00 AM to 6:29 AM (13, 50.0%) for females.
| Time of Departure | Male | Female |
| 12:00 AM to 4:59 AM | 0 (0.0%) | 0 (0.0%) |
| 5:00 AM to 5:29 AM | 0 (0.0%) | 0 (0.0%) |
| 5:30 AM to 5:59 AM | 0 (0.0%) | 0 (0.0%) |
| 6:00 AM to 6:29 AM | 0 (0.0%) | 13 (50.0%) |
| 6:30 AM to 6:59 AM | 30 (31.6%) | 0 (0.0%) |
| 7:00 AM to 7:29 AM | 0 (0.0%) | 0 (0.0%) |
| 7:30 AM to 7:59 AM | 0 (0.0%) | 13 (50.0%) |
| 8:00 AM to 8:29 AM | 0 (0.0%) | 0 (0.0%) |
| 8:30 AM to 8:59 AM | 20 (21.0%) | 0 (0.0%) |
| 9:00 AM to 9:59 AM | 13 (13.7%) | 0 (0.0%) |
| 10:00 AM to 10:59 AM | 0 (0.0%) | 0 (0.0%) |
| 11:00 AM to 11:59 AM | 0 (0.0%) | 0 (0.0%) |
| 12:00 PM to 3:59 PM | 32 (33.7%) | 0 (0.0%) |
| 4:00 PM to 11:59 PM | 0 (0.0%) | 0 (0.0%) |
| Total | 95 (100.0%) | 26 (100.0%) |
Housing Occupancy in Malden On Hudson
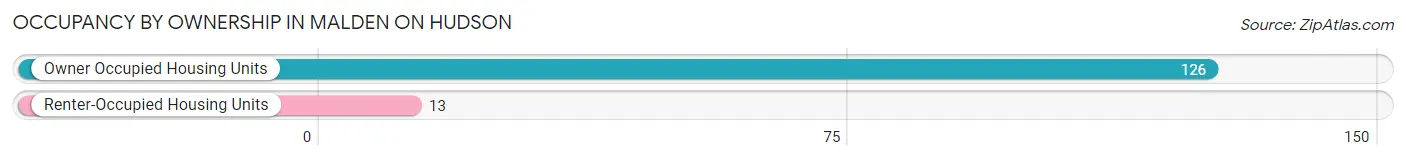
Occupancy by Ownership in Malden On Hudson
Of the total 139 dwellings in Malden On Hudson, owner-occupied units account for 126 (90.6%), while renter-occupied units make up 13 (9.3%).
| Occupancy | # Housing Units | % Housing Units |
| Owner Occupied Housing Units | 126 | 90.6% |
| Renter-Occupied Housing Units | 13 | 9.3% |
| Total Occupied Housing Units | 139 | 100.0% |
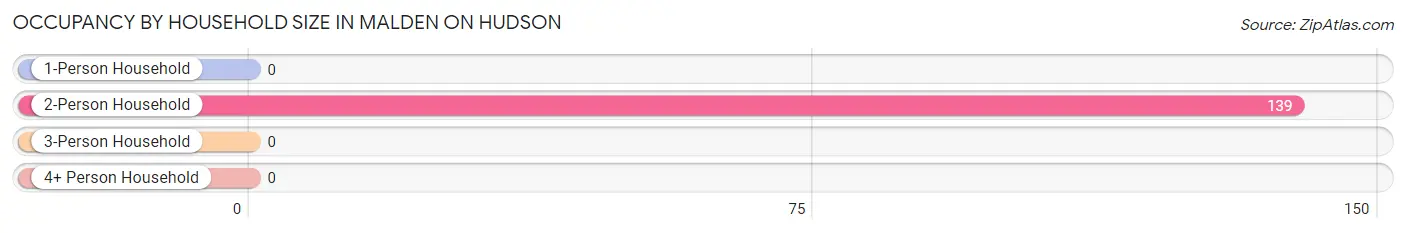
Occupancy by Household Size in Malden On Hudson
| Household Size | # Housing Units | % Housing Units |
| 1-Person Household | 0 | 0.0% |
| 2-Person Household | 139 | 100.0% |
| 3-Person Household | 0 | 0.0% |
| 4+ Person Household | 0 | 0.0% |
| Total Housing Units | 139 | 100.0% |
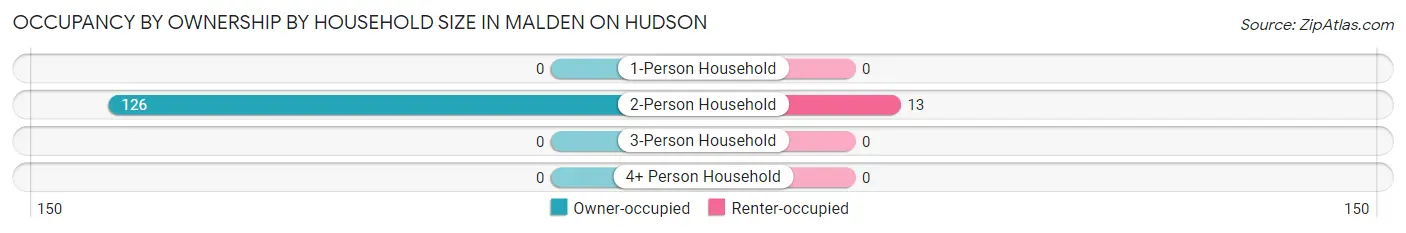
Occupancy by Ownership by Household Size in Malden On Hudson
| Household Size | Owner-occupied | Renter-occupied |
| 1-Person Household | 0 (0.0%) | 0 (0.0%) |
| 2-Person Household | 126 (90.6%) | 13 (9.3%) |
| 3-Person Household | 0 (0.0%) | 0 (0.0%) |
| 4+ Person Household | 0 (0.0%) | 0 (0.0%) |
| Total Housing Units | 126 (90.6%) | 13 (9.3%) |
Occupancy by Educational Attainment in Malden On Hudson
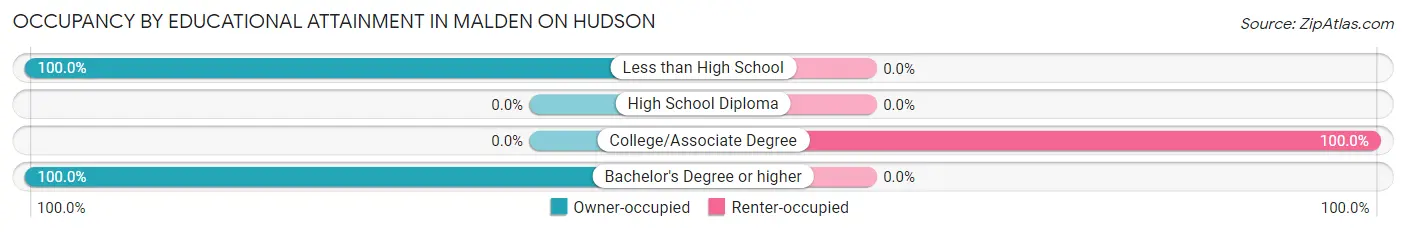
| Household Size | Owner-occupied | Renter-occupied |
| Less than High School | 39 (100.0%) | 0 (0.0%) |
| High School Diploma | 0 (0.0%) | 0 (0.0%) |
| College/Associate Degree | 0 (0.0%) | 13 (100.0%) |
| Bachelor's Degree or higher | 87 (100.0%) | 0 (0.0%) |
Occupancy by Age of Householder in Malden On Hudson
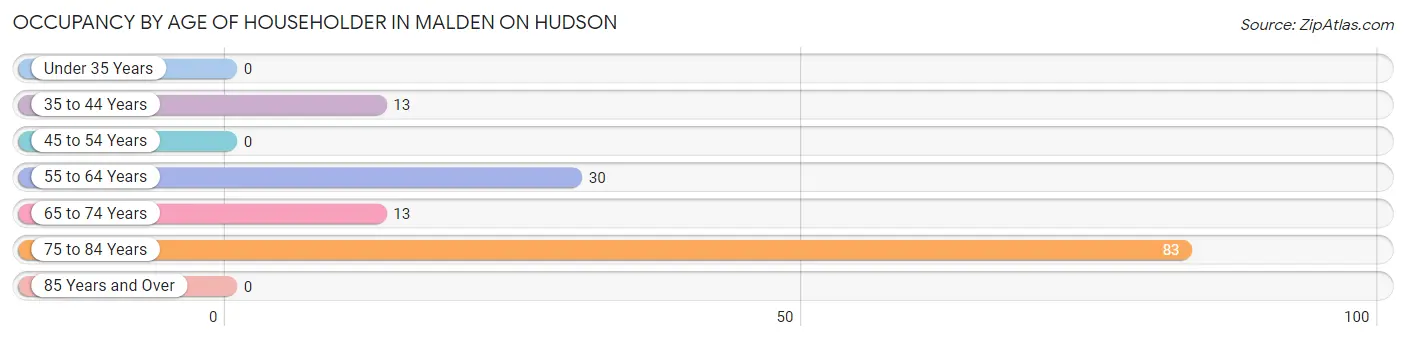
| Age Bracket | # Households | % Households |
| Under 35 Years | 0 | 0.0% |
| 35 to 44 Years | 13 | 9.3% |
| 45 to 54 Years | 0 | 0.0% |
| 55 to 64 Years | 30 | 21.6% |
| 65 to 74 Years | 13 | 9.3% |
| 75 to 84 Years | 83 | 59.7% |
| 85 Years and Over | 0 | 0.0% |
| Total | 139 | 100.0% |
Housing Finances in Malden On Hudson
Median Income by Occupancy in Malden On Hudson
| Occupancy Type | # Households | Median Income |
| Owner-Occupied | 126 (90.6%) | $0 |
| Renter-Occupied | 13 (9.3%) | $0 |
| Average | 139 (100.0%) | $0 |
Occupancy by Householder Income Bracket in Malden On Hudson
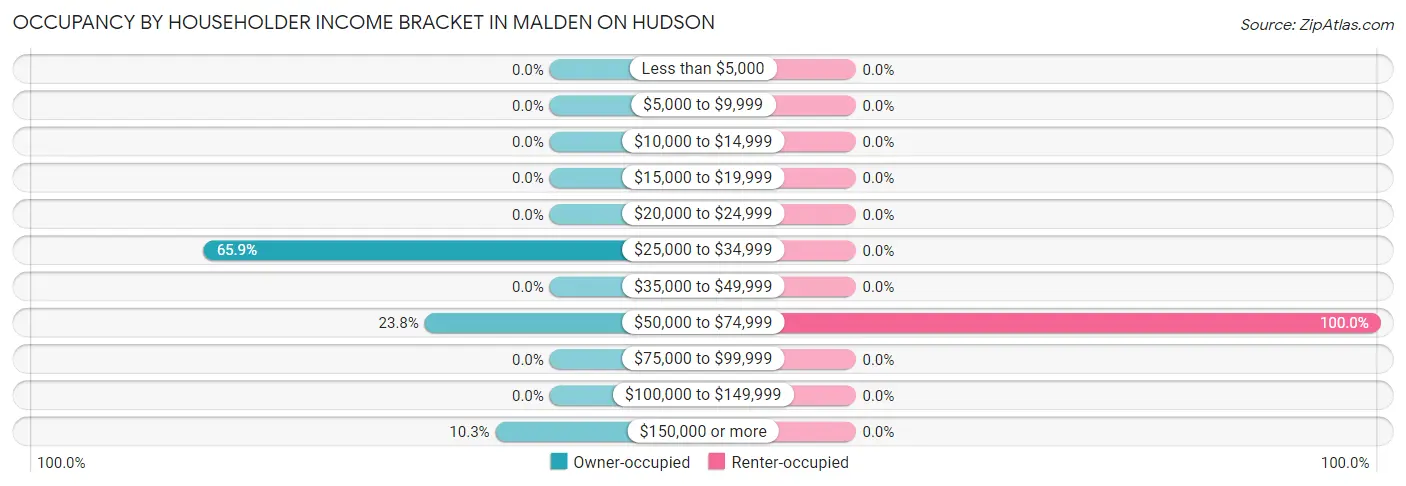
| Income Bracket | Owner-occupied | Renter-occupied |
| Less than $5,000 | 0 (0.0%) | 0 (0.0%) |
| $5,000 to $9,999 | 0 (0.0%) | 0 (0.0%) |
| $10,000 to $14,999 | 0 (0.0%) | 0 (0.0%) |
| $15,000 to $19,999 | 0 (0.0%) | 0 (0.0%) |
| $20,000 to $24,999 | 0 (0.0%) | 0 (0.0%) |
| $25,000 to $34,999 | 83 (65.9%) | 0 (0.0%) |
| $35,000 to $49,999 | 0 (0.0%) | 0 (0.0%) |
| $50,000 to $74,999 | 30 (23.8%) | 13 (100.0%) |
| $75,000 to $99,999 | 0 (0.0%) | 0 (0.0%) |
| $100,000 to $149,999 | 0 (0.0%) | 0 (0.0%) |
| $150,000 or more | 13 (10.3%) | 0 (0.0%) |
| Total | 126 (100.0%) | 13 (100.0%) |
Monthly Housing Cost Tiers in Malden On Hudson
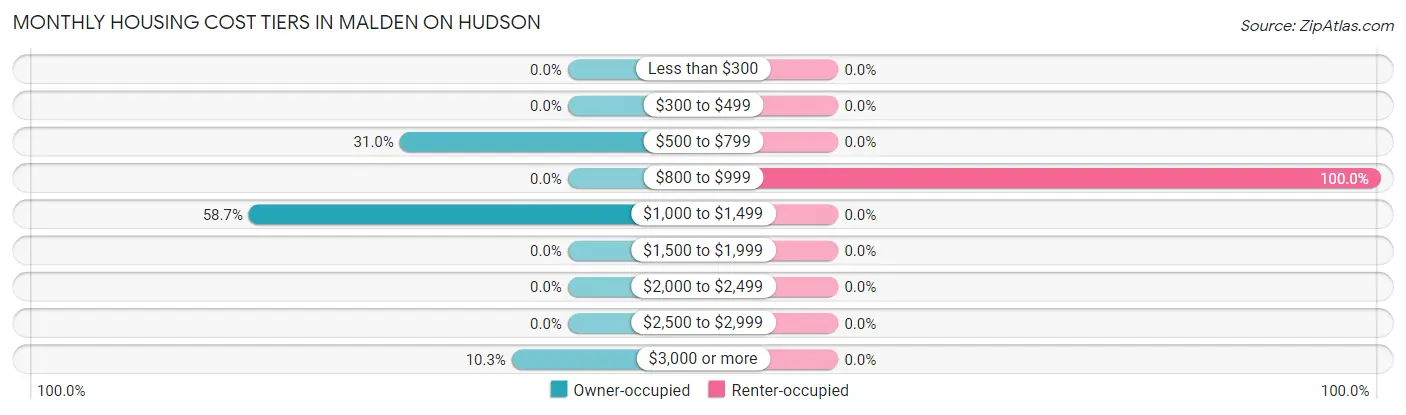
| Monthly Cost | Owner-occupied | Renter-occupied |
| Less than $300 | 0 (0.0%) | 0 (0.0%) |
| $300 to $499 | 0 (0.0%) | 0 (0.0%) |
| $500 to $799 | 39 (30.9%) | 0 (0.0%) |
| $800 to $999 | 0 (0.0%) | 13 (100.0%) |
| $1,000 to $1,499 | 74 (58.7%) | 0 (0.0%) |
| $1,500 to $1,999 | 0 (0.0%) | 0 (0.0%) |
| $2,000 to $2,499 | 0 (0.0%) | 0 (0.0%) |
| $2,500 to $2,999 | 0 (0.0%) | 0 (0.0%) |
| $3,000 or more | 13 (10.3%) | 0 (0.0%) |
| Total | 126 (100.0%) | 13 (100.0%) |
Physical Housing Characteristics in Malden On Hudson
Housing Structures in Malden On Hudson
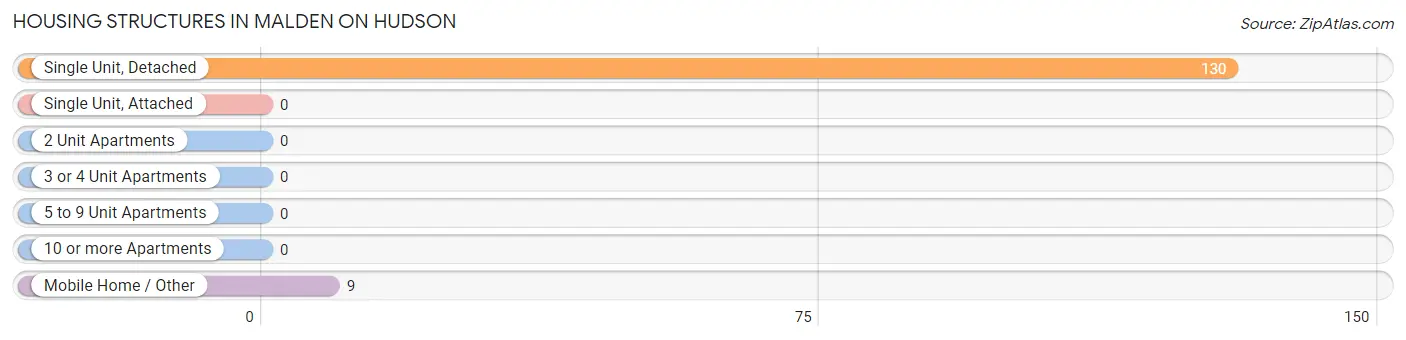
| Structure Type | # Housing Units | % Housing Units |
| Single Unit, Detached | 130 | 93.5% |
| Single Unit, Attached | 0 | 0.0% |
| 2 Unit Apartments | 0 | 0.0% |
| 3 or 4 Unit Apartments | 0 | 0.0% |
| 5 to 9 Unit Apartments | 0 | 0.0% |
| 10 or more Apartments | 0 | 0.0% |
| Mobile Home / Other | 9 | 6.5% |
| Total | 139 | 100.0% |
Housing Structures by Occupancy in Malden On Hudson
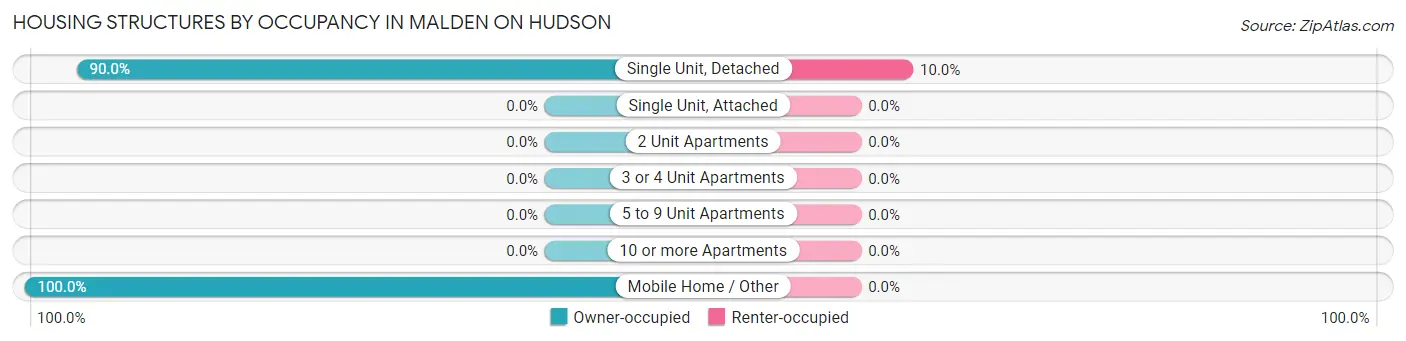
| Structure Type | Owner-occupied | Renter-occupied |
| Single Unit, Detached | 117 (90.0%) | 13 (10.0%) |
| Single Unit, Attached | 0 (0.0%) | 0 (0.0%) |
| 2 Unit Apartments | 0 (0.0%) | 0 (0.0%) |
| 3 or 4 Unit Apartments | 0 (0.0%) | 0 (0.0%) |
| 5 to 9 Unit Apartments | 0 (0.0%) | 0 (0.0%) |
| 10 or more Apartments | 0 (0.0%) | 0 (0.0%) |
| Mobile Home / Other | 9 (100.0%) | 0 (0.0%) |
| Total | 126 (90.6%) | 13 (9.3%) |
Housing Structures by Number of Rooms in Malden On Hudson
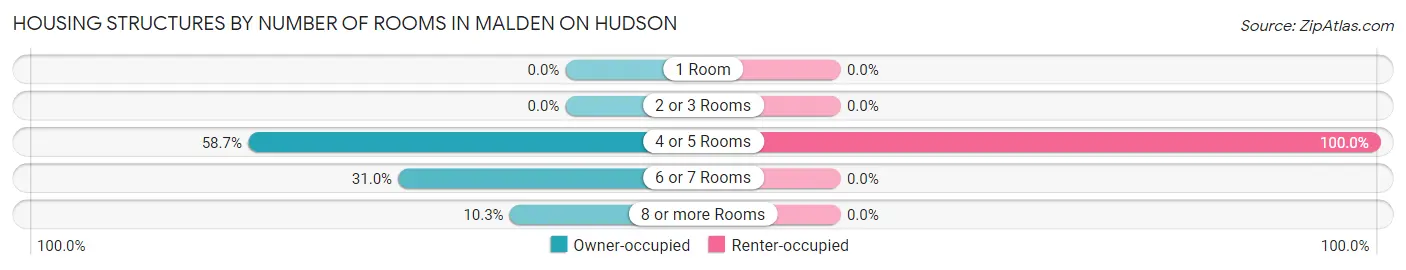
| Number of Rooms | Owner-occupied | Renter-occupied |
| 1 Room | 0 (0.0%) | 0 (0.0%) |
| 2 or 3 Rooms | 0 (0.0%) | 0 (0.0%) |
| 4 or 5 Rooms | 74 (58.7%) | 13 (100.0%) |
| 6 or 7 Rooms | 39 (30.9%) | 0 (0.0%) |
| 8 or more Rooms | 13 (10.3%) | 0 (0.0%) |
| Total | 126 (100.0%) | 13 (100.0%) |
Housing Structure by Heating Type in Malden On Hudson
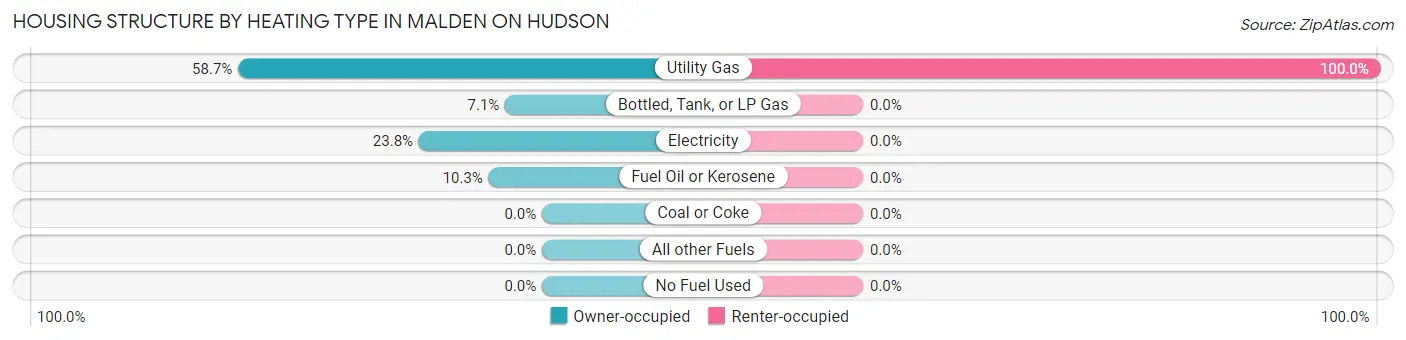
| Heating Type | Owner-occupied | Renter-occupied |
| Utility Gas | 74 (58.7%) | 13 (100.0%) |
| Bottled, Tank, or LP Gas | 9 (7.1%) | 0 (0.0%) |
| Electricity | 30 (23.8%) | 0 (0.0%) |
| Fuel Oil or Kerosene | 13 (10.3%) | 0 (0.0%) |
| Coal or Coke | 0 (0.0%) | 0 (0.0%) |
| All other Fuels | 0 (0.0%) | 0 (0.0%) |
| No Fuel Used | 0 (0.0%) | 0 (0.0%) |
| Total | 126 (100.0%) | 13 (100.0%) |
Household Vehicle Usage in Malden On Hudson
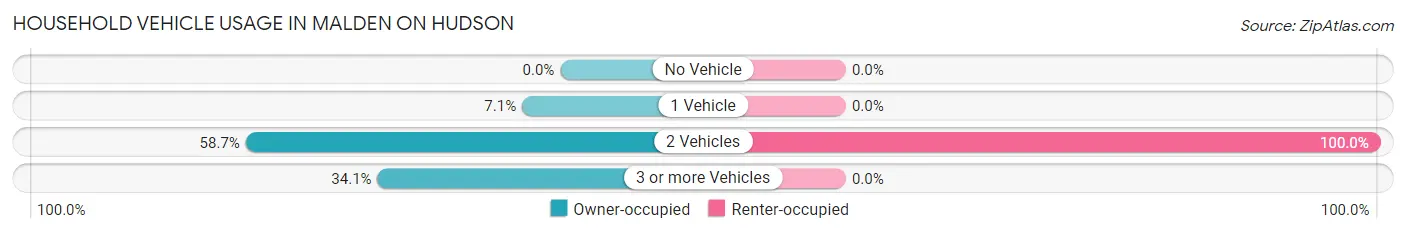
| Vehicles per Household | Owner-occupied | Renter-occupied |
| No Vehicle | 0 (0.0%) | 0 (0.0%) |
| 1 Vehicle | 9 (7.1%) | 0 (0.0%) |
| 2 Vehicles | 74 (58.7%) | 13 (100.0%) |
| 3 or more Vehicles | 43 (34.1%) | 0 (0.0%) |
| Total | 126 (100.0%) | 13 (100.0%) |
Real Estate & Mortgages in Malden On Hudson
Real Estate and Mortgage Overview in Malden On Hudson
| Characteristic | Without Mortgage | With Mortgage |
| Housing Units | 83 | 43 |
| Median Property Value | - | - |
| Median Household Income | - | - |
| Monthly Housing Costs | - | - |
| Real Estate Taxes | - | - |
Property Value by Mortgage Status in Malden On Hudson
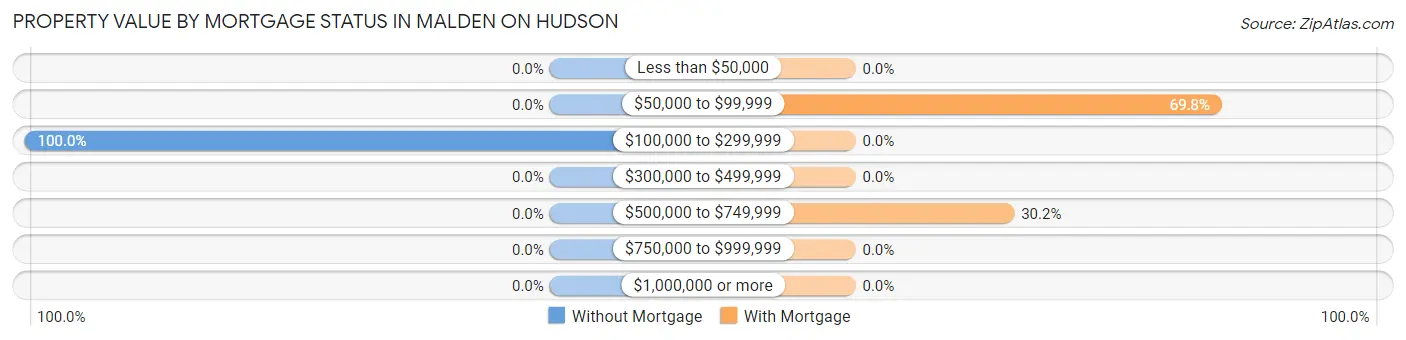
| Property Value | Without Mortgage | With Mortgage |
| Less than $50,000 | 0 (0.0%) | 0 (0.0%) |
| $50,000 to $99,999 | 0 (0.0%) | 30 (69.8%) |
| $100,000 to $299,999 | 83 (100.0%) | 0 (0.0%) |
| $300,000 to $499,999 | 0 (0.0%) | 0 (0.0%) |
| $500,000 to $749,999 | 0 (0.0%) | 13 (30.2%) |
| $750,000 to $999,999 | 0 (0.0%) | 0 (0.0%) |
| $1,000,000 or more | 0 (0.0%) | 0 (0.0%) |
| Total | 83 (100.0%) | 43 (100.0%) |
Household Income by Mortgage Status in Malden On Hudson
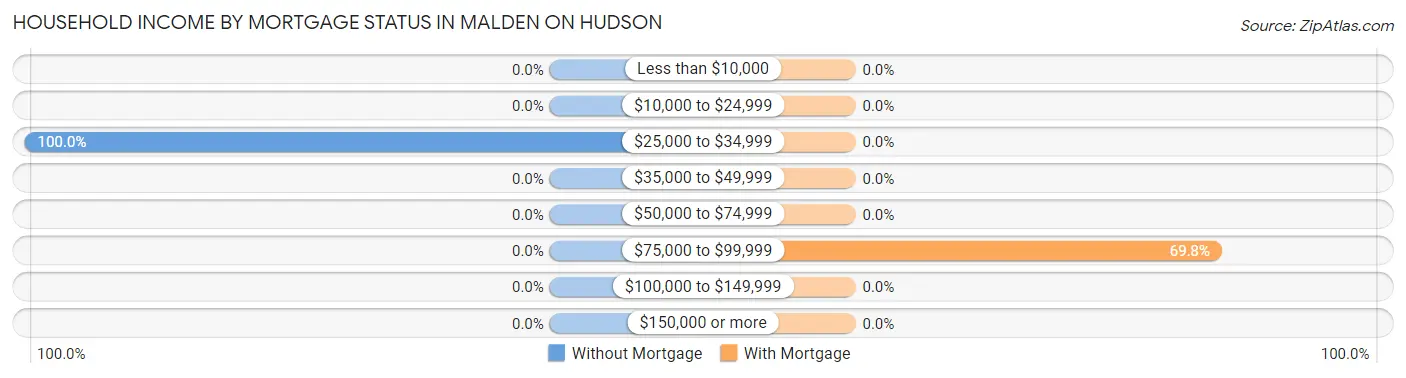
| Household Income | Without Mortgage | With Mortgage |
| Less than $10,000 | 0 (0.0%) | 0 (0.0%) |
| $10,000 to $24,999 | 0 (0.0%) | 0 (0.0%) |
| $25,000 to $34,999 | 83 (100.0%) | 0 (0.0%) |
| $35,000 to $49,999 | 0 (0.0%) | 0 (0.0%) |
| $50,000 to $74,999 | 0 (0.0%) | 0 (0.0%) |
| $75,000 to $99,999 | 0 (0.0%) | 30 (69.8%) |
| $100,000 to $149,999 | 0 (0.0%) | 0 (0.0%) |
| $150,000 or more | 0 (0.0%) | 0 (0.0%) |
| Total | 83 (100.0%) | 43 (100.0%) |
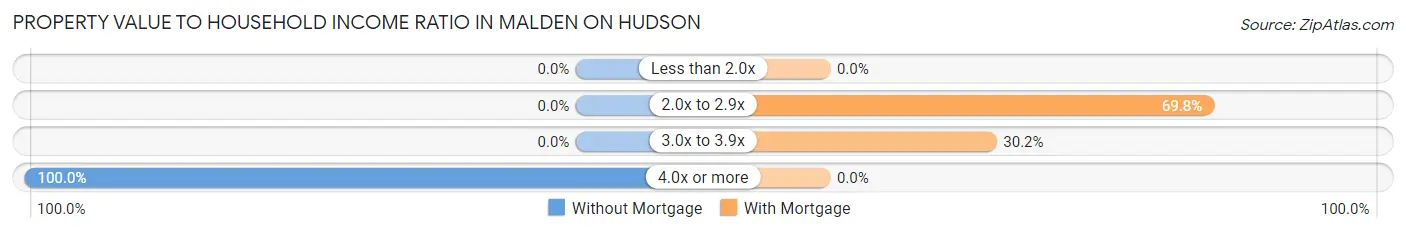
Property Value to Household Income Ratio in Malden On Hudson
| Value-to-Income Ratio | Without Mortgage | With Mortgage |
| Less than 2.0x | 0 (0.0%) | 0 (0.0%) |
| 2.0x to 2.9x | 0 (0.0%) | 30 (69.8%) |
| 3.0x to 3.9x | 0 (0.0%) | 13 (30.2%) |
| 4.0x or more | 83 (100.0%) | 0 (0.0%) |
| Total | 83 (100.0%) | 43 (100.0%) |
Real Estate Taxes by Mortgage Status in Malden On Hudson

| Property Taxes | Without Mortgage | With Mortgage |
| Less than $800 | 0 (0.0%) | 0 (0.0%) |
| $800 to $1,499 | 0 (0.0%) | 0 (0.0%) |
| $800 to $1,499 | 83 (100.0%) | 0 (0.0%) |
| Total | 83 (100.0%) | 43 (100.0%) |
Health & Disability in Malden On Hudson
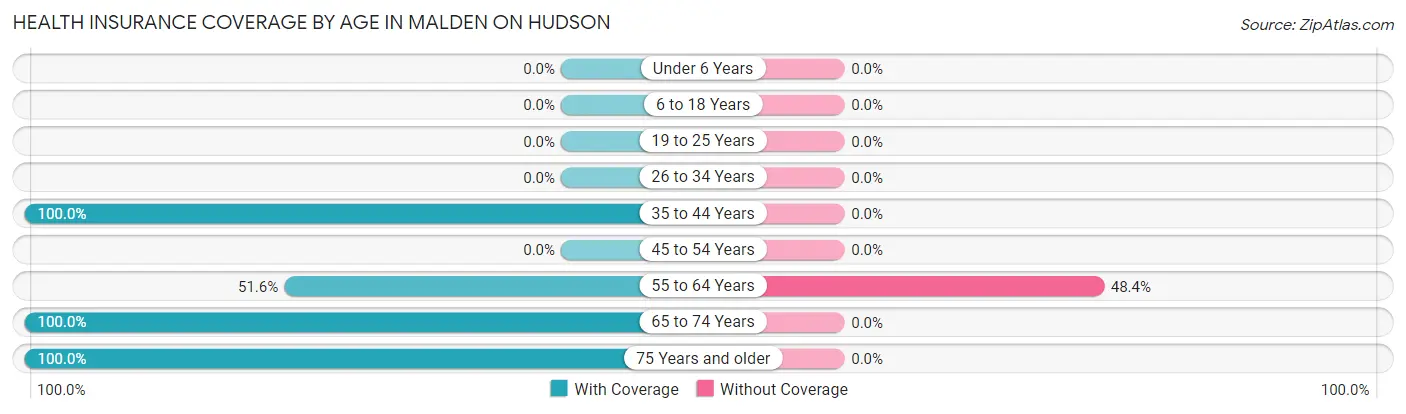
Health Insurance Coverage by Age in Malden On Hudson
| Age Bracket | With Coverage | Without Coverage |
| Under 6 Years | 0 (0.0%) | 0 (0.0%) |
| 6 to 18 Years | 0 (0.0%) | 0 (0.0%) |
| 19 to 25 Years | 0 (0.0%) | 0 (0.0%) |
| 26 to 34 Years | 0 (0.0%) | 0 (0.0%) |
| 35 to 44 Years | 33 (100.0%) | 0 (0.0%) |
| 45 to 54 Years | 0 (0.0%) | 0 (0.0%) |
| 55 to 64 Years | 32 (51.6%) | 30 (48.4%) |
| 65 to 74 Years | 26 (100.0%) | 0 (0.0%) |
| 75 Years and older | 200 (100.0%) | 0 (0.0%) |
| Total | 291 (90.6%) | 30 (9.3%) |
Health Insurance Coverage by Citizenship Status in Malden On Hudson

| Citizenship Status | With Coverage | Without Coverage |
| Native Born | 0 (0.0%) | 0 (0.0%) |
| Foreign Born, Citizen | 0 (0.0%) | 0 (0.0%) |
| Foreign Born, not a Citizen | 0 (0.0%) | 0 (0.0%) |
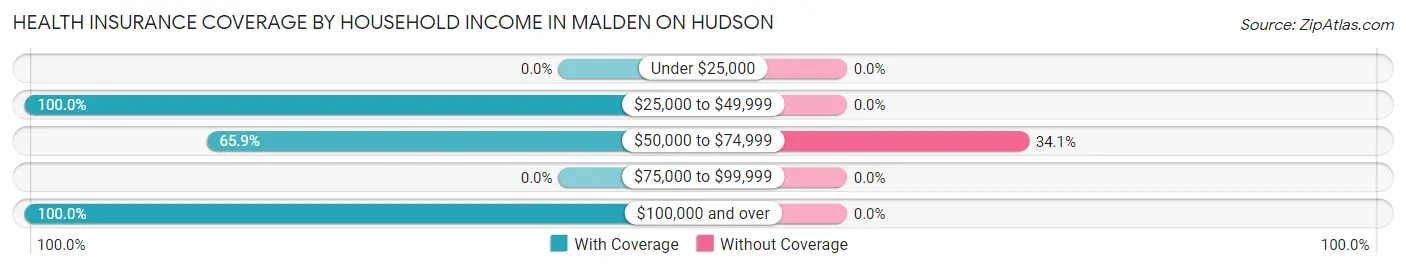
Health Insurance Coverage by Household Income in Malden On Hudson
| Household Income | With Coverage | Without Coverage |
| Under $25,000 | 0 (0.0%) | 0 (0.0%) |
| $25,000 to $49,999 | 200 (100.0%) | 0 (0.0%) |
| $50,000 to $74,999 | 58 (65.9%) | 30 (34.1%) |
| $75,000 to $99,999 | 0 (0.0%) | 0 (0.0%) |
| $100,000 and over | 33 (100.0%) | 0 (0.0%) |
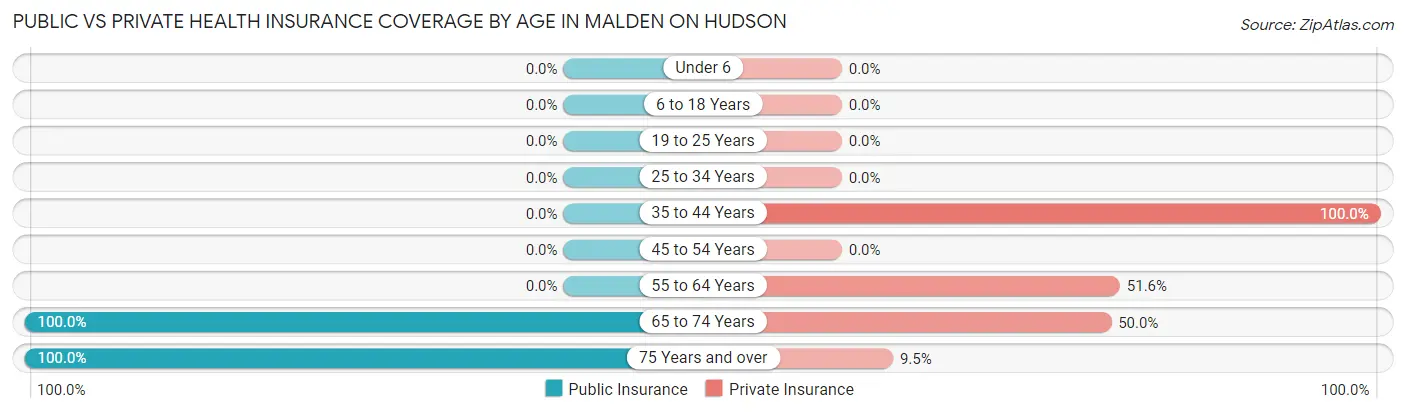
Public vs Private Health Insurance Coverage by Age in Malden On Hudson
| Age Bracket | Public Insurance | Private Insurance |
| Under 6 | 0 (0.0%) | 0 (0.0%) |
| 6 to 18 Years | 0 (0.0%) | 0 (0.0%) |
| 19 to 25 Years | 0 (0.0%) | 0 (0.0%) |
| 25 to 34 Years | 0 (0.0%) | 0 (0.0%) |
| 35 to 44 Years | 0 (0.0%) | 33 (100.0%) |
| 45 to 54 Years | 0 (0.0%) | 0 (0.0%) |
| 55 to 64 Years | 0 (0.0%) | 32 (51.6%) |
| 65 to 74 Years | 26 (100.0%) | 13 (50.0%) |
| 75 Years and over | 200 (100.0%) | 19 (9.5%) |
| Total | 226 (70.4%) | 97 (30.2%) |
Disability Status by Sex by Age in Malden On Hudson
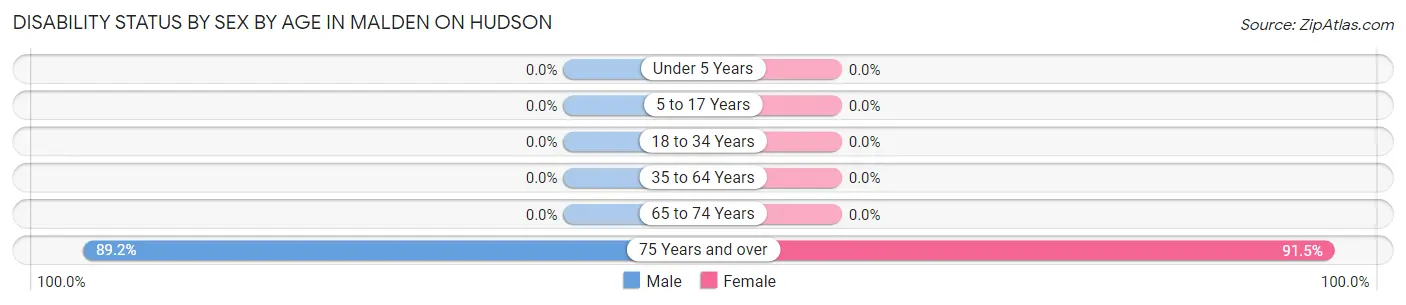
| Age Bracket | Male | Female |
| Under 5 Years | 0 (0.0%) | 0 (0.0%) |
| 5 to 17 Years | 0 (0.0%) | 0 (0.0%) |
| 18 to 34 Years | 0 (0.0%) | 0 (0.0%) |
| 35 to 64 Years | 0 (0.0%) | 0 (0.0%) |
| 65 to 74 Years | 0 (0.0%) | 0 (0.0%) |
| 75 Years and over | 74 (89.2%) | 107 (91.4%) |
Disability Class by Sex by Age in Malden On Hudson
Disability Class: Hearing Difficulty
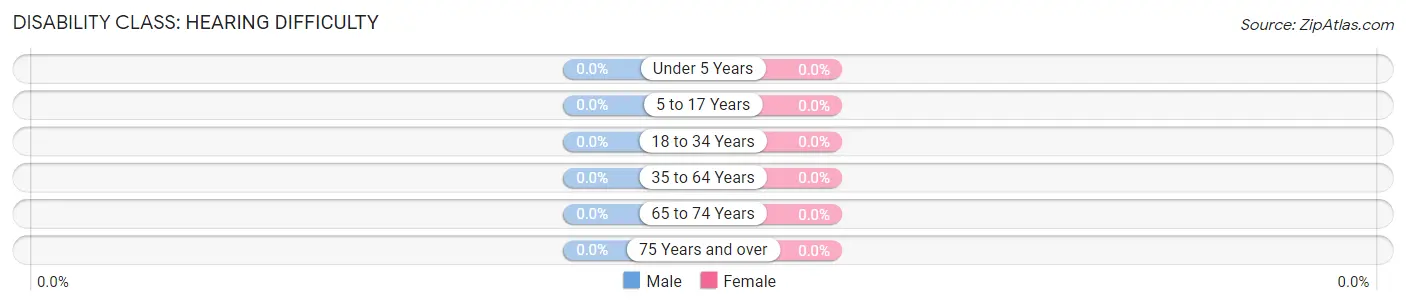
| Age Bracket | Male | Female |
| Under 5 Years | 0 (0.0%) | 0 (0.0%) |
| 5 to 17 Years | 0 (0.0%) | 0 (0.0%) |
| 18 to 34 Years | 0 (0.0%) | 0 (0.0%) |
| 35 to 64 Years | 0 (0.0%) | 0 (0.0%) |
| 65 to 74 Years | 0 (0.0%) | 0 (0.0%) |
| 75 Years and over | 0 (0.0%) | 0 (0.0%) |
Disability Class: Vision Difficulty
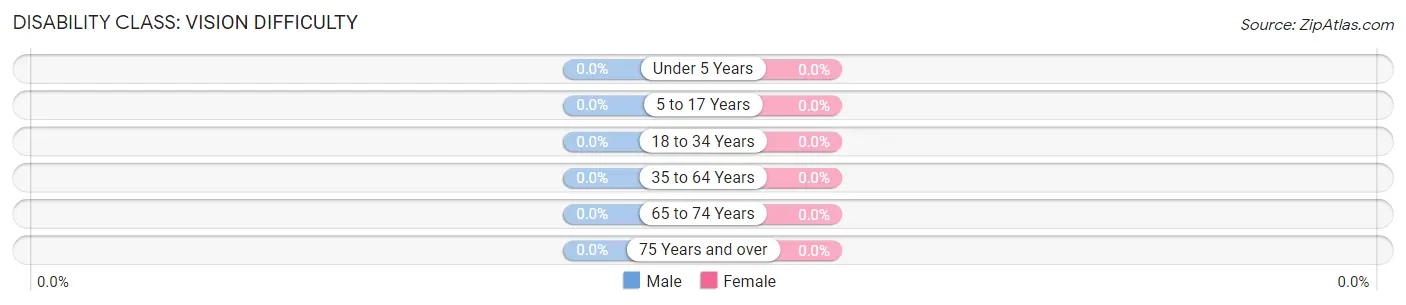
| Age Bracket | Male | Female |
| Under 5 Years | 0 (0.0%) | 0 (0.0%) |
| 5 to 17 Years | 0 (0.0%) | 0 (0.0%) |
| 18 to 34 Years | 0 (0.0%) | 0 (0.0%) |
| 35 to 64 Years | 0 (0.0%) | 0 (0.0%) |
| 65 to 74 Years | 0 (0.0%) | 0 (0.0%) |
| 75 Years and over | 0 (0.0%) | 0 (0.0%) |
Disability Class: Cognitive Difficulty
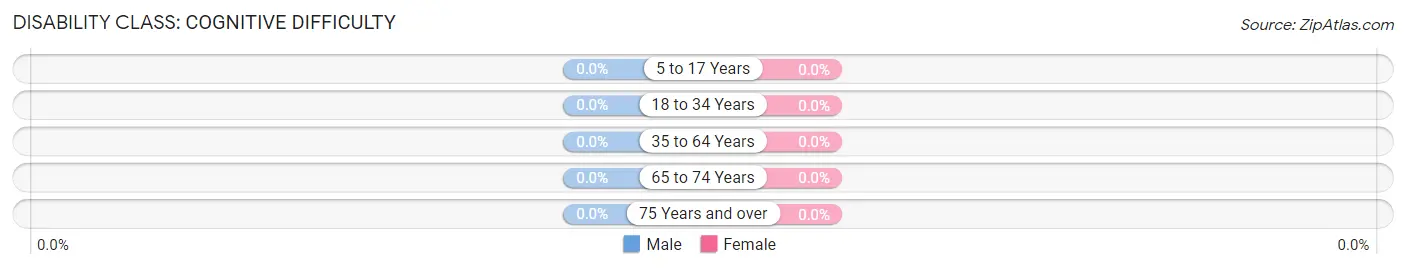
| Age Bracket | Male | Female |
| 5 to 17 Years | 0 (0.0%) | 0 (0.0%) |
| 18 to 34 Years | 0 (0.0%) | 0 (0.0%) |
| 35 to 64 Years | 0 (0.0%) | 0 (0.0%) |
| 65 to 74 Years | 0 (0.0%) | 0 (0.0%) |
| 75 Years and over | 0 (0.0%) | 0 (0.0%) |
Disability Class: Ambulatory Difficulty
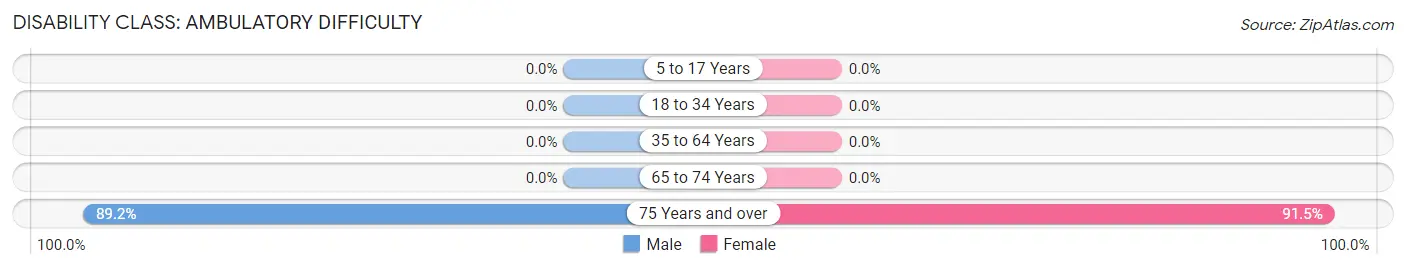
| Age Bracket | Male | Female |
| 5 to 17 Years | 0 (0.0%) | 0 (0.0%) |
| 18 to 34 Years | 0 (0.0%) | 0 (0.0%) |
| 35 to 64 Years | 0 (0.0%) | 0 (0.0%) |
| 65 to 74 Years | 0 (0.0%) | 0 (0.0%) |
| 75 Years and over | 74 (89.2%) | 107 (91.4%) |
Disability Class: Self-Care Difficulty

| Age Bracket | Male | Female |
| 5 to 17 Years | 0 (0.0%) | 0 (0.0%) |
| 18 to 34 Years | 0 (0.0%) | 0 (0.0%) |
| 35 to 64 Years | 0 (0.0%) | 0 (0.0%) |
| 65 to 74 Years | 0 (0.0%) | 0 (0.0%) |
| 75 Years and over | 0 (0.0%) | 107 (91.4%) |
Technology Access in Malden On Hudson
Computing Device Access in Malden On Hudson
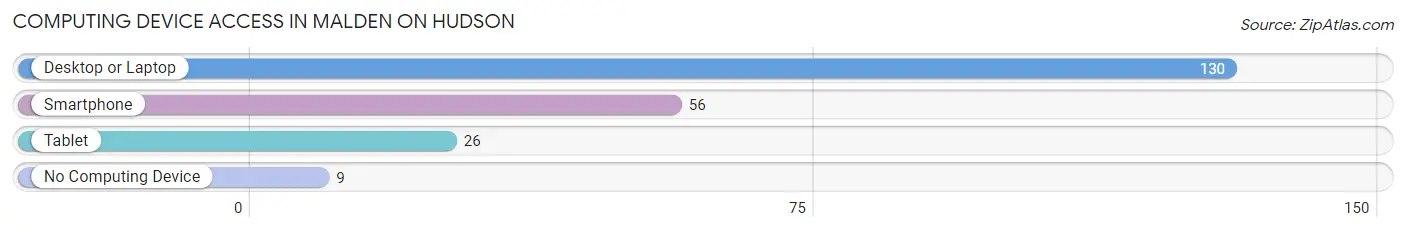
| Device Type | # Households | % Households |
| Desktop or Laptop | 130 | 93.5% |
| Smartphone | 56 | 40.3% |
| Tablet | 26 | 18.7% |
| No Computing Device | 9 | 6.5% |
| Total | 139 | 100.0% |
Internet Access in Malden On Hudson
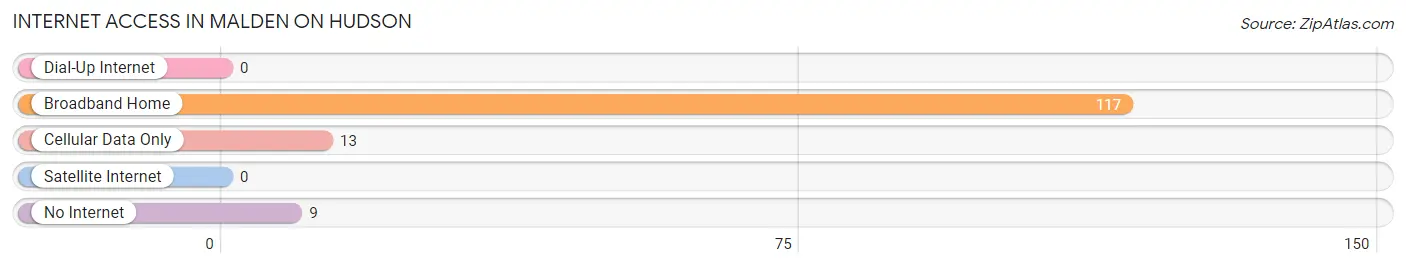
| Internet Type | # Households | % Households |
| Dial-Up Internet | 0 | 0.0% |
| Broadband Home | 117 | 84.2% |
| Cellular Data Only | 13 | 9.3% |
| Satellite Internet | 0 | 0.0% |
| No Internet | 9 | 6.5% |
| Total | 139 | 100.0% |
Malden On Hudson Summary
Malden On Hudson is a small hamlet located in the town of Esopus in Ulster County, New York. It is situated on the west bank of the Hudson River, approximately two miles south of the city of Kingston. The hamlet is home to a population of approximately 500 people and is a popular destination for tourists and outdoor enthusiasts.
Geography
Malden On Hudson is located in the Hudson Valley region of New York State. It is situated on the west bank of the Hudson River, approximately two miles south of the city of Kingston. The hamlet is bordered by the towns of Esopus to the north, Hurley to the east, and Saugerties to the south. The hamlet is located in the Catskill Mountains and is surrounded by rolling hills and forests. The climate in the area is generally mild, with temperatures ranging from the low 30s in the winter to the mid-80s in the summer.
History
Malden On Hudson was first settled in the late 1700s by Dutch and German immigrants. The hamlet was originally known as “Malden” and was part of the town of Esopus. In 1812, the hamlet was renamed “Malden On Hudson” to distinguish it from other towns in the area. The hamlet was a popular destination for tourists in the late 1800s and early 1900s, and was home to several resorts and hotels. In the mid-1900s, the hamlet began to decline in popularity as a tourist destination and the resorts and hotels closed.
Economy
Malden On Hudson is a small, rural community with a limited economy. The hamlet is home to several small businesses, including a grocery store, a hardware store, and a few restaurants. The hamlet is also home to a few small farms, which produce a variety of fruits and vegetables. The hamlet is also home to a few small manufacturing companies, which produce a variety of products, including furniture and clothing.
Demographics
As of the 2010 census, the population of Malden On Hudson was 498. The racial makeup of the hamlet was 94.2% White, 2.2% African American, 0.2% Native American, 0.8% Asian, 0.2% Pacific Islander, and 2.4% from other races. The median household income in the hamlet was $45,000, and the median age was 44.
Conclusion
Malden On Hudson is a small hamlet located in the town of Esopus in Ulster County, New York. It is situated on the west bank of the Hudson River, approximately two miles south of the city of Kingston. The hamlet is home to a population of approximately 500 people and is a popular destination for tourists and outdoor enthusiasts. The hamlet is home to several small businesses, including a grocery store, a hardware store, and a few restaurants. The hamlet is also home to a few small farms, which produce a variety of fruits and vegetables. The hamlet is also home to a few small manufacturing companies, which produce a variety of products, including furniture and clothing. The racial makeup of the hamlet was 94.2% White, 2.2% African American, 0.2% Native American, 0.8% Asian, 0.2% Pacific Islander, and 2.4% from other races. The median household income in the hamlet was $45,000, and the median age was 44.
Common Questions
What is Per Capita Income in Malden On Hudson?
Per Capita income in Malden On Hudson is $32,612.
What is Inequality or Gini Index in Malden On Hudson?
Inequality or Gini Index in Malden On Hudson is 0.44.
What is the Total Population of Malden On Hudson?
Total Population of Malden On Hudson is 321.
What is the Total Male Population of Malden On Hudson?
Total Male Population of Malden On Hudson is 178.
What is the Total Female Population of Malden On Hudson?
Total Female Population of Malden On Hudson is 143.
What is the Ratio of Males per 100 Females in Malden On Hudson?
There are 124.48 Males per 100 Females in Malden On Hudson.
What is the Ratio of Females per 100 Males in Malden On Hudson?
There are 80.34 Females per 100 Males in Malden On Hudson.
What is the Median Population Age in Malden On Hudson?
Median Population Age in Malden On Hudson is 82.2 Years.
What is the Average Family Size in Malden On Hudson
Average Family Size in Malden On Hudson is 2.3 People.
What is the Average Household Size in Malden On Hudson
Average Household Size in Malden On Hudson is 2.3 People.
How Large is the Labor Force in Malden On Hudson?
There are 121 People in the Labor Forcein in Malden On Hudson.
What is the Percentage of People in the Labor Force in Malden On Hudson?
37.7% of People are in the Labor Force in Malden On Hudson.