Wanakah, NY Map & Demographics
Wanakah Map
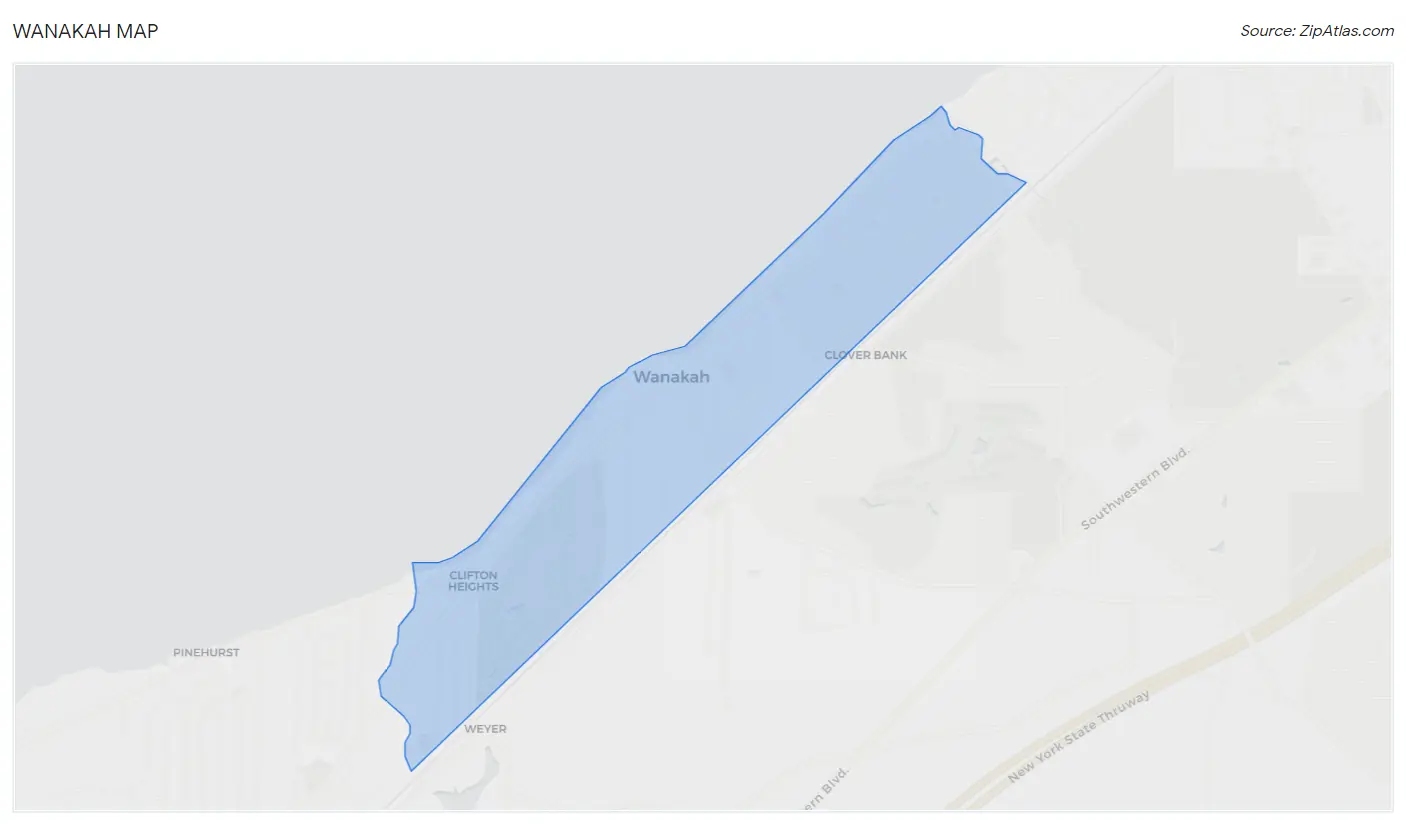
Wanakah Overview
$39,641
PER CAPITA INCOME
$74,333
AVG FAMILY INCOME
$72,614
AVG HOUSEHOLD INCOME
30.4%
WAGE / INCOME GAP [ % ]
69.6¢/ $1
WAGE / INCOME GAP [ $ ]
0.37
INEQUALITY / GINI INDEX
3,158
TOTAL POPULATION
1,368
MALE POPULATION
1,790
FEMALE POPULATION
76.42
MALES / 100 FEMALES
130.85
FEMALES / 100 MALES
47.4
MEDIAN AGE
2.8
AVG FAMILY SIZE
2.4
AVG HOUSEHOLD SIZE
1,641
LABOR FORCE [ PEOPLE ]
63.2%
PERCENT IN LABOR FORCE
3.1%
UNEMPLOYMENT RATE
Income in Wanakah
Income Overview in Wanakah
Per Capita Income in Wanakah is $39,641, while median incomes of families and households are $74,333 and $72,614 respectively.
| Characteristic | Number | Measure |
| Per Capita Income | 3,158 | $39,641 |
| Median Family Income | 892 | $74,333 |
| Mean Family Income | 892 | $98,283 |
| Median Household Income | 1,342 | $72,614 |
| Mean Household Income | 1,342 | $92,351 |
| Income Deficit | 892 | $0 |
| Wage / Income Gap (%) | 3,158 | 30.44% |
| Wage / Income Gap ($) | 3,158 | 69.56¢ per $1 |
| Gini / Inequality Index | 3,158 | 0.37 |
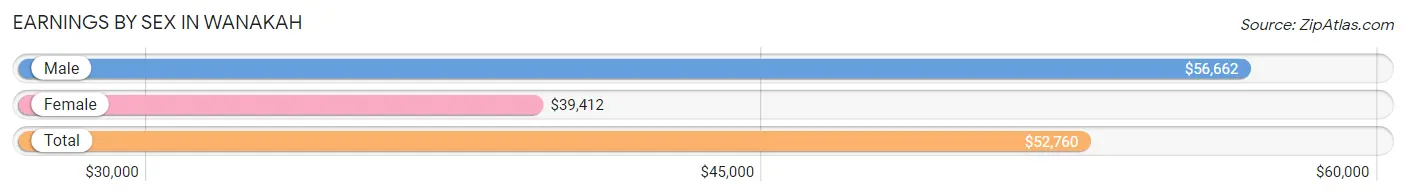
Earnings by Sex in Wanakah
Average Earnings in Wanakah are $52,760, $56,662 for men and $39,412 for women, a difference of 30.4%.
| Sex | Number | Average Earnings |
| Male | 827 (50.1%) | $56,662 |
| Female | 824 (49.9%) | $39,412 |
| Total | 1,651 (100.0%) | $52,760 |
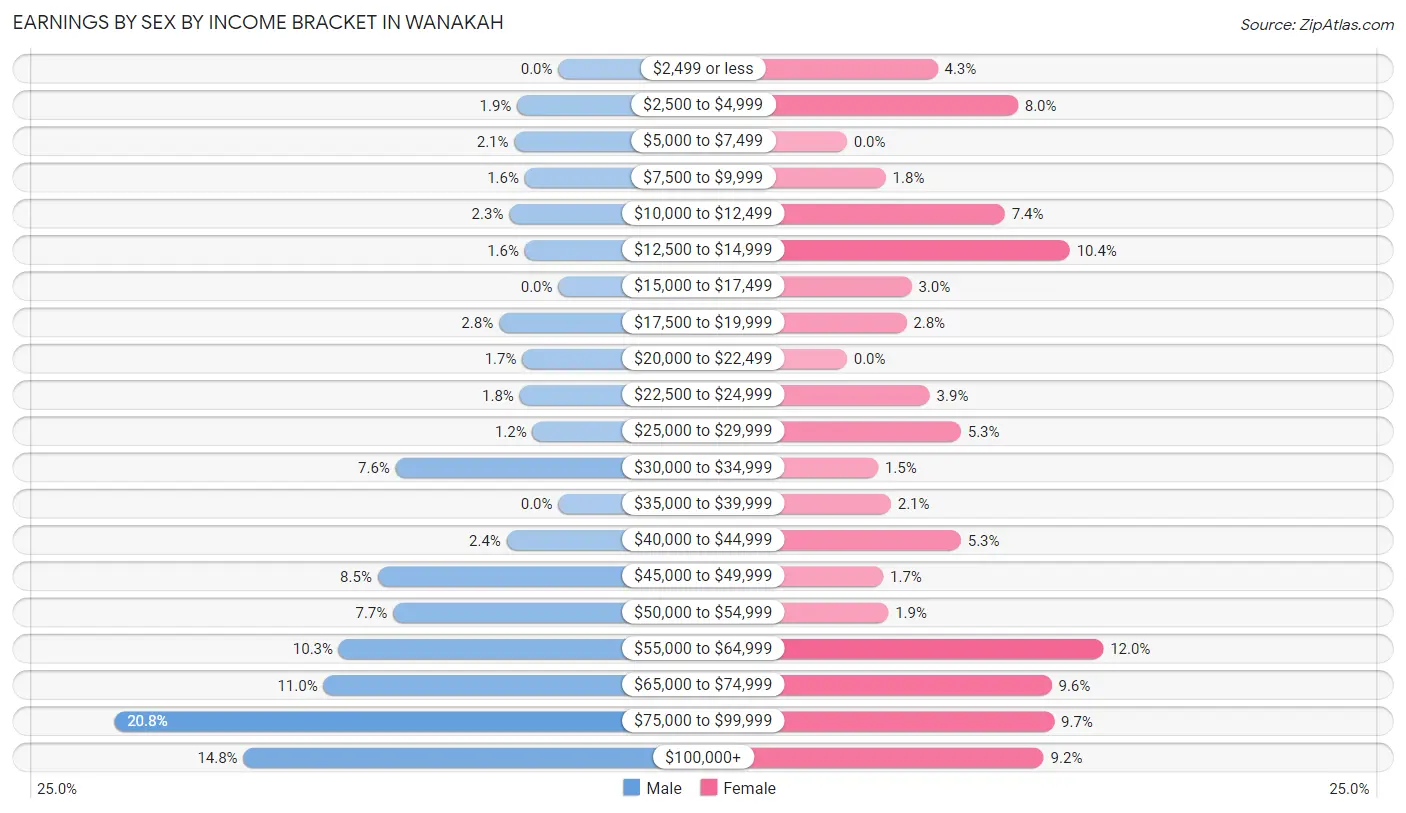
Earnings by Sex by Income Bracket in Wanakah
The most common earnings brackets in Wanakah are $75,000 to $99,999 for men (172 | 20.8%) and $55,000 to $64,999 for women (99 | 12.0%).
| Income | Male | Female |
| $2,499 or less | 0 (0.0%) | 35 (4.3%) |
| $2,500 to $4,999 | 16 (1.9%) | 66 (8.0%) |
| $5,000 to $7,499 | 17 (2.1%) | 0 (0.0%) |
| $7,500 to $9,999 | 13 (1.6%) | 15 (1.8%) |
| $10,000 to $12,499 | 19 (2.3%) | 61 (7.4%) |
| $12,500 to $14,999 | 13 (1.6%) | 86 (10.4%) |
| $15,000 to $17,499 | 0 (0.0%) | 25 (3.0%) |
| $17,500 to $19,999 | 23 (2.8%) | 23 (2.8%) |
| $20,000 to $22,499 | 14 (1.7%) | 0 (0.0%) |
| $22,500 to $24,999 | 15 (1.8%) | 32 (3.9%) |
| $25,000 to $29,999 | 10 (1.2%) | 44 (5.3%) |
| $30,000 to $34,999 | 63 (7.6%) | 12 (1.5%) |
| $35,000 to $39,999 | 0 (0.0%) | 17 (2.1%) |
| $40,000 to $44,999 | 20 (2.4%) | 44 (5.3%) |
| $45,000 to $49,999 | 70 (8.5%) | 14 (1.7%) |
| $50,000 to $54,999 | 64 (7.7%) | 16 (1.9%) |
| $55,000 to $64,999 | 85 (10.3%) | 99 (12.0%) |
| $65,000 to $74,999 | 91 (11.0%) | 79 (9.6%) |
| $75,000 to $99,999 | 172 (20.8%) | 80 (9.7%) |
| $100,000+ | 122 (14.7%) | 76 (9.2%) |
| Total | 827 (100.0%) | 824 (100.0%) |
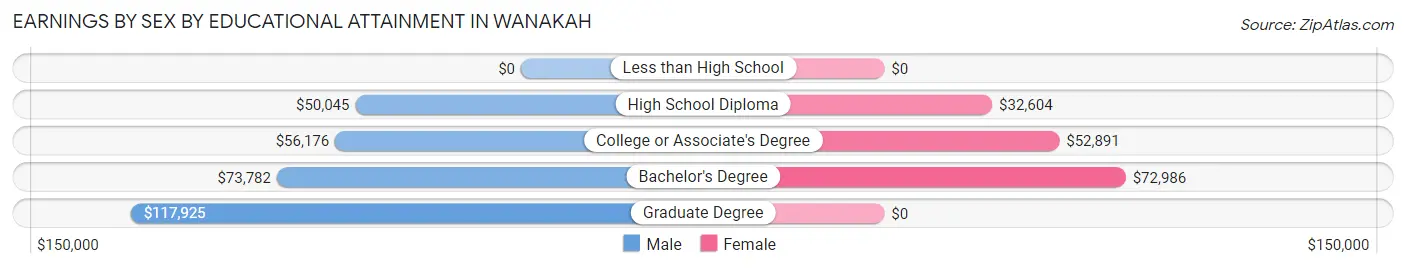
Earnings by Sex by Educational Attainment in Wanakah
Average earnings in Wanakah are $57,132 for men and $50,000 for women, a difference of 12.5%. Men with an educational attainment of graduate degree enjoy the highest average annual earnings of $117,925, while those with high school diploma education earn the least with $50,045. Women with an educational attainment of bachelor's degree earn the most with the average annual earnings of $72,986, while those with high school diploma education have the smallest earnings of $32,604.
| Educational Attainment | Male Income | Female Income |
| Less than High School | - | - |
| High School Diploma | $50,045 | $32,604 |
| College or Associate's Degree | $56,176 | $52,891 |
| Bachelor's Degree | $73,782 | $72,986 |
| Graduate Degree | $117,925 | $0 |
| Total | $57,132 | $50,000 |
Family Income in Wanakah
Family Income Brackets in Wanakah
According to the Wanakah family income data, there are 228 families falling into the $50,000 to $74,999 income range, which is the most common income bracket and makes up 25.6% of all families.
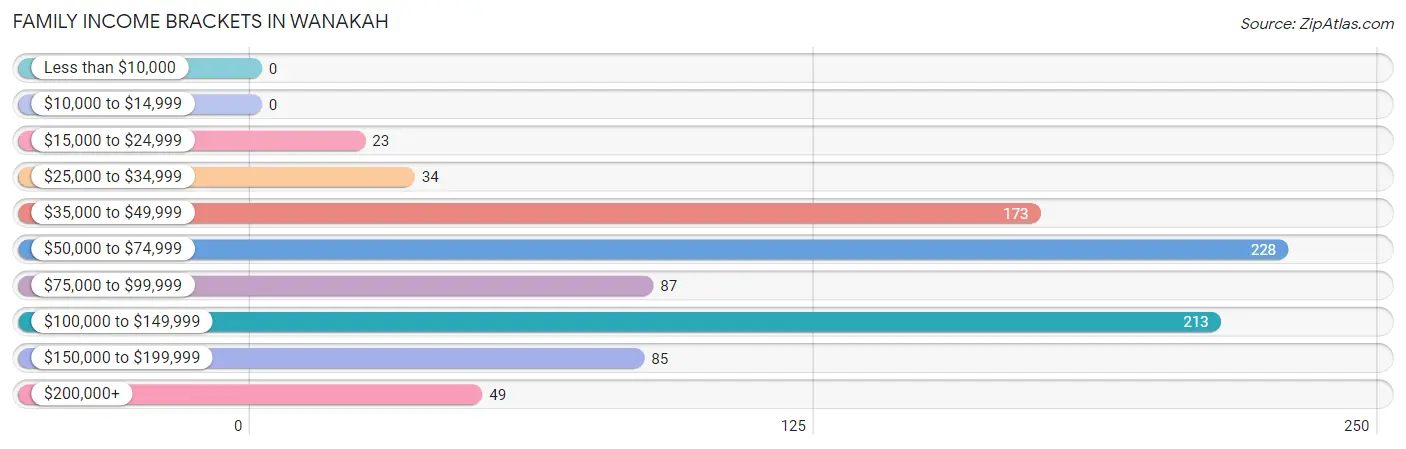
| Income Bracket | # Families | % Families |
| Less than $10,000 | 0 | 0.0% |
| $10,000 to $14,999 | 0 | 0.0% |
| $15,000 to $24,999 | 23 | 2.6% |
| $25,000 to $34,999 | 34 | 3.8% |
| $35,000 to $49,999 | 173 | 19.4% |
| $50,000 to $74,999 | 228 | 25.6% |
| $75,000 to $99,999 | 87 | 9.8% |
| $100,000 to $149,999 | 213 | 23.9% |
| $150,000 to $199,999 | 85 | 9.5% |
| $200,000+ | 49 | 5.5% |
Family Income by Famaliy Size in Wanakah
4-person families (108 | 12.1%) account for the highest median family income in Wanakah with $123,138 per family, while 2-person families (492 | 55.2%) have the highest median income of $33,934 per family member.
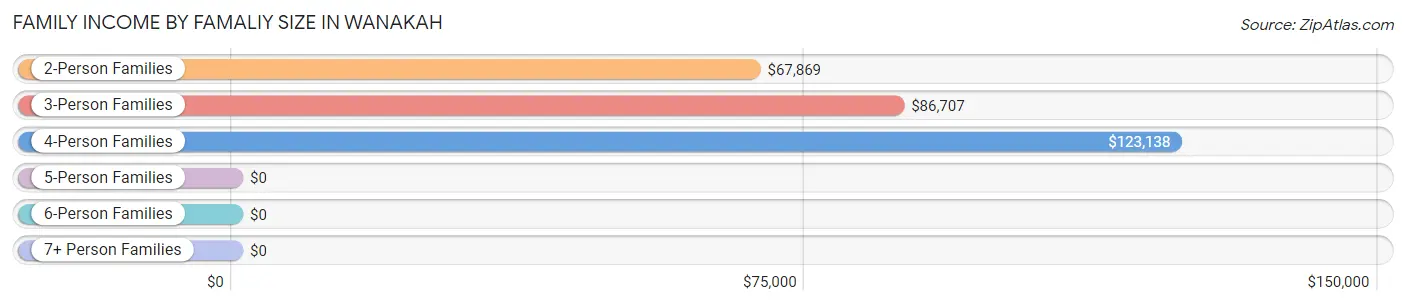
| Income Bracket | # Families | Median Income |
| 2-Person Families | 492 (55.2%) | $67,869 |
| 3-Person Families | 230 (25.8%) | $86,707 |
| 4-Person Families | 108 (12.1%) | $123,138 |
| 5-Person Families | 32 (3.6%) | $0 |
| 6-Person Families | 20 (2.2%) | $0 |
| 7+ Person Families | 10 (1.1%) | $0 |
| Total | 892 (100.0%) | $74,333 |
Family Income by Number of Earners in Wanakah
The median family income in Wanakah is $74,333, with families comprising 2 earners (274) having the highest median family income of $133,750, while families with 1 earner (382) have the lowest median family income of $50,862, accounting for 30.7% and 42.8% of families, respectively.
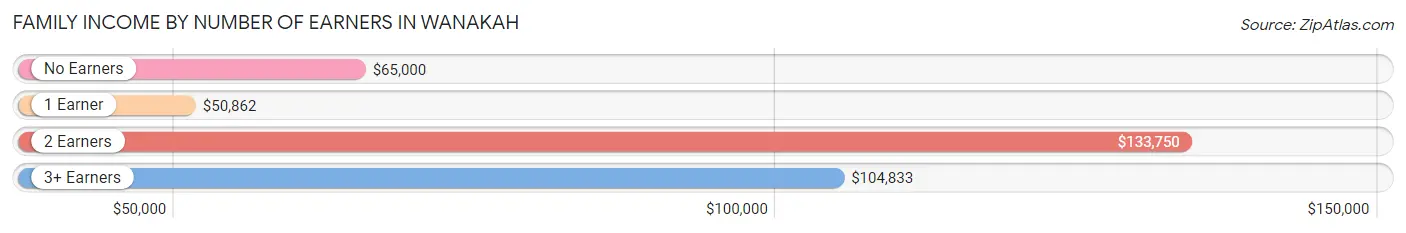
| Number of Earners | # Families | Median Income |
| No Earners | 126 (14.1%) | $65,000 |
| 1 Earner | 382 (42.8%) | $50,862 |
| 2 Earners | 274 (30.7%) | $133,750 |
| 3+ Earners | 110 (12.3%) | $104,833 |
| Total | 892 (100.0%) | $74,333 |
Household Income in Wanakah
Household Income Brackets in Wanakah
With 309 households falling in the category, the $50,000 to $74,999 income range is the most frequent in Wanakah, accounting for 23.0% of all households.
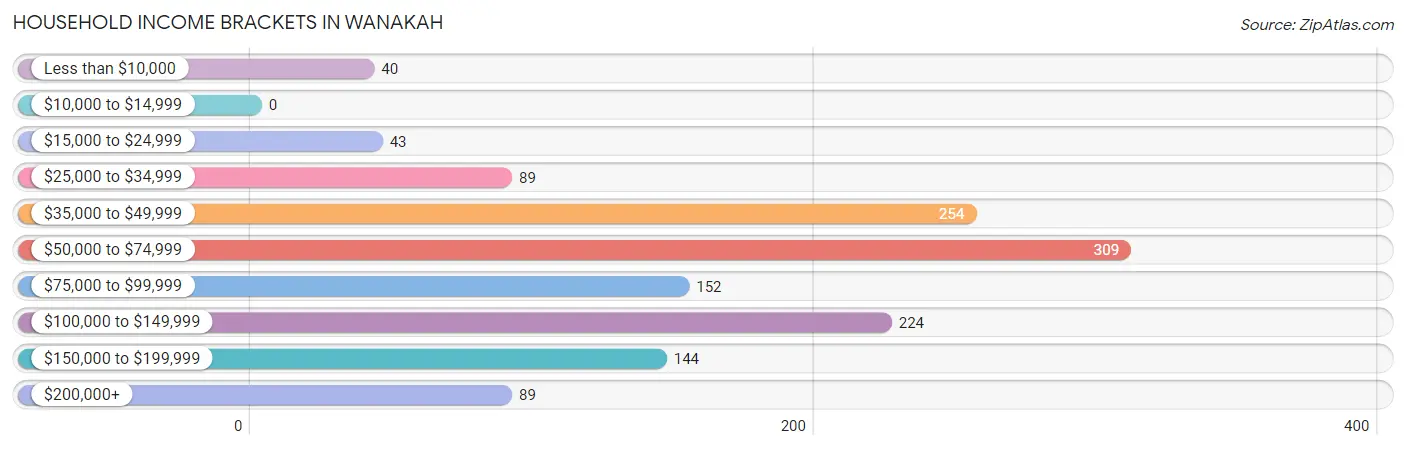
| Income Bracket | # Households | % Households |
| Less than $10,000 | 40 | 3.0% |
| $10,000 to $14,999 | 0 | 0.0% |
| $15,000 to $24,999 | 43 | 3.2% |
| $25,000 to $34,999 | 89 | 6.6% |
| $35,000 to $49,999 | 254 | 18.9% |
| $50,000 to $74,999 | 309 | 23.0% |
| $75,000 to $99,999 | 152 | 11.3% |
| $100,000 to $149,999 | 224 | 16.7% |
| $150,000 to $199,999 | 144 | 10.7% |
| $200,000+ | 89 | 6.6% |
Household Income by Householder Age in Wanakah
The median household income in Wanakah is $72,614, with the highest median household income of $89,464 found in the 45 to 64 years age bracket for the primary householder. A total of 589 households (43.9%) fall into this category.
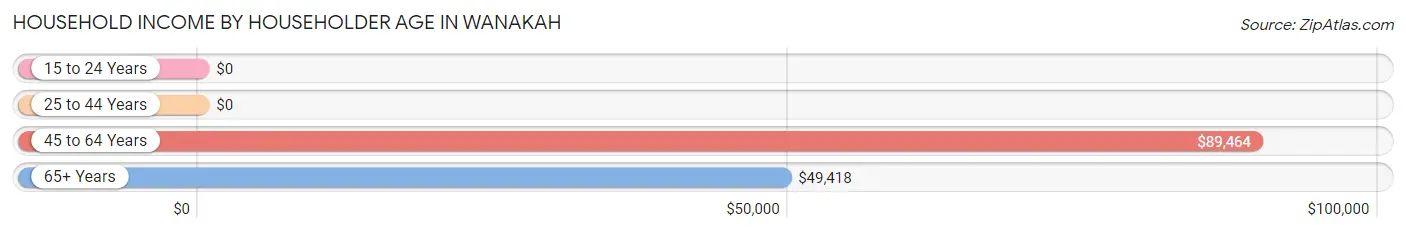
| Income Bracket | # Households | Median Income |
| 15 to 24 Years | 0 (0.0%) | $0 |
| 25 to 44 Years | 254 (18.9%) | $0 |
| 45 to 64 Years | 589 (43.9%) | $89,464 |
| 65+ Years | 499 (37.2%) | $49,418 |
| Total | 1,342 (100.0%) | $72,614 |
Poverty in Wanakah
Income Below Poverty by Sex and Age in Wanakah
With 0.9% poverty level for males and 8.6% for females among the residents of Wanakah, 45 to 54 year old males and 25 to 34 year old females are the most vulnerable to poverty, with 13 males (6.1%) and 68 females (36.4%) in their respective age groups living below the poverty level.
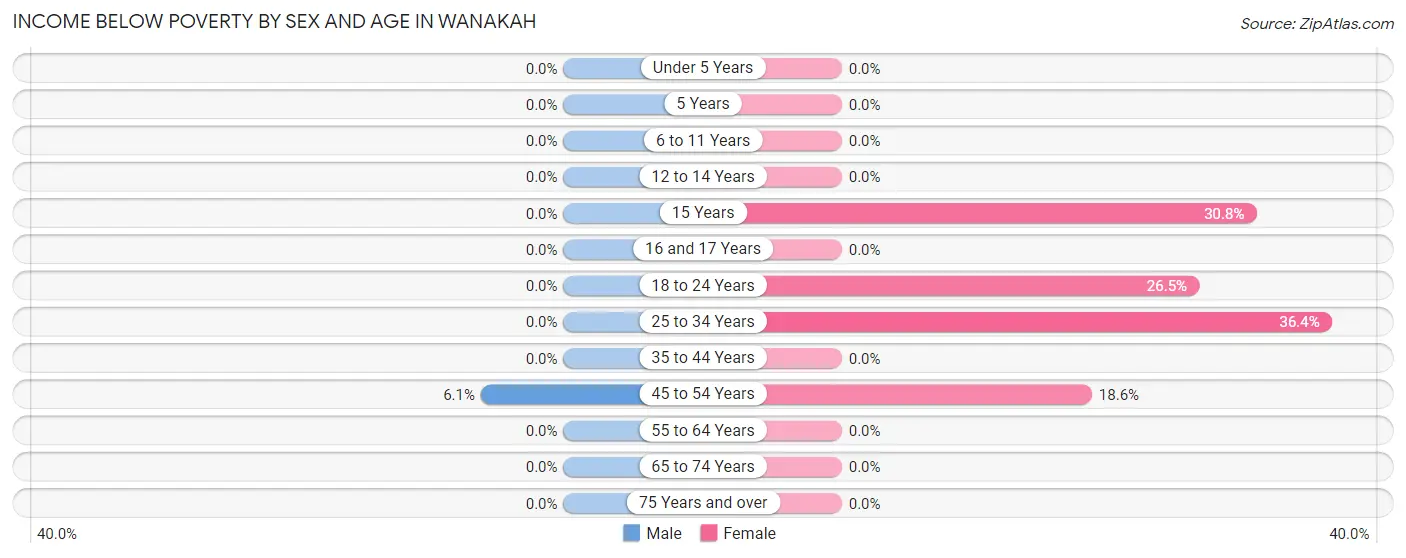
| Age Bracket | Male | Female |
| Under 5 Years | 0 (0.0%) | 0 (0.0%) |
| 5 Years | 0 (0.0%) | 0 (0.0%) |
| 6 to 11 Years | 0 (0.0%) | 0 (0.0%) |
| 12 to 14 Years | 0 (0.0%) | 0 (0.0%) |
| 15 Years | 0 (0.0%) | 12 (30.8%) |
| 16 and 17 Years | 0 (0.0%) | 0 (0.0%) |
| 18 to 24 Years | 0 (0.0%) | 22 (26.5%) |
| 25 to 34 Years | 0 (0.0%) | 68 (36.4%) |
| 35 to 44 Years | 0 (0.0%) | 0 (0.0%) |
| 45 to 54 Years | 13 (6.1%) | 52 (18.6%) |
| 55 to 64 Years | 0 (0.0%) | 0 (0.0%) |
| 65 to 74 Years | 0 (0.0%) | 0 (0.0%) |
| 75 Years and over | 0 (0.0%) | 0 (0.0%) |
| Total | 13 (0.9%) | 154 (8.6%) |
Income Above Poverty by Sex and Age in Wanakah
According to the poverty statistics in Wanakah, males aged under 5 years and females aged under 5 years are the age groups that are most secure financially, with 100.0% of males and 100.0% of females in these age groups living above the poverty line.
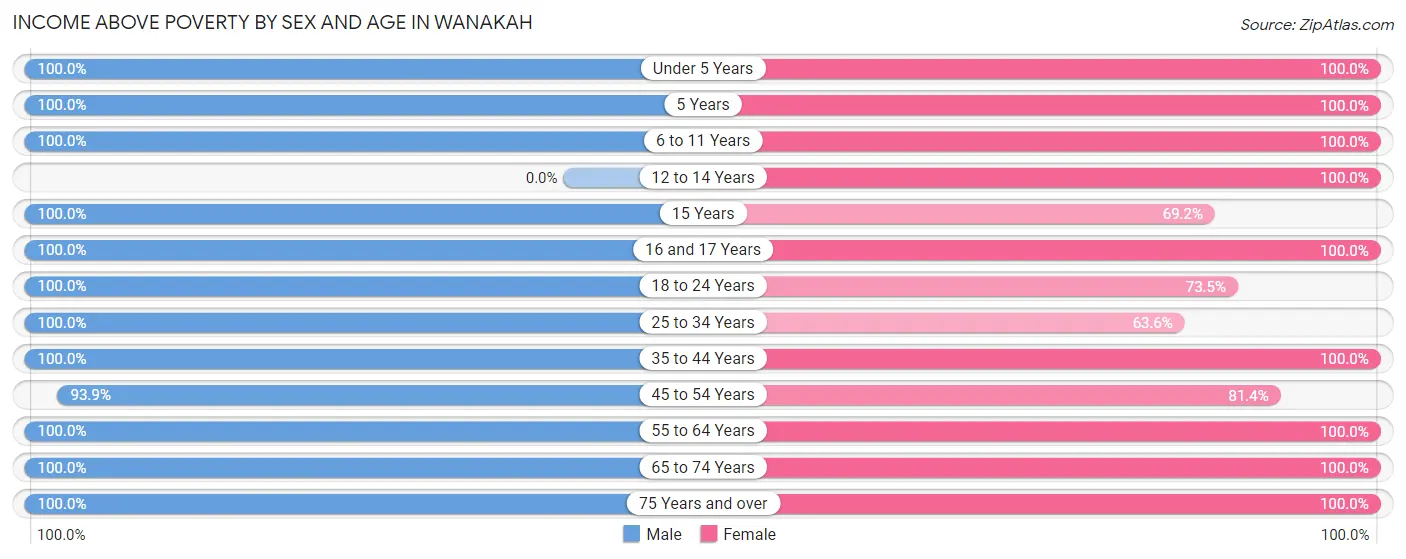
| Age Bracket | Male | Female |
| Under 5 Years | 136 (100.0%) | 106 (100.0%) |
| 5 Years | 20 (100.0%) | 69 (100.0%) |
| 6 to 11 Years | 31 (100.0%) | 136 (100.0%) |
| 12 to 14 Years | 0 (0.0%) | 15 (100.0%) |
| 15 Years | 9 (100.0%) | 27 (69.2%) |
| 16 and 17 Years | 17 (100.0%) | 54 (100.0%) |
| 18 to 24 Years | 107 (100.0%) | 61 (73.5%) |
| 25 to 34 Years | 175 (100.0%) | 119 (63.6%) |
| 35 to 44 Years | 112 (100.0%) | 154 (100.0%) |
| 45 to 54 Years | 199 (93.9%) | 228 (81.4%) |
| 55 to 64 Years | 376 (100.0%) | 199 (100.0%) |
| 65 to 74 Years | 115 (100.0%) | 383 (100.0%) |
| 75 Years and over | 58 (100.0%) | 85 (100.0%) |
| Total | 1,355 (99.1%) | 1,636 (91.4%) |
Income Below Poverty Among Married-Couple Families in Wanakah
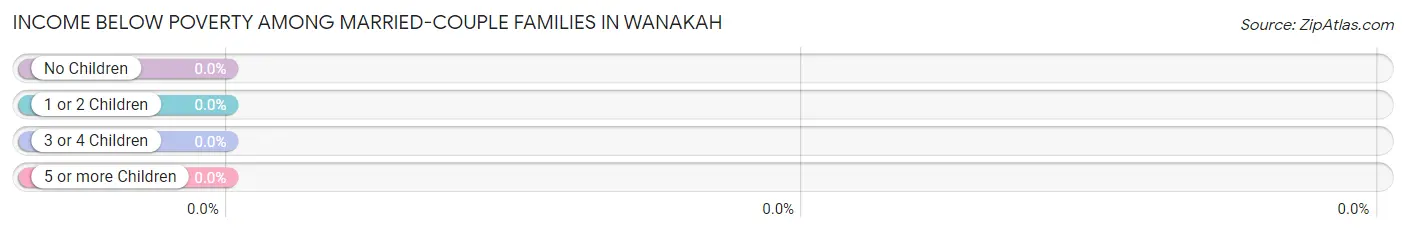
| Children | Above Poverty | Below Poverty |
| No Children | 342 (100.0%) | 0 (0.0%) |
| 1 or 2 Children | 171 (100.0%) | 0 (0.0%) |
| 3 or 4 Children | 62 (100.0%) | 0 (0.0%) |
| 5 or more Children | 0 (0.0%) | 0 (0.0%) |
| Total | 575 (100.0%) | 0 (0.0%) |
Income Below Poverty Among Single-Parent Households in Wanakah
| Children | Single Father | Single Mother |
| No Children | 0 (0.0%) | 0 (0.0%) |
| 1 or 2 Children | 0 (0.0%) | 0 (0.0%) |
| 3 or 4 Children | 0 (0.0%) | 0 (0.0%) |
| 5 or more Children | 0 (0.0%) | 0 (0.0%) |
| Total | 0 (0.0%) | 0 (0.0%) |
Income Below Poverty Among Married-Couple vs Single-Parent Households in Wanakah
| Children | Married-Couple Families | Single-Parent Households |
| No Children | 0 (0.0%) | 0 (0.0%) |
| 1 or 2 Children | 0 (0.0%) | 0 (0.0%) |
| 3 or 4 Children | 0 (0.0%) | 0 (0.0%) |
| 5 or more Children | 0 (0.0%) | 0 (0.0%) |
| Total | 0 (0.0%) | 0 (0.0%) |
Race in Wanakah
The most populous races in Wanakah are White / Caucasian (3,148 | 99.7%), and Two or more Races (10 | 0.3%).
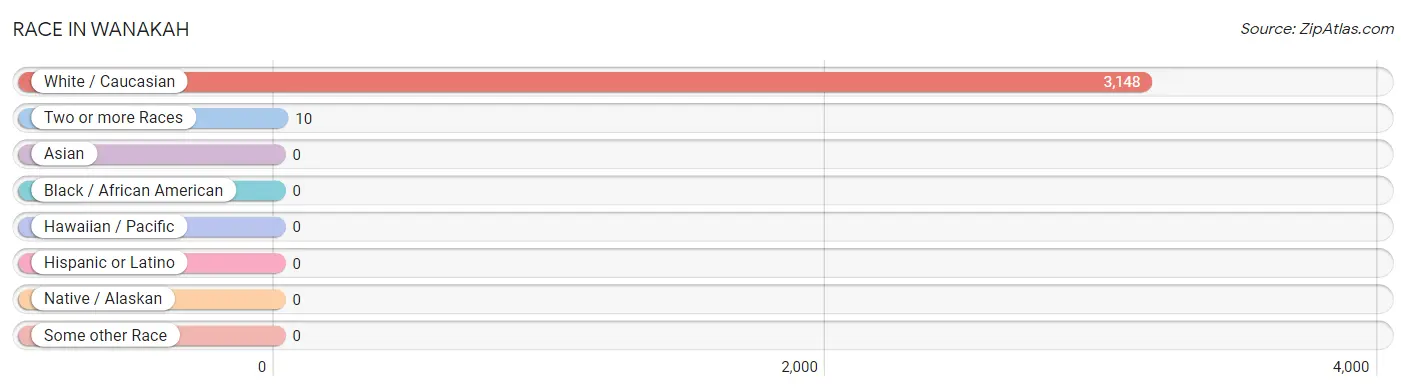
| Race | # Population | % Population |
| Asian | 0 | 0.0% |
| Black / African American | 0 | 0.0% |
| Hawaiian / Pacific | 0 | 0.0% |
| Hispanic or Latino | 0 | 0.0% |
| Native / Alaskan | 0 | 0.0% |
| White / Caucasian | 3,148 | 99.7% |
| Two or more Races | 10 | 0.3% |
| Some other Race | 0 | 0.0% |
| Total | 3,158 | 100.0% |
Ancestry in Wanakah
The most populous ancestries reported in Wanakah are German (934 | 29.6%), Polish (823 | 26.1%), Irish (768 | 24.3%), Italian (765 | 24.2%), and English (231 | 7.3%), together accounting for 111.5% of all Wanakah residents.
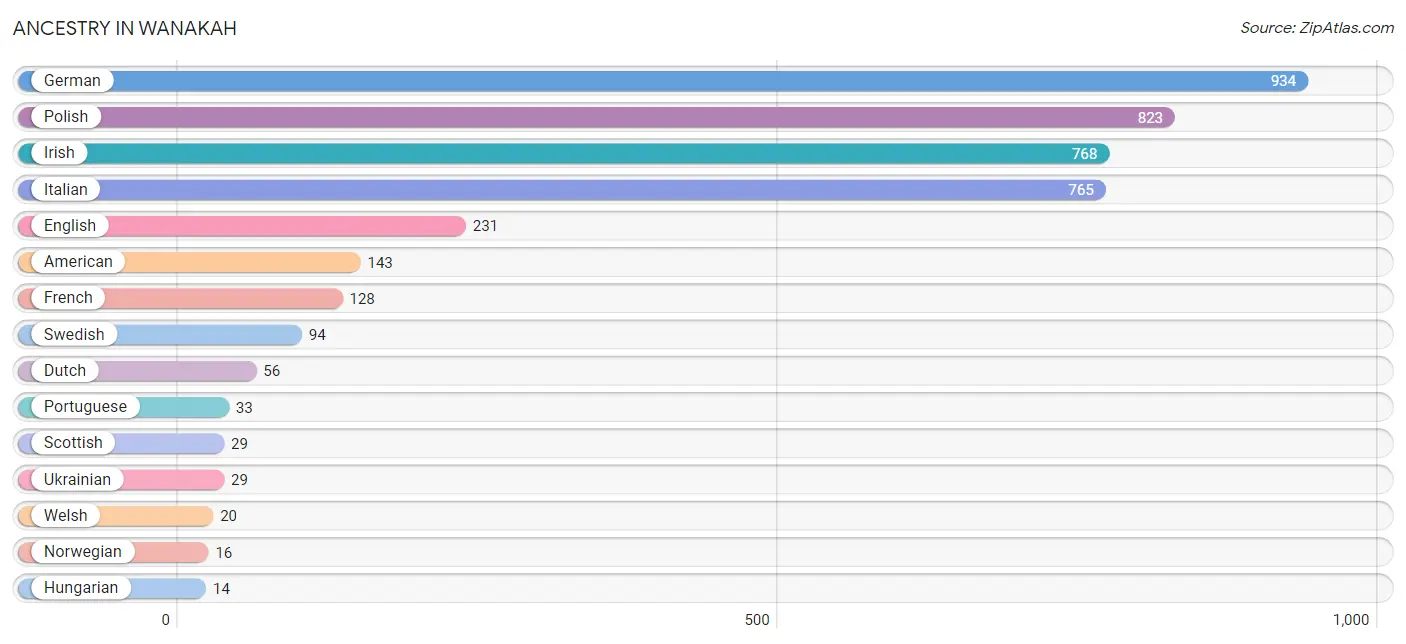
| Ancestry | # Population | % Population |
| American | 143 | 4.5% |
| Armenian | 10 | 0.3% |
| Canadian | 11 | 0.4% |
| Dutch | 56 | 1.8% |
| English | 231 | 7.3% |
| French | 128 | 4.1% |
| German | 934 | 29.6% |
| Hungarian | 14 | 0.4% |
| Irish | 768 | 24.3% |
| Italian | 765 | 24.2% |
| Norwegian | 16 | 0.5% |
| Polish | 823 | 26.1% |
| Portuguese | 33 | 1.0% |
| Russian | 14 | 0.4% |
| Scotch-Irish | 9 | 0.3% |
| Scottish | 29 | 0.9% |
| Swedish | 94 | 3.0% |
| Ukrainian | 29 | 0.9% |
| Welsh | 20 | 0.6% | View All 19 Rows |
Immigrants in Wanakah
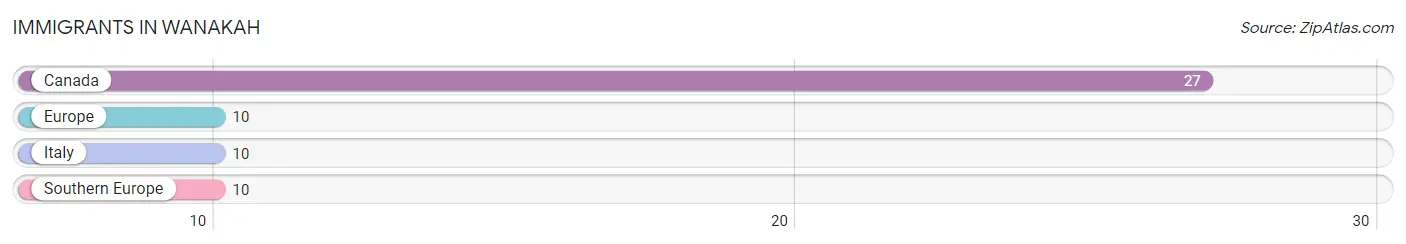
The most numerous immigrant groups reported in Wanakah came from Canada (27 | 0.9%), Europe (10 | 0.3%), Italy (10 | 0.3%), and Southern Europe (10 | 0.3%), together accounting for 1.8% of all Wanakah residents.
| Immigration Origin | # Population | % Population |
| Canada | 27 | 0.9% |
| Europe | 10 | 0.3% |
| Italy | 10 | 0.3% |
| Southern Europe | 10 | 0.3% | View All 4 Rows |
Sex and Age in Wanakah
Sex and Age in Wanakah
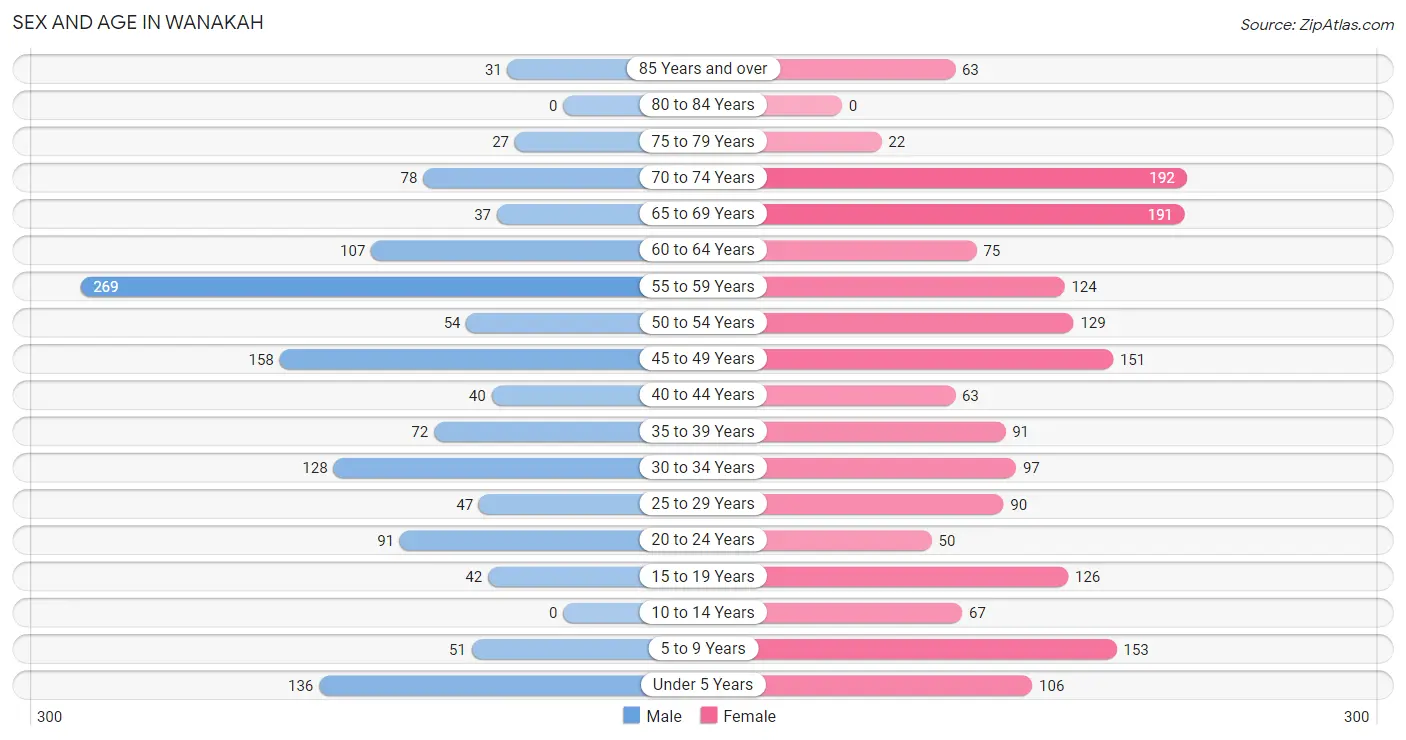
The most populous age groups in Wanakah are 55 to 59 Years (269 | 19.7%) for men and 70 to 74 Years (192 | 10.7%) for women.
| Age Bracket | Male | Female |
| Under 5 Years | 136 (9.9%) | 106 (5.9%) |
| 5 to 9 Years | 51 (3.7%) | 153 (8.6%) |
| 10 to 14 Years | 0 (0.0%) | 67 (3.7%) |
| 15 to 19 Years | 42 (3.1%) | 126 (7.0%) |
| 20 to 24 Years | 91 (6.7%) | 50 (2.8%) |
| 25 to 29 Years | 47 (3.4%) | 90 (5.0%) |
| 30 to 34 Years | 128 (9.4%) | 97 (5.4%) |
| 35 to 39 Years | 72 (5.3%) | 91 (5.1%) |
| 40 to 44 Years | 40 (2.9%) | 63 (3.5%) |
| 45 to 49 Years | 158 (11.6%) | 151 (8.4%) |
| 50 to 54 Years | 54 (4.0%) | 129 (7.2%) |
| 55 to 59 Years | 269 (19.7%) | 124 (6.9%) |
| 60 to 64 Years | 107 (7.8%) | 75 (4.2%) |
| 65 to 69 Years | 37 (2.7%) | 191 (10.7%) |
| 70 to 74 Years | 78 (5.7%) | 192 (10.7%) |
| 75 to 79 Years | 27 (2.0%) | 22 (1.2%) |
| 80 to 84 Years | 0 (0.0%) | 0 (0.0%) |
| 85 Years and over | 31 (2.3%) | 63 (3.5%) |
| Total | 1,368 (100.0%) | 1,790 (100.0%) |
Families and Households in Wanakah
Median Family Size in Wanakah
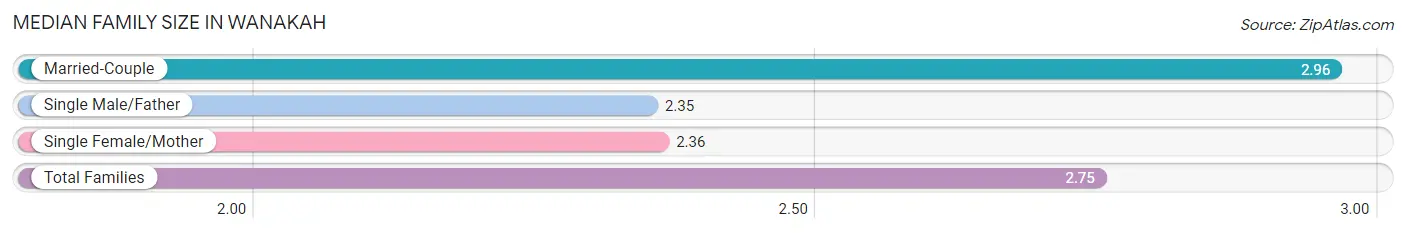
The median family size in Wanakah is 2.75 persons per family, with married-couple families (575 | 64.5%) accounting for the largest median family size of 2.96 persons per family. On the other hand, single male/father families (166 | 18.6%) represent the smallest median family size with 2.35 persons per family.
| Family Type | # Families | Family Size |
| Married-Couple | 575 (64.5%) | 2.96 |
| Single Male/Father | 166 (18.6%) | 2.35 |
| Single Female/Mother | 151 (16.9%) | 2.36 |
| Total Families | 892 (100.0%) | 2.75 |
Median Household Size in Wanakah
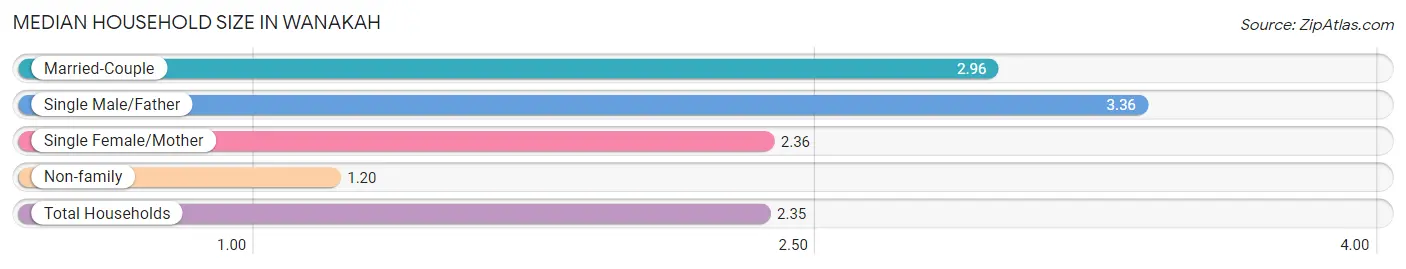
The median household size in Wanakah is 2.35 persons per household, with single male/father households (166 | 12.4%) accounting for the largest median household size of 3.36 persons per household. non-family households (450 | 33.5%) represent the smallest median household size with 1.20 persons per household.
| Household Type | # Households | Household Size |
| Married-Couple | 575 (42.8%) | 2.96 |
| Single Male/Father | 166 (12.4%) | 3.36 |
| Single Female/Mother | 151 (11.3%) | 2.36 |
| Non-family | 450 (33.5%) | 1.20 |
| Total Households | 1,342 (100.0%) | 2.35 |
Household Size by Marriage Status in Wanakah
Out of a total of 1,342 households in Wanakah, 892 (66.5%) are family households, while 450 (33.5%) are nonfamily households. The most numerous type of family households are 2-person households, comprising 407, and the most common type of nonfamily households are 1-person households, comprising 363.
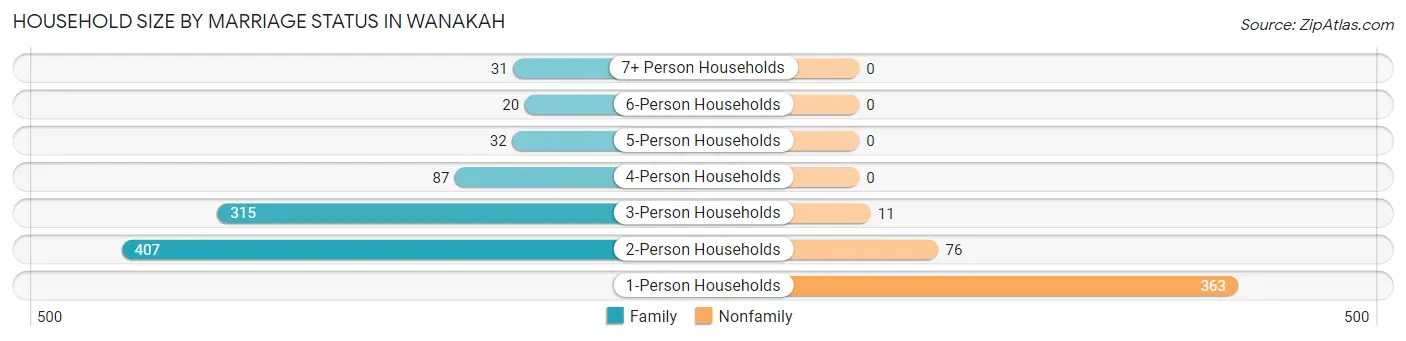
| Household Size | Family Households | Nonfamily Households |
| 1-Person Households | - | 363 (27.1%) |
| 2-Person Households | 407 (30.3%) | 76 (5.7%) |
| 3-Person Households | 315 (23.5%) | 11 (0.8%) |
| 4-Person Households | 87 (6.5%) | 0 (0.0%) |
| 5-Person Households | 32 (2.4%) | 0 (0.0%) |
| 6-Person Households | 20 (1.5%) | 0 (0.0%) |
| 7+ Person Households | 31 (2.3%) | 0 (0.0%) |
| Total | 892 (66.5%) | 450 (33.5%) |
Female Fertility in Wanakah
Fertility by Age in Wanakah
Average fertility rate in Wanakah is 27.0 births per 1,000 women. Women in the age bracket of 20 to 34 years have the highest fertility rate with 76.0 births per 1,000 women. Women in the age bracket of 20 to 34 years acount for 100.0% of all women with births.
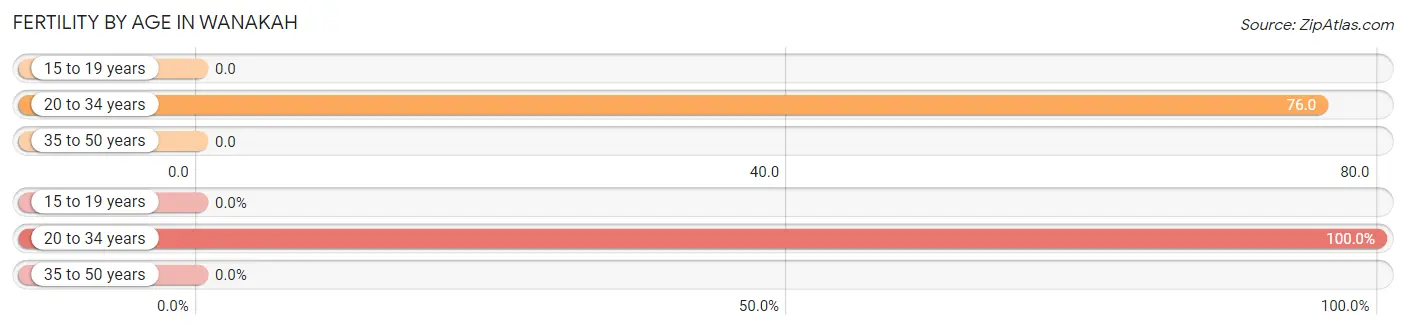
| Age Bracket | Women with Births | Births / 1,000 Women |
| 15 to 19 years | 0 (0.0%) | 0.0 |
| 20 to 34 years | 18 (100.0%) | 76.0 |
| 35 to 50 years | 0 (0.0%) | 0.0 |
| Total | 18 (100.0%) | 27.0 |
Fertility by Age by Marriage Status in Wanakah
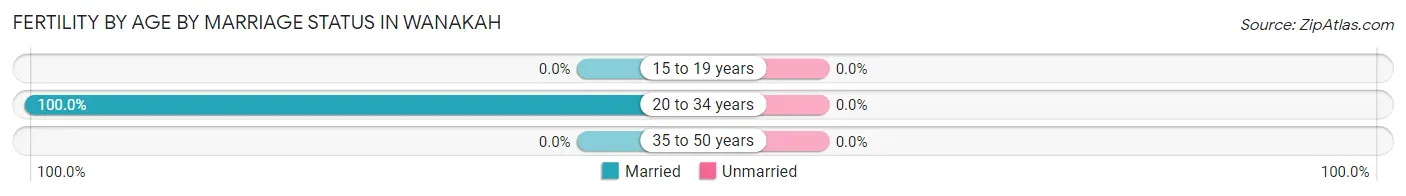
| Age Bracket | Married | Unmarried |
| 15 to 19 years | 0 (0.0%) | 0 (0.0%) |
| 20 to 34 years | 18 (100.0%) | 0 (0.0%) |
| 35 to 50 years | 0 (0.0%) | 0 (0.0%) |
| Total | 18 (100.0%) | 0 (0.0%) |
Fertility by Education in Wanakah
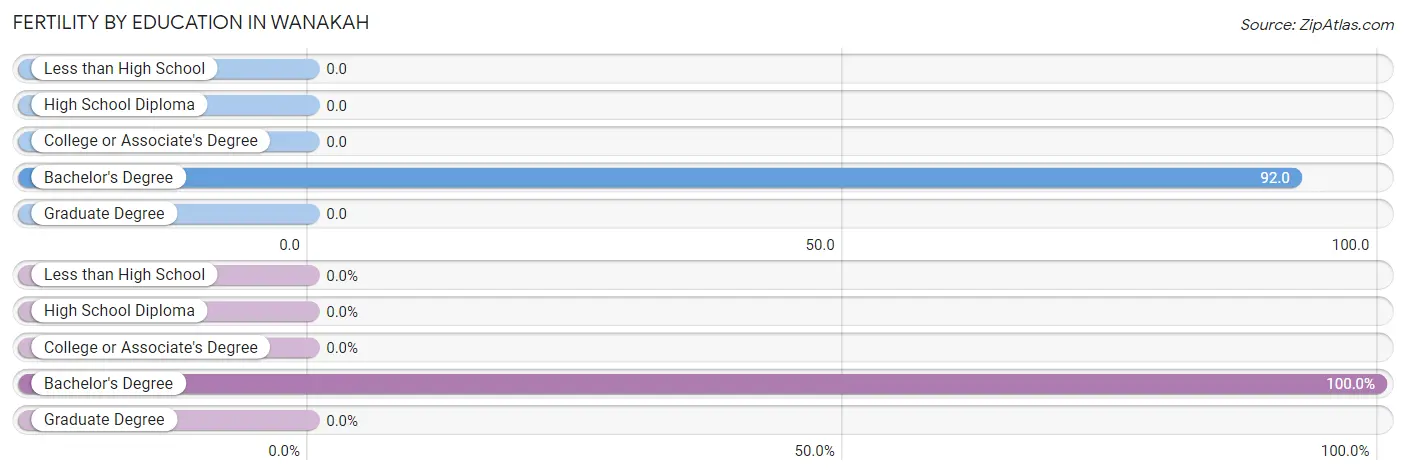
| Educational Attainment | Women with Births | Births / 1,000 Women |
| Less than High School | 0 (0.0%) | 0.0 |
| High School Diploma | 0 (0.0%) | 0.0 |
| College or Associate's Degree | 0 (0.0%) | 0.0 |
| Bachelor's Degree | 18 (100.0%) | 92.0 |
| Graduate Degree | 0 (0.0%) | 0.0 |
| Total | 18 (100.0%) | 27.0 |
Fertility by Education by Marriage Status in Wanakah
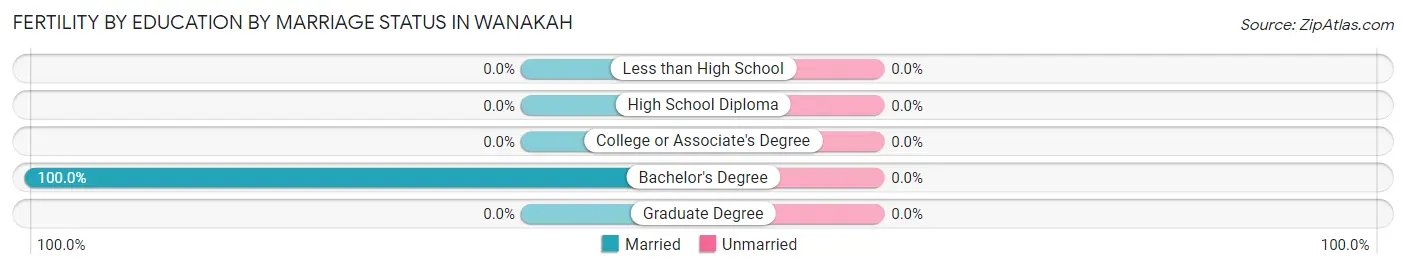
| Educational Attainment | Married | Unmarried |
| Less than High School | 0 (0.0%) | 0 (0.0%) |
| High School Diploma | 0 (0.0%) | 0 (0.0%) |
| College or Associate's Degree | 0 (0.0%) | 0 (0.0%) |
| Bachelor's Degree | 18 (100.0%) | 0 (0.0%) |
| Graduate Degree | 0 (0.0%) | 0 (0.0%) |
| Total | 18 (100.0%) | 0 (0.0%) |
Employment Characteristics in Wanakah
Employment by Class of Employer in Wanakah
Among the 1,552 employed individuals in Wanakah, private company employees (912 | 58.8%), not-for-profit organizations (211 | 13.6%), and self-employed (not incorporated) (148 | 9.5%) make up the most common classes of employment.
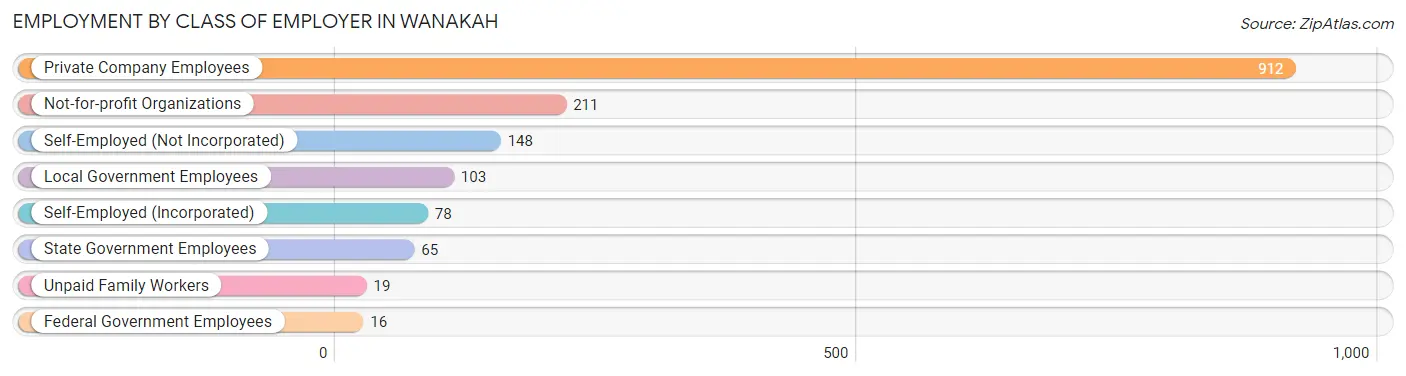
| Employer Class | # Employees | % Employees |
| Private Company Employees | 912 | 58.8% |
| Self-Employed (Incorporated) | 78 | 5.0% |
| Self-Employed (Not Incorporated) | 148 | 9.5% |
| Not-for-profit Organizations | 211 | 13.6% |
| Local Government Employees | 103 | 6.6% |
| State Government Employees | 65 | 4.2% |
| Federal Government Employees | 16 | 1.0% |
| Unpaid Family Workers | 19 | 1.2% |
| Total | 1,552 | 100.0% |
Employment Status by Age in Wanakah
According to the labor force statistics for Wanakah, out of the total population over 16 years of age (2,597), 63.2% or 1,641 individuals are in the labor force, with 3.1% or 51 of them unemployed. The age group with the highest labor force participation rate is 20 to 24 years, with 100.0% or 141 individuals in the labor force. Within the labor force, the 16 to 19 years age range has the highest percentage of unemployed individuals, with 17.8% or 16 of them being unemployed.
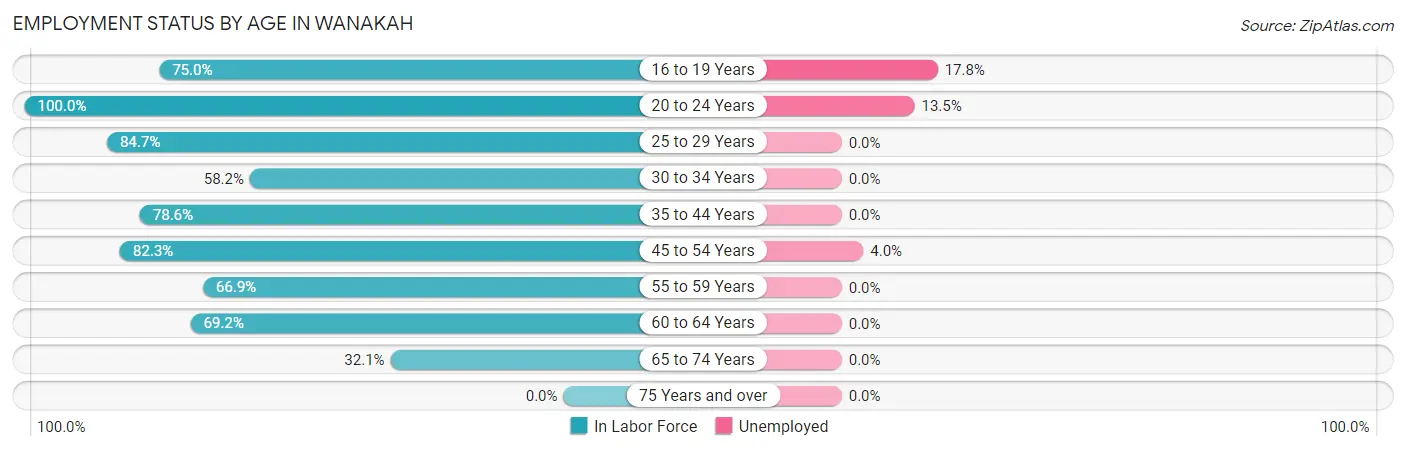
| Age Bracket | In Labor Force | Unemployed |
| 16 to 19 Years | 90 (75.0%) | 16 (17.8%) |
| 20 to 24 Years | 141 (100.0%) | 19 (13.5%) |
| 25 to 29 Years | 116 (84.7%) | 0 (0.0%) |
| 30 to 34 Years | 131 (58.2%) | 0 (0.0%) |
| 35 to 44 Years | 209 (78.6%) | 0 (0.0%) |
| 45 to 54 Years | 405 (82.3%) | 16 (4.0%) |
| 55 to 59 Years | 263 (66.9%) | 0 (0.0%) |
| 60 to 64 Years | 126 (69.2%) | 0 (0.0%) |
| 65 to 74 Years | 160 (32.1%) | 0 (0.0%) |
| 75 Years and over | 0 (0.0%) | 0 (0.0%) |
| Total | 1,641 (63.2%) | 51 (3.1%) |
Employment Status by Educational Attainment in Wanakah
According to labor force statistics for Wanakah, 73.7% of individuals (1,249) out of the total population between 25 and 64 years of age (1,695) are in the labor force, with 1.3% or 16 of them being unemployed. The group with the highest labor force participation rate are those with the educational attainment of college / associate degree, with 84.0% or 499 individuals in the labor force. Within the labor force, individuals with college / associate degree education have the highest percentage of unemployment, with 3.2% or 16 of them being unemployed.
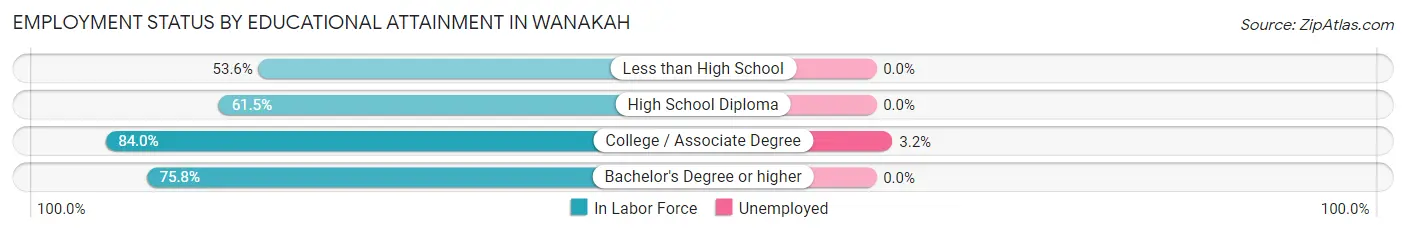
| Educational Attainment | In Labor Force | Unemployed |
| Less than High School | 15 (53.6%) | 0 (0.0%) |
| High School Diploma | 332 (61.5%) | 0 (0.0%) |
| College / Associate Degree | 499 (84.0%) | 19 (3.2%) |
| Bachelor's Degree or higher | 404 (75.8%) | 0 (0.0%) |
| Total | 1,249 (73.7%) | 22 (1.3%) |
Employment Occupations by Sex in Wanakah
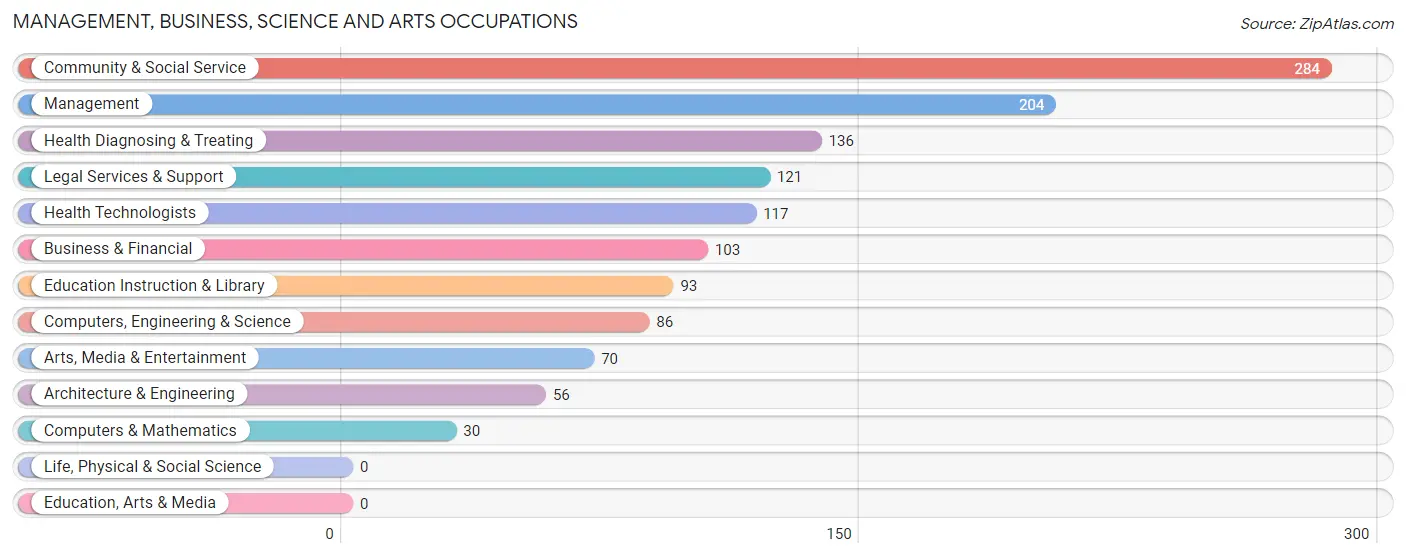
Management, Business, Science and Arts Occupations
The most common Management, Business, Science and Arts occupations in Wanakah are Community & Social Service (284 | 17.9%), Management (204 | 12.8%), Health Diagnosing & Treating (136 | 8.6%), Legal Services & Support (121 | 7.6%), and Health Technologists (117 | 7.4%).
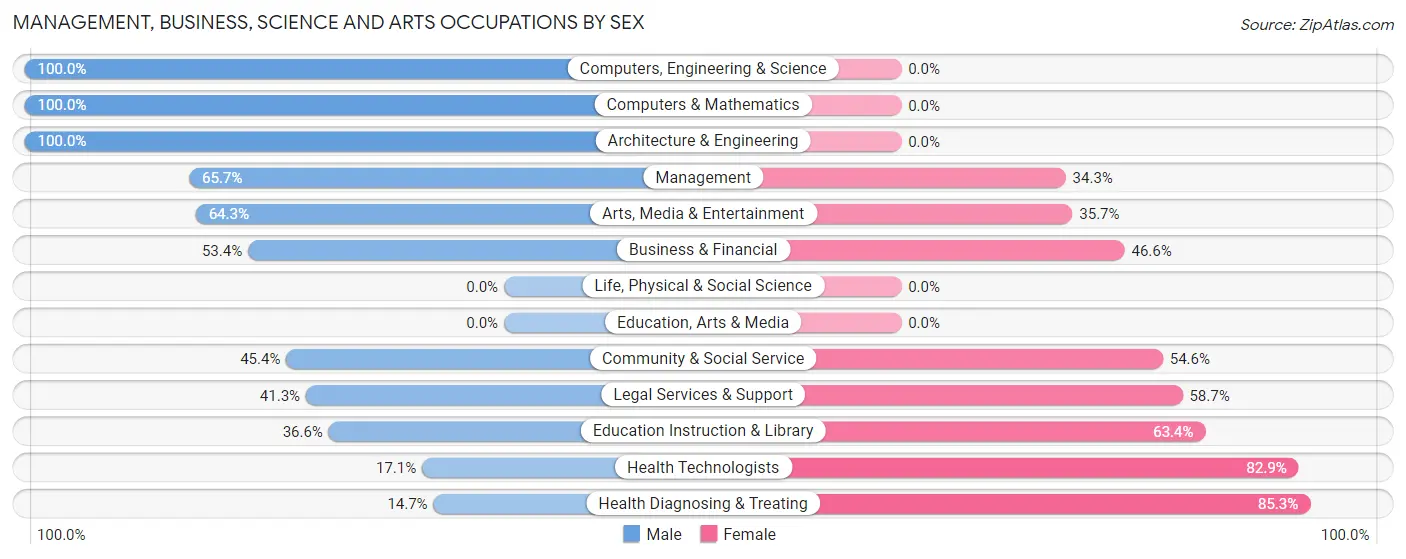
Management, Business, Science and Arts Occupations by Sex
Within the Management, Business, Science and Arts occupations in Wanakah, the most male-oriented occupations are Computers, Engineering & Science (100.0%), Computers & Mathematics (100.0%), and Architecture & Engineering (100.0%), while the most female-oriented occupations are Health Diagnosing & Treating (85.3%), Health Technologists (82.9%), and Education Instruction & Library (63.4%).
| Occupation | Male | Female |
| Management | 134 (65.7%) | 70 (34.3%) |
| Business & Financial | 55 (53.4%) | 48 (46.6%) |
| Computers, Engineering & Science | 86 (100.0%) | 0 (0.0%) |
| Computers & Mathematics | 30 (100.0%) | 0 (0.0%) |
| Architecture & Engineering | 56 (100.0%) | 0 (0.0%) |
| Life, Physical & Social Science | 0 (0.0%) | 0 (0.0%) |
| Community & Social Service | 129 (45.4%) | 155 (54.6%) |
| Education, Arts & Media | 0 (0.0%) | 0 (0.0%) |
| Legal Services & Support | 50 (41.3%) | 71 (58.7%) |
| Education Instruction & Library | 34 (36.6%) | 59 (63.4%) |
| Arts, Media & Entertainment | 45 (64.3%) | 25 (35.7%) |
| Health Diagnosing & Treating | 20 (14.7%) | 116 (85.3%) |
| Health Technologists | 20 (17.1%) | 97 (82.9%) |
| Total (Category) | 424 (52.1%) | 389 (47.8%) |
| Total (Overall) | 797 (50.1%) | 793 (49.9%) |
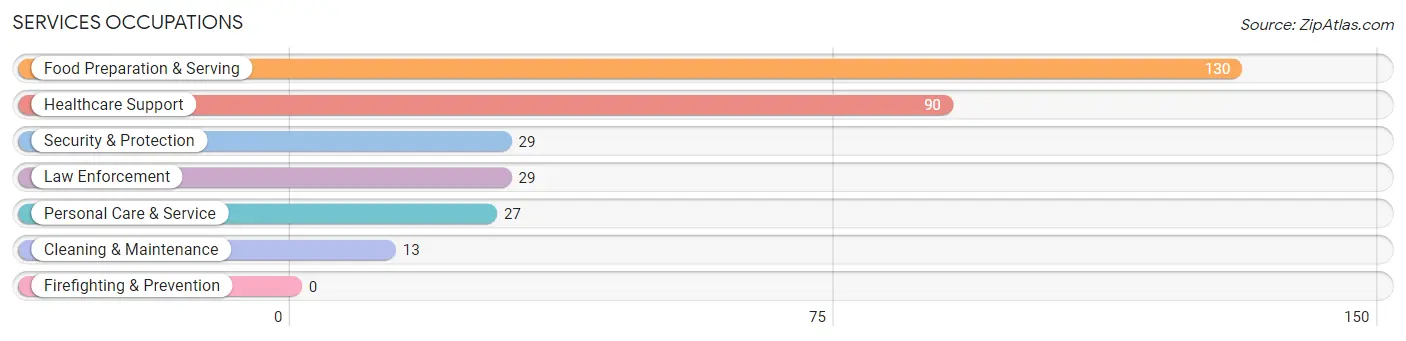
Services Occupations
The most common Services occupations in Wanakah are Food Preparation & Serving (130 | 8.2%), Healthcare Support (90 | 5.7%), Security & Protection (29 | 1.8%), Law Enforcement (29 | 1.8%), and Personal Care & Service (27 | 1.7%).
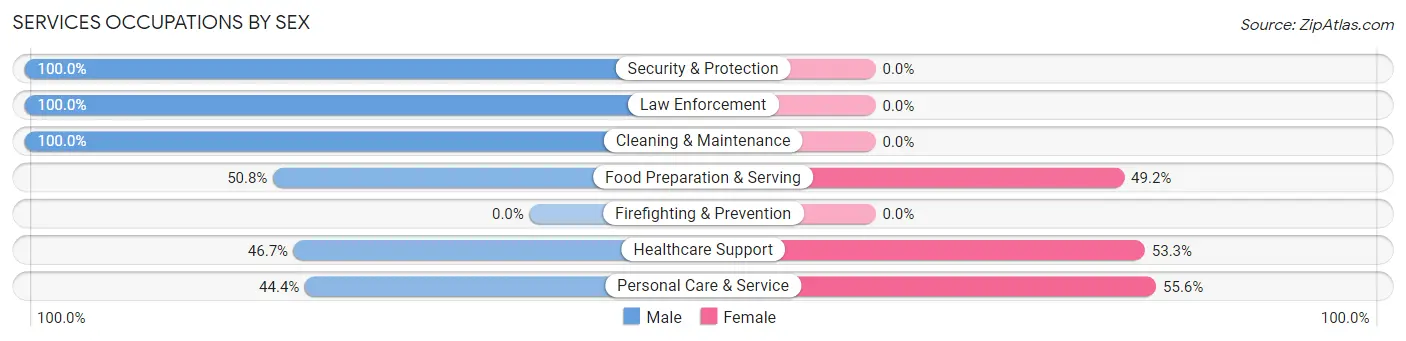
Services Occupations by Sex
Within the Services occupations in Wanakah, the most male-oriented occupations are Security & Protection (100.0%), Law Enforcement (100.0%), and Cleaning & Maintenance (100.0%), while the most female-oriented occupations are Personal Care & Service (55.6%), Healthcare Support (53.3%), and Food Preparation & Serving (49.2%).
| Occupation | Male | Female |
| Healthcare Support | 42 (46.7%) | 48 (53.3%) |
| Security & Protection | 29 (100.0%) | 0 (0.0%) |
| Firefighting & Prevention | 0 (0.0%) | 0 (0.0%) |
| Law Enforcement | 29 (100.0%) | 0 (0.0%) |
| Food Preparation & Serving | 66 (50.8%) | 64 (49.2%) |
| Cleaning & Maintenance | 13 (100.0%) | 0 (0.0%) |
| Personal Care & Service | 12 (44.4%) | 15 (55.6%) |
| Total (Category) | 162 (56.1%) | 127 (43.9%) |
| Total (Overall) | 797 (50.1%) | 793 (49.9%) |
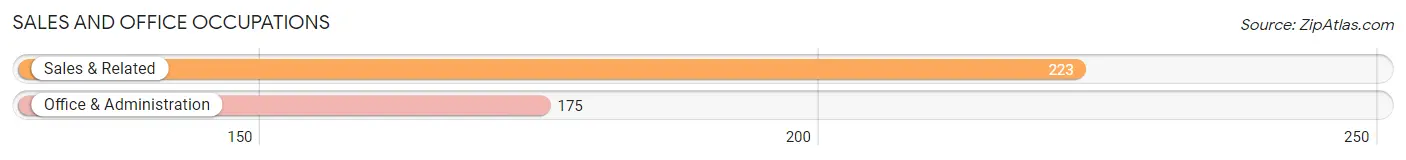
Sales and Office Occupations
The most common Sales and Office occupations in Wanakah are Sales & Related (223 | 14.0%), and Office & Administration (175 | 11.0%).
Sales and Office Occupations by Sex
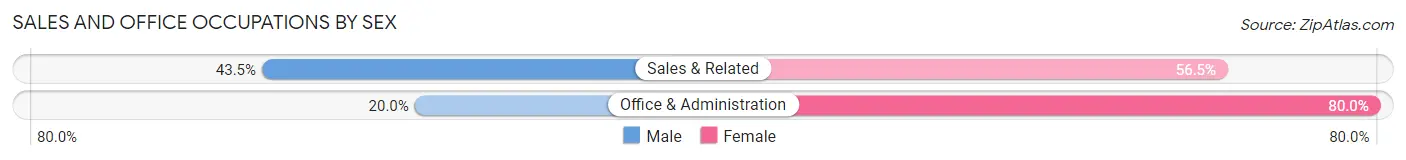
| Occupation | Male | Female |
| Sales & Related | 97 (43.5%) | 126 (56.5%) |
| Office & Administration | 35 (20.0%) | 140 (80.0%) |
| Total (Category) | 132 (33.2%) | 266 (66.8%) |
| Total (Overall) | 797 (50.1%) | 793 (49.9%) |
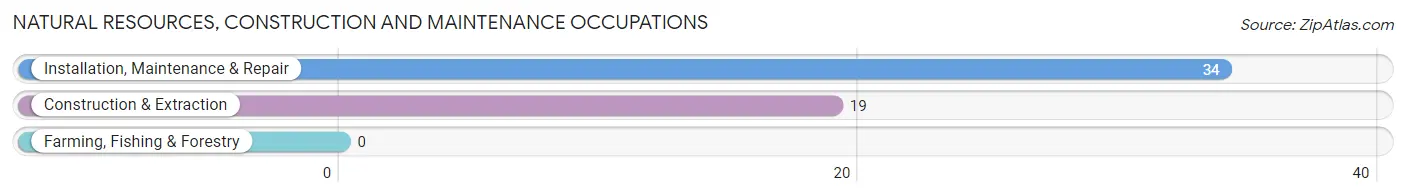
Natural Resources, Construction and Maintenance Occupations
The most common Natural Resources, Construction and Maintenance occupations in Wanakah are Installation, Maintenance & Repair (34 | 2.1%), and Construction & Extraction (19 | 1.2%).
Natural Resources, Construction and Maintenance Occupations by Sex
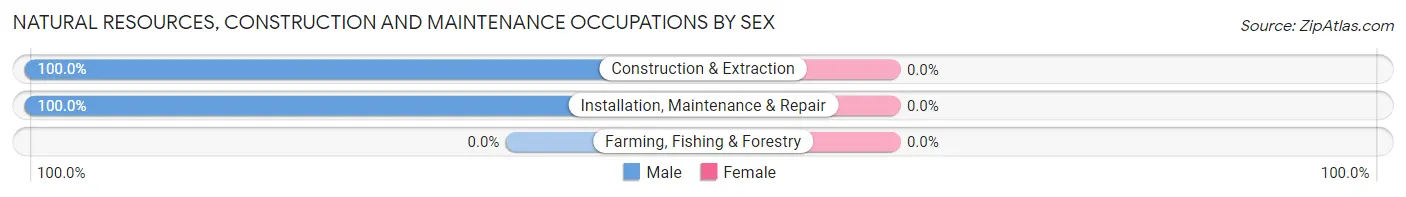
| Occupation | Male | Female |
| Farming, Fishing & Forestry | 0 (0.0%) | 0 (0.0%) |
| Construction & Extraction | 19 (100.0%) | 0 (0.0%) |
| Installation, Maintenance & Repair | 34 (100.0%) | 0 (0.0%) |
| Total (Category) | 53 (100.0%) | 0 (0.0%) |
| Total (Overall) | 797 (50.1%) | 793 (49.9%) |
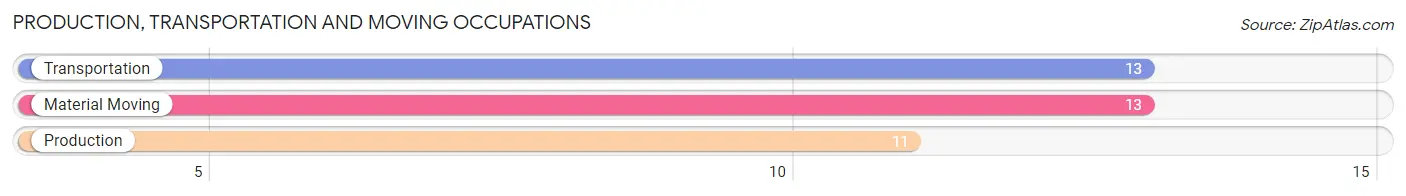
Production, Transportation and Moving Occupations
The most common Production, Transportation and Moving occupations in Wanakah are Transportation (13 | 0.8%), Material Moving (13 | 0.8%), and Production (11 | 0.7%).
Production, Transportation and Moving Occupations by Sex
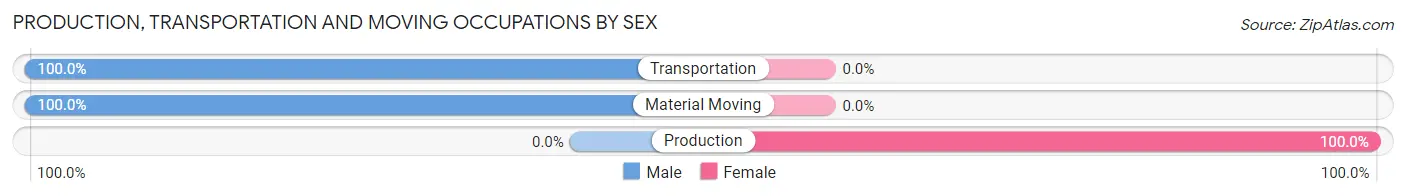
| Occupation | Male | Female |
| Production | 0 (0.0%) | 11 (100.0%) |
| Transportation | 13 (100.0%) | 0 (0.0%) |
| Material Moving | 13 (100.0%) | 0 (0.0%) |
| Total (Category) | 26 (70.3%) | 11 (29.7%) |
| Total (Overall) | 797 (50.1%) | 793 (49.9%) |
Employment Industries by Sex in Wanakah
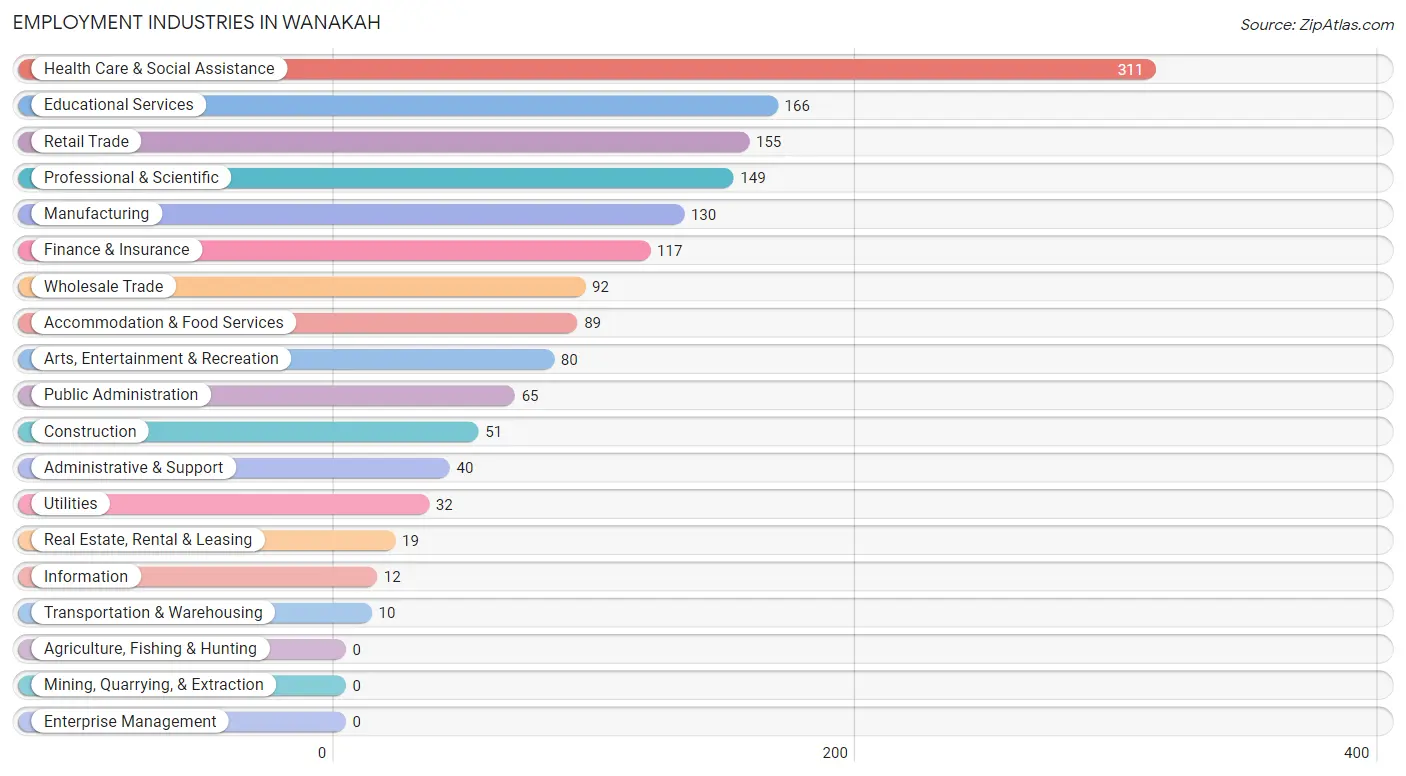
Employment Industries in Wanakah
The major employment industries in Wanakah include Health Care & Social Assistance (311 | 19.6%), Educational Services (166 | 10.4%), Retail Trade (155 | 9.8%), Professional & Scientific (149 | 9.4%), and Manufacturing (130 | 8.2%).
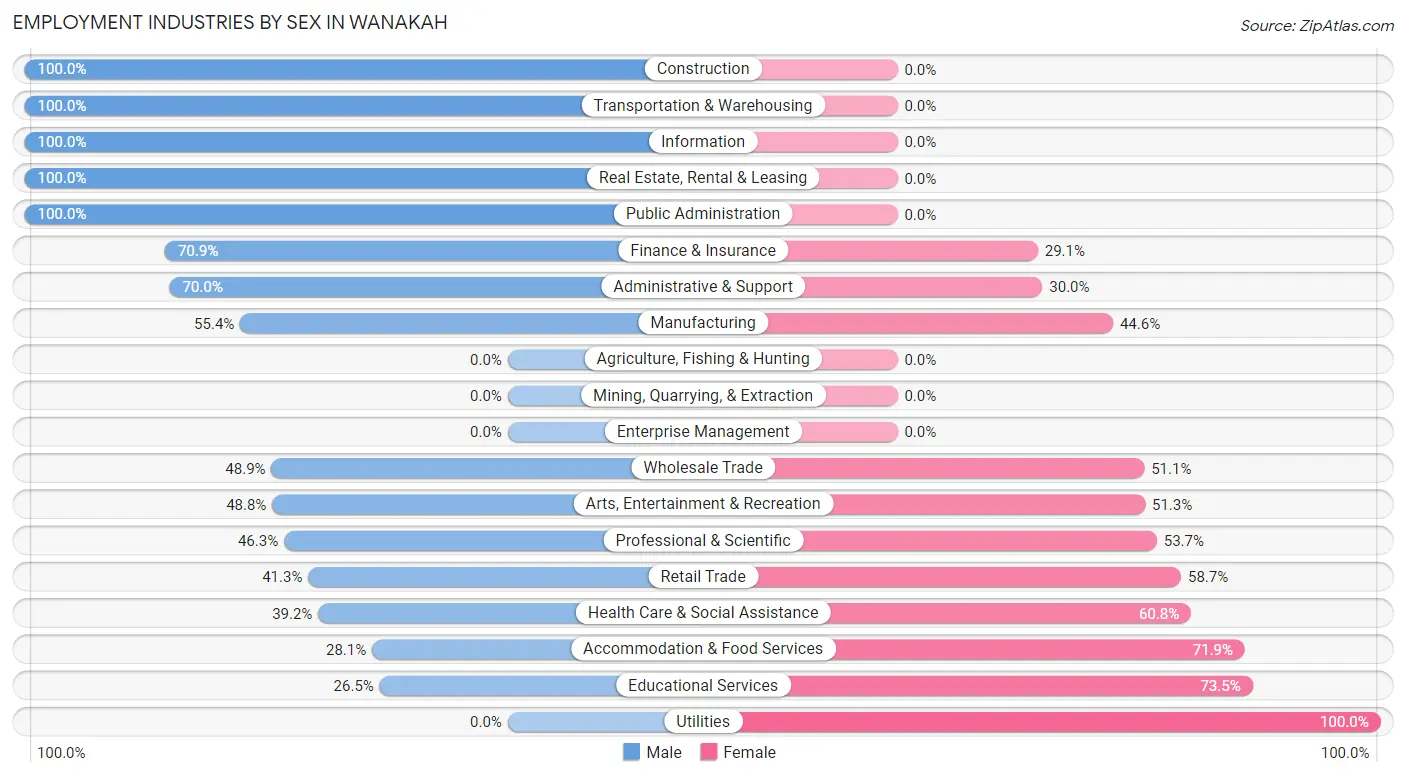
Employment Industries by Sex in Wanakah
The Wanakah industries that see more men than women are Construction (100.0%), Transportation & Warehousing (100.0%), and Information (100.0%), whereas the industries that tend to have a higher number of women are Utilities (100.0%), Educational Services (73.5%), and Accommodation & Food Services (71.9%).
| Industry | Male | Female |
| Agriculture, Fishing & Hunting | 0 (0.0%) | 0 (0.0%) |
| Mining, Quarrying, & Extraction | 0 (0.0%) | 0 (0.0%) |
| Construction | 51 (100.0%) | 0 (0.0%) |
| Manufacturing | 72 (55.4%) | 58 (44.6%) |
| Wholesale Trade | 45 (48.9%) | 47 (51.1%) |
| Retail Trade | 64 (41.3%) | 91 (58.7%) |
| Transportation & Warehousing | 10 (100.0%) | 0 (0.0%) |
| Utilities | 0 (0.0%) | 32 (100.0%) |
| Information | 12 (100.0%) | 0 (0.0%) |
| Finance & Insurance | 83 (70.9%) | 34 (29.1%) |
| Real Estate, Rental & Leasing | 19 (100.0%) | 0 (0.0%) |
| Professional & Scientific | 69 (46.3%) | 80 (53.7%) |
| Enterprise Management | 0 (0.0%) | 0 (0.0%) |
| Administrative & Support | 28 (70.0%) | 12 (30.0%) |
| Educational Services | 44 (26.5%) | 122 (73.5%) |
| Health Care & Social Assistance | 122 (39.2%) | 189 (60.8%) |
| Arts, Entertainment & Recreation | 39 (48.7%) | 41 (51.2%) |
| Accommodation & Food Services | 25 (28.1%) | 64 (71.9%) |
| Public Administration | 65 (100.0%) | 0 (0.0%) |
| Total | 797 (50.1%) | 793 (49.9%) |
Education in Wanakah
School Enrollment in Wanakah
The most common levels of schooling among the 499 students in Wanakah are elementary school (152 | 30.5%), high school (119 | 23.8%), and kindergarten (94 | 18.8%).
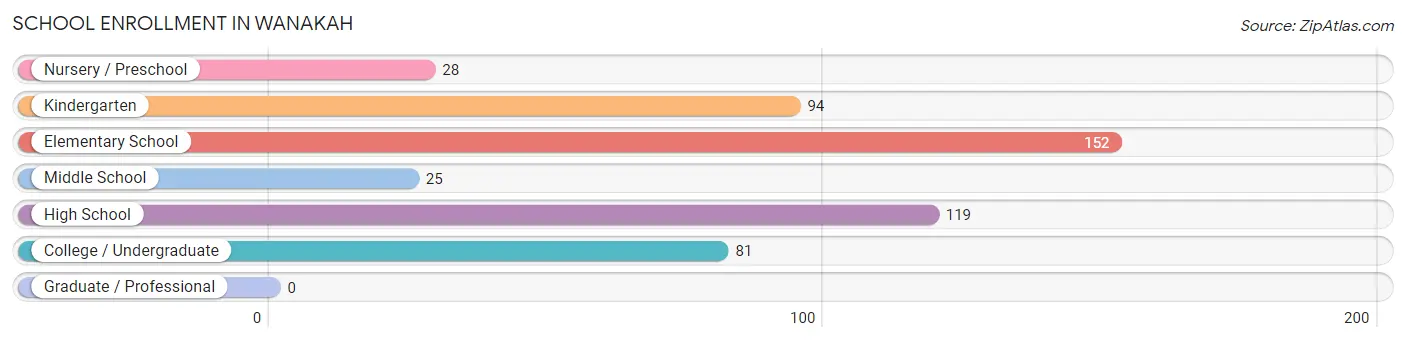
| School Level | # Students | % Students |
| Nursery / Preschool | 28 | 5.6% |
| Kindergarten | 94 | 18.8% |
| Elementary School | 152 | 30.5% |
| Middle School | 25 | 5.0% |
| High School | 119 | 23.8% |
| College / Undergraduate | 81 | 16.2% |
| Graduate / Professional | 0 | 0.0% |
| Total | 499 | 100.0% |
School Enrollment by Age by Funding Source in Wanakah
Out of a total of 499 students who are enrolled in schools in Wanakah, 135 (27.1%) attend a private institution, while the remaining 364 (72.9%) are enrolled in public schools. The age group of 5 to 9 year old has the highest likelihood of being enrolled in private schools, with 93 (45.6% in the age bracket) enrolled. Conversely, the age group of 3 to 4 year olds has the lowest likelihood of being enrolled in a private school, with 28 (100.0% in the age bracket) attending a public institution.
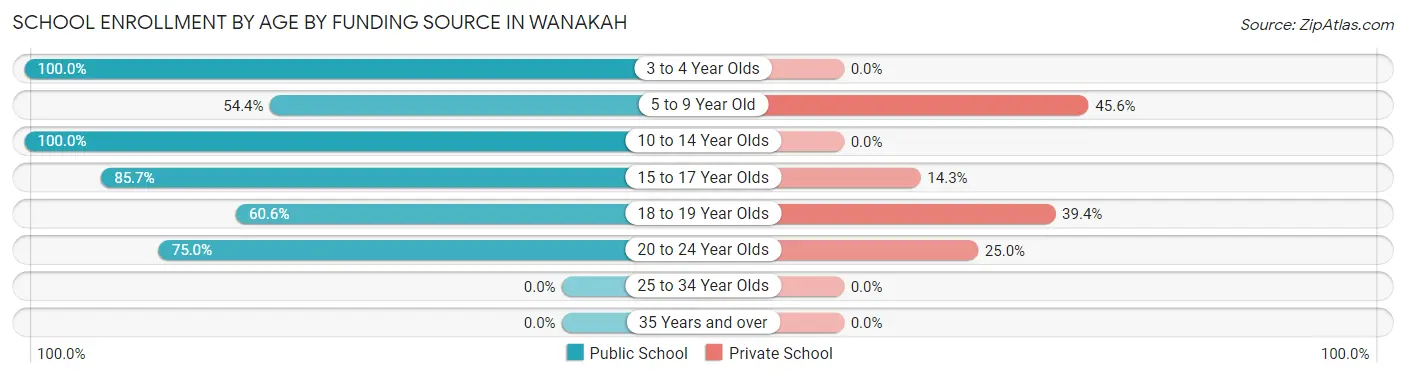
| Age Bracket | Public School | Private School |
| 3 to 4 Year Olds | 28 (100.0%) | 0 (0.0%) |
| 5 to 9 Year Old | 111 (54.4%) | 93 (45.6%) |
| 10 to 14 Year Olds | 67 (100.0%) | 0 (0.0%) |
| 15 to 17 Year Olds | 102 (85.7%) | 17 (14.3%) |
| 18 to 19 Year Olds | 20 (60.6%) | 13 (39.4%) |
| 20 to 24 Year Olds | 36 (75.0%) | 12 (25.0%) |
| 25 to 34 Year Olds | 0 (0.0%) | 0 (0.0%) |
| 35 Years and over | 0 (0.0%) | 0 (0.0%) |
| Total | 364 (72.9%) | 135 (27.1%) |
Educational Attainment by Field of Study in Wanakah
Business (179 | 23.4%), science & technology (135 | 17.7%), literature & languages (113 | 14.8%), education (64 | 8.4%), and engineering (54 | 7.1%) are the most common fields of study among 764 individuals in Wanakah who have obtained a bachelor's degree or higher.
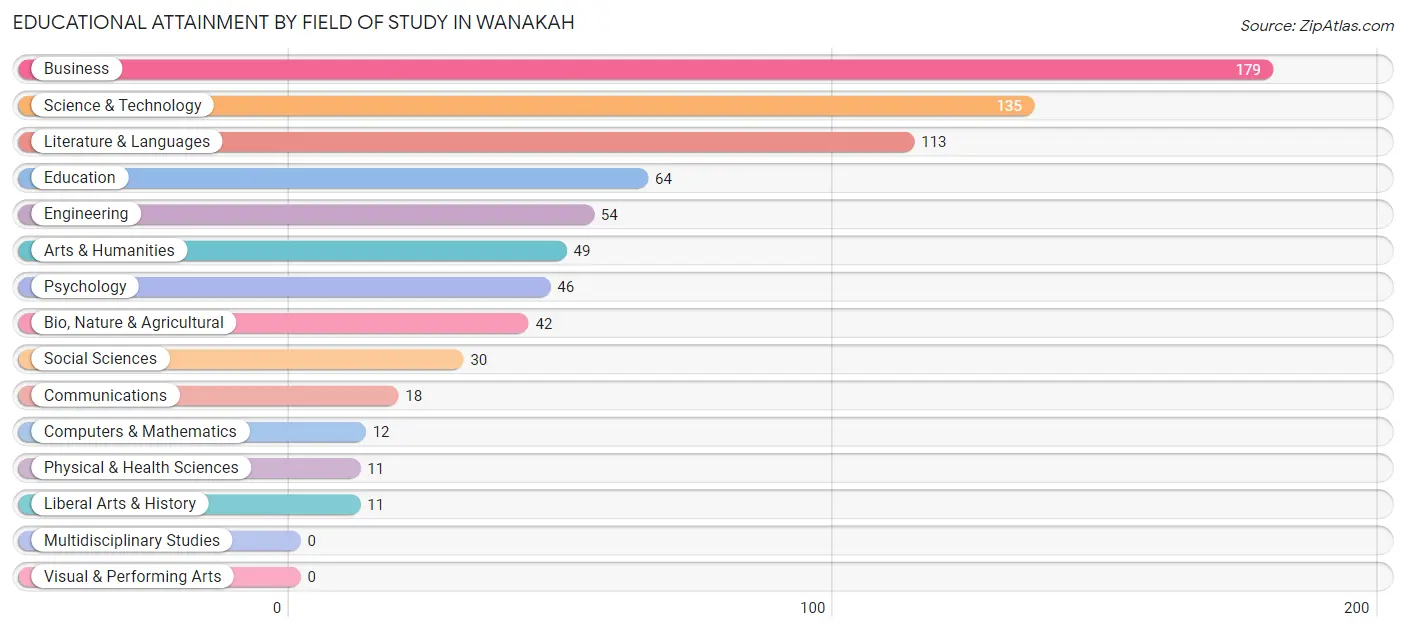
| Field of Study | # Graduates | % Graduates |
| Computers & Mathematics | 12 | 1.6% |
| Bio, Nature & Agricultural | 42 | 5.5% |
| Physical & Health Sciences | 11 | 1.4% |
| Psychology | 46 | 6.0% |
| Social Sciences | 30 | 3.9% |
| Engineering | 54 | 7.1% |
| Multidisciplinary Studies | 0 | 0.0% |
| Science & Technology | 135 | 17.7% |
| Business | 179 | 23.4% |
| Education | 64 | 8.4% |
| Literature & Languages | 113 | 14.8% |
| Liberal Arts & History | 11 | 1.4% |
| Visual & Performing Arts | 0 | 0.0% |
| Communications | 18 | 2.4% |
| Arts & Humanities | 49 | 6.4% |
| Total | 764 | 100.0% |
Transportation & Commute in Wanakah
Vehicle Availability by Sex in Wanakah
The most prevalent vehicle ownership categories in Wanakah are males with 2 vehicles (538, accounting for 69.2%) and females with 2 vehicles (337, making up 69.4%).
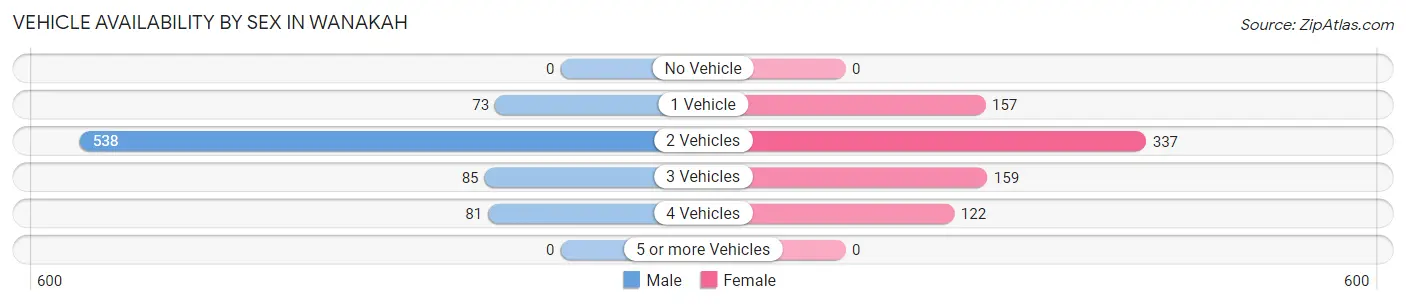
| Vehicles Available | Male | Female |
| No Vehicle | 0 (0.0%) | 0 (0.0%) |
| 1 Vehicle | 73 (9.4%) | 157 (20.3%) |
| 2 Vehicles | 538 (69.2%) | 337 (43.5%) |
| 3 Vehicles | 85 (10.9%) | 159 (20.5%) |
| 4 Vehicles | 81 (10.4%) | 122 (15.7%) |
| 5 or more Vehicles | 0 (0.0%) | 0 (0.0%) |
| Total | 777 (100.0%) | 775 (100.0%) |
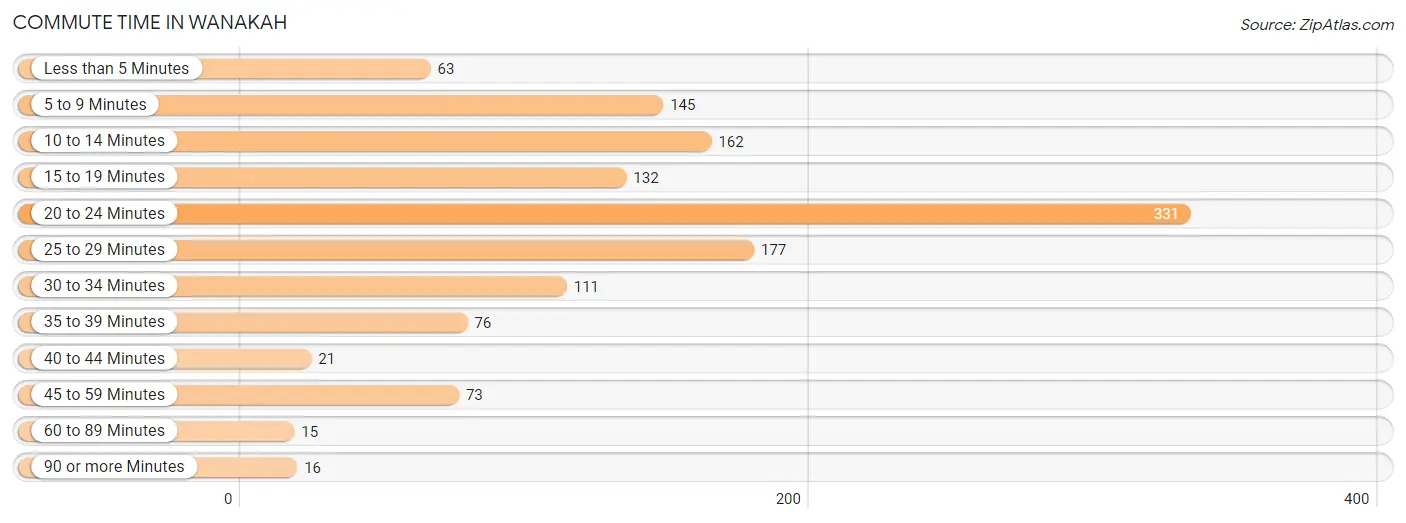
Commute Time in Wanakah
The most frequently occuring commute durations in Wanakah are 20 to 24 minutes (331 commuters, 25.0%), 25 to 29 minutes (177 commuters, 13.4%), and 10 to 14 minutes (162 commuters, 12.2%).
| Commute Time | # Commuters | % Commuters |
| Less than 5 Minutes | 63 | 4.8% |
| 5 to 9 Minutes | 145 | 11.0% |
| 10 to 14 Minutes | 162 | 12.2% |
| 15 to 19 Minutes | 132 | 10.0% |
| 20 to 24 Minutes | 331 | 25.0% |
| 25 to 29 Minutes | 177 | 13.4% |
| 30 to 34 Minutes | 111 | 8.4% |
| 35 to 39 Minutes | 76 | 5.8% |
| 40 to 44 Minutes | 21 | 1.6% |
| 45 to 59 Minutes | 73 | 5.5% |
| 60 to 89 Minutes | 15 | 1.1% |
| 90 or more Minutes | 16 | 1.2% |
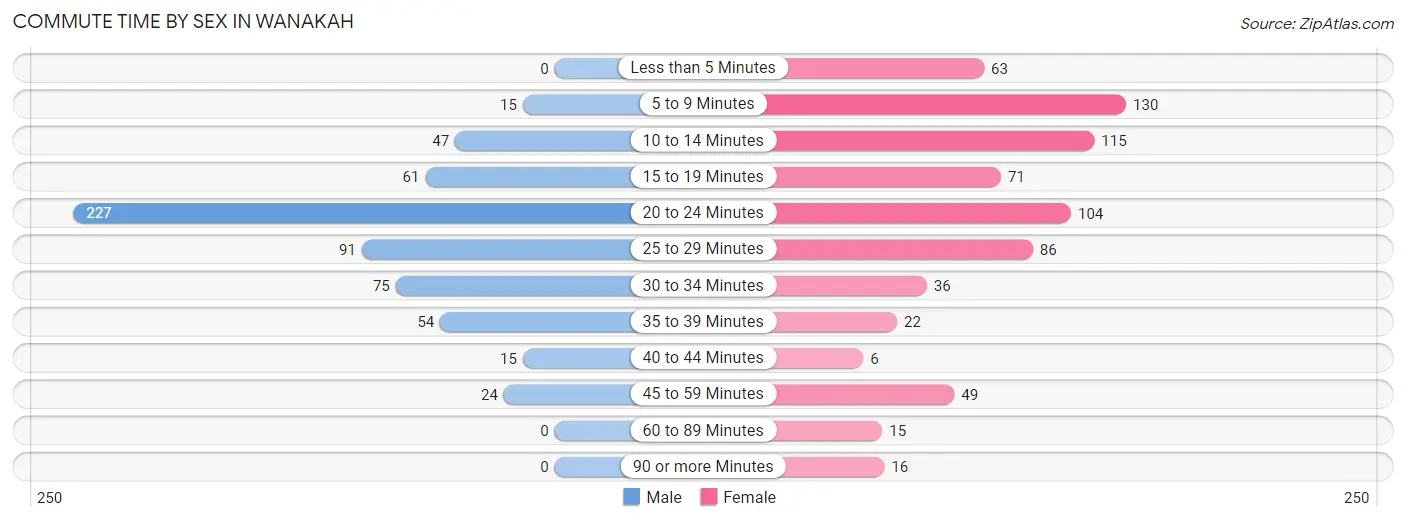
Commute Time by Sex in Wanakah
The most common commute times in Wanakah are 20 to 24 minutes (227 commuters, 37.3%) for males and 5 to 9 minutes (130 commuters, 18.2%) for females.
| Commute Time | Male | Female |
| Less than 5 Minutes | 0 (0.0%) | 63 (8.8%) |
| 5 to 9 Minutes | 15 (2.5%) | 130 (18.2%) |
| 10 to 14 Minutes | 47 (7.7%) | 115 (16.1%) |
| 15 to 19 Minutes | 61 (10.0%) | 71 (10.0%) |
| 20 to 24 Minutes | 227 (37.3%) | 104 (14.6%) |
| 25 to 29 Minutes | 91 (14.9%) | 86 (12.1%) |
| 30 to 34 Minutes | 75 (12.3%) | 36 (5.1%) |
| 35 to 39 Minutes | 54 (8.9%) | 22 (3.1%) |
| 40 to 44 Minutes | 15 (2.5%) | 6 (0.8%) |
| 45 to 59 Minutes | 24 (3.9%) | 49 (6.9%) |
| 60 to 89 Minutes | 0 (0.0%) | 15 (2.1%) |
| 90 or more Minutes | 0 (0.0%) | 16 (2.2%) |
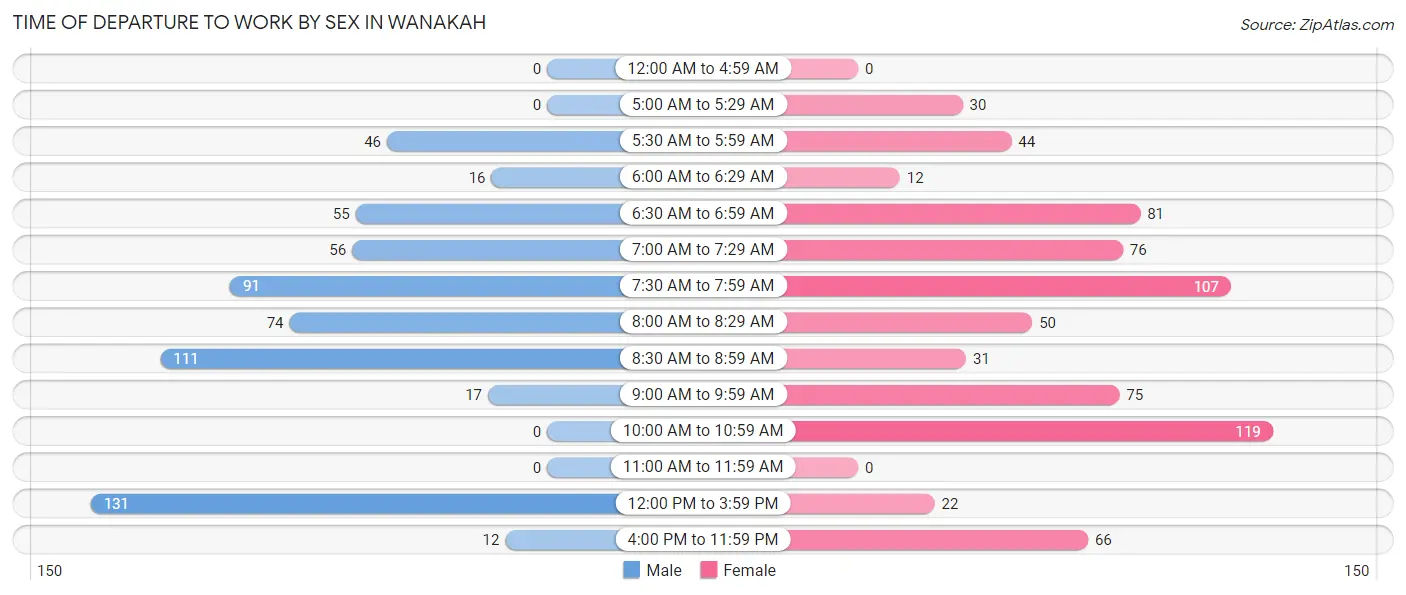
Time of Departure to Work by Sex in Wanakah
The most frequent times of departure to work in Wanakah are 12:00 PM to 3:59 PM (131, 21.5%) for males and 10:00 AM to 10:59 AM (119, 16.7%) for females.
| Time of Departure | Male | Female |
| 12:00 AM to 4:59 AM | 0 (0.0%) | 0 (0.0%) |
| 5:00 AM to 5:29 AM | 0 (0.0%) | 30 (4.2%) |
| 5:30 AM to 5:59 AM | 46 (7.5%) | 44 (6.2%) |
| 6:00 AM to 6:29 AM | 16 (2.6%) | 12 (1.7%) |
| 6:30 AM to 6:59 AM | 55 (9.0%) | 81 (11.4%) |
| 7:00 AM to 7:29 AM | 56 (9.2%) | 76 (10.7%) |
| 7:30 AM to 7:59 AM | 91 (14.9%) | 107 (15.0%) |
| 8:00 AM to 8:29 AM | 74 (12.1%) | 50 (7.0%) |
| 8:30 AM to 8:59 AM | 111 (18.2%) | 31 (4.3%) |
| 9:00 AM to 9:59 AM | 17 (2.8%) | 75 (10.5%) |
| 10:00 AM to 10:59 AM | 0 (0.0%) | 119 (16.7%) |
| 11:00 AM to 11:59 AM | 0 (0.0%) | 0 (0.0%) |
| 12:00 PM to 3:59 PM | 131 (21.5%) | 22 (3.1%) |
| 4:00 PM to 11:59 PM | 12 (2.0%) | 66 (9.3%) |
| Total | 609 (100.0%) | 713 (100.0%) |
Housing Occupancy in Wanakah
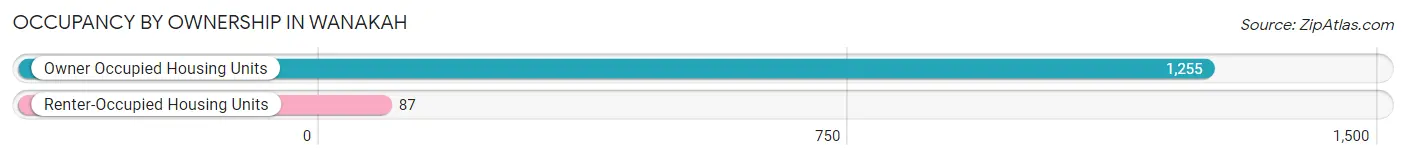
Occupancy by Ownership in Wanakah
Of the total 1,342 dwellings in Wanakah, owner-occupied units account for 1,255 (93.5%), while renter-occupied units make up 87 (6.5%).
| Occupancy | # Housing Units | % Housing Units |
| Owner Occupied Housing Units | 1,255 | 93.5% |
| Renter-Occupied Housing Units | 87 | 6.5% |
| Total Occupied Housing Units | 1,342 | 100.0% |
Occupancy by Household Size in Wanakah
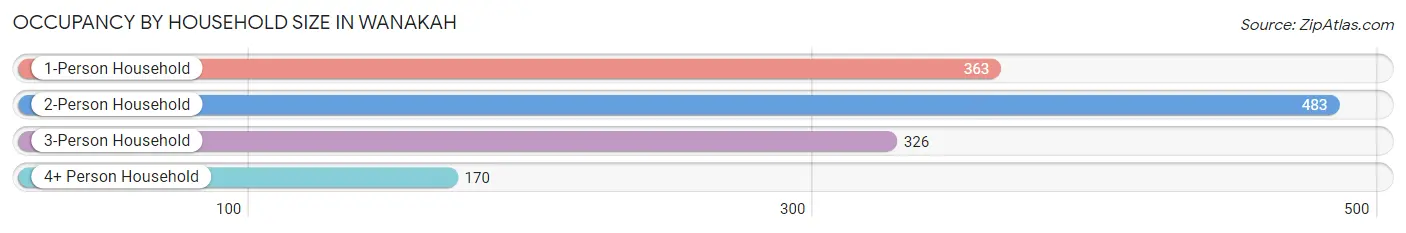
| Household Size | # Housing Units | % Housing Units |
| 1-Person Household | 363 | 27.1% |
| 2-Person Household | 483 | 36.0% |
| 3-Person Household | 326 | 24.3% |
| 4+ Person Household | 170 | 12.7% |
| Total Housing Units | 1,342 | 100.0% |
Occupancy by Ownership by Household Size in Wanakah
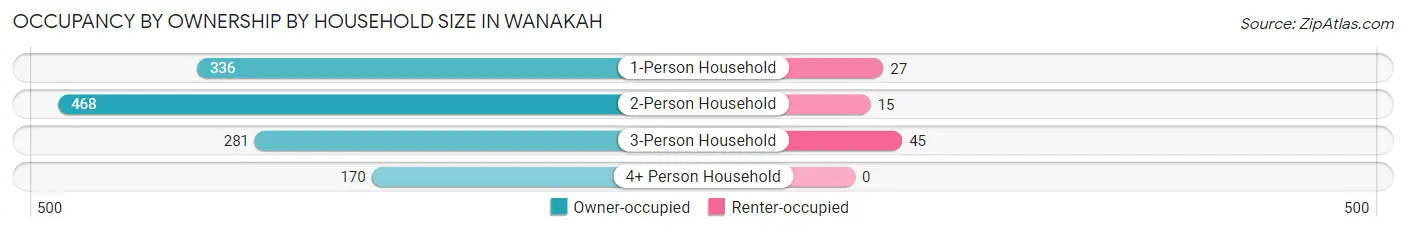
| Household Size | Owner-occupied | Renter-occupied |
| 1-Person Household | 336 (92.6%) | 27 (7.4%) |
| 2-Person Household | 468 (96.9%) | 15 (3.1%) |
| 3-Person Household | 281 (86.2%) | 45 (13.8%) |
| 4+ Person Household | 170 (100.0%) | 0 (0.0%) |
| Total Housing Units | 1,255 (93.5%) | 87 (6.5%) |
Occupancy by Educational Attainment in Wanakah
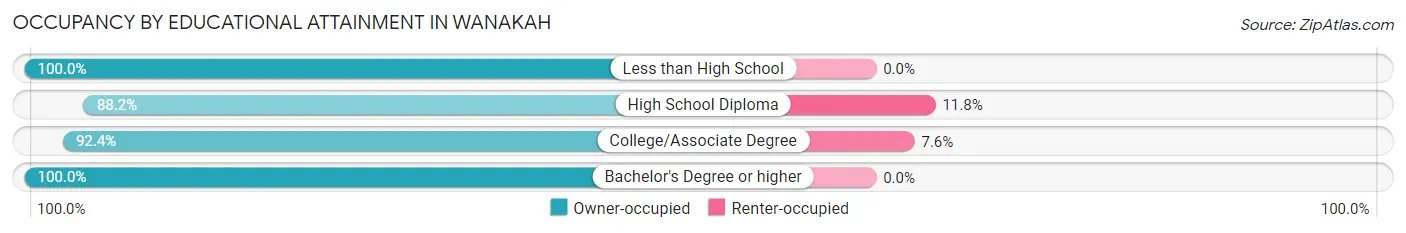
| Household Size | Owner-occupied | Renter-occupied |
| Less than High School | 13 (100.0%) | 0 (0.0%) |
| High School Diploma | 315 (88.2%) | 42 (11.8%) |
| College/Associate Degree | 546 (92.4%) | 45 (7.6%) |
| Bachelor's Degree or higher | 381 (100.0%) | 0 (0.0%) |
Occupancy by Age of Householder in Wanakah
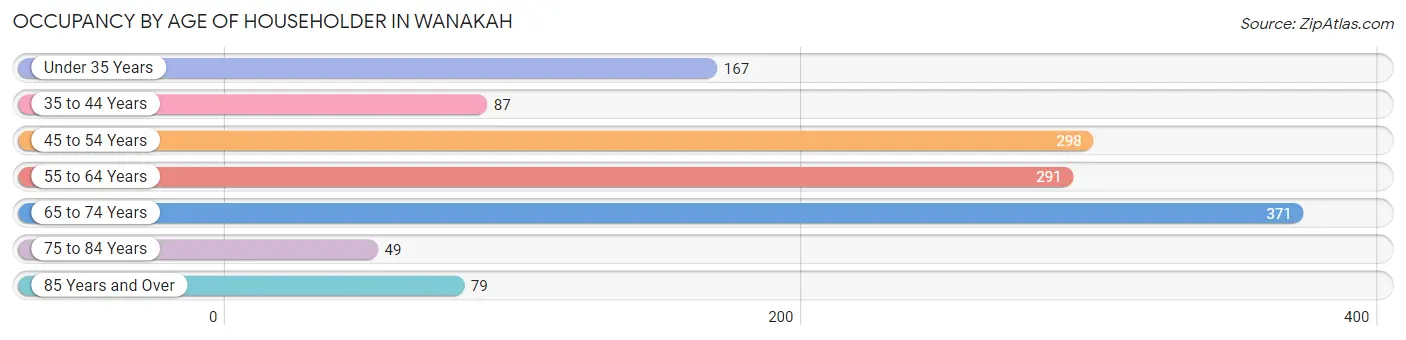
| Age Bracket | # Households | % Households |
| Under 35 Years | 167 | 12.4% |
| 35 to 44 Years | 87 | 6.5% |
| 45 to 54 Years | 298 | 22.2% |
| 55 to 64 Years | 291 | 21.7% |
| 65 to 74 Years | 371 | 27.7% |
| 75 to 84 Years | 49 | 3.6% |
| 85 Years and Over | 79 | 5.9% |
| Total | 1,342 | 100.0% |
Housing Finances in Wanakah
Median Income by Occupancy in Wanakah
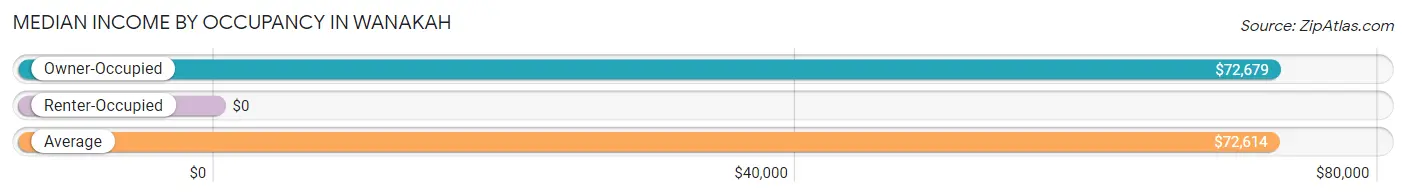
| Occupancy Type | # Households | Median Income |
| Owner-Occupied | 1,255 (93.5%) | $72,679 |
| Renter-Occupied | 87 (6.5%) | $0 |
| Average | 1,342 (100.0%) | $72,614 |
Occupancy by Householder Income Bracket in Wanakah
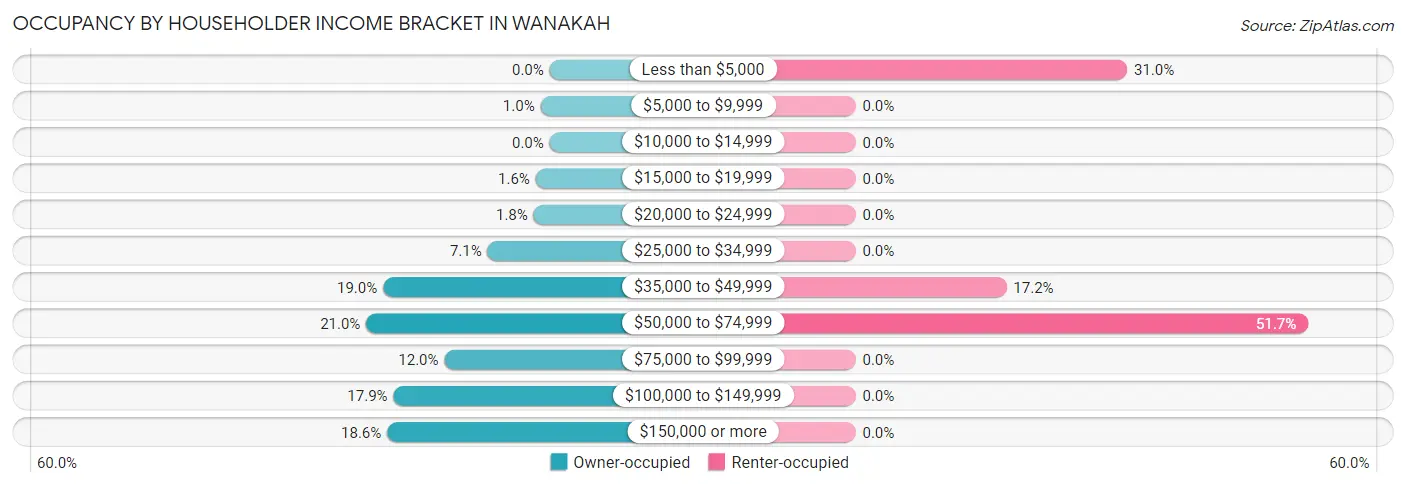
| Income Bracket | Owner-occupied | Renter-occupied |
| Less than $5,000 | 0 (0.0%) | 27 (31.0%) |
| $5,000 to $9,999 | 13 (1.0%) | 0 (0.0%) |
| $10,000 to $14,999 | 0 (0.0%) | 0 (0.0%) |
| $15,000 to $19,999 | 20 (1.6%) | 0 (0.0%) |
| $20,000 to $24,999 | 23 (1.8%) | 0 (0.0%) |
| $25,000 to $34,999 | 89 (7.1%) | 0 (0.0%) |
| $35,000 to $49,999 | 239 (19.0%) | 15 (17.2%) |
| $50,000 to $74,999 | 263 (21.0%) | 45 (51.7%) |
| $75,000 to $99,999 | 151 (12.0%) | 0 (0.0%) |
| $100,000 to $149,999 | 224 (17.8%) | 0 (0.0%) |
| $150,000 or more | 233 (18.6%) | 0 (0.0%) |
| Total | 1,255 (100.0%) | 87 (100.0%) |
Monthly Housing Cost Tiers in Wanakah
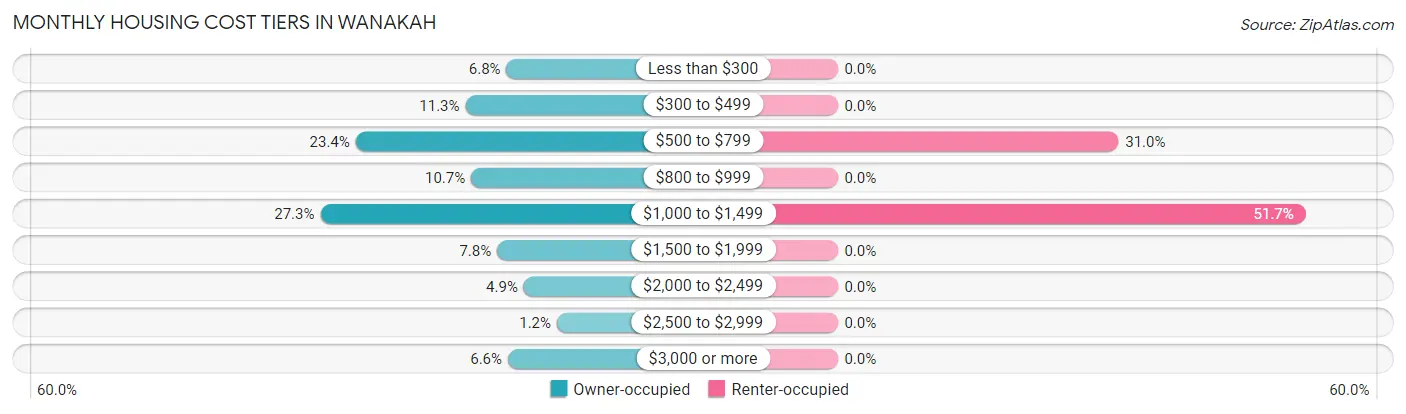
| Monthly Cost | Owner-occupied | Renter-occupied |
| Less than $300 | 85 (6.8%) | 0 (0.0%) |
| $300 to $499 | 142 (11.3%) | 0 (0.0%) |
| $500 to $799 | 294 (23.4%) | 27 (31.0%) |
| $800 to $999 | 134 (10.7%) | 0 (0.0%) |
| $1,000 to $1,499 | 343 (27.3%) | 45 (51.7%) |
| $1,500 to $1,999 | 98 (7.8%) | 0 (0.0%) |
| $2,000 to $2,499 | 61 (4.9%) | 0 (0.0%) |
| $2,500 to $2,999 | 15 (1.2%) | 0 (0.0%) |
| $3,000 or more | 83 (6.6%) | 0 (0.0%) |
| Total | 1,255 (100.0%) | 87 (100.0%) |
Physical Housing Characteristics in Wanakah
Housing Structures in Wanakah
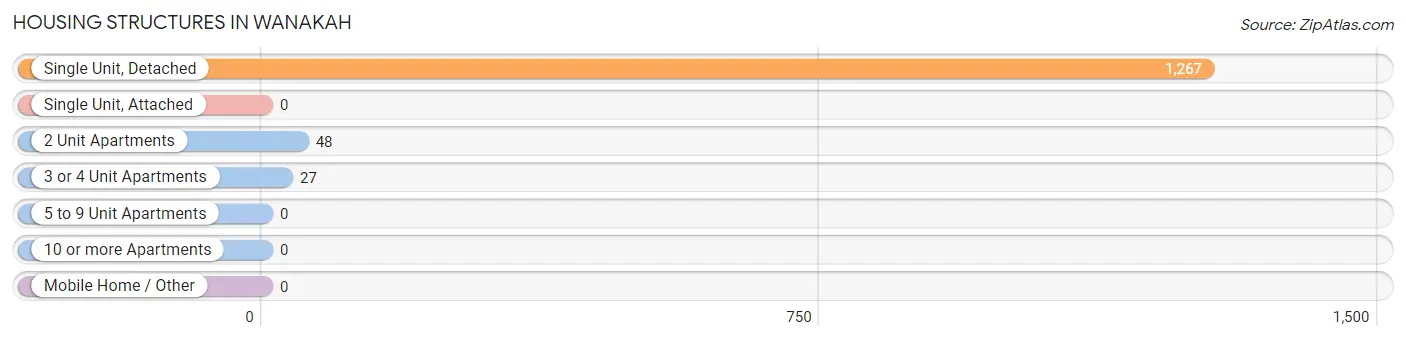
| Structure Type | # Housing Units | % Housing Units |
| Single Unit, Detached | 1,267 | 94.4% |
| Single Unit, Attached | 0 | 0.0% |
| 2 Unit Apartments | 48 | 3.6% |
| 3 or 4 Unit Apartments | 27 | 2.0% |
| 5 to 9 Unit Apartments | 0 | 0.0% |
| 10 or more Apartments | 0 | 0.0% |
| Mobile Home / Other | 0 | 0.0% |
| Total | 1,342 | 100.0% |
Housing Structures by Occupancy in Wanakah
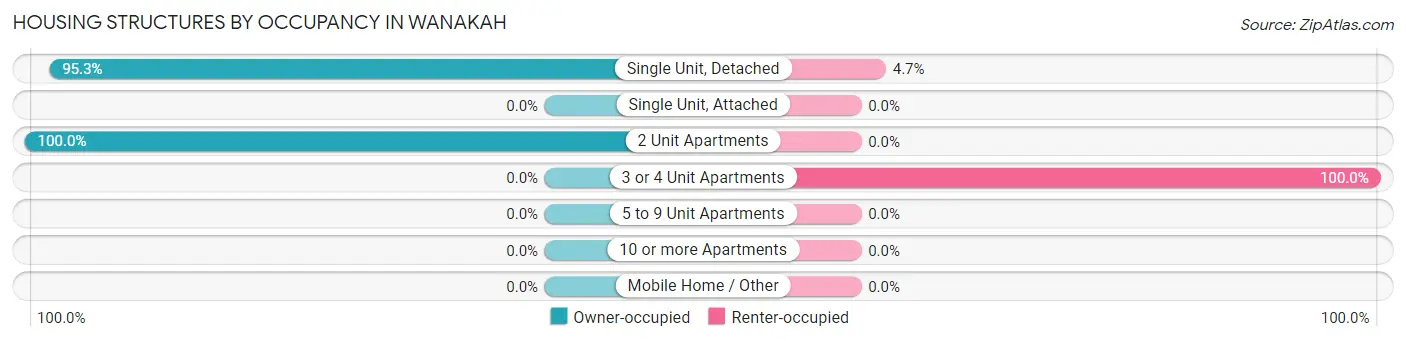
| Structure Type | Owner-occupied | Renter-occupied |
| Single Unit, Detached | 1,207 (95.3%) | 60 (4.7%) |
| Single Unit, Attached | 0 (0.0%) | 0 (0.0%) |
| 2 Unit Apartments | 48 (100.0%) | 0 (0.0%) |
| 3 or 4 Unit Apartments | 0 (0.0%) | 27 (100.0%) |
| 5 to 9 Unit Apartments | 0 (0.0%) | 0 (0.0%) |
| 10 or more Apartments | 0 (0.0%) | 0 (0.0%) |
| Mobile Home / Other | 0 (0.0%) | 0 (0.0%) |
| Total | 1,255 (93.5%) | 87 (6.5%) |
Housing Structures by Number of Rooms in Wanakah
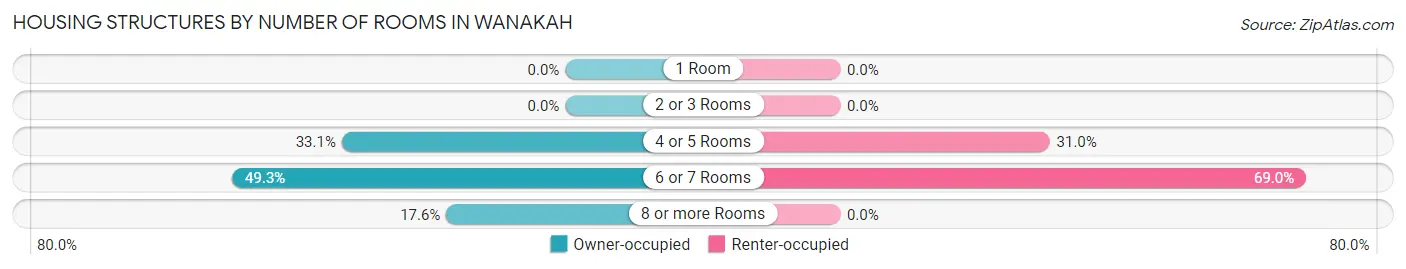
| Number of Rooms | Owner-occupied | Renter-occupied |
| 1 Room | 0 (0.0%) | 0 (0.0%) |
| 2 or 3 Rooms | 0 (0.0%) | 0 (0.0%) |
| 4 or 5 Rooms | 415 (33.1%) | 27 (31.0%) |
| 6 or 7 Rooms | 619 (49.3%) | 60 (69.0%) |
| 8 or more Rooms | 221 (17.6%) | 0 (0.0%) |
| Total | 1,255 (100.0%) | 87 (100.0%) |
Housing Structure by Heating Type in Wanakah
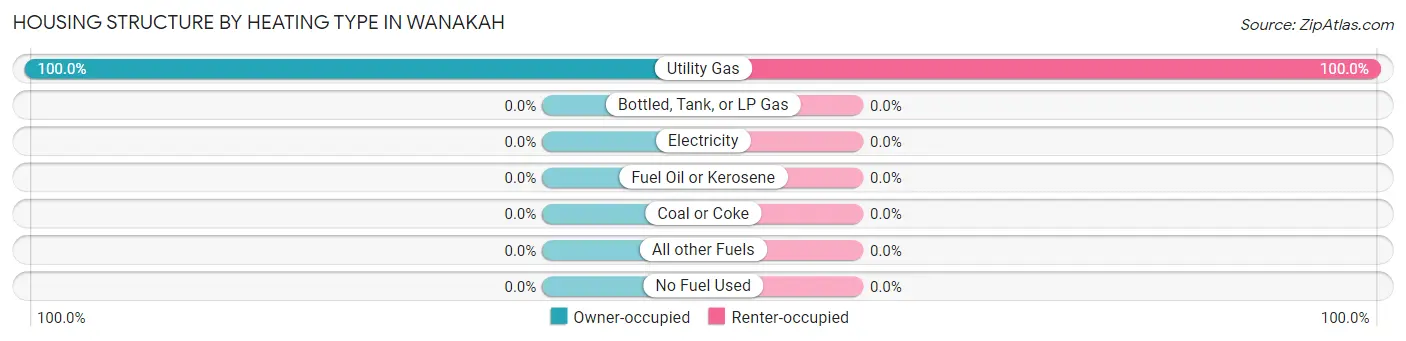
| Heating Type | Owner-occupied | Renter-occupied |
| Utility Gas | 1,255 (100.0%) | 87 (100.0%) |
| Bottled, Tank, or LP Gas | 0 (0.0%) | 0 (0.0%) |
| Electricity | 0 (0.0%) | 0 (0.0%) |
| Fuel Oil or Kerosene | 0 (0.0%) | 0 (0.0%) |
| Coal or Coke | 0 (0.0%) | 0 (0.0%) |
| All other Fuels | 0 (0.0%) | 0 (0.0%) |
| No Fuel Used | 0 (0.0%) | 0 (0.0%) |
| Total | 1,255 (100.0%) | 87 (100.0%) |
Household Vehicle Usage in Wanakah

| Vehicles per Household | Owner-occupied | Renter-occupied |
| No Vehicle | 57 (4.5%) | 15 (17.2%) |
| 1 Vehicle | 317 (25.3%) | 72 (82.8%) |
| 2 Vehicles | 671 (53.5%) | 0 (0.0%) |
| 3 or more Vehicles | 210 (16.7%) | 0 (0.0%) |
| Total | 1,255 (100.0%) | 87 (100.0%) |
Real Estate & Mortgages in Wanakah
Real Estate and Mortgage Overview in Wanakah
| Characteristic | Without Mortgage | With Mortgage |
| Housing Units | 526 | 729 |
| Median Property Value | $163,900 | $173,000 |
| Median Household Income | $62,440 | $189 |
| Monthly Housing Costs | $605 | $83 |
| Real Estate Taxes | $3,909 | $0 |
Property Value by Mortgage Status in Wanakah
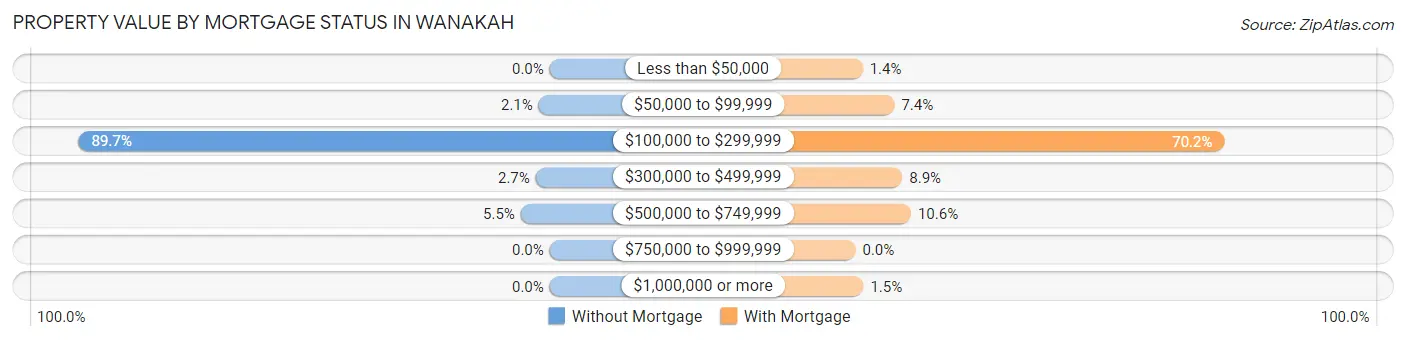
| Property Value | Without Mortgage | With Mortgage |
| Less than $50,000 | 0 (0.0%) | 10 (1.4%) |
| $50,000 to $99,999 | 11 (2.1%) | 54 (7.4%) |
| $100,000 to $299,999 | 472 (89.7%) | 512 (70.2%) |
| $300,000 to $499,999 | 14 (2.7%) | 65 (8.9%) |
| $500,000 to $749,999 | 29 (5.5%) | 77 (10.6%) |
| $750,000 to $999,999 | 0 (0.0%) | 0 (0.0%) |
| $1,000,000 or more | 0 (0.0%) | 11 (1.5%) |
| Total | 526 (100.0%) | 729 (100.0%) |
Household Income by Mortgage Status in Wanakah
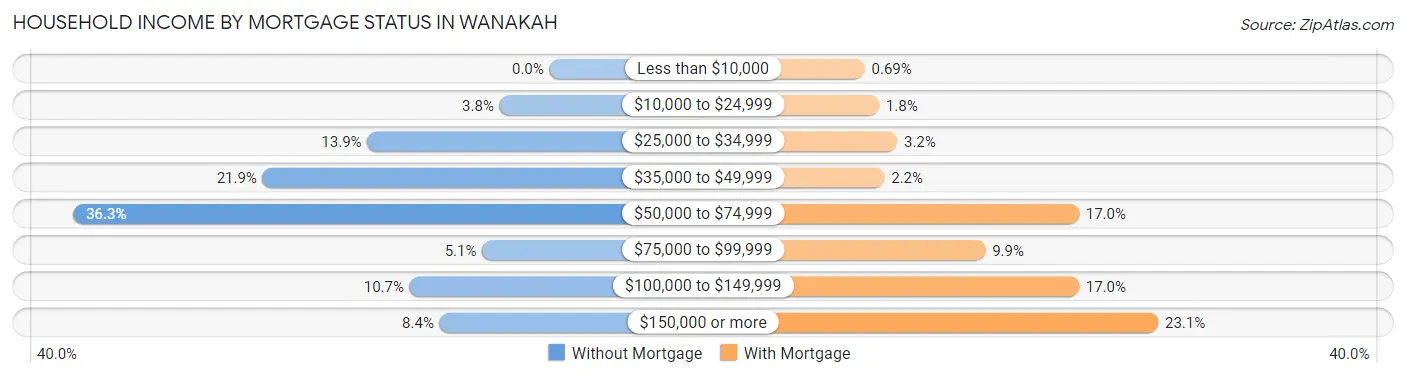
| Household Income | Without Mortgage | With Mortgage |
| Less than $10,000 | 0 (0.0%) | 5 (0.7%) |
| $10,000 to $24,999 | 20 (3.8%) | 13 (1.8%) |
| $25,000 to $34,999 | 73 (13.9%) | 23 (3.2%) |
| $35,000 to $49,999 | 115 (21.9%) | 16 (2.2%) |
| $50,000 to $74,999 | 191 (36.3%) | 124 (17.0%) |
| $75,000 to $99,999 | 27 (5.1%) | 72 (9.9%) |
| $100,000 to $149,999 | 56 (10.6%) | 124 (17.0%) |
| $150,000 or more | 44 (8.4%) | 168 (23.1%) |
| Total | 526 (100.0%) | 729 (100.0%) |
Property Value to Household Income Ratio in Wanakah
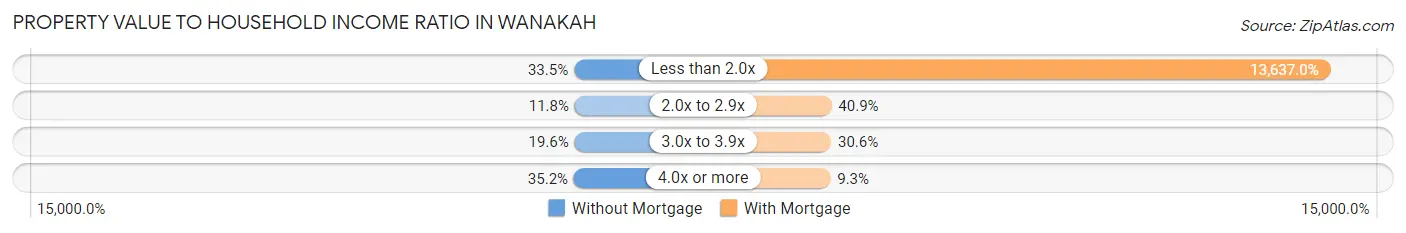
| Value-to-Income Ratio | Without Mortgage | With Mortgage |
| Less than 2.0x | 176 (33.5%) | 99,414 (13,637.0%) |
| 2.0x to 2.9x | 62 (11.8%) | 298 (40.9%) |
| 3.0x to 3.9x | 103 (19.6%) | 223 (30.6%) |
| 4.0x or more | 185 (35.2%) | 68 (9.3%) |
| Total | 526 (100.0%) | 729 (100.0%) |
Real Estate Taxes by Mortgage Status in Wanakah
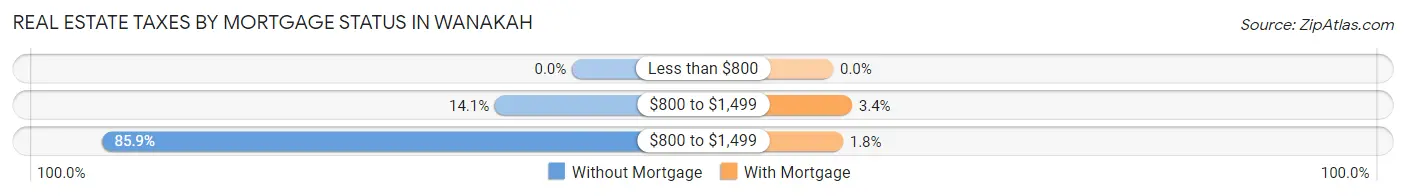
| Property Taxes | Without Mortgage | With Mortgage |
| Less than $800 | 0 (0.0%) | 0 (0.0%) |
| $800 to $1,499 | 74 (14.1%) | 25 (3.4%) |
| $800 to $1,499 | 452 (85.9%) | 13 (1.8%) |
| Total | 526 (100.0%) | 729 (100.0%) |
Health & Disability in Wanakah
Health Insurance Coverage by Age in Wanakah
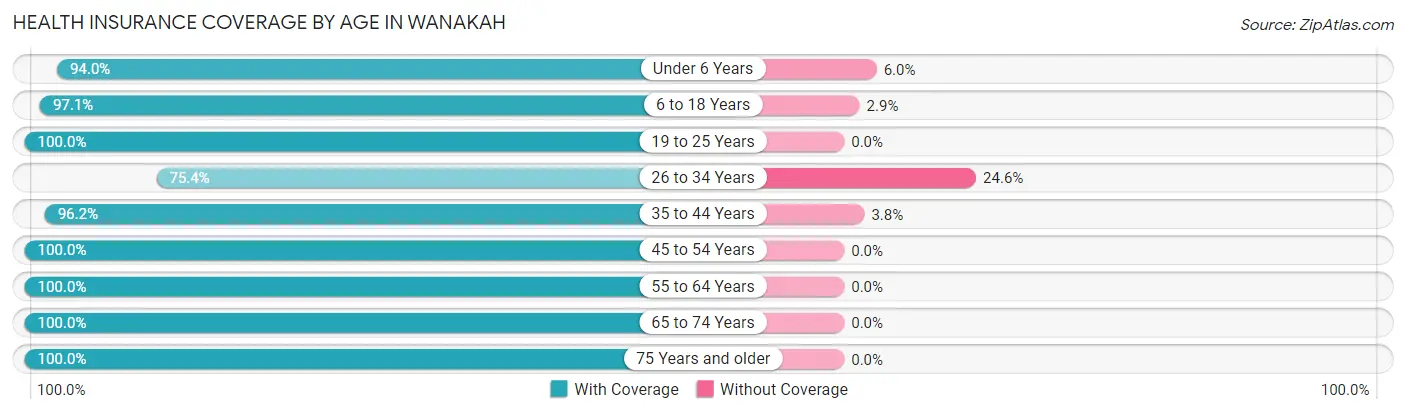
| Age Bracket | With Coverage | Without Coverage |
| Under 6 Years | 311 (94.0%) | 20 (6.0%) |
| 6 to 18 Years | 305 (97.1%) | 9 (2.9%) |
| 19 to 25 Years | 177 (100.0%) | 0 (0.0%) |
| 26 to 34 Years | 273 (75.4%) | 89 (24.6%) |
| 35 to 44 Years | 256 (96.2%) | 10 (3.8%) |
| 45 to 54 Years | 492 (100.0%) | 0 (0.0%) |
| 55 to 64 Years | 575 (100.0%) | 0 (0.0%) |
| 65 to 74 Years | 498 (100.0%) | 0 (0.0%) |
| 75 Years and older | 143 (100.0%) | 0 (0.0%) |
| Total | 3,030 (96.0%) | 128 (4.1%) |
Health Insurance Coverage by Citizenship Status in Wanakah
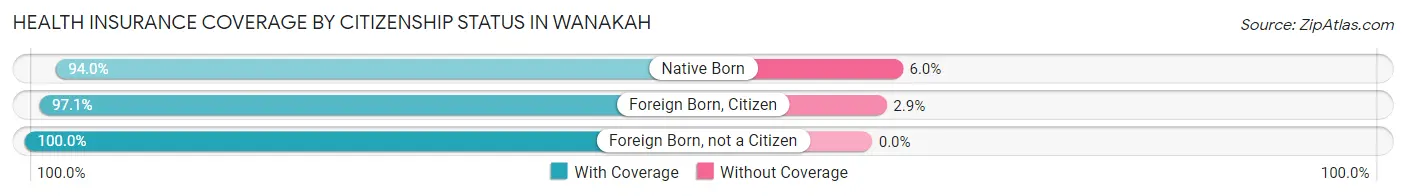
| Citizenship Status | With Coverage | Without Coverage |
| Native Born | 311 (94.0%) | 20 (6.0%) |
| Foreign Born, Citizen | 305 (97.1%) | 9 (2.9%) |
| Foreign Born, not a Citizen | 177 (100.0%) | 0 (0.0%) |
Health Insurance Coverage by Household Income in Wanakah
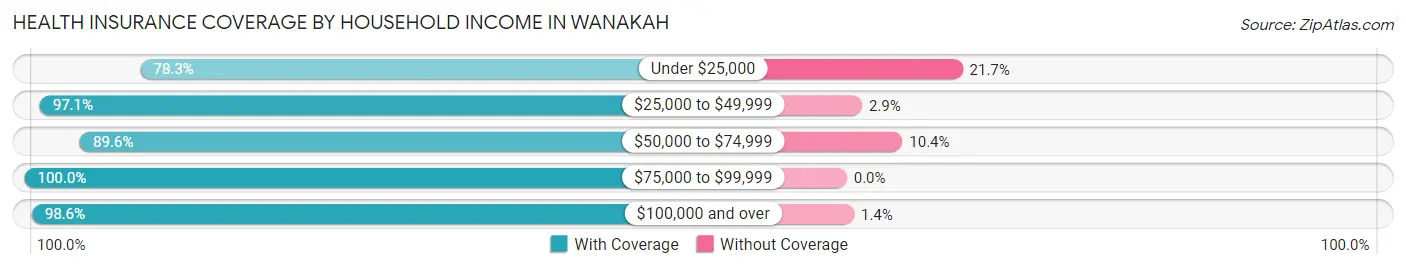
| Household Income | With Coverage | Without Coverage |
| Under $25,000 | 83 (78.3%) | 23 (21.7%) |
| $25,000 to $49,999 | 645 (97.1%) | 19 (2.9%) |
| $50,000 to $74,999 | 568 (89.6%) | 66 (10.4%) |
| $75,000 to $99,999 | 279 (100.0%) | 0 (0.0%) |
| $100,000 and over | 1,455 (98.6%) | 20 (1.4%) |
Public vs Private Health Insurance Coverage by Age in Wanakah
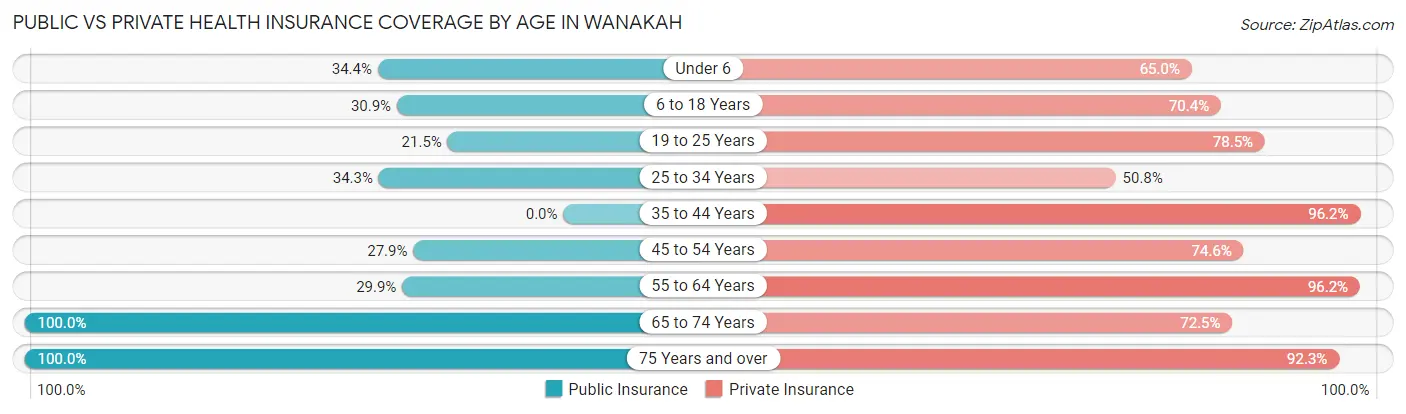
| Age Bracket | Public Insurance | Private Insurance |
| Under 6 | 114 (34.4%) | 215 (64.9%) |
| 6 to 18 Years | 97 (30.9%) | 221 (70.4%) |
| 19 to 25 Years | 38 (21.5%) | 139 (78.5%) |
| 25 to 34 Years | 124 (34.3%) | 184 (50.8%) |
| 35 to 44 Years | 0 (0.0%) | 256 (96.2%) |
| 45 to 54 Years | 137 (27.9%) | 367 (74.6%) |
| 55 to 64 Years | 172 (29.9%) | 553 (96.2%) |
| 65 to 74 Years | 498 (100.0%) | 361 (72.5%) |
| 75 Years and over | 143 (100.0%) | 132 (92.3%) |
| Total | 1,323 (41.9%) | 2,428 (76.9%) |
Disability Status by Sex by Age in Wanakah
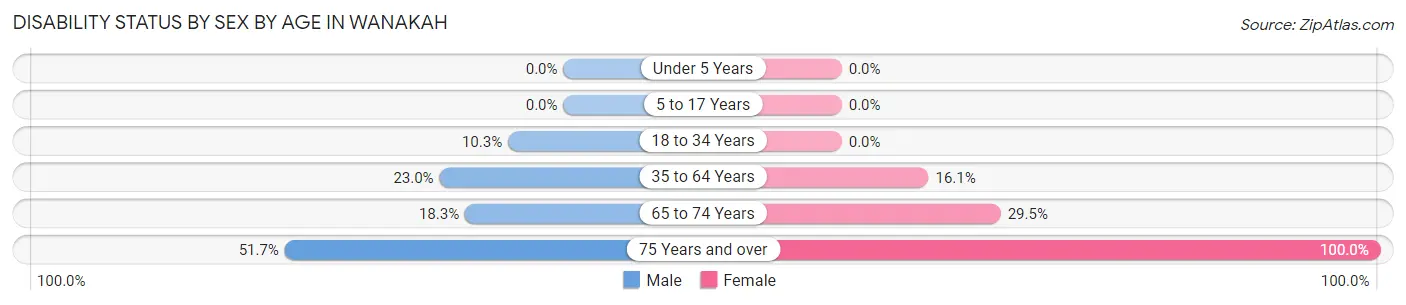
| Age Bracket | Male | Female |
| Under 5 Years | 0 (0.0%) | 0 (0.0%) |
| 5 to 17 Years | 0 (0.0%) | 0 (0.0%) |
| 18 to 34 Years | 29 (10.3%) | 0 (0.0%) |
| 35 to 64 Years | 161 (23.0%) | 102 (16.1%) |
| 65 to 74 Years | 21 (18.3%) | 113 (29.5%) |
| 75 Years and over | 30 (51.7%) | 85 (100.0%) |
Disability Class by Sex by Age in Wanakah
Disability Class: Hearing Difficulty
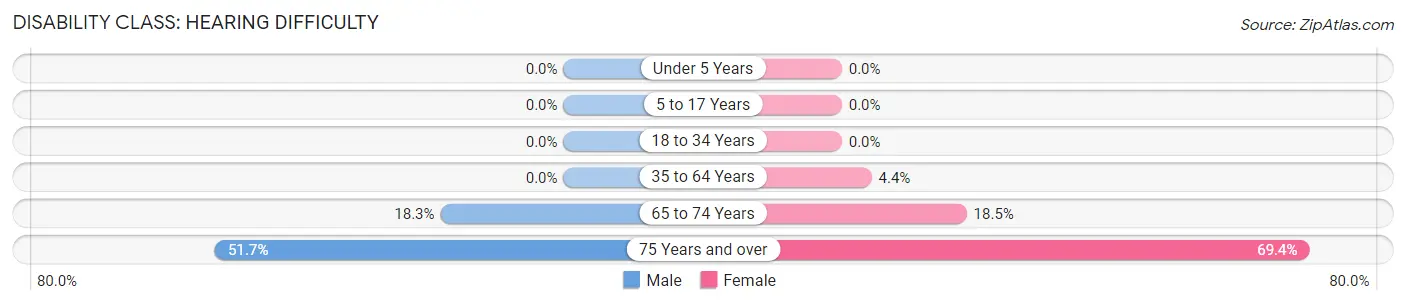
| Age Bracket | Male | Female |
| Under 5 Years | 0 (0.0%) | 0 (0.0%) |
| 5 to 17 Years | 0 (0.0%) | 0 (0.0%) |
| 18 to 34 Years | 0 (0.0%) | 0 (0.0%) |
| 35 to 64 Years | 0 (0.0%) | 28 (4.4%) |
| 65 to 74 Years | 21 (18.3%) | 71 (18.5%) |
| 75 Years and over | 30 (51.7%) | 59 (69.4%) |
Disability Class: Vision Difficulty
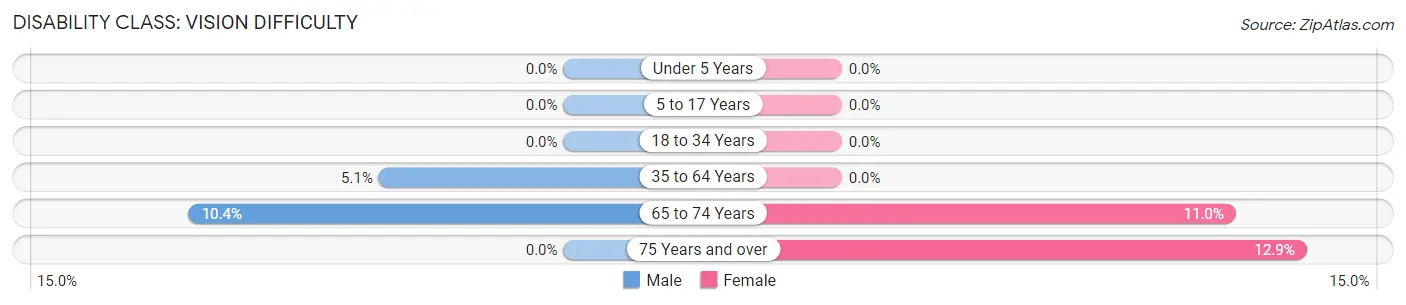
| Age Bracket | Male | Female |
| Under 5 Years | 0 (0.0%) | 0 (0.0%) |
| 5 to 17 Years | 0 (0.0%) | 0 (0.0%) |
| 18 to 34 Years | 0 (0.0%) | 0 (0.0%) |
| 35 to 64 Years | 36 (5.1%) | 0 (0.0%) |
| 65 to 74 Years | 12 (10.4%) | 42 (11.0%) |
| 75 Years and over | 0 (0.0%) | 11 (12.9%) |
Disability Class: Cognitive Difficulty
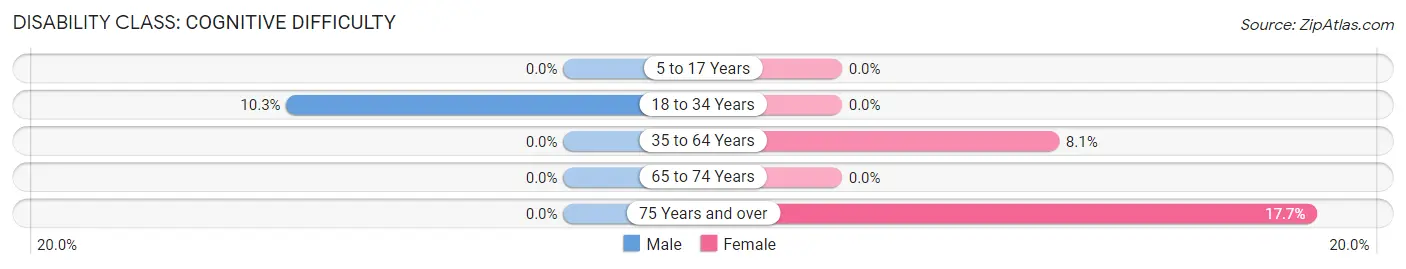
| Age Bracket | Male | Female |
| 5 to 17 Years | 0 (0.0%) | 0 (0.0%) |
| 18 to 34 Years | 29 (10.3%) | 0 (0.0%) |
| 35 to 64 Years | 0 (0.0%) | 51 (8.1%) |
| 65 to 74 Years | 0 (0.0%) | 0 (0.0%) |
| 75 Years and over | 0 (0.0%) | 15 (17.6%) |
Disability Class: Ambulatory Difficulty
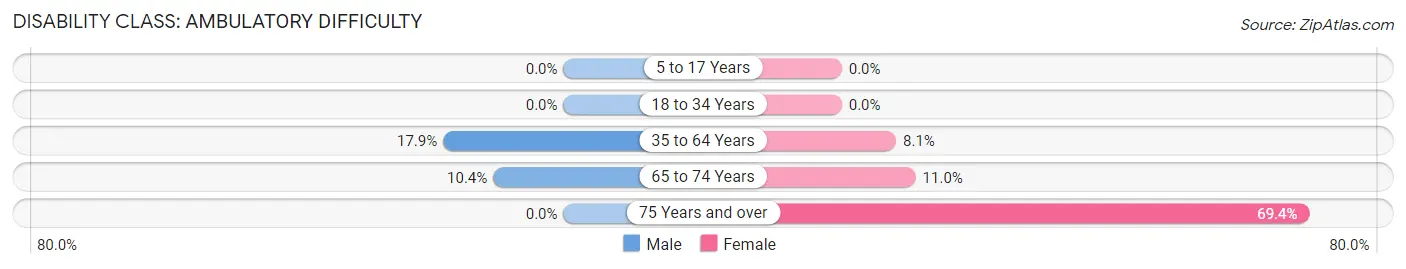
| Age Bracket | Male | Female |
| 5 to 17 Years | 0 (0.0%) | 0 (0.0%) |
| 18 to 34 Years | 0 (0.0%) | 0 (0.0%) |
| 35 to 64 Years | 125 (17.9%) | 51 (8.1%) |
| 65 to 74 Years | 12 (10.4%) | 42 (11.0%) |
| 75 Years and over | 0 (0.0%) | 59 (69.4%) |
Disability Class: Self-Care Difficulty
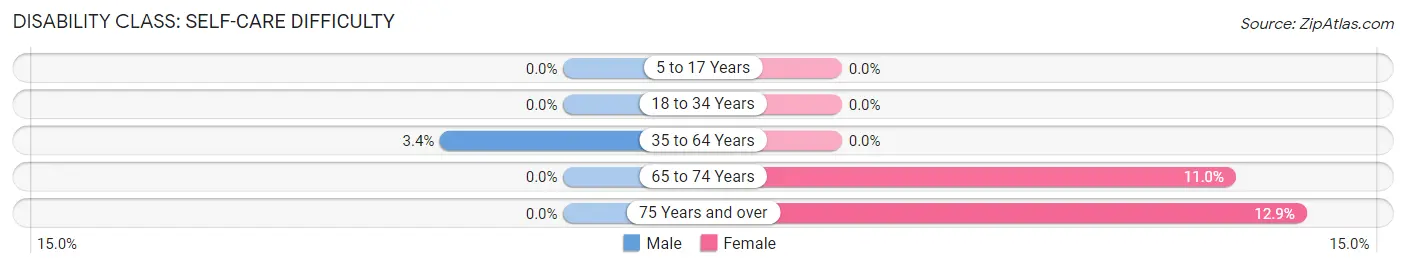
| Age Bracket | Male | Female |
| 5 to 17 Years | 0 (0.0%) | 0 (0.0%) |
| 18 to 34 Years | 0 (0.0%) | 0 (0.0%) |
| 35 to 64 Years | 24 (3.4%) | 0 (0.0%) |
| 65 to 74 Years | 0 (0.0%) | 42 (11.0%) |
| 75 Years and over | 0 (0.0%) | 11 (12.9%) |
Technology Access in Wanakah
Computing Device Access in Wanakah
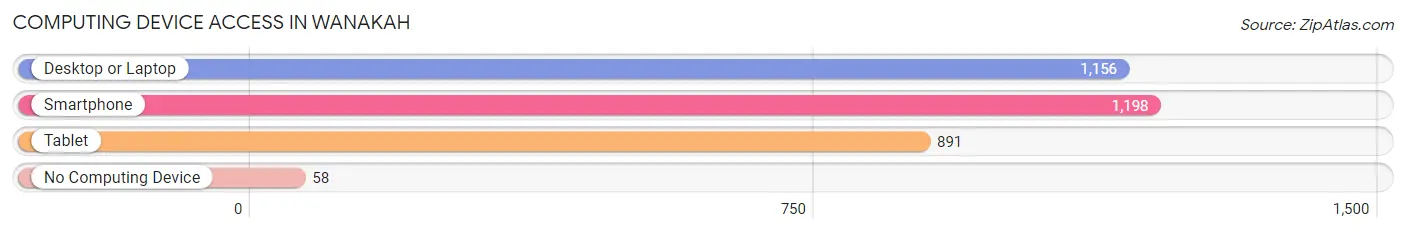
| Device Type | # Households | % Households |
| Desktop or Laptop | 1,156 | 86.1% |
| Smartphone | 1,198 | 89.3% |
| Tablet | 891 | 66.4% |
| No Computing Device | 58 | 4.3% |
| Total | 1,342 | 100.0% |
Internet Access in Wanakah
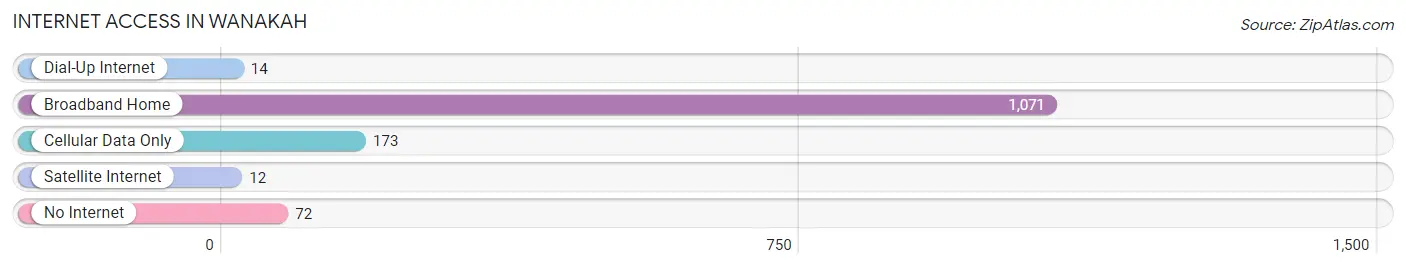
| Internet Type | # Households | % Households |
| Dial-Up Internet | 14 | 1.0% |
| Broadband Home | 1,071 | 79.8% |
| Cellular Data Only | 173 | 12.9% |
| Satellite Internet | 12 | 0.9% |
| No Internet | 72 | 5.4% |
| Total | 1,342 | 100.0% |
Wanakah Summary
WANAKAH NY HISTORY GEOGRAPHY ECONOMY AND DEMOGRAPHICS
History
The small town of Wanakah, New York is located in the town of Hamburg in Erie County. It is situated on the shores of Lake Erie, just south of Buffalo. The area was first settled in the early 1800s by a group of German immigrants who named the area after their hometown of Wanakah, Germany. The town was officially incorporated in 1851 and has since grown to become a popular summer destination for tourists and locals alike.
The town of Wanakah has a rich history that dates back to the early 1800s. The first settlers in the area were German immigrants who named the area after their hometown of Wanakah, Germany. The town was officially incorporated in 1851 and has since grown to become a popular summer destination for tourists and locals alike.
The town of Wanakah has a long history of industry and commerce. In the late 1800s, the town was home to several factories, including a paper mill, a sawmill, and a tannery. The town also had a thriving fishing industry, with several fish canneries located along the lake.
In the early 1900s, the town began to experience a decline in industry and commerce. This was due in part to the Great Depression, which caused many of the factories to close. However, the town was able to rebound in the 1950s and 1960s, when it became a popular summer destination for tourists and locals alike.
Geography
The town of Wanakah is located in the town of Hamburg in Erie County, New York. It is situated on the shores of Lake Erie, just south of Buffalo. The town is bordered by the towns of Evans and Brant to the north, the town of Orchard Park to the east, and the town of Hamburg to the south.
The town of Wanakah is located in a flat, low-lying area. The terrain is mostly flat, with some rolling hills in the northern part of the town. The town is located in a temperate climate, with warm summers and cold winters.
The town of Wanakah is home to several parks and recreational areas, including Wanakah Beach, Wanakah Park, and Wanakah State Park. The town also has several marinas and boat launches, making it a popular destination for boaters and fishermen.
Economy
The town of Wanakah has a strong economy that is largely based on tourism. The town is home to several hotels, restaurants, and other businesses that cater to tourists. The town also has several marinas and boat launches, making it a popular destination for boaters and fishermen.
The town of Wanakah also has a strong manufacturing sector. The town is home to several factories, including a paper mill, a sawmill, and a tannery. The town also has several fish canneries located along the lake.
Demographics
The town of Wanakah has a population of approximately 2,500 people. The town is predominantly white, with a small percentage of African Americans and Hispanics. The median household income in the town is $50,000, and the median home value is $150,000.
The town of Wanakah is served by the Hamburg Central School District. The district has three elementary schools, one middle school, and one high school. The town also has several private schools, including a Catholic school and a Montessori school.
Conclusion
The town of Wanakah, New York is a small town located in the town of Hamburg in Erie County. It is situated on the shores of Lake Erie, just south of Buffalo. The town has a rich history that dates back to the early 1800s, and it has a strong economy that is largely based on tourism. The town is predominantly white, with a small percentage of African Americans and Hispanics. The town is served by the Hamburg Central School District, and it has several parks and recreational areas, making it a popular destination for tourists and locals alike.
Common Questions
What is Per Capita Income in Wanakah?
Per Capita income in Wanakah is $39,641.
What is the Median Family Income in Wanakah?
Median Family Income in Wanakah is $74,333.
What is the Median Household income in Wanakah?
Median Household Income in Wanakah is $72,614.
What is Income or Wage Gap in Wanakah?
Income or Wage Gap in Wanakah is 30.4%.
Women in Wanakah earn 69.6 cents for every dollar earned by a man.
What is Inequality or Gini Index in Wanakah?
Inequality or Gini Index in Wanakah is 0.37.
What is the Total Population of Wanakah?
Total Population of Wanakah is 3,158.
What is the Total Male Population of Wanakah?
Total Male Population of Wanakah is 1,368.
What is the Total Female Population of Wanakah?
Total Female Population of Wanakah is 1,790.
What is the Ratio of Males per 100 Females in Wanakah?
There are 76.42 Males per 100 Females in Wanakah.
What is the Ratio of Females per 100 Males in Wanakah?
There are 130.85 Females per 100 Males in Wanakah.
What is the Median Population Age in Wanakah?
Median Population Age in Wanakah is 47.4 Years.
What is the Average Family Size in Wanakah
Average Family Size in Wanakah is 2.8 People.
What is the Average Household Size in Wanakah
Average Household Size in Wanakah is 2.4 People.
How Large is the Labor Force in Wanakah?
There are 1,641 People in the Labor Forcein in Wanakah.
What is the Percentage of People in the Labor Force in Wanakah?
63.2% of People are in the Labor Force in Wanakah.
What is the Unemployment Rate in Wanakah?
Unemployment Rate in Wanakah is 3.1%.