Rhinecliff, NY Map & Demographics
Rhinecliff Map
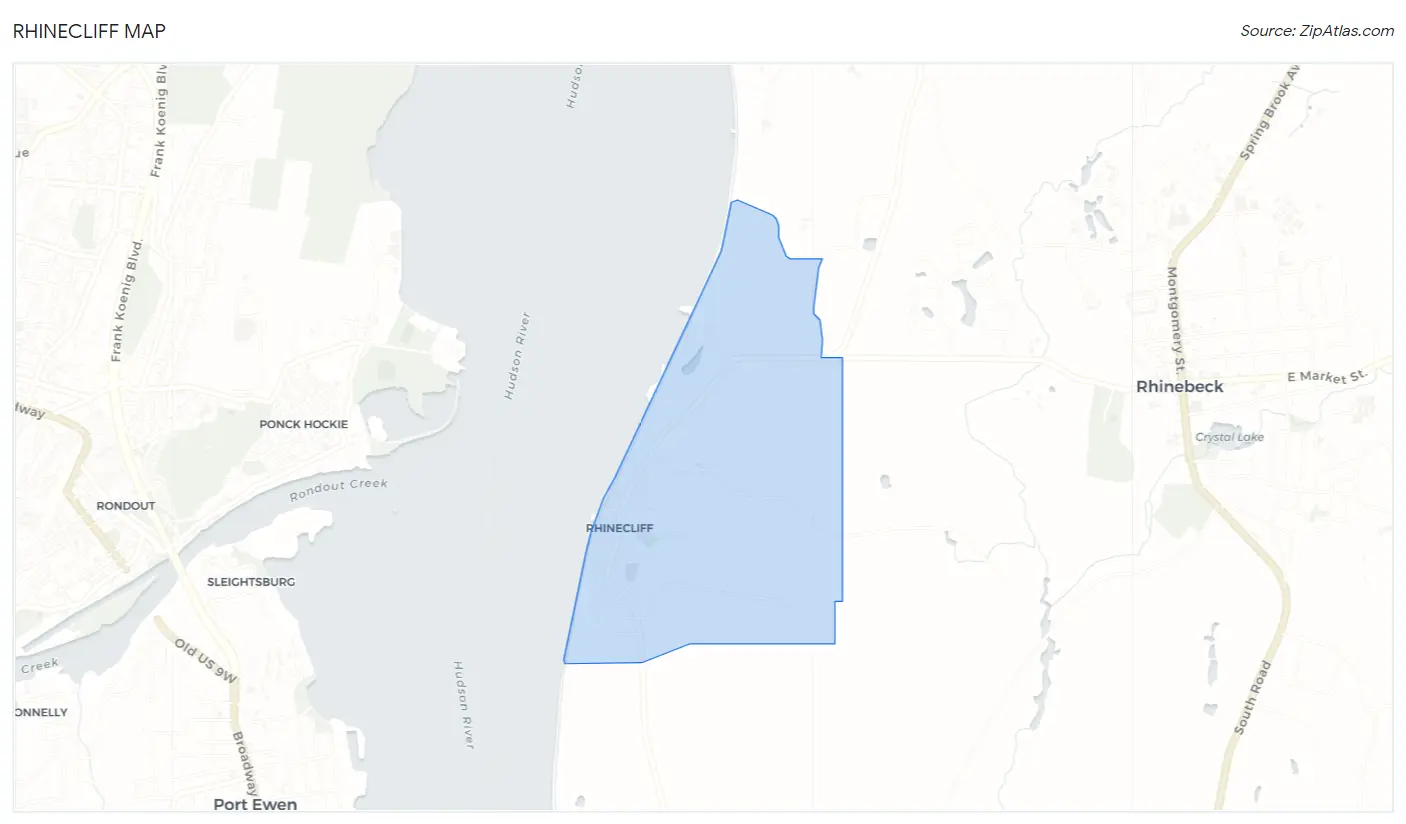
Rhinecliff Overview
$73,736
PER CAPITA INCOME
$196,250
AVG FAMILY INCOME
27.2%
WAGE / INCOME GAP [ % ]
72.8¢/ $1
WAGE / INCOME GAP [ $ ]
0.42
INEQUALITY / GINI INDEX
386
TOTAL POPULATION
170
MALE POPULATION
216
FEMALE POPULATION
78.70
MALES / 100 FEMALES
127.06
FEMALES / 100 MALES
60.9
MEDIAN AGE
2.5
AVG FAMILY SIZE
2.0
AVG HOUSEHOLD SIZE
225
LABOR FORCE [ PEOPLE ]
63.2%
PERCENT IN LABOR FORCE
3.6%
UNEMPLOYMENT RATE
Rhinecliff Zip Codes
Income in Rhinecliff
Income Overview in Rhinecliff
| Characteristic | Number | Measure |
| Per Capita Income | 386 | $73,736 |
| Median Family Income | 86 | $196,250 |
| Mean Family Income | 86 | $225,213 |
| Median Household Income | 197 | $0 |
| Mean Household Income | 197 | $145,725 |
| Income Deficit | 86 | $0 |
| Wage / Income Gap (%) | 386 | 27.16% |
| Wage / Income Gap ($) | 386 | 72.84¢ per $1 |
| Gini / Inequality Index | 386 | 0.42 |
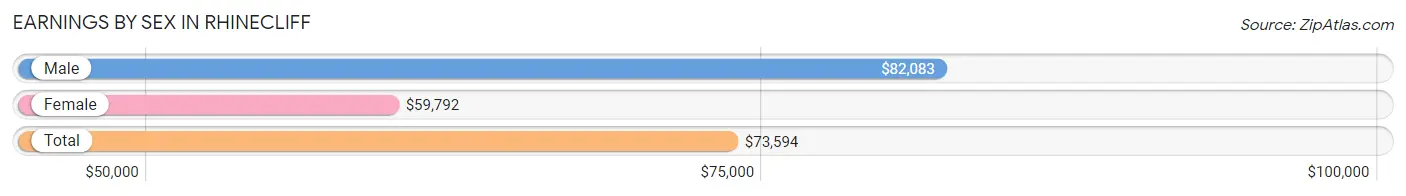
Earnings by Sex in Rhinecliff
Average Earnings in Rhinecliff are $73,594, $82,083 for men and $59,792 for women, a difference of 27.2%.
| Sex | Number | Average Earnings |
| Male | 146 (62.1%) | $82,083 |
| Female | 89 (37.9%) | $59,792 |
| Total | 235 (100.0%) | $73,594 |
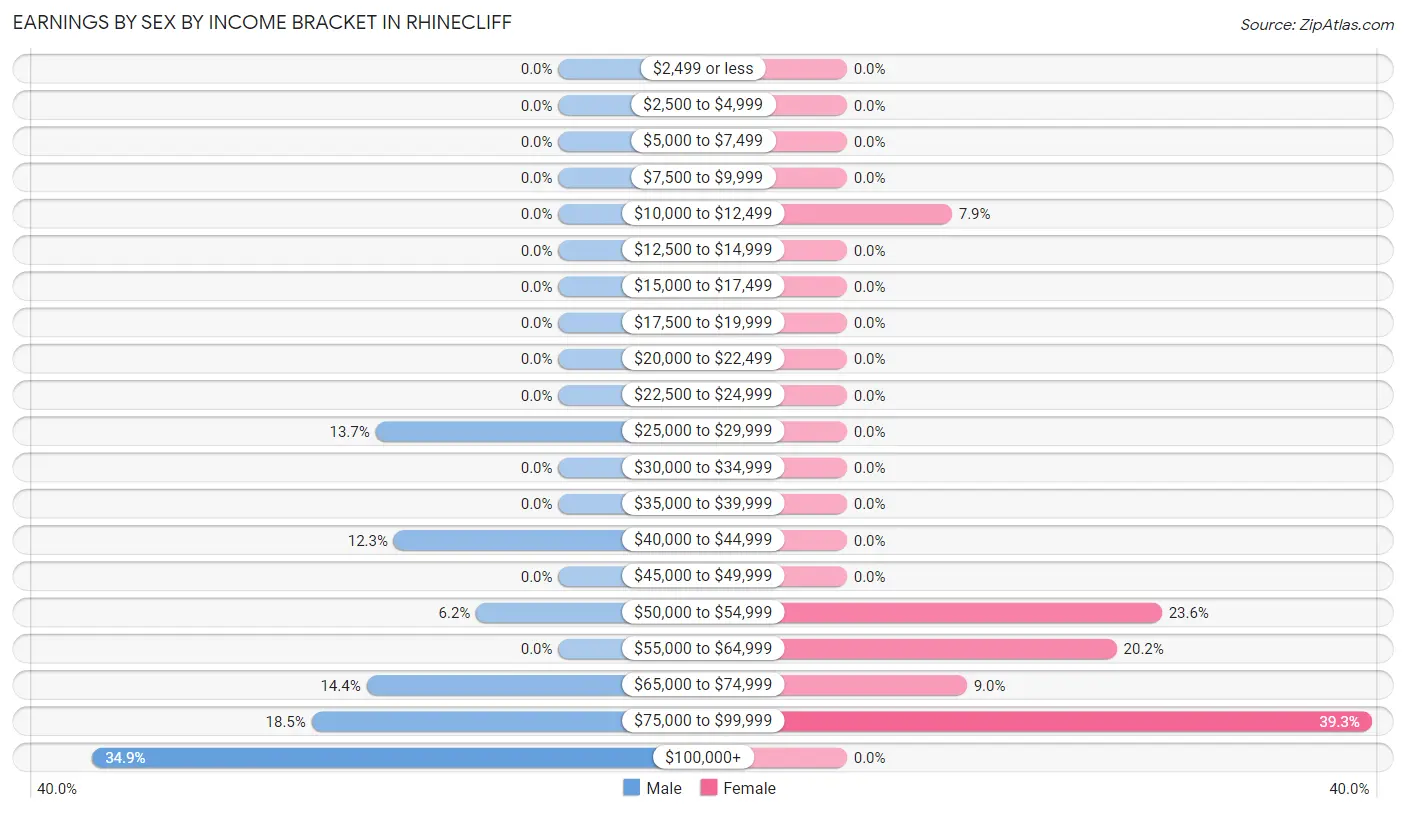
Earnings by Sex by Income Bracket in Rhinecliff
The most common earnings brackets in Rhinecliff are $100,000+ for men (51 | 34.9%) and $75,000 to $99,999 for women (35 | 39.3%).
| Income | Male | Female |
| $2,499 or less | 0 (0.0%) | 0 (0.0%) |
| $2,500 to $4,999 | 0 (0.0%) | 0 (0.0%) |
| $5,000 to $7,499 | 0 (0.0%) | 0 (0.0%) |
| $7,500 to $9,999 | 0 (0.0%) | 0 (0.0%) |
| $10,000 to $12,499 | 0 (0.0%) | 7 (7.9%) |
| $12,500 to $14,999 | 0 (0.0%) | 0 (0.0%) |
| $15,000 to $17,499 | 0 (0.0%) | 0 (0.0%) |
| $17,500 to $19,999 | 0 (0.0%) | 0 (0.0%) |
| $20,000 to $22,499 | 0 (0.0%) | 0 (0.0%) |
| $22,500 to $24,999 | 0 (0.0%) | 0 (0.0%) |
| $25,000 to $29,999 | 20 (13.7%) | 0 (0.0%) |
| $30,000 to $34,999 | 0 (0.0%) | 0 (0.0%) |
| $35,000 to $39,999 | 0 (0.0%) | 0 (0.0%) |
| $40,000 to $44,999 | 18 (12.3%) | 0 (0.0%) |
| $45,000 to $49,999 | 0 (0.0%) | 0 (0.0%) |
| $50,000 to $54,999 | 9 (6.2%) | 21 (23.6%) |
| $55,000 to $64,999 | 0 (0.0%) | 18 (20.2%) |
| $65,000 to $74,999 | 21 (14.4%) | 8 (9.0%) |
| $75,000 to $99,999 | 27 (18.5%) | 35 (39.3%) |
| $100,000+ | 51 (34.9%) | 0 (0.0%) |
| Total | 146 (100.0%) | 89 (100.0%) |
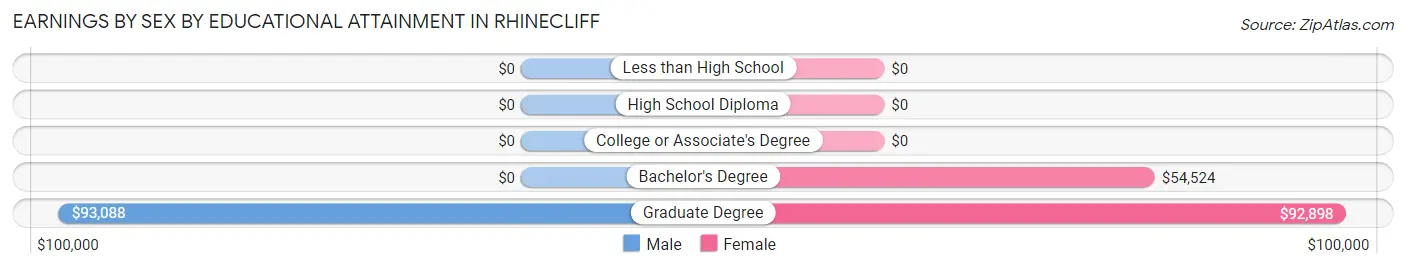
Earnings by Sex by Educational Attainment in Rhinecliff
Average earnings in Rhinecliff are $82,083 for men and $59,792 for women, a difference of 27.2%. Men with an educational attainment of graduate degree enjoy the highest average annual earnings of $93,088, while those with graduate degree education earn the least with $93,088. Women with an educational attainment of graduate degree earn the most with the average annual earnings of $92,898, while those with bachelor's degree education have the smallest earnings of $54,524.
| Educational Attainment | Male Income | Female Income |
| Less than High School | - | - |
| High School Diploma | - | - |
| College or Associate's Degree | - | - |
| Bachelor's Degree | - | - |
| Graduate Degree | $93,088 | $92,898 |
| Total | $82,083 | $59,792 |
Family Income in Rhinecliff
Family Income Brackets in Rhinecliff
According to the Rhinecliff family income data, there are 40 families falling into the $200,000+ income range, which is the most common income bracket and makes up 46.5% of all families.
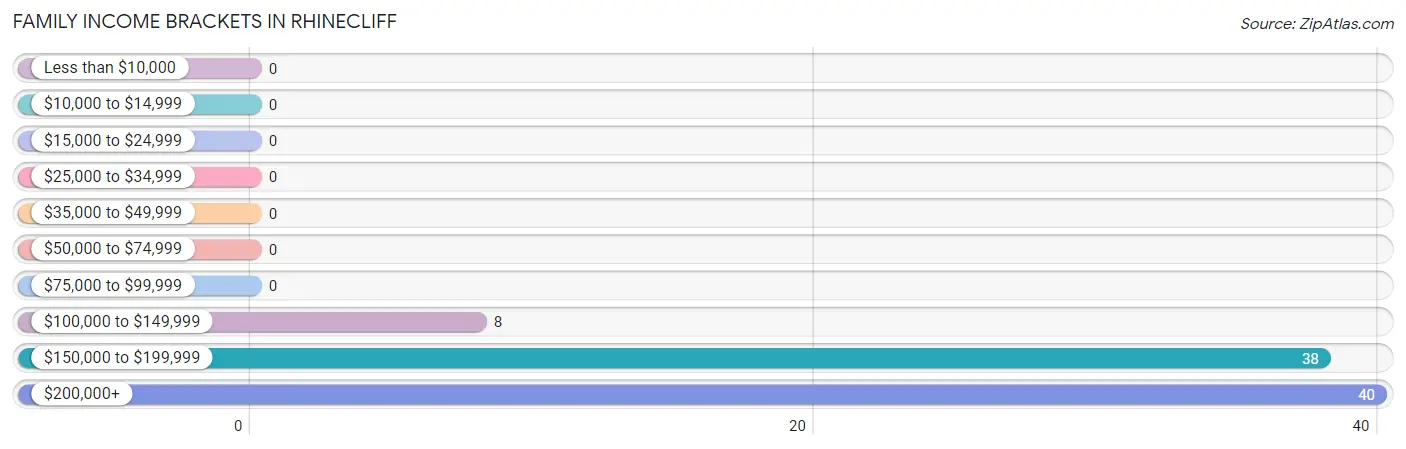
| Income Bracket | # Families | % Families |
| Less than $10,000 | 0 | 0.0% |
| $10,000 to $14,999 | 0 | 0.0% |
| $15,000 to $24,999 | 0 | 0.0% |
| $25,000 to $34,999 | 0 | 0.0% |
| $35,000 to $49,999 | 0 | 0.0% |
| $50,000 to $74,999 | 0 | 0.0% |
| $75,000 to $99,999 | 0 | 0.0% |
| $100,000 to $149,999 | 8 | 9.3% |
| $150,000 to $199,999 | 38 | 44.2% |
| $200,000+ | 40 | 46.5% |
Family Income by Famaliy Size in Rhinecliff
3-person families (37 | 43.0%) account for the highest median family income in Rhinecliff with $234,145 per family, while 2-person families (49 | 57.0%) have the highest median income of $80,938 per family member.
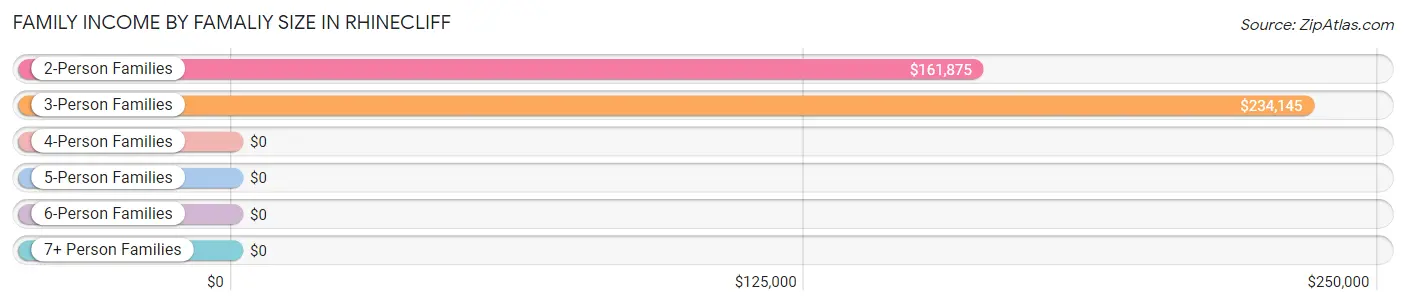
| Income Bracket | # Families | Median Income |
| 2-Person Families | 49 (57.0%) | $161,875 |
| 3-Person Families | 37 (43.0%) | $234,145 |
| 4-Person Families | 0 (0.0%) | $0 |
| 5-Person Families | 0 (0.0%) | $0 |
| 6-Person Families | 0 (0.0%) | $0 |
| 7+ Person Families | 0 (0.0%) | $0 |
| Total | 86 (100.0%) | $196,250 |
Family Income by Number of Earners in Rhinecliff
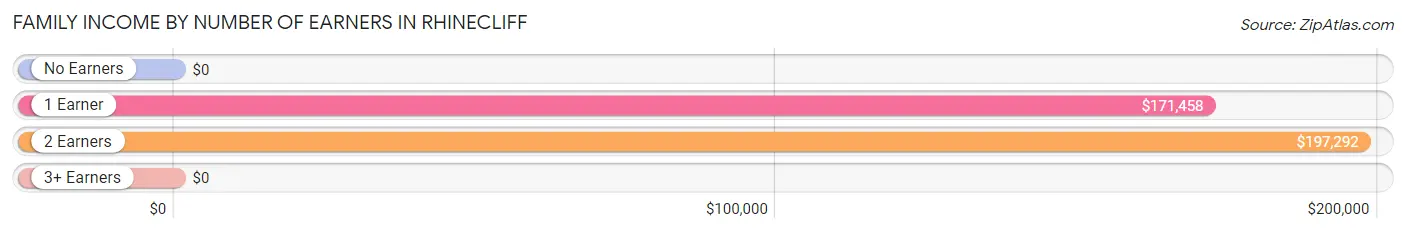
| Number of Earners | # Families | Median Income |
| No Earners | 0 (0.0%) | $0 |
| 1 Earner | 23 (26.7%) | $171,458 |
| 2 Earners | 63 (73.3%) | $197,292 |
| 3+ Earners | 0 (0.0%) | $0 |
| Total | 86 (100.0%) | $196,250 |
Household Income in Rhinecliff
Household Income Brackets in Rhinecliff
With 79 households falling in the category, the $50,000 to $74,999 income range is the most frequent in Rhinecliff, accounting for 40.1% of all households.
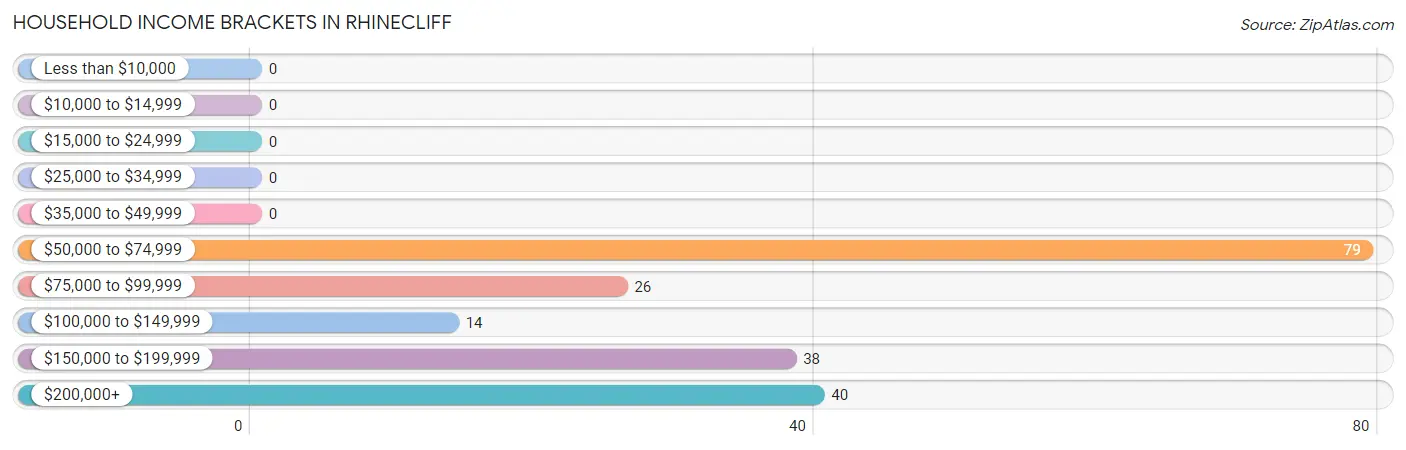
| Income Bracket | # Households | % Households |
| Less than $10,000 | 0 | 0.0% |
| $10,000 to $14,999 | 0 | 0.0% |
| $15,000 to $24,999 | 0 | 0.0% |
| $25,000 to $34,999 | 0 | 0.0% |
| $35,000 to $49,999 | 0 | 0.0% |
| $50,000 to $74,999 | 79 | 40.1% |
| $75,000 to $99,999 | 26 | 13.2% |
| $100,000 to $149,999 | 14 | 7.1% |
| $150,000 to $199,999 | 38 | 19.3% |
| $200,000+ | 40 | 20.3% |
Household Income by Householder Age in Rhinecliff
The median household income in Rhinecliff is $0, with the highest median household income of $114,063 found in the 45 to 64 years age bracket for the primary householder. A total of 74 households (37.6%) fall into this category.
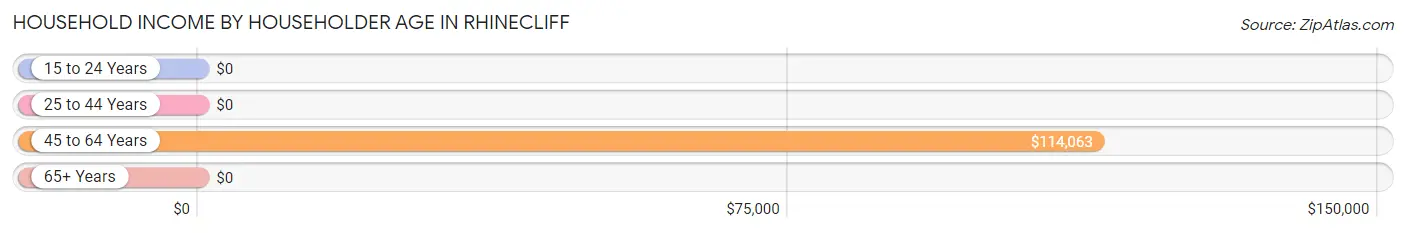
| Income Bracket | # Households | Median Income |
| 15 to 24 Years | 0 (0.0%) | $0 |
| 25 to 44 Years | 16 (8.1%) | $0 |
| 45 to 64 Years | 74 (37.6%) | $114,063 |
| 65+ Years | 107 (54.3%) | $0 |
| Total | 197 (100.0%) | $0 |
Poverty in Rhinecliff
Income Below Poverty by Sex and Age in Rhinecliff
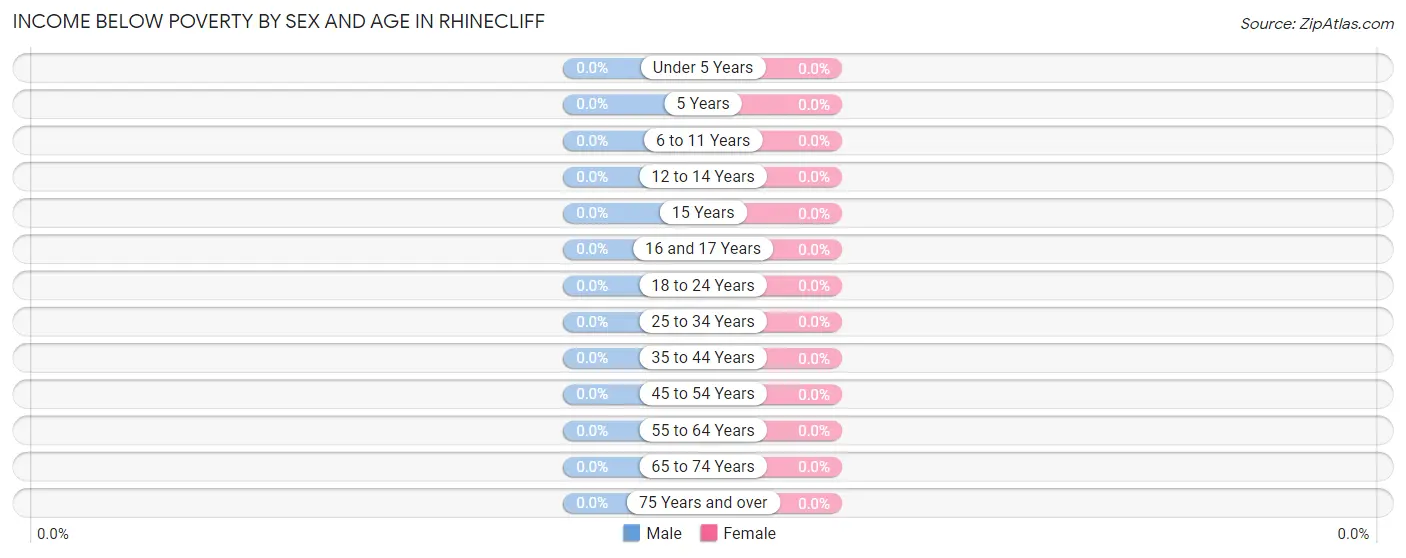
| Age Bracket | Male | Female |
| Under 5 Years | 0 (0.0%) | 0 (0.0%) |
| 5 Years | 0 (0.0%) | 0 (0.0%) |
| 6 to 11 Years | 0 (0.0%) | 0 (0.0%) |
| 12 to 14 Years | 0 (0.0%) | 0 (0.0%) |
| 15 Years | 0 (0.0%) | 0 (0.0%) |
| 16 and 17 Years | 0 (0.0%) | 0 (0.0%) |
| 18 to 24 Years | 0 (0.0%) | 0 (0.0%) |
| 25 to 34 Years | 0 (0.0%) | 0 (0.0%) |
| 35 to 44 Years | 0 (0.0%) | 0 (0.0%) |
| 45 to 54 Years | 0 (0.0%) | 0 (0.0%) |
| 55 to 64 Years | 0 (0.0%) | 0 (0.0%) |
| 65 to 74 Years | 0 (0.0%) | 0 (0.0%) |
| 75 Years and over | 0 (0.0%) | 0 (0.0%) |
| Total | 0 (0.0%) | 0 (0.0%) |
Income Above Poverty by Sex and Age in Rhinecliff
According to the poverty statistics in Rhinecliff, males aged under 5 years and females aged 6 to 11 years are the age groups that are most secure financially, with 100.0% of males and 100.0% of females in these age groups living above the poverty line.
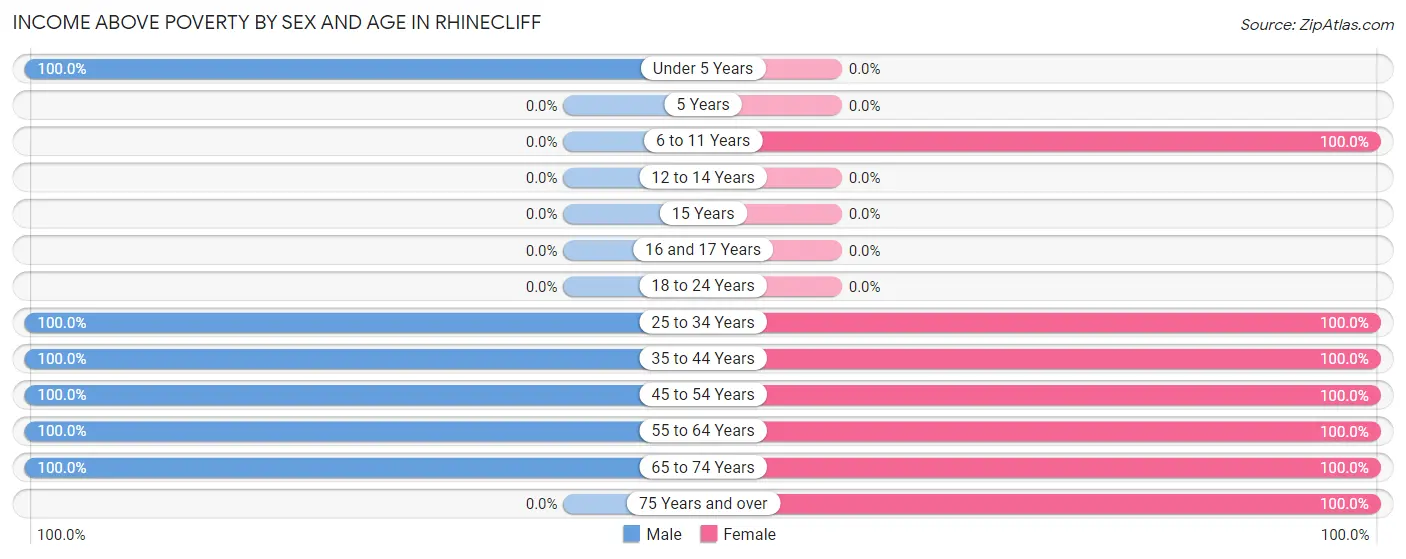
| Age Bracket | Male | Female |
| Under 5 Years | 16 (100.0%) | 0 (0.0%) |
| 5 Years | 0 (0.0%) | 0 (0.0%) |
| 6 to 11 Years | 0 (0.0%) | 14 (100.0%) |
| 12 to 14 Years | 0 (0.0%) | 0 (0.0%) |
| 15 Years | 0 (0.0%) | 0 (0.0%) |
| 16 and 17 Years | 0 (0.0%) | 0 (0.0%) |
| 18 to 24 Years | 0 (0.0%) | 0 (0.0%) |
| 25 to 34 Years | 25 (100.0%) | 34 (100.0%) |
| 35 to 44 Years | 12 (100.0%) | 18 (100.0%) |
| 45 to 54 Years | 26 (100.0%) | 29 (100.0%) |
| 55 to 64 Years | 56 (100.0%) | 15 (100.0%) |
| 65 to 74 Years | 35 (100.0%) | 8 (100.0%) |
| 75 Years and over | 0 (0.0%) | 98 (100.0%) |
| Total | 170 (100.0%) | 216 (100.0%) |
Income Below Poverty Among Married-Couple Families in Rhinecliff
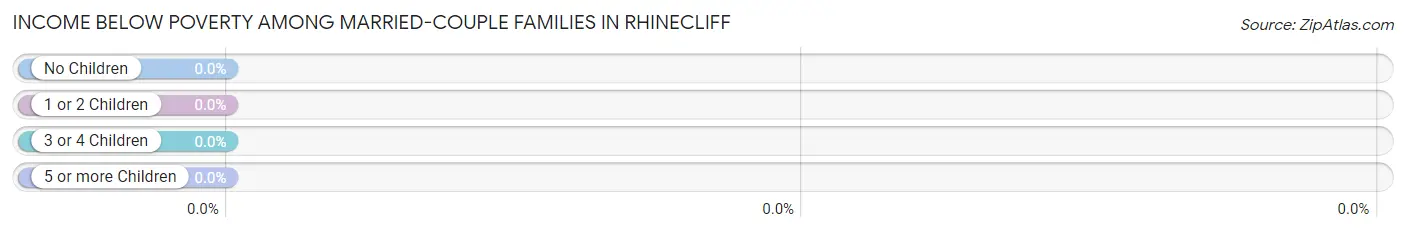
| Children | Above Poverty | Below Poverty |
| No Children | 49 (100.0%) | 0 (0.0%) |
| 1 or 2 Children | 18 (100.0%) | 0 (0.0%) |
| 3 or 4 Children | 0 (0.0%) | 0 (0.0%) |
| 5 or more Children | 0 (0.0%) | 0 (0.0%) |
| Total | 67 (100.0%) | 0 (0.0%) |
Income Below Poverty Among Single-Parent Households in Rhinecliff
| Children | Single Father | Single Mother |
| No Children | 0 (0.0%) | 0 (0.0%) |
| 1 or 2 Children | 0 (0.0%) | 0 (0.0%) |
| 3 or 4 Children | 0 (0.0%) | 0 (0.0%) |
| 5 or more Children | 0 (0.0%) | 0 (0.0%) |
| Total | 0 (0.0%) | 0 (0.0%) |
Income Below Poverty Among Married-Couple vs Single-Parent Households in Rhinecliff
| Children | Married-Couple Families | Single-Parent Households |
| No Children | 0 (0.0%) | 0 (0.0%) |
| 1 or 2 Children | 0 (0.0%) | 0 (0.0%) |
| 3 or 4 Children | 0 (0.0%) | 0 (0.0%) |
| 5 or more Children | 0 (0.0%) | 0 (0.0%) |
| Total | 0 (0.0%) | 0 (0.0%) |
Race in Rhinecliff
The most populous races in Rhinecliff are White / Caucasian (386 | 100.0%), and Hispanic or Latino (16 | 4.2%).
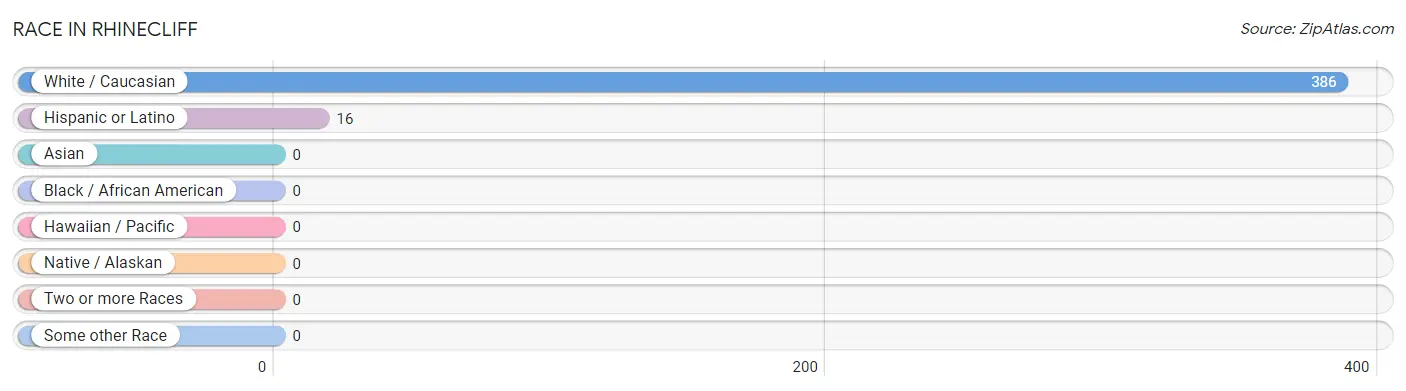
| Race | # Population | % Population |
| Asian | 0 | 0.0% |
| Black / African American | 0 | 0.0% |
| Hawaiian / Pacific | 0 | 0.0% |
| Hispanic or Latino | 16 | 4.2% |
| Native / Alaskan | 0 | 0.0% |
| White / Caucasian | 386 | 100.0% |
| Two or more Races | 0 | 0.0% |
| Some other Race | 0 | 0.0% |
| Total | 386 | 100.0% |
Ancestry in Rhinecliff
The most populous ancestries reported in Rhinecliff are Irish (104 | 26.9%), English (88 | 22.8%), Swedish (57 | 14.8%), American (56 | 14.5%), and Italian (20 | 5.2%), together accounting for 84.2% of all Rhinecliff residents.
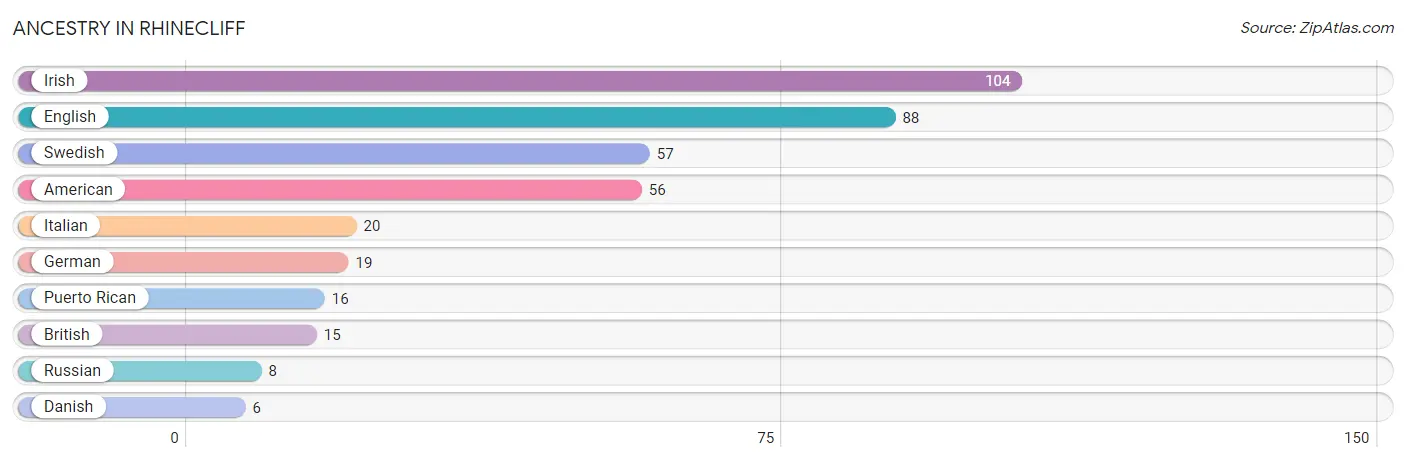
| Ancestry | # Population | % Population |
| American | 56 | 14.5% |
| British | 15 | 3.9% |
| Danish | 6 | 1.5% |
| English | 88 | 22.8% |
| German | 19 | 4.9% |
| Irish | 104 | 26.9% |
| Italian | 20 | 5.2% |
| Puerto Rican | 16 | 4.2% |
| Russian | 8 | 2.1% |
| Swedish | 57 | 14.8% | View All 10 Rows |
Immigrants in Rhinecliff

| Immigration Origin | # Population | % Population | View All 0 Rows |
Sex and Age in Rhinecliff
Sex and Age in Rhinecliff
The most populous age groups in Rhinecliff are 60 to 64 Years (56 | 32.9%) for men and 85 Years and over (98 | 45.4%) for women.
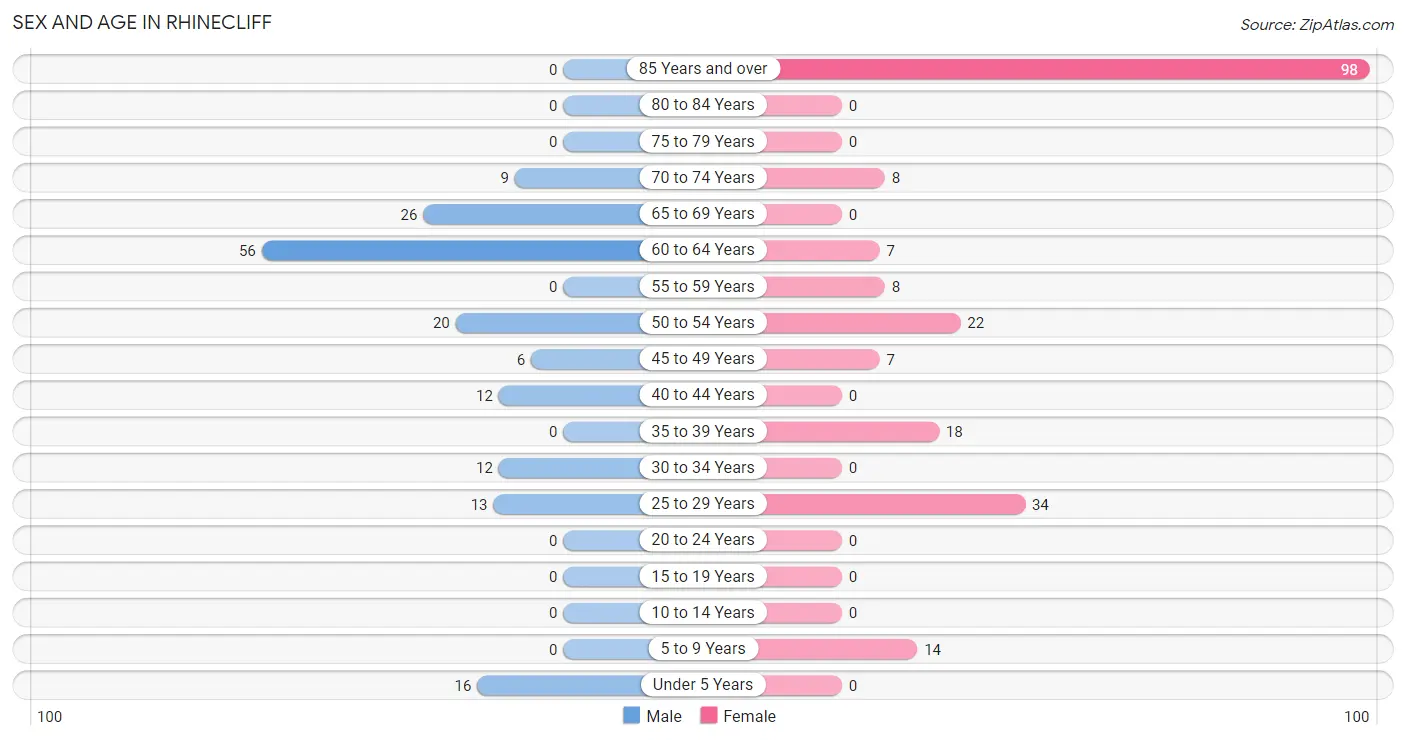
| Age Bracket | Male | Female |
| Under 5 Years | 16 (9.4%) | 0 (0.0%) |
| 5 to 9 Years | 0 (0.0%) | 14 (6.5%) |
| 10 to 14 Years | 0 (0.0%) | 0 (0.0%) |
| 15 to 19 Years | 0 (0.0%) | 0 (0.0%) |
| 20 to 24 Years | 0 (0.0%) | 0 (0.0%) |
| 25 to 29 Years | 13 (7.6%) | 34 (15.7%) |
| 30 to 34 Years | 12 (7.1%) | 0 (0.0%) |
| 35 to 39 Years | 0 (0.0%) | 18 (8.3%) |
| 40 to 44 Years | 12 (7.1%) | 0 (0.0%) |
| 45 to 49 Years | 6 (3.5%) | 7 (3.2%) |
| 50 to 54 Years | 20 (11.8%) | 22 (10.2%) |
| 55 to 59 Years | 0 (0.0%) | 8 (3.7%) |
| 60 to 64 Years | 56 (32.9%) | 7 (3.2%) |
| 65 to 69 Years | 26 (15.3%) | 0 (0.0%) |
| 70 to 74 Years | 9 (5.3%) | 8 (3.7%) |
| 75 to 79 Years | 0 (0.0%) | 0 (0.0%) |
| 80 to 84 Years | 0 (0.0%) | 0 (0.0%) |
| 85 Years and over | 0 (0.0%) | 98 (45.4%) |
| Total | 170 (100.0%) | 216 (100.0%) |
Families and Households in Rhinecliff
Median Family Size in Rhinecliff
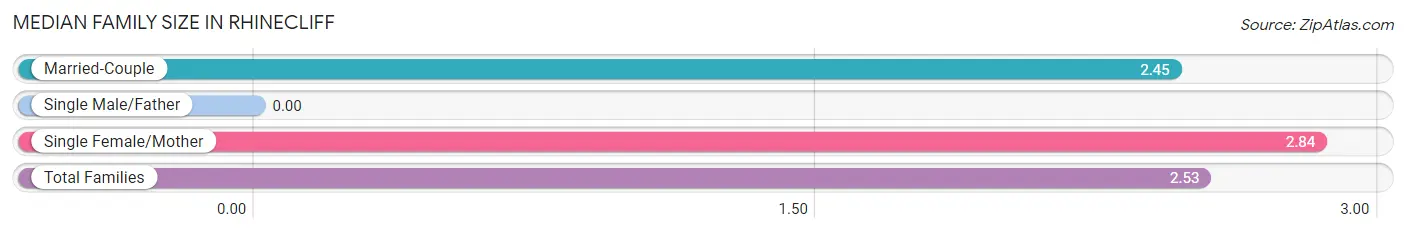
| Family Type | # Families | Family Size |
| Married-Couple | 67 (77.9%) | 2.45 |
| Single Male/Father | 0 (0.0%) | - |
| Single Female/Mother | 19 (22.1%) | 2.84 |
| Total Families | 86 (100.0%) | 2.53 |
Median Household Size in Rhinecliff
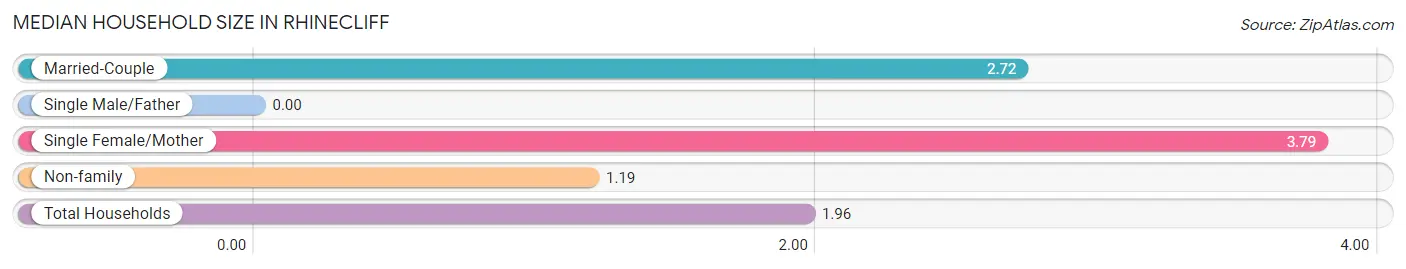
| Household Type | # Households | Household Size |
| Married-Couple | 67 (34.0%) | 2.72 |
| Single Male/Father | 0 (0.0%) | - |
| Single Female/Mother | 19 (9.6%) | 3.79 |
| Non-family | 111 (56.4%) | 1.19 |
| Total Households | 197 (100.0%) | 1.96 |
Household Size by Marriage Status in Rhinecliff
Out of a total of 197 households in Rhinecliff, 86 (43.6%) are family households, while 111 (56.4%) are nonfamily households. The most numerous type of family households are 2-person households, comprising 40, and the most common type of nonfamily households are 1-person households, comprising 91.
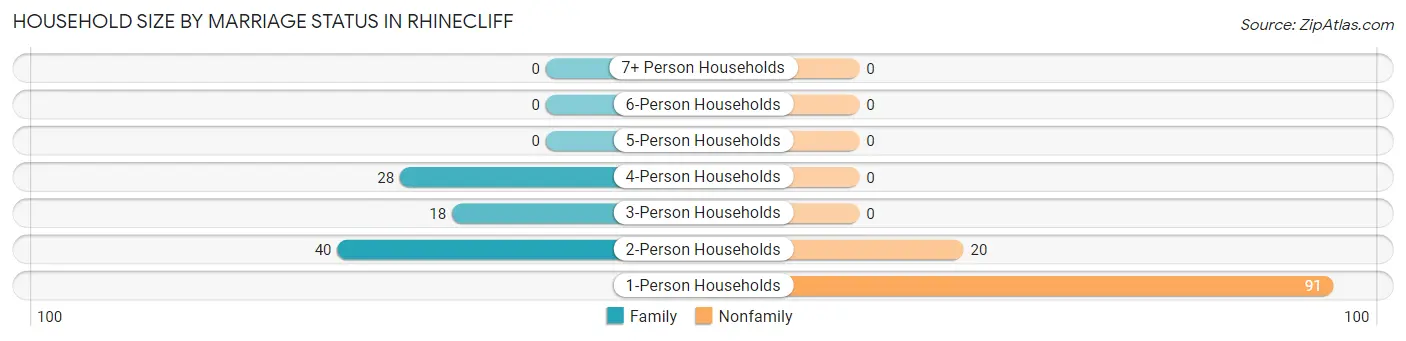
| Household Size | Family Households | Nonfamily Households |
| 1-Person Households | - | 91 (46.2%) |
| 2-Person Households | 40 (20.3%) | 20 (10.2%) |
| 3-Person Households | 18 (9.1%) | 0 (0.0%) |
| 4-Person Households | 28 (14.2%) | 0 (0.0%) |
| 5-Person Households | 0 (0.0%) | 0 (0.0%) |
| 6-Person Households | 0 (0.0%) | 0 (0.0%) |
| 7+ Person Households | 0 (0.0%) | 0 (0.0%) |
| Total | 86 (43.6%) | 111 (56.4%) |
Female Fertility in Rhinecliff
Fertility by Age in Rhinecliff
| Age Bracket | Women with Births | Births / 1,000 Women |
| 15 to 19 years | 0 (0.0%) | 0.0 |
| 20 to 34 years | 0 (0.0%) | 0.0 |
| 35 to 50 years | 0 (0.0%) | 0.0 |
| Total | 0 (0.0%) | 0.0 |
Fertility by Age by Marriage Status in Rhinecliff
| Age Bracket | Married | Unmarried |
| 15 to 19 years | 0 (0.0%) | 0 (0.0%) |
| 20 to 34 years | 0 (0.0%) | 0 (0.0%) |
| 35 to 50 years | 0 (0.0%) | 0 (0.0%) |
| Total | 0 (0.0%) | 0 (0.0%) |
Fertility by Education in Rhinecliff
| Educational Attainment | Women with Births | Births / 1,000 Women |
| Less than High School | 0 (0.0%) | 0.0 |
| High School Diploma | 0 (0.0%) | 0.0 |
| College or Associate's Degree | 0 (0.0%) | 0.0 |
| Bachelor's Degree | 0 (0.0%) | 0.0 |
| Graduate Degree | 0 (0.0%) | 0.0 |
| Total | 0 (0.0%) | 0.0 |
Fertility by Education by Marriage Status in Rhinecliff
| Educational Attainment | Married | Unmarried |
| Less than High School | 0 (0.0%) | 0 (0.0%) |
| High School Diploma | 0 (0.0%) | 0 (0.0%) |
| College or Associate's Degree | 0 (0.0%) | 0 (0.0%) |
| Bachelor's Degree | 0 (0.0%) | 0 (0.0%) |
| Graduate Degree | 0 (0.0%) | 0 (0.0%) |
| Total | 0 (0.0%) | 0 (0.0%) |
Employment Characteristics in Rhinecliff
Employment by Class of Employer in Rhinecliff
Among the 217 employed individuals in Rhinecliff, private company employees (62 | 28.6%), local government employees (59 | 27.2%), and state government employees (33 | 15.2%) make up the most common classes of employment.
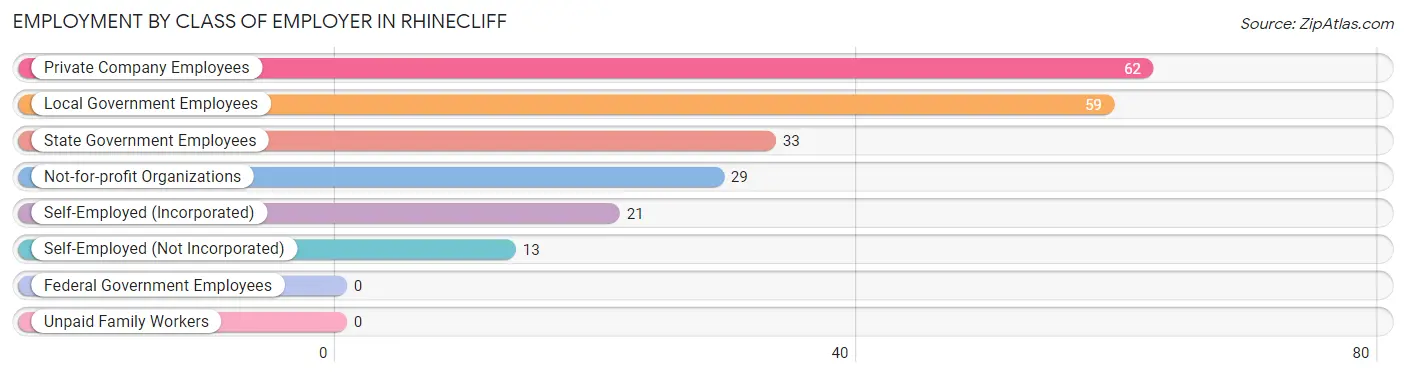
| Employer Class | # Employees | % Employees |
| Private Company Employees | 62 | 28.6% |
| Self-Employed (Incorporated) | 21 | 9.7% |
| Self-Employed (Not Incorporated) | 13 | 6.0% |
| Not-for-profit Organizations | 29 | 13.4% |
| Local Government Employees | 59 | 27.2% |
| State Government Employees | 33 | 15.2% |
| Federal Government Employees | 0 | 0.0% |
| Unpaid Family Workers | 0 | 0.0% |
| Total | 217 | 100.0% |
Employment Status by Age in Rhinecliff
According to the labor force statistics for Rhinecliff, out of the total population over 16 years of age (356), 63.2% or 225 individuals are in the labor force, with 3.6% or 8 of them unemployed. The age group with the highest labor force participation rate is 25 to 29 years, with 100.0% or 47 individuals in the labor force. Within the labor force, the 65 to 74 years age range has the highest percentage of unemployed individuals, with 47.1% or 8 of them being unemployed.
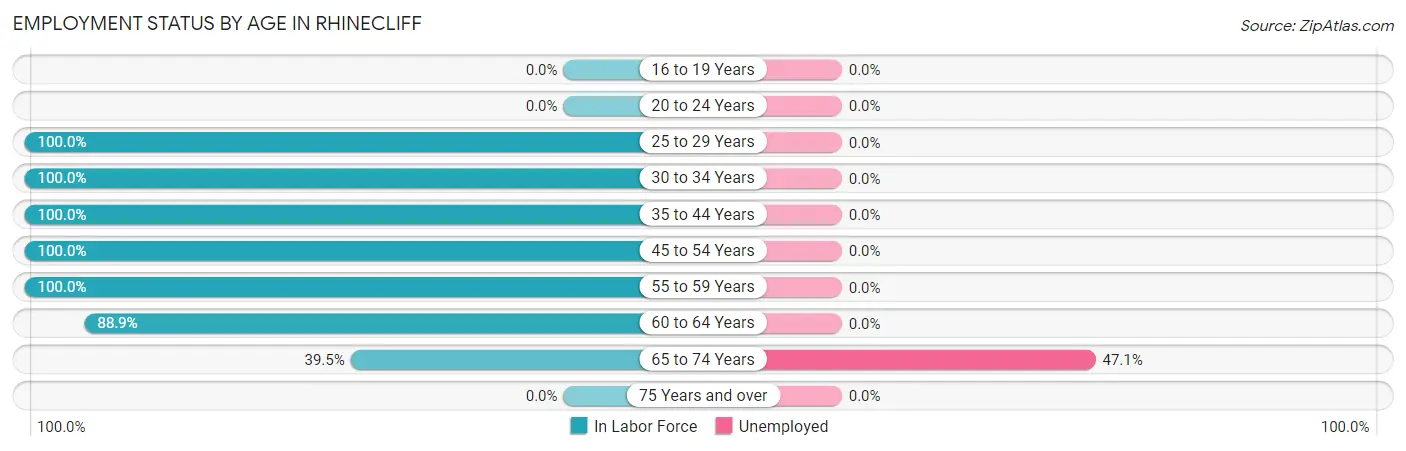
| Age Bracket | In Labor Force | Unemployed |
| 16 to 19 Years | 0 (0.0%) | 0 (0.0%) |
| 20 to 24 Years | 0 (0.0%) | 0 (0.0%) |
| 25 to 29 Years | 47 (100.0%) | 0 (0.0%) |
| 30 to 34 Years | 12 (100.0%) | 0 (0.0%) |
| 35 to 44 Years | 30 (100.0%) | 0 (0.0%) |
| 45 to 54 Years | 55 (100.0%) | 0 (0.0%) |
| 55 to 59 Years | 8 (100.0%) | 0 (0.0%) |
| 60 to 64 Years | 56 (88.9%) | 0 (0.0%) |
| 65 to 74 Years | 17 (39.5%) | 8 (47.1%) |
| 75 Years and over | 0 (0.0%) | 0 (0.0%) |
| Total | 225 (63.2%) | 8 (3.6%) |
Employment Status by Educational Attainment in Rhinecliff
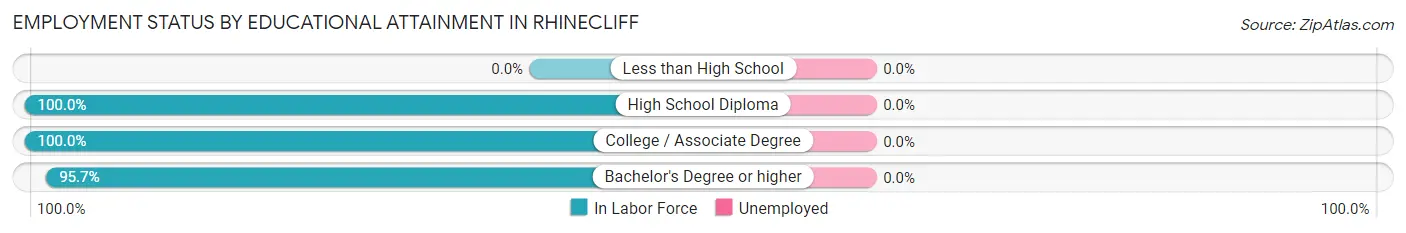
| Educational Attainment | In Labor Force | Unemployed |
| Less than High School | 0 (0.0%) | 0 (0.0%) |
| High School Diploma | 30 (100.0%) | 0 (0.0%) |
| College / Associate Degree | 24 (100.0%) | 0 (0.0%) |
| Bachelor's Degree or higher | 154 (95.7%) | 0 (0.0%) |
| Total | 208 (96.7%) | 0 (0.0%) |
Employment Occupations by Sex in Rhinecliff
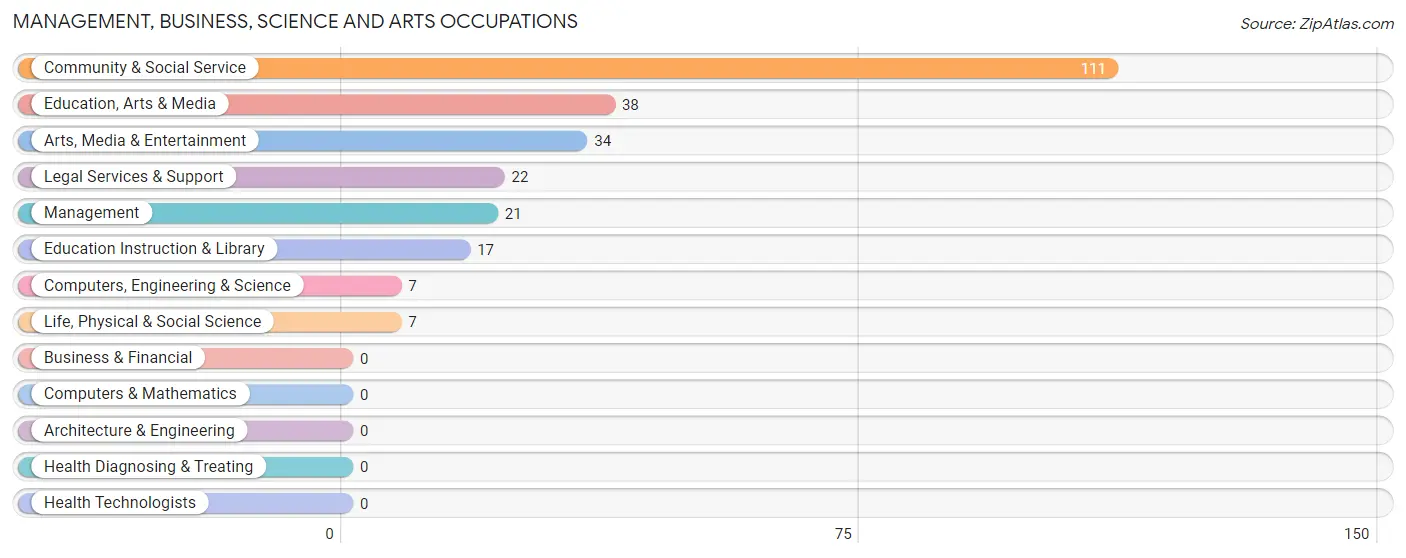
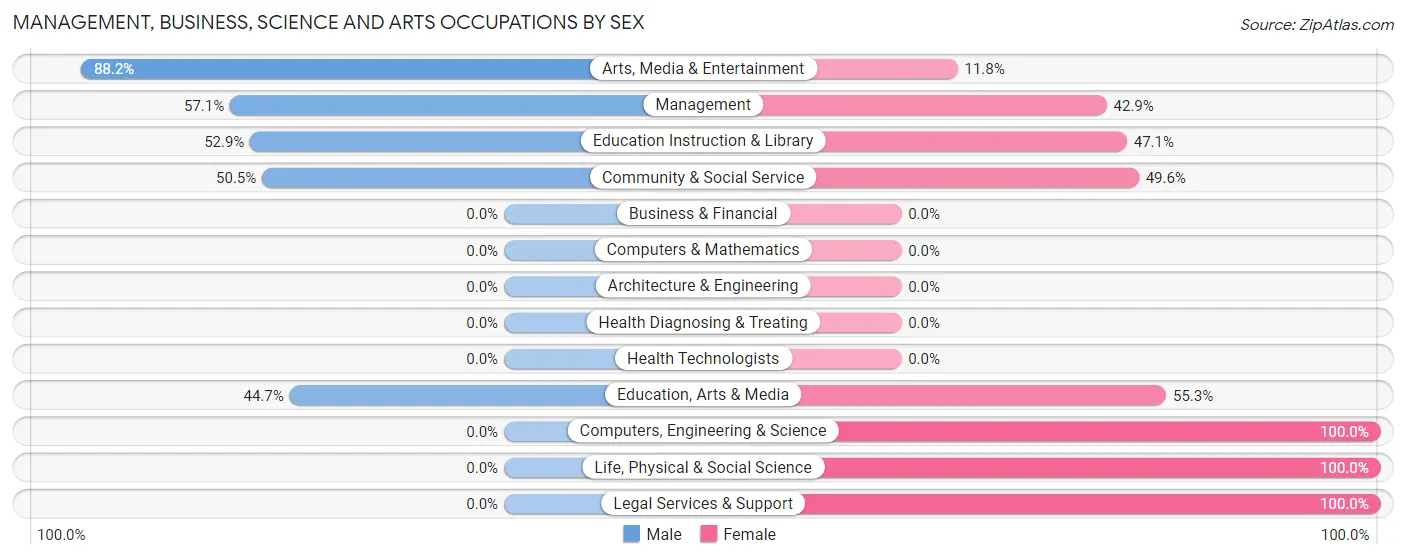
Management, Business, Science and Arts Occupations
The most common Management, Business, Science and Arts occupations in Rhinecliff are Community & Social Service (111 | 51.1%), Education, Arts & Media (38 | 17.5%), Arts, Media & Entertainment (34 | 15.7%), Legal Services & Support (22 | 10.1%), and Management (21 | 9.7%).
Management, Business, Science and Arts Occupations by Sex
Within the Management, Business, Science and Arts occupations in Rhinecliff, the most male-oriented occupations are Arts, Media & Entertainment (88.2%), Management (57.1%), and Education Instruction & Library (52.9%), while the most female-oriented occupations are Computers, Engineering & Science (100.0%), Life, Physical & Social Science (100.0%), and Legal Services & Support (100.0%).
| Occupation | Male | Female |
| Management | 12 (57.1%) | 9 (42.9%) |
| Business & Financial | 0 (0.0%) | 0 (0.0%) |
| Computers, Engineering & Science | 0 (0.0%) | 7 (100.0%) |
| Computers & Mathematics | 0 (0.0%) | 0 (0.0%) |
| Architecture & Engineering | 0 (0.0%) | 0 (0.0%) |
| Life, Physical & Social Science | 0 (0.0%) | 7 (100.0%) |
| Community & Social Service | 56 (50.4%) | 55 (49.5%) |
| Education, Arts & Media | 17 (44.7%) | 21 (55.3%) |
| Legal Services & Support | 0 (0.0%) | 22 (100.0%) |
| Education Instruction & Library | 9 (52.9%) | 8 (47.1%) |
| Arts, Media & Entertainment | 30 (88.2%) | 4 (11.8%) |
| Health Diagnosing & Treating | 0 (0.0%) | 0 (0.0%) |
| Health Technologists | 0 (0.0%) | 0 (0.0%) |
| Total (Category) | 68 (48.9%) | 71 (51.1%) |
| Total (Overall) | 128 (59.0%) | 89 (41.0%) |
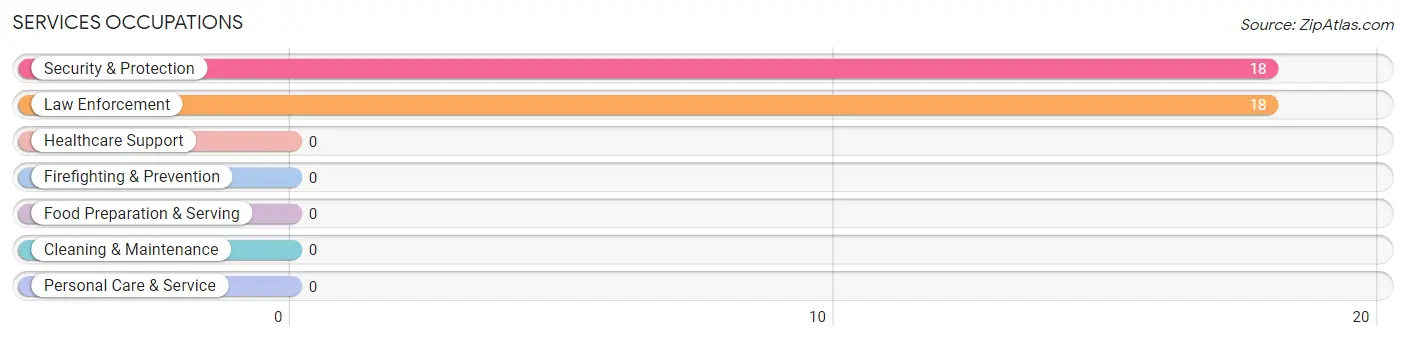
Services Occupations
The most common Services occupations in Rhinecliff are Security & Protection (18 | 8.3%), and Law Enforcement (18 | 8.3%).
Services Occupations by Sex
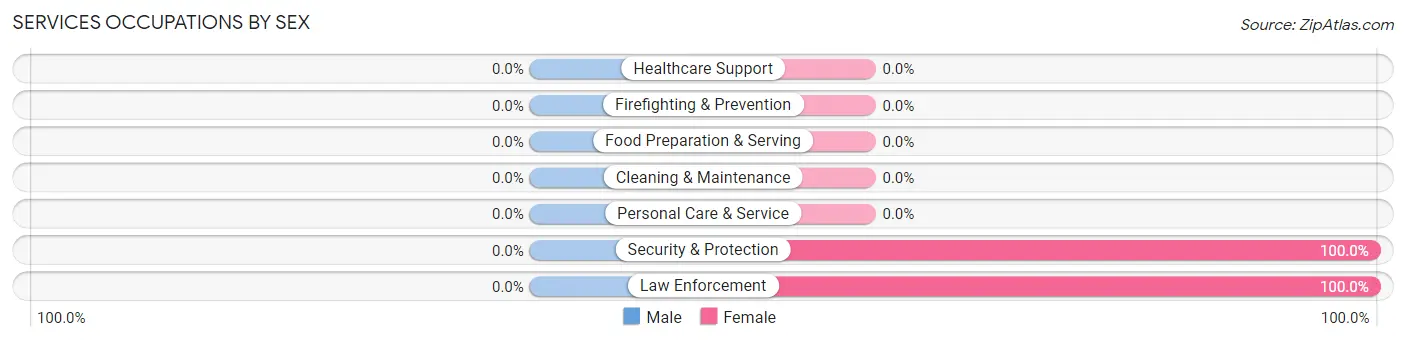
| Occupation | Male | Female |
| Healthcare Support | 0 (0.0%) | 0 (0.0%) |
| Security & Protection | 0 (0.0%) | 18 (100.0%) |
| Firefighting & Prevention | 0 (0.0%) | 0 (0.0%) |
| Law Enforcement | 0 (0.0%) | 18 (100.0%) |
| Food Preparation & Serving | 0 (0.0%) | 0 (0.0%) |
| Cleaning & Maintenance | 0 (0.0%) | 0 (0.0%) |
| Personal Care & Service | 0 (0.0%) | 0 (0.0%) |
| Total (Category) | 0 (0.0%) | 18 (100.0%) |
| Total (Overall) | 128 (59.0%) | 89 (41.0%) |
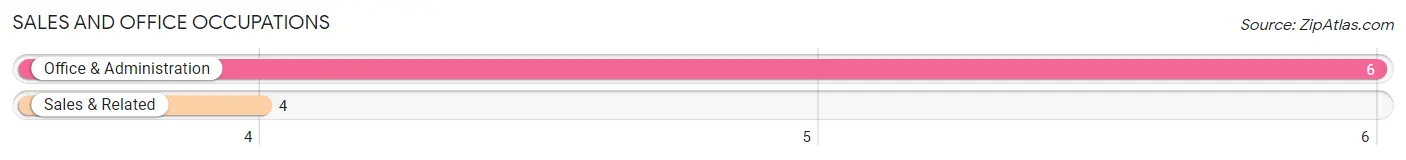
Sales and Office Occupations
The most common Sales and Office occupations in Rhinecliff are Office & Administration (6 | 2.8%), and Sales & Related (4 | 1.8%).
Sales and Office Occupations by Sex
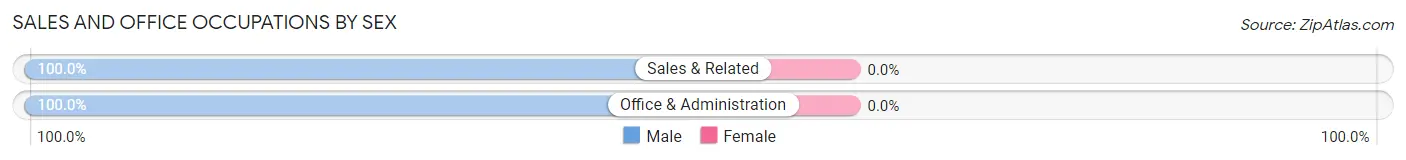
| Occupation | Male | Female |
| Sales & Related | 4 (100.0%) | 0 (0.0%) |
| Office & Administration | 6 (100.0%) | 0 (0.0%) |
| Total (Category) | 10 (100.0%) | 0 (0.0%) |
| Total (Overall) | 128 (59.0%) | 89 (41.0%) |
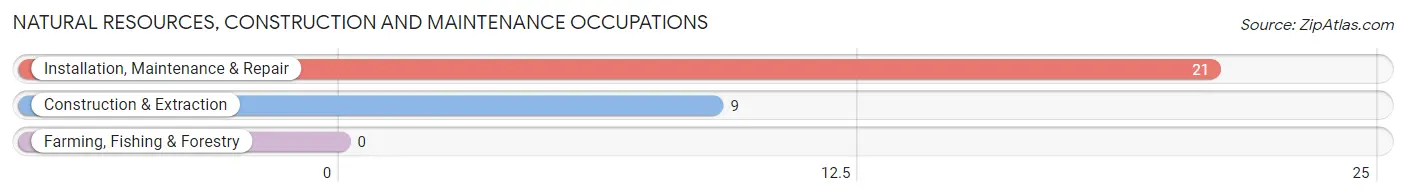
Natural Resources, Construction and Maintenance Occupations
The most common Natural Resources, Construction and Maintenance occupations in Rhinecliff are Installation, Maintenance & Repair (21 | 9.7%), and Construction & Extraction (9 | 4.2%).
Natural Resources, Construction and Maintenance Occupations by Sex
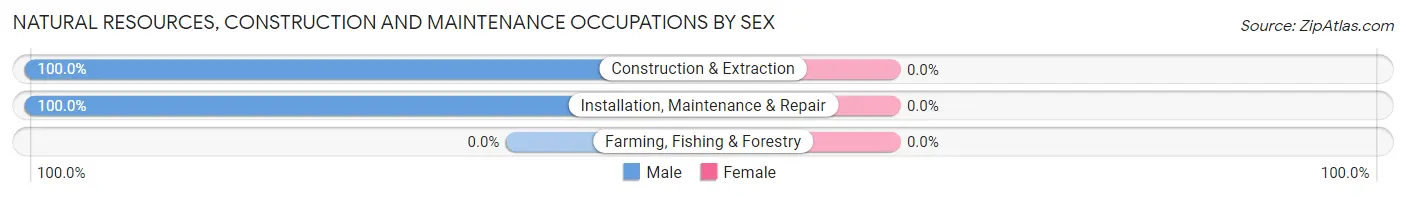
| Occupation | Male | Female |
| Farming, Fishing & Forestry | 0 (0.0%) | 0 (0.0%) |
| Construction & Extraction | 9 (100.0%) | 0 (0.0%) |
| Installation, Maintenance & Repair | 21 (100.0%) | 0 (0.0%) |
| Total (Category) | 30 (100.0%) | 0 (0.0%) |
| Total (Overall) | 128 (59.0%) | 89 (41.0%) |
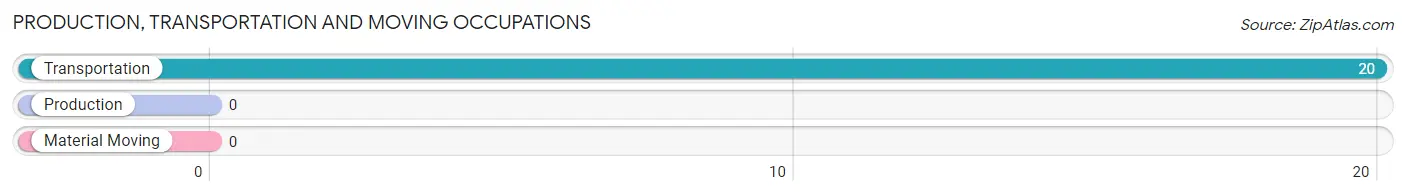
Production, Transportation and Moving Occupations
The most common Production, Transportation and Moving occupations in Rhinecliff are , and Transportation (20 | 9.2%).
Production, Transportation and Moving Occupations by Sex
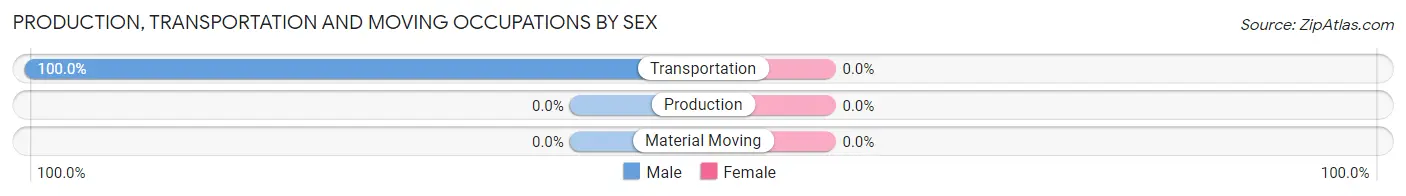
| Occupation | Male | Female |
| Production | 0 (0.0%) | 0 (0.0%) |
| Transportation | 20 (100.0%) | 0 (0.0%) |
| Material Moving | 0 (0.0%) | 0 (0.0%) |
| Total (Category) | 20 (100.0%) | 0 (0.0%) |
| Total (Overall) | 128 (59.0%) | 89 (41.0%) |
Employment Industries by Sex in Rhinecliff
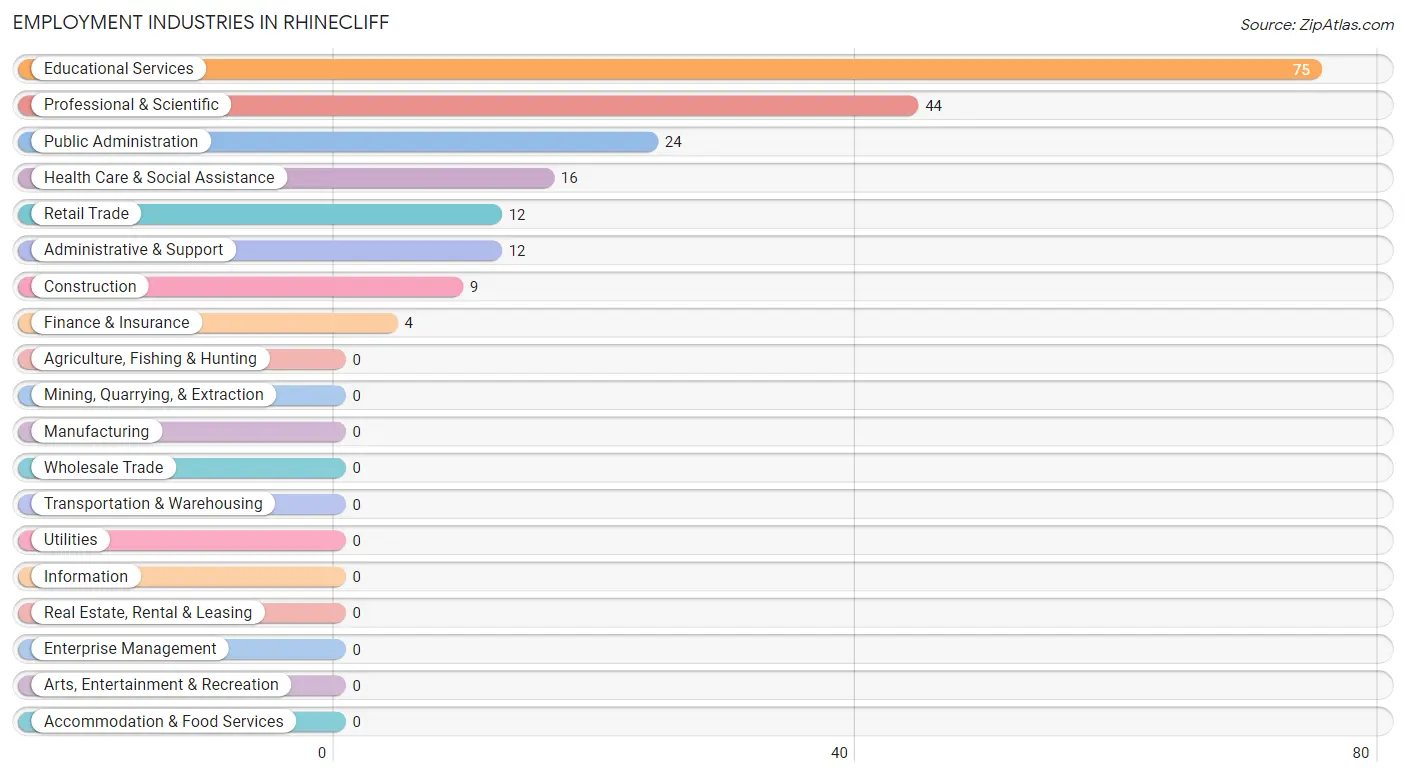
Employment Industries in Rhinecliff
The major employment industries in Rhinecliff include Educational Services (75 | 34.6%), Professional & Scientific (44 | 20.3%), Public Administration (24 | 11.1%), Health Care & Social Assistance (16 | 7.4%), and Retail Trade (12 | 5.5%).
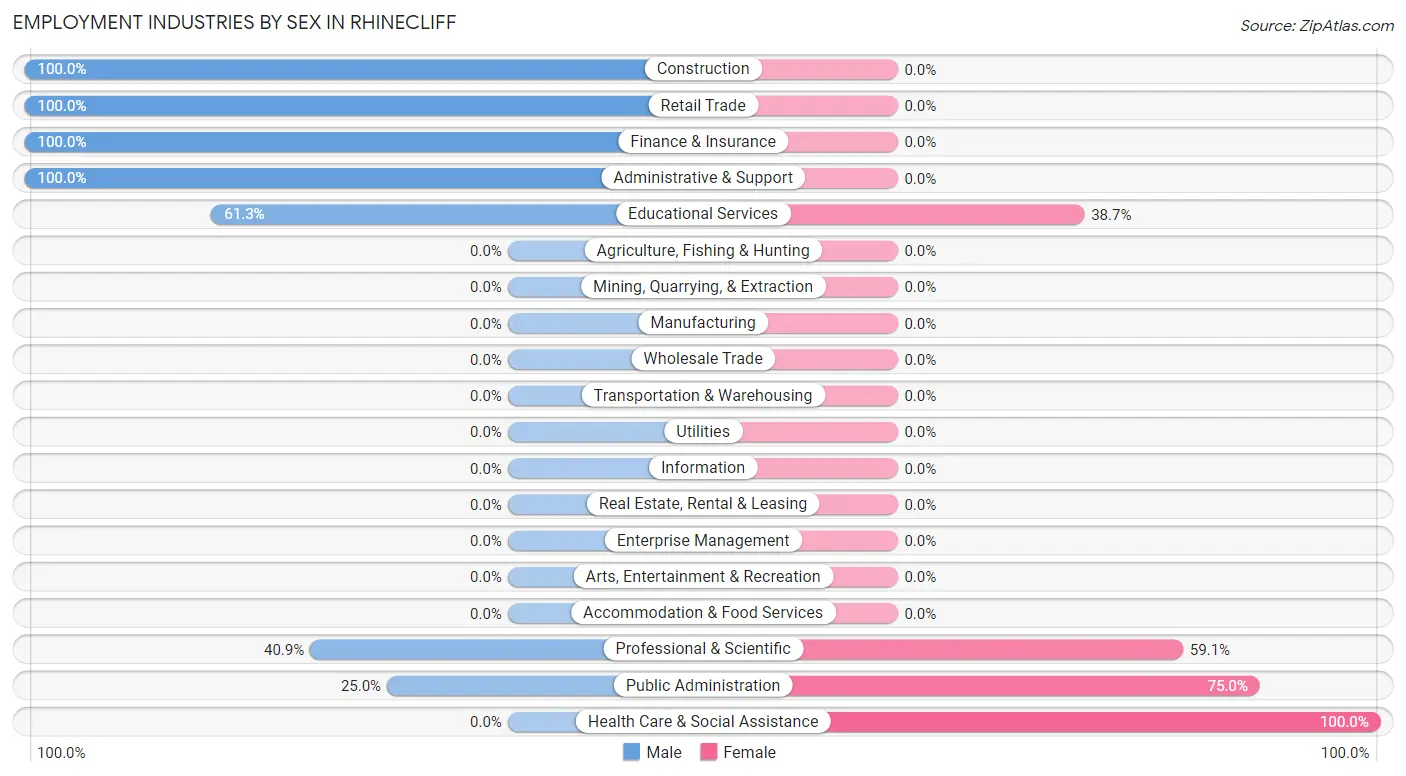
Employment Industries by Sex in Rhinecliff
The Rhinecliff industries that see more men than women are Construction (100.0%), Retail Trade (100.0%), and Finance & Insurance (100.0%), whereas the industries that tend to have a higher number of women are Health Care & Social Assistance (100.0%), Public Administration (75.0%), and Professional & Scientific (59.1%).
| Industry | Male | Female |
| Agriculture, Fishing & Hunting | 0 (0.0%) | 0 (0.0%) |
| Mining, Quarrying, & Extraction | 0 (0.0%) | 0 (0.0%) |
| Construction | 9 (100.0%) | 0 (0.0%) |
| Manufacturing | 0 (0.0%) | 0 (0.0%) |
| Wholesale Trade | 0 (0.0%) | 0 (0.0%) |
| Retail Trade | 12 (100.0%) | 0 (0.0%) |
| Transportation & Warehousing | 0 (0.0%) | 0 (0.0%) |
| Utilities | 0 (0.0%) | 0 (0.0%) |
| Information | 0 (0.0%) | 0 (0.0%) |
| Finance & Insurance | 4 (100.0%) | 0 (0.0%) |
| Real Estate, Rental & Leasing | 0 (0.0%) | 0 (0.0%) |
| Professional & Scientific | 18 (40.9%) | 26 (59.1%) |
| Enterprise Management | 0 (0.0%) | 0 (0.0%) |
| Administrative & Support | 12 (100.0%) | 0 (0.0%) |
| Educational Services | 46 (61.3%) | 29 (38.7%) |
| Health Care & Social Assistance | 0 (0.0%) | 16 (100.0%) |
| Arts, Entertainment & Recreation | 0 (0.0%) | 0 (0.0%) |
| Accommodation & Food Services | 0 (0.0%) | 0 (0.0%) |
| Public Administration | 6 (25.0%) | 18 (75.0%) |
| Total | 128 (59.0%) | 89 (41.0%) |
Education in Rhinecliff
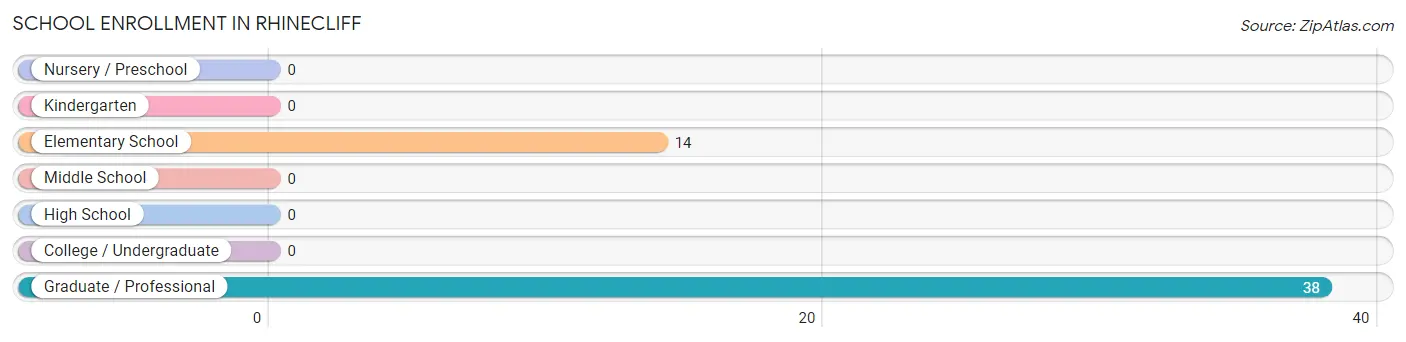
School Enrollment in Rhinecliff
The most common levels of schooling among the 52 students in Rhinecliff are graduate / professional (38 | 73.1%), and elementary school (14 | 26.9%).
| School Level | # Students | % Students |
| Nursery / Preschool | 0 | 0.0% |
| Kindergarten | 0 | 0.0% |
| Elementary School | 14 | 26.9% |
| Middle School | 0 | 0.0% |
| High School | 0 | 0.0% |
| College / Undergraduate | 0 | 0.0% |
| Graduate / Professional | 38 | 73.1% |
| Total | 52 | 100.0% |
School Enrollment by Age by Funding Source in Rhinecliff
Out of a total of 52 students who are enrolled in schools in Rhinecliff, 30 (57.7%) attend a private institution, while the remaining 22 (42.3%) are enrolled in public schools. The age group of 25 to 34 year olds has the highest likelihood of being enrolled in private schools, with 30 (100.0% in the age bracket) enrolled. Conversely, the age group of 5 to 9 year old has the lowest likelihood of being enrolled in a private school, with 14 (100.0% in the age bracket) attending a public institution.
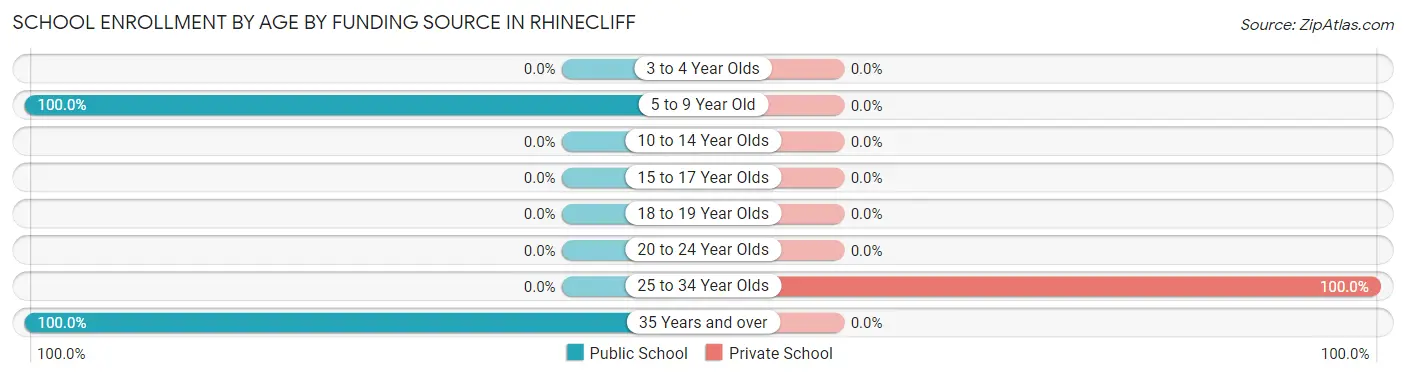
| Age Bracket | Public School | Private School |
| 3 to 4 Year Olds | 0 (0.0%) | 0 (0.0%) |
| 5 to 9 Year Old | 14 (100.0%) | 0 (0.0%) |
| 10 to 14 Year Olds | 0 (0.0%) | 0 (0.0%) |
| 15 to 17 Year Olds | 0 (0.0%) | 0 (0.0%) |
| 18 to 19 Year Olds | 0 (0.0%) | 0 (0.0%) |
| 20 to 24 Year Olds | 0 (0.0%) | 0 (0.0%) |
| 25 to 34 Year Olds | 0 (0.0%) | 30 (100.0%) |
| 35 Years and over | 8 (100.0%) | 0 (0.0%) |
| Total | 22 (42.3%) | 30 (57.7%) |
Educational Attainment by Field of Study in Rhinecliff
Literature & languages (109 | 35.6%), visual & performing arts (46 | 15.0%), social sciences (41 | 13.4%), psychology (29 | 9.5%), and business (26 | 8.5%) are the most common fields of study among 306 individuals in Rhinecliff who have obtained a bachelor's degree or higher.
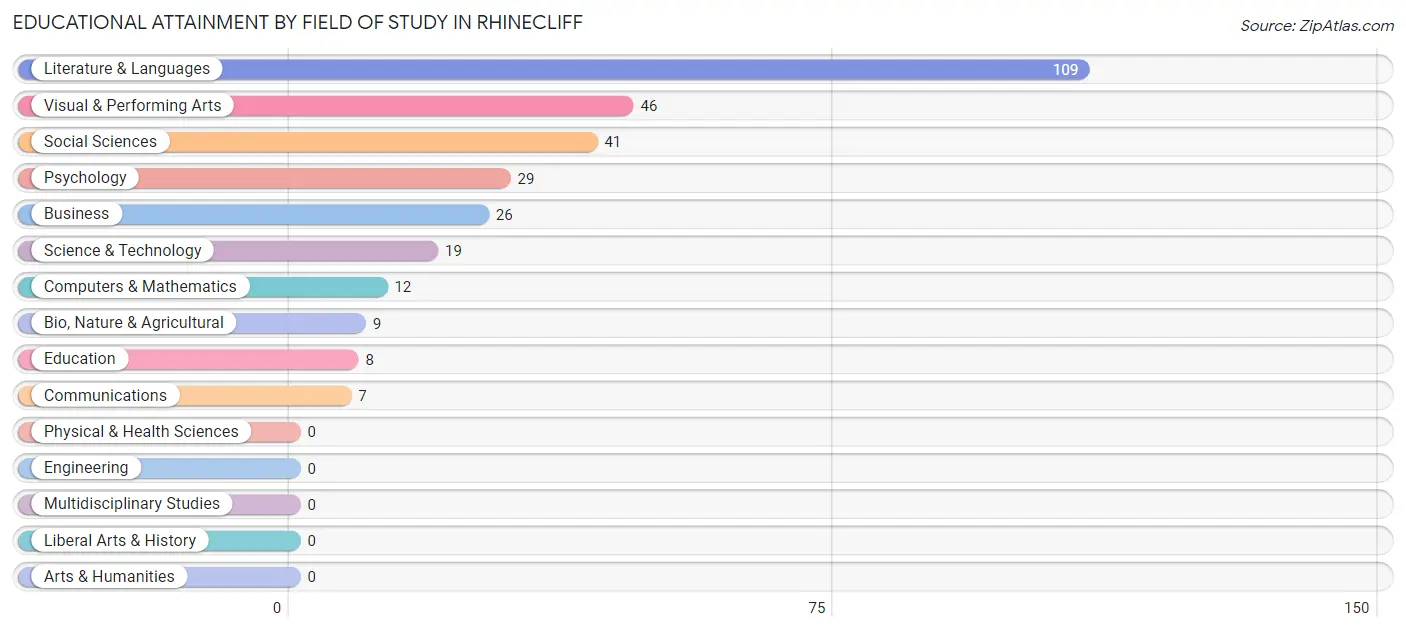
| Field of Study | # Graduates | % Graduates |
| Computers & Mathematics | 12 | 3.9% |
| Bio, Nature & Agricultural | 9 | 2.9% |
| Physical & Health Sciences | 0 | 0.0% |
| Psychology | 29 | 9.5% |
| Social Sciences | 41 | 13.4% |
| Engineering | 0 | 0.0% |
| Multidisciplinary Studies | 0 | 0.0% |
| Science & Technology | 19 | 6.2% |
| Business | 26 | 8.5% |
| Education | 8 | 2.6% |
| Literature & Languages | 109 | 35.6% |
| Liberal Arts & History | 0 | 0.0% |
| Visual & Performing Arts | 46 | 15.0% |
| Communications | 7 | 2.3% |
| Arts & Humanities | 0 | 0.0% |
| Total | 306 | 100.0% |
Transportation & Commute in Rhinecliff
Vehicle Availability by Sex in Rhinecliff
The most prevalent vehicle ownership categories in Rhinecliff are males with 2 vehicles (99, accounting for 77.3%) and females with 2 vehicles (71, making up 111.2%).
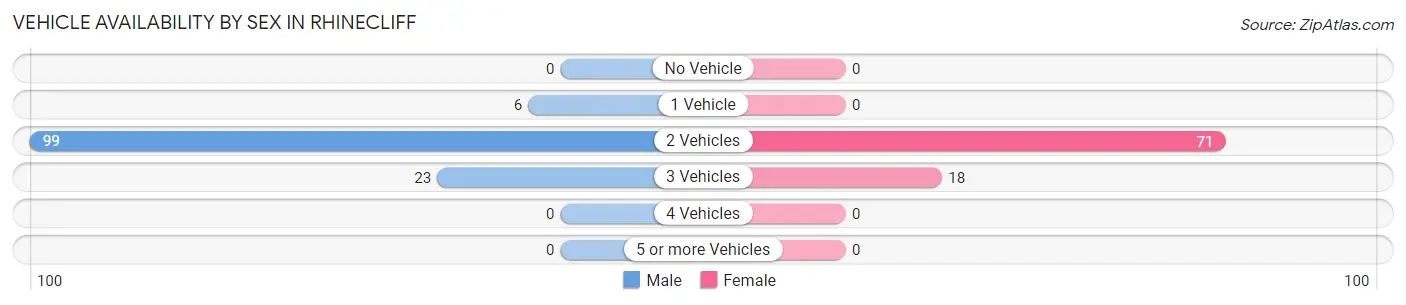
| Vehicles Available | Male | Female |
| No Vehicle | 0 (0.0%) | 0 (0.0%) |
| 1 Vehicle | 6 (4.7%) | 0 (0.0%) |
| 2 Vehicles | 99 (77.3%) | 71 (79.8%) |
| 3 Vehicles | 23 (18.0%) | 18 (20.2%) |
| 4 Vehicles | 0 (0.0%) | 0 (0.0%) |
| 5 or more Vehicles | 0 (0.0%) | 0 (0.0%) |
| Total | 128 (100.0%) | 89 (100.0%) |
Commute Time in Rhinecliff
The most frequently occuring commute durations in Rhinecliff are 10 to 14 minutes (77 commuters, 35.5%), 20 to 24 minutes (53 commuters, 24.4%), and 90 or more minutes (28 commuters, 12.9%).
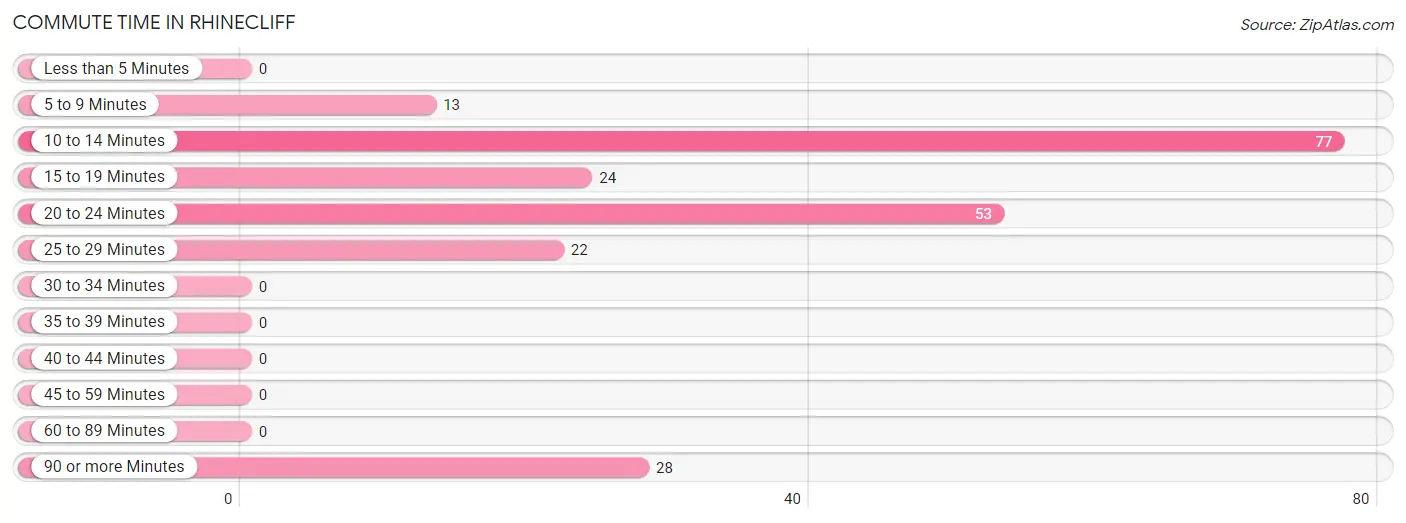
| Commute Time | # Commuters | % Commuters |
| Less than 5 Minutes | 0 | 0.0% |
| 5 to 9 Minutes | 13 | 6.0% |
| 10 to 14 Minutes | 77 | 35.5% |
| 15 to 19 Minutes | 24 | 11.1% |
| 20 to 24 Minutes | 53 | 24.4% |
| 25 to 29 Minutes | 22 | 10.1% |
| 30 to 34 Minutes | 0 | 0.0% |
| 35 to 39 Minutes | 0 | 0.0% |
| 40 to 44 Minutes | 0 | 0.0% |
| 45 to 59 Minutes | 0 | 0.0% |
| 60 to 89 Minutes | 0 | 0.0% |
| 90 or more Minutes | 28 | 12.9% |
Commute Time by Sex in Rhinecliff
The most common commute times in Rhinecliff are 20 to 24 minutes (45 commuters, 35.2%) for males and 10 to 14 minutes (39 commuters, 43.8%) for females.
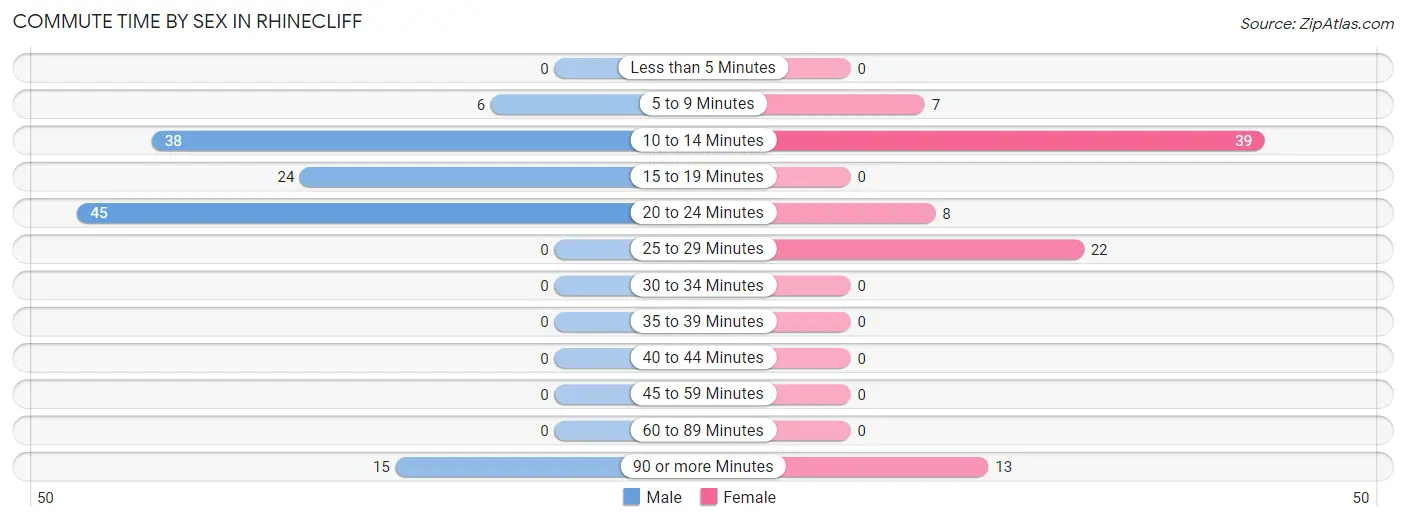
| Commute Time | Male | Female |
| Less than 5 Minutes | 0 (0.0%) | 0 (0.0%) |
| 5 to 9 Minutes | 6 (4.7%) | 7 (7.9%) |
| 10 to 14 Minutes | 38 (29.7%) | 39 (43.8%) |
| 15 to 19 Minutes | 24 (18.8%) | 0 (0.0%) |
| 20 to 24 Minutes | 45 (35.2%) | 8 (9.0%) |
| 25 to 29 Minutes | 0 (0.0%) | 22 (24.7%) |
| 30 to 34 Minutes | 0 (0.0%) | 0 (0.0%) |
| 35 to 39 Minutes | 0 (0.0%) | 0 (0.0%) |
| 40 to 44 Minutes | 0 (0.0%) | 0 (0.0%) |
| 45 to 59 Minutes | 0 (0.0%) | 0 (0.0%) |
| 60 to 89 Minutes | 0 (0.0%) | 0 (0.0%) |
| 90 or more Minutes | 15 (11.7%) | 13 (14.6%) |
Time of Departure to Work by Sex in Rhinecliff
The most frequent times of departure to work in Rhinecliff are 8:00 AM to 8:29 AM (38, 29.7%) for males and 8:30 AM to 8:59 AM (48, 53.9%) for females.
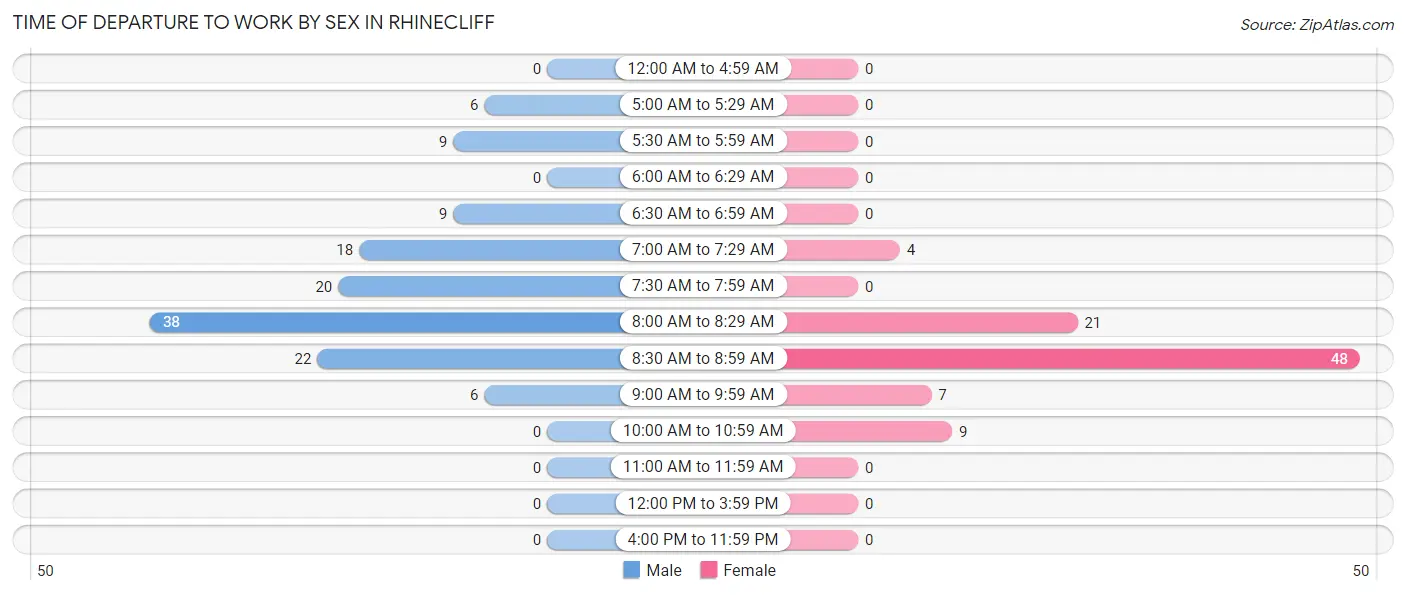
| Time of Departure | Male | Female |
| 12:00 AM to 4:59 AM | 0 (0.0%) | 0 (0.0%) |
| 5:00 AM to 5:29 AM | 6 (4.7%) | 0 (0.0%) |
| 5:30 AM to 5:59 AM | 9 (7.0%) | 0 (0.0%) |
| 6:00 AM to 6:29 AM | 0 (0.0%) | 0 (0.0%) |
| 6:30 AM to 6:59 AM | 9 (7.0%) | 0 (0.0%) |
| 7:00 AM to 7:29 AM | 18 (14.1%) | 4 (4.5%) |
| 7:30 AM to 7:59 AM | 20 (15.6%) | 0 (0.0%) |
| 8:00 AM to 8:29 AM | 38 (29.7%) | 21 (23.6%) |
| 8:30 AM to 8:59 AM | 22 (17.2%) | 48 (53.9%) |
| 9:00 AM to 9:59 AM | 6 (4.7%) | 7 (7.9%) |
| 10:00 AM to 10:59 AM | 0 (0.0%) | 9 (10.1%) |
| 11:00 AM to 11:59 AM | 0 (0.0%) | 0 (0.0%) |
| 12:00 PM to 3:59 PM | 0 (0.0%) | 0 (0.0%) |
| 4:00 PM to 11:59 PM | 0 (0.0%) | 0 (0.0%) |
| Total | 128 (100.0%) | 89 (100.0%) |
Housing Occupancy in Rhinecliff
Occupancy by Ownership in Rhinecliff
Of the total 197 dwellings in Rhinecliff, owner-occupied units account for 171 (86.8%), while renter-occupied units make up 26 (13.2%).
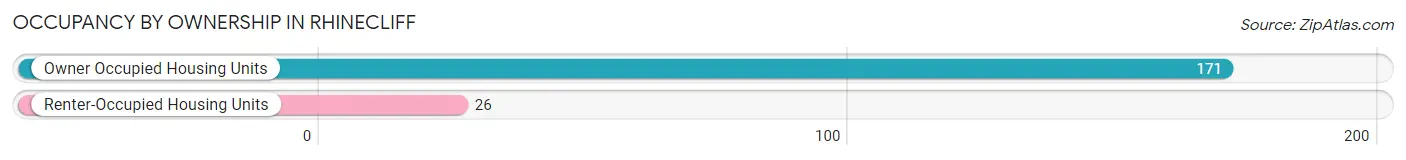
| Occupancy | # Housing Units | % Housing Units |
| Owner Occupied Housing Units | 171 | 86.8% |
| Renter-Occupied Housing Units | 26 | 13.2% |
| Total Occupied Housing Units | 197 | 100.0% |
Occupancy by Household Size in Rhinecliff
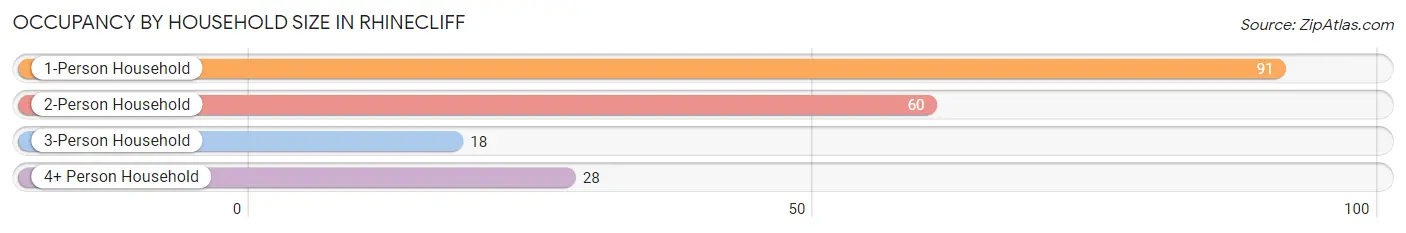
| Household Size | # Housing Units | % Housing Units |
| 1-Person Household | 91 | 46.2% |
| 2-Person Household | 60 | 30.5% |
| 3-Person Household | 18 | 9.1% |
| 4+ Person Household | 28 | 14.2% |
| Total Housing Units | 197 | 100.0% |
Occupancy by Ownership by Household Size in Rhinecliff
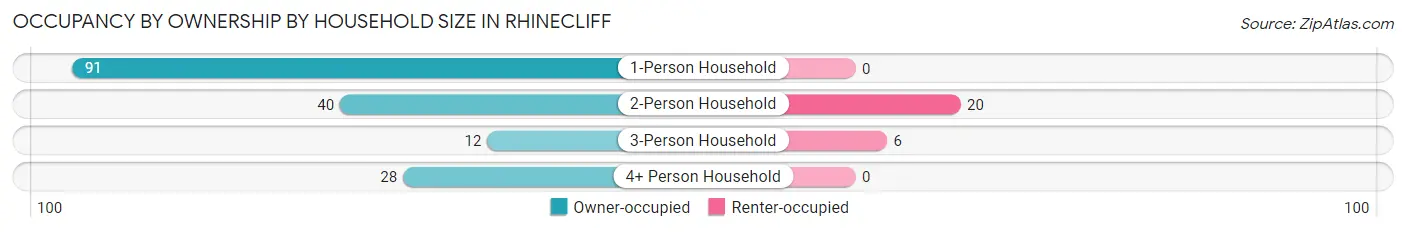
| Household Size | Owner-occupied | Renter-occupied |
| 1-Person Household | 91 (100.0%) | 0 (0.0%) |
| 2-Person Household | 40 (66.7%) | 20 (33.3%) |
| 3-Person Household | 12 (66.7%) | 6 (33.3%) |
| 4+ Person Household | 28 (100.0%) | 0 (0.0%) |
| Total Housing Units | 171 (86.8%) | 26 (13.2%) |
Occupancy by Educational Attainment in Rhinecliff
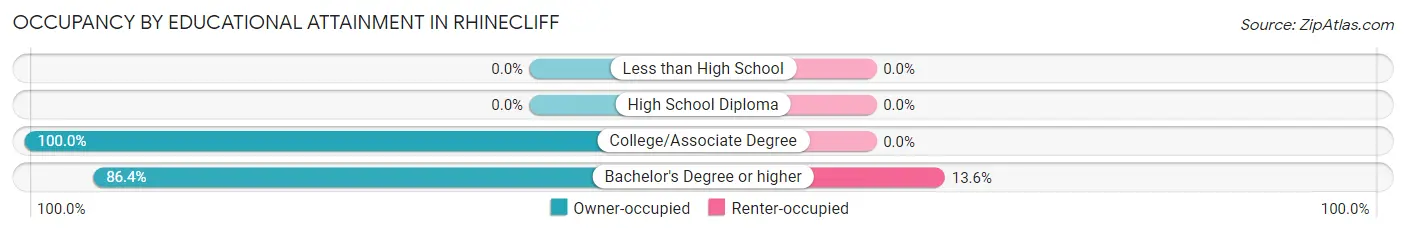
| Household Size | Owner-occupied | Renter-occupied |
| Less than High School | 0 (0.0%) | 0 (0.0%) |
| High School Diploma | 0 (0.0%) | 0 (0.0%) |
| College/Associate Degree | 6 (100.0%) | 0 (0.0%) |
| Bachelor's Degree or higher | 165 (86.4%) | 26 (13.6%) |
Occupancy by Age of Householder in Rhinecliff
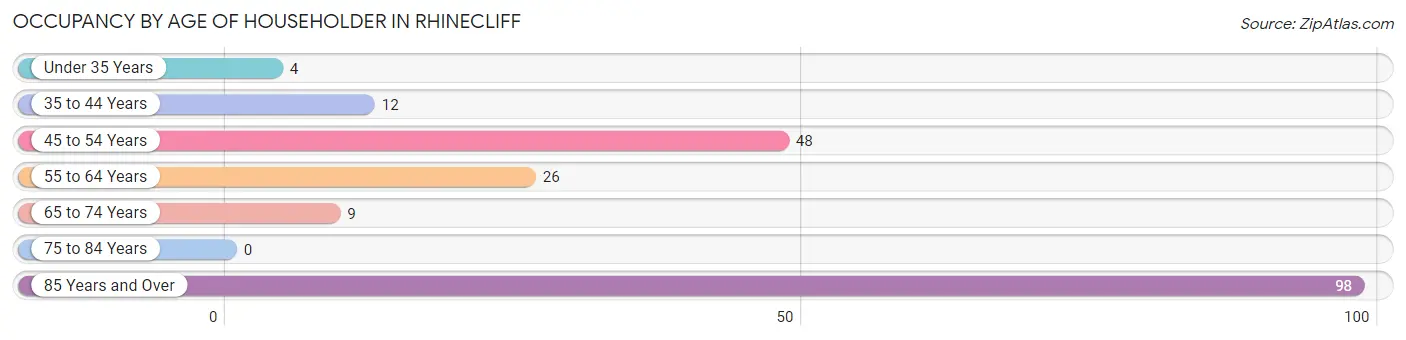
| Age Bracket | # Households | % Households |
| Under 35 Years | 4 | 2.0% |
| 35 to 44 Years | 12 | 6.1% |
| 45 to 54 Years | 48 | 24.4% |
| 55 to 64 Years | 26 | 13.2% |
| 65 to 74 Years | 9 | 4.6% |
| 75 to 84 Years | 0 | 0.0% |
| 85 Years and Over | 98 | 49.7% |
| Total | 197 | 100.0% |
Housing Finances in Rhinecliff
Median Income by Occupancy in Rhinecliff
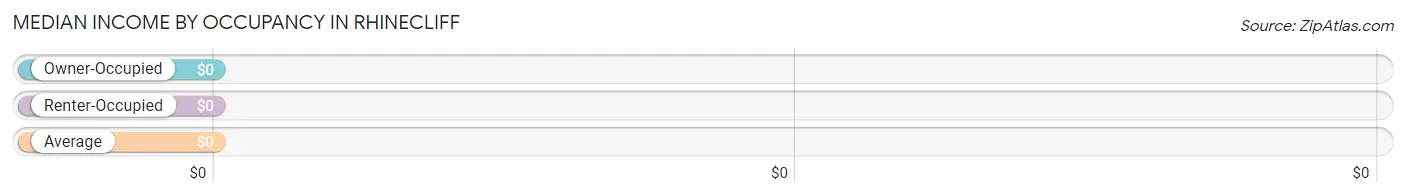
| Occupancy Type | # Households | Median Income |
| Owner-Occupied | 171 (86.8%) | $0 |
| Renter-Occupied | 26 (13.2%) | $0 |
| Average | 197 (100.0%) | $0 |
Occupancy by Householder Income Bracket in Rhinecliff
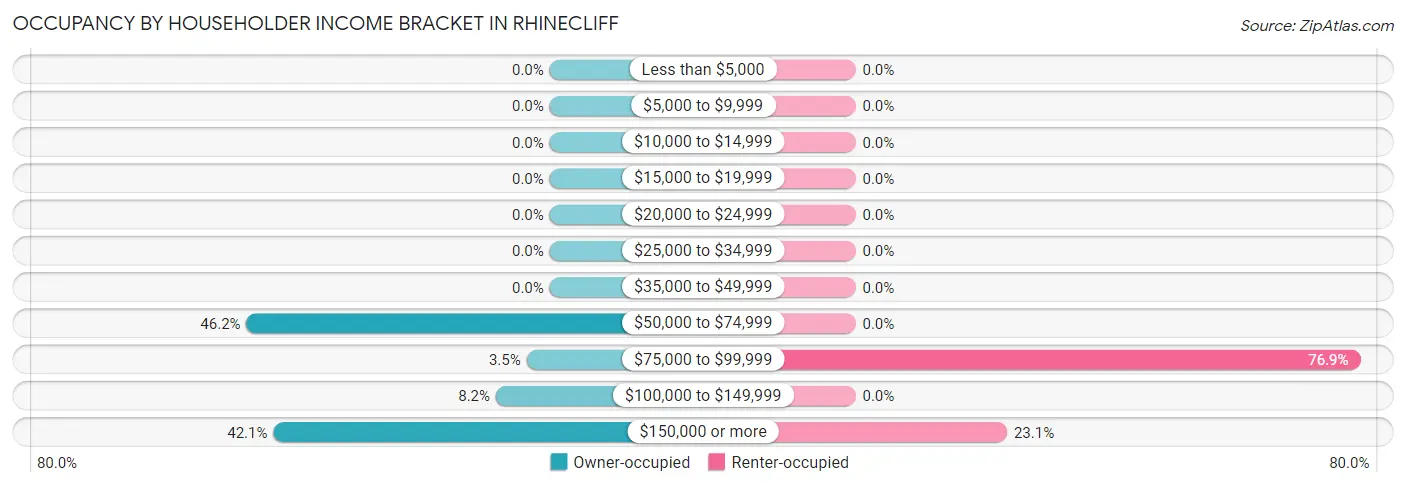
| Income Bracket | Owner-occupied | Renter-occupied |
| Less than $5,000 | 0 (0.0%) | 0 (0.0%) |
| $5,000 to $9,999 | 0 (0.0%) | 0 (0.0%) |
| $10,000 to $14,999 | 0 (0.0%) | 0 (0.0%) |
| $15,000 to $19,999 | 0 (0.0%) | 0 (0.0%) |
| $20,000 to $24,999 | 0 (0.0%) | 0 (0.0%) |
| $25,000 to $34,999 | 0 (0.0%) | 0 (0.0%) |
| $35,000 to $49,999 | 0 (0.0%) | 0 (0.0%) |
| $50,000 to $74,999 | 79 (46.2%) | 0 (0.0%) |
| $75,000 to $99,999 | 6 (3.5%) | 20 (76.9%) |
| $100,000 to $149,999 | 14 (8.2%) | 0 (0.0%) |
| $150,000 or more | 72 (42.1%) | 6 (23.1%) |
| Total | 171 (100.0%) | 26 (100.0%) |
Monthly Housing Cost Tiers in Rhinecliff
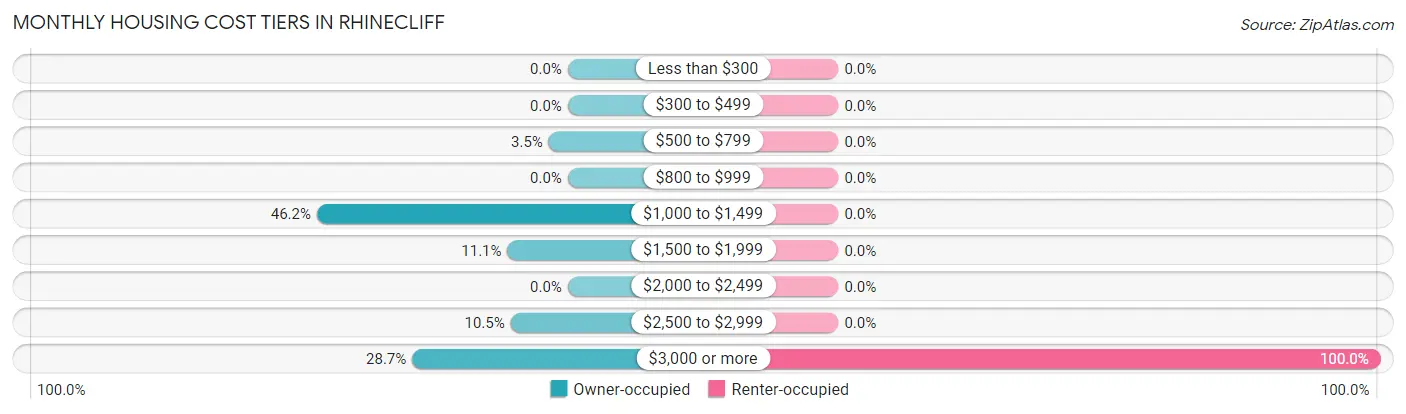
| Monthly Cost | Owner-occupied | Renter-occupied |
| Less than $300 | 0 (0.0%) | 0 (0.0%) |
| $300 to $499 | 0 (0.0%) | 0 (0.0%) |
| $500 to $799 | 6 (3.5%) | 0 (0.0%) |
| $800 to $999 | 0 (0.0%) | 0 (0.0%) |
| $1,000 to $1,499 | 79 (46.2%) | 0 (0.0%) |
| $1,500 to $1,999 | 19 (11.1%) | 0 (0.0%) |
| $2,000 to $2,499 | 0 (0.0%) | 0 (0.0%) |
| $2,500 to $2,999 | 18 (10.5%) | 0 (0.0%) |
| $3,000 or more | 49 (28.6%) | 26 (100.0%) |
| Total | 171 (100.0%) | 26 (100.0%) |
Physical Housing Characteristics in Rhinecliff
Housing Structures in Rhinecliff
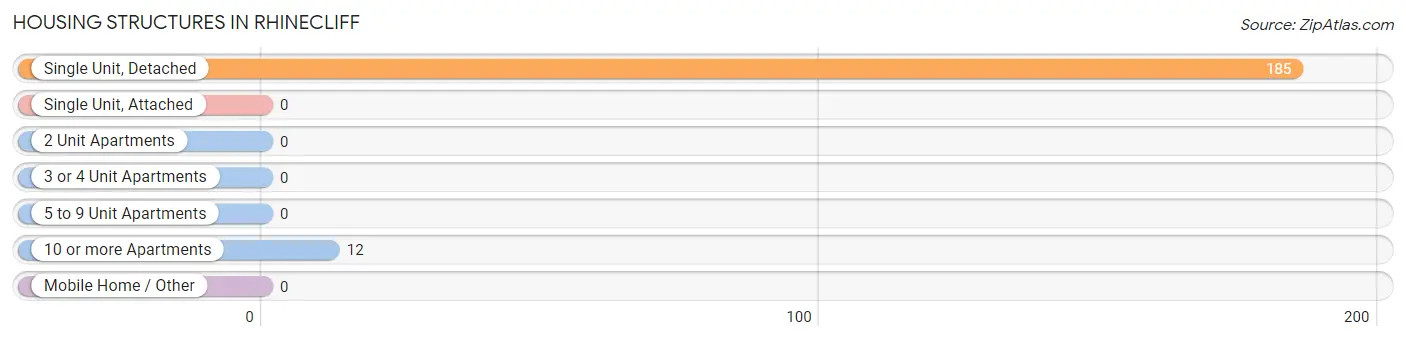
| Structure Type | # Housing Units | % Housing Units |
| Single Unit, Detached | 185 | 93.9% |
| Single Unit, Attached | 0 | 0.0% |
| 2 Unit Apartments | 0 | 0.0% |
| 3 or 4 Unit Apartments | 0 | 0.0% |
| 5 to 9 Unit Apartments | 0 | 0.0% |
| 10 or more Apartments | 12 | 6.1% |
| Mobile Home / Other | 0 | 0.0% |
| Total | 197 | 100.0% |
Housing Structures by Occupancy in Rhinecliff
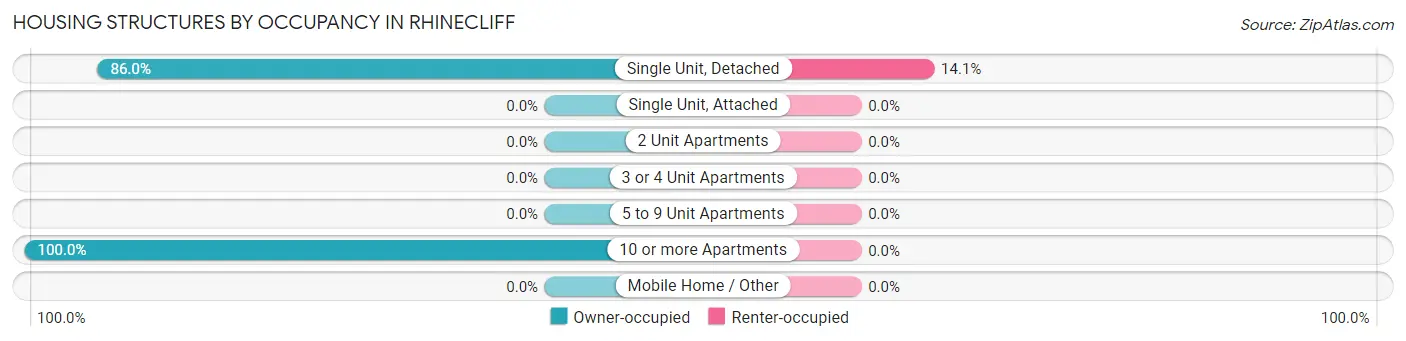
| Structure Type | Owner-occupied | Renter-occupied |
| Single Unit, Detached | 159 (86.0%) | 26 (14.1%) |
| Single Unit, Attached | 0 (0.0%) | 0 (0.0%) |
| 2 Unit Apartments | 0 (0.0%) | 0 (0.0%) |
| 3 or 4 Unit Apartments | 0 (0.0%) | 0 (0.0%) |
| 5 to 9 Unit Apartments | 0 (0.0%) | 0 (0.0%) |
| 10 or more Apartments | 12 (100.0%) | 0 (0.0%) |
| Mobile Home / Other | 0 (0.0%) | 0 (0.0%) |
| Total | 171 (86.8%) | 26 (13.2%) |
Housing Structures by Number of Rooms in Rhinecliff
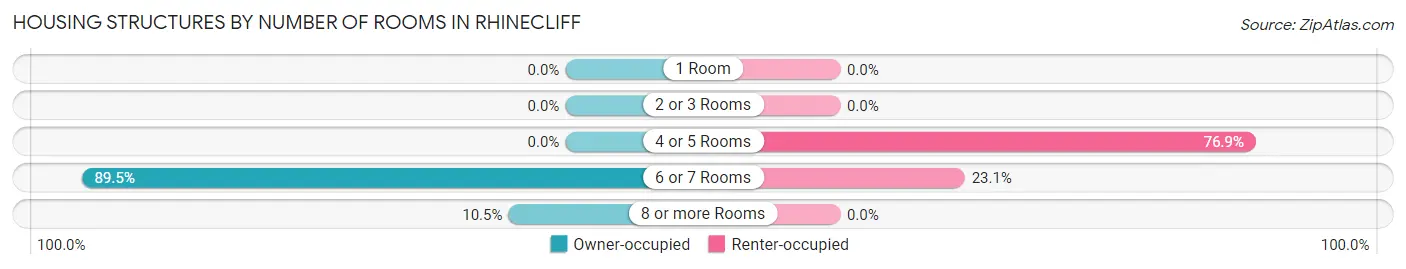
| Number of Rooms | Owner-occupied | Renter-occupied |
| 1 Room | 0 (0.0%) | 0 (0.0%) |
| 2 or 3 Rooms | 0 (0.0%) | 0 (0.0%) |
| 4 or 5 Rooms | 0 (0.0%) | 20 (76.9%) |
| 6 or 7 Rooms | 153 (89.5%) | 6 (23.1%) |
| 8 or more Rooms | 18 (10.5%) | 0 (0.0%) |
| Total | 171 (100.0%) | 26 (100.0%) |
Housing Structure by Heating Type in Rhinecliff
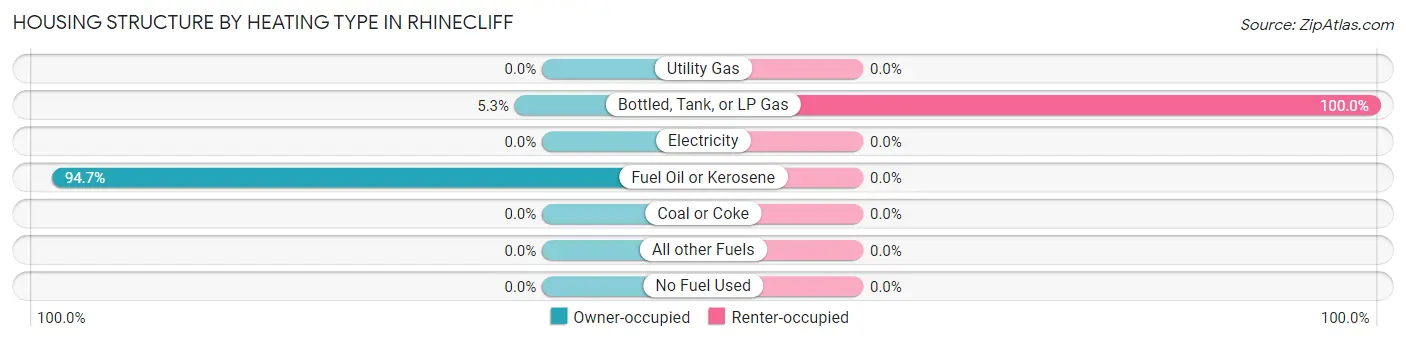
| Heating Type | Owner-occupied | Renter-occupied |
| Utility Gas | 0 (0.0%) | 0 (0.0%) |
| Bottled, Tank, or LP Gas | 9 (5.3%) | 26 (100.0%) |
| Electricity | 0 (0.0%) | 0 (0.0%) |
| Fuel Oil or Kerosene | 162 (94.7%) | 0 (0.0%) |
| Coal or Coke | 0 (0.0%) | 0 (0.0%) |
| All other Fuels | 0 (0.0%) | 0 (0.0%) |
| No Fuel Used | 0 (0.0%) | 0 (0.0%) |
| Total | 171 (100.0%) | 26 (100.0%) |
Household Vehicle Usage in Rhinecliff
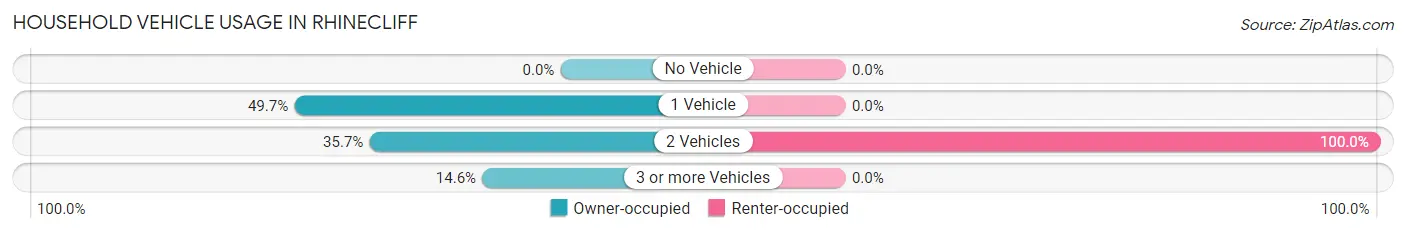
| Vehicles per Household | Owner-occupied | Renter-occupied |
| No Vehicle | 0 (0.0%) | 0 (0.0%) |
| 1 Vehicle | 85 (49.7%) | 0 (0.0%) |
| 2 Vehicles | 61 (35.7%) | 26 (100.0%) |
| 3 or more Vehicles | 25 (14.6%) | 0 (0.0%) |
| Total | 171 (100.0%) | 26 (100.0%) |
Real Estate & Mortgages in Rhinecliff
Real Estate and Mortgage Overview in Rhinecliff
| Characteristic | Without Mortgage | With Mortgage |
| Housing Units | 104 | 67 |
| Median Property Value | $365,800 | $587,500 |
| Median Household Income | - | - |
| Monthly Housing Costs | $1,258 | $49 |
| Real Estate Taxes | $6,456 | $0 |
Property Value by Mortgage Status in Rhinecliff
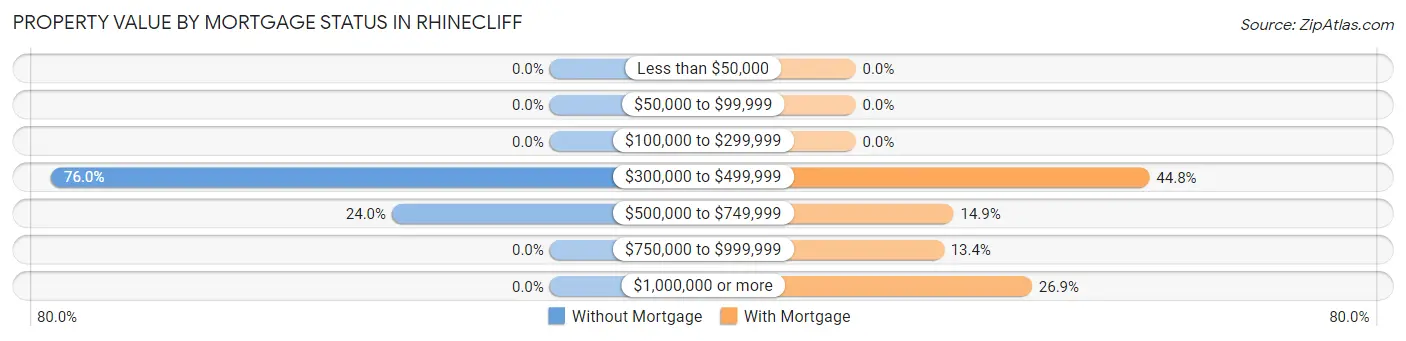
| Property Value | Without Mortgage | With Mortgage |
| Less than $50,000 | 0 (0.0%) | 0 (0.0%) |
| $50,000 to $99,999 | 0 (0.0%) | 0 (0.0%) |
| $100,000 to $299,999 | 0 (0.0%) | 0 (0.0%) |
| $300,000 to $499,999 | 79 (76.0%) | 30 (44.8%) |
| $500,000 to $749,999 | 25 (24.0%) | 10 (14.9%) |
| $750,000 to $999,999 | 0 (0.0%) | 9 (13.4%) |
| $1,000,000 or more | 0 (0.0%) | 18 (26.9%) |
| Total | 104 (100.0%) | 67 (100.0%) |
Household Income by Mortgage Status in Rhinecliff
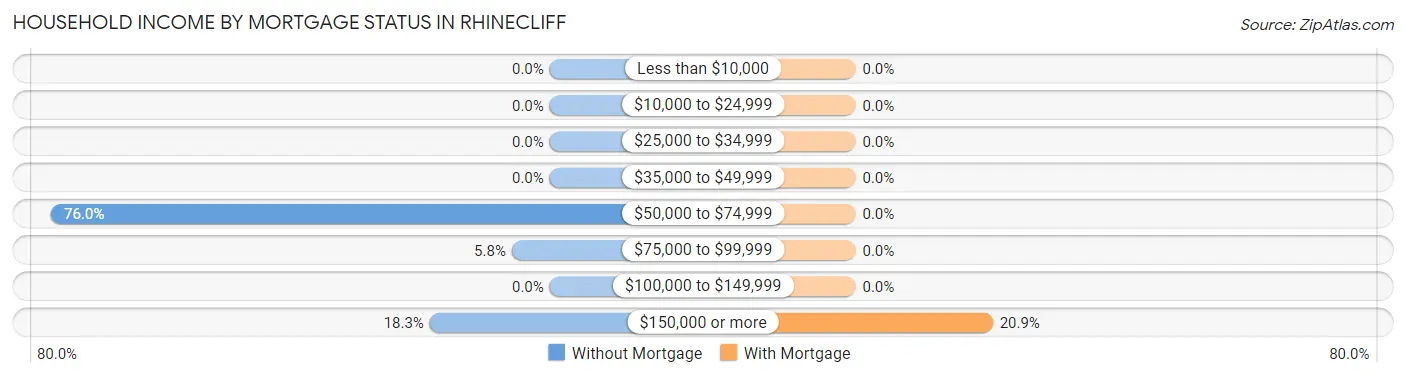
| Household Income | Without Mortgage | With Mortgage |
| Less than $10,000 | 0 (0.0%) | 0 (0.0%) |
| $10,000 to $24,999 | 0 (0.0%) | 0 (0.0%) |
| $25,000 to $34,999 | 0 (0.0%) | 0 (0.0%) |
| $35,000 to $49,999 | 0 (0.0%) | 0 (0.0%) |
| $50,000 to $74,999 | 79 (76.0%) | 0 (0.0%) |
| $75,000 to $99,999 | 6 (5.8%) | 0 (0.0%) |
| $100,000 to $149,999 | 0 (0.0%) | 0 (0.0%) |
| $150,000 or more | 19 (18.3%) | 14 (20.9%) |
| Total | 104 (100.0%) | 67 (100.0%) |
Property Value to Household Income Ratio in Rhinecliff
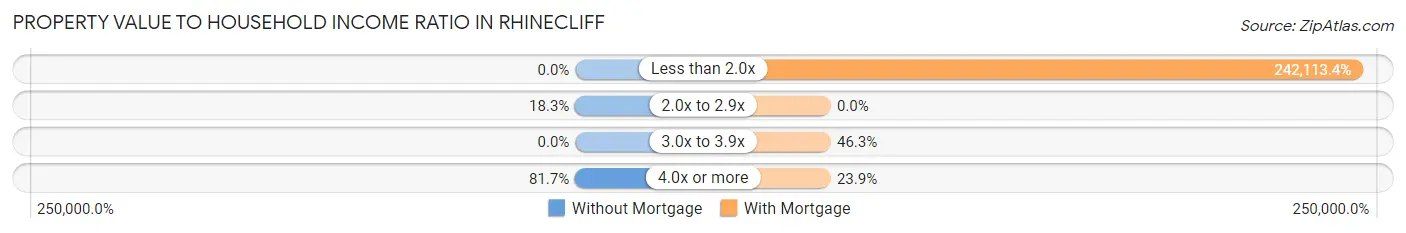
| Value-to-Income Ratio | Without Mortgage | With Mortgage |
| Less than 2.0x | 0 (0.0%) | 162,216 (242,113.4%) |
| 2.0x to 2.9x | 19 (18.3%) | 0 (0.0%) |
| 3.0x to 3.9x | 0 (0.0%) | 31 (46.3%) |
| 4.0x or more | 85 (81.7%) | 16 (23.9%) |
| Total | 104 (100.0%) | 67 (100.0%) |
Real Estate Taxes by Mortgage Status in Rhinecliff
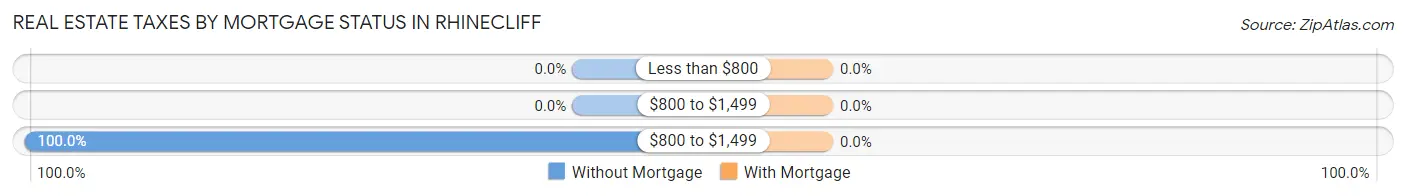
| Property Taxes | Without Mortgage | With Mortgage |
| Less than $800 | 0 (0.0%) | 0 (0.0%) |
| $800 to $1,499 | 0 (0.0%) | 0 (0.0%) |
| $800 to $1,499 | 104 (100.0%) | 0 (0.0%) |
| Total | 104 (100.0%) | 67 (100.0%) |
Health & Disability in Rhinecliff
Health Insurance Coverage by Age in Rhinecliff
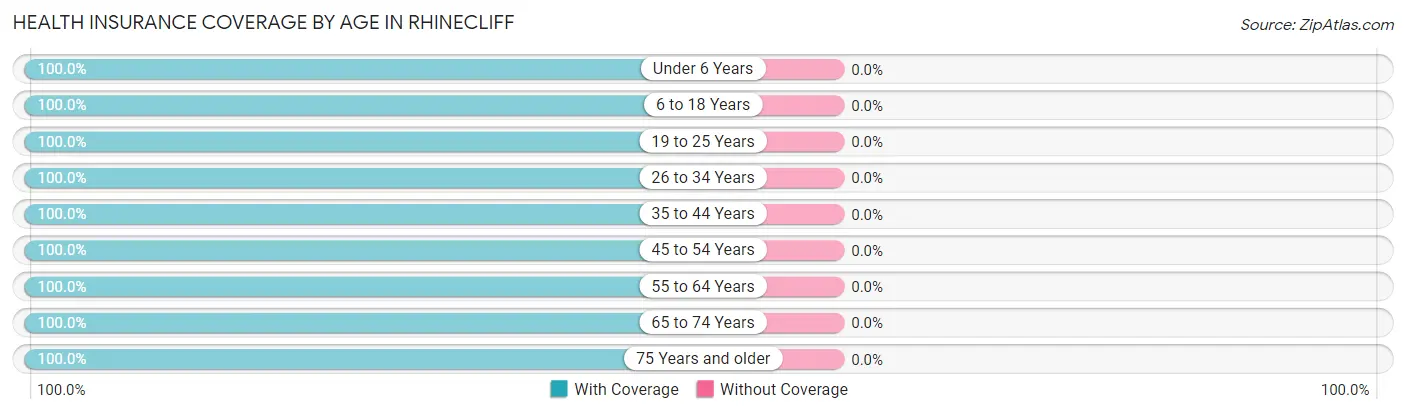
| Age Bracket | With Coverage | Without Coverage |
| Under 6 Years | 16 (100.0%) | 0 (0.0%) |
| 6 to 18 Years | 14 (100.0%) | 0 (0.0%) |
| 19 to 25 Years | 21 (100.0%) | 0 (0.0%) |
| 26 to 34 Years | 38 (100.0%) | 0 (0.0%) |
| 35 to 44 Years | 30 (100.0%) | 0 (0.0%) |
| 45 to 54 Years | 55 (100.0%) | 0 (0.0%) |
| 55 to 64 Years | 71 (100.0%) | 0 (0.0%) |
| 65 to 74 Years | 43 (100.0%) | 0 (0.0%) |
| 75 Years and older | 98 (100.0%) | 0 (0.0%) |
| Total | 386 (100.0%) | 0 (0.0%) |
Health Insurance Coverage by Citizenship Status in Rhinecliff
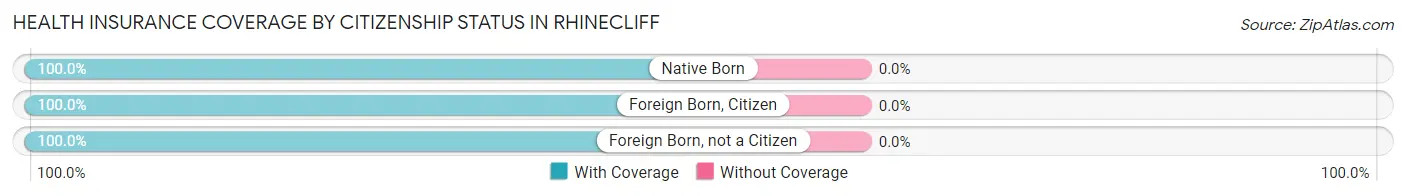
| Citizenship Status | With Coverage | Without Coverage |
| Native Born | 16 (100.0%) | 0 (0.0%) |
| Foreign Born, Citizen | 14 (100.0%) | 0 (0.0%) |
| Foreign Born, not a Citizen | 21 (100.0%) | 0 (0.0%) |
Health Insurance Coverage by Household Income in Rhinecliff
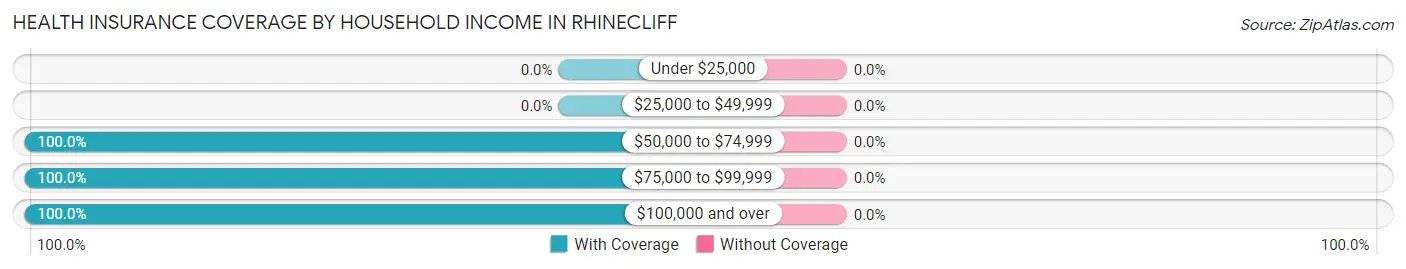
| Household Income | With Coverage | Without Coverage |
| Under $25,000 | 0 (0.0%) | 0 (0.0%) |
| $25,000 to $49,999 | 0 (0.0%) | 0 (0.0%) |
| $50,000 to $74,999 | 79 (100.0%) | 0 (0.0%) |
| $75,000 to $99,999 | 47 (100.0%) | 0 (0.0%) |
| $100,000 and over | 260 (100.0%) | 0 (0.0%) |
Public vs Private Health Insurance Coverage by Age in Rhinecliff
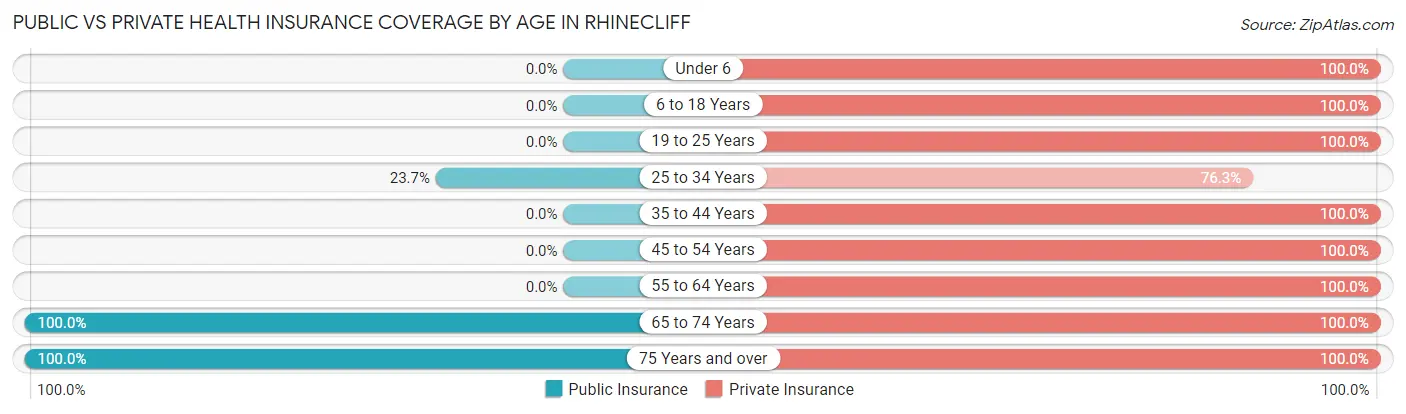
| Age Bracket | Public Insurance | Private Insurance |
| Under 6 | 0 (0.0%) | 16 (100.0%) |
| 6 to 18 Years | 0 (0.0%) | 14 (100.0%) |
| 19 to 25 Years | 0 (0.0%) | 21 (100.0%) |
| 25 to 34 Years | 9 (23.7%) | 29 (76.3%) |
| 35 to 44 Years | 0 (0.0%) | 30 (100.0%) |
| 45 to 54 Years | 0 (0.0%) | 55 (100.0%) |
| 55 to 64 Years | 0 (0.0%) | 71 (100.0%) |
| 65 to 74 Years | 43 (100.0%) | 43 (100.0%) |
| 75 Years and over | 98 (100.0%) | 98 (100.0%) |
| Total | 150 (38.9%) | 377 (97.7%) |
Disability Status by Sex by Age in Rhinecliff
| Age Bracket | Male | Female |
| Under 5 Years | 0 (0.0%) | 0 (0.0%) |
| 5 to 17 Years | 0 (0.0%) | 0 (0.0%) |
| 18 to 34 Years | 0 (0.0%) | 0 (0.0%) |
| 35 to 64 Years | 0 (0.0%) | 0 (0.0%) |
| 65 to 74 Years | 0 (0.0%) | 0 (0.0%) |
| 75 Years and over | 0 (0.0%) | 0 (0.0%) |
Disability Class by Sex by Age in Rhinecliff
Disability Class: Hearing Difficulty
| Age Bracket | Male | Female |
| Under 5 Years | 0 (0.0%) | 0 (0.0%) |
| 5 to 17 Years | 0 (0.0%) | 0 (0.0%) |
| 18 to 34 Years | 0 (0.0%) | 0 (0.0%) |
| 35 to 64 Years | 0 (0.0%) | 0 (0.0%) |
| 65 to 74 Years | 0 (0.0%) | 0 (0.0%) |
| 75 Years and over | 0 (0.0%) | 0 (0.0%) |
Disability Class: Vision Difficulty
| Age Bracket | Male | Female |
| Under 5 Years | 0 (0.0%) | 0 (0.0%) |
| 5 to 17 Years | 0 (0.0%) | 0 (0.0%) |
| 18 to 34 Years | 0 (0.0%) | 0 (0.0%) |
| 35 to 64 Years | 0 (0.0%) | 0 (0.0%) |
| 65 to 74 Years | 0 (0.0%) | 0 (0.0%) |
| 75 Years and over | 0 (0.0%) | 0 (0.0%) |
Disability Class: Cognitive Difficulty
| Age Bracket | Male | Female |
| 5 to 17 Years | 0 (0.0%) | 0 (0.0%) |
| 18 to 34 Years | 0 (0.0%) | 0 (0.0%) |
| 35 to 64 Years | 0 (0.0%) | 0 (0.0%) |
| 65 to 74 Years | 0 (0.0%) | 0 (0.0%) |
| 75 Years and over | 0 (0.0%) | 0 (0.0%) |
Disability Class: Ambulatory Difficulty
| Age Bracket | Male | Female |
| 5 to 17 Years | 0 (0.0%) | 0 (0.0%) |
| 18 to 34 Years | 0 (0.0%) | 0 (0.0%) |
| 35 to 64 Years | 0 (0.0%) | 0 (0.0%) |
| 65 to 74 Years | 0 (0.0%) | 0 (0.0%) |
| 75 Years and over | 0 (0.0%) | 0 (0.0%) |
Disability Class: Self-Care Difficulty
| Age Bracket | Male | Female |
| 5 to 17 Years | 0 (0.0%) | 0 (0.0%) |
| 18 to 34 Years | 0 (0.0%) | 0 (0.0%) |
| 35 to 64 Years | 0 (0.0%) | 0 (0.0%) |
| 65 to 74 Years | 0 (0.0%) | 0 (0.0%) |
| 75 Years and over | 0 (0.0%) | 0 (0.0%) |
Technology Access in Rhinecliff
Computing Device Access in Rhinecliff
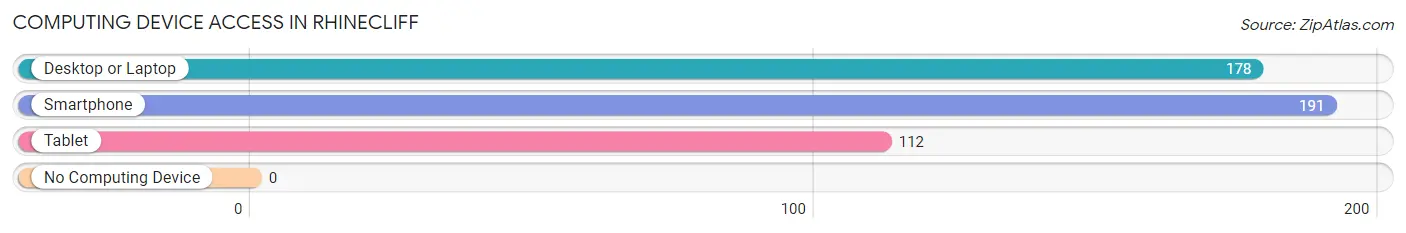
| Device Type | # Households | % Households |
| Desktop or Laptop | 178 | 90.4% |
| Smartphone | 191 | 97.0% |
| Tablet | 112 | 56.9% |
| No Computing Device | 0 | 0.0% |
| Total | 197 | 100.0% |
Internet Access in Rhinecliff
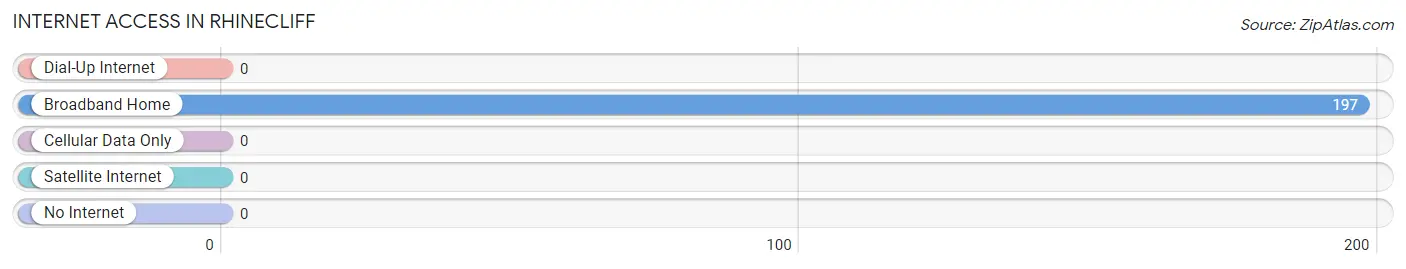
| Internet Type | # Households | % Households |
| Dial-Up Internet | 0 | 0.0% |
| Broadband Home | 197 | 100.0% |
| Cellular Data Only | 0 | 0.0% |
| Satellite Internet | 0 | 0.0% |
| No Internet | 0 | 0.0% |
| Total | 197 | 100.0% |
Rhinecliff Summary
Rhinecliff is a small hamlet located in the town of Rhinebeck in Dutchess County, New York. It is situated on the east bank of the Hudson River, approximately two miles north of the village of Rhinebeck. The hamlet is part of the Hudson Valley region and is located within the Hudson River Historic District.
History
Rhinecliff was first settled in the late 17th century by Dutch settlers. The hamlet was originally known as “Ryn Cliffe” and was part of the town of Rhinebeck. In 1797, the hamlet was officially incorporated as the village of Rhinecliff. The village was named after the nearby Rhinecliff Creek, which was named after the Rhine River in Germany.
In the early 19th century, Rhinecliff was a thriving port town. It was home to several wharves, warehouses, and shipyards. The hamlet was also home to several mills, including a paper mill, a grist mill, and a saw mill.
In the mid-19th century, Rhinecliff began to decline as a port town. The opening of the Hudson River Railroad in 1851 made it easier for goods to be transported by rail, rather than by boat. This led to a decrease in the number of ships that stopped in Rhinecliff. By the late 19th century, the hamlet had become a quiet rural community.
Geography
Rhinecliff is located in the town of Rhinebeck in Dutchess County, New York. It is situated on the east bank of the Hudson River, approximately two miles north of the village of Rhinebeck. The hamlet is part of the Hudson Valley region and is located within the Hudson River Historic District.
The hamlet is bordered to the north by the town of Red Hook, to the east by the town of Milan, to the south by the village of Rhinebeck, and to the west by the Hudson River. The hamlet is located at an elevation of approximately 200 feet above sea level.
Economy
Rhinecliff is a small, rural community with a population of approximately 500 people. The hamlet is primarily a residential community, with most of its residents commuting to nearby towns and cities for work.
The hamlet is home to several small businesses, including a few restaurants, a grocery store, a hardware store, and a few antique shops. The hamlet is also home to a few bed and breakfasts, as well as a few small inns.
Demographics
As of the 2010 census, the population of Rhinecliff was 498. The racial makeup of the hamlet was 94.4% White, 1.2% African American, 0.2% Native American, 0.6% Asian, 0.2% Pacific Islander, and 3.4% from other races. Hispanic or Latino of any race were 4.2% of the population.
The median household income in Rhinecliff was $50,000, and the median family income was $58,750. The per capita income for the hamlet was $25,945. About 8.3% of families and 10.2% of the population were below the poverty line, including 15.2% of those under age 18 and 4.2% of those age 65 or over.
Common Questions
What is Per Capita Income in Rhinecliff?
Per Capita income in Rhinecliff is $73,736.
What is the Median Family Income in Rhinecliff?
Median Family Income in Rhinecliff is $196,250.
What is Income or Wage Gap in Rhinecliff?
Income or Wage Gap in Rhinecliff is 27.2%.
Women in Rhinecliff earn 72.8 cents for every dollar earned by a man.
What is Inequality or Gini Index in Rhinecliff?
Inequality or Gini Index in Rhinecliff is 0.42.
What is the Total Population of Rhinecliff?
Total Population of Rhinecliff is 386.
What is the Total Male Population of Rhinecliff?
Total Male Population of Rhinecliff is 170.
What is the Total Female Population of Rhinecliff?
Total Female Population of Rhinecliff is 216.
What is the Ratio of Males per 100 Females in Rhinecliff?
There are 78.70 Males per 100 Females in Rhinecliff.
What is the Ratio of Females per 100 Males in Rhinecliff?
There are 127.06 Females per 100 Males in Rhinecliff.
What is the Median Population Age in Rhinecliff?
Median Population Age in Rhinecliff is 60.9 Years.
What is the Average Family Size in Rhinecliff
Average Family Size in Rhinecliff is 2.5 People.
What is the Average Household Size in Rhinecliff
Average Household Size in Rhinecliff is 2.0 People.
How Large is the Labor Force in Rhinecliff?
There are 225 People in the Labor Forcein in Rhinecliff.
What is the Percentage of People in the Labor Force in Rhinecliff?
63.2% of People are in the Labor Force in Rhinecliff.
What is the Unemployment Rate in Rhinecliff?
Unemployment Rate in Rhinecliff is 3.6%.