Cedarhurst, NY Map & Demographics
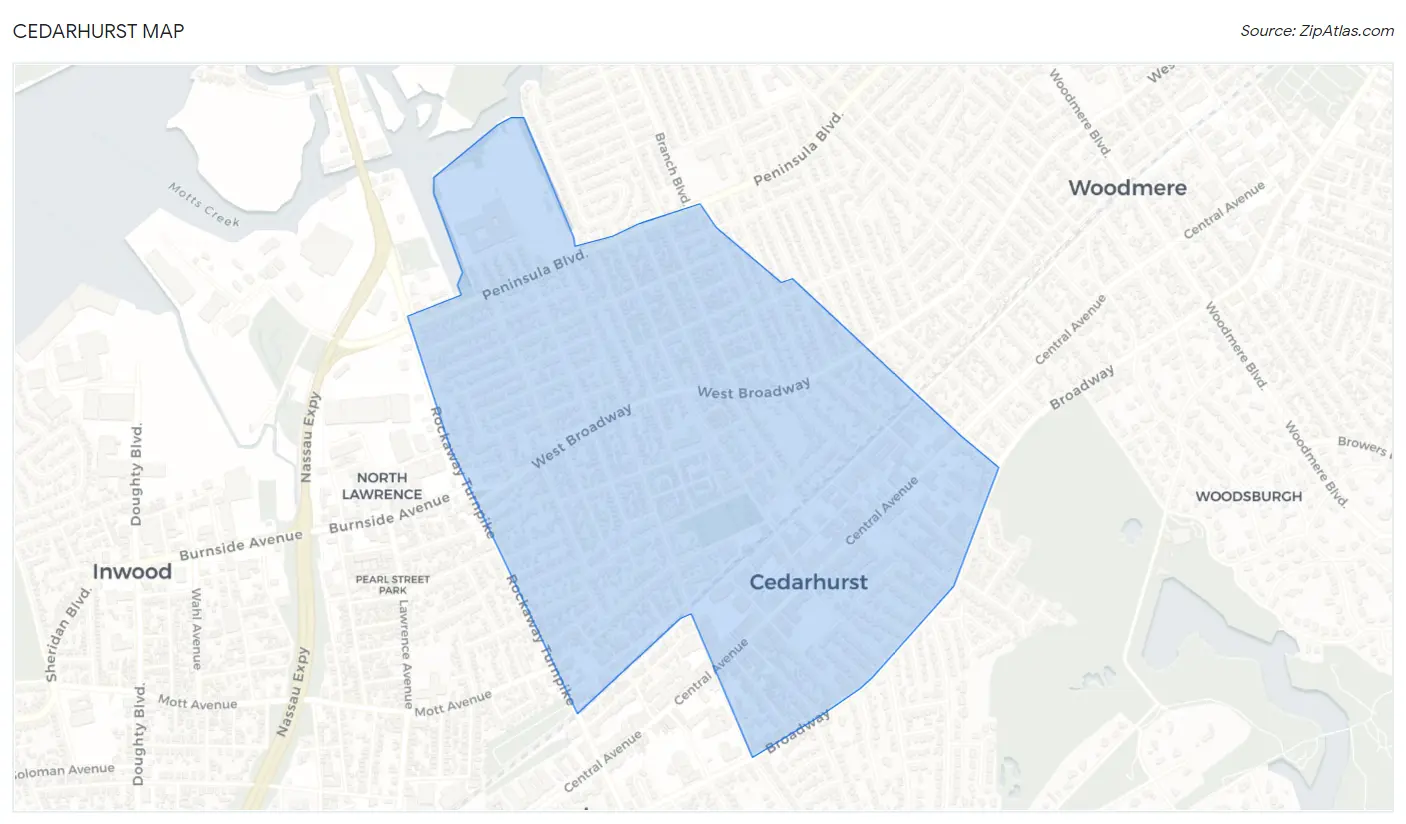
Cedarhurst Map
Cedarhurst Overview
$48,127
PER CAPITA INCOME
$147,125
AVG FAMILY INCOME
$102,561
AVG HOUSEHOLD INCOME
3.9%
WAGE / INCOME GAP [ % ]
96.1¢/ $1
WAGE / INCOME GAP [ $ ]
0.46
INEQUALITY / GINI INDEX
7,307
TOTAL POPULATION
3,860
MALE POPULATION
3,447
FEMALE POPULATION
111.98
MALES / 100 FEMALES
89.30
FEMALES / 100 MALES
35.4
MEDIAN AGE
3.9
AVG FAMILY SIZE
2.9
AVG HOUSEHOLD SIZE
3,401
LABOR FORCE [ PEOPLE ]
63.7%
PERCENT IN LABOR FORCE
7.1%
UNEMPLOYMENT RATE
Cedarhurst Zip Codes
Cedarhurst Area Codes
Income in Cedarhurst
Income Overview in Cedarhurst
Per Capita Income in Cedarhurst is $48,127, while median incomes of families and households are $147,125 and $102,561 respectively.
| Characteristic | Number | Measure |
| Per Capita Income | 7,307 | $48,127 |
| Median Family Income | 1,633 | $147,125 |
| Mean Family Income | 1,633 | $184,619 |
| Median Household Income | 2,489 | $102,561 |
| Mean Household Income | 2,489 | $141,242 |
| Income Deficit | 1,633 | $0 |
| Wage / Income Gap (%) | 7,307 | 3.93% |
| Wage / Income Gap ($) | 7,307 | 96.07¢ per $1 |
| Gini / Inequality Index | 7,307 | 0.46 |
Earnings by Sex in Cedarhurst
Average Earnings in Cedarhurst are $55,327, $54,004 for men and $56,216 for women, a difference of 3.9%.
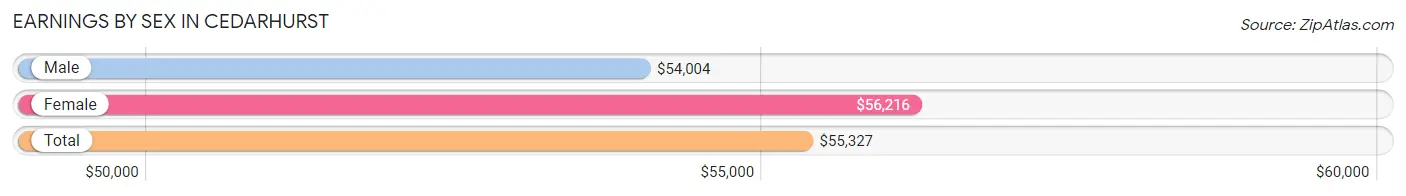
| Sex | Number | Average Earnings |
| Male | 1,923 (54.0%) | $54,004 |
| Female | 1,639 (46.0%) | $56,216 |
| Total | 3,562 (100.0%) | $55,327 |
Earnings by Sex by Income Bracket in Cedarhurst
The most common earnings brackets in Cedarhurst are $100,000+ for men (481 | 25.0%) and $100,000+ for women (311 | 19.0%).
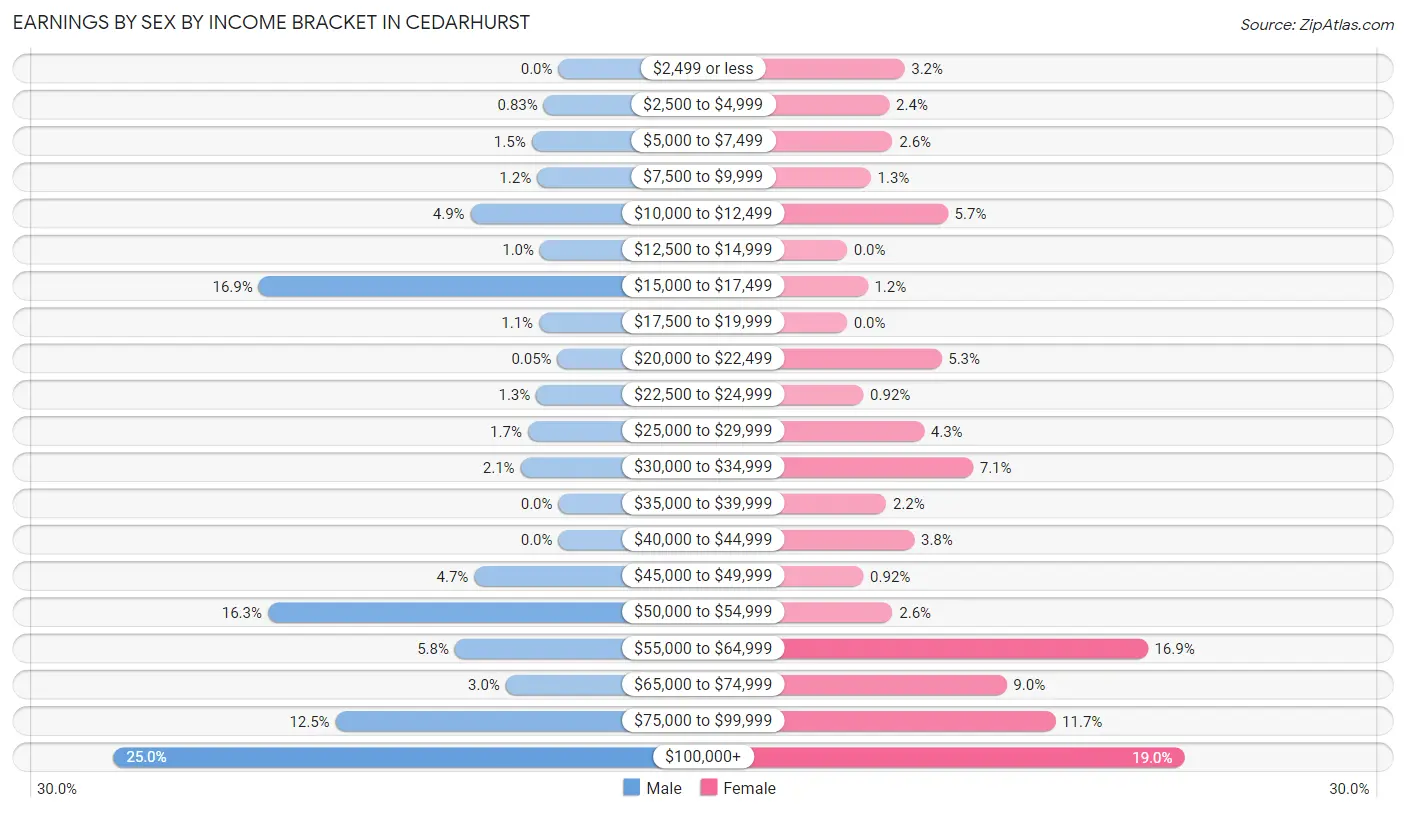
| Income | Male | Female |
| $2,499 or less | 0 (0.0%) | 53 (3.2%) |
| $2,500 to $4,999 | 16 (0.8%) | 39 (2.4%) |
| $5,000 to $7,499 | 29 (1.5%) | 42 (2.6%) |
| $7,500 to $9,999 | 23 (1.2%) | 22 (1.3%) |
| $10,000 to $12,499 | 95 (4.9%) | 93 (5.7%) |
| $12,500 to $14,999 | 20 (1.0%) | 0 (0.0%) |
| $15,000 to $17,499 | 324 (16.9%) | 19 (1.2%) |
| $17,500 to $19,999 | 21 (1.1%) | 0 (0.0%) |
| $20,000 to $22,499 | 1 (0.1%) | 87 (5.3%) |
| $22,500 to $24,999 | 24 (1.3%) | 15 (0.9%) |
| $25,000 to $29,999 | 33 (1.7%) | 71 (4.3%) |
| $30,000 to $34,999 | 41 (2.1%) | 116 (7.1%) |
| $35,000 to $39,999 | 0 (0.0%) | 36 (2.2%) |
| $40,000 to $44,999 | 0 (0.0%) | 62 (3.8%) |
| $45,000 to $49,999 | 91 (4.7%) | 15 (0.9%) |
| $50,000 to $54,999 | 314 (16.3%) | 42 (2.6%) |
| $55,000 to $64,999 | 112 (5.8%) | 277 (16.9%) |
| $65,000 to $74,999 | 57 (3.0%) | 147 (9.0%) |
| $75,000 to $99,999 | 241 (12.5%) | 192 (11.7%) |
| $100,000+ | 481 (25.0%) | 311 (19.0%) |
| Total | 1,923 (100.0%) | 1,639 (100.0%) |
Earnings by Sex by Educational Attainment in Cedarhurst
Average earnings in Cedarhurst are $56,552 for men and $57,059 for women, a difference of 0.9%. Men with an educational attainment of graduate degree enjoy the highest average annual earnings of $141,164, while those with high school diploma education earn the least with $58,475. Women with an educational attainment of bachelor's degree earn the most with the average annual earnings of $125,313, while those with college or associate's degree education have the smallest earnings of $56,974.
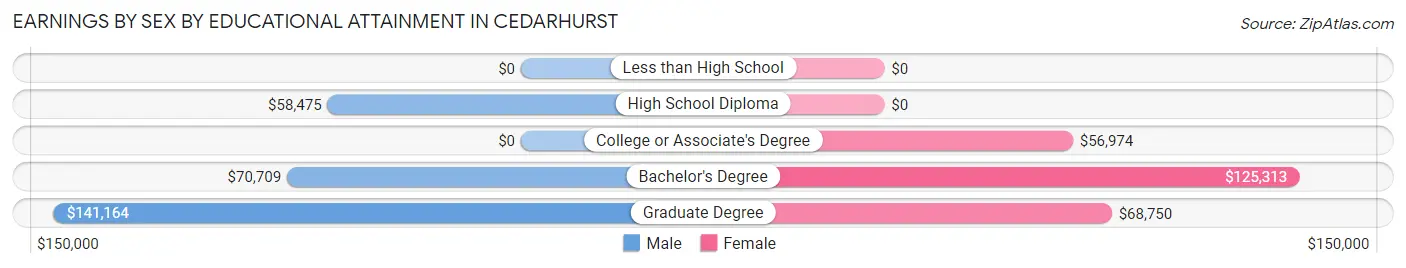
| Educational Attainment | Male Income | Female Income |
| Less than High School | - | - |
| High School Diploma | $58,475 | $0 |
| College or Associate's Degree | - | - |
| Bachelor's Degree | $70,709 | $125,313 |
| Graduate Degree | $141,164 | $68,750 |
| Total | $56,552 | $57,059 |
Family Income in Cedarhurst
Family Income Brackets in Cedarhurst
According to the Cedarhurst family income data, there are 576 families falling into the $200,000+ income range, which is the most common income bracket and makes up 35.3% of all families.
| Income Bracket | # Families | % Families |
| Less than $10,000 | 0 | 0.0% |
| $10,000 to $14,999 | 0 | 0.0% |
| $15,000 to $24,999 | 0 | 0.0% |
| $25,000 to $34,999 | 60 | 3.7% |
| $35,000 to $49,999 | 51 | 3.1% |
| $50,000 to $74,999 | 389 | 23.8% |
| $75,000 to $99,999 | 51 | 3.1% |
| $100,000 to $149,999 | 294 | 18.0% |
| $150,000 to $199,999 | 211 | 12.9% |
| $200,000+ | 576 | 35.3% |
Family Income by Famaliy Size in Cedarhurst
5-person families (237 | 14.5%) account for the highest median family income in Cedarhurst with $250,001 per family, while 2-person families (440 | 26.9%) have the highest median income of $62,206 per family member.
| Income Bracket | # Families | Median Income |
| 2-Person Families | 440 (26.9%) | $124,412 |
| 3-Person Families | 480 (29.4%) | $0 |
| 4-Person Families | 127 (7.8%) | $193,813 |
| 5-Person Families | 237 (14.5%) | $250,001 |
| 6-Person Families | 312 (19.1%) | $0 |
| 7+ Person Families | 37 (2.3%) | $0 |
| Total | 1,633 (100.0%) | $147,125 |
Family Income by Number of Earners in Cedarhurst
| Number of Earners | # Families | Median Income |
| No Earners | 44 (2.7%) | $0 |
| 1 Earner | 588 (36.0%) | $126,250 |
| 2 Earners | 762 (46.7%) | $153,920 |
| 3+ Earners | 239 (14.6%) | $250,001 |
| Total | 1,633 (100.0%) | $147,125 |
Household Income in Cedarhurst
Household Income Brackets in Cedarhurst
With 595 households falling in the category, the $200,000+ income range is the most frequent in Cedarhurst, accounting for 23.9% of all households. In contrast, only 40 households (1.6%) fall into the $15,000 to $24,999 income bracket, making it the least populous group.
| Income Bracket | # Households | % Households |
| Less than $10,000 | 75 | 3.0% |
| $10,000 to $14,999 | 82 | 3.3% |
| $15,000 to $24,999 | 40 | 1.6% |
| $25,000 to $34,999 | 172 | 6.9% |
| $35,000 to $49,999 | 234 | 9.4% |
| $50,000 to $74,999 | 483 | 19.4% |
| $75,000 to $99,999 | 159 | 6.4% |
| $100,000 to $149,999 | 443 | 17.8% |
| $150,000 to $199,999 | 209 | 8.4% |
| $200,000+ | 595 | 23.9% |
Household Income by Householder Age in Cedarhurst
The median household income in Cedarhurst is $102,561, with the highest median household income of $124,293 found in the 25 to 44 years age bracket for the primary householder. A total of 689 households (27.7%) fall into this category.
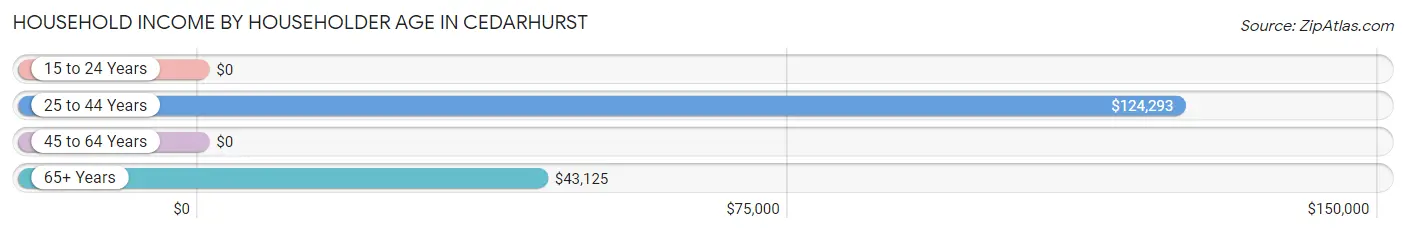
| Income Bracket | # Households | Median Income |
| 15 to 24 Years | 0 (0.0%) | $0 |
| 25 to 44 Years | 689 (27.7%) | $124,293 |
| 45 to 64 Years | 873 (35.1%) | $0 |
| 65+ Years | 927 (37.2%) | $43,125 |
| Total | 2,489 (100.0%) | $102,561 |
Poverty in Cedarhurst
Income Below Poverty by Sex and Age in Cedarhurst
With 2.6% poverty level for males and 2.5% for females among the residents of Cedarhurst, 75 year old and over males and 75 year old and over females are the most vulnerable to poverty, with 40 males (30.1%) and 67 females (25.7%) in their respective age groups living below the poverty level.
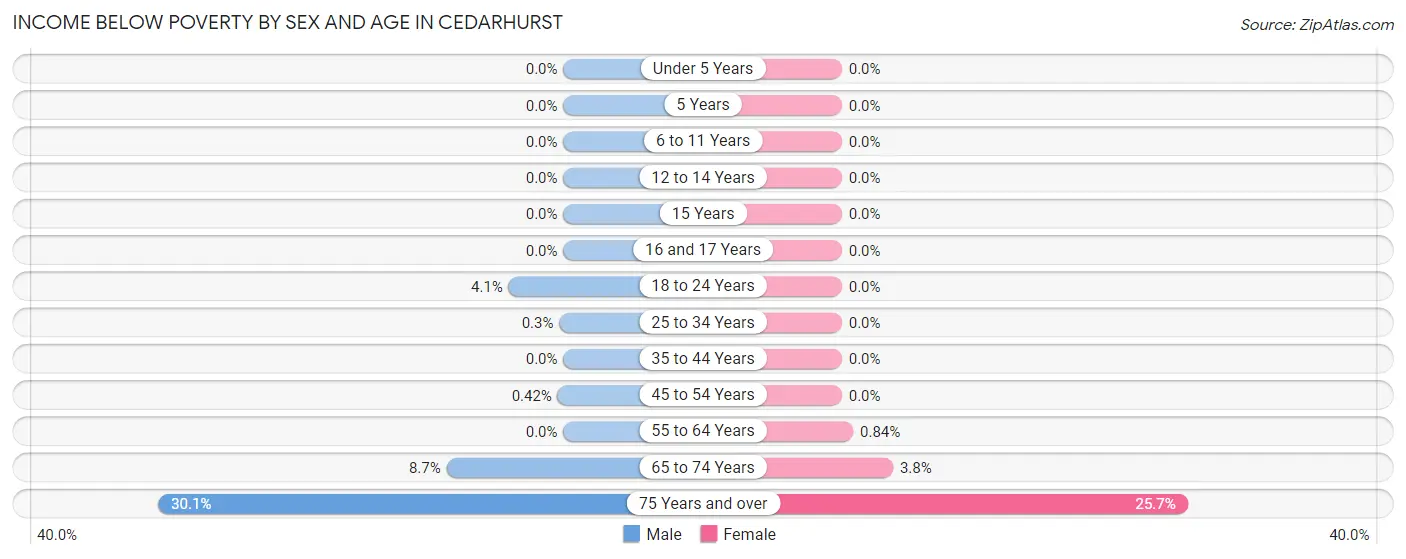
| Age Bracket | Male | Female |
| Under 5 Years | 0 (0.0%) | 0 (0.0%) |
| 5 Years | 0 (0.0%) | 0 (0.0%) |
| 6 to 11 Years | 0 (0.0%) | 0 (0.0%) |
| 12 to 14 Years | 0 (0.0%) | 0 (0.0%) |
| 15 Years | 0 (0.0%) | 0 (0.0%) |
| 16 and 17 Years | 0 (0.0%) | 0 (0.0%) |
| 18 to 24 Years | 23 (4.1%) | 0 (0.0%) |
| 25 to 34 Years | 1 (0.3%) | 0 (0.0%) |
| 35 to 44 Years | 0 (0.0%) | 0 (0.0%) |
| 45 to 54 Years | 1 (0.4%) | 0 (0.0%) |
| 55 to 64 Years | 0 (0.0%) | 4 (0.8%) |
| 65 to 74 Years | 36 (8.7%) | 14 (3.8%) |
| 75 Years and over | 40 (30.1%) | 67 (25.7%) |
| Total | 101 (2.6%) | 85 (2.5%) |
Income Above Poverty by Sex and Age in Cedarhurst
According to the poverty statistics in Cedarhurst, males aged under 5 years and females aged under 5 years are the age groups that are most secure financially, with 100.0% of males and 100.0% of females in these age groups living above the poverty line.
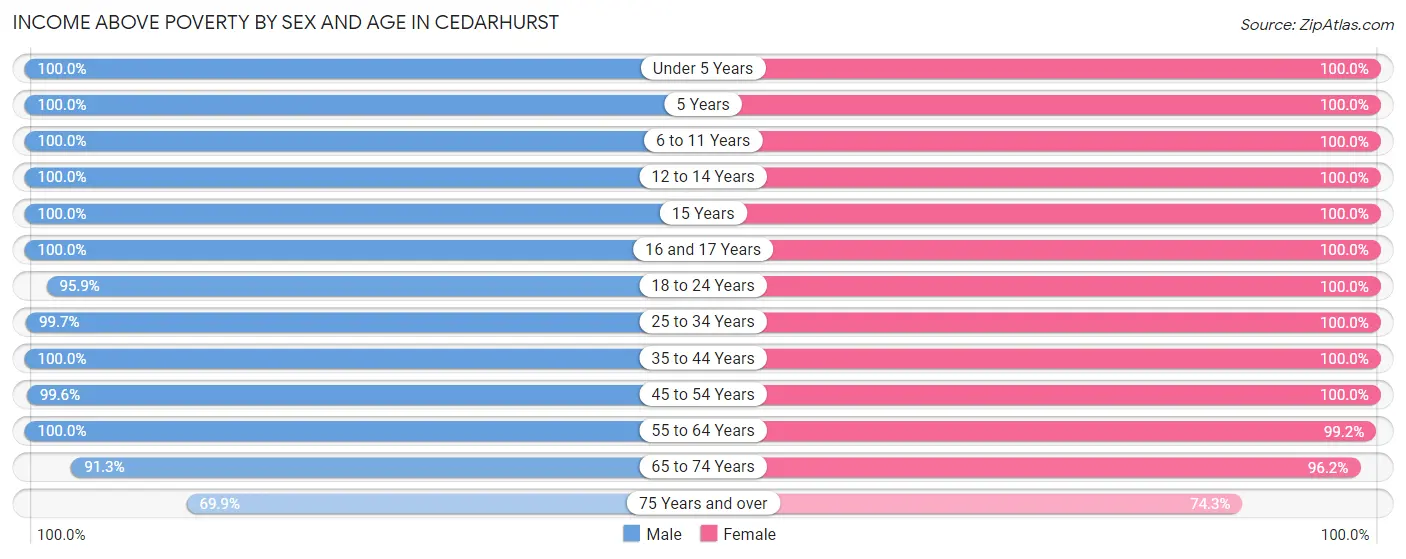
| Age Bracket | Male | Female |
| Under 5 Years | 234 (100.0%) | 157 (100.0%) |
| 5 Years | 42 (100.0%) | 66 (100.0%) |
| 6 to 11 Years | 401 (100.0%) | 379 (100.0%) |
| 12 to 14 Years | 252 (100.0%) | 228 (100.0%) |
| 15 Years | 151 (100.0%) | 58 (100.0%) |
| 16 and 17 Years | 126 (100.0%) | 56 (100.0%) |
| 18 to 24 Years | 543 (95.9%) | 351 (100.0%) |
| 25 to 34 Years | 333 (99.7%) | 202 (100.0%) |
| 35 to 44 Years | 426 (100.0%) | 516 (100.0%) |
| 45 to 54 Years | 237 (99.6%) | 326 (100.0%) |
| 55 to 64 Years | 542 (100.0%) | 475 (99.2%) |
| 65 to 74 Years | 379 (91.3%) | 354 (96.2%) |
| 75 Years and over | 93 (69.9%) | 194 (74.3%) |
| Total | 3,759 (97.4%) | 3,362 (97.5%) |
Income Below Poverty Among Married-Couple Families in Cedarhurst
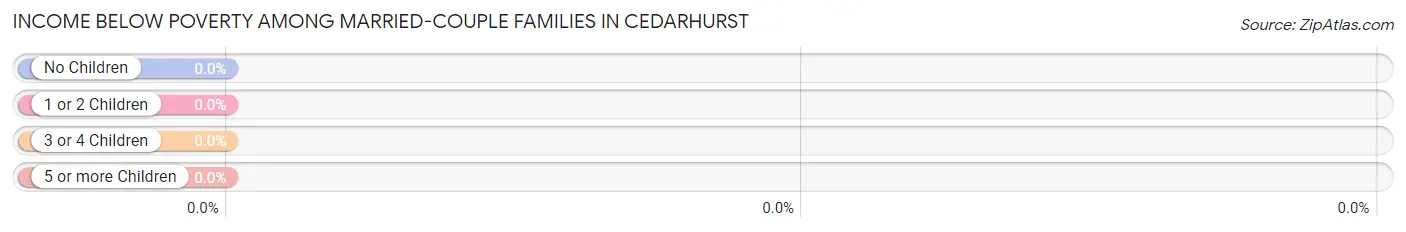
| Children | Above Poverty | Below Poverty |
| No Children | 800 (100.0%) | 0 (0.0%) |
| 1 or 2 Children | 285 (100.0%) | 0 (0.0%) |
| 3 or 4 Children | 392 (100.0%) | 0 (0.0%) |
| 5 or more Children | 23 (100.0%) | 0 (0.0%) |
| Total | 1,500 (100.0%) | 0 (0.0%) |
Income Below Poverty Among Single-Parent Households in Cedarhurst
| Children | Single Father | Single Mother |
| No Children | 0 (0.0%) | 0 (0.0%) |
| 1 or 2 Children | 0 (0.0%) | 0 (0.0%) |
| 3 or 4 Children | 0 (0.0%) | 0 (0.0%) |
| 5 or more Children | 0 (0.0%) | 0 (0.0%) |
| Total | 0 (0.0%) | 0 (0.0%) |
Income Below Poverty Among Married-Couple vs Single-Parent Households in Cedarhurst
| Children | Married-Couple Families | Single-Parent Households |
| No Children | 0 (0.0%) | 0 (0.0%) |
| 1 or 2 Children | 0 (0.0%) | 0 (0.0%) |
| 3 or 4 Children | 0 (0.0%) | 0 (0.0%) |
| 5 or more Children | 0 (0.0%) | 0 (0.0%) |
| Total | 0 (0.0%) | 0 (0.0%) |
Race in Cedarhurst
The most populous races in Cedarhurst are White / Caucasian (6,213 | 85.0%), Hispanic or Latino (1,200 | 16.4%), and Two or more Races (698 | 9.6%).
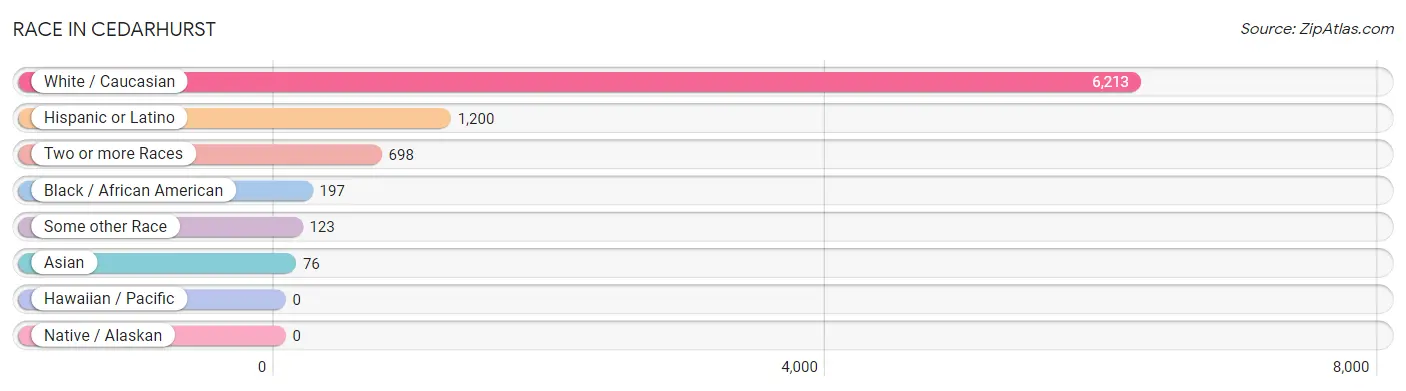
| Race | # Population | % Population |
| Asian | 76 | 1.0% |
| Black / African American | 197 | 2.7% |
| Hawaiian / Pacific | 0 | 0.0% |
| Hispanic or Latino | 1,200 | 16.4% |
| Native / Alaskan | 0 | 0.0% |
| White / Caucasian | 6,213 | 85.0% |
| Two or more Races | 698 | 9.6% |
| Some other Race | 123 | 1.7% |
| Total | 7,307 | 100.0% |
Ancestry in Cedarhurst
The most populous ancestries reported in Cedarhurst are Polish (1,075 | 14.7%), American (729 | 10.0%), South American (669 | 9.2%), Chilean (644 | 8.8%), and Hungarian (633 | 8.7%), together accounting for 51.3% of all Cedarhurst residents.
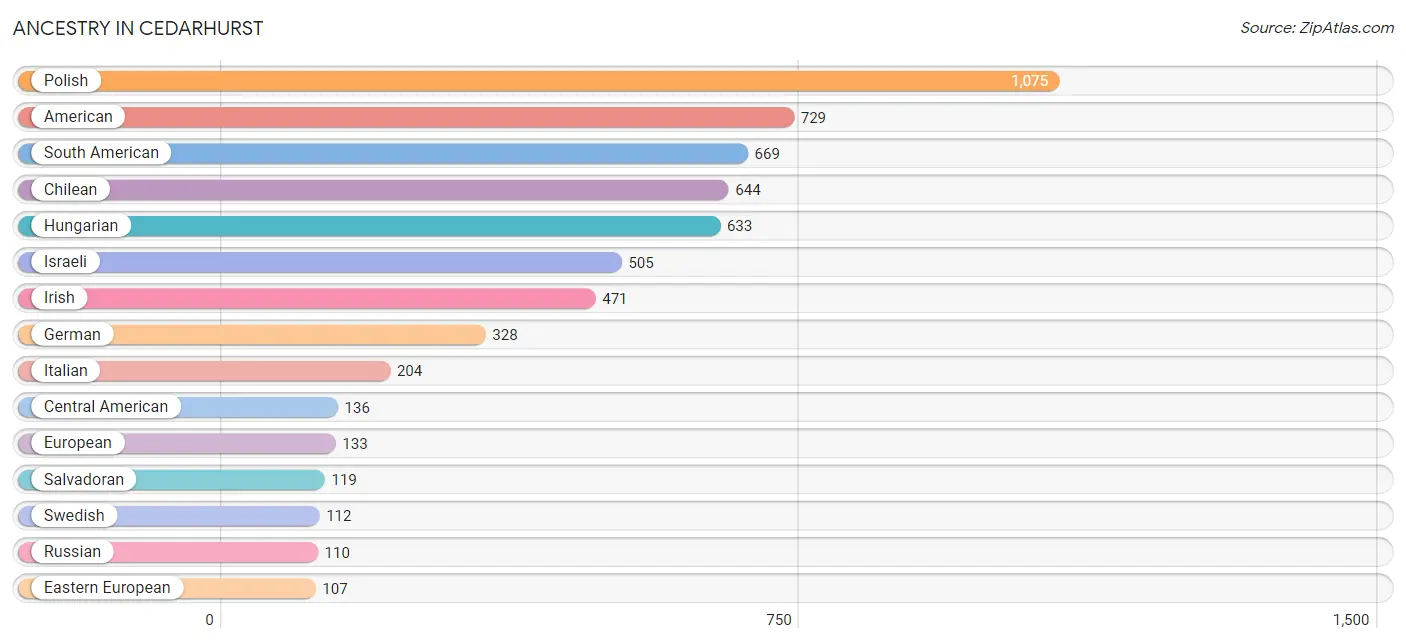
| Ancestry | # Population | % Population |
| African | 18 | 0.3% |
| American | 729 | 10.0% |
| Arab | 85 | 1.2% |
| Argentinean | 25 | 0.3% |
| Austrian | 77 | 1.1% |
| British | 22 | 0.3% |
| Burmese | 42 | 0.6% |
| Central American | 136 | 1.9% |
| Chilean | 644 | 8.8% |
| Danish | 27 | 0.4% |
| Dominican | 37 | 0.5% |
| Eastern European | 107 | 1.5% |
| English | 58 | 0.8% |
| European | 133 | 1.8% |
| Finnish | 26 | 0.4% |
| French | 27 | 0.4% |
| German | 328 | 4.5% |
| Greek | 39 | 0.5% |
| Guatemalan | 17 | 0.2% |
| Hungarian | 633 | 8.7% |
| Indian (Asian) | 13 | 0.2% |
| Iranian | 57 | 0.8% |
| Iraqi | 14 | 0.2% |
| Irish | 471 | 6.5% |
| Israeli | 505 | 6.9% |
| Italian | 204 | 2.8% |
| Korean | 20 | 0.3% |
| Polish | 1,075 | 14.7% |
| Romanian | 15 | 0.2% |
| Russian | 110 | 1.5% |
| Salvadoran | 119 | 1.6% |
| South American | 669 | 9.2% |
| Spaniard | 19 | 0.3% |
| Subsaharan African | 18 | 0.3% |
| Swedish | 112 | 1.5% |
| Syrian | 14 | 0.2% |
| Thai | 1 | 0.0% |
| Ukrainian | 29 | 0.4% | View All 38 Rows |
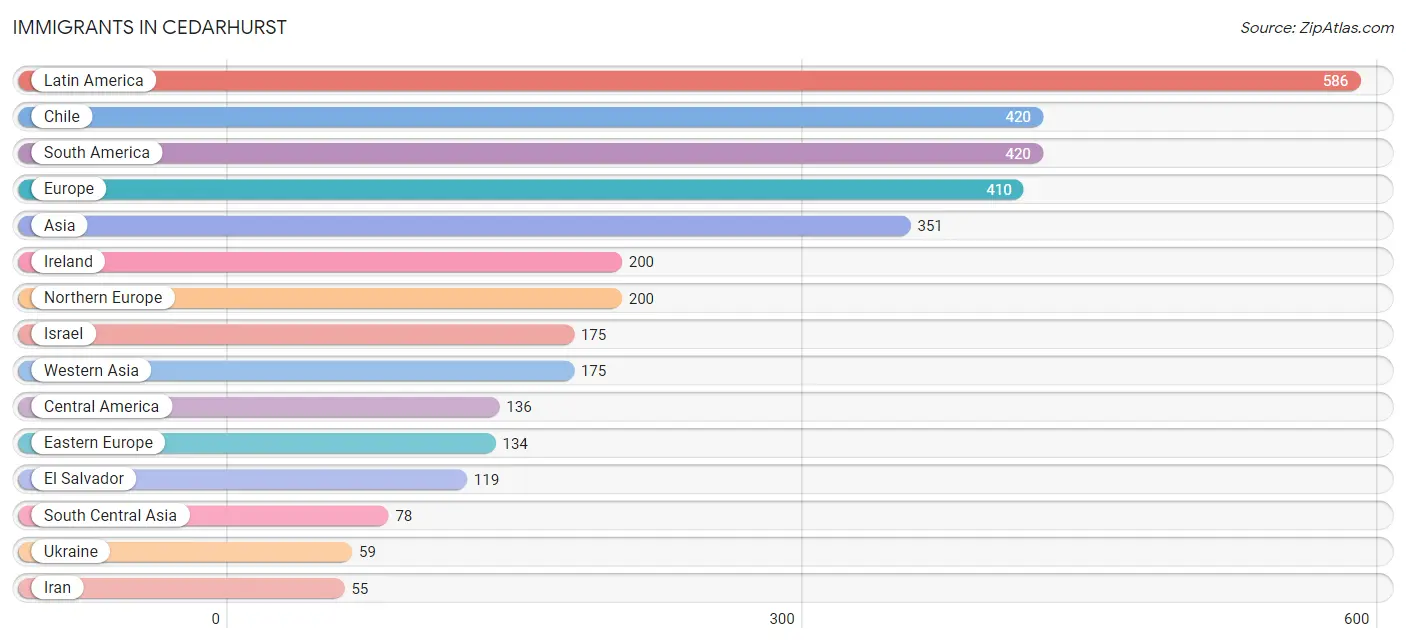
Immigrants in Cedarhurst
The most numerous immigrant groups reported in Cedarhurst came from Latin America (586 | 8.0%), Chile (420 | 5.8%), South America (420 | 5.8%), Europe (410 | 5.6%), and Asia (351 | 4.8%), together accounting for 29.9% of all Cedarhurst residents.
| Immigration Origin | # Population | % Population |
| Africa | 18 | 0.3% |
| Asia | 351 | 4.8% |
| Belarus | 1 | 0.0% |
| Canada | 32 | 0.4% |
| Caribbean | 30 | 0.4% |
| Central America | 136 | 1.9% |
| Chile | 420 | 5.8% |
| China | 13 | 0.2% |
| Dominican Republic | 12 | 0.2% |
| Eastern Asia | 13 | 0.2% |
| Eastern Europe | 134 | 1.8% |
| El Salvador | 119 | 1.6% |
| Europe | 410 | 5.6% |
| Germany | 54 | 0.7% |
| Guatemala | 17 | 0.2% |
| Hungary | 19 | 0.3% |
| India | 1 | 0.0% |
| Iran | 55 | 0.7% |
| Ireland | 200 | 2.7% |
| Israel | 175 | 2.4% |
| Italy | 22 | 0.3% |
| Jamaica | 18 | 0.3% |
| Latin America | 586 | 8.0% |
| Morocco | 18 | 0.3% |
| Northern Africa | 18 | 0.3% |
| Northern Europe | 200 | 2.7% |
| Philippines | 28 | 0.4% |
| Russia | 55 | 0.7% |
| South America | 420 | 5.8% |
| South Central Asia | 78 | 1.1% |
| South Eastern Asia | 28 | 0.4% |
| Southern Europe | 22 | 0.3% |
| Ukraine | 59 | 0.8% |
| Uzbekistan | 22 | 0.3% |
| Western Asia | 175 | 2.4% |
| Western Europe | 54 | 0.7% | View All 36 Rows |
Sex and Age in Cedarhurst
Sex and Age in Cedarhurst
The most populous age groups in Cedarhurst are 20 to 24 Years (566 | 14.7%) for men and 55 to 59 Years (431 | 12.5%) for women.
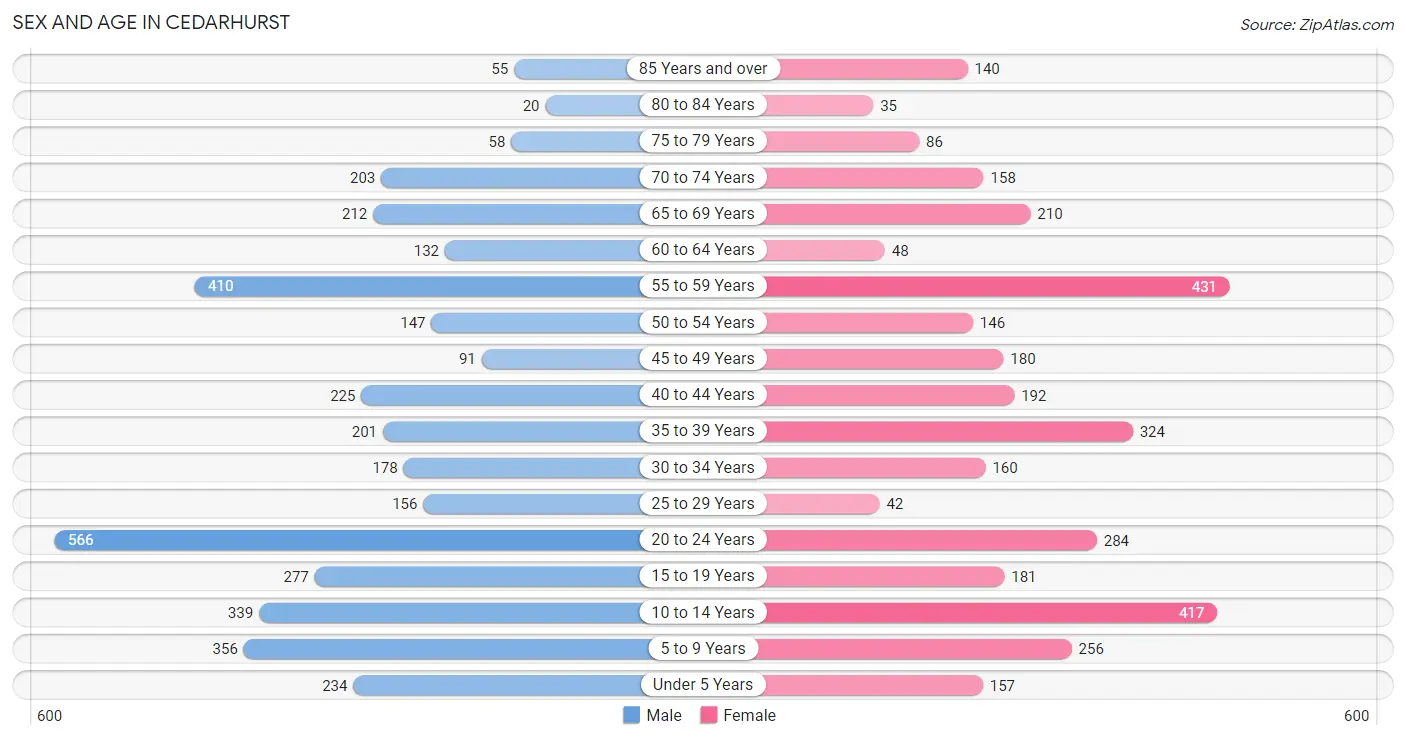
| Age Bracket | Male | Female |
| Under 5 Years | 234 (6.1%) | 157 (4.5%) |
| 5 to 9 Years | 356 (9.2%) | 256 (7.4%) |
| 10 to 14 Years | 339 (8.8%) | 417 (12.1%) |
| 15 to 19 Years | 277 (7.2%) | 181 (5.2%) |
| 20 to 24 Years | 566 (14.7%) | 284 (8.2%) |
| 25 to 29 Years | 156 (4.0%) | 42 (1.2%) |
| 30 to 34 Years | 178 (4.6%) | 160 (4.6%) |
| 35 to 39 Years | 201 (5.2%) | 324 (9.4%) |
| 40 to 44 Years | 225 (5.8%) | 192 (5.6%) |
| 45 to 49 Years | 91 (2.4%) | 180 (5.2%) |
| 50 to 54 Years | 147 (3.8%) | 146 (4.2%) |
| 55 to 59 Years | 410 (10.6%) | 431 (12.5%) |
| 60 to 64 Years | 132 (3.4%) | 48 (1.4%) |
| 65 to 69 Years | 212 (5.5%) | 210 (6.1%) |
| 70 to 74 Years | 203 (5.3%) | 158 (4.6%) |
| 75 to 79 Years | 58 (1.5%) | 86 (2.5%) |
| 80 to 84 Years | 20 (0.5%) | 35 (1.0%) |
| 85 Years and over | 55 (1.4%) | 140 (4.1%) |
| Total | 3,860 (100.0%) | 3,447 (100.0%) |
Families and Households in Cedarhurst
Median Family Size in Cedarhurst
The median family size in Cedarhurst is 3.87 persons per family, with married-couple families (1,500 | 91.9%) accounting for the largest median family size of 4 persons per family. On the other hand, single female/mother families (59 | 3.6%) represent the smallest median family size with 2.31 persons per family.
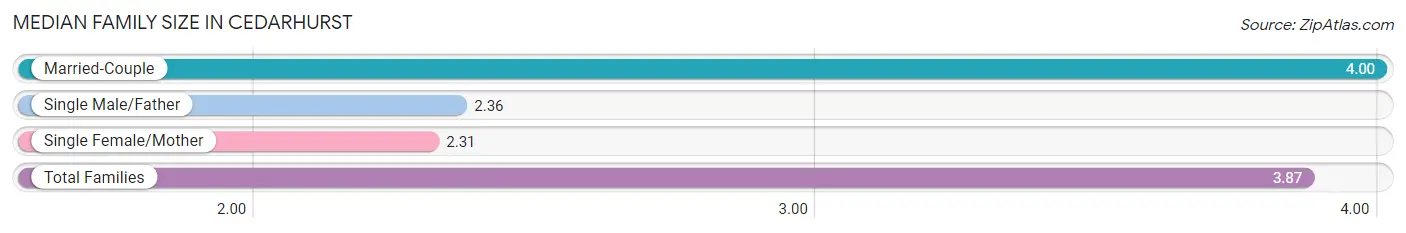
| Family Type | # Families | Family Size |
| Married-Couple | 1,500 (91.9%) | 4.00 |
| Single Male/Father | 74 (4.5%) | 2.36 |
| Single Female/Mother | 59 (3.6%) | 2.31 |
| Total Families | 1,633 (100.0%) | 3.87 |
Median Household Size in Cedarhurst
The median household size in Cedarhurst is 2.93 persons per household, with married-couple households (1,500 | 60.3%) accounting for the largest median household size of 4.04 persons per household. non-family households (856 | 34.4%) represent the smallest median household size with 1.08 persons per household.
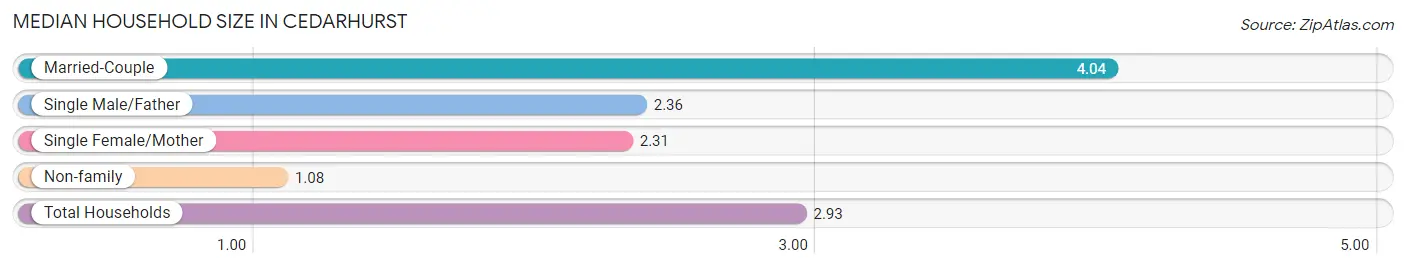
| Household Type | # Households | Household Size |
| Married-Couple | 1,500 (60.3%) | 4.04 |
| Single Male/Father | 74 (3.0%) | 2.36 |
| Single Female/Mother | 59 (2.4%) | 2.31 |
| Non-family | 856 (34.4%) | 1.08 |
| Total Households | 2,489 (100.0%) | 2.93 |
Household Size by Marriage Status in Cedarhurst
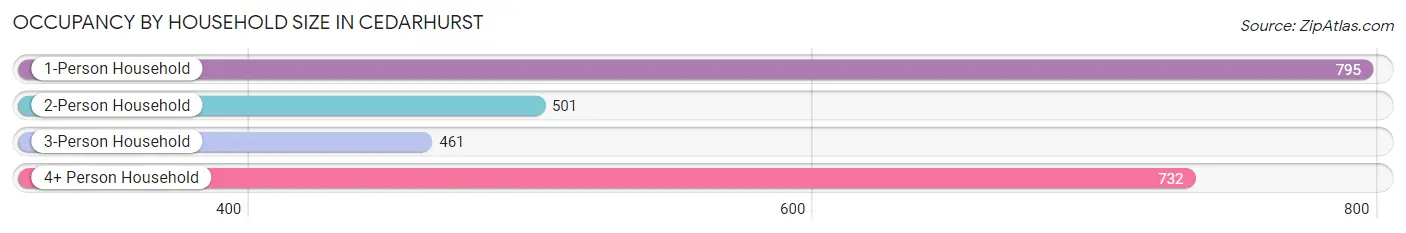
Out of a total of 2,489 households in Cedarhurst, 1,633 (65.6%) are family households, while 856 (34.4%) are nonfamily households. The most numerous type of family households are 3-person households, comprising 461, and the most common type of nonfamily households are 1-person households, comprising 795.
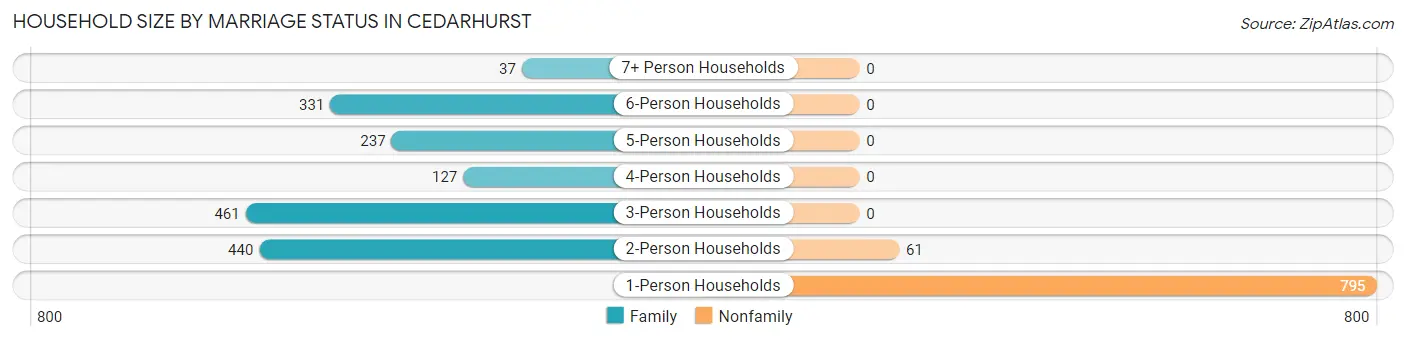
| Household Size | Family Households | Nonfamily Households |
| 1-Person Households | - | 795 (31.9%) |
| 2-Person Households | 440 (17.7%) | 61 (2.5%) |
| 3-Person Households | 461 (18.5%) | 0 (0.0%) |
| 4-Person Households | 127 (5.1%) | 0 (0.0%) |
| 5-Person Households | 237 (9.5%) | 0 (0.0%) |
| 6-Person Households | 331 (13.3%) | 0 (0.0%) |
| 7+ Person Households | 37 (1.5%) | 0 (0.0%) |
| Total | 1,633 (65.6%) | 856 (34.4%) |
Female Fertility in Cedarhurst
Fertility by Age in Cedarhurst
Average fertility rate in Cedarhurst is 63.0 births per 1,000 women. Women in the age bracket of 20 to 34 years have the highest fertility rate with 140.0 births per 1,000 women. Women in the age bracket of 20 to 34 years acount for 74.7% of all women with births.
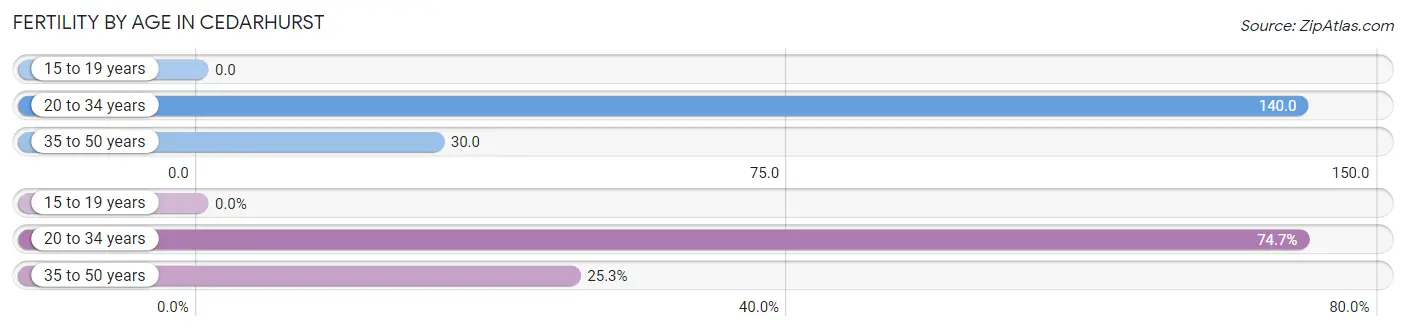
| Age Bracket | Women with Births | Births / 1,000 Women |
| 15 to 19 years | 0 (0.0%) | 0.0 |
| 20 to 34 years | 68 (74.7%) | 140.0 |
| 35 to 50 years | 23 (25.3%) | 30.0 |
| Total | 91 (100.0%) | 63.0 |
Fertility by Age by Marriage Status in Cedarhurst
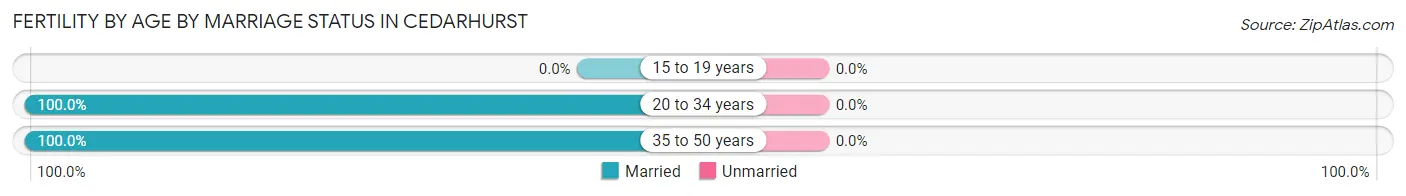
| Age Bracket | Married | Unmarried |
| 15 to 19 years | 0 (0.0%) | 0 (0.0%) |
| 20 to 34 years | 68 (100.0%) | 0 (0.0%) |
| 35 to 50 years | 23 (100.0%) | 0 (0.0%) |
| Total | 91 (100.0%) | 0 (0.0%) |
Fertility by Education in Cedarhurst
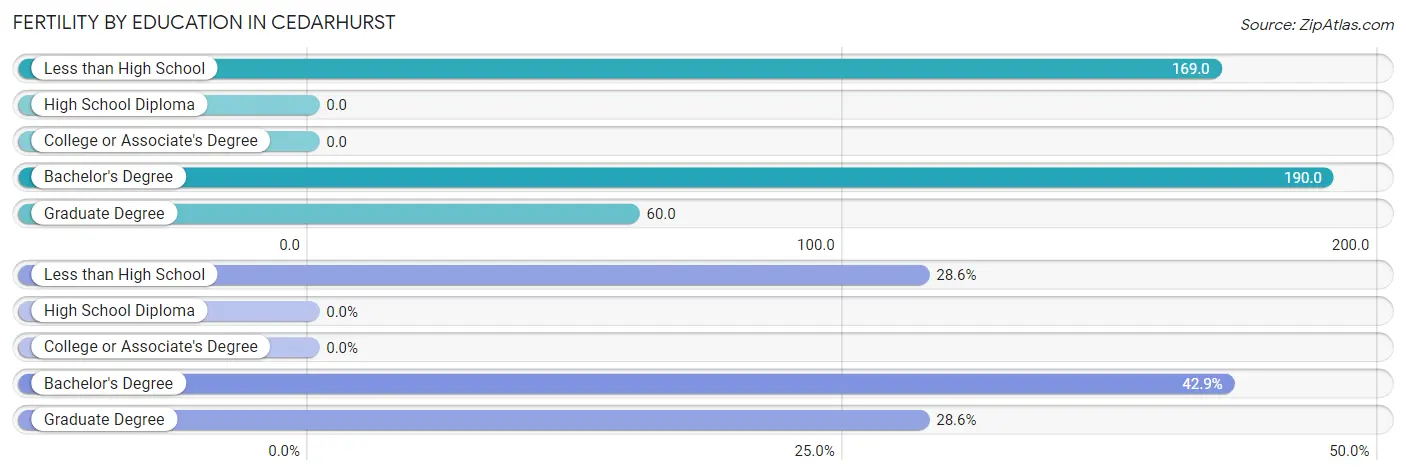
| Educational Attainment | Women with Births | Births / 1,000 Women |
| Less than High School | 26 (28.6%) | 169.0 |
| High School Diploma | 0 (0.0%) | 0.0 |
| College or Associate's Degree | 0 (0.0%) | 0.0 |
| Bachelor's Degree | 39 (42.9%) | 190.0 |
| Graduate Degree | 26 (28.6%) | 60.0 |
| Total | 91 (100.0%) | 63.0 |
Fertility by Education by Marriage Status in Cedarhurst
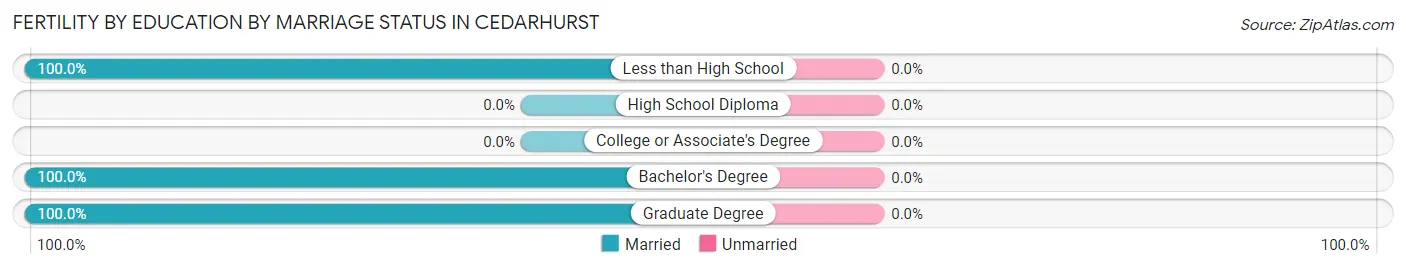
| Educational Attainment | Married | Unmarried |
| Less than High School | 26 (100.0%) | 0 (0.0%) |
| High School Diploma | 0 (0.0%) | 0 (0.0%) |
| College or Associate's Degree | 0 (0.0%) | 0 (0.0%) |
| Bachelor's Degree | 39 (100.0%) | 0 (0.0%) |
| Graduate Degree | 26 (100.0%) | 0 (0.0%) |
| Total | 91 (100.0%) | 0 (0.0%) |
Employment Characteristics in Cedarhurst
Employment by Class of Employer in Cedarhurst
Among the 3,120 employed individuals in Cedarhurst, private company employees (2,114 | 67.8%), not-for-profit organizations (342 | 11.0%), and self-employed (incorporated) (280 | 9.0%) make up the most common classes of employment.
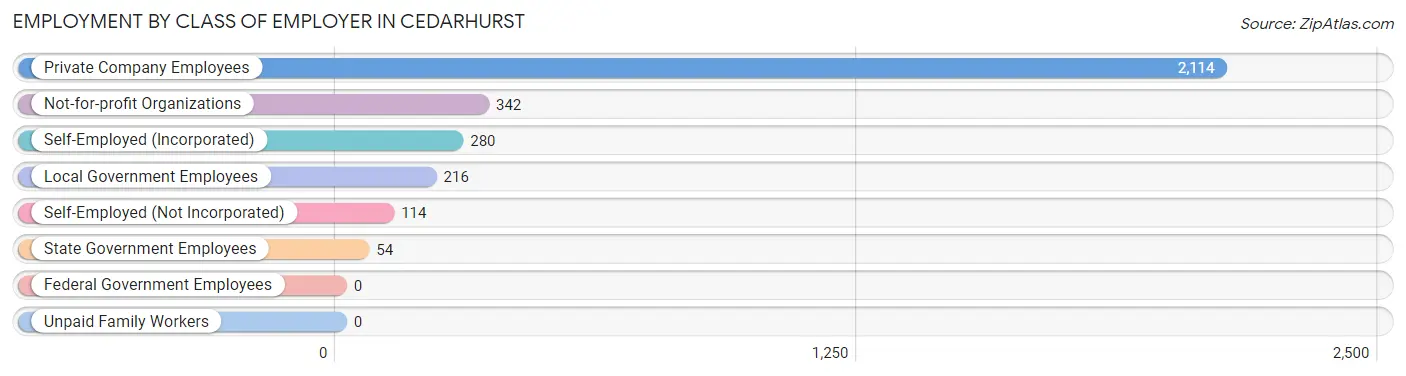
| Employer Class | # Employees | % Employees |
| Private Company Employees | 2,114 | 67.8% |
| Self-Employed (Incorporated) | 280 | 9.0% |
| Self-Employed (Not Incorporated) | 114 | 3.6% |
| Not-for-profit Organizations | 342 | 11.0% |
| Local Government Employees | 216 | 6.9% |
| State Government Employees | 54 | 1.7% |
| Federal Government Employees | 0 | 0.0% |
| Unpaid Family Workers | 0 | 0.0% |
| Total | 3,120 | 100.0% |
Employment Status by Age in Cedarhurst
According to the labor force statistics for Cedarhurst, out of the total population over 16 years of age (5,339), 63.7% or 3,401 individuals are in the labor force, with 7.1% or 241 of them unemployed. The age group with the highest labor force participation rate is 25 to 29 years, with 100.0% or 198 individuals in the labor force. Within the labor force, the 16 to 19 years age range has the highest percentage of unemployed individuals, with 100.0% or 20 of them being unemployed.
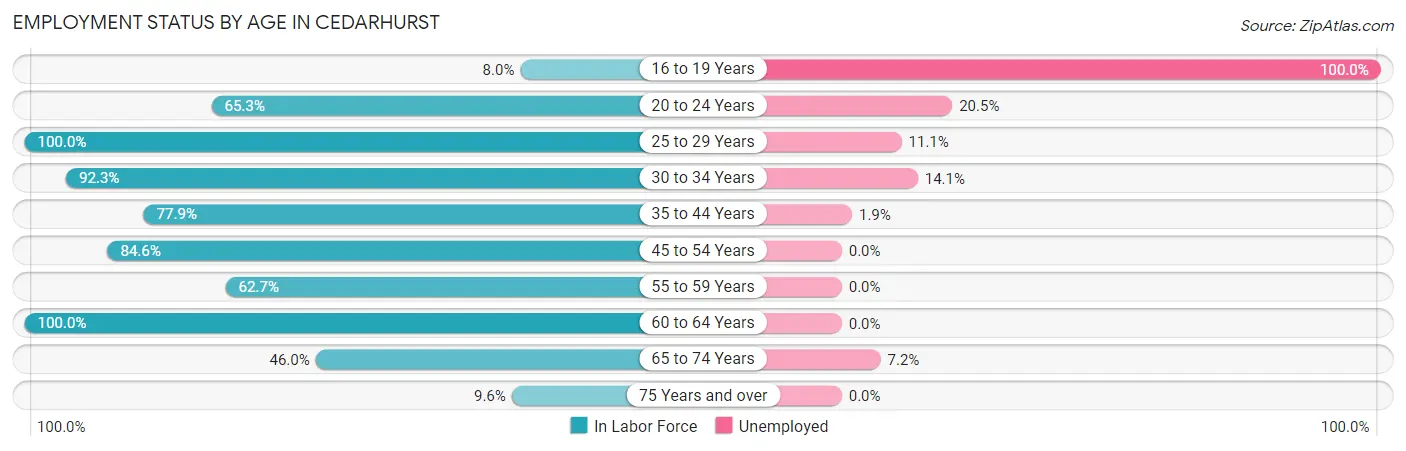
| Age Bracket | In Labor Force | Unemployed |
| 16 to 19 Years | 20 (8.0%) | 20 (100.0%) |
| 20 to 24 Years | 555 (65.3%) | 114 (20.5%) |
| 25 to 29 Years | 198 (100.0%) | 22 (11.1%) |
| 30 to 34 Years | 312 (92.3%) | 44 (14.1%) |
| 35 to 44 Years | 734 (77.9%) | 14 (1.9%) |
| 45 to 54 Years | 477 (84.6%) | 0 (0.0%) |
| 55 to 59 Years | 527 (62.7%) | 0 (0.0%) |
| 60 to 64 Years | 180 (100.0%) | 0 (0.0%) |
| 65 to 74 Years | 360 (46.0%) | 26 (7.2%) |
| 75 Years and over | 38 (9.6%) | 0 (0.0%) |
| Total | 3,401 (63.7%) | 241 (7.1%) |
Employment Status by Educational Attainment in Cedarhurst
According to labor force statistics for Cedarhurst, 79.3% of individuals (2,429) out of the total population between 25 and 64 years of age (3,063) are in the labor force, with 3.3% or 80 of them being unemployed. The group with the highest labor force participation rate are those with the educational attainment of less than high school, with 94.8% or 73 individuals in the labor force. Within the labor force, individuals with college / associate degree education have the highest percentage of unemployment, with 6.5% or 37 of them being unemployed.
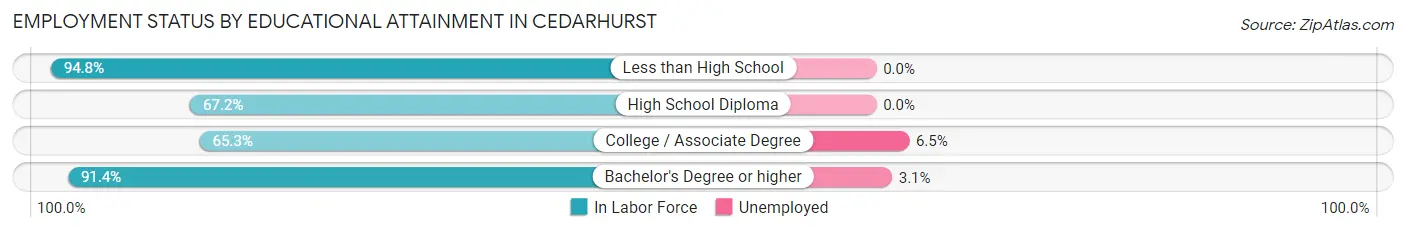
| Educational Attainment | In Labor Force | Unemployed |
| Less than High School | 73 (94.8%) | 0 (0.0%) |
| High School Diploma | 412 (67.2%) | 0 (0.0%) |
| College / Associate Degree | 566 (65.3%) | 56 (6.5%) |
| Bachelor's Degree or higher | 1,376 (91.4%) | 47 (3.1%) |
| Total | 2,429 (79.3%) | 101 (3.3%) |
Employment Occupations by Sex in Cedarhurst
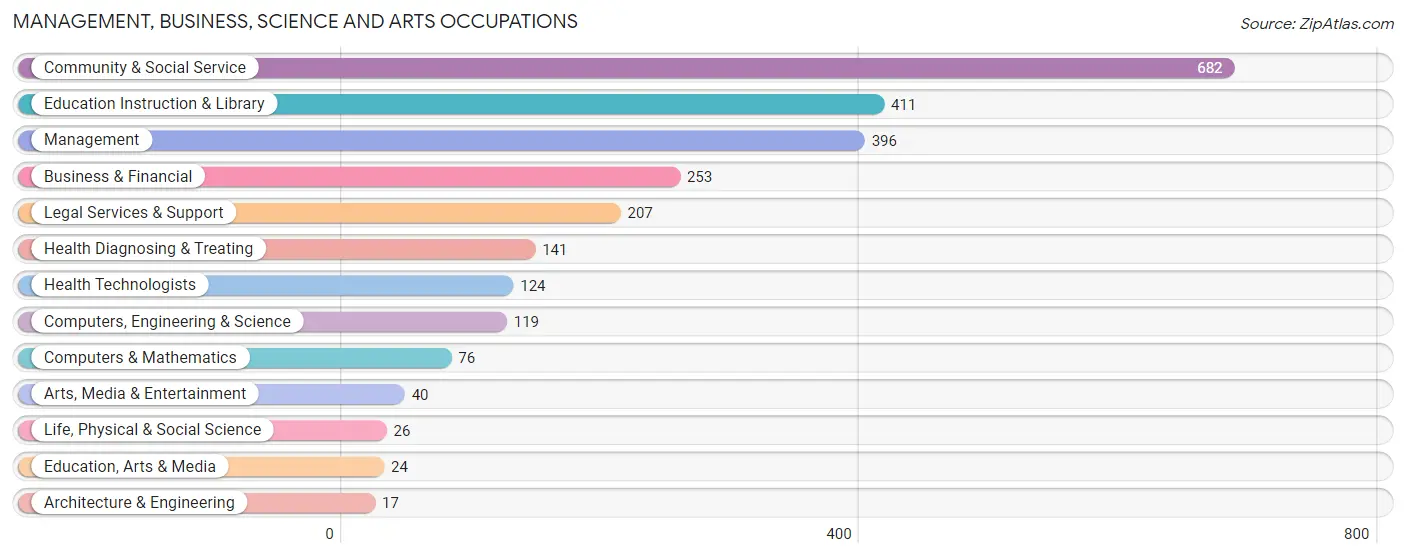
Management, Business, Science and Arts Occupations
The most common Management, Business, Science and Arts occupations in Cedarhurst are Community & Social Service (682 | 21.6%), Education Instruction & Library (411 | 13.0%), Management (396 | 12.5%), Business & Financial (253 | 8.0%), and Legal Services & Support (207 | 6.6%).
Management, Business, Science and Arts Occupations by Sex
Within the Management, Business, Science and Arts occupations in Cedarhurst, the most male-oriented occupations are Computers, Engineering & Science (100.0%), Computers & Mathematics (100.0%), and Architecture & Engineering (100.0%), while the most female-oriented occupations are Education, Arts & Media (100.0%), Arts, Media & Entertainment (100.0%), and Education Instruction & Library (81.5%).
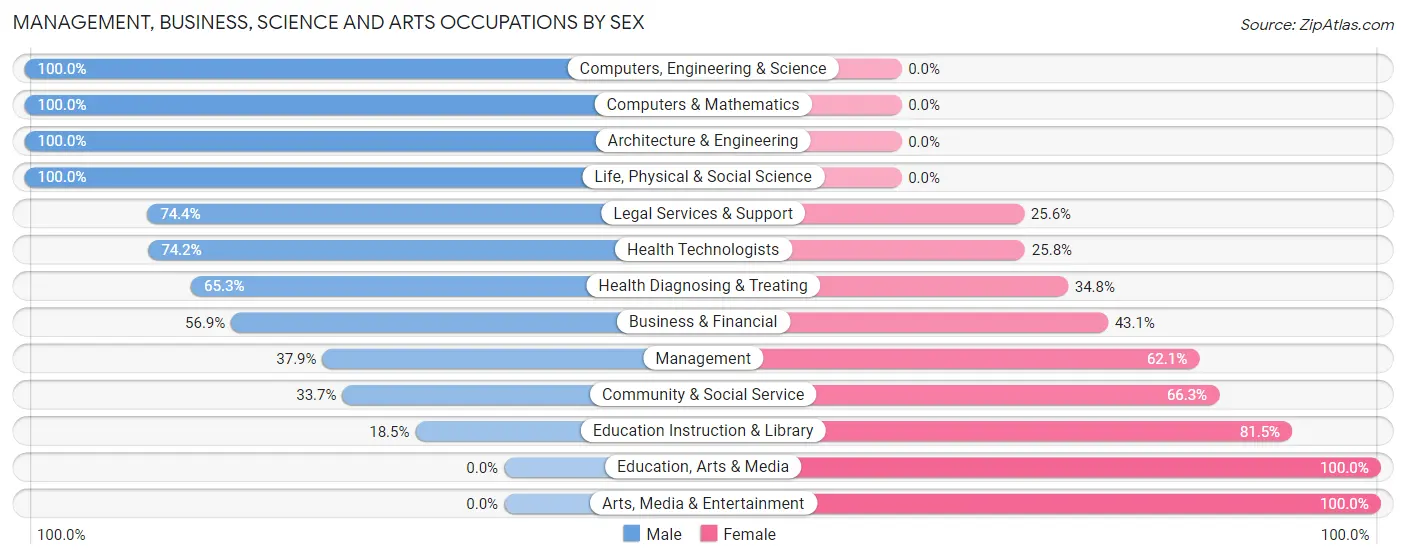
| Occupation | Male | Female |
| Management | 150 (37.9%) | 246 (62.1%) |
| Business & Financial | 144 (56.9%) | 109 (43.1%) |
| Computers, Engineering & Science | 119 (100.0%) | 0 (0.0%) |
| Computers & Mathematics | 76 (100.0%) | 0 (0.0%) |
| Architecture & Engineering | 17 (100.0%) | 0 (0.0%) |
| Life, Physical & Social Science | 26 (100.0%) | 0 (0.0%) |
| Community & Social Service | 230 (33.7%) | 452 (66.3%) |
| Education, Arts & Media | 0 (0.0%) | 24 (100.0%) |
| Legal Services & Support | 154 (74.4%) | 53 (25.6%) |
| Education Instruction & Library | 76 (18.5%) | 335 (81.5%) |
| Arts, Media & Entertainment | 0 (0.0%) | 40 (100.0%) |
| Health Diagnosing & Treating | 92 (65.2%) | 49 (34.7%) |
| Health Technologists | 92 (74.2%) | 32 (25.8%) |
| Total (Category) | 735 (46.2%) | 856 (53.8%) |
| Total (Overall) | 1,643 (52.0%) | 1,518 (48.0%) |
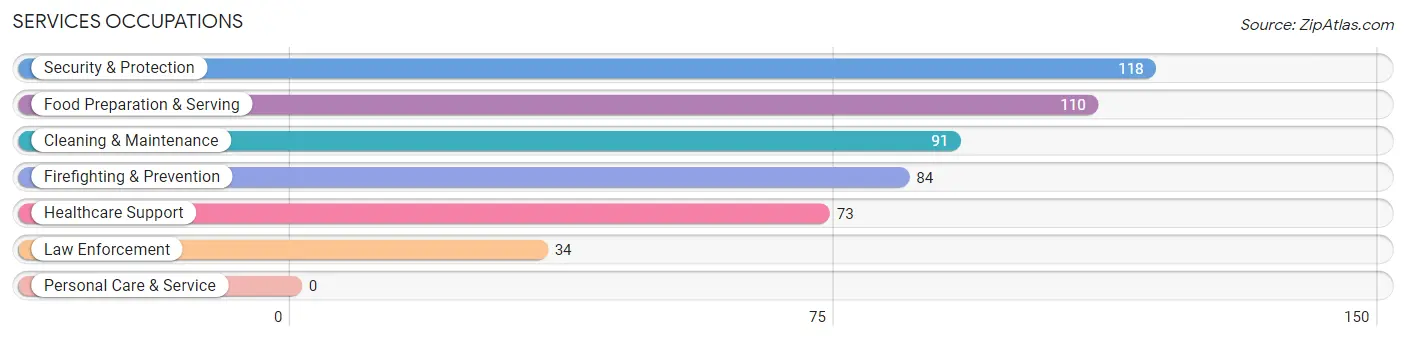
Services Occupations
The most common Services occupations in Cedarhurst are Security & Protection (118 | 3.7%), Food Preparation & Serving (110 | 3.5%), Cleaning & Maintenance (91 | 2.9%), Firefighting & Prevention (84 | 2.7%), and Healthcare Support (73 | 2.3%).
Services Occupations by Sex
Within the Services occupations in Cedarhurst, the most male-oriented occupations are Law Enforcement (100.0%), Food Preparation & Serving (100.0%), and Cleaning & Maintenance (100.0%), while the most female-oriented occupations are Healthcare Support (100.0%), Firefighting & Prevention (72.6%), and Security & Protection (51.7%).
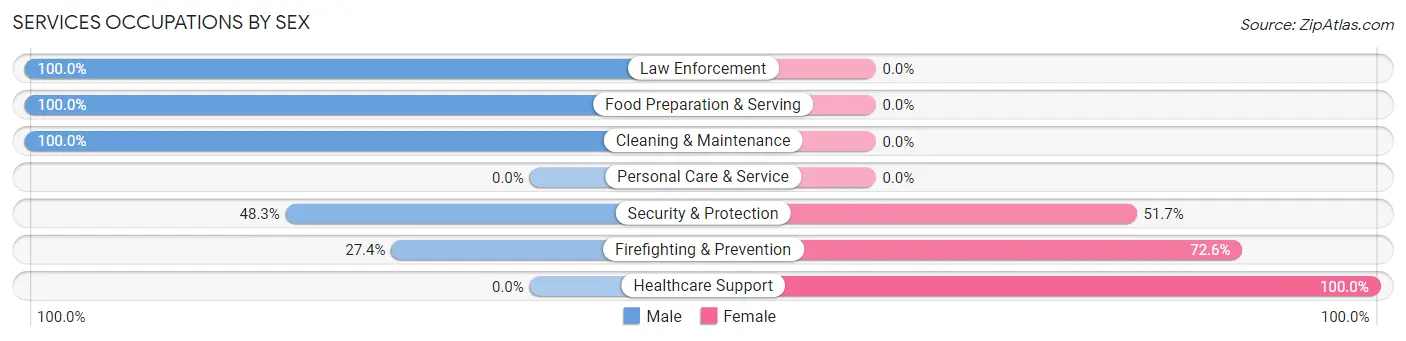
| Occupation | Male | Female |
| Healthcare Support | 0 (0.0%) | 73 (100.0%) |
| Security & Protection | 57 (48.3%) | 61 (51.7%) |
| Firefighting & Prevention | 23 (27.4%) | 61 (72.6%) |
| Law Enforcement | 34 (100.0%) | 0 (0.0%) |
| Food Preparation & Serving | 110 (100.0%) | 0 (0.0%) |
| Cleaning & Maintenance | 91 (100.0%) | 0 (0.0%) |
| Personal Care & Service | 0 (0.0%) | 0 (0.0%) |
| Total (Category) | 258 (65.8%) | 134 (34.2%) |
| Total (Overall) | 1,643 (52.0%) | 1,518 (48.0%) |
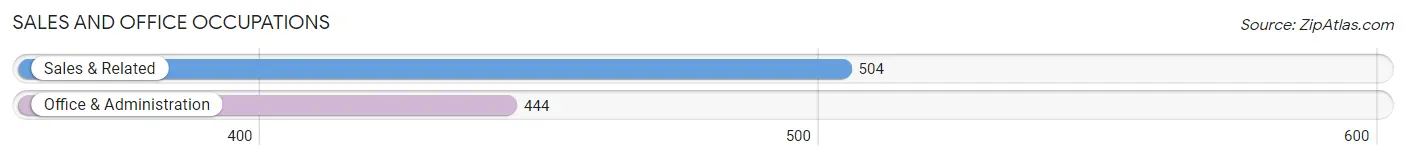
Sales and Office Occupations
The most common Sales and Office occupations in Cedarhurst are Sales & Related (504 | 15.9%), and Office & Administration (444 | 14.1%).
Sales and Office Occupations by Sex
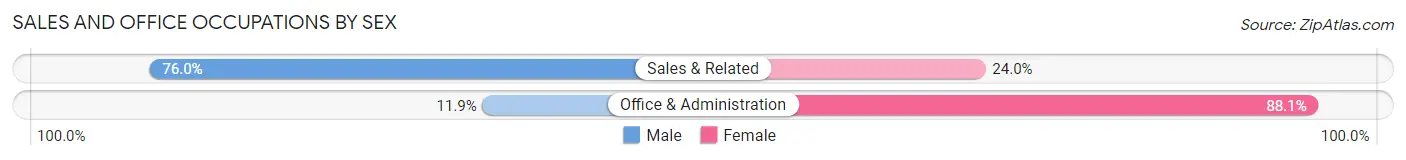
| Occupation | Male | Female |
| Sales & Related | 383 (76.0%) | 121 (24.0%) |
| Office & Administration | 53 (11.9%) | 391 (88.1%) |
| Total (Category) | 436 (46.0%) | 512 (54.0%) |
| Total (Overall) | 1,643 (52.0%) | 1,518 (48.0%) |
Natural Resources, Construction and Maintenance Occupations
The most common Natural Resources, Construction and Maintenance occupations in Cedarhurst are Installation, Maintenance & Repair (84 | 2.7%), and Construction & Extraction (48 | 1.5%).
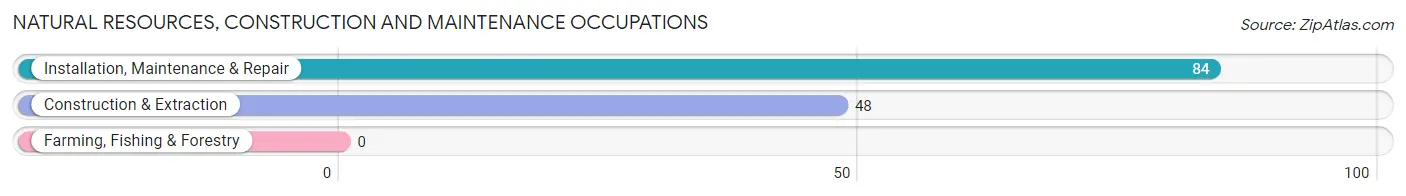
Natural Resources, Construction and Maintenance Occupations by Sex
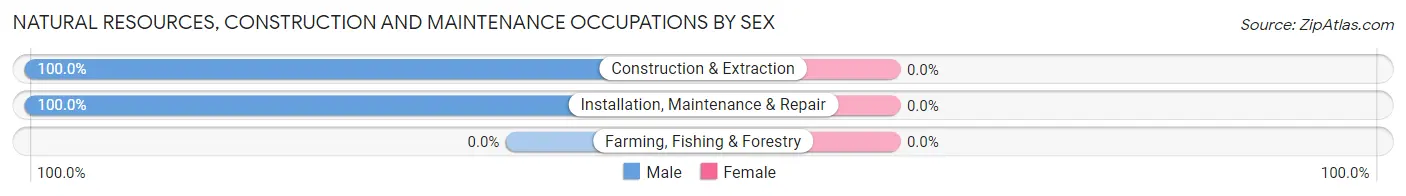
| Occupation | Male | Female |
| Farming, Fishing & Forestry | 0 (0.0%) | 0 (0.0%) |
| Construction & Extraction | 48 (100.0%) | 0 (0.0%) |
| Installation, Maintenance & Repair | 84 (100.0%) | 0 (0.0%) |
| Total (Category) | 132 (100.0%) | 0 (0.0%) |
| Total (Overall) | 1,643 (52.0%) | 1,518 (48.0%) |
Production, Transportation and Moving Occupations
The most common Production, Transportation and Moving occupations in Cedarhurst are Production (65 | 2.1%), and Transportation (33 | 1.0%).
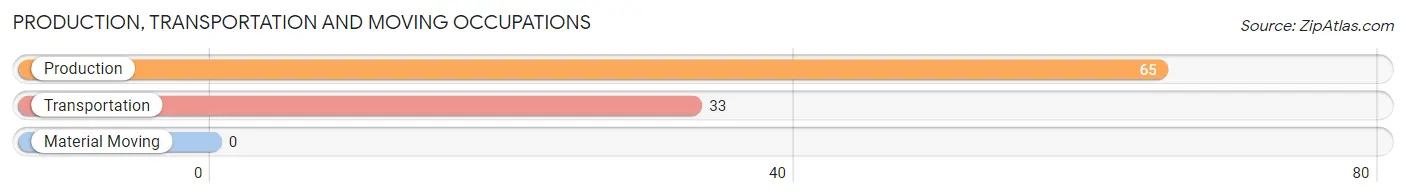
Production, Transportation and Moving Occupations by Sex
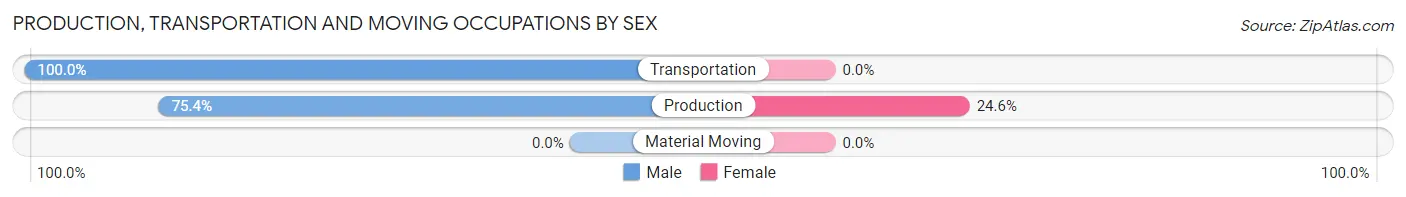
| Occupation | Male | Female |
| Production | 49 (75.4%) | 16 (24.6%) |
| Transportation | 33 (100.0%) | 0 (0.0%) |
| Material Moving | 0 (0.0%) | 0 (0.0%) |
| Total (Category) | 82 (83.7%) | 16 (16.3%) |
| Total (Overall) | 1,643 (52.0%) | 1,518 (48.0%) |
Employment Industries by Sex in Cedarhurst
Employment Industries in Cedarhurst
The major employment industries in Cedarhurst include Educational Services (618 | 19.6%), Health Care & Social Assistance (510 | 16.1%), Professional & Scientific (366 | 11.6%), Retail Trade (204 | 6.5%), and Administrative & Support (202 | 6.4%).
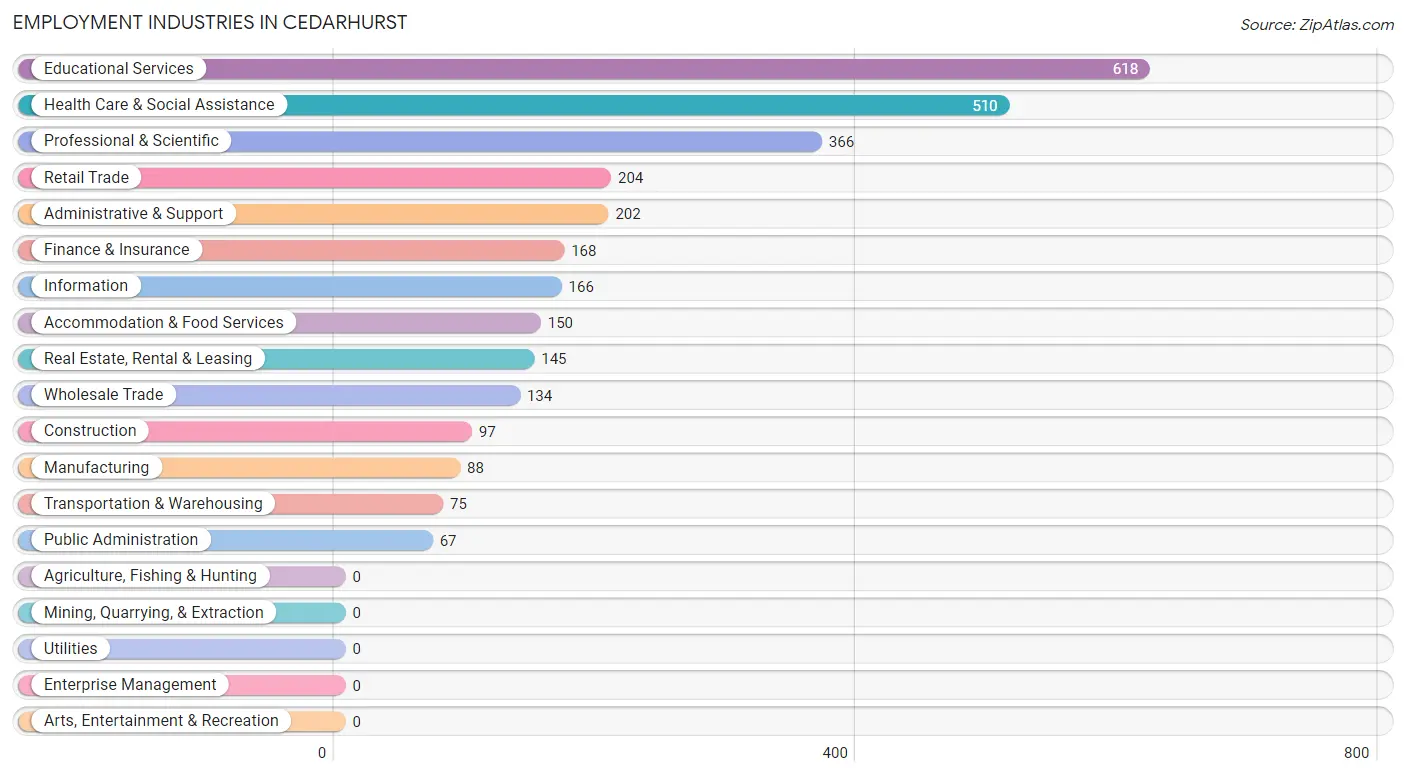
Employment Industries by Sex in Cedarhurst
The Cedarhurst industries that see more men than women are Finance & Insurance (90.5%), Information (87.4%), and Wholesale Trade (87.3%), whereas the industries that tend to have a higher number of women are Educational Services (75.7%), Health Care & Social Assistance (65.1%), and Professional & Scientific (57.7%).
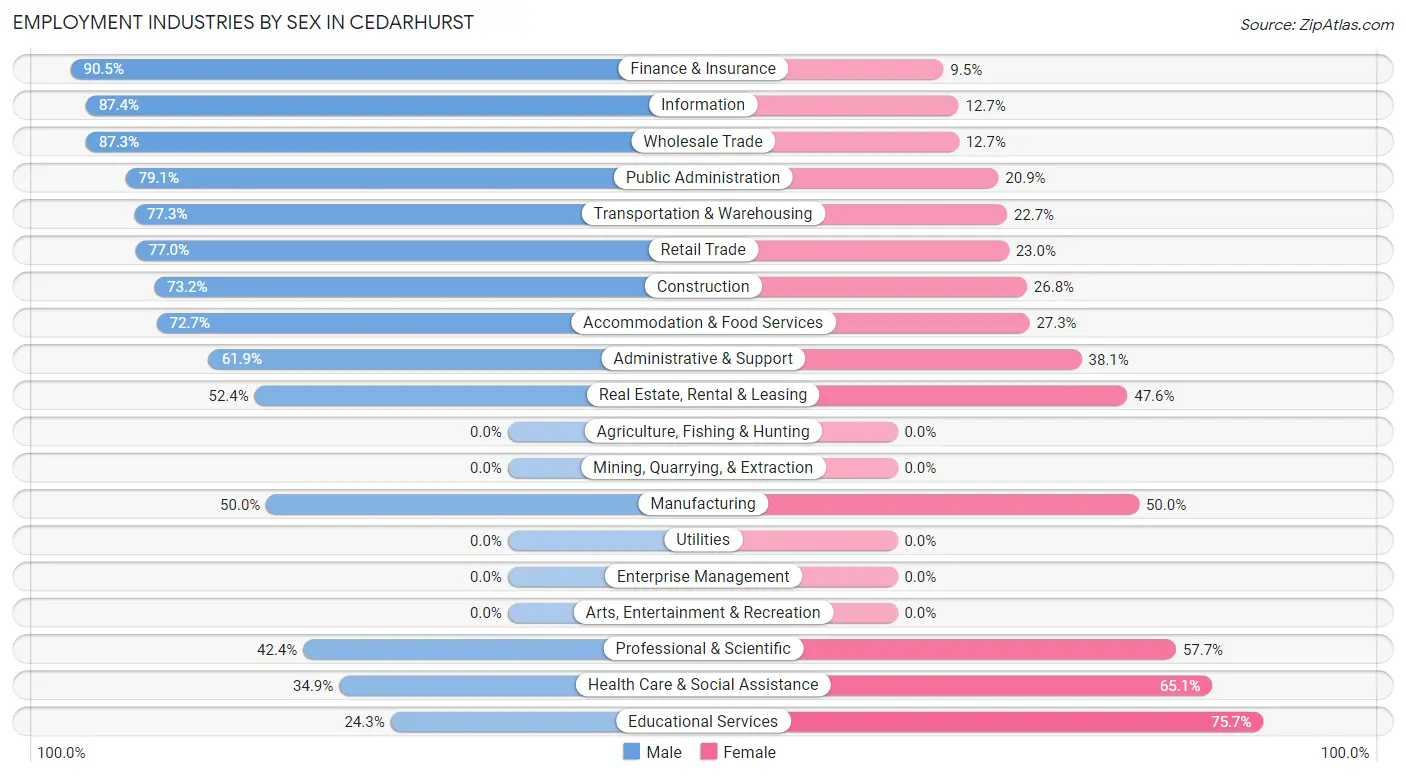
| Industry | Male | Female |
| Agriculture, Fishing & Hunting | 0 (0.0%) | 0 (0.0%) |
| Mining, Quarrying, & Extraction | 0 (0.0%) | 0 (0.0%) |
| Construction | 71 (73.2%) | 26 (26.8%) |
| Manufacturing | 44 (50.0%) | 44 (50.0%) |
| Wholesale Trade | 117 (87.3%) | 17 (12.7%) |
| Retail Trade | 157 (77.0%) | 47 (23.0%) |
| Transportation & Warehousing | 58 (77.3%) | 17 (22.7%) |
| Utilities | 0 (0.0%) | 0 (0.0%) |
| Information | 145 (87.4%) | 21 (12.7%) |
| Finance & Insurance | 152 (90.5%) | 16 (9.5%) |
| Real Estate, Rental & Leasing | 76 (52.4%) | 69 (47.6%) |
| Professional & Scientific | 155 (42.3%) | 211 (57.7%) |
| Enterprise Management | 0 (0.0%) | 0 (0.0%) |
| Administrative & Support | 125 (61.9%) | 77 (38.1%) |
| Educational Services | 150 (24.3%) | 468 (75.7%) |
| Health Care & Social Assistance | 178 (34.9%) | 332 (65.1%) |
| Arts, Entertainment & Recreation | 0 (0.0%) | 0 (0.0%) |
| Accommodation & Food Services | 109 (72.7%) | 41 (27.3%) |
| Public Administration | 53 (79.1%) | 14 (20.9%) |
| Total | 1,643 (52.0%) | 1,518 (48.0%) |
Education in Cedarhurst
School Enrollment in Cedarhurst
The most common levels of schooling among the 2,490 students in Cedarhurst are middle school (627 | 25.2%), college / undergraduate (547 | 22.0%), and high school (500 | 20.1%).
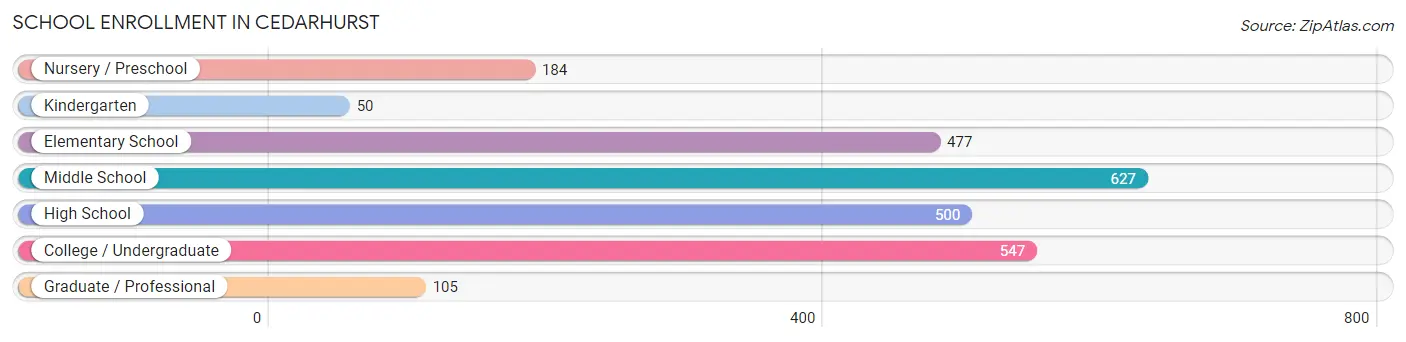
| School Level | # Students | % Students |
| Nursery / Preschool | 184 | 7.4% |
| Kindergarten | 50 | 2.0% |
| Elementary School | 477 | 19.2% |
| Middle School | 627 | 25.2% |
| High School | 500 | 20.1% |
| College / Undergraduate | 547 | 22.0% |
| Graduate / Professional | 105 | 4.2% |
| Total | 2,490 | 100.0% |
School Enrollment by Age by Funding Source in Cedarhurst
Out of a total of 2,490 students who are enrolled in schools in Cedarhurst, 1,788 (71.8%) attend a private institution, while the remaining 702 (28.2%) are enrolled in public schools. The age group of 25 to 34 year olds has the highest likelihood of being enrolled in private schools, with 74 (100.0% in the age bracket) enrolled. Conversely, the age group of 20 to 24 year olds has the lowest likelihood of being enrolled in a private school, with 342 (71.7% in the age bracket) attending a public institution.
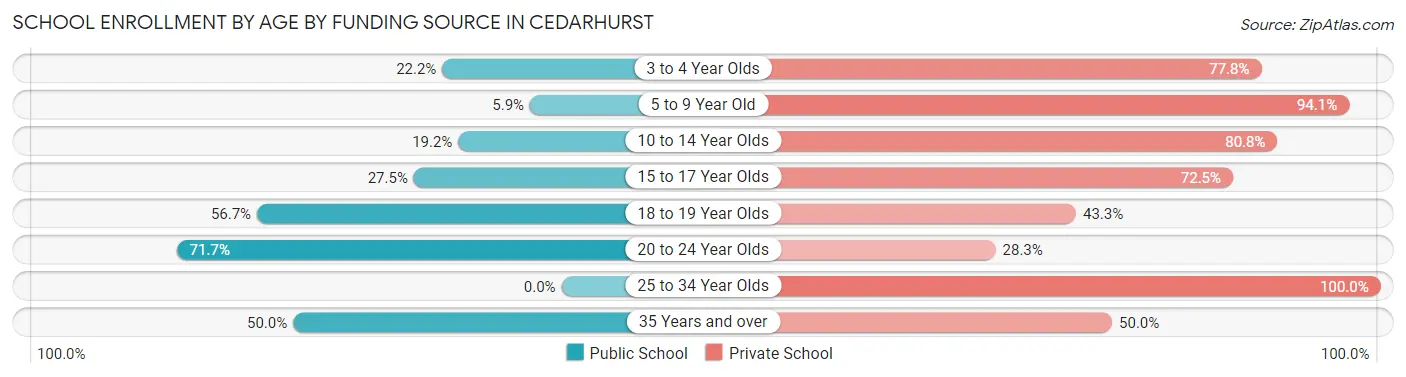
| Age Bracket | Public School | Private School |
| 3 to 4 Year Olds | 28 (22.2%) | 98 (77.8%) |
| 5 to 9 Year Old | 36 (5.9%) | 576 (94.1%) |
| 10 to 14 Year Olds | 141 (19.2%) | 592 (80.8%) |
| 15 to 17 Year Olds | 101 (27.5%) | 266 (72.5%) |
| 18 to 19 Year Olds | 38 (56.7%) | 29 (43.3%) |
| 20 to 24 Year Olds | 342 (71.7%) | 135 (28.3%) |
| 25 to 34 Year Olds | 0 (0.0%) | 74 (100.0%) |
| 35 Years and over | 17 (50.0%) | 17 (50.0%) |
| Total | 702 (28.2%) | 1,788 (71.8%) |
Educational Attainment by Field of Study in Cedarhurst
Business (601 | 29.7%), social sciences (314 | 15.5%), liberal arts & history (231 | 11.4%), education (227 | 11.2%), and psychology (119 | 5.9%) are the most common fields of study among 2,024 individuals in Cedarhurst who have obtained a bachelor's degree or higher.
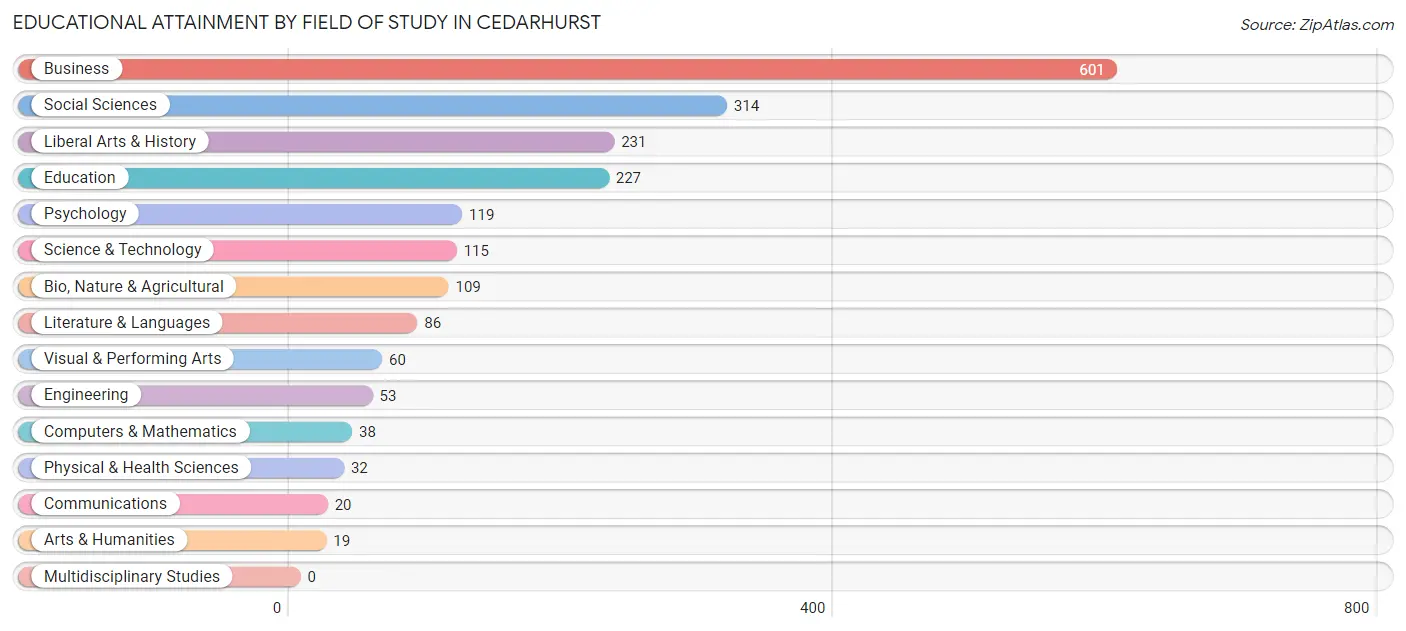
| Field of Study | # Graduates | % Graduates |
| Computers & Mathematics | 38 | 1.9% |
| Bio, Nature & Agricultural | 109 | 5.4% |
| Physical & Health Sciences | 32 | 1.6% |
| Psychology | 119 | 5.9% |
| Social Sciences | 314 | 15.5% |
| Engineering | 53 | 2.6% |
| Multidisciplinary Studies | 0 | 0.0% |
| Science & Technology | 115 | 5.7% |
| Business | 601 | 29.7% |
| Education | 227 | 11.2% |
| Literature & Languages | 86 | 4.3% |
| Liberal Arts & History | 231 | 11.4% |
| Visual & Performing Arts | 60 | 3.0% |
| Communications | 20 | 1.0% |
| Arts & Humanities | 19 | 0.9% |
| Total | 2,024 | 100.0% |
Transportation & Commute in Cedarhurst
Vehicle Availability by Sex in Cedarhurst
The most prevalent vehicle ownership categories in Cedarhurst are males with 2 vehicles (693, accounting for 42.2%) and females with 2 vehicles (631, making up 46.9%).
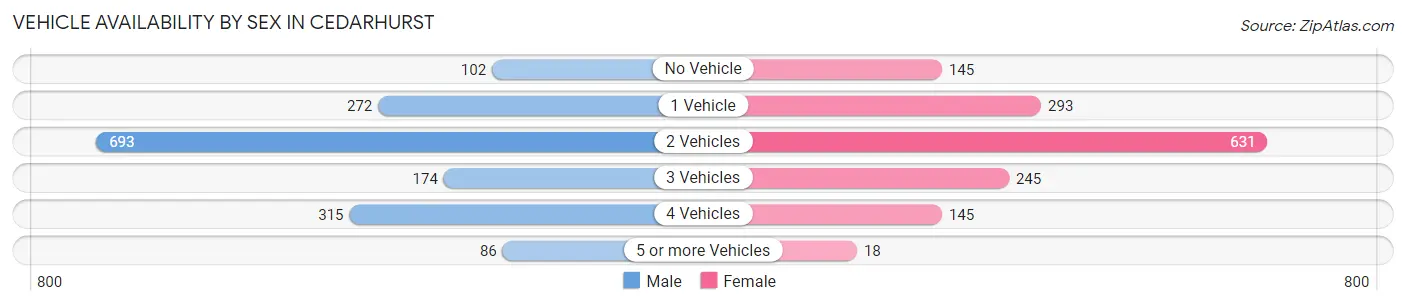
| Vehicles Available | Male | Female |
| No Vehicle | 102 (6.2%) | 145 (9.8%) |
| 1 Vehicle | 272 (16.6%) | 293 (19.8%) |
| 2 Vehicles | 693 (42.2%) | 631 (42.7%) |
| 3 Vehicles | 174 (10.6%) | 245 (16.6%) |
| 4 Vehicles | 315 (19.2%) | 145 (9.8%) |
| 5 or more Vehicles | 86 (5.2%) | 18 (1.2%) |
| Total | 1,642 (100.0%) | 1,477 (100.0%) |
Commute Time in Cedarhurst
The most frequently occuring commute durations in Cedarhurst are 60 to 89 minutes (503 commuters, 18.3%), 45 to 59 minutes (420 commuters, 15.3%), and 5 to 9 minutes (407 commuters, 14.8%).
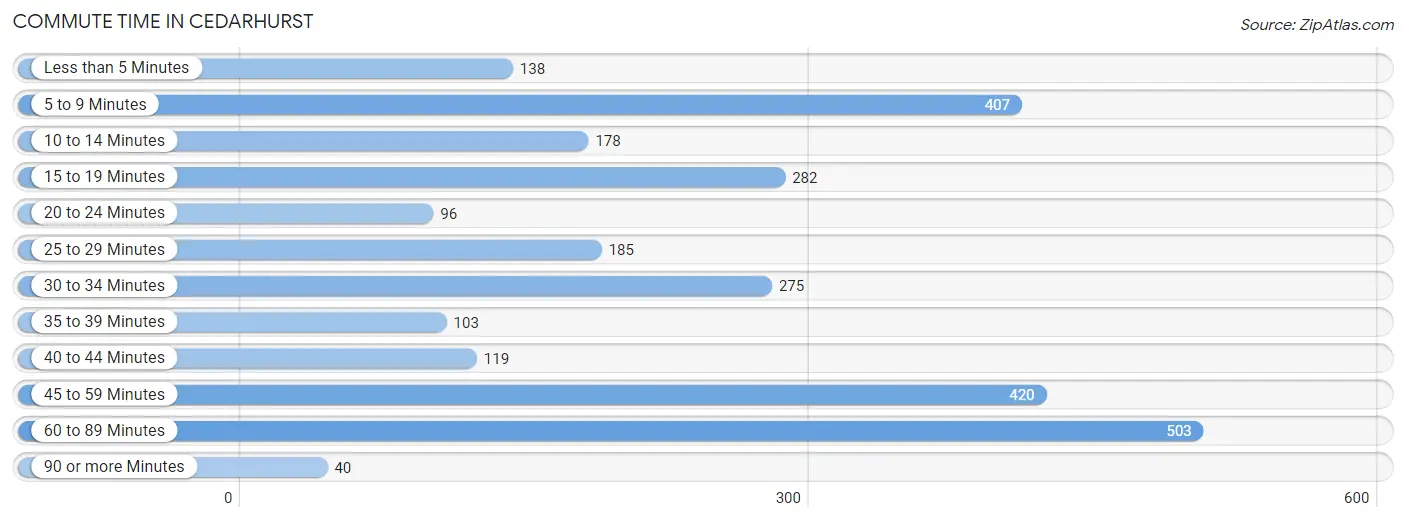
| Commute Time | # Commuters | % Commuters |
| Less than 5 Minutes | 138 | 5.0% |
| 5 to 9 Minutes | 407 | 14.8% |
| 10 to 14 Minutes | 178 | 6.5% |
| 15 to 19 Minutes | 282 | 10.3% |
| 20 to 24 Minutes | 96 | 3.5% |
| 25 to 29 Minutes | 185 | 6.7% |
| 30 to 34 Minutes | 275 | 10.0% |
| 35 to 39 Minutes | 103 | 3.7% |
| 40 to 44 Minutes | 119 | 4.3% |
| 45 to 59 Minutes | 420 | 15.3% |
| 60 to 89 Minutes | 503 | 18.3% |
| 90 or more Minutes | 40 | 1.5% |
Commute Time by Sex in Cedarhurst
The most common commute times in Cedarhurst are 60 to 89 minutes (364 commuters, 25.6%) for males and 15 to 19 minutes (282 commuters, 21.3%) for females.
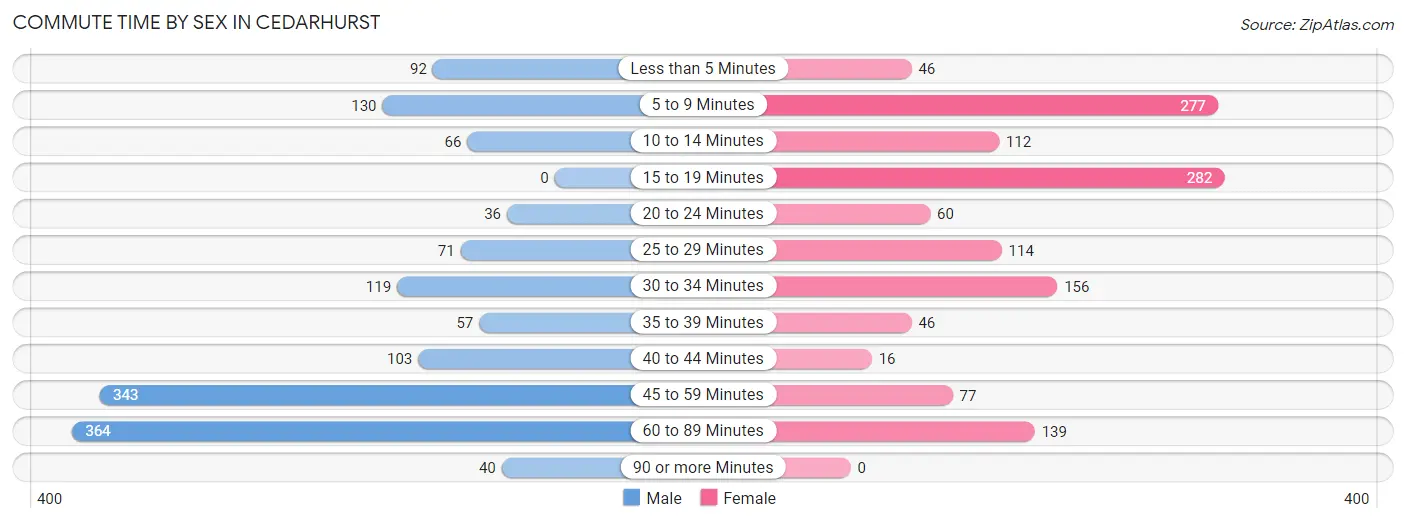
| Commute Time | Male | Female |
| Less than 5 Minutes | 92 (6.5%) | 46 (3.5%) |
| 5 to 9 Minutes | 130 (9.1%) | 277 (20.9%) |
| 10 to 14 Minutes | 66 (4.6%) | 112 (8.5%) |
| 15 to 19 Minutes | 0 (0.0%) | 282 (21.3%) |
| 20 to 24 Minutes | 36 (2.5%) | 60 (4.5%) |
| 25 to 29 Minutes | 71 (5.0%) | 114 (8.6%) |
| 30 to 34 Minutes | 119 (8.4%) | 156 (11.8%) |
| 35 to 39 Minutes | 57 (4.0%) | 46 (3.5%) |
| 40 to 44 Minutes | 103 (7.2%) | 16 (1.2%) |
| 45 to 59 Minutes | 343 (24.1%) | 77 (5.8%) |
| 60 to 89 Minutes | 364 (25.6%) | 139 (10.5%) |
| 90 or more Minutes | 40 (2.8%) | 0 (0.0%) |
Time of Departure to Work by Sex in Cedarhurst
The most frequent times of departure to work in Cedarhurst are 9:00 AM to 9:59 AM (280, 19.7%) for males and 9:00 AM to 9:59 AM (357, 26.9%) for females.
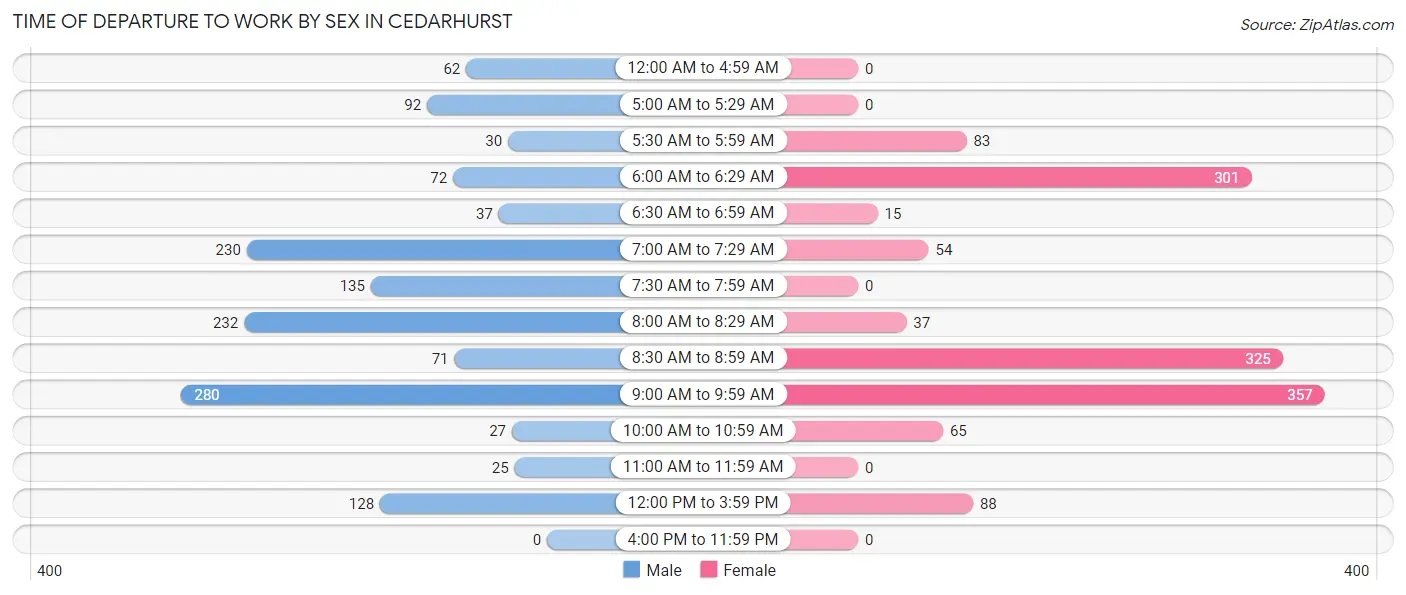
| Time of Departure | Male | Female |
| 12:00 AM to 4:59 AM | 62 (4.4%) | 0 (0.0%) |
| 5:00 AM to 5:29 AM | 92 (6.5%) | 0 (0.0%) |
| 5:30 AM to 5:59 AM | 30 (2.1%) | 83 (6.3%) |
| 6:00 AM to 6:29 AM | 72 (5.1%) | 301 (22.7%) |
| 6:30 AM to 6:59 AM | 37 (2.6%) | 15 (1.1%) |
| 7:00 AM to 7:29 AM | 230 (16.2%) | 54 (4.1%) |
| 7:30 AM to 7:59 AM | 135 (9.5%) | 0 (0.0%) |
| 8:00 AM to 8:29 AM | 232 (16.3%) | 37 (2.8%) |
| 8:30 AM to 8:59 AM | 71 (5.0%) | 325 (24.5%) |
| 9:00 AM to 9:59 AM | 280 (19.7%) | 357 (26.9%) |
| 10:00 AM to 10:59 AM | 27 (1.9%) | 65 (4.9%) |
| 11:00 AM to 11:59 AM | 25 (1.8%) | 0 (0.0%) |
| 12:00 PM to 3:59 PM | 128 (9.0%) | 88 (6.6%) |
| 4:00 PM to 11:59 PM | 0 (0.0%) | 0 (0.0%) |
| Total | 1,421 (100.0%) | 1,325 (100.0%) |
Housing Occupancy in Cedarhurst
Occupancy by Ownership in Cedarhurst
Of the total 2,489 dwellings in Cedarhurst, owner-occupied units account for 1,668 (67.0%), while renter-occupied units make up 821 (33.0%).
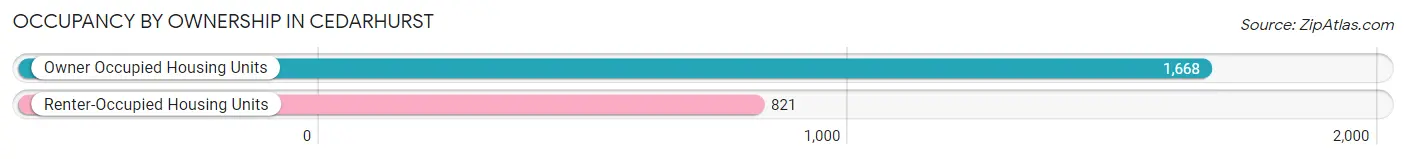
| Occupancy | # Housing Units | % Housing Units |
| Owner Occupied Housing Units | 1,668 | 67.0% |
| Renter-Occupied Housing Units | 821 | 33.0% |
| Total Occupied Housing Units | 2,489 | 100.0% |
Occupancy by Household Size in Cedarhurst
| Household Size | # Housing Units | % Housing Units |
| 1-Person Household | 795 | 31.9% |
| 2-Person Household | 501 | 20.1% |
| 3-Person Household | 461 | 18.5% |
| 4+ Person Household | 732 | 29.4% |
| Total Housing Units | 2,489 | 100.0% |
Occupancy by Ownership by Household Size in Cedarhurst
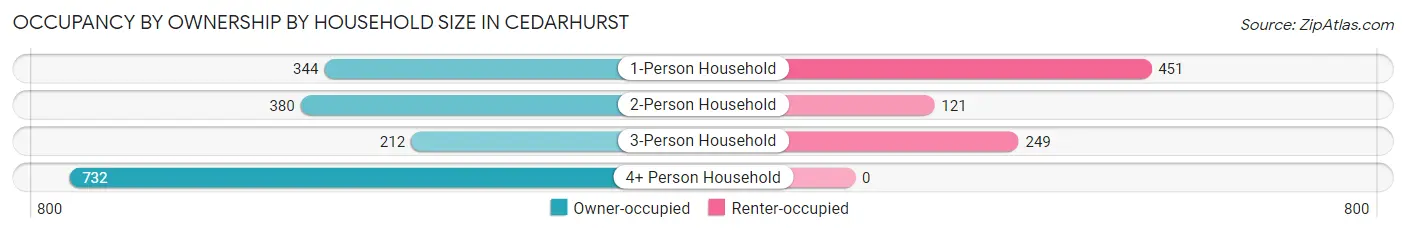
| Household Size | Owner-occupied | Renter-occupied |
| 1-Person Household | 344 (43.3%) | 451 (56.7%) |
| 2-Person Household | 380 (75.8%) | 121 (24.1%) |
| 3-Person Household | 212 (46.0%) | 249 (54.0%) |
| 4+ Person Household | 732 (100.0%) | 0 (0.0%) |
| Total Housing Units | 1,668 (67.0%) | 821 (33.0%) |
Occupancy by Educational Attainment in Cedarhurst
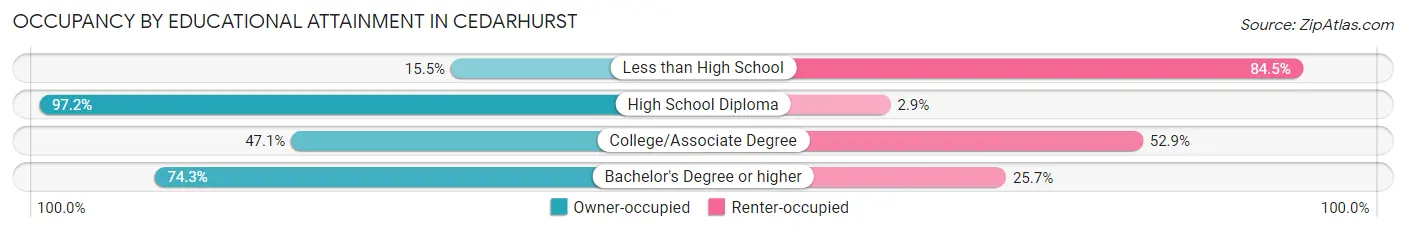
| Household Size | Owner-occupied | Renter-occupied |
| Less than High School | 13 (15.5%) | 71 (84.5%) |
| High School Diploma | 409 (97.2%) | 12 (2.9%) |
| College/Associate Degree | 395 (47.1%) | 443 (52.9%) |
| Bachelor's Degree or higher | 851 (74.3%) | 295 (25.7%) |
Occupancy by Age of Householder in Cedarhurst
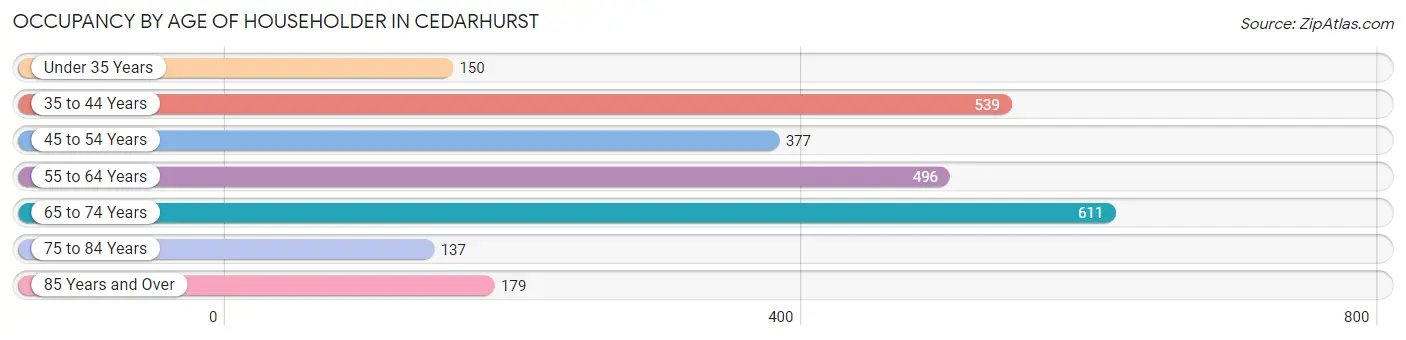
| Age Bracket | # Households | % Households |
| Under 35 Years | 150 | 6.0% |
| 35 to 44 Years | 539 | 21.7% |
| 45 to 54 Years | 377 | 15.1% |
| 55 to 64 Years | 496 | 19.9% |
| 65 to 74 Years | 611 | 24.5% |
| 75 to 84 Years | 137 | 5.5% |
| 85 Years and Over | 179 | 7.2% |
| Total | 2,489 | 100.0% |
Housing Finances in Cedarhurst
Median Income by Occupancy in Cedarhurst
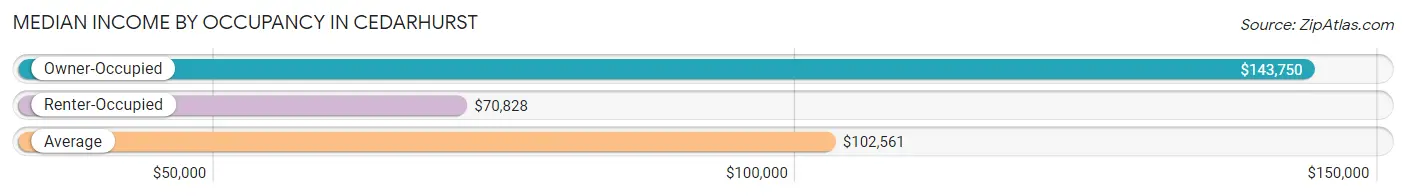
| Occupancy Type | # Households | Median Income |
| Owner-Occupied | 1,668 (67.0%) | $143,750 |
| Renter-Occupied | 821 (33.0%) | $70,828 |
| Average | 2,489 (100.0%) | $102,561 |
Occupancy by Householder Income Bracket in Cedarhurst
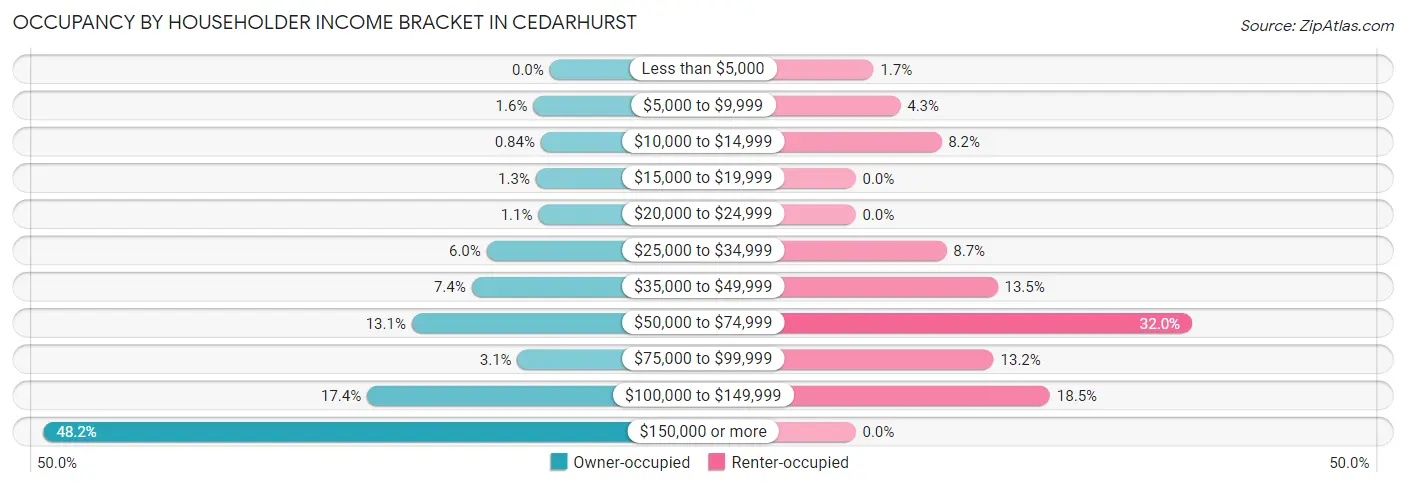
| Income Bracket | Owner-occupied | Renter-occupied |
| Less than $5,000 | 0 (0.0%) | 14 (1.7%) |
| $5,000 to $9,999 | 26 (1.6%) | 35 (4.3%) |
| $10,000 to $14,999 | 14 (0.8%) | 67 (8.2%) |
| $15,000 to $19,999 | 22 (1.3%) | 0 (0.0%) |
| $20,000 to $24,999 | 18 (1.1%) | 0 (0.0%) |
| $25,000 to $34,999 | 100 (6.0%) | 71 (8.6%) |
| $35,000 to $49,999 | 124 (7.4%) | 111 (13.5%) |
| $50,000 to $74,999 | 219 (13.1%) | 263 (32.0%) |
| $75,000 to $99,999 | 51 (3.1%) | 108 (13.2%) |
| $100,000 to $149,999 | 290 (17.4%) | 152 (18.5%) |
| $150,000 or more | 804 (48.2%) | 0 (0.0%) |
| Total | 1,668 (100.0%) | 821 (100.0%) |
Monthly Housing Cost Tiers in Cedarhurst
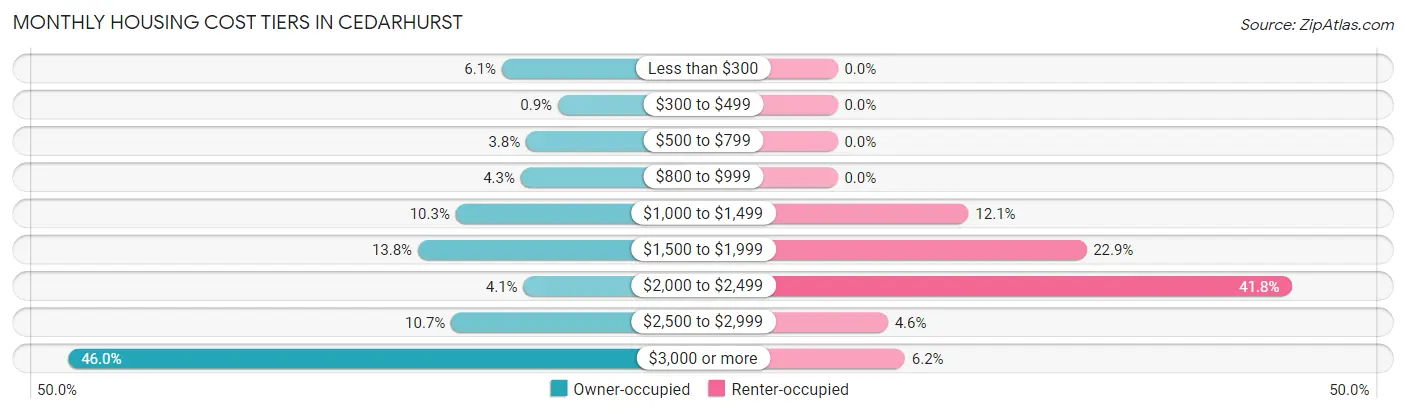
| Monthly Cost | Owner-occupied | Renter-occupied |
| Less than $300 | 101 (6.1%) | 0 (0.0%) |
| $300 to $499 | 15 (0.9%) | 0 (0.0%) |
| $500 to $799 | 64 (3.8%) | 0 (0.0%) |
| $800 to $999 | 72 (4.3%) | 0 (0.0%) |
| $1,000 to $1,499 | 172 (10.3%) | 99 (12.1%) |
| $1,500 to $1,999 | 230 (13.8%) | 188 (22.9%) |
| $2,000 to $2,499 | 68 (4.1%) | 343 (41.8%) |
| $2,500 to $2,999 | 179 (10.7%) | 38 (4.6%) |
| $3,000 or more | 767 (46.0%) | 51 (6.2%) |
| Total | 1,668 (100.0%) | 821 (100.0%) |
Physical Housing Characteristics in Cedarhurst
Housing Structures in Cedarhurst
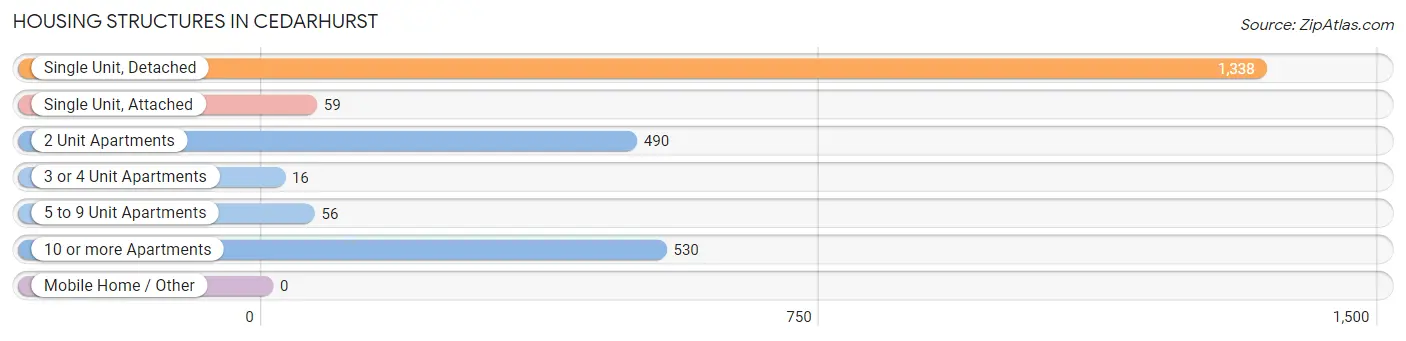
| Structure Type | # Housing Units | % Housing Units |
| Single Unit, Detached | 1,338 | 53.8% |
| Single Unit, Attached | 59 | 2.4% |
| 2 Unit Apartments | 490 | 19.7% |
| 3 or 4 Unit Apartments | 16 | 0.6% |
| 5 to 9 Unit Apartments | 56 | 2.2% |
| 10 or more Apartments | 530 | 21.3% |
| Mobile Home / Other | 0 | 0.0% |
| Total | 2,489 | 100.0% |
Housing Structures by Occupancy in Cedarhurst
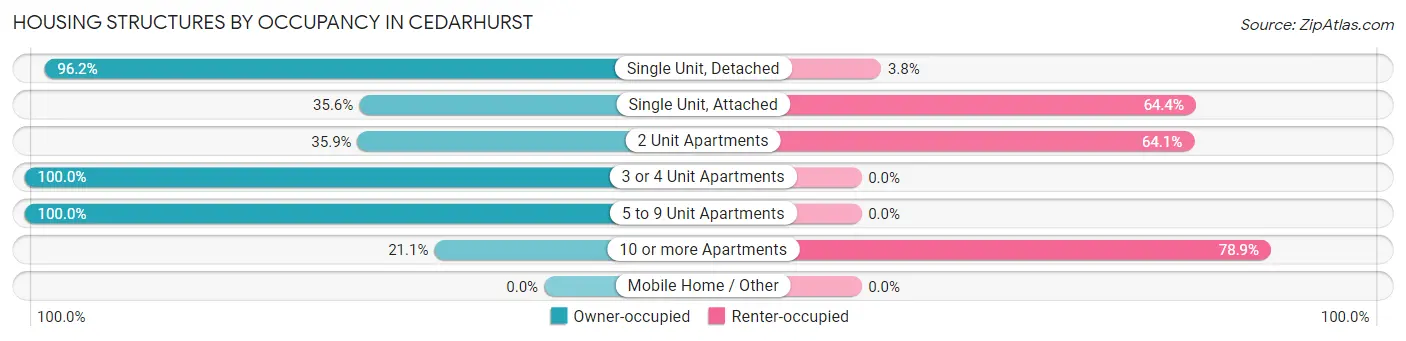
| Structure Type | Owner-occupied | Renter-occupied |
| Single Unit, Detached | 1,287 (96.2%) | 51 (3.8%) |
| Single Unit, Attached | 21 (35.6%) | 38 (64.4%) |
| 2 Unit Apartments | 176 (35.9%) | 314 (64.1%) |
| 3 or 4 Unit Apartments | 16 (100.0%) | 0 (0.0%) |
| 5 to 9 Unit Apartments | 56 (100.0%) | 0 (0.0%) |
| 10 or more Apartments | 112 (21.1%) | 418 (78.9%) |
| Mobile Home / Other | 0 (0.0%) | 0 (0.0%) |
| Total | 1,668 (67.0%) | 821 (33.0%) |
Housing Structures by Number of Rooms in Cedarhurst
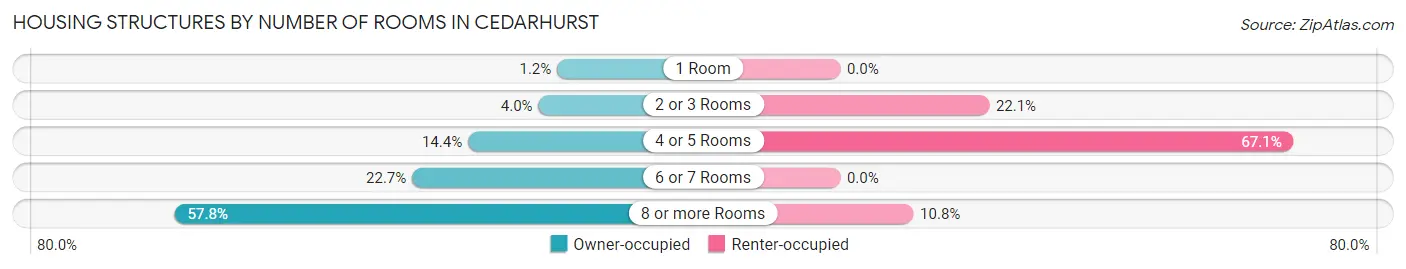
| Number of Rooms | Owner-occupied | Renter-occupied |
| 1 Room | 20 (1.2%) | 0 (0.0%) |
| 2 or 3 Rooms | 66 (4.0%) | 181 (22.1%) |
| 4 or 5 Rooms | 240 (14.4%) | 551 (67.1%) |
| 6 or 7 Rooms | 378 (22.7%) | 0 (0.0%) |
| 8 or more Rooms | 964 (57.8%) | 89 (10.8%) |
| Total | 1,668 (100.0%) | 821 (100.0%) |
Housing Structure by Heating Type in Cedarhurst
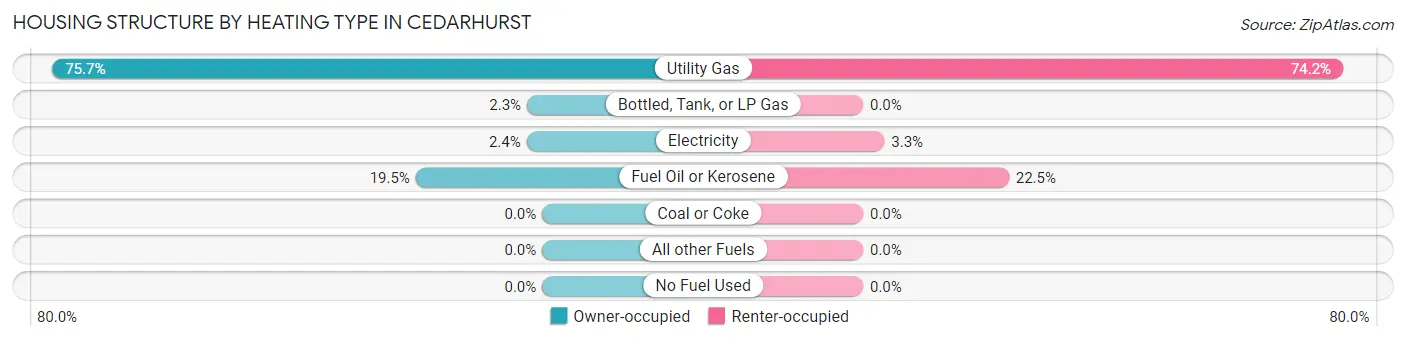
| Heating Type | Owner-occupied | Renter-occupied |
| Utility Gas | 1,263 (75.7%) | 609 (74.2%) |
| Bottled, Tank, or LP Gas | 39 (2.3%) | 0 (0.0%) |
| Electricity | 40 (2.4%) | 27 (3.3%) |
| Fuel Oil or Kerosene | 326 (19.5%) | 185 (22.5%) |
| Coal or Coke | 0 (0.0%) | 0 (0.0%) |
| All other Fuels | 0 (0.0%) | 0 (0.0%) |
| No Fuel Used | 0 (0.0%) | 0 (0.0%) |
| Total | 1,668 (100.0%) | 821 (100.0%) |
Household Vehicle Usage in Cedarhurst
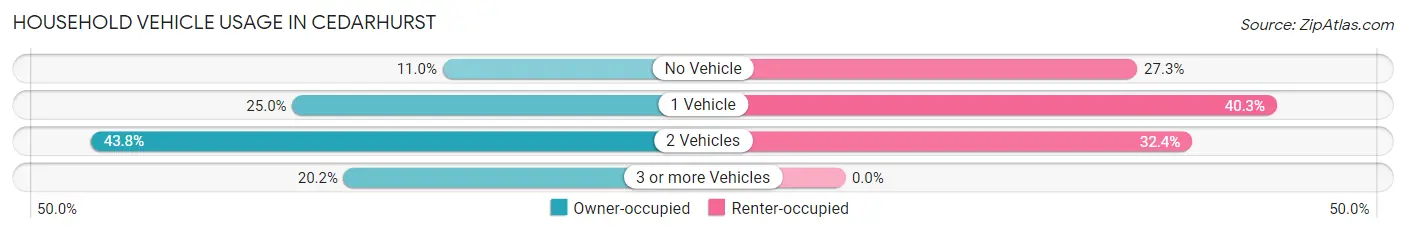
| Vehicles per Household | Owner-occupied | Renter-occupied |
| No Vehicle | 183 (11.0%) | 224 (27.3%) |
| 1 Vehicle | 417 (25.0%) | 331 (40.3%) |
| 2 Vehicles | 731 (43.8%) | 266 (32.4%) |
| 3 or more Vehicles | 337 (20.2%) | 0 (0.0%) |
| Total | 1,668 (100.0%) | 821 (100.0%) |
Real Estate & Mortgages in Cedarhurst
Real Estate and Mortgage Overview in Cedarhurst
| Characteristic | Without Mortgage | With Mortgage |
| Housing Units | 601 | 1,067 |
| Median Property Value | $697,900 | $867,400 |
| Median Household Income | $123,438 | $560 |
| Monthly Housing Costs | $1,378 | $767 |
| Real Estate Taxes | $10,001 | $20 |
Property Value by Mortgage Status in Cedarhurst
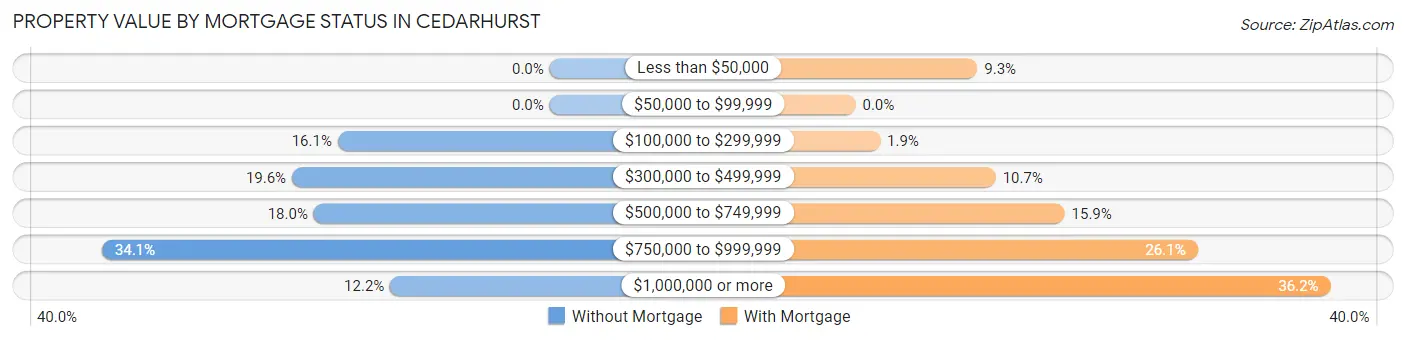
| Property Value | Without Mortgage | With Mortgage |
| Less than $50,000 | 0 (0.0%) | 99 (9.3%) |
| $50,000 to $99,999 | 0 (0.0%) | 0 (0.0%) |
| $100,000 to $299,999 | 97 (16.1%) | 20 (1.9%) |
| $300,000 to $499,999 | 118 (19.6%) | 114 (10.7%) |
| $500,000 to $749,999 | 108 (18.0%) | 170 (15.9%) |
| $750,000 to $999,999 | 205 (34.1%) | 278 (26.1%) |
| $1,000,000 or more | 73 (12.1%) | 386 (36.2%) |
| Total | 601 (100.0%) | 1,067 (100.0%) |
Household Income by Mortgage Status in Cedarhurst
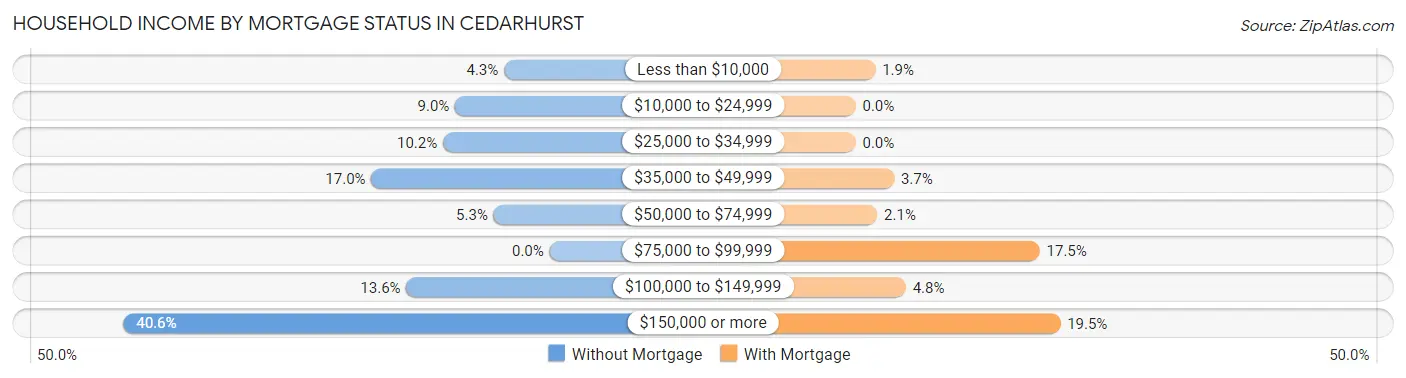
| Household Income | Without Mortgage | With Mortgage |
| Less than $10,000 | 26 (4.3%) | 20 (1.9%) |
| $10,000 to $24,999 | 54 (9.0%) | 0 (0.0%) |
| $25,000 to $34,999 | 61 (10.2%) | 0 (0.0%) |
| $35,000 to $49,999 | 102 (17.0%) | 39 (3.7%) |
| $50,000 to $74,999 | 32 (5.3%) | 22 (2.1%) |
| $75,000 to $99,999 | 0 (0.0%) | 187 (17.5%) |
| $100,000 to $149,999 | 82 (13.6%) | 51 (4.8%) |
| $150,000 or more | 244 (40.6%) | 208 (19.5%) |
| Total | 601 (100.0%) | 1,067 (100.0%) |
Property Value to Household Income Ratio in Cedarhurst
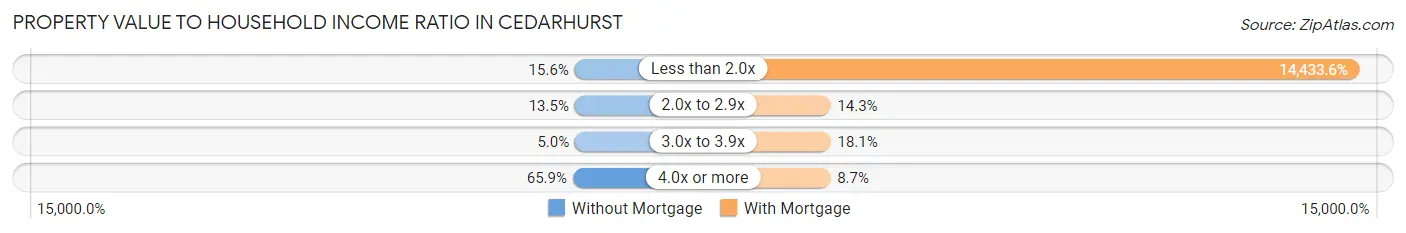
| Value-to-Income Ratio | Without Mortgage | With Mortgage |
| Less than 2.0x | 94 (15.6%) | 154,006 (14,433.5%) |
| 2.0x to 2.9x | 81 (13.5%) | 153 (14.3%) |
| 3.0x to 3.9x | 30 (5.0%) | 193 (18.1%) |
| 4.0x or more | 396 (65.9%) | 93 (8.7%) |
| Total | 601 (100.0%) | 1,067 (100.0%) |
Real Estate Taxes by Mortgage Status in Cedarhurst
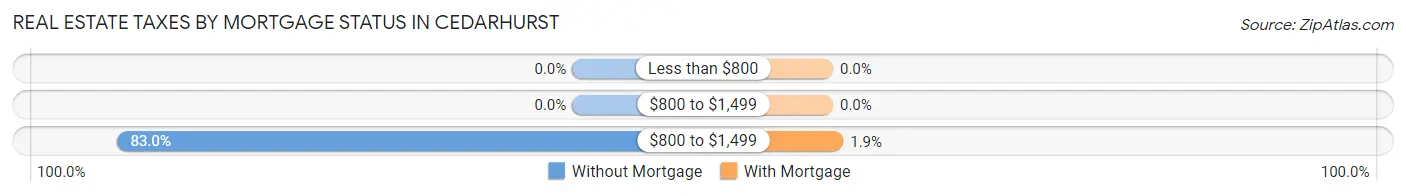
| Property Taxes | Without Mortgage | With Mortgage |
| Less than $800 | 0 (0.0%) | 0 (0.0%) |
| $800 to $1,499 | 0 (0.0%) | 0 (0.0%) |
| $800 to $1,499 | 499 (83.0%) | 20 (1.9%) |
| Total | 601 (100.0%) | 1,067 (100.0%) |
Health & Disability in Cedarhurst
Health Insurance Coverage by Age in Cedarhurst
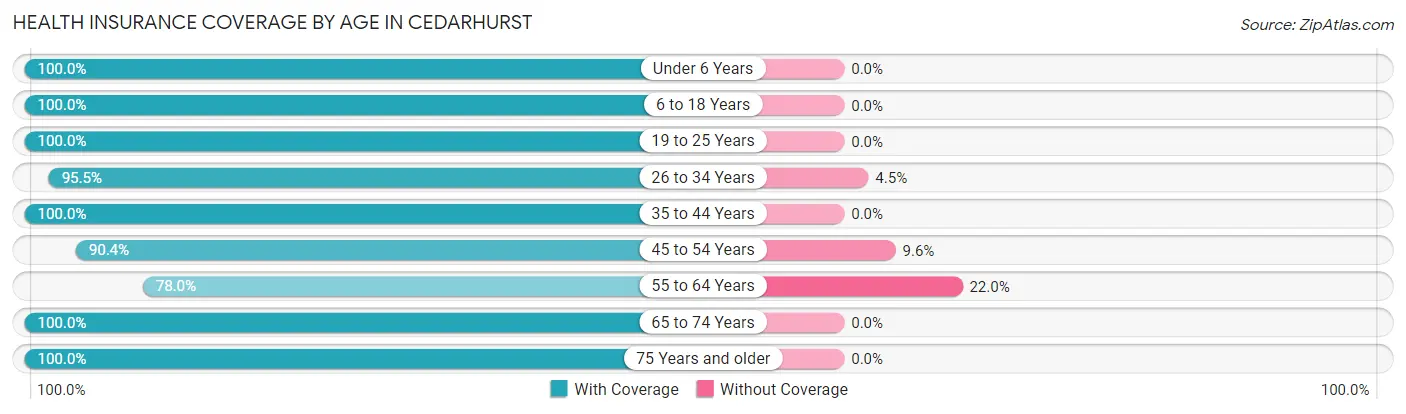
| Age Bracket | With Coverage | Without Coverage |
| Under 6 Years | 499 (100.0%) | 0 (0.0%) |
| 6 to 18 Years | 1,680 (100.0%) | 0 (0.0%) |
| 19 to 25 Years | 913 (100.0%) | 0 (0.0%) |
| 26 to 34 Years | 488 (95.5%) | 23 (4.5%) |
| 35 to 44 Years | 942 (100.0%) | 0 (0.0%) |
| 45 to 54 Years | 510 (90.4%) | 54 (9.6%) |
| 55 to 64 Years | 796 (78.0%) | 225 (22.0%) |
| 65 to 74 Years | 783 (100.0%) | 0 (0.0%) |
| 75 Years and older | 394 (100.0%) | 0 (0.0%) |
| Total | 7,005 (95.9%) | 302 (4.1%) |
Health Insurance Coverage by Citizenship Status in Cedarhurst
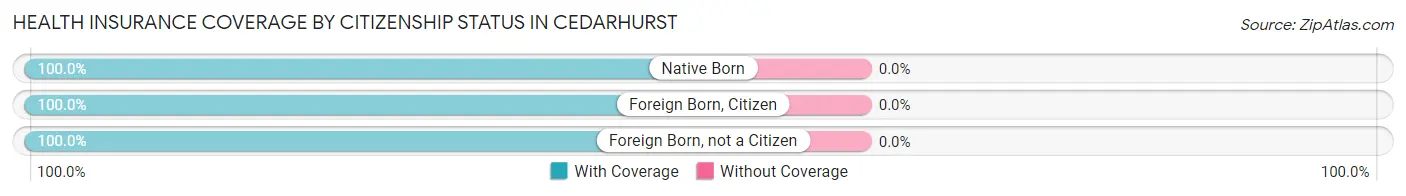
| Citizenship Status | With Coverage | Without Coverage |
| Native Born | 499 (100.0%) | 0 (0.0%) |
| Foreign Born, Citizen | 1,680 (100.0%) | 0 (0.0%) |
| Foreign Born, not a Citizen | 913 (100.0%) | 0 (0.0%) |
Health Insurance Coverage by Household Income in Cedarhurst
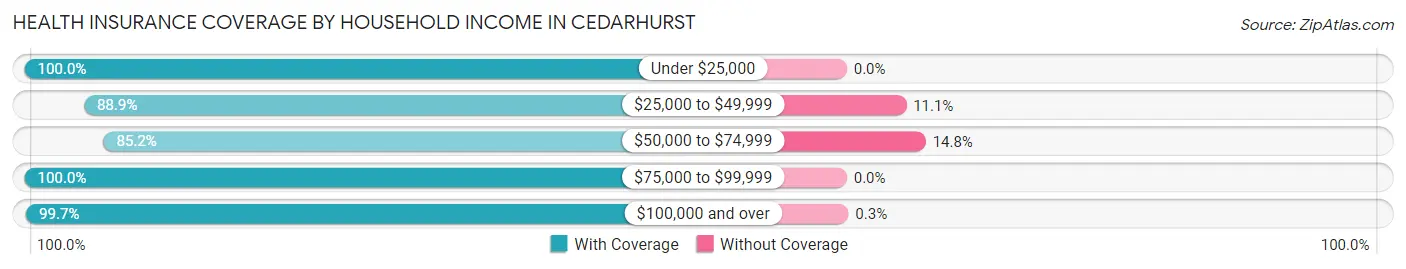
| Household Income | With Coverage | Without Coverage |
| Under $25,000 | 196 (100.0%) | 0 (0.0%) |
| $25,000 to $49,999 | 495 (88.9%) | 62 (11.1%) |
| $50,000 to $74,999 | 1,297 (85.2%) | 225 (14.8%) |
| $75,000 to $99,999 | 313 (100.0%) | 0 (0.0%) |
| $100,000 and over | 4,697 (99.7%) | 14 (0.3%) |
Public vs Private Health Insurance Coverage by Age in Cedarhurst
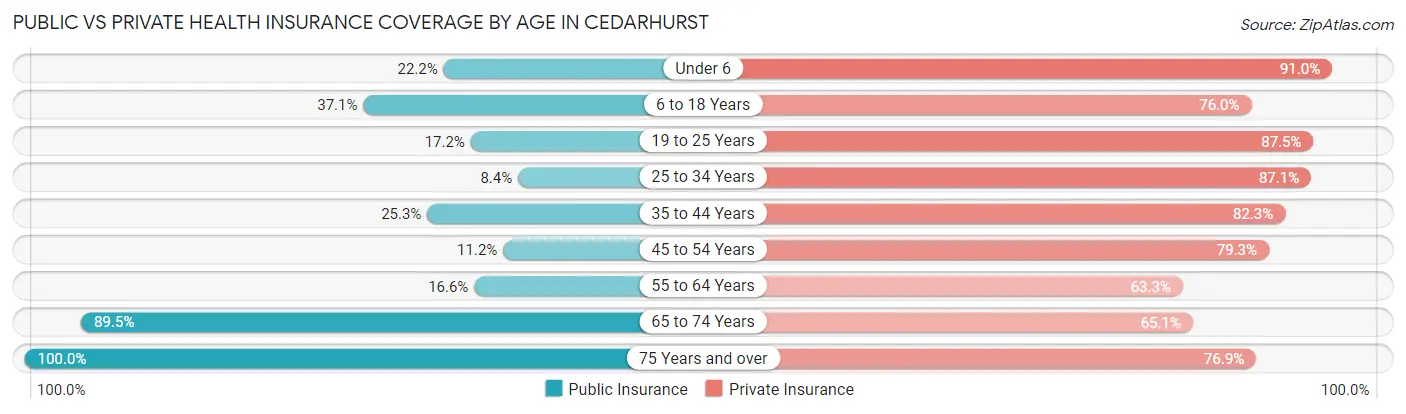
| Age Bracket | Public Insurance | Private Insurance |
| Under 6 | 111 (22.2%) | 454 (91.0%) |
| 6 to 18 Years | 624 (37.1%) | 1,277 (76.0%) |
| 19 to 25 Years | 157 (17.2%) | 799 (87.5%) |
| 25 to 34 Years | 43 (8.4%) | 445 (87.1%) |
| 35 to 44 Years | 238 (25.3%) | 775 (82.3%) |
| 45 to 54 Years | 63 (11.2%) | 447 (79.3%) |
| 55 to 64 Years | 169 (16.6%) | 646 (63.3%) |
| 65 to 74 Years | 701 (89.5%) | 510 (65.1%) |
| 75 Years and over | 394 (100.0%) | 303 (76.9%) |
| Total | 2,500 (34.2%) | 5,656 (77.4%) |
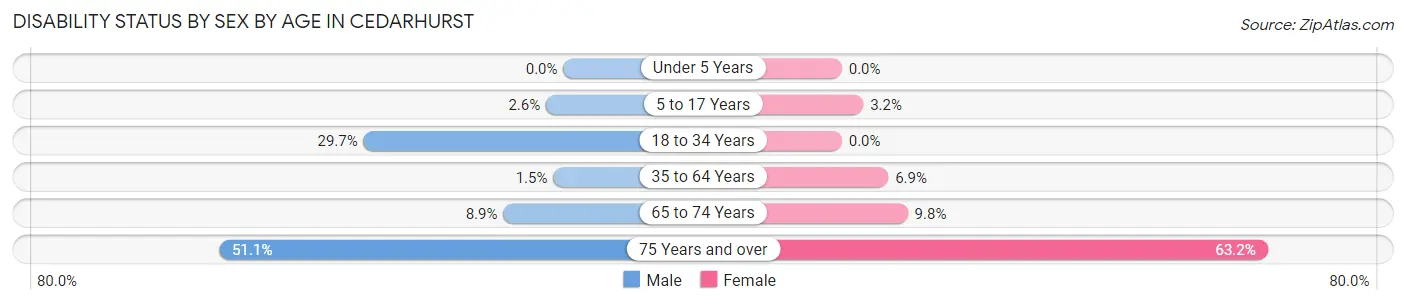
Disability Status by Sex by Age in Cedarhurst
| Age Bracket | Male | Female |
| Under 5 Years | 0 (0.0%) | 0 (0.0%) |
| 5 to 17 Years | 25 (2.6%) | 25 (3.2%) |
| 18 to 34 Years | 267 (29.7%) | 0 (0.0%) |
| 35 to 64 Years | 18 (1.5%) | 91 (6.9%) |
| 65 to 74 Years | 37 (8.9%) | 36 (9.8%) |
| 75 Years and over | 68 (51.1%) | 165 (63.2%) |
Disability Class by Sex by Age in Cedarhurst
Disability Class: Hearing Difficulty
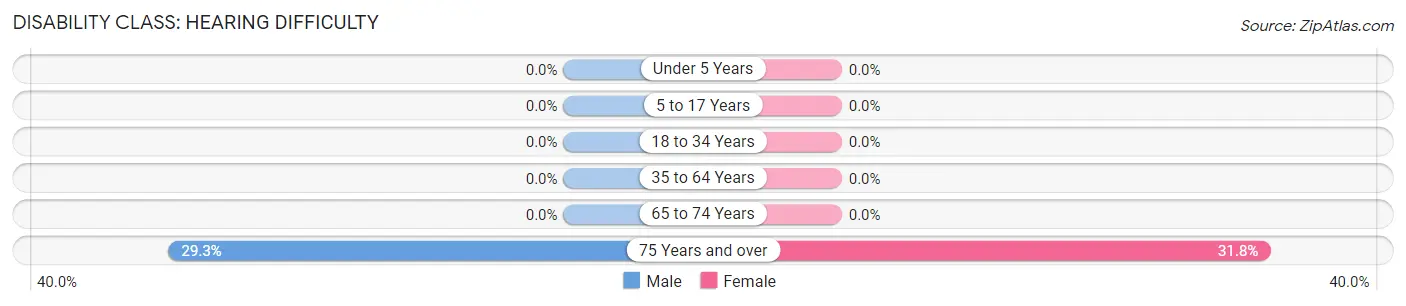
| Age Bracket | Male | Female |
| Under 5 Years | 0 (0.0%) | 0 (0.0%) |
| 5 to 17 Years | 0 (0.0%) | 0 (0.0%) |
| 18 to 34 Years | 0 (0.0%) | 0 (0.0%) |
| 35 to 64 Years | 0 (0.0%) | 0 (0.0%) |
| 65 to 74 Years | 0 (0.0%) | 0 (0.0%) |
| 75 Years and over | 39 (29.3%) | 83 (31.8%) |
Disability Class: Vision Difficulty
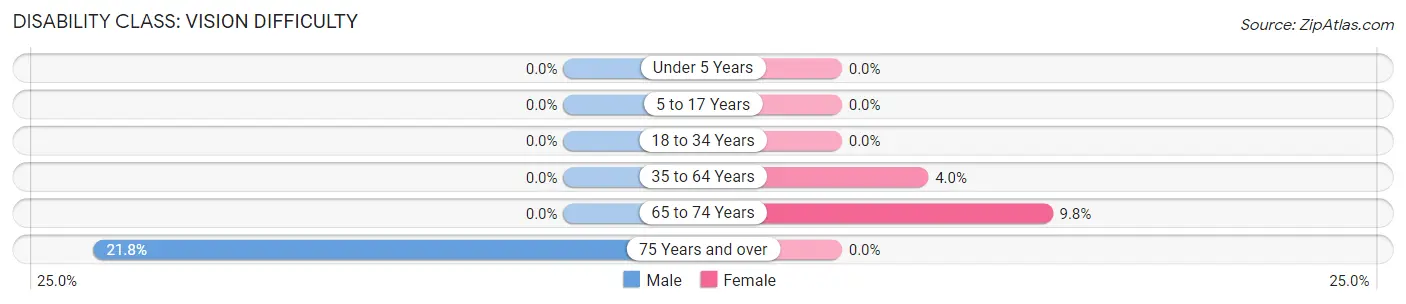
| Age Bracket | Male | Female |
| Under 5 Years | 0 (0.0%) | 0 (0.0%) |
| 5 to 17 Years | 0 (0.0%) | 0 (0.0%) |
| 18 to 34 Years | 0 (0.0%) | 0 (0.0%) |
| 35 to 64 Years | 0 (0.0%) | 53 (4.0%) |
| 65 to 74 Years | 0 (0.0%) | 36 (9.8%) |
| 75 Years and over | 29 (21.8%) | 0 (0.0%) |
Disability Class: Cognitive Difficulty
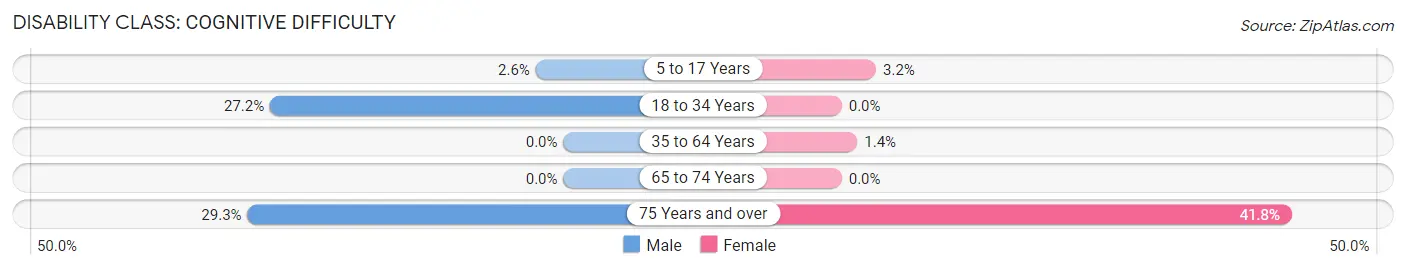
| Age Bracket | Male | Female |
| 5 to 17 Years | 25 (2.6%) | 25 (3.2%) |
| 18 to 34 Years | 245 (27.2%) | 0 (0.0%) |
| 35 to 64 Years | 0 (0.0%) | 19 (1.4%) |
| 65 to 74 Years | 0 (0.0%) | 0 (0.0%) |
| 75 Years and over | 39 (29.3%) | 109 (41.8%) |
Disability Class: Ambulatory Difficulty
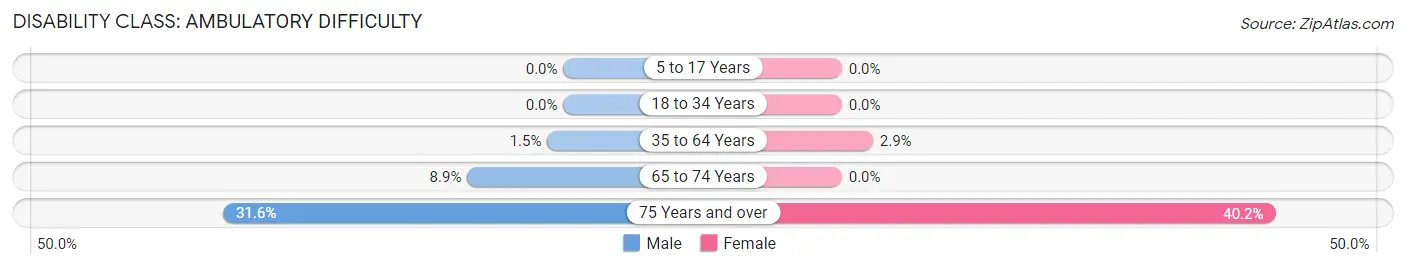
| Age Bracket | Male | Female |
| 5 to 17 Years | 0 (0.0%) | 0 (0.0%) |
| 18 to 34 Years | 0 (0.0%) | 0 (0.0%) |
| 35 to 64 Years | 18 (1.5%) | 38 (2.9%) |
| 65 to 74 Years | 37 (8.9%) | 0 (0.0%) |
| 75 Years and over | 42 (31.6%) | 105 (40.2%) |
Disability Class: Self-Care Difficulty
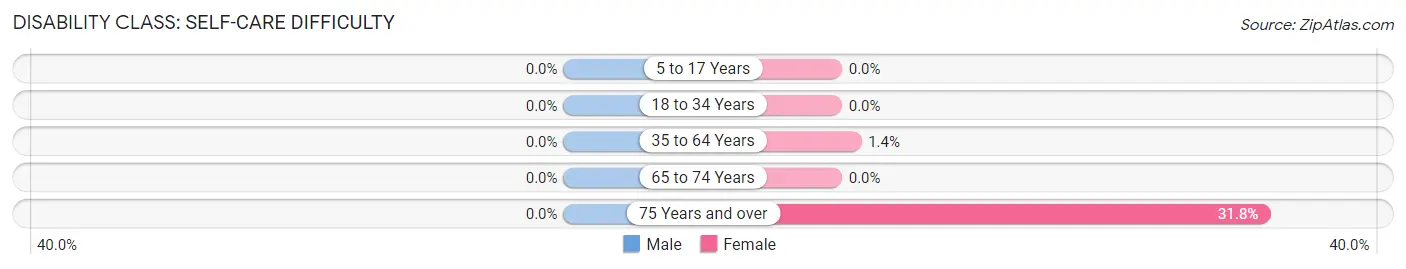
| Age Bracket | Male | Female |
| 5 to 17 Years | 0 (0.0%) | 0 (0.0%) |
| 18 to 34 Years | 0 (0.0%) | 0 (0.0%) |
| 35 to 64 Years | 0 (0.0%) | 19 (1.4%) |
| 65 to 74 Years | 0 (0.0%) | 0 (0.0%) |
| 75 Years and over | 0 (0.0%) | 83 (31.8%) |
Technology Access in Cedarhurst
Computing Device Access in Cedarhurst
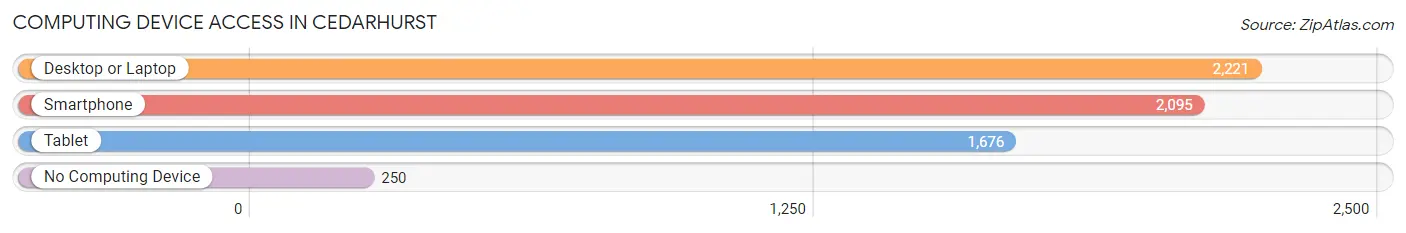
| Device Type | # Households | % Households |
| Desktop or Laptop | 2,221 | 89.2% |
| Smartphone | 2,095 | 84.2% |
| Tablet | 1,676 | 67.3% |
| No Computing Device | 250 | 10.0% |
| Total | 2,489 | 100.0% |
Internet Access in Cedarhurst
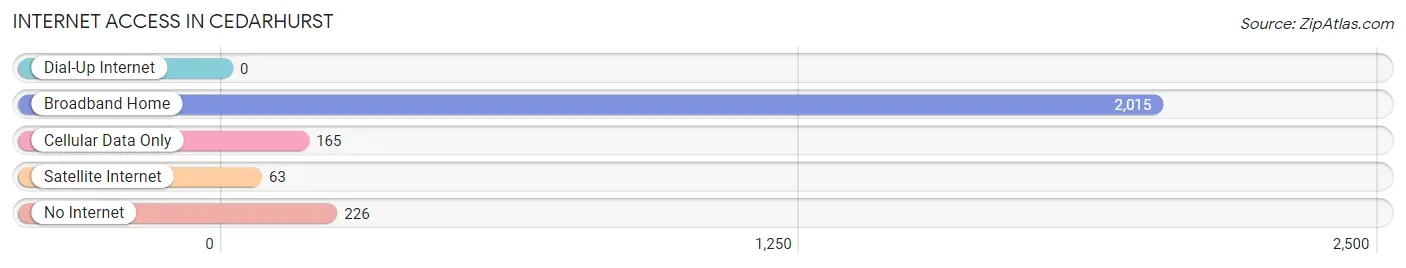
| Internet Type | # Households | % Households |
| Dial-Up Internet | 0 | 0.0% |
| Broadband Home | 2,015 | 81.0% |
| Cellular Data Only | 165 | 6.6% |
| Satellite Internet | 63 | 2.5% |
| No Internet | 226 | 9.1% |
| Total | 2,489 | 100.0% |
Cedarhurst Summary
Cedarhurst is a village located in the Town of Hempstead in Nassau County, New York. It is situated on the South Shore of Long Island, approximately 19 miles east of Manhattan. The village has a population of 6,592 as of the 2010 census.
Geography
Cedarhurst is located at 40°37'25" North, 73°41'17" West (40.623607, -73.687945). It is bordered by Lawrence to the north, Woodmere to the east, Inwood to the south, and Hewlett to the west. The village is situated on the South Shore of Long Island, approximately 19 miles east of Manhattan.
The village is located on a peninsula that juts out into the Atlantic Ocean. The peninsula is bordered by the Atlantic Ocean to the south, Reynolds Channel to the east, and Hewlett Bay to the west. The village is located on a flat plain, with an elevation of approximately 10 feet above sea level.
Climate
Cedarhurst has a humid subtropical climate, with hot, humid summers and mild winters. The average annual temperature is 57°F, with an average high of 79°F in July and an average low of 35°F in January. The average annual precipitation is 46 inches, with an average of 4.5 inches of snowfall per year.
Demographics
As of the 2010 census, there were 6,592 people, 2,541 households, and 1,717 families residing in the village. The population density was 5,845.3 people per square mile. The racial makeup of the village was 79.2% White, 8.2% African American, 0.2% Native American, 6.3% Asian, 0.1% Pacific Islander, 3.2% from other races, and 2.9% from two or more races. Hispanic or Latino of any race were 8.7% of the population.
The median age in the village was 43.2 years. 22.2% of residents were under the age of 18; 6.2% were between the ages of 18 and 24; 22.7% were from 25 to 44; 32.2% were from 45 to 64; and 16.7% were 65 years of age or older. The gender makeup of the village was 48.2% male and 51.8% female.
Economy
Cedarhurst is a primarily residential community, with a small commercial district located along Central Avenue. The village is home to a variety of small businesses, including restaurants, retail stores, and professional services. The village is also home to a number of financial institutions, including banks, credit unions, and investment firms.
The village is served by the Long Island Rail Road, with service to Manhattan and other points on Long Island. The village is also served by several bus routes operated by Nassau Inter-County Express.
History
Cedarhurst was originally inhabited by the Rockaway Indians, a sub-tribe of the Lenape. The area was settled by Europeans in the late 17th century, and was known as Cedarhurst-in-the-Woods. The village was incorporated in 1910, and was named after the cedar trees that grew in the area.
In the early 20th century, Cedarhurst was a popular summer resort for wealthy New Yorkers. The village was home to several large estates, including the estate of William K. Vanderbilt, which was later converted into a golf course.
In the 1950s, Cedarhurst began to experience a population boom, as many New Yorkers moved to the village in search of a suburban lifestyle. The village has since become a popular destination for young professionals and families.
Common Questions
What is Per Capita Income in Cedarhurst?
Per Capita income in Cedarhurst is $48,127.
What is the Median Family Income in Cedarhurst?
Median Family Income in Cedarhurst is $147,125.
What is the Median Household income in Cedarhurst?
Median Household Income in Cedarhurst is $102,561.
What is Income or Wage Gap in Cedarhurst?
Income or Wage Gap in Cedarhurst is 3.9%.
Women in Cedarhurst earn 96.1 cents for every dollar earned by a man.
What is Inequality or Gini Index in Cedarhurst?
Inequality or Gini Index in Cedarhurst is 0.46.
What is the Total Population of Cedarhurst?
Total Population of Cedarhurst is 7,307.
What is the Total Male Population of Cedarhurst?
Total Male Population of Cedarhurst is 3,860.
What is the Total Female Population of Cedarhurst?
Total Female Population of Cedarhurst is 3,447.
What is the Ratio of Males per 100 Females in Cedarhurst?
There are 111.98 Males per 100 Females in Cedarhurst.
What is the Ratio of Females per 100 Males in Cedarhurst?
There are 89.30 Females per 100 Males in Cedarhurst.
What is the Median Population Age in Cedarhurst?
Median Population Age in Cedarhurst is 35.4 Years.
What is the Average Family Size in Cedarhurst
Average Family Size in Cedarhurst is 3.9 People.
What is the Average Household Size in Cedarhurst
Average Household Size in Cedarhurst is 2.9 People.
How Large is the Labor Force in Cedarhurst?
There are 3,401 People in the Labor Forcein in Cedarhurst.
What is the Percentage of People in the Labor Force in Cedarhurst?
63.7% of People are in the Labor Force in Cedarhurst.
What is the Unemployment Rate in Cedarhurst?
Unemployment Rate in Cedarhurst is 7.1%.