Greenport West, NY Map & Demographics
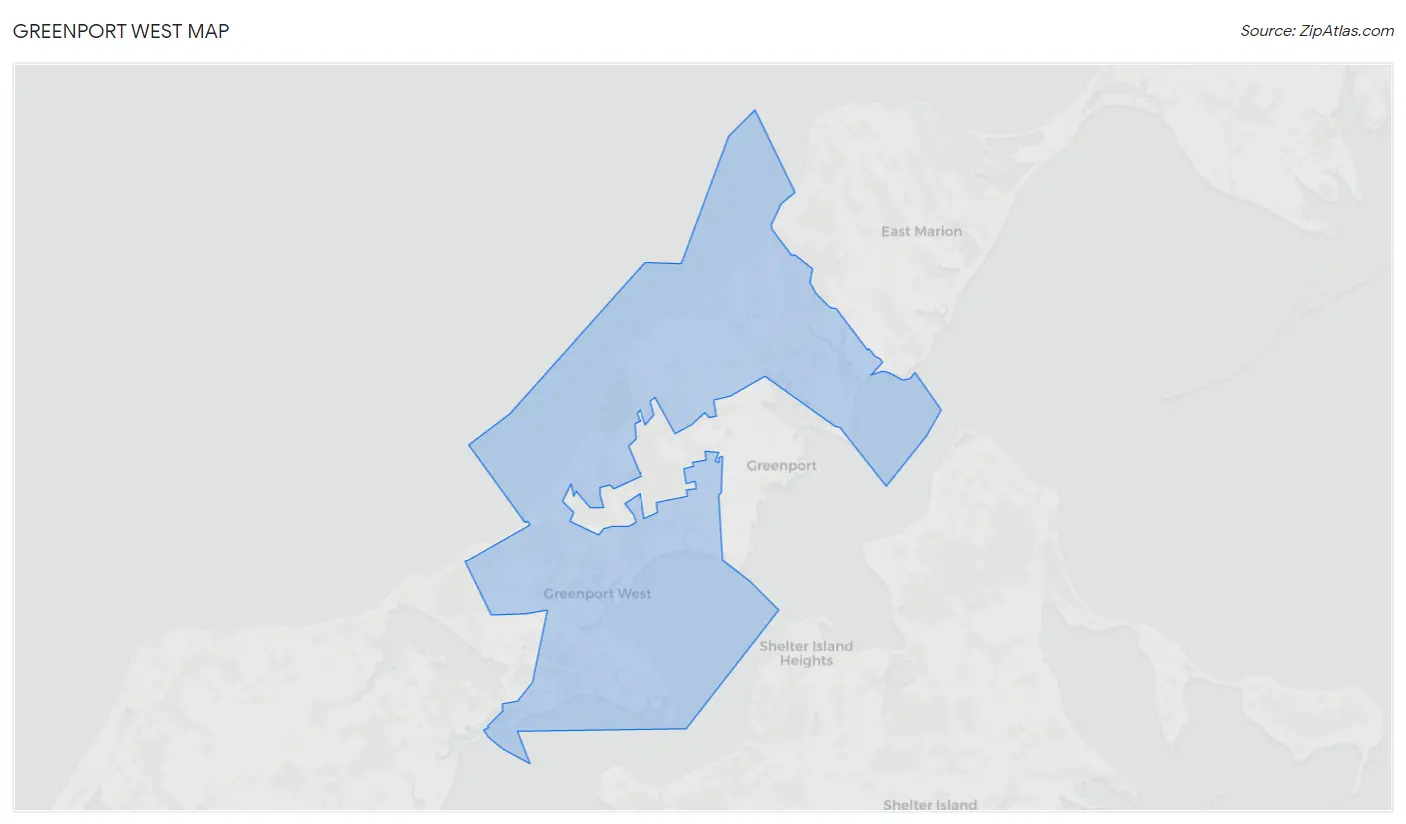
Greenport West Map
Greenport West Overview
$73,007
PER CAPITA INCOME
$149,094
AVG FAMILY INCOME
$73,750
AVG HOUSEHOLD INCOME
22.1%
WAGE / INCOME GAP [ % ]
77.9¢/ $1
WAGE / INCOME GAP [ $ ]
0.56
INEQUALITY / GINI INDEX
2,230
TOTAL POPULATION
1,079
MALE POPULATION
1,151
FEMALE POPULATION
93.74
MALES / 100 FEMALES
106.67
FEMALES / 100 MALES
59.2
MEDIAN AGE
2.9
AVG FAMILY SIZE
2.0
AVG HOUSEHOLD SIZE
990
LABOR FORCE [ PEOPLE ]
48.9%
PERCENT IN LABOR FORCE
7.0%
UNEMPLOYMENT RATE
Income in Greenport West
Income Overview in Greenport West
Per Capita Income in Greenport West is $73,007, while median incomes of families and households are $149,094 and $73,750 respectively.
| Characteristic | Number | Measure |
| Per Capita Income | 2,230 | $73,007 |
| Median Family Income | 521 | $149,094 |
| Mean Family Income | 521 | $219,725 |
| Median Household Income | 1,077 | $73,750 |
| Mean Household Income | 1,077 | $150,666 |
| Income Deficit | 521 | $0 |
| Wage / Income Gap (%) | 2,230 | 22.12% |
| Wage / Income Gap ($) | 2,230 | 77.88¢ per $1 |
| Gini / Inequality Index | 2,230 | 0.56 |
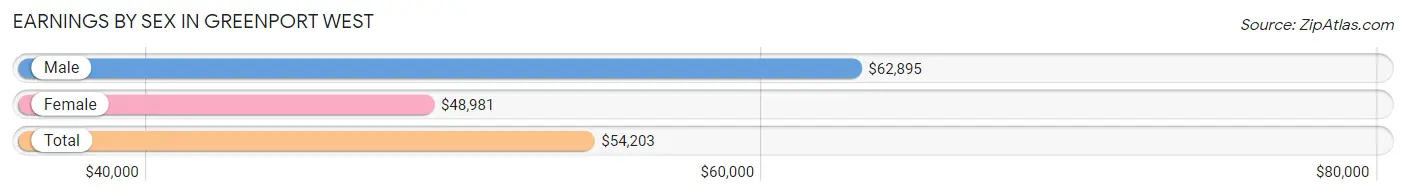
Earnings by Sex in Greenport West
Average Earnings in Greenport West are $54,203, $62,895 for men and $48,981 for women, a difference of 22.1%.
| Sex | Number | Average Earnings |
| Male | 644 (61.0%) | $62,895 |
| Female | 412 (39.0%) | $48,981 |
| Total | 1,056 (100.0%) | $54,203 |
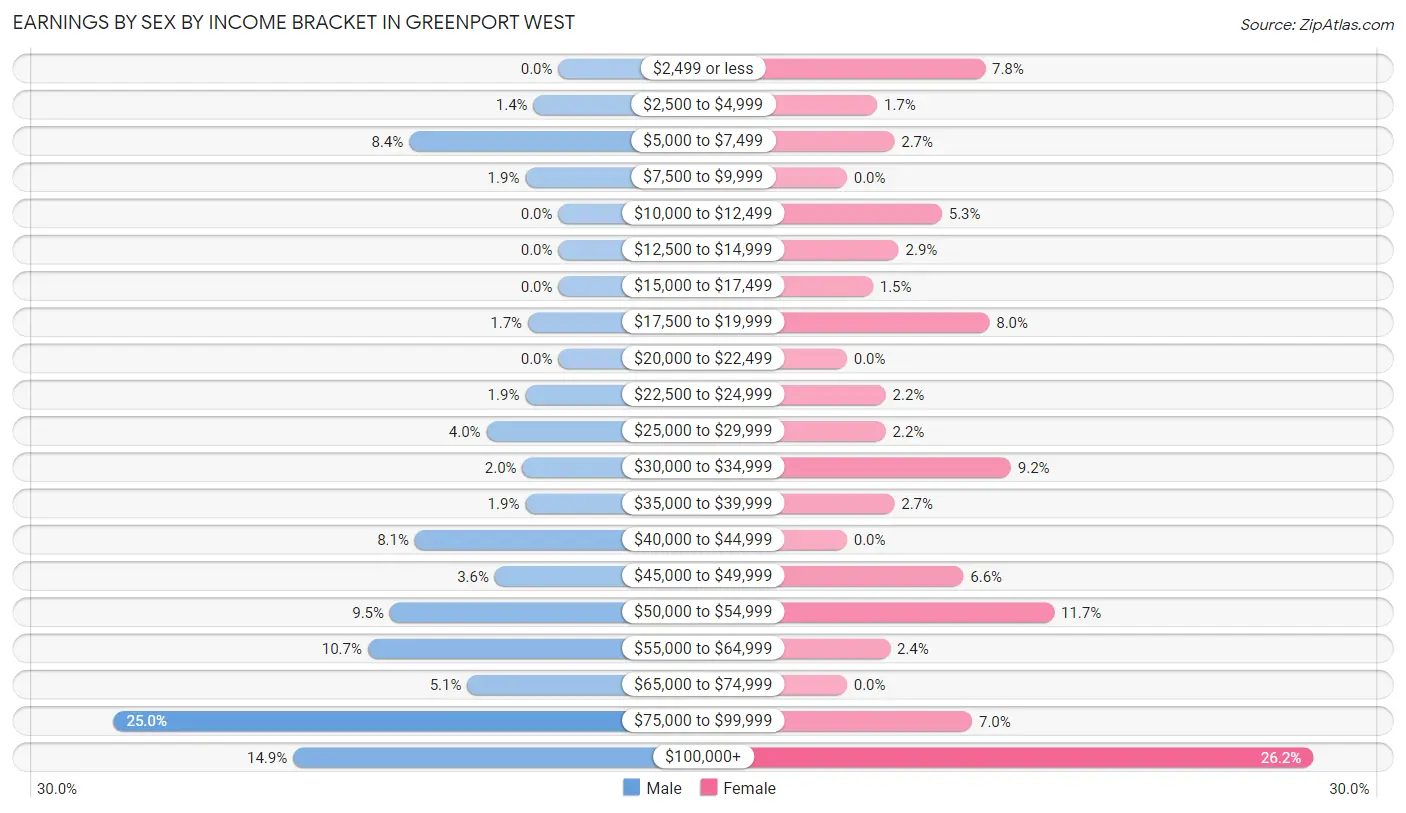
Earnings by Sex by Income Bracket in Greenport West
The most common earnings brackets in Greenport West are $75,000 to $99,999 for men (161 | 25.0%) and $100,000+ for women (108 | 26.2%).
| Income | Male | Female |
| $2,499 or less | 0 (0.0%) | 32 (7.8%) |
| $2,500 to $4,999 | 9 (1.4%) | 7 (1.7%) |
| $5,000 to $7,499 | 54 (8.4%) | 11 (2.7%) |
| $7,500 to $9,999 | 12 (1.9%) | 0 (0.0%) |
| $10,000 to $12,499 | 0 (0.0%) | 22 (5.3%) |
| $12,500 to $14,999 | 0 (0.0%) | 12 (2.9%) |
| $15,000 to $17,499 | 0 (0.0%) | 6 (1.5%) |
| $17,500 to $19,999 | 11 (1.7%) | 33 (8.0%) |
| $20,000 to $22,499 | 0 (0.0%) | 0 (0.0%) |
| $22,500 to $24,999 | 12 (1.9%) | 9 (2.2%) |
| $25,000 to $29,999 | 26 (4.0%) | 9 (2.2%) |
| $30,000 to $34,999 | 13 (2.0%) | 38 (9.2%) |
| $35,000 to $39,999 | 12 (1.9%) | 11 (2.7%) |
| $40,000 to $44,999 | 52 (8.1%) | 0 (0.0%) |
| $45,000 to $49,999 | 23 (3.6%) | 27 (6.6%) |
| $50,000 to $54,999 | 61 (9.5%) | 48 (11.7%) |
| $55,000 to $64,999 | 69 (10.7%) | 10 (2.4%) |
| $65,000 to $74,999 | 33 (5.1%) | 0 (0.0%) |
| $75,000 to $99,999 | 161 (25.0%) | 29 (7.0%) |
| $100,000+ | 96 (14.9%) | 108 (26.2%) |
| Total | 644 (100.0%) | 412 (100.0%) |
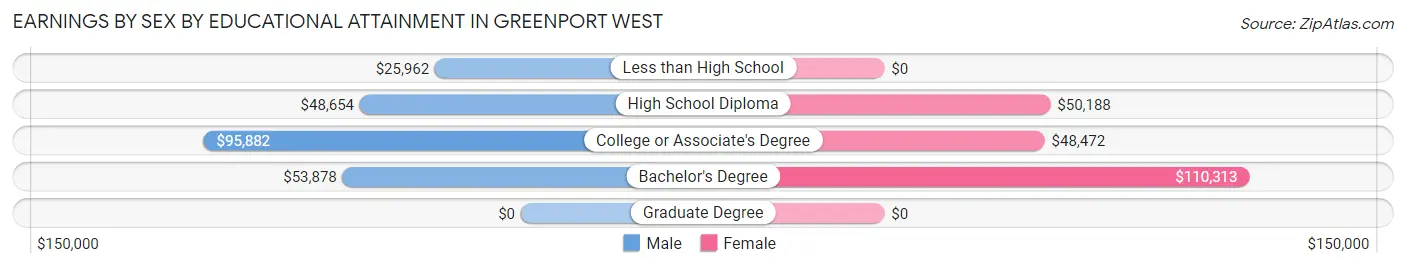
Earnings by Sex by Educational Attainment in Greenport West
Average earnings in Greenport West are $63,875 for men and $50,344 for women, a difference of 21.2%. Men with an educational attainment of college or associate's degree enjoy the highest average annual earnings of $95,882, while those with less than high school education earn the least with $25,962. Women with an educational attainment of bachelor's degree earn the most with the average annual earnings of $110,313, while those with college or associate's degree education have the smallest earnings of $48,472.
| Educational Attainment | Male Income | Female Income |
| Less than High School | $25,962 | $0 |
| High School Diploma | $48,654 | $50,188 |
| College or Associate's Degree | $95,882 | $48,472 |
| Bachelor's Degree | $53,878 | $110,313 |
| Graduate Degree | - | - |
| Total | $63,875 | $50,344 |
Family Income in Greenport West
Family Income Brackets in Greenport West
According to the Greenport West family income data, there are 178 families falling into the $200,000+ income range, which is the most common income bracket and makes up 34.2% of all families.
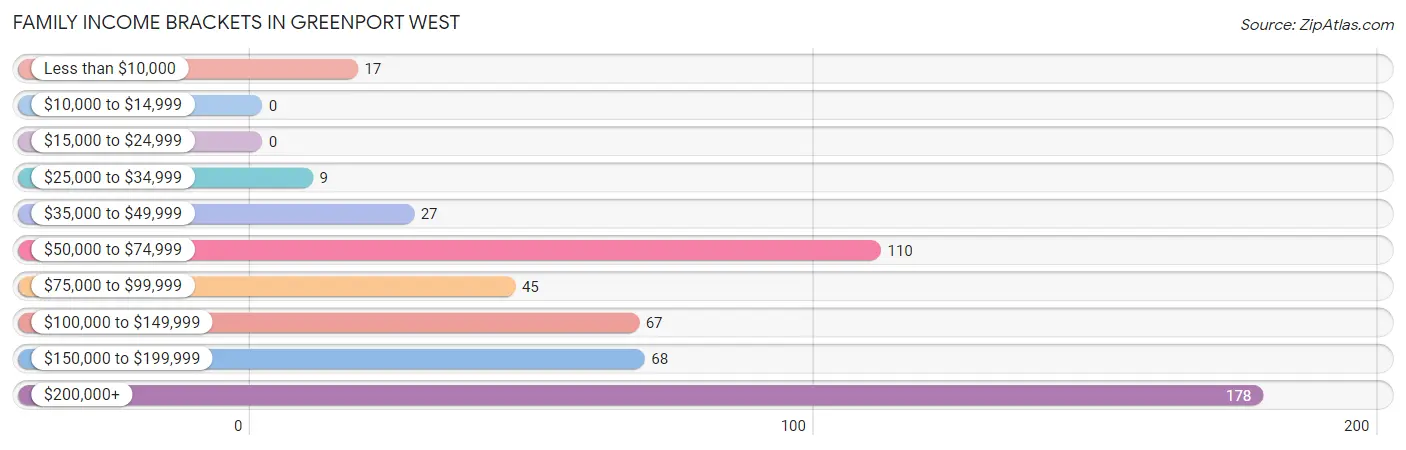
| Income Bracket | # Families | % Families |
| Less than $10,000 | 17 | 3.3% |
| $10,000 to $14,999 | 0 | 0.0% |
| $15,000 to $24,999 | 0 | 0.0% |
| $25,000 to $34,999 | 9 | 1.7% |
| $35,000 to $49,999 | 27 | 5.2% |
| $50,000 to $74,999 | 110 | 21.1% |
| $75,000 to $99,999 | 45 | 8.6% |
| $100,000 to $149,999 | 67 | 12.9% |
| $150,000 to $199,999 | 68 | 13.1% |
| $200,000+ | 178 | 34.2% |
Family Income by Famaliy Size in Greenport West
3-person families (64 | 12.3%) account for the highest median family income in Greenport West with $178,250 per family, while 3-person families (64 | 12.3%) have the highest median income of $59,417 per family member.
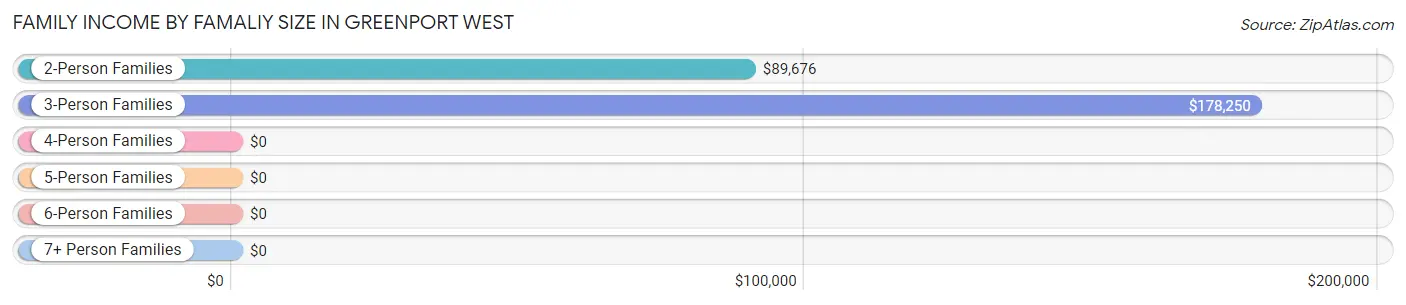
| Income Bracket | # Families | Median Income |
| 2-Person Families | 313 (60.1%) | $89,676 |
| 3-Person Families | 64 (12.3%) | $178,250 |
| 4-Person Families | 91 (17.5%) | $0 |
| 5-Person Families | 10 (1.9%) | $0 |
| 6-Person Families | 43 (8.3%) | $0 |
| 7+ Person Families | 0 (0.0%) | $0 |
| Total | 521 (100.0%) | $149,094 |
Family Income by Number of Earners in Greenport West
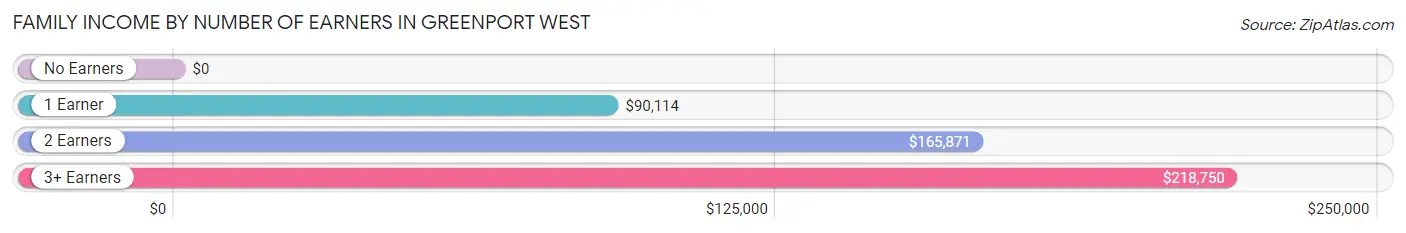
| Number of Earners | # Families | Median Income |
| No Earners | 135 (25.9%) | $0 |
| 1 Earner | 71 (13.6%) | $90,114 |
| 2 Earners | 281 (53.9%) | $165,871 |
| 3+ Earners | 34 (6.5%) | $218,750 |
| Total | 521 (100.0%) | $149,094 |
Household Income in Greenport West
Household Income Brackets in Greenport West
With 272 households falling in the category, the $50,000 to $74,999 income range is the most frequent in Greenport West, accounting for 25.3% of all households. In contrast, only 11 households (1.0%) fall into the $15,000 to $24,999 income bracket, making it the least populous group.
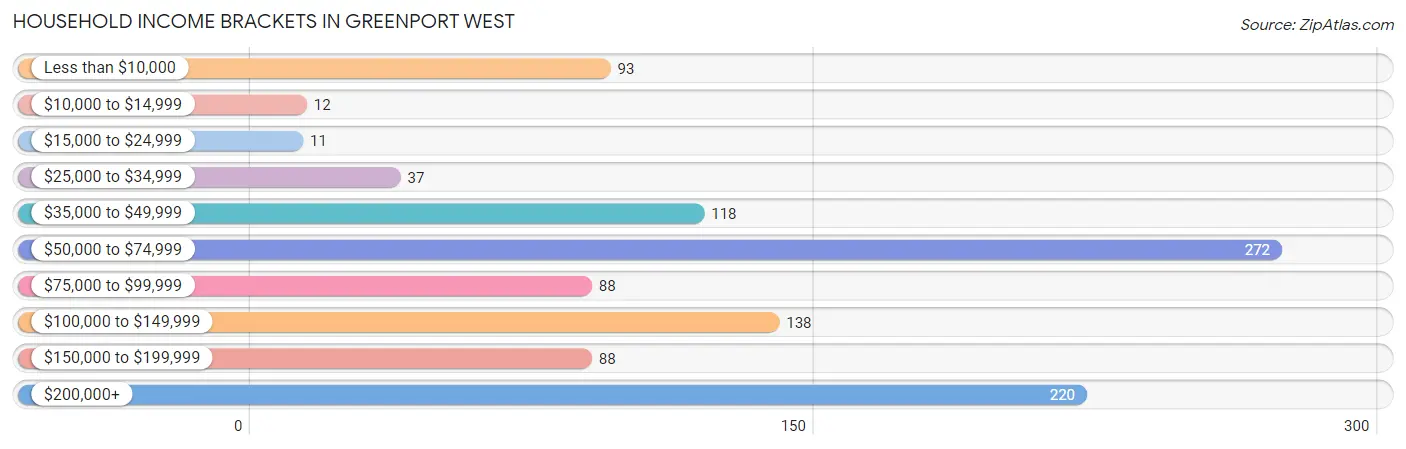
| Income Bracket | # Households | % Households |
| Less than $10,000 | 93 | 8.6% |
| $10,000 to $14,999 | 12 | 1.1% |
| $15,000 to $24,999 | 11 | 1.0% |
| $25,000 to $34,999 | 37 | 3.4% |
| $35,000 to $49,999 | 118 | 11.0% |
| $50,000 to $74,999 | 272 | 25.3% |
| $75,000 to $99,999 | 88 | 8.2% |
| $100,000 to $149,999 | 138 | 12.8% |
| $150,000 to $199,999 | 88 | 8.2% |
| $200,000+ | 220 | 20.4% |
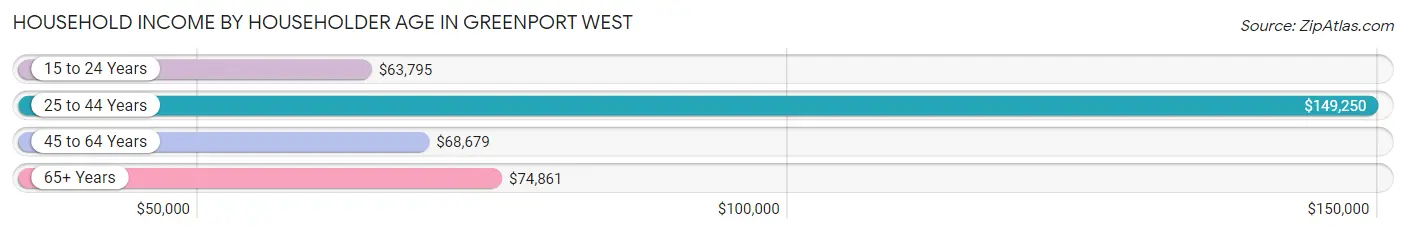
Household Income by Householder Age in Greenport West
The median household income in Greenport West is $73,750, with the highest median household income of $149,250 found in the 25 to 44 years age bracket for the primary householder. A total of 158 households (14.7%) fall into this category. Meanwhile, the 15 to 24 years age bracket for the primary householder has the lowest median household income of $63,795, with 55 households (5.1%) in this group.
| Income Bracket | # Households | Median Income |
| 15 to 24 Years | 55 (5.1%) | $63,795 |
| 25 to 44 Years | 158 (14.7%) | $149,250 |
| 45 to 64 Years | 315 (29.2%) | $68,679 |
| 65+ Years | 549 (51.0%) | $74,861 |
| Total | 1,077 (100.0%) | $73,750 |
Poverty in Greenport West
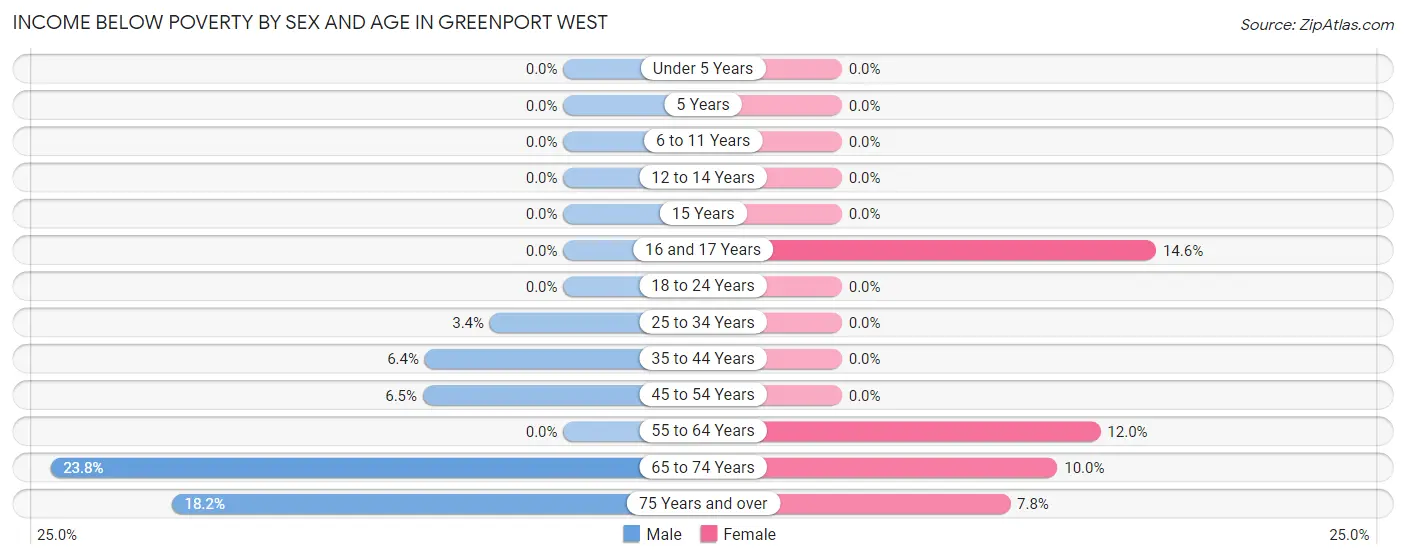
Income Below Poverty by Sex and Age in Greenport West
With 6.7% poverty level for males and 6.1% for females among the residents of Greenport West, 65 to 74 year old males and 16 and 17 year old females are the most vulnerable to poverty, with 10 males (23.8%) and 7 females (14.6%) in their respective age groups living below the poverty level.
| Age Bracket | Male | Female |
| Under 5 Years | 0 (0.0%) | 0 (0.0%) |
| 5 Years | 0 (0.0%) | 0 (0.0%) |
| 6 to 11 Years | 0 (0.0%) | 0 (0.0%) |
| 12 to 14 Years | 0 (0.0%) | 0 (0.0%) |
| 15 Years | 0 (0.0%) | 0 (0.0%) |
| 16 and 17 Years | 0 (0.0%) | 7 (14.6%) |
| 18 to 24 Years | 0 (0.0%) | 0 (0.0%) |
| 25 to 34 Years | 3 (3.4%) | 0 (0.0%) |
| 35 to 44 Years | 9 (6.4%) | 0 (0.0%) |
| 45 to 54 Years | 9 (6.5%) | 0 (0.0%) |
| 55 to 64 Years | 0 (0.0%) | 12 (12.0%) |
| 65 to 74 Years | 10 (23.8%) | 22 (10.0%) |
| 75 Years and over | 40 (18.2%) | 25 (7.8%) |
| Total | 71 (6.7%) | 66 (6.1%) |
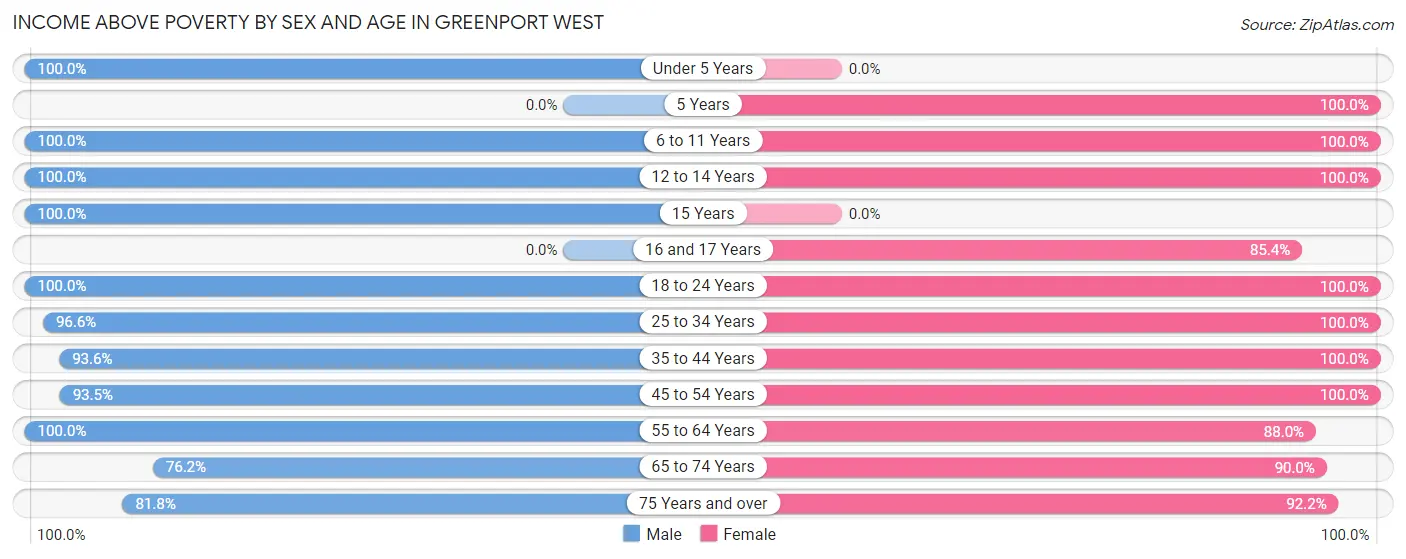
Income Above Poverty by Sex and Age in Greenport West
According to the poverty statistics in Greenport West, males aged under 5 years and females aged 5 years are the age groups that are most secure financially, with 100.0% of males and 100.0% of females in these age groups living above the poverty line.
| Age Bracket | Male | Female |
| Under 5 Years | 17 (100.0%) | 0 (0.0%) |
| 5 Years | 0 (0.0%) | 38 (100.0%) |
| 6 to 11 Years | 71 (100.0%) | 22 (100.0%) |
| 12 to 14 Years | 35 (100.0%) | 13 (100.0%) |
| 15 Years | 10 (100.0%) | 0 (0.0%) |
| 16 and 17 Years | 0 (0.0%) | 41 (85.4%) |
| 18 to 24 Years | 145 (100.0%) | 14 (100.0%) |
| 25 to 34 Years | 85 (96.6%) | 82 (100.0%) |
| 35 to 44 Years | 131 (93.6%) | 78 (100.0%) |
| 45 to 54 Years | 129 (93.5%) | 140 (100.0%) |
| 55 to 64 Years | 148 (100.0%) | 88 (88.0%) |
| 65 to 74 Years | 32 (76.2%) | 198 (90.0%) |
| 75 Years and over | 180 (81.8%) | 295 (92.2%) |
| Total | 983 (93.3%) | 1,009 (93.9%) |
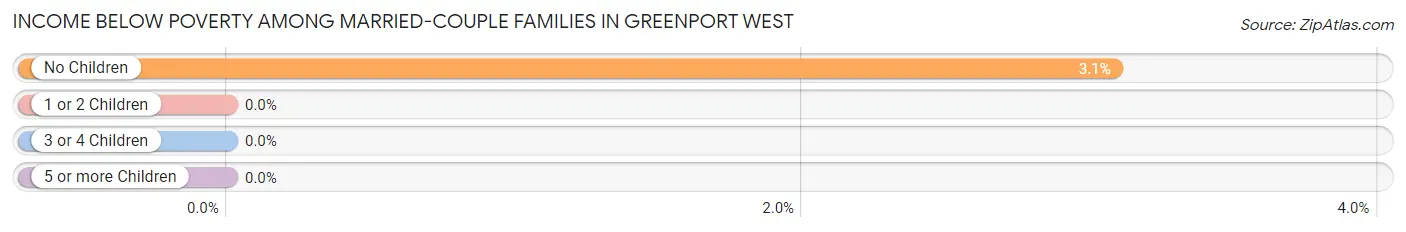
Income Below Poverty Among Married-Couple Families in Greenport West
The poverty statistics for married-couple families in Greenport West show that 2.2% or 10 of the total 453 families live below the poverty line. Families with no children have the highest poverty rate of 3.1%, comprising of 10 families. On the other hand, families with 1 or 2 children have the lowest poverty rate of 0.0%, which includes 0 families.
| Children | Above Poverty | Below Poverty |
| No Children | 315 (96.9%) | 10 (3.1%) |
| 1 or 2 Children | 85 (100.0%) | 0 (0.0%) |
| 3 or 4 Children | 43 (100.0%) | 0 (0.0%) |
| 5 or more Children | 0 (0.0%) | 0 (0.0%) |
| Total | 443 (97.8%) | 10 (2.2%) |
Income Below Poverty Among Single-Parent Households in Greenport West
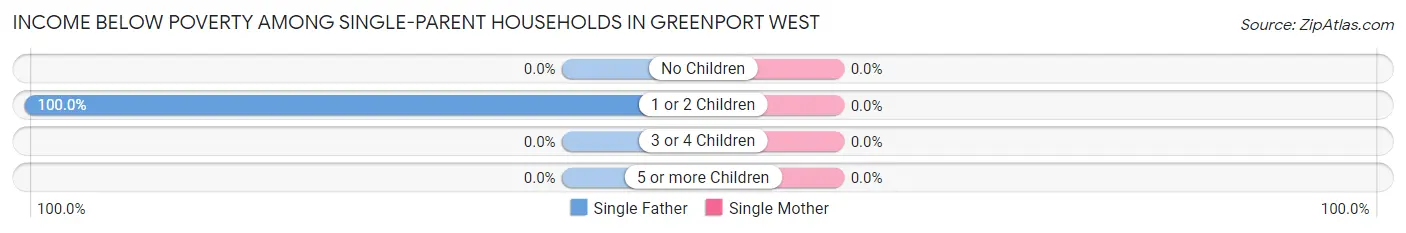
| Children | Single Father | Single Mother |
| No Children | 0 (0.0%) | 0 (0.0%) |
| 1 or 2 Children | 7 (100.0%) | 0 (0.0%) |
| 3 or 4 Children | 0 (0.0%) | 0 (0.0%) |
| 5 or more Children | 0 (0.0%) | 0 (0.0%) |
| Total | 7 (41.2%) | 0 (0.0%) |
Income Below Poverty Among Married-Couple vs Single-Parent Households in Greenport West
The poverty data for Greenport West shows that 10 of the married-couple family households (2.2%) and 7 of the single-parent households (10.3%) are living below the poverty level. Within the married-couple family households, those with no children have the highest poverty rate, with 10 households (3.1%) falling below the poverty line. Among the single-parent households, those with 1 or 2 children have the highest poverty rate, with 7 household (100.0%) living below poverty.
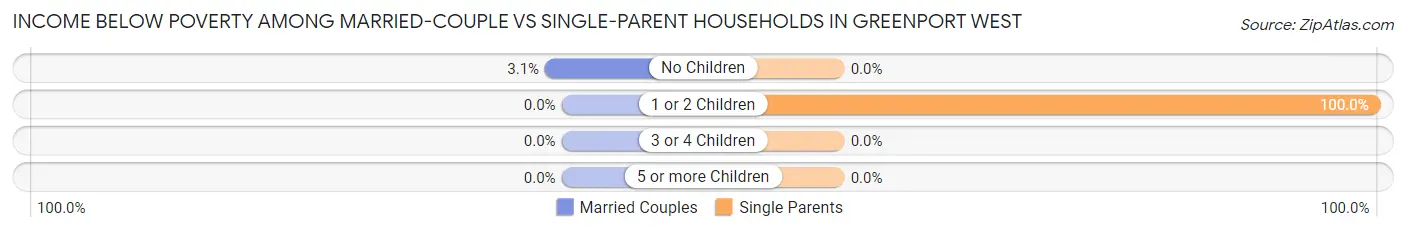
| Children | Married-Couple Families | Single-Parent Households |
| No Children | 10 (3.1%) | 0 (0.0%) |
| 1 or 2 Children | 0 (0.0%) | 7 (100.0%) |
| 3 or 4 Children | 0 (0.0%) | 0 (0.0%) |
| 5 or more Children | 0 (0.0%) | 0 (0.0%) |
| Total | 10 (2.2%) | 7 (10.3%) |
Race in Greenport West
The most populous races in Greenport West are White / Caucasian (1,945 | 87.2%), Two or more Races (139 | 6.2%), and Black / African American (82 | 3.7%).
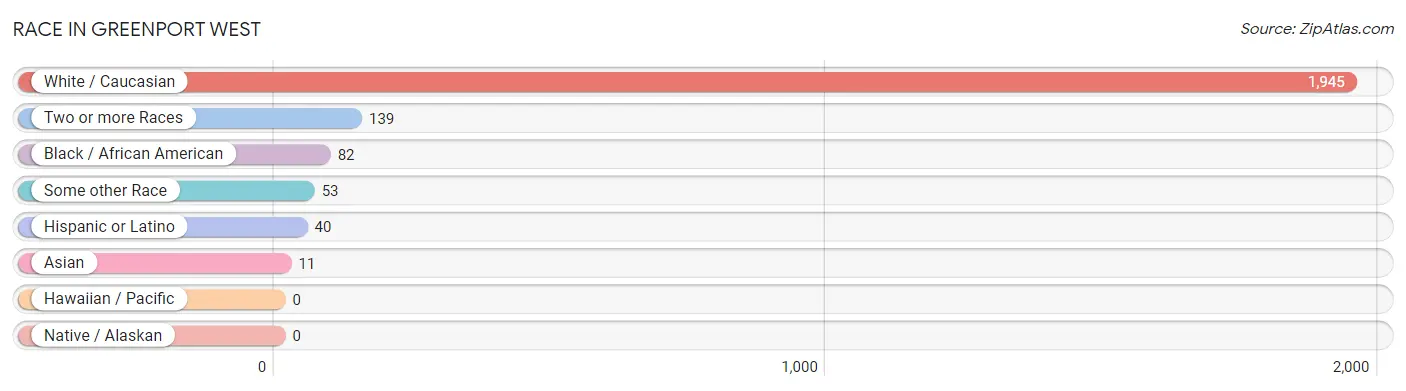
| Race | # Population | % Population |
| Asian | 11 | 0.5% |
| Black / African American | 82 | 3.7% |
| Hawaiian / Pacific | 0 | 0.0% |
| Hispanic or Latino | 40 | 1.8% |
| Native / Alaskan | 0 | 0.0% |
| White / Caucasian | 1,945 | 87.2% |
| Two or more Races | 139 | 6.2% |
| Some other Race | 53 | 2.4% |
| Total | 2,230 | 100.0% |
Ancestry in Greenport West
The most populous ancestries reported in Greenport West are American (470 | 21.1%), Irish (343 | 15.4%), German (241 | 10.8%), English (181 | 8.1%), and Italian (160 | 7.2%), together accounting for 62.6% of all Greenport West residents.
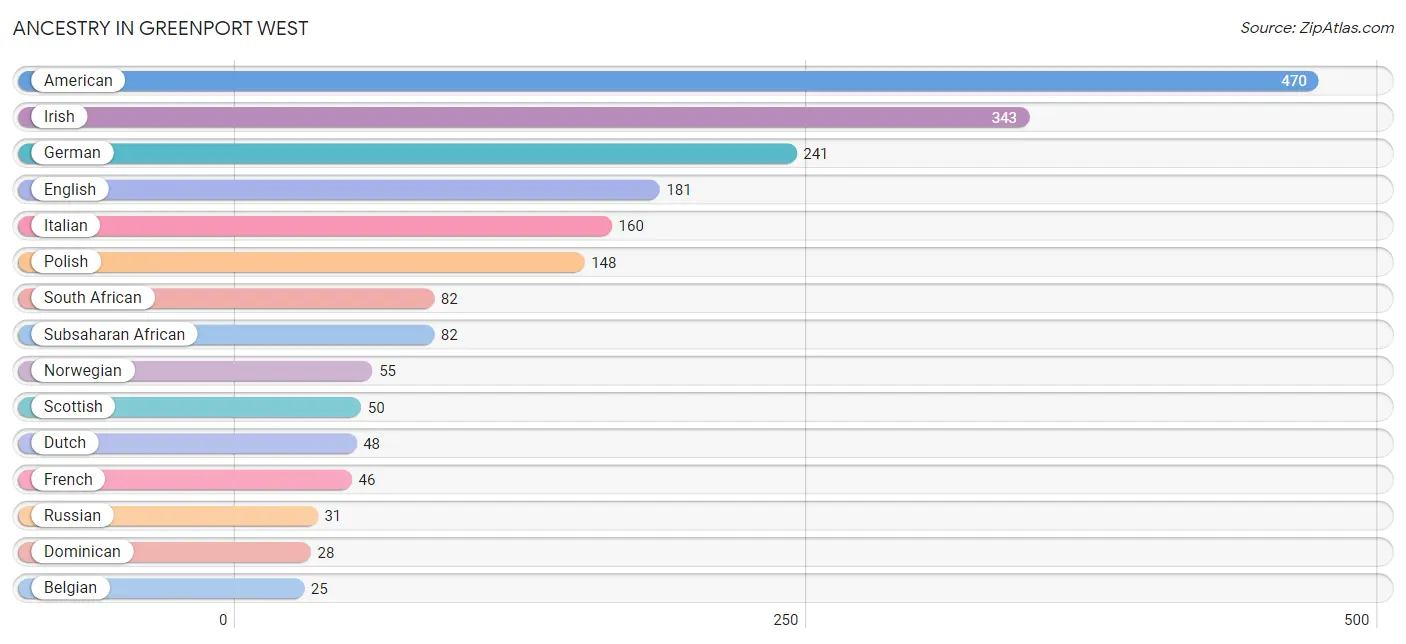
| Ancestry | # Population | % Population |
| American | 470 | 21.1% |
| Arab | 11 | 0.5% |
| Belgian | 25 | 1.1% |
| British | 10 | 0.4% |
| Burmese | 11 | 0.5% |
| Canadian | 12 | 0.5% |
| Czech | 12 | 0.5% |
| Danish | 18 | 0.8% |
| Dominican | 28 | 1.3% |
| Dutch | 48 | 2.1% |
| Eastern European | 21 | 0.9% |
| English | 181 | 8.1% |
| European | 2 | 0.1% |
| Filipino | 11 | 0.5% |
| Finnish | 14 | 0.6% |
| French | 46 | 2.1% |
| German | 241 | 10.8% |
| Greek | 21 | 0.9% |
| Indian (Asian) | 7 | 0.3% |
| Irish | 343 | 15.4% |
| Italian | 160 | 7.2% |
| Lithuanian | 11 | 0.5% |
| Northern European | 11 | 0.5% |
| Norwegian | 55 | 2.5% |
| Polish | 148 | 6.6% |
| Portuguese | 9 | 0.4% |
| Puerto Rican | 12 | 0.5% |
| Russian | 31 | 1.4% |
| Scotch-Irish | 20 | 0.9% |
| Scottish | 50 | 2.2% |
| South African | 82 | 3.7% |
| Subsaharan African | 82 | 3.7% |
| Swedish | 11 | 0.5% |
| Syrian | 11 | 0.5% |
| Ukrainian | 20 | 0.9% | View All 35 Rows |
Immigrants in Greenport West
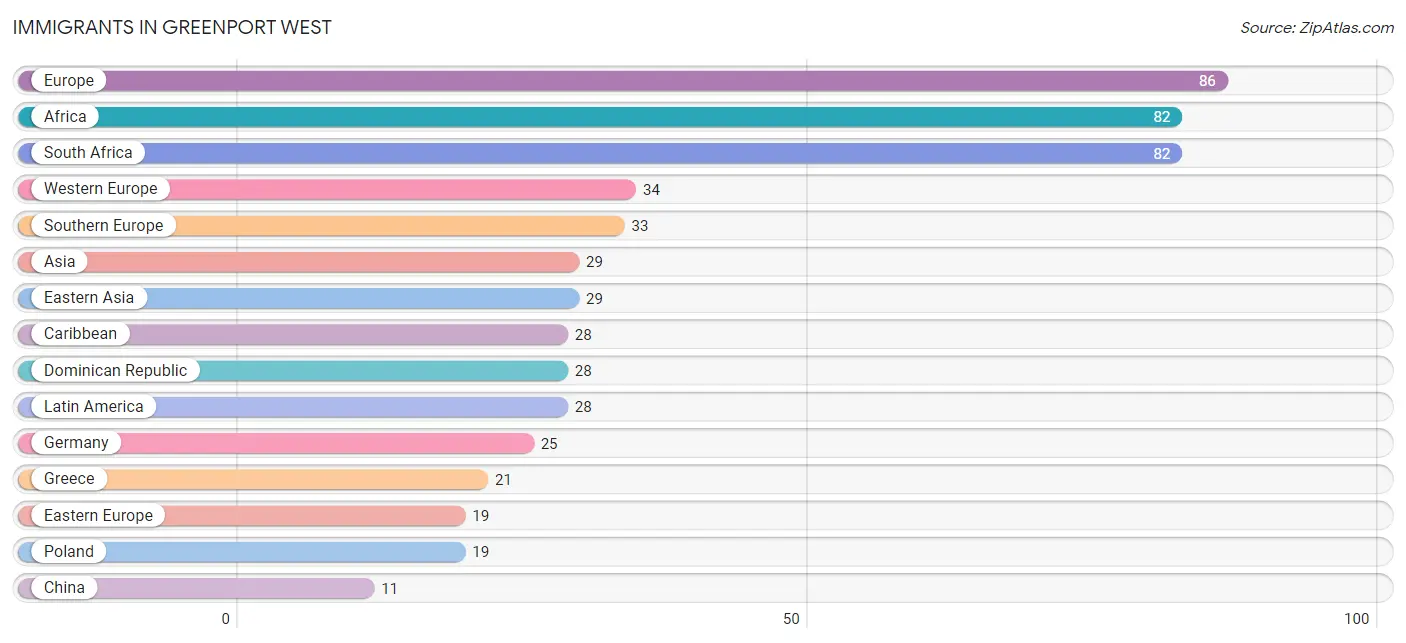
The most numerous immigrant groups reported in Greenport West came from Europe (86 | 3.9%), Africa (82 | 3.7%), South Africa (82 | 3.7%), Western Europe (34 | 1.5%), and Southern Europe (33 | 1.5%), together accounting for 14.2% of all Greenport West residents.
| Immigration Origin | # Population | % Population |
| Africa | 82 | 3.7% |
| Asia | 29 | 1.3% |
| Caribbean | 28 | 1.3% |
| China | 11 | 0.5% |
| Dominican Republic | 28 | 1.3% |
| Eastern Asia | 29 | 1.3% |
| Eastern Europe | 19 | 0.9% |
| Europe | 86 | 3.9% |
| Germany | 25 | 1.1% |
| Greece | 21 | 0.9% |
| Japan | 7 | 0.3% |
| Korea | 11 | 0.5% |
| Latin America | 28 | 1.3% |
| Netherlands | 9 | 0.4% |
| Poland | 19 | 0.9% |
| South Africa | 82 | 3.7% |
| Southern Europe | 33 | 1.5% |
| Taiwan | 11 | 0.5% |
| Western Europe | 34 | 1.5% | View All 19 Rows |
Sex and Age in Greenport West
Sex and Age in Greenport West
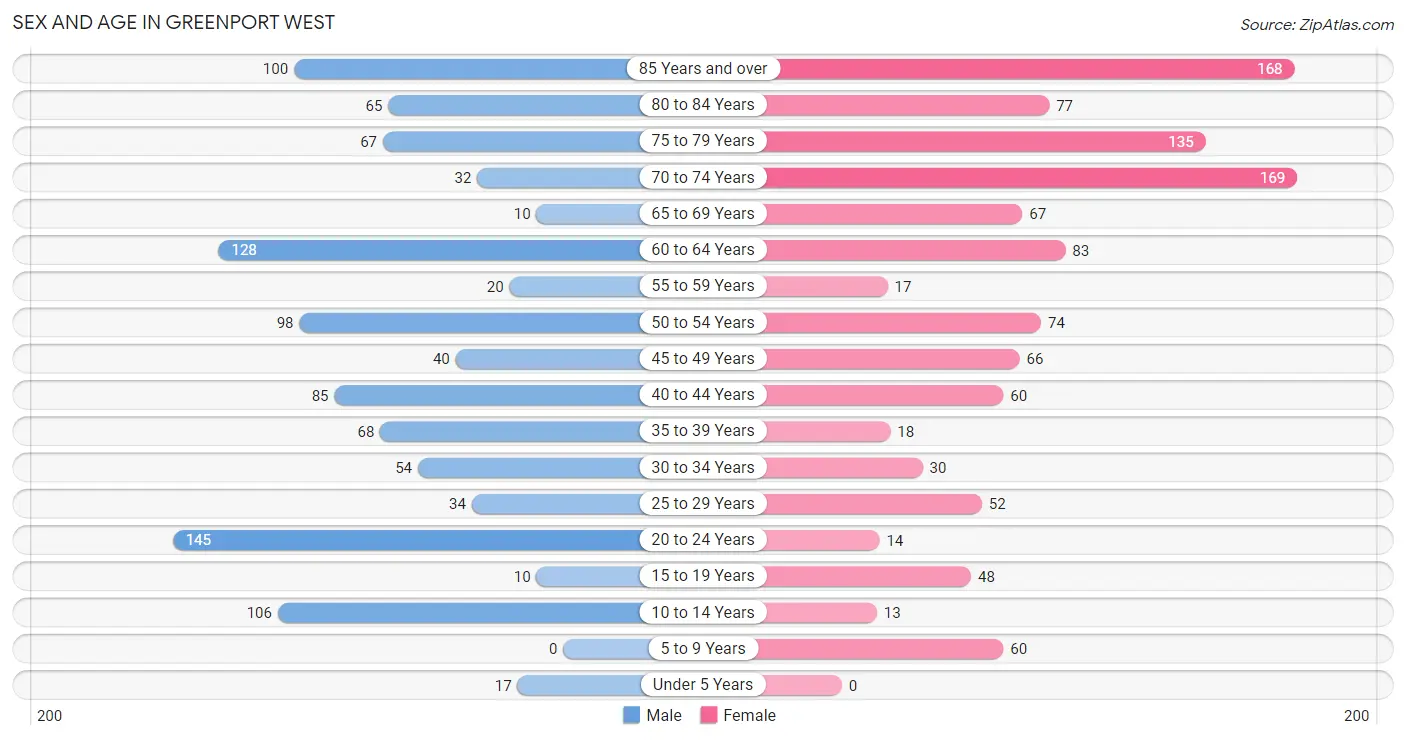
The most populous age groups in Greenport West are 20 to 24 Years (145 | 13.4%) for men and 70 to 74 Years (169 | 14.7%) for women.
| Age Bracket | Male | Female |
| Under 5 Years | 17 (1.6%) | 0 (0.0%) |
| 5 to 9 Years | 0 (0.0%) | 60 (5.2%) |
| 10 to 14 Years | 106 (9.8%) | 13 (1.1%) |
| 15 to 19 Years | 10 (0.9%) | 48 (4.2%) |
| 20 to 24 Years | 145 (13.4%) | 14 (1.2%) |
| 25 to 29 Years | 34 (3.2%) | 52 (4.5%) |
| 30 to 34 Years | 54 (5.0%) | 30 (2.6%) |
| 35 to 39 Years | 68 (6.3%) | 18 (1.6%) |
| 40 to 44 Years | 85 (7.9%) | 60 (5.2%) |
| 45 to 49 Years | 40 (3.7%) | 66 (5.7%) |
| 50 to 54 Years | 98 (9.1%) | 74 (6.4%) |
| 55 to 59 Years | 20 (1.8%) | 17 (1.5%) |
| 60 to 64 Years | 128 (11.9%) | 83 (7.2%) |
| 65 to 69 Years | 10 (0.9%) | 67 (5.8%) |
| 70 to 74 Years | 32 (3.0%) | 169 (14.7%) |
| 75 to 79 Years | 67 (6.2%) | 135 (11.7%) |
| 80 to 84 Years | 65 (6.0%) | 77 (6.7%) |
| 85 Years and over | 100 (9.3%) | 168 (14.6%) |
| Total | 1,079 (100.0%) | 1,151 (100.0%) |
Families and Households in Greenport West
Median Family Size in Greenport West
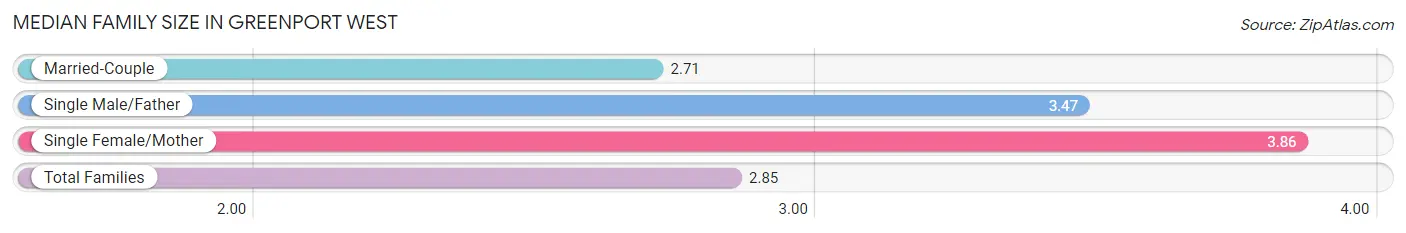
The median family size in Greenport West is 2.85 persons per family, with single female/mother families (51 | 9.8%) accounting for the largest median family size of 3.86 persons per family. On the other hand, married-couple families (453 | 87.0%) represent the smallest median family size with 2.71 persons per family.
| Family Type | # Families | Family Size |
| Married-Couple | 453 (87.0%) | 2.71 |
| Single Male/Father | 17 (3.3%) | 3.47 |
| Single Female/Mother | 51 (9.8%) | 3.86 |
| Total Families | 521 (100.0%) | 2.85 |
Median Household Size in Greenport West
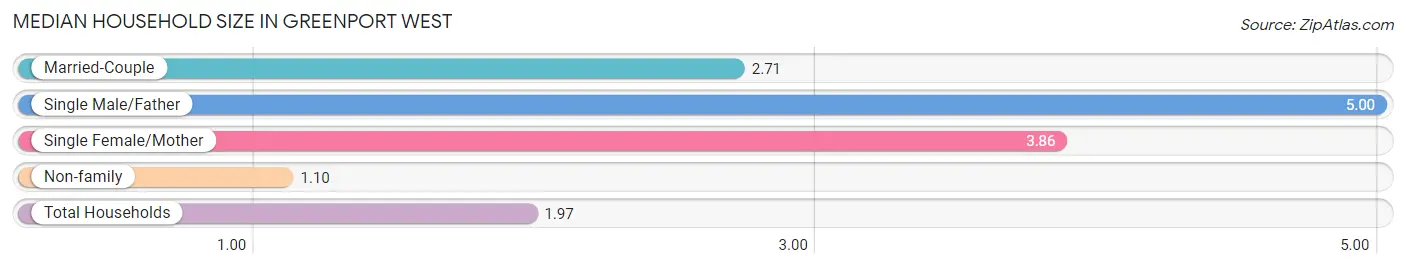
The median household size in Greenport West is 1.97 persons per household, with single male/father households (17 | 1.6%) accounting for the largest median household size of 5 persons per household. non-family households (556 | 51.6%) represent the smallest median household size with 1.10 persons per household.
| Household Type | # Households | Household Size |
| Married-Couple | 453 (42.1%) | 2.71 |
| Single Male/Father | 17 (1.6%) | 5.00 |
| Single Female/Mother | 51 (4.7%) | 3.86 |
| Non-family | 556 (51.6%) | 1.10 |
| Total Households | 1,077 (100.0%) | 1.97 |
Household Size by Marriage Status in Greenport West
Out of a total of 1,077 households in Greenport West, 521 (48.4%) are family households, while 556 (51.6%) are nonfamily households. The most numerous type of family households are 2-person households, comprising 306, and the most common type of nonfamily households are 1-person households, comprising 504.
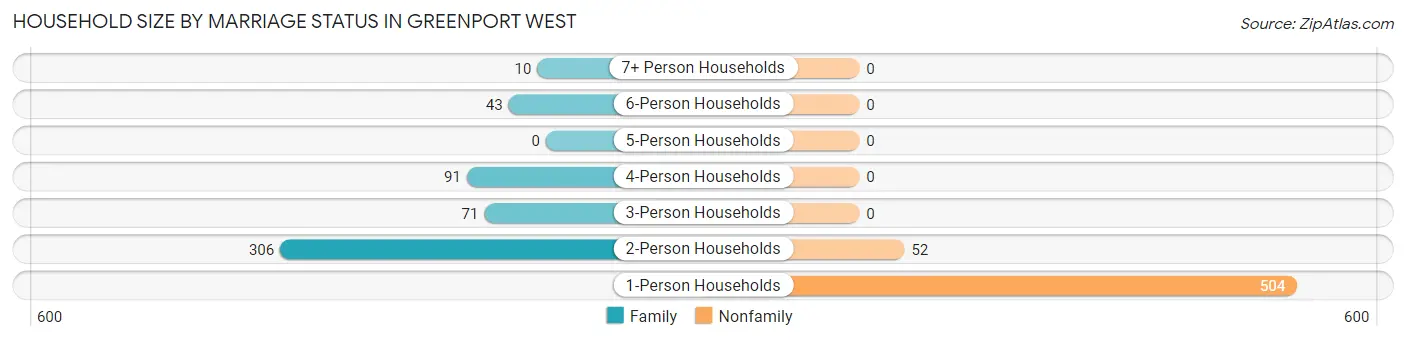
| Household Size | Family Households | Nonfamily Households |
| 1-Person Households | - | 504 (46.8%) |
| 2-Person Households | 306 (28.4%) | 52 (4.8%) |
| 3-Person Households | 71 (6.6%) | 0 (0.0%) |
| 4-Person Households | 91 (8.5%) | 0 (0.0%) |
| 5-Person Households | 0 (0.0%) | 0 (0.0%) |
| 6-Person Households | 43 (4.0%) | 0 (0.0%) |
| 7+ Person Households | 10 (0.9%) | 0 (0.0%) |
| Total | 521 (48.4%) | 556 (51.6%) |
Female Fertility in Greenport West
Fertility by Age in Greenport West
Average fertility rate in Greenport West is 31.0 births per 1,000 women. Women in the age bracket of 35 to 50 years have the highest fertility rate with 63.0 births per 1,000 women. Women in the age bracket of 35 to 50 years acount for 100.0% of all women with births.
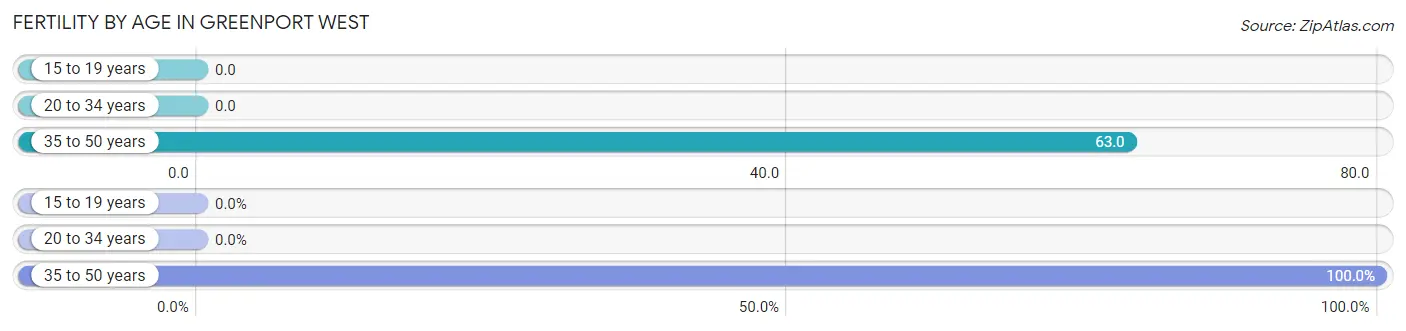
| Age Bracket | Women with Births | Births / 1,000 Women |
| 15 to 19 years | 0 (0.0%) | 0.0 |
| 20 to 34 years | 0 (0.0%) | 0.0 |
| 35 to 50 years | 9 (100.0%) | 63.0 |
| Total | 9 (100.0%) | 31.0 |
Fertility by Age by Marriage Status in Greenport West
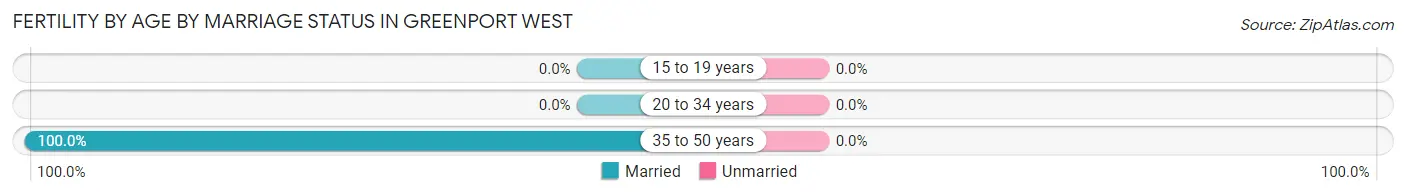
| Age Bracket | Married | Unmarried |
| 15 to 19 years | 0 (0.0%) | 0 (0.0%) |
| 20 to 34 years | 0 (0.0%) | 0 (0.0%) |
| 35 to 50 years | 9 (100.0%) | 0 (0.0%) |
| Total | 9 (100.0%) | 0 (0.0%) |
Fertility by Education in Greenport West
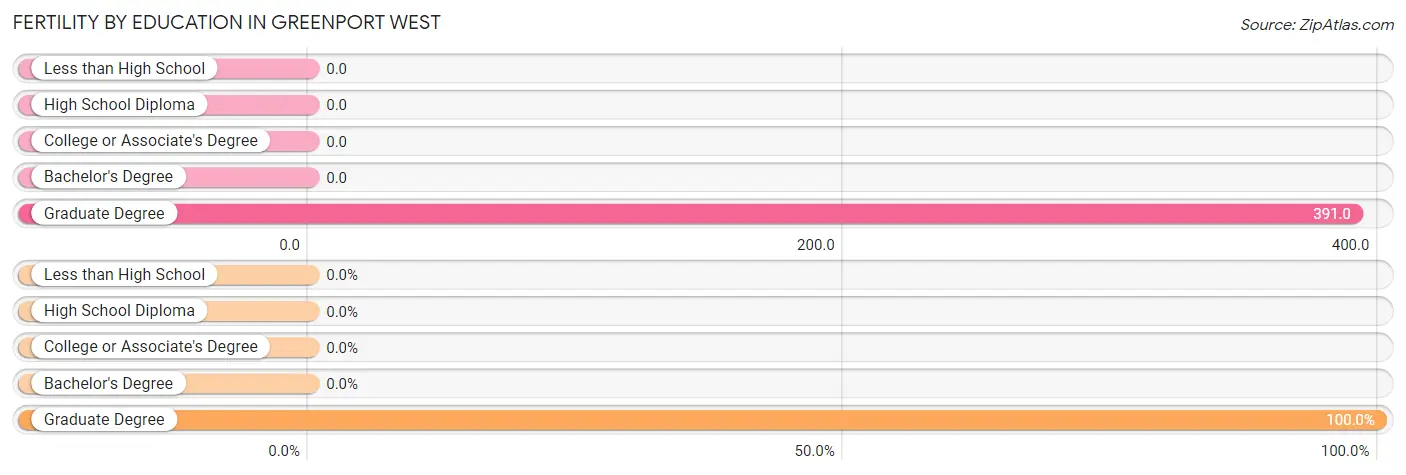
| Educational Attainment | Women with Births | Births / 1,000 Women |
| Less than High School | 0 (0.0%) | 0.0 |
| High School Diploma | 0 (0.0%) | 0.0 |
| College or Associate's Degree | 0 (0.0%) | 0.0 |
| Bachelor's Degree | 0 (0.0%) | 0.0 |
| Graduate Degree | 9 (100.0%) | 391.0 |
| Total | 9 (100.0%) | 31.0 |
Fertility by Education by Marriage Status in Greenport West
| Educational Attainment | Married | Unmarried |
| Less than High School | 0 (0.0%) | 0 (0.0%) |
| High School Diploma | 0 (0.0%) | 0 (0.0%) |
| College or Associate's Degree | 0 (0.0%) | 0 (0.0%) |
| Bachelor's Degree | 0 (0.0%) | 0 (0.0%) |
| Graduate Degree | 9 (100.0%) | 0 (0.0%) |
| Total | 9 (100.0%) | 0 (0.0%) |
Employment Characteristics in Greenport West
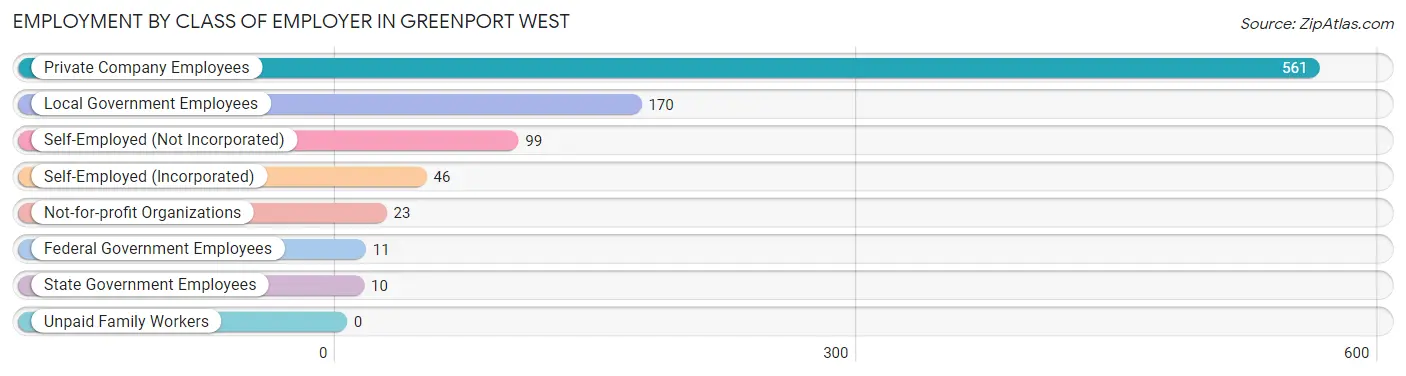
Employment by Class of Employer in Greenport West
Among the 920 employed individuals in Greenport West, private company employees (561 | 61.0%), local government employees (170 | 18.5%), and self-employed (not incorporated) (99 | 10.8%) make up the most common classes of employment.
| Employer Class | # Employees | % Employees |
| Private Company Employees | 561 | 61.0% |
| Self-Employed (Incorporated) | 46 | 5.0% |
| Self-Employed (Not Incorporated) | 99 | 10.8% |
| Not-for-profit Organizations | 23 | 2.5% |
| Local Government Employees | 170 | 18.5% |
| State Government Employees | 10 | 1.1% |
| Federal Government Employees | 11 | 1.2% |
| Unpaid Family Workers | 0 | 0.0% |
| Total | 920 | 100.0% |
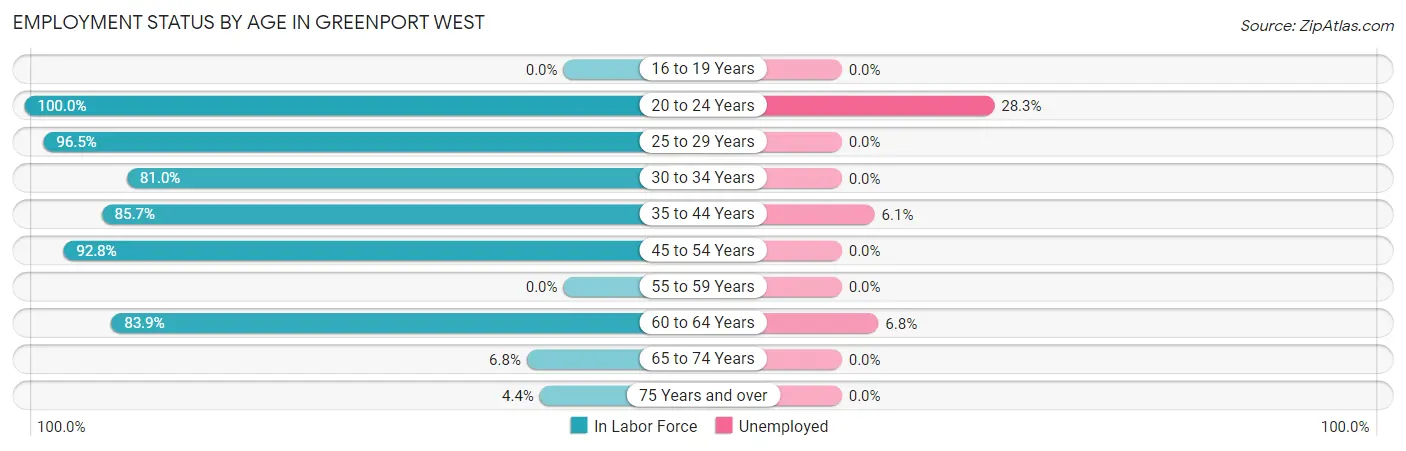
Employment Status by Age in Greenport West
According to the labor force statistics for Greenport West, out of the total population over 16 years of age (2,024), 48.9% or 990 individuals are in the labor force, with 7.0% or 69 of them unemployed. The age group with the highest labor force participation rate is 20 to 24 years, with 100.0% or 159 individuals in the labor force. Within the labor force, the 20 to 24 years age range has the highest percentage of unemployed individuals, with 28.3% or 45 of them being unemployed.
| Age Bracket | In Labor Force | Unemployed |
| 16 to 19 Years | 0 (0.0%) | 0 (0.0%) |
| 20 to 24 Years | 159 (100.0%) | 45 (28.3%) |
| 25 to 29 Years | 83 (96.5%) | 0 (0.0%) |
| 30 to 34 Years | 68 (81.0%) | 0 (0.0%) |
| 35 to 44 Years | 198 (85.7%) | 12 (6.1%) |
| 45 to 54 Years | 258 (92.8%) | 0 (0.0%) |
| 55 to 59 Years | 0 (0.0%) | 0 (0.0%) |
| 60 to 64 Years | 177 (83.9%) | 12 (6.8%) |
| 65 to 74 Years | 19 (6.8%) | 0 (0.0%) |
| 75 Years and over | 27 (4.4%) | 0 (0.0%) |
| Total | 990 (48.9%) | 69 (7.0%) |
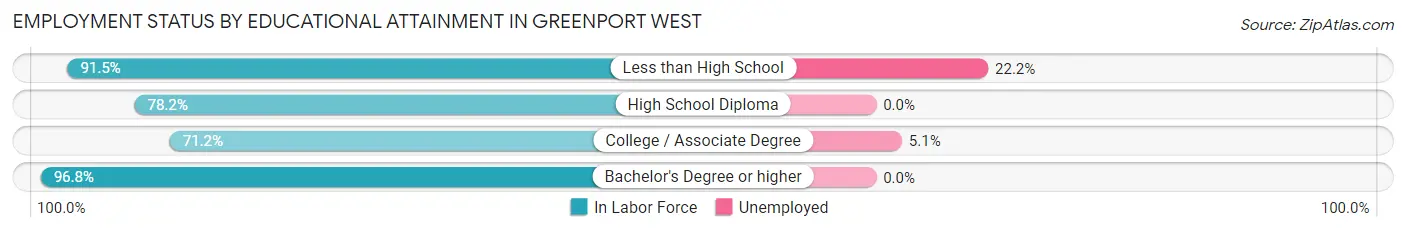
Employment Status by Educational Attainment in Greenport West
According to labor force statistics for Greenport West, 84.6% of individuals (784) out of the total population between 25 and 64 years of age (927) are in the labor force, with 3.1% or 24 of them being unemployed. The group with the highest labor force participation rate are those with the educational attainment of bachelor's degree or higher, with 96.8% or 389 individuals in the labor force. Within the labor force, individuals with less than high school education have the highest percentage of unemployment, with 22.2% or 12 of them being unemployed.
| Educational Attainment | In Labor Force | Unemployed |
| Less than High School | 54 (91.5%) | 13 (22.2%) |
| High School Diploma | 104 (78.2%) | 0 (0.0%) |
| College / Associate Degree | 237 (71.2%) | 17 (5.1%) |
| Bachelor's Degree or higher | 389 (96.8%) | 0 (0.0%) |
| Total | 784 (84.6%) | 29 (3.1%) |
Employment Occupations by Sex in Greenport West
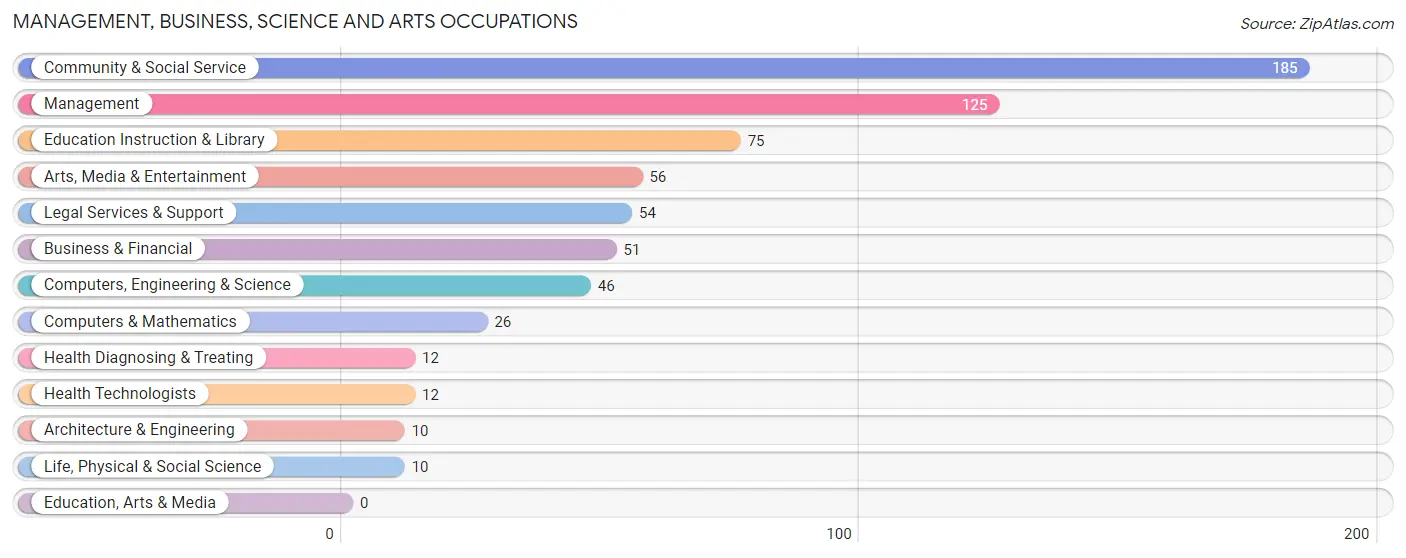
Management, Business, Science and Arts Occupations
The most common Management, Business, Science and Arts occupations in Greenport West are Community & Social Service (185 | 20.1%), Management (125 | 13.6%), Education Instruction & Library (75 | 8.2%), Arts, Media & Entertainment (56 | 6.1%), and Legal Services & Support (54 | 5.9%).
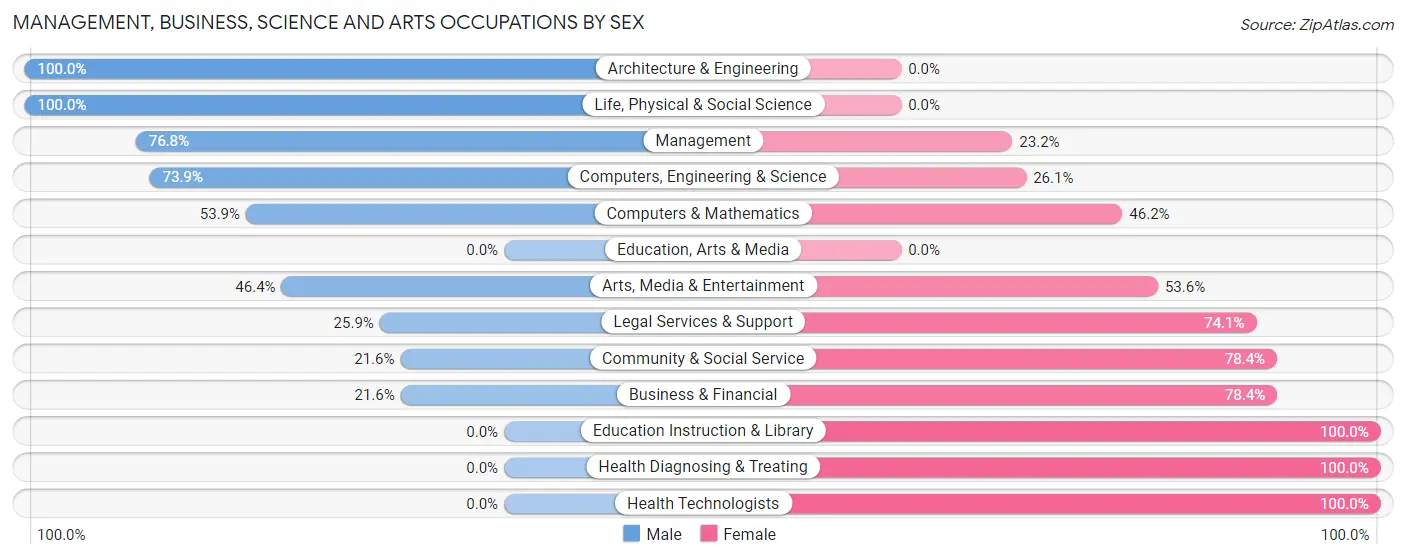
Management, Business, Science and Arts Occupations by Sex
Within the Management, Business, Science and Arts occupations in Greenport West, the most male-oriented occupations are Architecture & Engineering (100.0%), Life, Physical & Social Science (100.0%), and Management (76.8%), while the most female-oriented occupations are Education Instruction & Library (100.0%), Health Diagnosing & Treating (100.0%), and Health Technologists (100.0%).
| Occupation | Male | Female |
| Management | 96 (76.8%) | 29 (23.2%) |
| Business & Financial | 11 (21.6%) | 40 (78.4%) |
| Computers, Engineering & Science | 34 (73.9%) | 12 (26.1%) |
| Computers & Mathematics | 14 (53.8%) | 12 (46.2%) |
| Architecture & Engineering | 10 (100.0%) | 0 (0.0%) |
| Life, Physical & Social Science | 10 (100.0%) | 0 (0.0%) |
| Community & Social Service | 40 (21.6%) | 145 (78.4%) |
| Education, Arts & Media | 0 (0.0%) | 0 (0.0%) |
| Legal Services & Support | 14 (25.9%) | 40 (74.1%) |
| Education Instruction & Library | 0 (0.0%) | 75 (100.0%) |
| Arts, Media & Entertainment | 26 (46.4%) | 30 (53.6%) |
| Health Diagnosing & Treating | 0 (0.0%) | 12 (100.0%) |
| Health Technologists | 0 (0.0%) | 12 (100.0%) |
| Total (Category) | 181 (43.2%) | 238 (56.8%) |
| Total (Overall) | 555 (60.3%) | 365 (39.7%) |
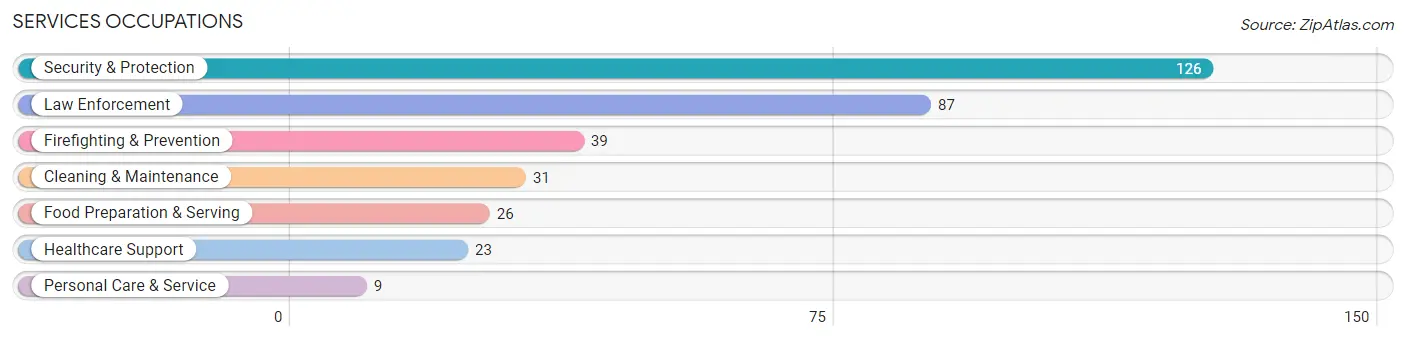
Services Occupations
The most common Services occupations in Greenport West are Security & Protection (126 | 13.7%), Law Enforcement (87 | 9.5%), Firefighting & Prevention (39 | 4.2%), Cleaning & Maintenance (31 | 3.4%), and Food Preparation & Serving (26 | 2.8%).
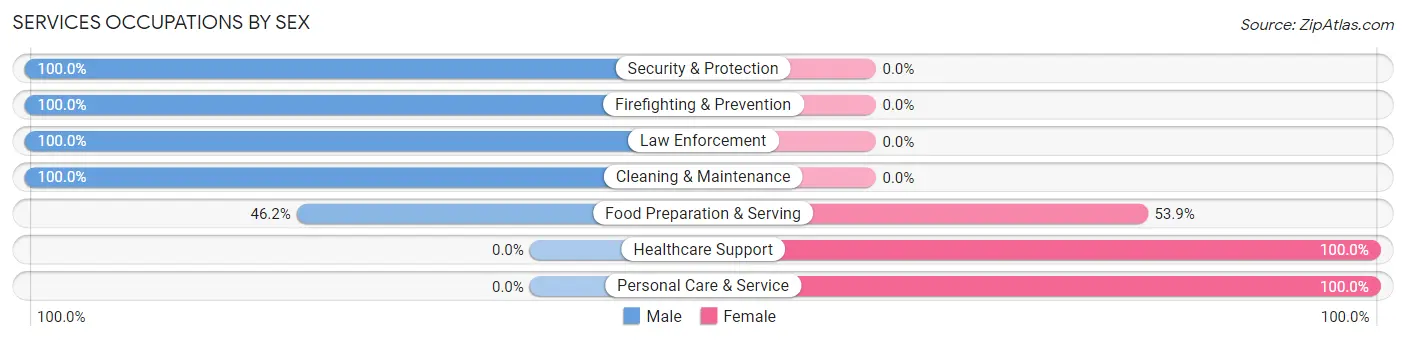
Services Occupations by Sex
Within the Services occupations in Greenport West, the most male-oriented occupations are Security & Protection (100.0%), Firefighting & Prevention (100.0%), and Law Enforcement (100.0%), while the most female-oriented occupations are Healthcare Support (100.0%), Personal Care & Service (100.0%), and Food Preparation & Serving (53.8%).
| Occupation | Male | Female |
| Healthcare Support | 0 (0.0%) | 23 (100.0%) |
| Security & Protection | 126 (100.0%) | 0 (0.0%) |
| Firefighting & Prevention | 39 (100.0%) | 0 (0.0%) |
| Law Enforcement | 87 (100.0%) | 0 (0.0%) |
| Food Preparation & Serving | 12 (46.2%) | 14 (53.8%) |
| Cleaning & Maintenance | 31 (100.0%) | 0 (0.0%) |
| Personal Care & Service | 0 (0.0%) | 9 (100.0%) |
| Total (Category) | 169 (78.6%) | 46 (21.4%) |
| Total (Overall) | 555 (60.3%) | 365 (39.7%) |
Sales and Office Occupations
The most common Sales and Office occupations in Greenport West are Office & Administration (71 | 7.7%), and Sales & Related (21 | 2.3%).
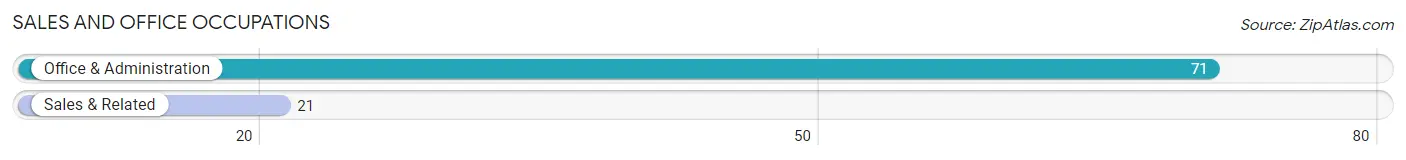
Sales and Office Occupations by Sex
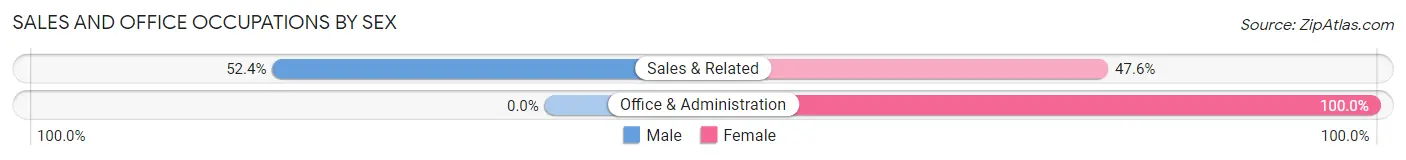
| Occupation | Male | Female |
| Sales & Related | 11 (52.4%) | 10 (47.6%) |
| Office & Administration | 0 (0.0%) | 71 (100.0%) |
| Total (Category) | 11 (12.0%) | 81 (88.0%) |
| Total (Overall) | 555 (60.3%) | 365 (39.7%) |
Natural Resources, Construction and Maintenance Occupations
The most common Natural Resources, Construction and Maintenance occupations in Greenport West are Construction & Extraction (59 | 6.4%), and Installation, Maintenance & Repair (28 | 3.0%).
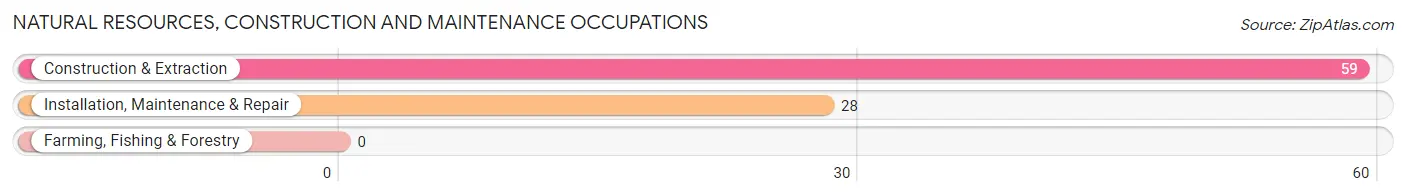
Natural Resources, Construction and Maintenance Occupations by Sex
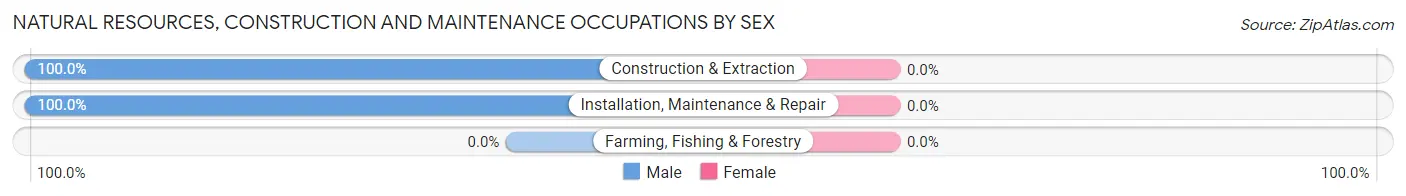
| Occupation | Male | Female |
| Farming, Fishing & Forestry | 0 (0.0%) | 0 (0.0%) |
| Construction & Extraction | 59 (100.0%) | 0 (0.0%) |
| Installation, Maintenance & Repair | 28 (100.0%) | 0 (0.0%) |
| Total (Category) | 87 (100.0%) | 0 (0.0%) |
| Total (Overall) | 555 (60.3%) | 365 (39.7%) |
Production, Transportation and Moving Occupations
The most common Production, Transportation and Moving occupations in Greenport West are Transportation (80 | 8.7%), Production (14 | 1.5%), and Material Moving (13 | 1.4%).
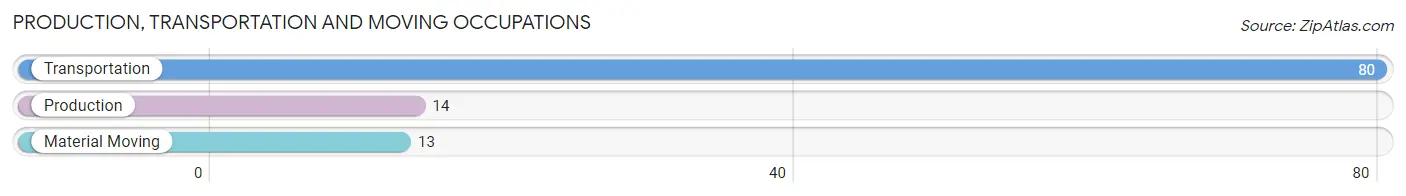
Production, Transportation and Moving Occupations by Sex
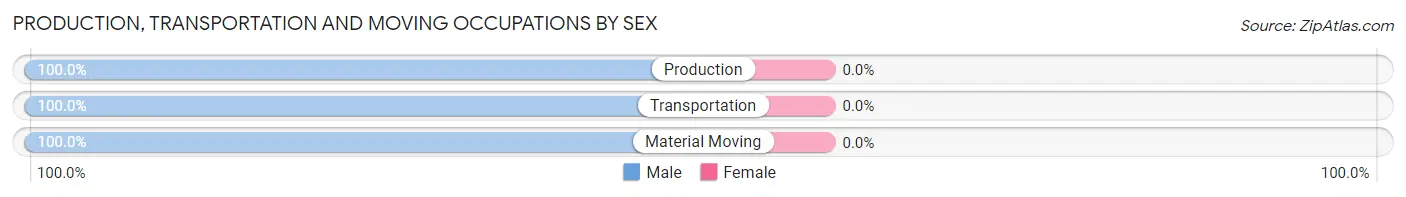
| Occupation | Male | Female |
| Production | 14 (100.0%) | 0 (0.0%) |
| Transportation | 80 (100.0%) | 0 (0.0%) |
| Material Moving | 13 (100.0%) | 0 (0.0%) |
| Total (Category) | 107 (100.0%) | 0 (0.0%) |
| Total (Overall) | 555 (60.3%) | 365 (39.7%) |
Employment Industries by Sex in Greenport West
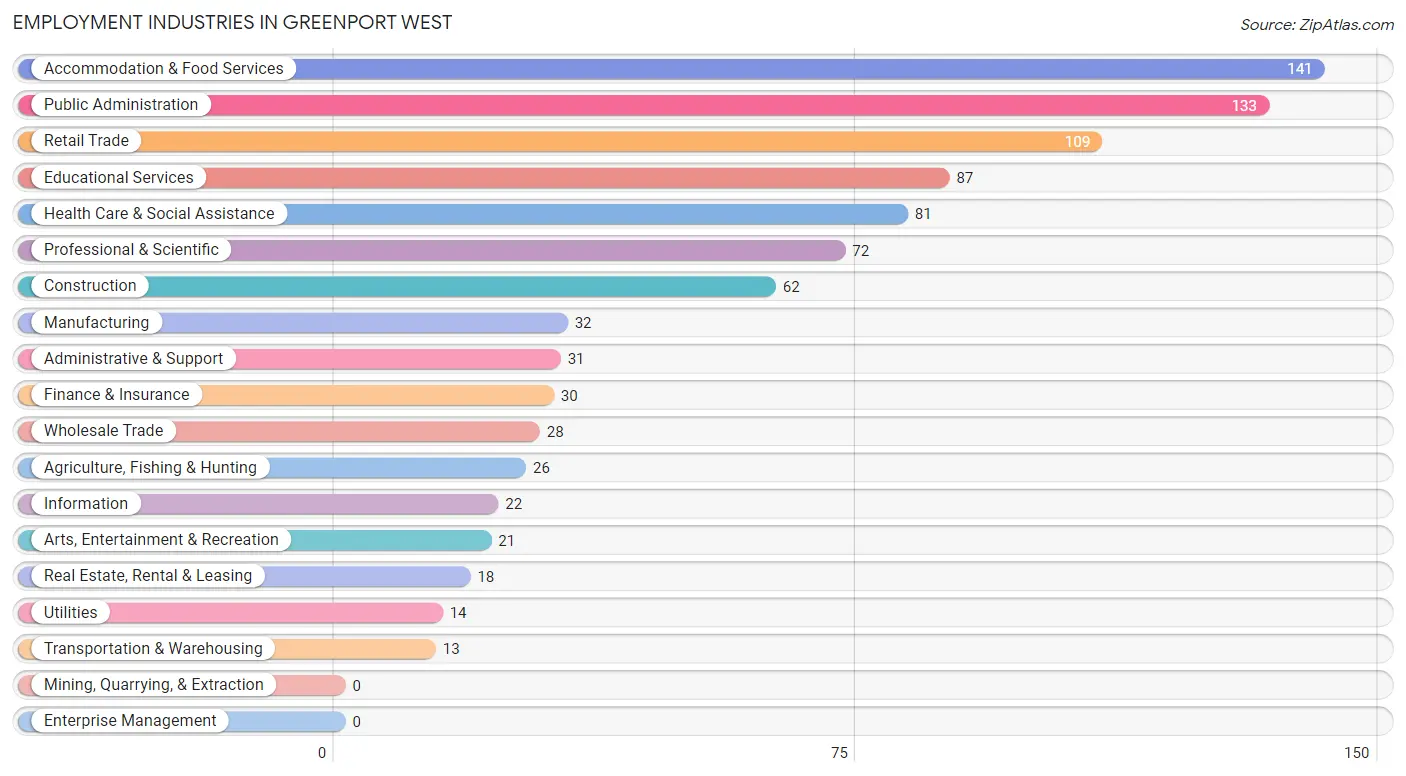
Employment Industries in Greenport West
The major employment industries in Greenport West include Accommodation & Food Services (141 | 15.3%), Public Administration (133 | 14.5%), Retail Trade (109 | 11.8%), Educational Services (87 | 9.5%), and Health Care & Social Assistance (81 | 8.8%).
Employment Industries by Sex in Greenport West
The Greenport West industries that see more men than women are Wholesale Trade (100.0%), Transportation & Warehousing (100.0%), and Utilities (100.0%), whereas the industries that tend to have a higher number of women are Educational Services (100.0%), Accommodation & Food Services (61.7%), and Arts, Entertainment & Recreation (57.1%).
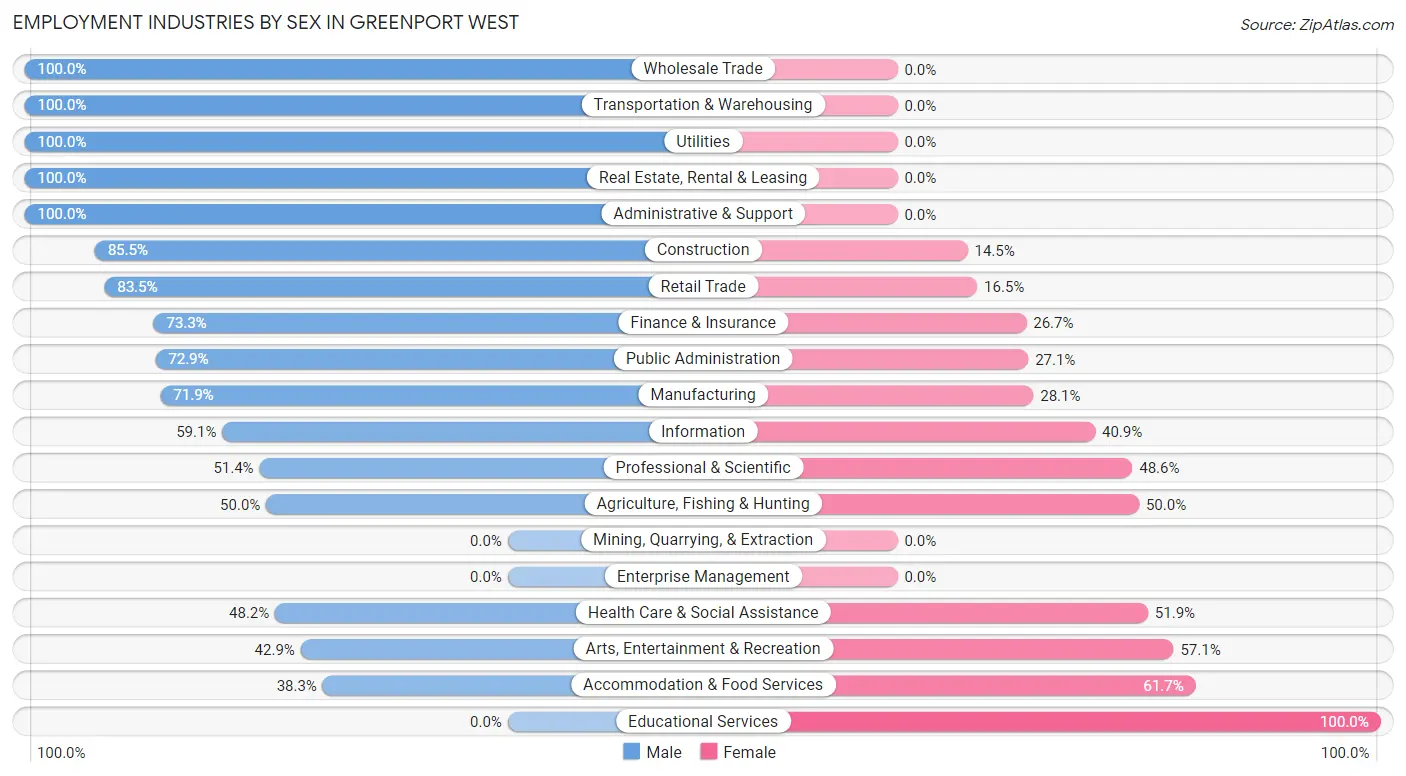
| Industry | Male | Female |
| Agriculture, Fishing & Hunting | 13 (50.0%) | 13 (50.0%) |
| Mining, Quarrying, & Extraction | 0 (0.0%) | 0 (0.0%) |
| Construction | 53 (85.5%) | 9 (14.5%) |
| Manufacturing | 23 (71.9%) | 9 (28.1%) |
| Wholesale Trade | 28 (100.0%) | 0 (0.0%) |
| Retail Trade | 91 (83.5%) | 18 (16.5%) |
| Transportation & Warehousing | 13 (100.0%) | 0 (0.0%) |
| Utilities | 14 (100.0%) | 0 (0.0%) |
| Information | 13 (59.1%) | 9 (40.9%) |
| Finance & Insurance | 22 (73.3%) | 8 (26.7%) |
| Real Estate, Rental & Leasing | 18 (100.0%) | 0 (0.0%) |
| Professional & Scientific | 37 (51.4%) | 35 (48.6%) |
| Enterprise Management | 0 (0.0%) | 0 (0.0%) |
| Administrative & Support | 31 (100.0%) | 0 (0.0%) |
| Educational Services | 0 (0.0%) | 87 (100.0%) |
| Health Care & Social Assistance | 39 (48.1%) | 42 (51.8%) |
| Arts, Entertainment & Recreation | 9 (42.9%) | 12 (57.1%) |
| Accommodation & Food Services | 54 (38.3%) | 87 (61.7%) |
| Public Administration | 97 (72.9%) | 36 (27.1%) |
| Total | 555 (60.3%) | 365 (39.7%) |
Education in Greenport West
School Enrollment in Greenport West
The most common levels of schooling among the 302 students in Greenport West are middle school (84 | 27.8%), high school (69 | 22.9%), and elementary school (57 | 18.9%).
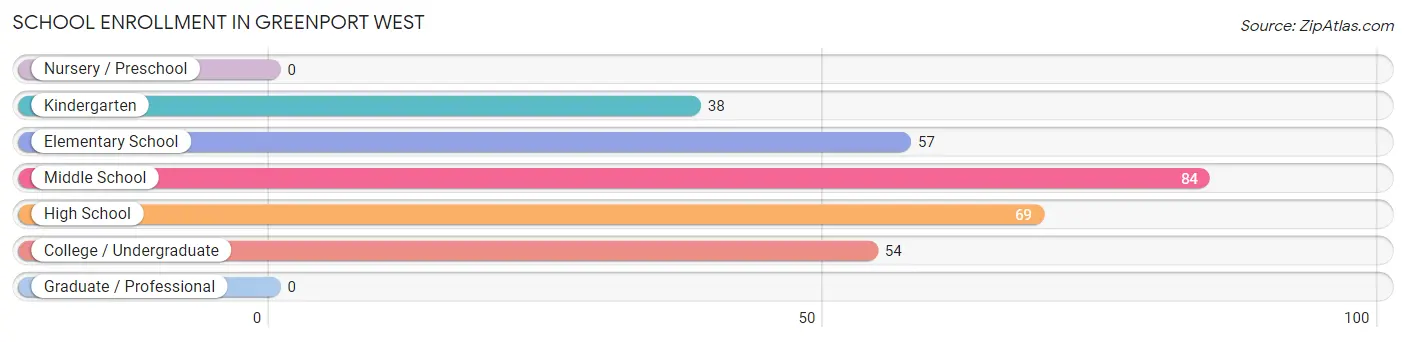
| School Level | # Students | % Students |
| Nursery / Preschool | 0 | 0.0% |
| Kindergarten | 38 | 12.6% |
| Elementary School | 57 | 18.9% |
| Middle School | 84 | 27.8% |
| High School | 69 | 22.9% |
| College / Undergraduate | 54 | 17.9% |
| Graduate / Professional | 0 | 0.0% |
| Total | 302 | 100.0% |
School Enrollment by Age by Funding Source in Greenport West
Out of a total of 302 students who are enrolled in schools in Greenport West, 183 (60.6%) attend a private institution, while the remaining 119 (39.4%) are enrolled in public schools. The age group of 20 to 24 year olds has the highest likelihood of being enrolled in private schools, with 45 (100.0% in the age bracket) enrolled. Conversely, the age group of 35 years and over has the lowest likelihood of being enrolled in a private school, with 20 (100.0% in the age bracket) attending a public institution.
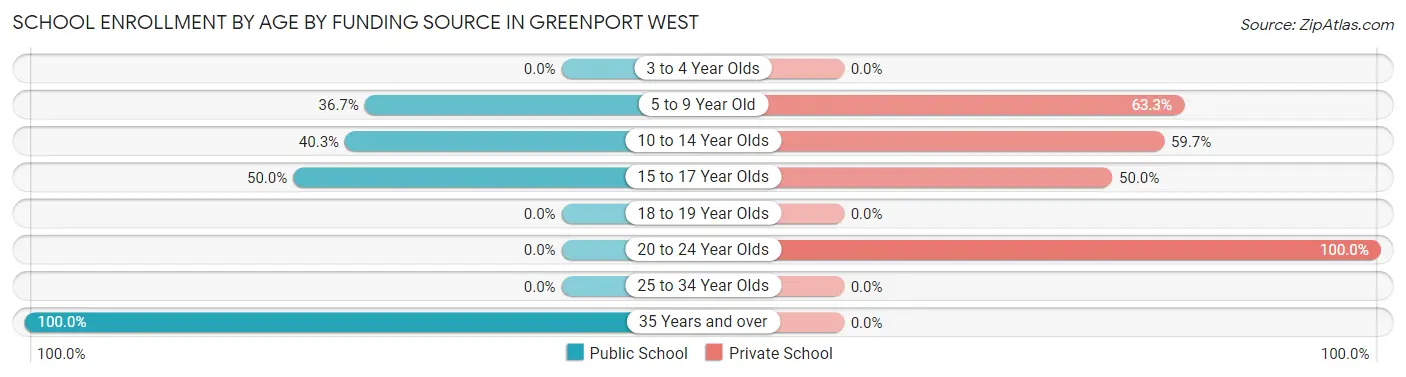
| Age Bracket | Public School | Private School |
| 3 to 4 Year Olds | 0 (0.0%) | 0 (0.0%) |
| 5 to 9 Year Old | 22 (36.7%) | 38 (63.3%) |
| 10 to 14 Year Olds | 48 (40.3%) | 71 (59.7%) |
| 15 to 17 Year Olds | 29 (50.0%) | 29 (50.0%) |
| 18 to 19 Year Olds | 0 (0.0%) | 0 (0.0%) |
| 20 to 24 Year Olds | 0 (0.0%) | 45 (100.0%) |
| 25 to 34 Year Olds | 0 (0.0%) | 0 (0.0%) |
| 35 Years and over | 20 (100.0%) | 0 (0.0%) |
| Total | 119 (39.4%) | 183 (60.6%) |
Educational Attainment by Field of Study in Greenport West
Business (160 | 18.2%), arts & humanities (118 | 13.4%), social sciences (99 | 11.2%), education (96 | 10.9%), and science & technology (83 | 9.4%) are the most common fields of study among 881 individuals in Greenport West who have obtained a bachelor's degree or higher.
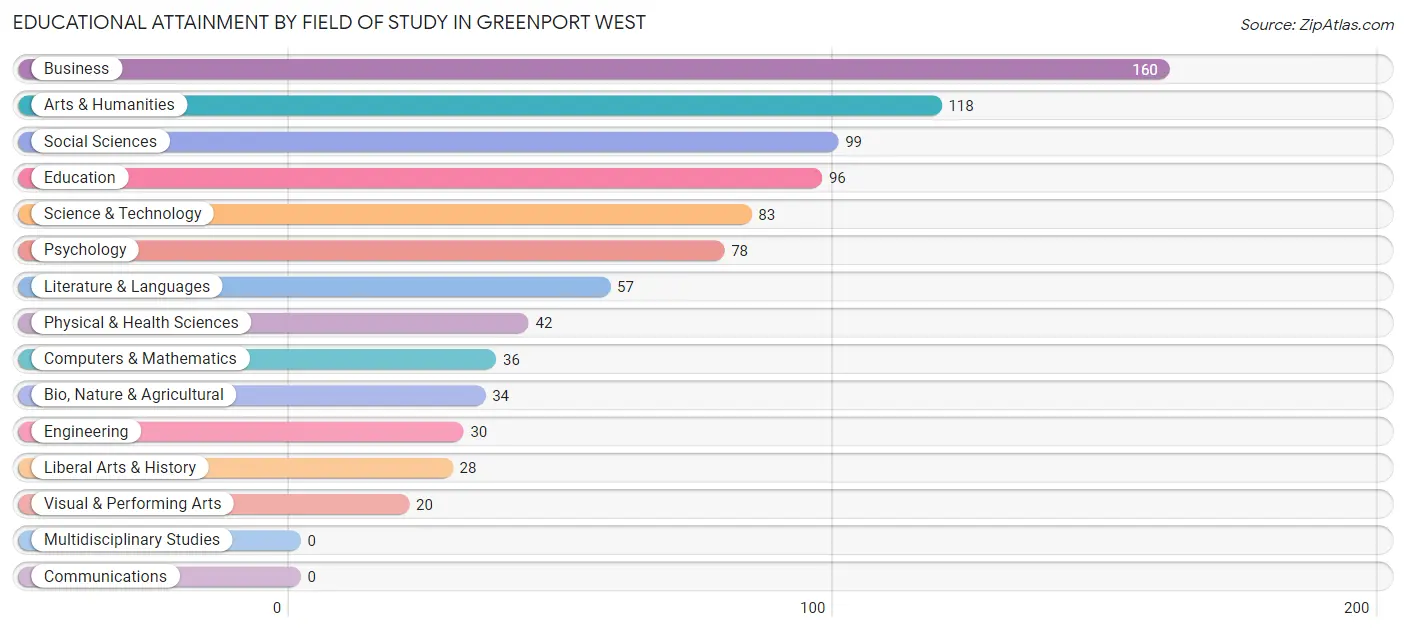
| Field of Study | # Graduates | % Graduates |
| Computers & Mathematics | 36 | 4.1% |
| Bio, Nature & Agricultural | 34 | 3.9% |
| Physical & Health Sciences | 42 | 4.8% |
| Psychology | 78 | 8.8% |
| Social Sciences | 99 | 11.2% |
| Engineering | 30 | 3.4% |
| Multidisciplinary Studies | 0 | 0.0% |
| Science & Technology | 83 | 9.4% |
| Business | 160 | 18.2% |
| Education | 96 | 10.9% |
| Literature & Languages | 57 | 6.5% |
| Liberal Arts & History | 28 | 3.2% |
| Visual & Performing Arts | 20 | 2.3% |
| Communications | 0 | 0.0% |
| Arts & Humanities | 118 | 13.4% |
| Total | 881 | 100.0% |
Transportation & Commute in Greenport West
Vehicle Availability by Sex in Greenport West
The most prevalent vehicle ownership categories in Greenport West are males with 2 vehicles (220, accounting for 39.6%) and females with 2 vehicles (154, making up 60.3%).
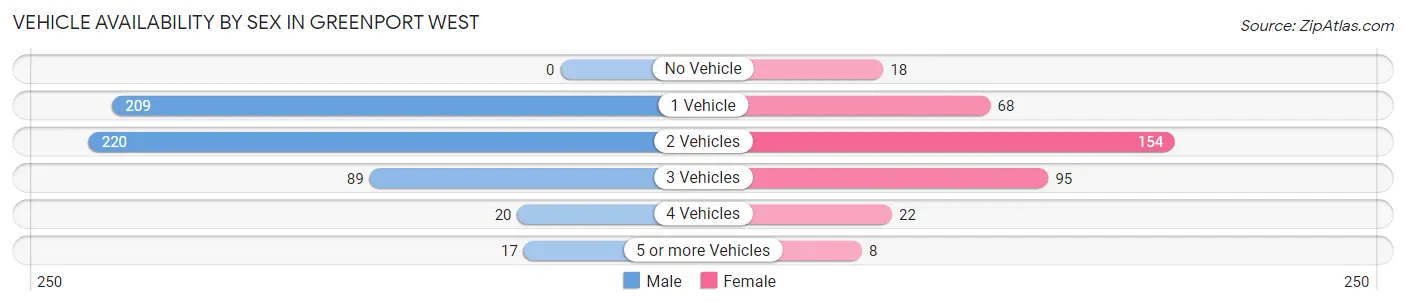
| Vehicles Available | Male | Female |
| No Vehicle | 0 (0.0%) | 18 (4.9%) |
| 1 Vehicle | 209 (37.7%) | 68 (18.6%) |
| 2 Vehicles | 220 (39.6%) | 154 (42.2%) |
| 3 Vehicles | 89 (16.0%) | 95 (26.0%) |
| 4 Vehicles | 20 (3.6%) | 22 (6.0%) |
| 5 or more Vehicles | 17 (3.1%) | 8 (2.2%) |
| Total | 555 (100.0%) | 365 (100.0%) |
Commute Time in Greenport West
The most frequently occuring commute durations in Greenport West are 15 to 19 minutes (173 commuters, 21.3%), less than 5 minutes (151 commuters, 18.6%), and 5 to 9 minutes (149 commuters, 18.4%).
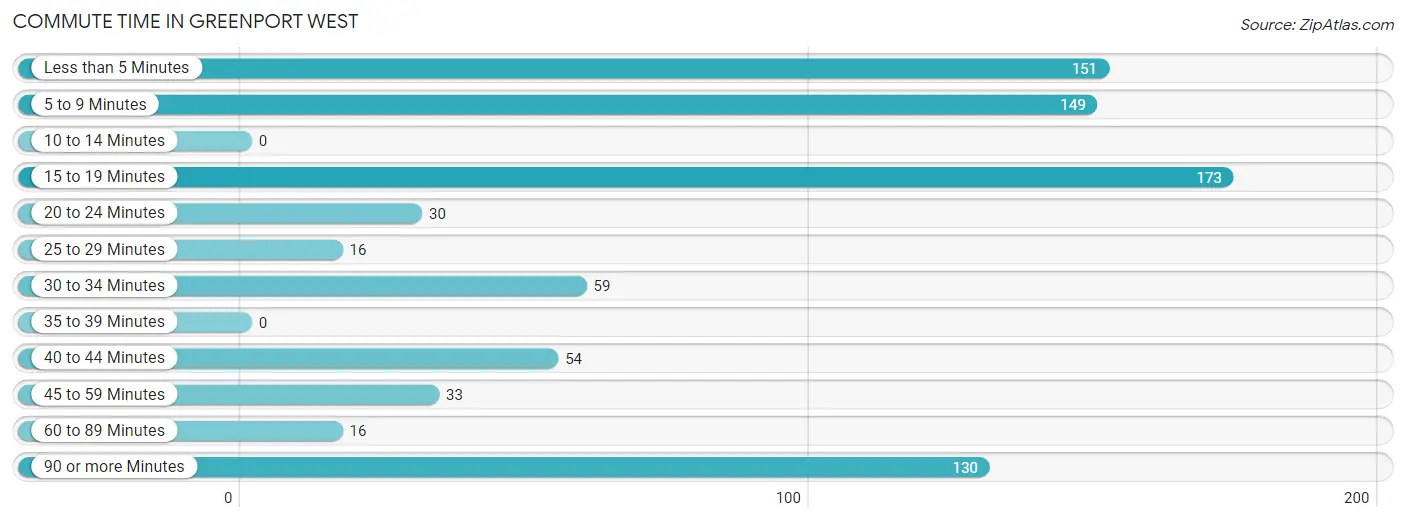
| Commute Time | # Commuters | % Commuters |
| Less than 5 Minutes | 151 | 18.6% |
| 5 to 9 Minutes | 149 | 18.4% |
| 10 to 14 Minutes | 0 | 0.0% |
| 15 to 19 Minutes | 173 | 21.3% |
| 20 to 24 Minutes | 30 | 3.7% |
| 25 to 29 Minutes | 16 | 2.0% |
| 30 to 34 Minutes | 59 | 7.3% |
| 35 to 39 Minutes | 0 | 0.0% |
| 40 to 44 Minutes | 54 | 6.7% |
| 45 to 59 Minutes | 33 | 4.1% |
| 60 to 89 Minutes | 16 | 2.0% |
| 90 or more Minutes | 130 | 16.0% |
Commute Time by Sex in Greenport West
The most common commute times in Greenport West are 15 to 19 minutes (155 commuters, 29.4%) for males and 5 to 9 minutes (81 commuters, 28.6%) for females.
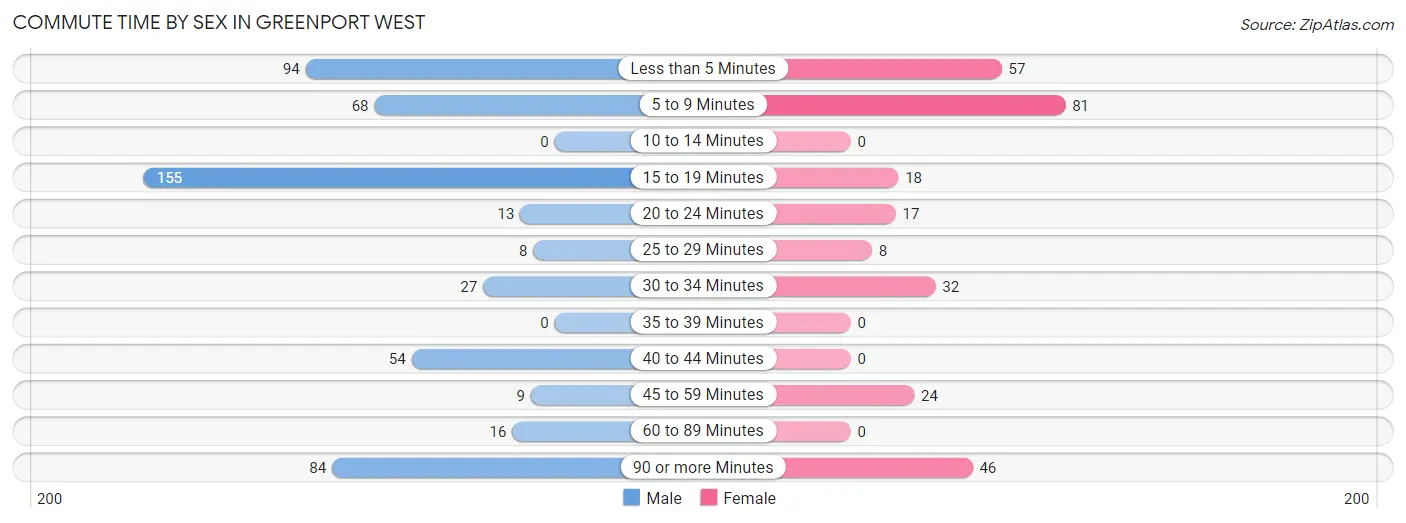
| Commute Time | Male | Female |
| Less than 5 Minutes | 94 (17.8%) | 57 (20.1%) |
| 5 to 9 Minutes | 68 (12.9%) | 81 (28.6%) |
| 10 to 14 Minutes | 0 (0.0%) | 0 (0.0%) |
| 15 to 19 Minutes | 155 (29.4%) | 18 (6.4%) |
| 20 to 24 Minutes | 13 (2.5%) | 17 (6.0%) |
| 25 to 29 Minutes | 8 (1.5%) | 8 (2.8%) |
| 30 to 34 Minutes | 27 (5.1%) | 32 (11.3%) |
| 35 to 39 Minutes | 0 (0.0%) | 0 (0.0%) |
| 40 to 44 Minutes | 54 (10.2%) | 0 (0.0%) |
| 45 to 59 Minutes | 9 (1.7%) | 24 (8.5%) |
| 60 to 89 Minutes | 16 (3.0%) | 0 (0.0%) |
| 90 or more Minutes | 84 (15.9%) | 46 (16.3%) |
Time of Departure to Work by Sex in Greenport West
The most frequent times of departure to work in Greenport West are 6:30 AM to 6:59 AM (104, 19.7%) for males and 12:00 PM to 3:59 PM (87, 30.7%) for females.
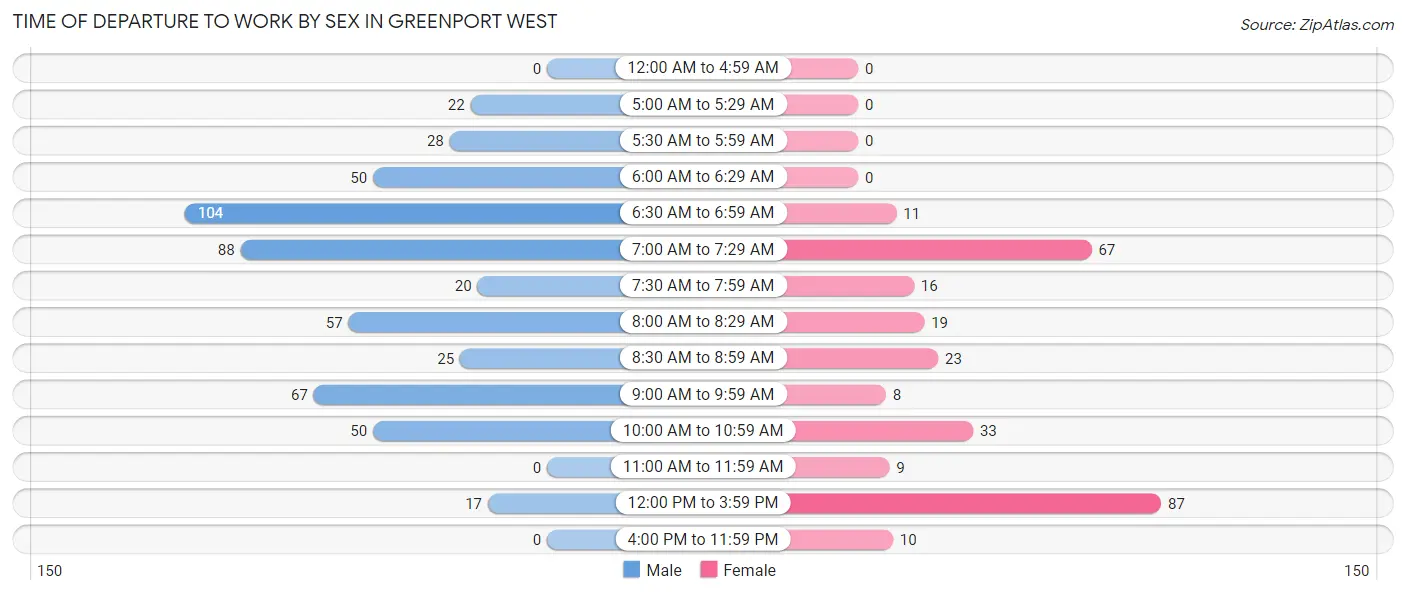
| Time of Departure | Male | Female |
| 12:00 AM to 4:59 AM | 0 (0.0%) | 0 (0.0%) |
| 5:00 AM to 5:29 AM | 22 (4.2%) | 0 (0.0%) |
| 5:30 AM to 5:59 AM | 28 (5.3%) | 0 (0.0%) |
| 6:00 AM to 6:29 AM | 50 (9.5%) | 0 (0.0%) |
| 6:30 AM to 6:59 AM | 104 (19.7%) | 11 (3.9%) |
| 7:00 AM to 7:29 AM | 88 (16.7%) | 67 (23.7%) |
| 7:30 AM to 7:59 AM | 20 (3.8%) | 16 (5.7%) |
| 8:00 AM to 8:29 AM | 57 (10.8%) | 19 (6.7%) |
| 8:30 AM to 8:59 AM | 25 (4.7%) | 23 (8.1%) |
| 9:00 AM to 9:59 AM | 67 (12.7%) | 8 (2.8%) |
| 10:00 AM to 10:59 AM | 50 (9.5%) | 33 (11.7%) |
| 11:00 AM to 11:59 AM | 0 (0.0%) | 9 (3.2%) |
| 12:00 PM to 3:59 PM | 17 (3.2%) | 87 (30.7%) |
| 4:00 PM to 11:59 PM | 0 (0.0%) | 10 (3.5%) |
| Total | 528 (100.0%) | 283 (100.0%) |
Housing Occupancy in Greenport West
Occupancy by Ownership in Greenport West
Of the total 1,077 dwellings in Greenport West, owner-occupied units account for 867 (80.5%), while renter-occupied units make up 210 (19.5%).
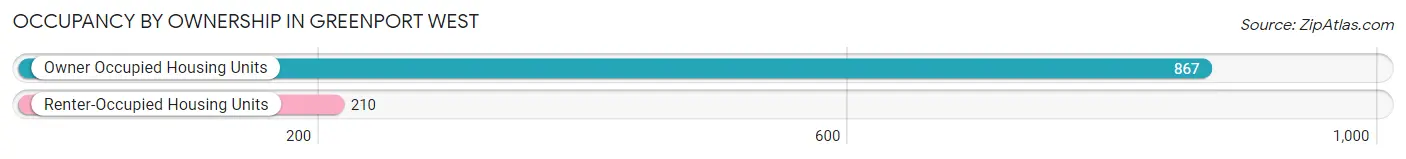
| Occupancy | # Housing Units | % Housing Units |
| Owner Occupied Housing Units | 867 | 80.5% |
| Renter-Occupied Housing Units | 210 | 19.5% |
| Total Occupied Housing Units | 1,077 | 100.0% |
Occupancy by Household Size in Greenport West
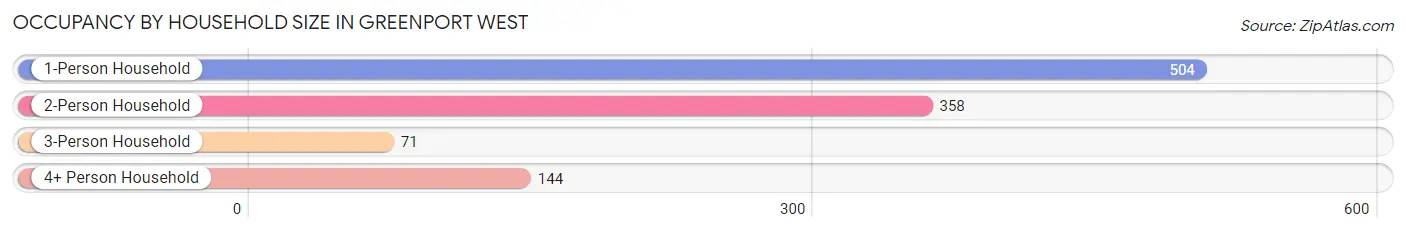
| Household Size | # Housing Units | % Housing Units |
| 1-Person Household | 504 | 46.8% |
| 2-Person Household | 358 | 33.2% |
| 3-Person Household | 71 | 6.6% |
| 4+ Person Household | 144 | 13.4% |
| Total Housing Units | 1,077 | 100.0% |
Occupancy by Ownership by Household Size in Greenport West
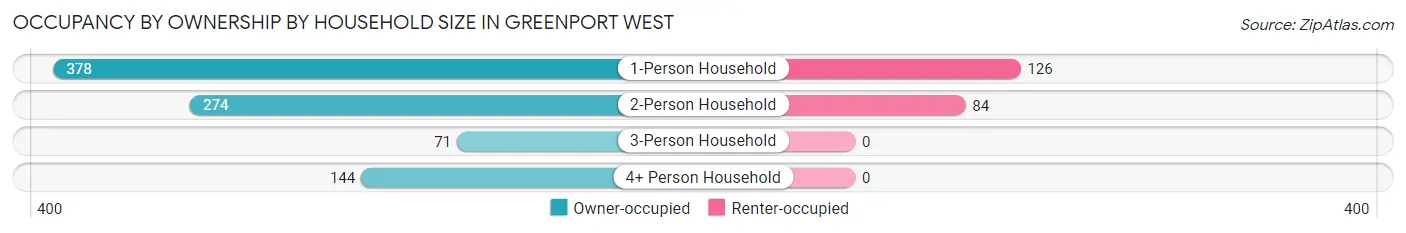
| Household Size | Owner-occupied | Renter-occupied |
| 1-Person Household | 378 (75.0%) | 126 (25.0%) |
| 2-Person Household | 274 (76.5%) | 84 (23.5%) |
| 3-Person Household | 71 (100.0%) | 0 (0.0%) |
| 4+ Person Household | 144 (100.0%) | 0 (0.0%) |
| Total Housing Units | 867 (80.5%) | 210 (19.5%) |
Occupancy by Educational Attainment in Greenport West
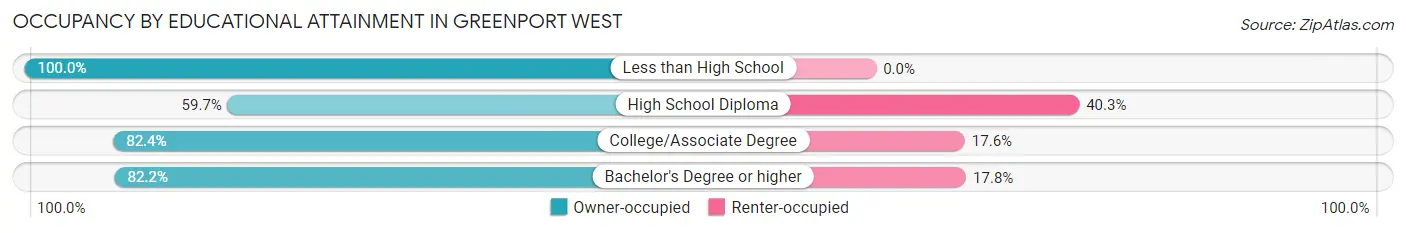
| Household Size | Owner-occupied | Renter-occupied |
| Less than High School | 89 (100.0%) | 0 (0.0%) |
| High School Diploma | 92 (59.7%) | 62 (40.3%) |
| College/Associate Degree | 253 (82.4%) | 54 (17.6%) |
| Bachelor's Degree or higher | 433 (82.2%) | 94 (17.8%) |
Occupancy by Age of Householder in Greenport West
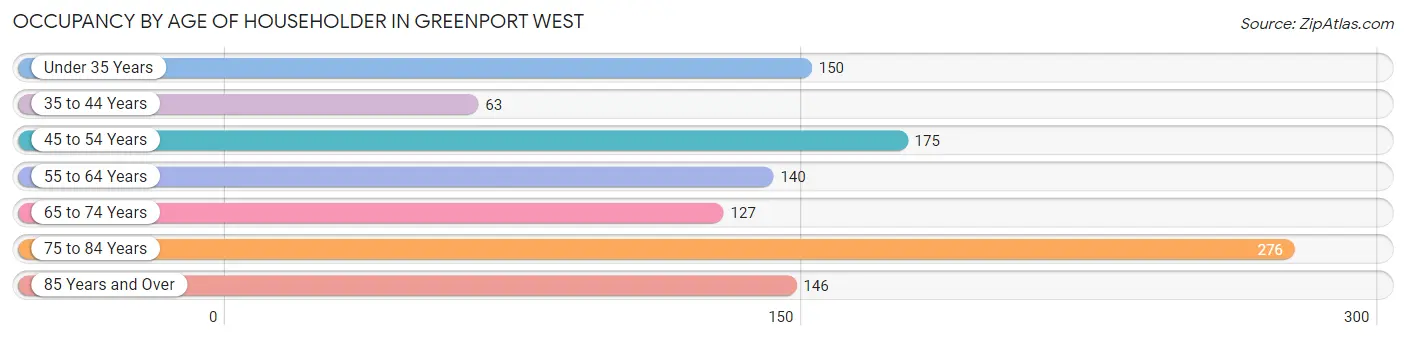
| Age Bracket | # Households | % Households |
| Under 35 Years | 150 | 13.9% |
| 35 to 44 Years | 63 | 5.9% |
| 45 to 54 Years | 175 | 16.3% |
| 55 to 64 Years | 140 | 13.0% |
| 65 to 74 Years | 127 | 11.8% |
| 75 to 84 Years | 276 | 25.6% |
| 85 Years and Over | 146 | 13.6% |
| Total | 1,077 | 100.0% |
Housing Finances in Greenport West
Median Income by Occupancy in Greenport West
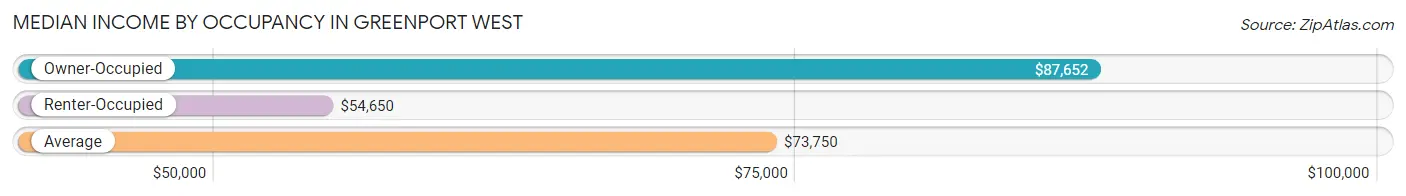
| Occupancy Type | # Households | Median Income |
| Owner-Occupied | 867 (80.5%) | $87,652 |
| Renter-Occupied | 210 (19.5%) | $54,650 |
| Average | 1,077 (100.0%) | $73,750 |
Occupancy by Householder Income Bracket in Greenport West
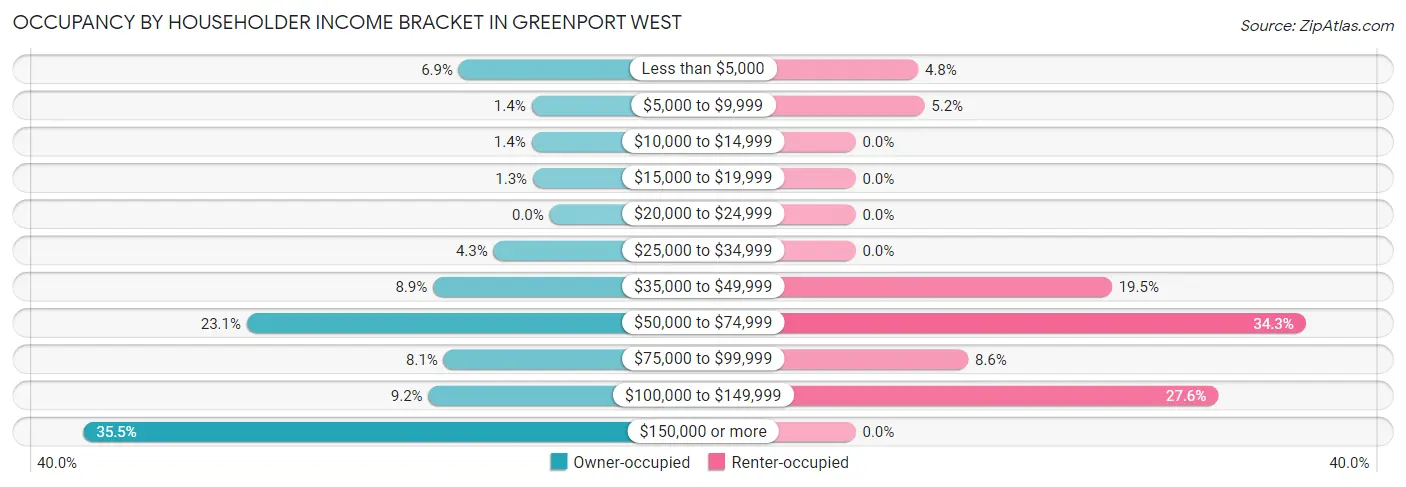
| Income Bracket | Owner-occupied | Renter-occupied |
| Less than $5,000 | 60 (6.9%) | 10 (4.8%) |
| $5,000 to $9,999 | 12 (1.4%) | 11 (5.2%) |
| $10,000 to $14,999 | 12 (1.4%) | 0 (0.0%) |
| $15,000 to $19,999 | 11 (1.3%) | 0 (0.0%) |
| $20,000 to $24,999 | 0 (0.0%) | 0 (0.0%) |
| $25,000 to $34,999 | 37 (4.3%) | 0 (0.0%) |
| $35,000 to $49,999 | 77 (8.9%) | 41 (19.5%) |
| $50,000 to $74,999 | 200 (23.1%) | 72 (34.3%) |
| $75,000 to $99,999 | 70 (8.1%) | 18 (8.6%) |
| $100,000 to $149,999 | 80 (9.2%) | 58 (27.6%) |
| $150,000 or more | 308 (35.5%) | 0 (0.0%) |
| Total | 867 (100.0%) | 210 (100.0%) |
Monthly Housing Cost Tiers in Greenport West
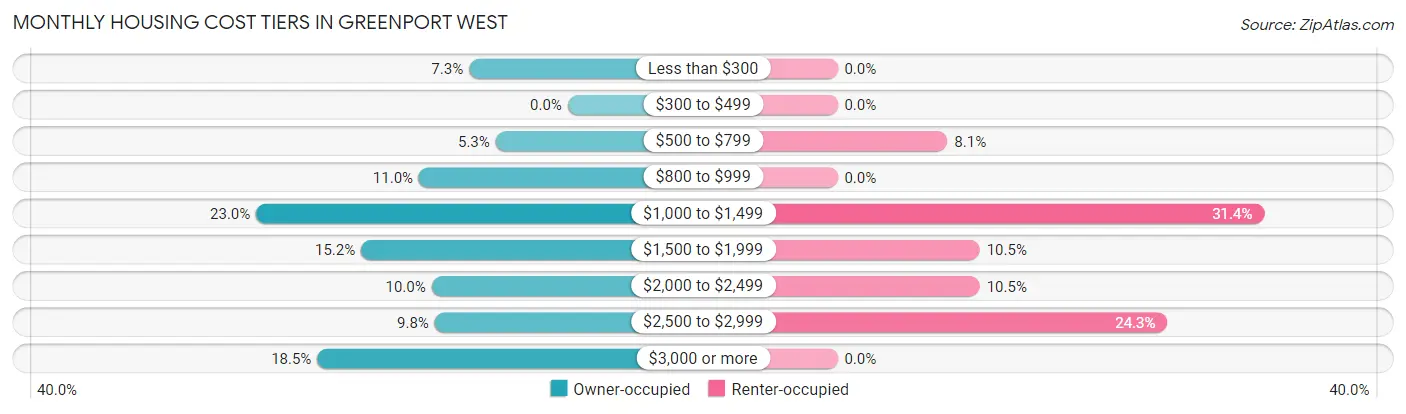
| Monthly Cost | Owner-occupied | Renter-occupied |
| Less than $300 | 63 (7.3%) | 0 (0.0%) |
| $300 to $499 | 0 (0.0%) | 0 (0.0%) |
| $500 to $799 | 46 (5.3%) | 17 (8.1%) |
| $800 to $999 | 95 (11.0%) | 0 (0.0%) |
| $1,000 to $1,499 | 199 (23.0%) | 66 (31.4%) |
| $1,500 to $1,999 | 132 (15.2%) | 22 (10.5%) |
| $2,000 to $2,499 | 87 (10.0%) | 22 (10.5%) |
| $2,500 to $2,999 | 85 (9.8%) | 51 (24.3%) |
| $3,000 or more | 160 (18.4%) | 0 (0.0%) |
| Total | 867 (100.0%) | 210 (100.0%) |
Physical Housing Characteristics in Greenport West
Housing Structures in Greenport West
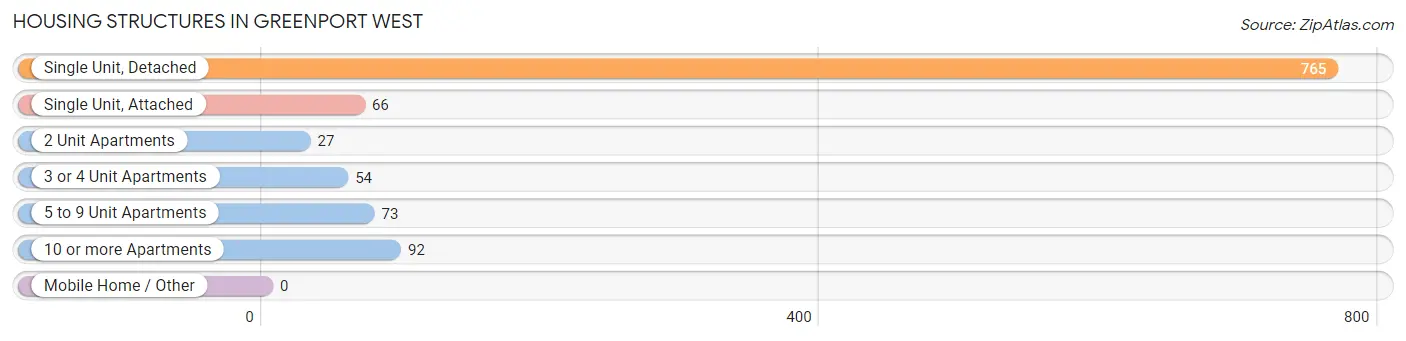
| Structure Type | # Housing Units | % Housing Units |
| Single Unit, Detached | 765 | 71.0% |
| Single Unit, Attached | 66 | 6.1% |
| 2 Unit Apartments | 27 | 2.5% |
| 3 or 4 Unit Apartments | 54 | 5.0% |
| 5 to 9 Unit Apartments | 73 | 6.8% |
| 10 or more Apartments | 92 | 8.5% |
| Mobile Home / Other | 0 | 0.0% |
| Total | 1,077 | 100.0% |
Housing Structures by Occupancy in Greenport West
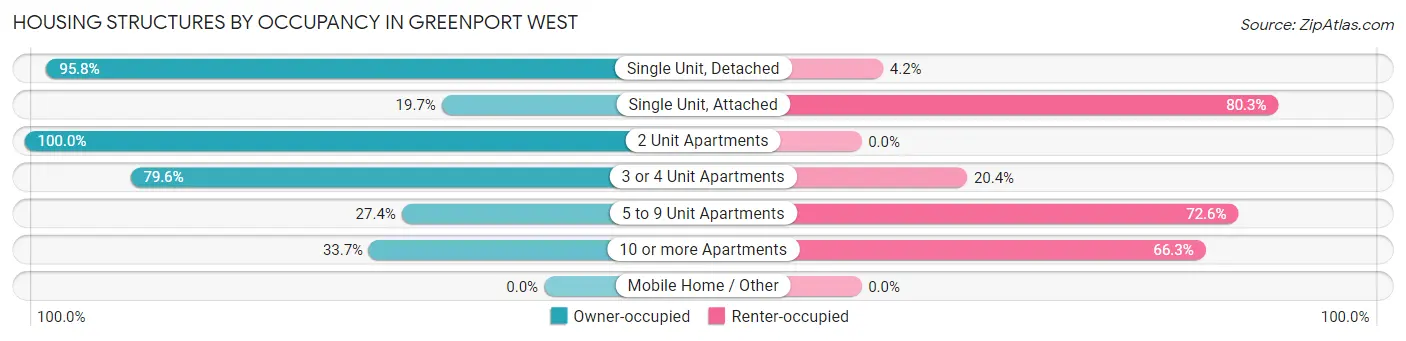
| Structure Type | Owner-occupied | Renter-occupied |
| Single Unit, Detached | 733 (95.8%) | 32 (4.2%) |
| Single Unit, Attached | 13 (19.7%) | 53 (80.3%) |
| 2 Unit Apartments | 27 (100.0%) | 0 (0.0%) |
| 3 or 4 Unit Apartments | 43 (79.6%) | 11 (20.4%) |
| 5 to 9 Unit Apartments | 20 (27.4%) | 53 (72.6%) |
| 10 or more Apartments | 31 (33.7%) | 61 (66.3%) |
| Mobile Home / Other | 0 (0.0%) | 0 (0.0%) |
| Total | 867 (80.5%) | 210 (19.5%) |
Housing Structures by Number of Rooms in Greenport West
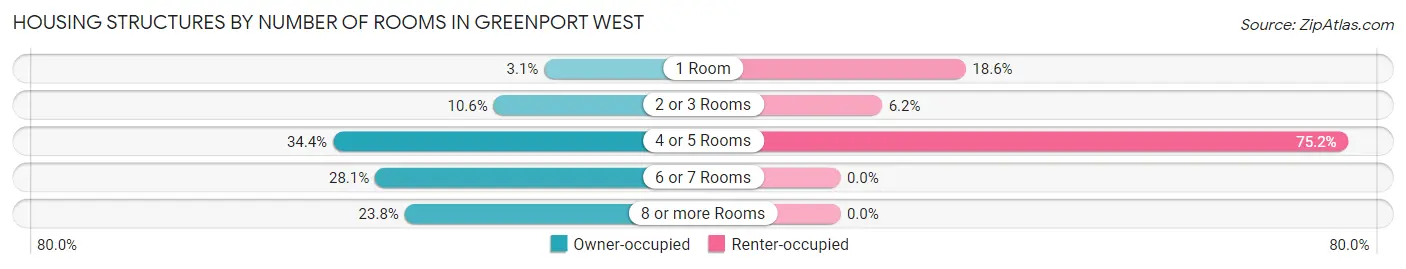
| Number of Rooms | Owner-occupied | Renter-occupied |
| 1 Room | 27 (3.1%) | 39 (18.6%) |
| 2 or 3 Rooms | 92 (10.6%) | 13 (6.2%) |
| 4 or 5 Rooms | 298 (34.4%) | 158 (75.2%) |
| 6 or 7 Rooms | 244 (28.1%) | 0 (0.0%) |
| 8 or more Rooms | 206 (23.8%) | 0 (0.0%) |
| Total | 867 (100.0%) | 210 (100.0%) |
Housing Structure by Heating Type in Greenport West
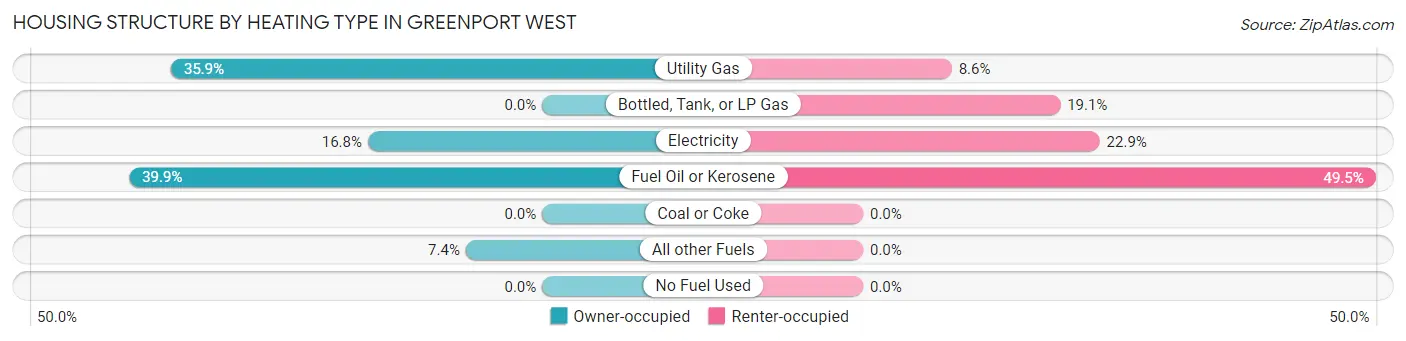
| Heating Type | Owner-occupied | Renter-occupied |
| Utility Gas | 311 (35.9%) | 18 (8.6%) |
| Bottled, Tank, or LP Gas | 0 (0.0%) | 40 (19.1%) |
| Electricity | 146 (16.8%) | 48 (22.9%) |
| Fuel Oil or Kerosene | 346 (39.9%) | 104 (49.5%) |
| Coal or Coke | 0 (0.0%) | 0 (0.0%) |
| All other Fuels | 64 (7.4%) | 0 (0.0%) |
| No Fuel Used | 0 (0.0%) | 0 (0.0%) |
| Total | 867 (100.0%) | 210 (100.0%) |
Household Vehicle Usage in Greenport West
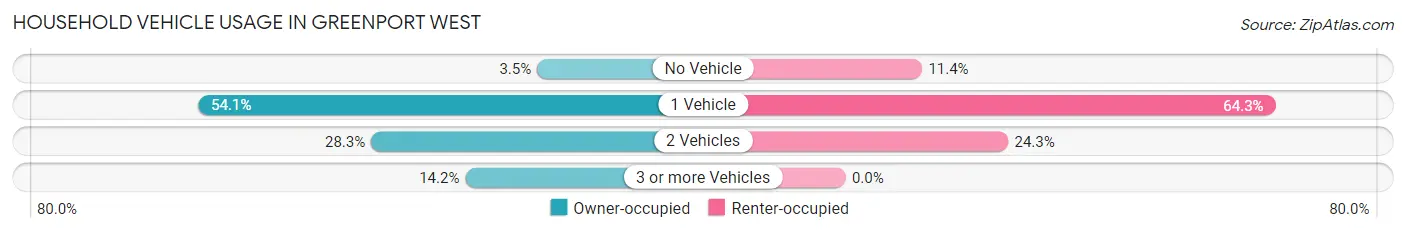
| Vehicles per Household | Owner-occupied | Renter-occupied |
| No Vehicle | 30 (3.5%) | 24 (11.4%) |
| 1 Vehicle | 469 (54.1%) | 135 (64.3%) |
| 2 Vehicles | 245 (28.3%) | 51 (24.3%) |
| 3 or more Vehicles | 123 (14.2%) | 0 (0.0%) |
| Total | 867 (100.0%) | 210 (100.0%) |
Real Estate & Mortgages in Greenport West
Real Estate and Mortgage Overview in Greenport West
| Characteristic | Without Mortgage | With Mortgage |
| Housing Units | 469 | 398 |
| Median Property Value | $830,200 | $610,500 |
| Median Household Income | $64,609 | $190 |
| Monthly Housing Costs | $1,137 | $121 |
| Real Estate Taxes | $9,430 | $35 |
Property Value by Mortgage Status in Greenport West
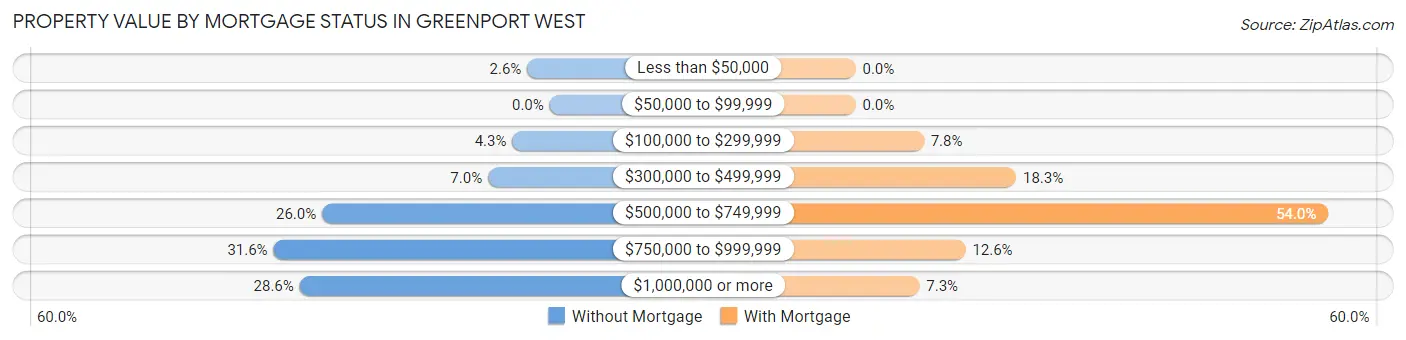
| Property Value | Without Mortgage | With Mortgage |
| Less than $50,000 | 12 (2.6%) | 0 (0.0%) |
| $50,000 to $99,999 | 0 (0.0%) | 0 (0.0%) |
| $100,000 to $299,999 | 20 (4.3%) | 31 (7.8%) |
| $300,000 to $499,999 | 33 (7.0%) | 73 (18.3%) |
| $500,000 to $749,999 | 122 (26.0%) | 215 (54.0%) |
| $750,000 to $999,999 | 148 (31.6%) | 50 (12.6%) |
| $1,000,000 or more | 134 (28.6%) | 29 (7.3%) |
| Total | 469 (100.0%) | 398 (100.0%) |
Household Income by Mortgage Status in Greenport West
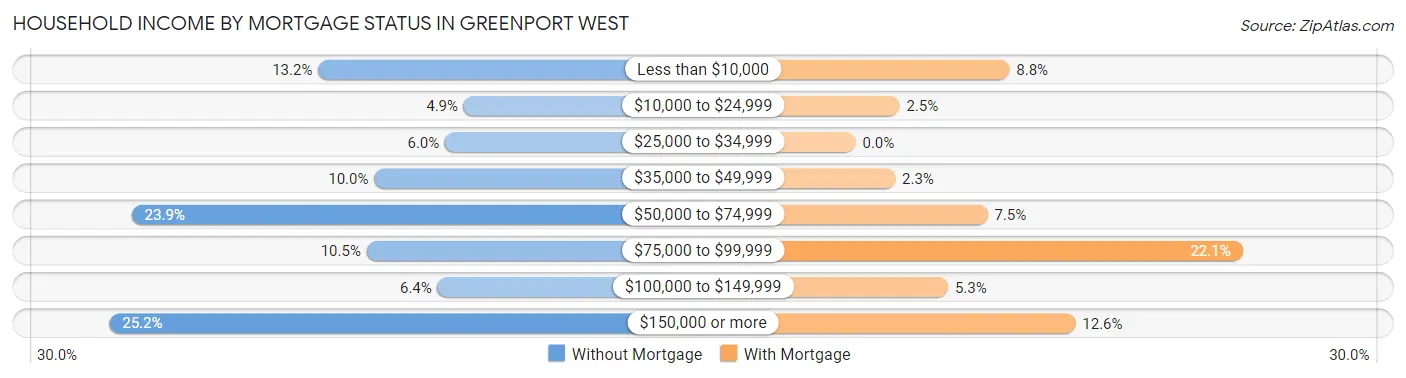
| Household Income | Without Mortgage | With Mortgage |
| Less than $10,000 | 62 (13.2%) | 35 (8.8%) |
| $10,000 to $24,999 | 23 (4.9%) | 10 (2.5%) |
| $25,000 to $34,999 | 28 (6.0%) | 0 (0.0%) |
| $35,000 to $49,999 | 47 (10.0%) | 9 (2.3%) |
| $50,000 to $74,999 | 112 (23.9%) | 30 (7.5%) |
| $75,000 to $99,999 | 49 (10.4%) | 88 (22.1%) |
| $100,000 to $149,999 | 30 (6.4%) | 21 (5.3%) |
| $150,000 or more | 118 (25.2%) | 50 (12.6%) |
| Total | 469 (100.0%) | 398 (100.0%) |
Property Value to Household Income Ratio in Greenport West
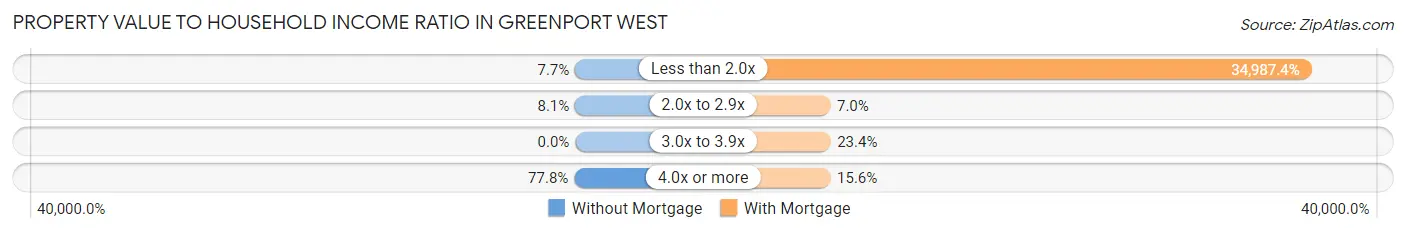
| Value-to-Income Ratio | Without Mortgage | With Mortgage |
| Less than 2.0x | 36 (7.7%) | 139,250 (34,987.4%) |
| 2.0x to 2.9x | 38 (8.1%) | 28 (7.0%) |
| 3.0x to 3.9x | 0 (0.0%) | 93 (23.4%) |
| 4.0x or more | 365 (77.8%) | 62 (15.6%) |
| Total | 469 (100.0%) | 398 (100.0%) |
Real Estate Taxes by Mortgage Status in Greenport West
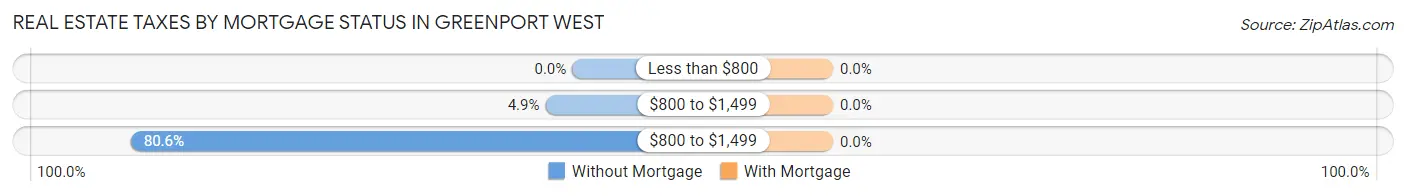
| Property Taxes | Without Mortgage | With Mortgage |
| Less than $800 | 0 (0.0%) | 0 (0.0%) |
| $800 to $1,499 | 23 (4.9%) | 0 (0.0%) |
| $800 to $1,499 | 378 (80.6%) | 0 (0.0%) |
| Total | 469 (100.0%) | 398 (100.0%) |
Health & Disability in Greenport West
Health Insurance Coverage by Age in Greenport West
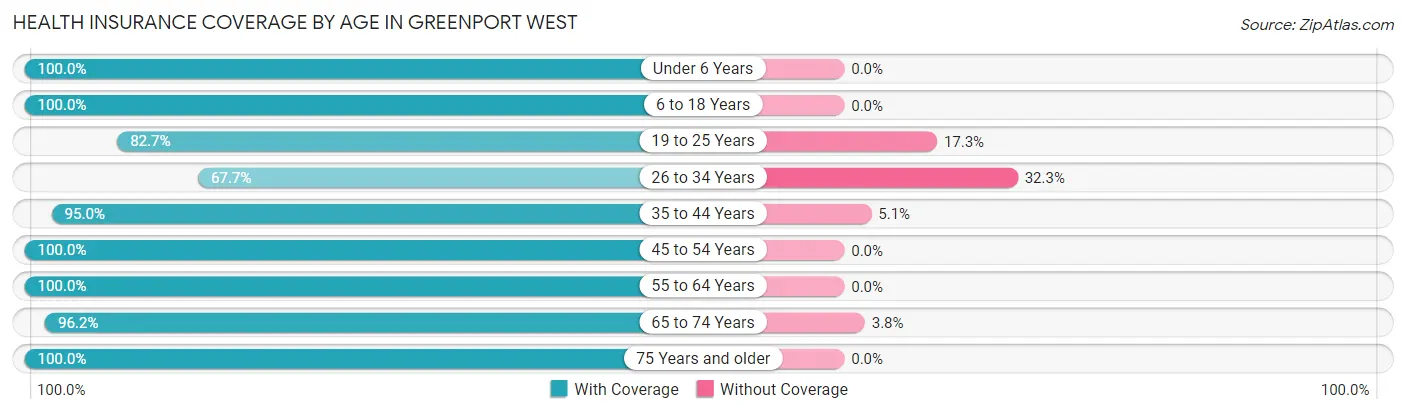
| Age Bracket | With Coverage | Without Coverage |
| Under 6 Years | 55 (100.0%) | 0 (0.0%) |
| 6 to 18 Years | 199 (100.0%) | 0 (0.0%) |
| 19 to 25 Years | 134 (82.7%) | 28 (17.3%) |
| 26 to 34 Years | 113 (67.7%) | 54 (32.3%) |
| 35 to 44 Years | 207 (95.0%) | 11 (5.1%) |
| 45 to 54 Years | 278 (100.0%) | 0 (0.0%) |
| 55 to 64 Years | 248 (100.0%) | 0 (0.0%) |
| 65 to 74 Years | 252 (96.2%) | 10 (3.8%) |
| 75 Years and older | 540 (100.0%) | 0 (0.0%) |
| Total | 2,026 (95.2%) | 103 (4.8%) |
Health Insurance Coverage by Citizenship Status in Greenport West
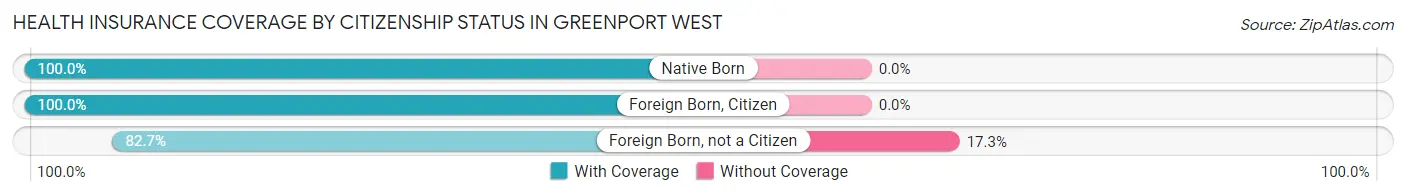
| Citizenship Status | With Coverage | Without Coverage |
| Native Born | 55 (100.0%) | 0 (0.0%) |
| Foreign Born, Citizen | 199 (100.0%) | 0 (0.0%) |
| Foreign Born, not a Citizen | 134 (82.7%) | 28 (17.3%) |
Health Insurance Coverage by Household Income in Greenport West
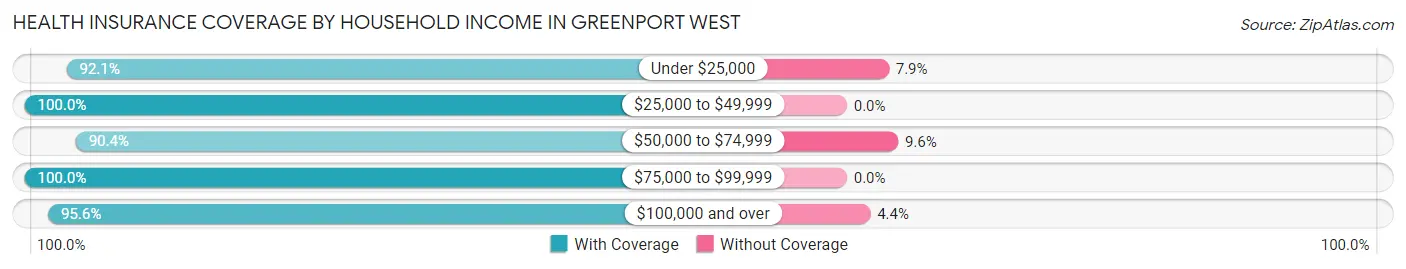
| Household Income | With Coverage | Without Coverage |
| Under $25,000 | 117 (92.1%) | 10 (7.9%) |
| $25,000 to $49,999 | 198 (100.0%) | 0 (0.0%) |
| $50,000 to $74,999 | 368 (90.4%) | 39 (9.6%) |
| $75,000 to $99,999 | 159 (100.0%) | 0 (0.0%) |
| $100,000 and over | 1,175 (95.6%) | 54 (4.4%) |
Public vs Private Health Insurance Coverage by Age in Greenport West
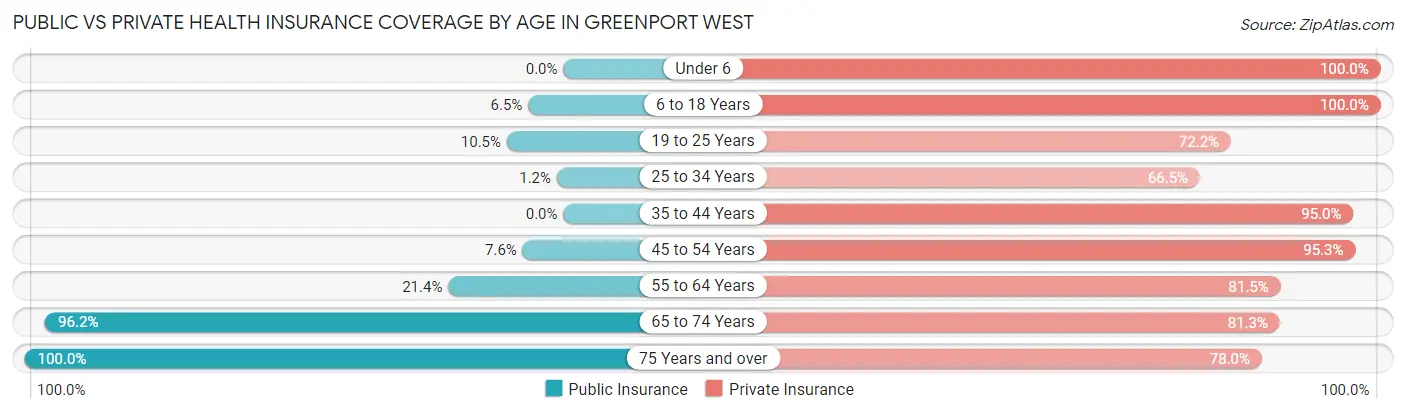
| Age Bracket | Public Insurance | Private Insurance |
| Under 6 | 0 (0.0%) | 55 (100.0%) |
| 6 to 18 Years | 13 (6.5%) | 199 (100.0%) |
| 19 to 25 Years | 17 (10.5%) | 117 (72.2%) |
| 25 to 34 Years | 2 (1.2%) | 111 (66.5%) |
| 35 to 44 Years | 0 (0.0%) | 207 (95.0%) |
| 45 to 54 Years | 21 (7.5%) | 265 (95.3%) |
| 55 to 64 Years | 53 (21.4%) | 202 (81.5%) |
| 65 to 74 Years | 252 (96.2%) | 213 (81.3%) |
| 75 Years and over | 540 (100.0%) | 421 (78.0%) |
| Total | 898 (42.2%) | 1,790 (84.1%) |
Disability Status by Sex by Age in Greenport West
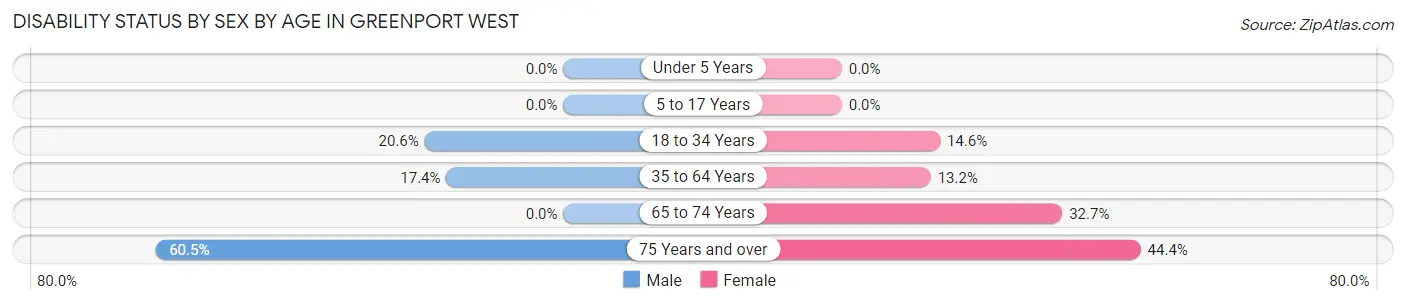
| Age Bracket | Male | Female |
| Under 5 Years | 0 (0.0%) | 0 (0.0%) |
| 5 to 17 Years | 0 (0.0%) | 0 (0.0%) |
| 18 to 34 Years | 48 (20.6%) | 14 (14.6%) |
| 35 to 64 Years | 74 (17.4%) | 42 (13.2%) |
| 65 to 74 Years | 0 (0.0%) | 72 (32.7%) |
| 75 Years and over | 133 (60.5%) | 142 (44.4%) |
Disability Class by Sex by Age in Greenport West
Disability Class: Hearing Difficulty
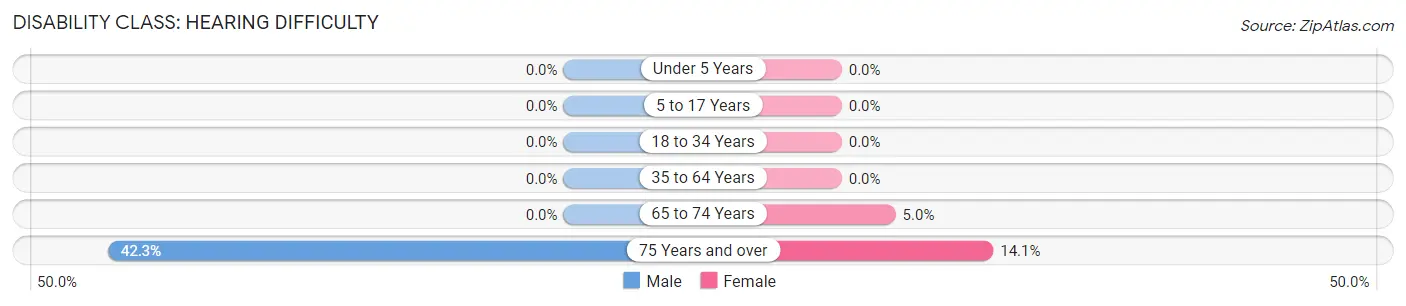
| Age Bracket | Male | Female |
| Under 5 Years | 0 (0.0%) | 0 (0.0%) |
| 5 to 17 Years | 0 (0.0%) | 0 (0.0%) |
| 18 to 34 Years | 0 (0.0%) | 0 (0.0%) |
| 35 to 64 Years | 0 (0.0%) | 0 (0.0%) |
| 65 to 74 Years | 0 (0.0%) | 11 (5.0%) |
| 75 Years and over | 93 (42.3%) | 45 (14.1%) |
Disability Class: Vision Difficulty
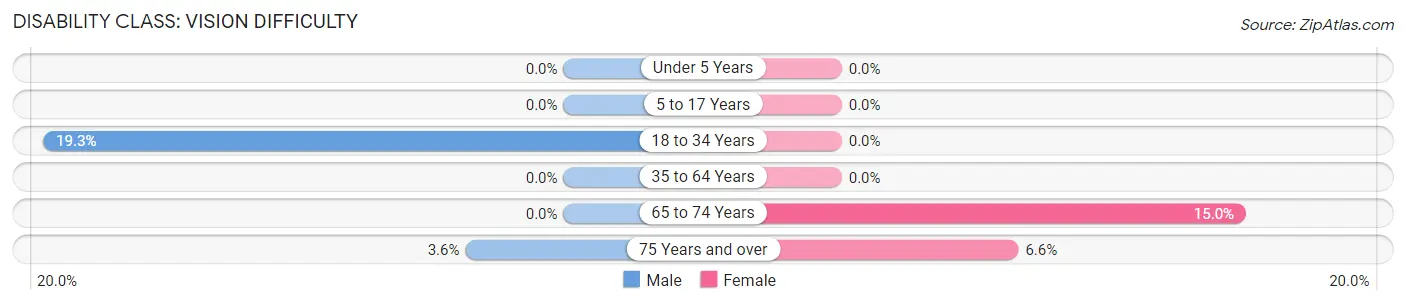
| Age Bracket | Male | Female |
| Under 5 Years | 0 (0.0%) | 0 (0.0%) |
| 5 to 17 Years | 0 (0.0%) | 0 (0.0%) |
| 18 to 34 Years | 45 (19.3%) | 0 (0.0%) |
| 35 to 64 Years | 0 (0.0%) | 0 (0.0%) |
| 65 to 74 Years | 0 (0.0%) | 33 (15.0%) |
| 75 Years and over | 8 (3.6%) | 21 (6.6%) |
Disability Class: Cognitive Difficulty
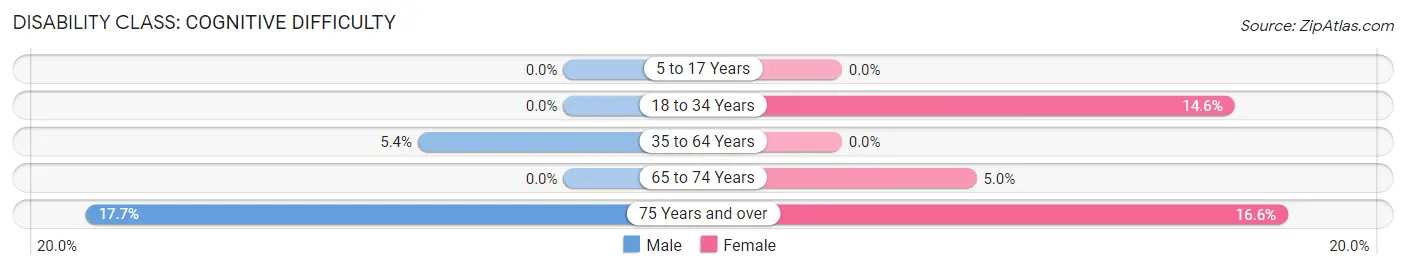
| Age Bracket | Male | Female |
| 5 to 17 Years | 0 (0.0%) | 0 (0.0%) |
| 18 to 34 Years | 0 (0.0%) | 14 (14.6%) |
| 35 to 64 Years | 23 (5.4%) | 0 (0.0%) |
| 65 to 74 Years | 0 (0.0%) | 11 (5.0%) |
| 75 Years and over | 39 (17.7%) | 53 (16.6%) |
Disability Class: Ambulatory Difficulty
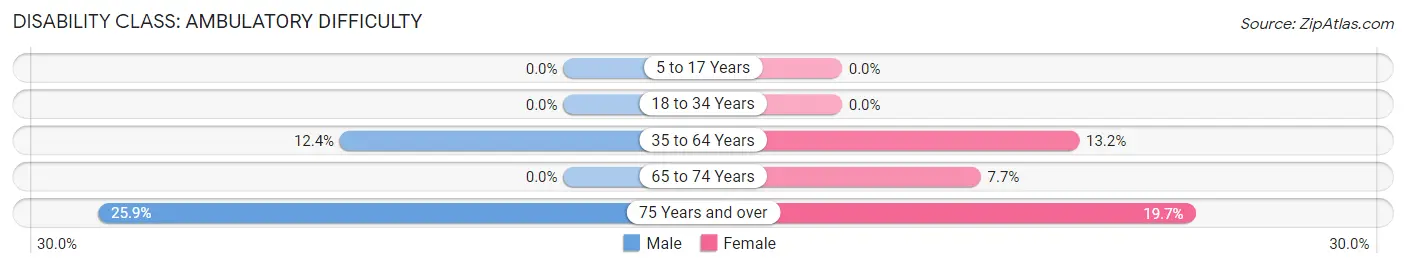
| Age Bracket | Male | Female |
| 5 to 17 Years | 0 (0.0%) | 0 (0.0%) |
| 18 to 34 Years | 0 (0.0%) | 0 (0.0%) |
| 35 to 64 Years | 53 (12.4%) | 42 (13.2%) |
| 65 to 74 Years | 0 (0.0%) | 17 (7.7%) |
| 75 Years and over | 57 (25.9%) | 63 (19.7%) |
Disability Class: Self-Care Difficulty
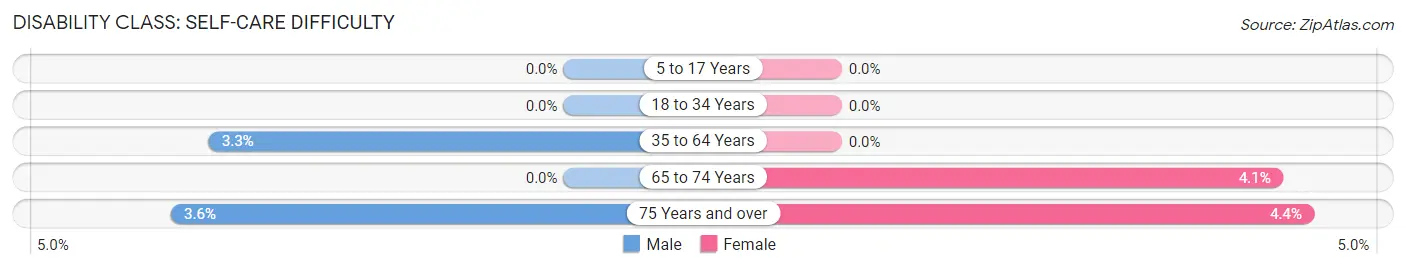
| Age Bracket | Male | Female |
| 5 to 17 Years | 0 (0.0%) | 0 (0.0%) |
| 18 to 34 Years | 0 (0.0%) | 0 (0.0%) |
| 35 to 64 Years | 14 (3.3%) | 0 (0.0%) |
| 65 to 74 Years | 0 (0.0%) | 9 (4.1%) |
| 75 Years and over | 8 (3.6%) | 14 (4.4%) |
Technology Access in Greenport West
Computing Device Access in Greenport West
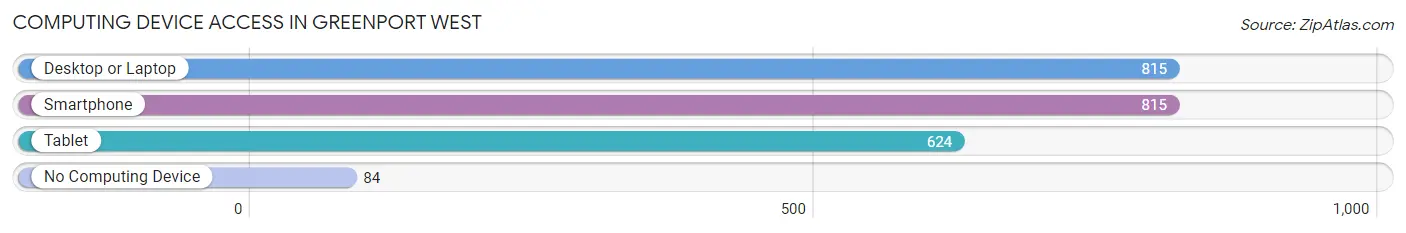
| Device Type | # Households | % Households |
| Desktop or Laptop | 815 | 75.7% |
| Smartphone | 815 | 75.7% |
| Tablet | 624 | 57.9% |
| No Computing Device | 84 | 7.8% |
| Total | 1,077 | 100.0% |
Internet Access in Greenport West
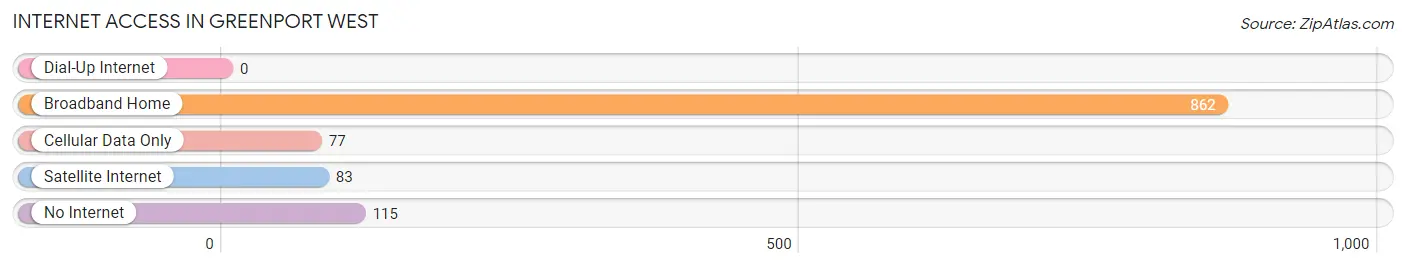
| Internet Type | # Households | % Households |
| Dial-Up Internet | 0 | 0.0% |
| Broadband Home | 862 | 80.0% |
| Cellular Data Only | 77 | 7.1% |
| Satellite Internet | 83 | 7.7% |
| No Internet | 115 | 10.7% |
| Total | 1,077 | 100.0% |
Greenport West Summary
Greenport West, NY is a small hamlet located in the Town of Southold in Suffolk County, New York. It is situated on the North Fork of Long Island, approximately 90 miles east of New York City. The hamlet is bordered by the hamlets of East Marion to the west, Southold to the east, and Greenport to the south.
History
Greenport West was originally part of the Town of Southold, which was established in 1640. The area was first settled by English colonists in 1640 and was known as the “West End” of Southold. The area was primarily used for farming and fishing. In the late 19th century, the area began to develop as a summer resort destination. Hotels, restaurants, and other businesses began to open in the area, and the population began to grow.
In the early 20th century, the area was known as “Greenport West” and was home to a number of summer resorts. The area was also home to a number of small businesses, including a general store, a post office, and a blacksmith shop.
In the 1950s, the area began to decline as a summer resort destination. Many of the businesses closed, and the population began to decline. In the late 20th century, the area began to experience a resurgence as a residential community.
Geography
Greenport West is located on the North Fork of Long Island, approximately 90 miles east of New York City. The hamlet is bordered by the hamlets of East Marion to the west, Southold to the east, and Greenport to the south. The area is primarily rural, with a mix of farmland and woodlands. The area is also home to a number of small ponds and creeks.
Economy
Greenport West is primarily a residential community, with a small number of businesses located in the area. The primary industries in the area are tourism, agriculture, and fishing. The area is home to a number of small farms, which produce a variety of fruits and vegetables. The area is also home to a number of small fishing businesses, which specialize in shellfish and finfish.
Demographics
As of the 2010 census, the population of Greenport West was 1,845. The population is primarily white (94.3%), with a small percentage of African Americans (2.2%) and Hispanics (2.2%). The median household income in the area is $68,750, and the median home value is $521,000.
Conclusion
Greenport West, NY is a small hamlet located in the Town of Southold in Suffolk County, New York. It is situated on the North Fork of Long Island, approximately 90 miles east of New York City. The hamlet is bordered by the hamlets of East Marion to the west, Southold to the east, and Greenport to the south. The area is primarily rural, with a mix of farmland and woodlands. The primary industries in the area are tourism, agriculture, and fishing. As of the 2010 census, the population of Greenport West was 1,845. The population is primarily white (94.3%), with a small percentage of African Americans (2.2%) and Hispanics (2.2%). The median household income in the area is $68,750, and the median home value is $521,000.
Common Questions
What is Per Capita Income in Greenport West?
Per Capita income in Greenport West is $73,007.
What is the Median Family Income in Greenport West?
Median Family Income in Greenport West is $149,094.
What is the Median Household income in Greenport West?
Median Household Income in Greenport West is $73,750.
What is Income or Wage Gap in Greenport West?
Income or Wage Gap in Greenport West is 22.1%.
Women in Greenport West earn 77.9 cents for every dollar earned by a man.
What is Inequality or Gini Index in Greenport West?
Inequality or Gini Index in Greenport West is 0.56.
What is the Total Population of Greenport West?
Total Population of Greenport West is 2,230.
What is the Total Male Population of Greenport West?
Total Male Population of Greenport West is 1,079.
What is the Total Female Population of Greenport West?
Total Female Population of Greenport West is 1,151.
What is the Ratio of Males per 100 Females in Greenport West?
There are 93.74 Males per 100 Females in Greenport West.
What is the Ratio of Females per 100 Males in Greenport West?
There are 106.67 Females per 100 Males in Greenport West.
What is the Median Population Age in Greenport West?
Median Population Age in Greenport West is 59.2 Years.
What is the Average Family Size in Greenport West
Average Family Size in Greenport West is 2.9 People.
What is the Average Household Size in Greenport West
Average Household Size in Greenport West is 2.0 People.
How Large is the Labor Force in Greenport West?
There are 990 People in the Labor Forcein in Greenport West.
What is the Percentage of People in the Labor Force in Greenport West?
48.9% of People are in the Labor Force in Greenport West.
What is the Unemployment Rate in Greenport West?
Unemployment Rate in Greenport West is 7.0%.