Thomaston, NY Map & Demographics
Thomaston Map
Thomaston Overview
$74,562
PER CAPITA INCOME
$162,420
AVG FAMILY INCOME
$134,107
AVG HOUSEHOLD INCOME
38.1%
WAGE / INCOME GAP [ % ]
61.9¢/ $1
WAGE / INCOME GAP [ $ ]
0.47
INEQUALITY / GINI INDEX
2,750
TOTAL POPULATION
1,339
MALE POPULATION
1,411
FEMALE POPULATION
94.90
MALES / 100 FEMALES
105.38
FEMALES / 100 MALES
45.9
MEDIAN AGE
3.1
AVG FAMILY SIZE
2.6
AVG HOUSEHOLD SIZE
1,389
LABOR FORCE [ PEOPLE ]
63.1%
PERCENT IN LABOR FORCE
3.2%
UNEMPLOYMENT RATE
Income in Thomaston
Income Overview in Thomaston
Per Capita Income in Thomaston is $74,562, while median incomes of families and households are $162,420 and $134,107 respectively.
| Characteristic | Number | Measure |
| Per Capita Income | 2,750 | $74,562 |
| Median Family Income | 747 | $162,420 |
| Mean Family Income | 747 | $243,334 |
| Median Household Income | 1,043 | $134,107 |
| Mean Household Income | 1,043 | $199,078 |
| Income Deficit | 747 | $0 |
| Wage / Income Gap (%) | 2,750 | 38.15% |
| Wage / Income Gap ($) | 2,750 | 61.85¢ per $1 |
| Gini / Inequality Index | 2,750 | 0.47 |
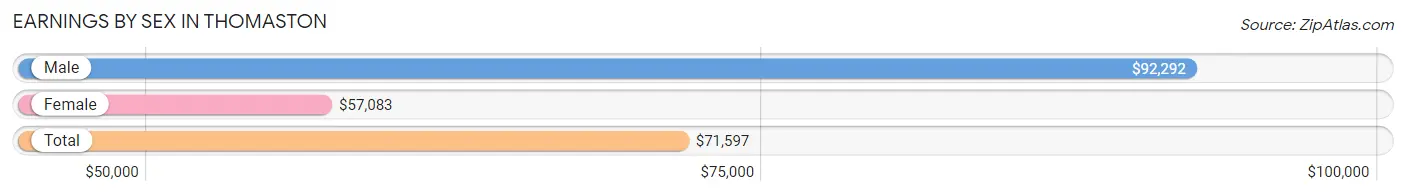
Earnings by Sex in Thomaston
Average Earnings in Thomaston are $71,597, $92,292 for men and $57,083 for women, a difference of 38.2%.
| Sex | Number | Average Earnings |
| Male | 761 (51.9%) | $92,292 |
| Female | 704 (48.0%) | $57,083 |
| Total | 1,465 (100.0%) | $71,597 |
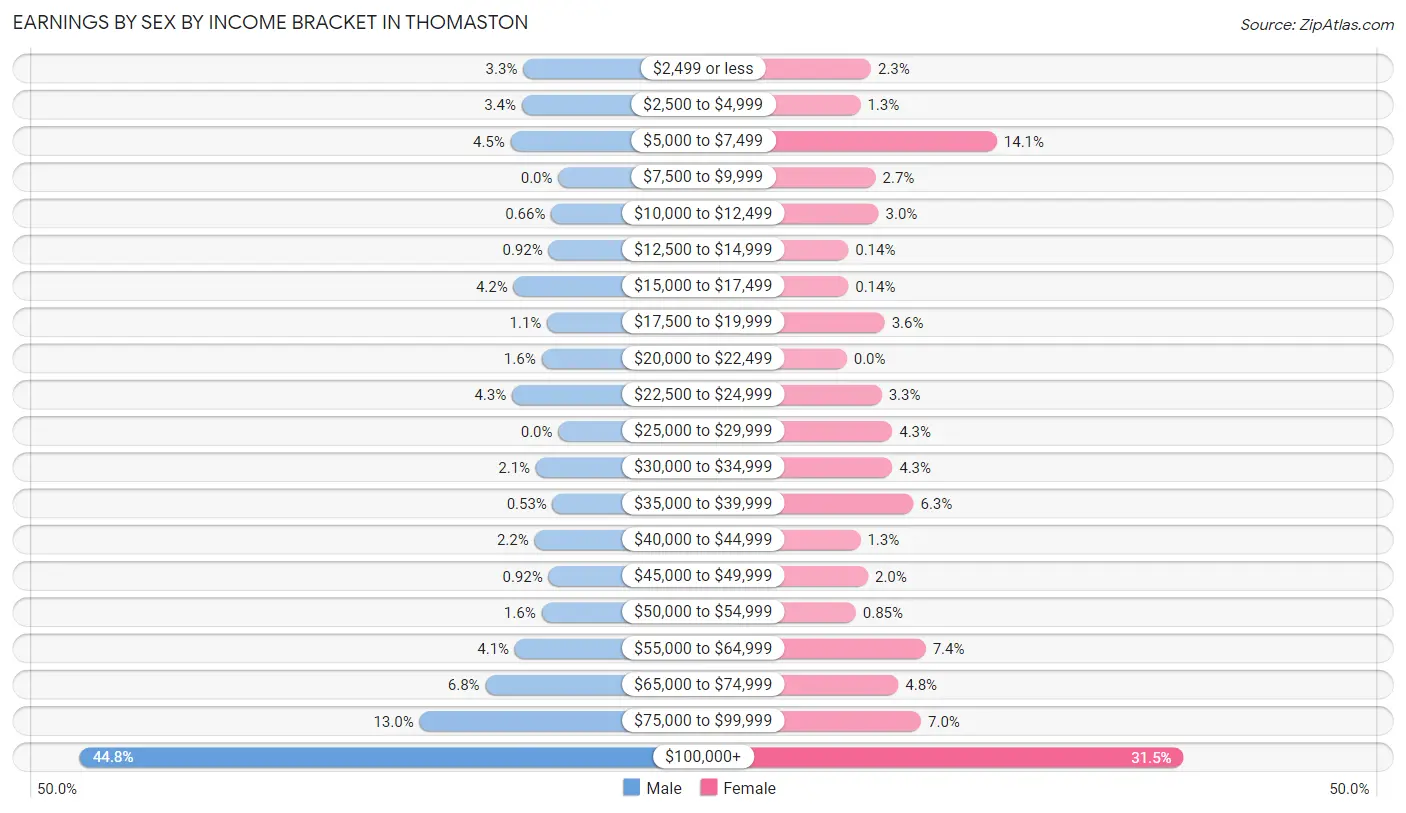
Earnings by Sex by Income Bracket in Thomaston
The most common earnings brackets in Thomaston are $100,000+ for men (341 | 44.8%) and $100,000+ for women (222 | 31.5%).
| Income | Male | Female |
| $2,499 or less | 25 (3.3%) | 16 (2.3%) |
| $2,500 to $4,999 | 26 (3.4%) | 9 (1.3%) |
| $5,000 to $7,499 | 34 (4.5%) | 99 (14.1%) |
| $7,500 to $9,999 | 0 (0.0%) | 19 (2.7%) |
| $10,000 to $12,499 | 5 (0.7%) | 21 (3.0%) |
| $12,500 to $14,999 | 7 (0.9%) | 1 (0.1%) |
| $15,000 to $17,499 | 32 (4.2%) | 1 (0.1%) |
| $17,500 to $19,999 | 8 (1.1%) | 25 (3.5%) |
| $20,000 to $22,499 | 12 (1.6%) | 0 (0.0%) |
| $22,500 to $24,999 | 33 (4.3%) | 23 (3.3%) |
| $25,000 to $29,999 | 0 (0.0%) | 30 (4.3%) |
| $30,000 to $34,999 | 16 (2.1%) | 30 (4.3%) |
| $35,000 to $39,999 | 4 (0.5%) | 44 (6.2%) |
| $40,000 to $44,999 | 17 (2.2%) | 9 (1.3%) |
| $45,000 to $49,999 | 7 (0.9%) | 14 (2.0%) |
| $50,000 to $54,999 | 12 (1.6%) | 6 (0.9%) |
| $55,000 to $64,999 | 31 (4.1%) | 52 (7.4%) |
| $65,000 to $74,999 | 52 (6.8%) | 34 (4.8%) |
| $75,000 to $99,999 | 99 (13.0%) | 49 (7.0%) |
| $100,000+ | 341 (44.8%) | 222 (31.5%) |
| Total | 761 (100.0%) | 704 (100.0%) |
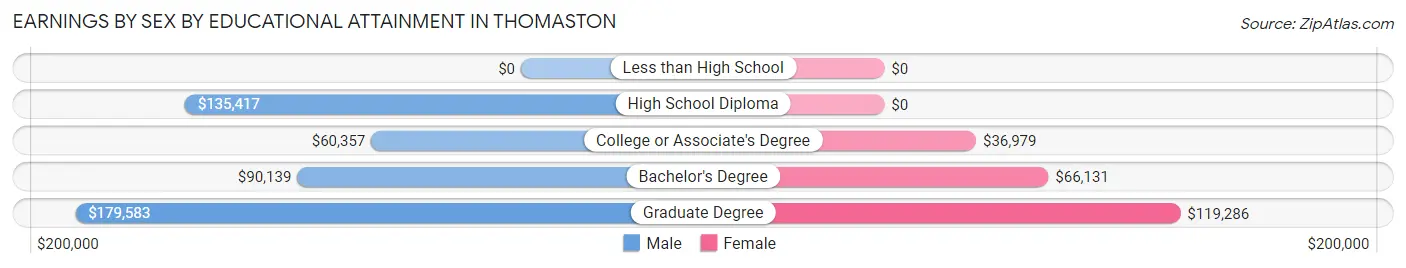
Earnings by Sex by Educational Attainment in Thomaston
Average earnings in Thomaston are $95,096 for men and $59,773 for women, a difference of 37.1%. Men with an educational attainment of graduate degree enjoy the highest average annual earnings of $179,583, while those with college or associate's degree education earn the least with $60,357. Women with an educational attainment of graduate degree earn the most with the average annual earnings of $119,286, while those with college or associate's degree education have the smallest earnings of $36,979.
| Educational Attainment | Male Income | Female Income |
| Less than High School | - | - |
| High School Diploma | $135,417 | $0 |
| College or Associate's Degree | $60,357 | $36,979 |
| Bachelor's Degree | $90,139 | $66,131 |
| Graduate Degree | $179,583 | $119,286 |
| Total | $95,096 | $59,773 |
Family Income in Thomaston
Family Income Brackets in Thomaston
According to the Thomaston family income data, there are 330 families falling into the $200,000+ income range, which is the most common income bracket and makes up 44.2% of all families.
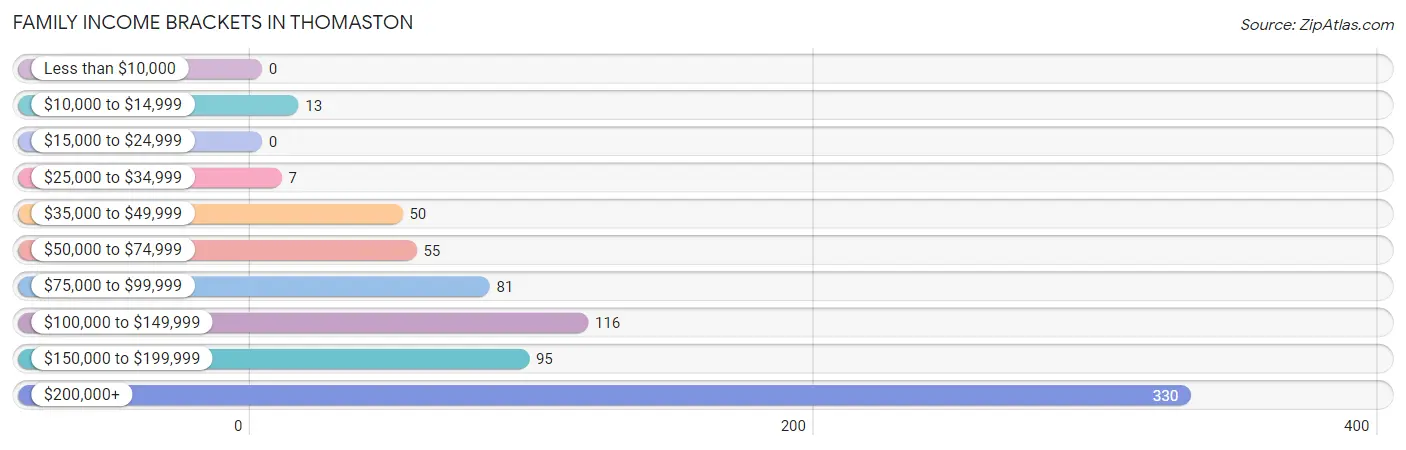
| Income Bracket | # Families | % Families |
| Less than $10,000 | 0 | 0.0% |
| $10,000 to $14,999 | 13 | 1.7% |
| $15,000 to $24,999 | 0 | 0.0% |
| $25,000 to $34,999 | 7 | 0.9% |
| $35,000 to $49,999 | 50 | 6.7% |
| $50,000 to $74,999 | 55 | 7.4% |
| $75,000 to $99,999 | 81 | 10.8% |
| $100,000 to $149,999 | 116 | 15.5% |
| $150,000 to $199,999 | 95 | 12.7% |
| $200,000+ | 330 | 44.2% |
Family Income by Famaliy Size in Thomaston
4-person families (182 | 24.4%) account for the highest median family income in Thomaston with $250,001 per family, while 2-person families (333 | 44.6%) have the highest median income of $80,093 per family member.
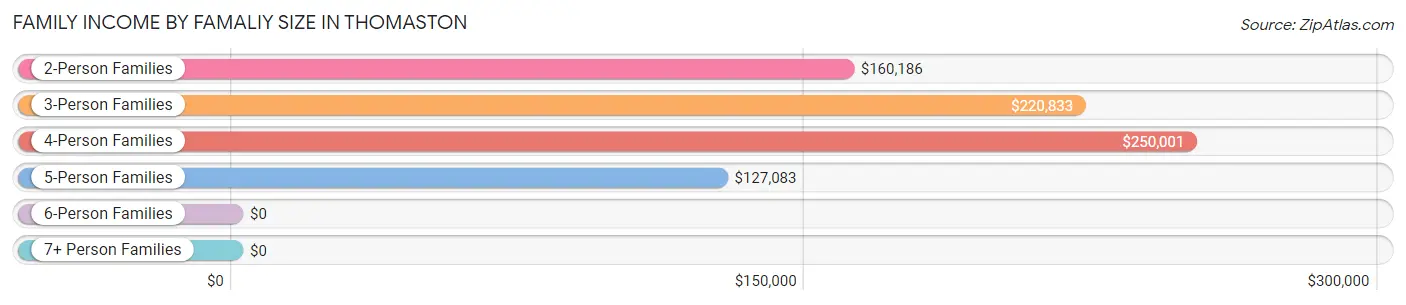
| Income Bracket | # Families | Median Income |
| 2-Person Families | 333 (44.6%) | $160,186 |
| 3-Person Families | 150 (20.1%) | $220,833 |
| 4-Person Families | 182 (24.4%) | $250,001 |
| 5-Person Families | 30 (4.0%) | $127,083 |
| 6-Person Families | 25 (3.4%) | $0 |
| 7+ Person Families | 27 (3.6%) | $0 |
| Total | 747 (100.0%) | $162,420 |
Family Income by Number of Earners in Thomaston
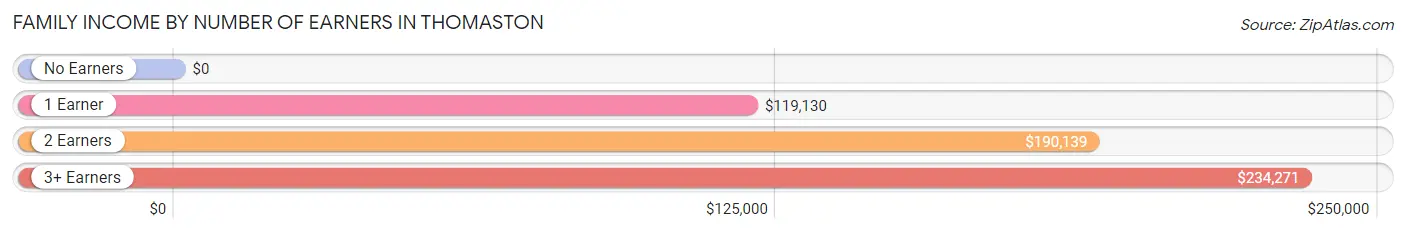
| Number of Earners | # Families | Median Income |
| No Earners | 70 (9.4%) | $0 |
| 1 Earner | 134 (17.9%) | $119,130 |
| 2 Earners | 478 (64.0%) | $190,139 |
| 3+ Earners | 65 (8.7%) | $234,271 |
| Total | 747 (100.0%) | $162,420 |
Household Income in Thomaston
Household Income Brackets in Thomaston
With 344 households falling in the category, the $200,000+ income range is the most frequent in Thomaston, accounting for 33.0% of all households. In contrast, only 13 households (1.3%) fall into the $10,000 to $14,999 income bracket, making it the least populous group.
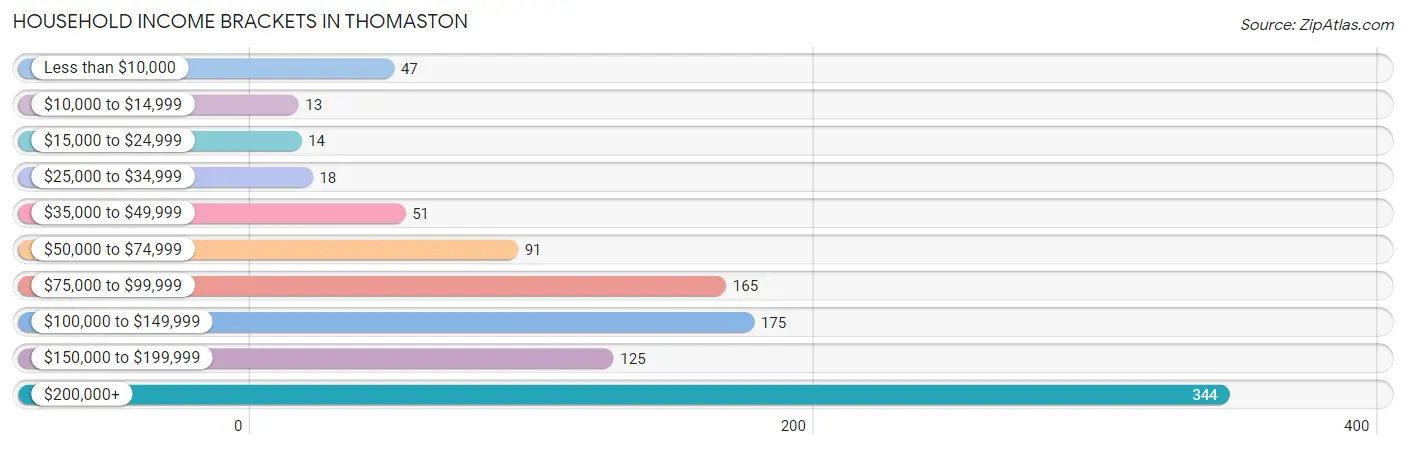
| Income Bracket | # Households | % Households |
| Less than $10,000 | 47 | 4.5% |
| $10,000 to $14,999 | 13 | 1.2% |
| $15,000 to $24,999 | 14 | 1.3% |
| $25,000 to $34,999 | 18 | 1.7% |
| $35,000 to $49,999 | 51 | 4.9% |
| $50,000 to $74,999 | 91 | 8.7% |
| $75,000 to $99,999 | 165 | 15.8% |
| $100,000 to $149,999 | 175 | 16.8% |
| $150,000 to $199,999 | 125 | 12.0% |
| $200,000+ | 344 | 33.0% |
Household Income by Householder Age in Thomaston
The median household income in Thomaston is $134,107, with the highest median household income of $172,083 found in the 25 to 44 years age bracket for the primary householder. A total of 195 households (18.7%) fall into this category.
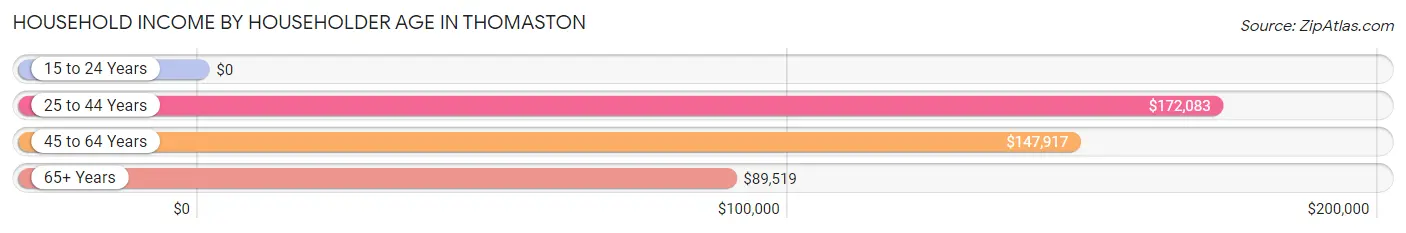
| Income Bracket | # Households | Median Income |
| 15 to 24 Years | 0 (0.0%) | $0 |
| 25 to 44 Years | 195 (18.7%) | $172,083 |
| 45 to 64 Years | 492 (47.2%) | $147,917 |
| 65+ Years | 356 (34.1%) | $89,519 |
| Total | 1,043 (100.0%) | $134,107 |
Poverty in Thomaston
Income Below Poverty by Sex and Age in Thomaston
With 5.7% poverty level for males and 6.8% for females among the residents of Thomaston, 55 to 64 year old males and 25 to 34 year old females are the most vulnerable to poverty, with 29 males (12.8%) and 22 females (19.5%) in their respective age groups living below the poverty level.
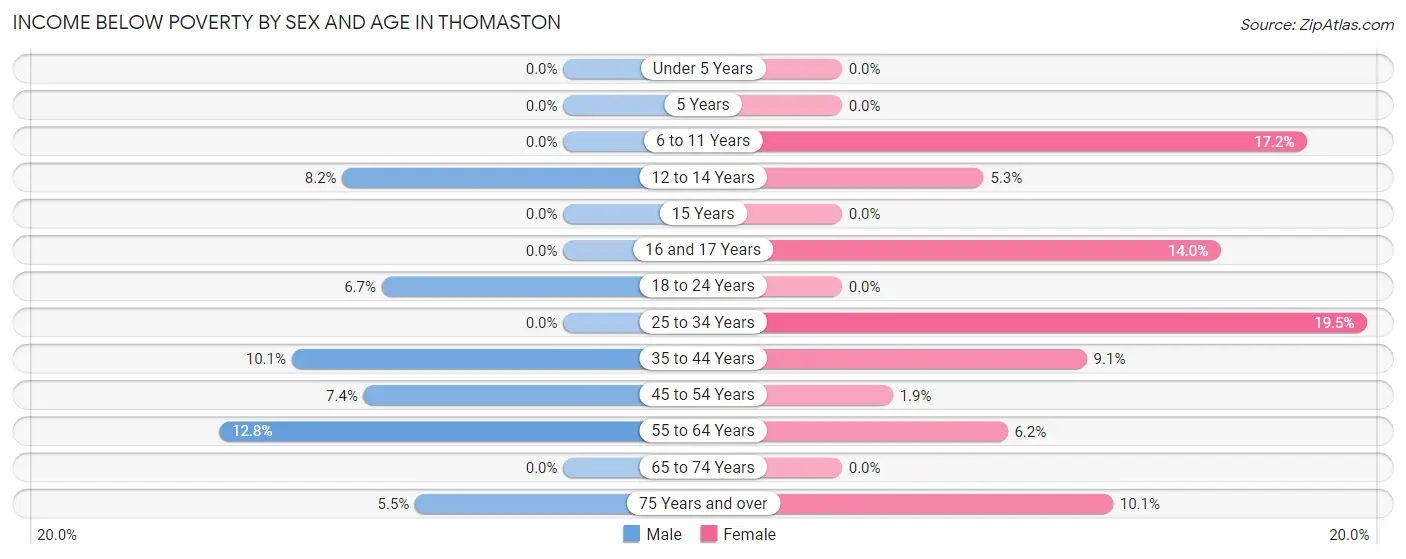
| Age Bracket | Male | Female |
| Under 5 Years | 0 (0.0%) | 0 (0.0%) |
| 5 Years | 0 (0.0%) | 0 (0.0%) |
| 6 to 11 Years | 0 (0.0%) | 15 (17.2%) |
| 12 to 14 Years | 5 (8.2%) | 7 (5.3%) |
| 15 Years | 0 (0.0%) | 0 (0.0%) |
| 16 and 17 Years | 0 (0.0%) | 8 (14.0%) |
| 18 to 24 Years | 6 (6.7%) | 0 (0.0%) |
| 25 to 34 Years | 0 (0.0%) | 22 (19.5%) |
| 35 to 44 Years | 13 (10.1%) | 12 (9.1%) |
| 45 to 54 Years | 16 (7.4%) | 5 (1.9%) |
| 55 to 64 Years | 29 (12.8%) | 8 (6.1%) |
| 65 to 74 Years | 0 (0.0%) | 0 (0.0%) |
| 75 Years and over | 6 (5.5%) | 18 (10.1%) |
| Total | 75 (5.7%) | 95 (6.8%) |
Income Above Poverty by Sex and Age in Thomaston
According to the poverty statistics in Thomaston, males aged under 5 years and females aged under 5 years are the age groups that are most secure financially, with 100.0% of males and 100.0% of females in these age groups living above the poverty line.
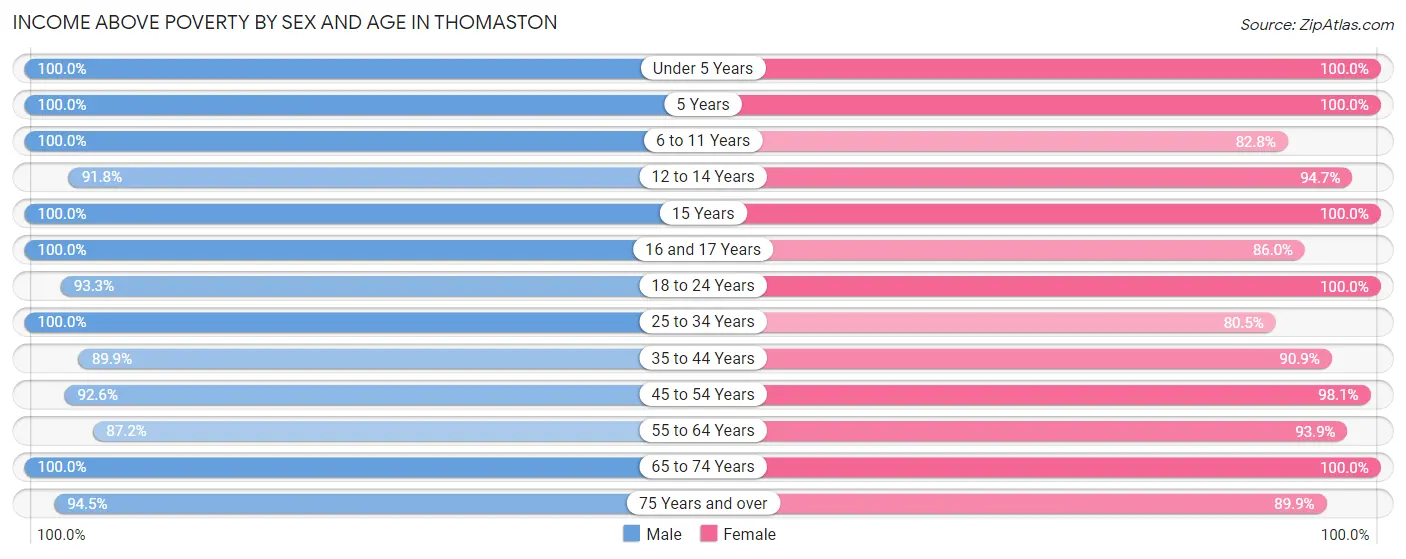
| Age Bracket | Male | Female |
| Under 5 Years | 71 (100.0%) | 41 (100.0%) |
| 5 Years | 3 (100.0%) | 5 (100.0%) |
| 6 to 11 Years | 96 (100.0%) | 72 (82.8%) |
| 12 to 14 Years | 56 (91.8%) | 126 (94.7%) |
| 15 Years | 8 (100.0%) | 25 (100.0%) |
| 16 and 17 Years | 79 (100.0%) | 49 (86.0%) |
| 18 to 24 Years | 83 (93.3%) | 80 (100.0%) |
| 25 to 34 Years | 100 (100.0%) | 91 (80.5%) |
| 35 to 44 Years | 116 (89.9%) | 120 (90.9%) |
| 45 to 54 Years | 200 (92.6%) | 259 (98.1%) |
| 55 to 64 Years | 198 (87.2%) | 122 (93.9%) |
| 65 to 74 Years | 140 (100.0%) | 157 (100.0%) |
| 75 Years and over | 103 (94.5%) | 161 (89.9%) |
| Total | 1,253 (94.4%) | 1,308 (93.2%) |
Income Below Poverty Among Married-Couple Families in Thomaston
The poverty statistics for married-couple families in Thomaston show that 1.9% or 13 of the total 668 families live below the poverty line. Families with 3 or 4 children have the highest poverty rate of 20.5%, comprising of 8 families. On the other hand, families with no children have the lowest poverty rate of 0.0%, which includes 0 families.
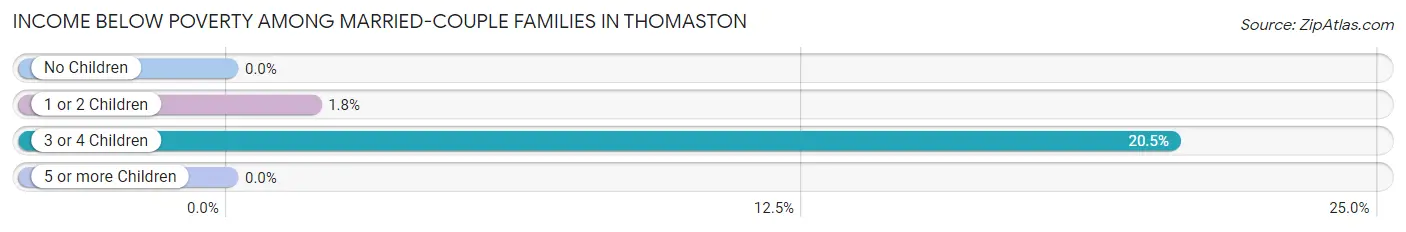
| Children | Above Poverty | Below Poverty |
| No Children | 352 (100.0%) | 0 (0.0%) |
| 1 or 2 Children | 272 (98.2%) | 5 (1.8%) |
| 3 or 4 Children | 31 (79.5%) | 8 (20.5%) |
| 5 or more Children | 0 (0.0%) | 0 (0.0%) |
| Total | 655 (98.1%) | 13 (1.9%) |
Income Below Poverty Among Single-Parent Households in Thomaston
| Children | Single Father | Single Mother |
| No Children | 0 (0.0%) | 0 (0.0%) |
| 1 or 2 Children | 0 (0.0%) | 0 (0.0%) |
| 3 or 4 Children | 0 (0.0%) | 0 (0.0%) |
| 5 or more Children | 0 (0.0%) | 0 (0.0%) |
| Total | 0 (0.0%) | 0 (0.0%) |
Income Below Poverty Among Married-Couple vs Single-Parent Households in Thomaston
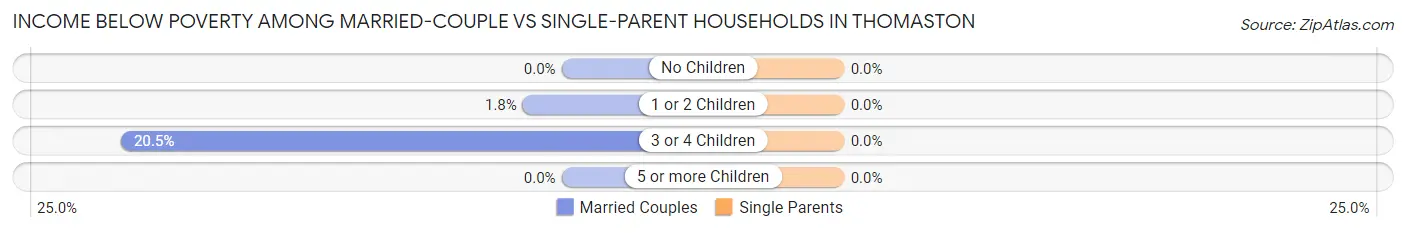
| Children | Married-Couple Families | Single-Parent Households |
| No Children | 0 (0.0%) | 0 (0.0%) |
| 1 or 2 Children | 5 (1.8%) | 0 (0.0%) |
| 3 or 4 Children | 8 (20.5%) | 0 (0.0%) |
| 5 or more Children | 0 (0.0%) | 0 (0.0%) |
| Total | 13 (1.9%) | 0 (0.0%) |
Race in Thomaston
The most populous races in Thomaston are White / Caucasian (1,509 | 54.9%), Asian (1,116 | 40.6%), and Two or more Races (80 | 2.9%).
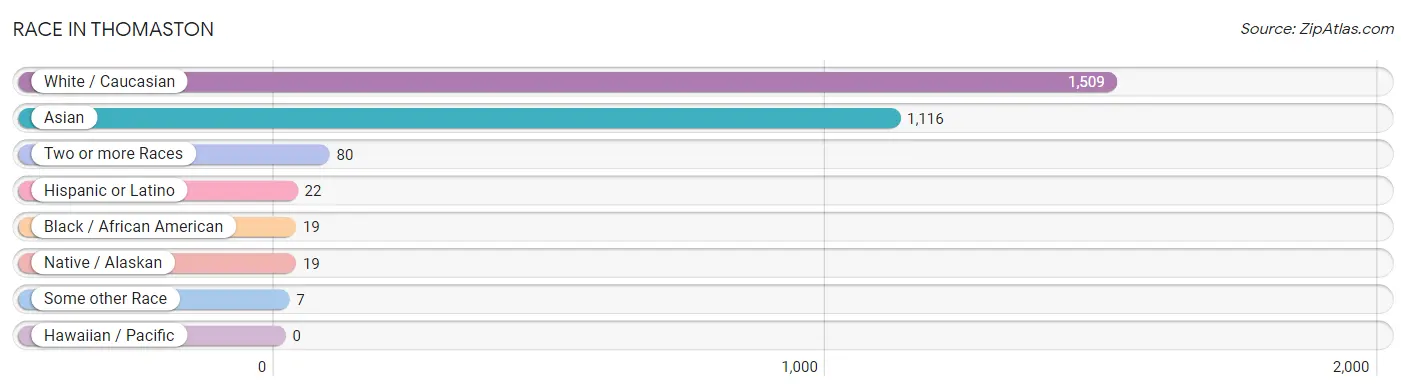
| Race | # Population | % Population |
| Asian | 1,116 | 40.6% |
| Black / African American | 19 | 0.7% |
| Hawaiian / Pacific | 0 | 0.0% |
| Hispanic or Latino | 22 | 0.8% |
| Native / Alaskan | 19 | 0.7% |
| White / Caucasian | 1,509 | 54.9% |
| Two or more Races | 80 | 2.9% |
| Some other Race | 7 | 0.3% |
| Total | 2,750 | 100.0% |
Ancestry in Thomaston
The most populous ancestries reported in Thomaston are Indian (Asian) (701 | 25.5%), Burmese (229 | 8.3%), Iranian (192 | 7.0%), Russian (174 | 6.3%), and Eastern European (148 | 5.4%), together accounting for 52.5% of all Thomaston residents.
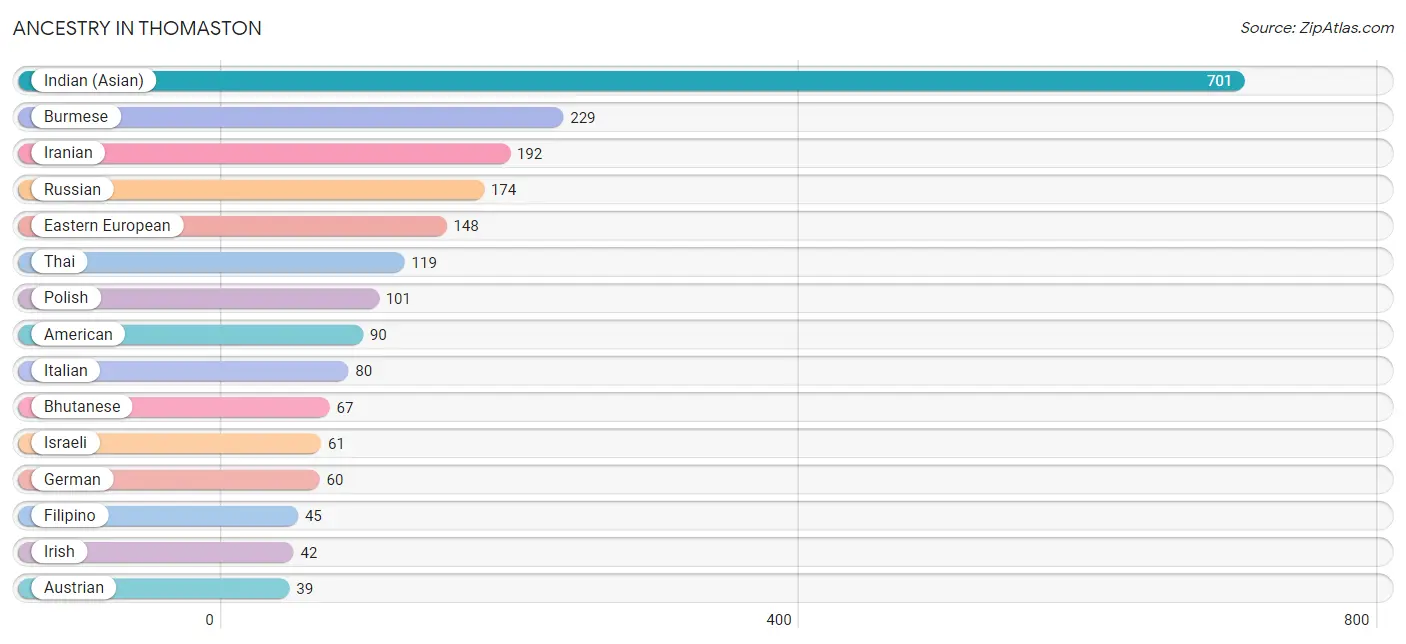
| Ancestry | # Population | % Population |
| American | 90 | 3.3% |
| Arab | 14 | 0.5% |
| Armenian | 7 | 0.3% |
| Austrian | 39 | 1.4% |
| Bhutanese | 67 | 2.4% |
| Burmese | 229 | 8.3% |
| Colombian | 22 | 0.8% |
| Czechoslovakian | 6 | 0.2% |
| Eastern European | 148 | 5.4% |
| Egyptian | 6 | 0.2% |
| English | 24 | 0.9% |
| European | 13 | 0.5% |
| Filipino | 45 | 1.6% |
| French | 18 | 0.6% |
| German | 60 | 2.2% |
| Greek | 28 | 1.0% |
| Guyanese | 8 | 0.3% |
| Hungarian | 39 | 1.4% |
| Icelander | 21 | 0.8% |
| Indian (Asian) | 701 | 25.5% |
| Iranian | 192 | 7.0% |
| Irish | 42 | 1.5% |
| Israeli | 61 | 2.2% |
| Italian | 80 | 2.9% |
| Jamaican | 11 | 0.4% |
| Korean | 7 | 0.3% |
| Mexican American Indian | 19 | 0.7% |
| Northern European | 7 | 0.3% |
| Polish | 101 | 3.7% |
| Russian | 174 | 6.3% |
| Slovak | 6 | 0.2% |
| South African | 8 | 0.3% |
| South American | 22 | 0.8% |
| Subsaharan African | 8 | 0.3% |
| Syrian | 8 | 0.3% |
| Thai | 119 | 4.3% |
| Turkish | 3 | 0.1% |
| Ukrainian | 6 | 0.2% |
| Welsh | 24 | 0.9% | View All 39 Rows |
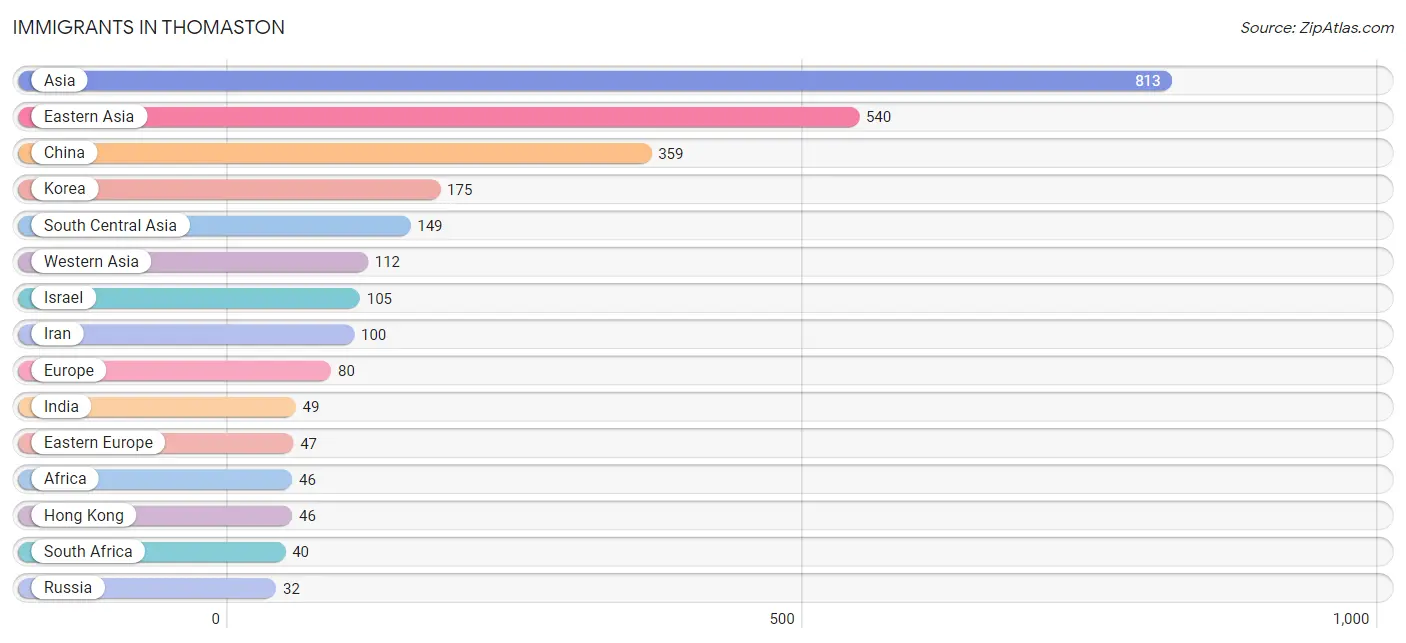
Immigrants in Thomaston
The most numerous immigrant groups reported in Thomaston came from Asia (813 | 29.6%), Eastern Asia (540 | 19.6%), China (359 | 13.1%), Korea (175 | 6.4%), and South Central Asia (149 | 5.4%), together accounting for 74.0% of all Thomaston residents.
| Immigration Origin | # Population | % Population |
| Africa | 46 | 1.7% |
| Asia | 813 | 29.6% |
| Belgium | 12 | 0.4% |
| Canada | 16 | 0.6% |
| China | 359 | 13.1% |
| Eastern Asia | 540 | 19.6% |
| Eastern Europe | 47 | 1.7% |
| Egypt | 6 | 0.2% |
| Europe | 80 | 2.9% |
| Greece | 7 | 0.3% |
| Guyana | 4 | 0.2% |
| Hong Kong | 46 | 1.7% |
| Hungary | 5 | 0.2% |
| India | 49 | 1.8% |
| Iran | 100 | 3.6% |
| Israel | 105 | 3.8% |
| Italy | 6 | 0.2% |
| Japan | 6 | 0.2% |
| Korea | 175 | 6.4% |
| Latin America | 4 | 0.2% |
| Northern Africa | 6 | 0.2% |
| Northern Europe | 8 | 0.3% |
| Philippines | 7 | 0.3% |
| Russia | 32 | 1.2% |
| Saudi Arabia | 7 | 0.3% |
| South Africa | 40 | 1.5% |
| South America | 4 | 0.2% |
| South Central Asia | 149 | 5.4% |
| South Eastern Asia | 12 | 0.4% |
| Southern Europe | 13 | 0.5% |
| Taiwan | 22 | 0.8% |
| Ukraine | 6 | 0.2% |
| Vietnam | 5 | 0.2% |
| Western Asia | 112 | 4.1% |
| Western Europe | 12 | 0.4% | View All 35 Rows |
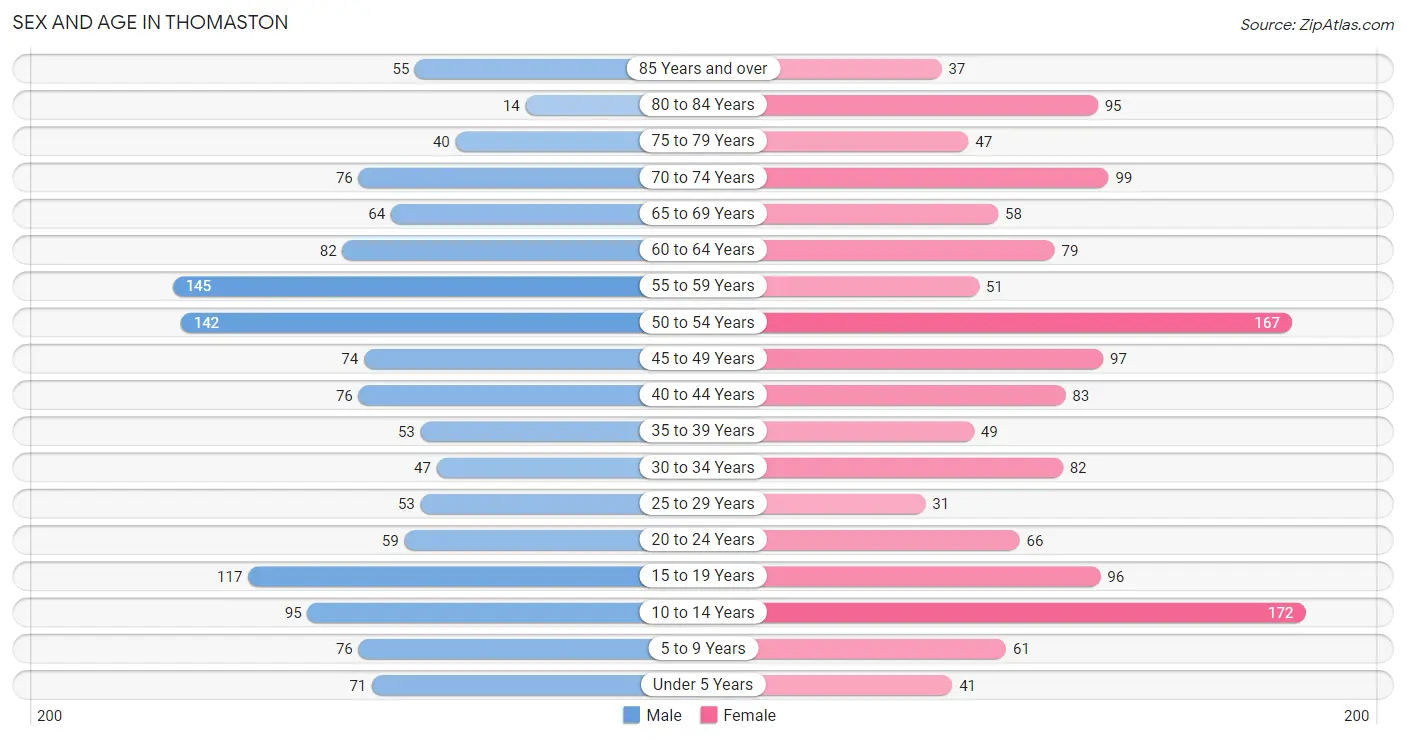
Sex and Age in Thomaston
Sex and Age in Thomaston
The most populous age groups in Thomaston are 55 to 59 Years (145 | 10.8%) for men and 10 to 14 Years (172 | 12.2%) for women.
| Age Bracket | Male | Female |
| Under 5 Years | 71 (5.3%) | 41 (2.9%) |
| 5 to 9 Years | 76 (5.7%) | 61 (4.3%) |
| 10 to 14 Years | 95 (7.1%) | 172 (12.2%) |
| 15 to 19 Years | 117 (8.7%) | 96 (6.8%) |
| 20 to 24 Years | 59 (4.4%) | 66 (4.7%) |
| 25 to 29 Years | 53 (4.0%) | 31 (2.2%) |
| 30 to 34 Years | 47 (3.5%) | 82 (5.8%) |
| 35 to 39 Years | 53 (4.0%) | 49 (3.5%) |
| 40 to 44 Years | 76 (5.7%) | 83 (5.9%) |
| 45 to 49 Years | 74 (5.5%) | 97 (6.9%) |
| 50 to 54 Years | 142 (10.6%) | 167 (11.8%) |
| 55 to 59 Years | 145 (10.8%) | 51 (3.6%) |
| 60 to 64 Years | 82 (6.1%) | 79 (5.6%) |
| 65 to 69 Years | 64 (4.8%) | 58 (4.1%) |
| 70 to 74 Years | 76 (5.7%) | 99 (7.0%) |
| 75 to 79 Years | 40 (3.0%) | 47 (3.3%) |
| 80 to 84 Years | 14 (1.1%) | 95 (6.7%) |
| 85 Years and over | 55 (4.1%) | 37 (2.6%) |
| Total | 1,339 (100.0%) | 1,411 (100.0%) |
Families and Households in Thomaston
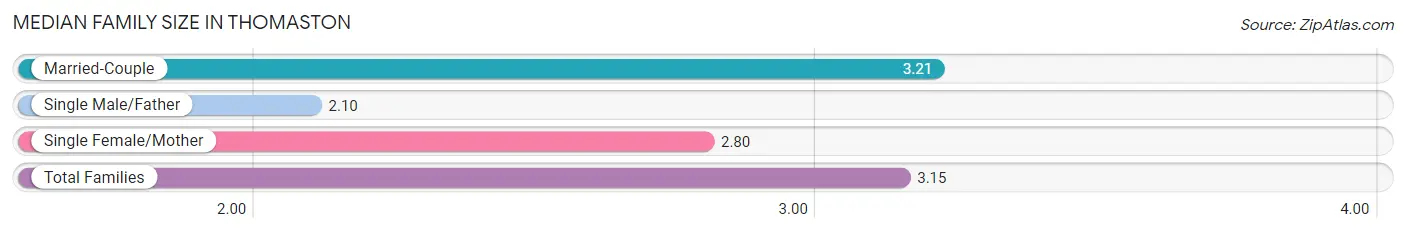
Median Family Size in Thomaston
The median family size in Thomaston is 3.15 persons per family, with married-couple families (668 | 89.4%) accounting for the largest median family size of 3.21 persons per family. On the other hand, single male/father families (10 | 1.3%) represent the smallest median family size with 2.10 persons per family.
| Family Type | # Families | Family Size |
| Married-Couple | 668 (89.4%) | 3.21 |
| Single Male/Father | 10 (1.3%) | 2.10 |
| Single Female/Mother | 69 (9.2%) | 2.80 |
| Total Families | 747 (100.0%) | 3.15 |
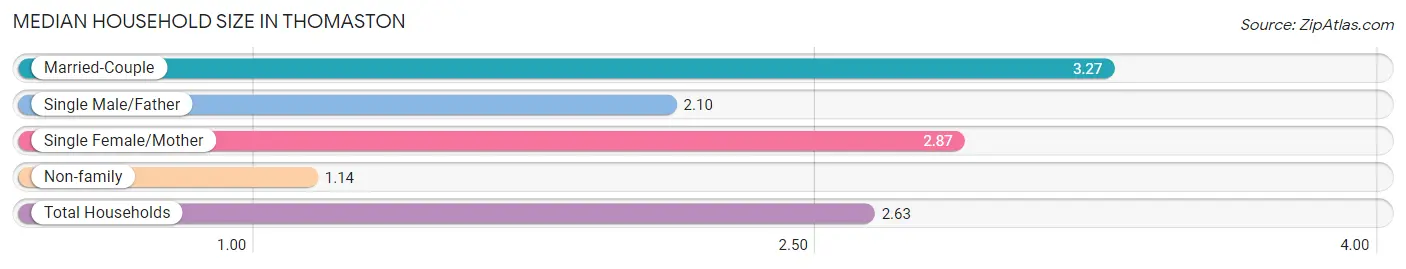
Median Household Size in Thomaston
The median household size in Thomaston is 2.63 persons per household, with married-couple households (668 | 64.0%) accounting for the largest median household size of 3.27 persons per household. non-family households (296 | 28.4%) represent the smallest median household size with 1.14 persons per household.
| Household Type | # Households | Household Size |
| Married-Couple | 668 (64.0%) | 3.27 |
| Single Male/Father | 10 (1.0%) | 2.10 |
| Single Female/Mother | 69 (6.6%) | 2.87 |
| Non-family | 296 (28.4%) | 1.14 |
| Total Households | 1,043 (100.0%) | 2.63 |
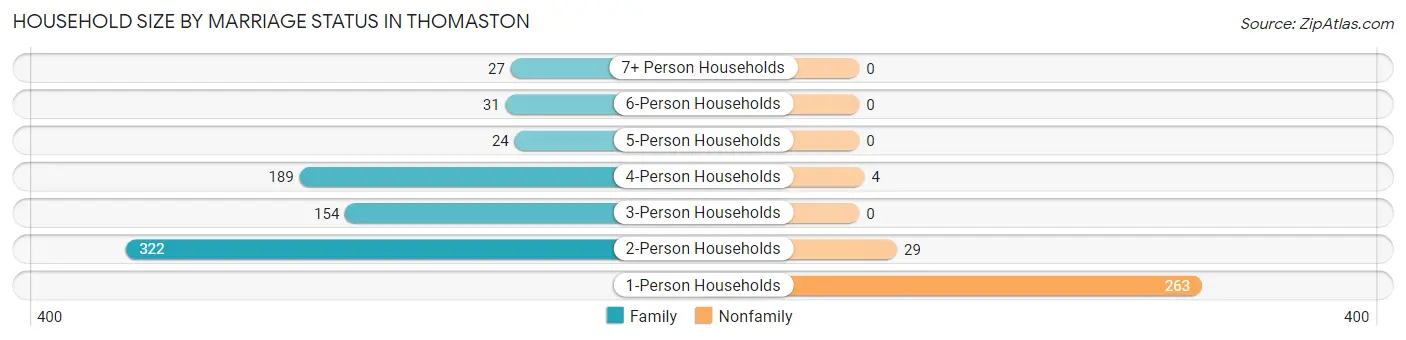
Household Size by Marriage Status in Thomaston
Out of a total of 1,043 households in Thomaston, 747 (71.6%) are family households, while 296 (28.4%) are nonfamily households. The most numerous type of family households are 2-person households, comprising 322, and the most common type of nonfamily households are 1-person households, comprising 263.
| Household Size | Family Households | Nonfamily Households |
| 1-Person Households | - | 263 (25.2%) |
| 2-Person Households | 322 (30.9%) | 29 (2.8%) |
| 3-Person Households | 154 (14.8%) | 0 (0.0%) |
| 4-Person Households | 189 (18.1%) | 4 (0.4%) |
| 5-Person Households | 24 (2.3%) | 0 (0.0%) |
| 6-Person Households | 31 (3.0%) | 0 (0.0%) |
| 7+ Person Households | 27 (2.6%) | 0 (0.0%) |
| Total | 747 (71.6%) | 296 (28.4%) |
Female Fertility in Thomaston
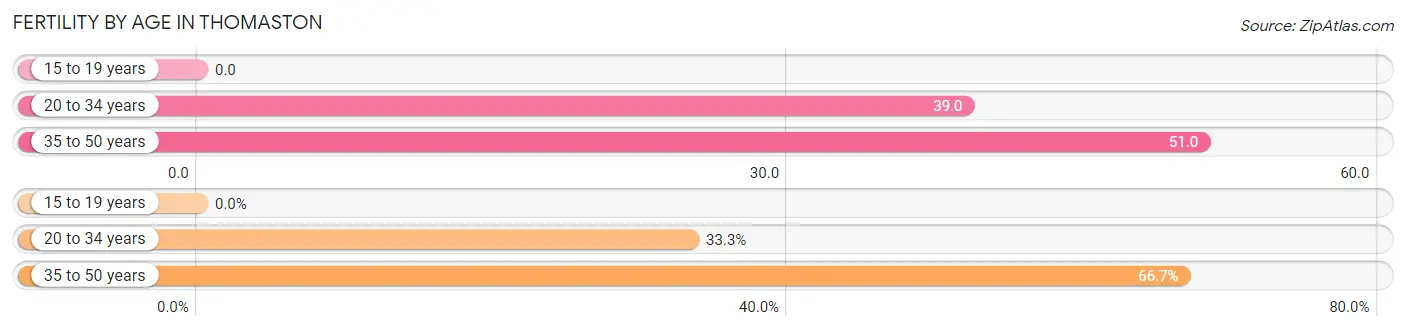
Fertility by Age in Thomaston
Average fertility rate in Thomaston is 38.0 births per 1,000 women. Women in the age bracket of 35 to 50 years have the highest fertility rate with 51.0 births per 1,000 women. Women in the age bracket of 35 to 50 years acount for 66.7% of all women with births.
| Age Bracket | Women with Births | Births / 1,000 Women |
| 15 to 19 years | 0 (0.0%) | 0.0 |
| 20 to 34 years | 7 (33.3%) | 39.0 |
| 35 to 50 years | 14 (66.7%) | 51.0 |
| Total | 21 (100.0%) | 38.0 |
Fertility by Age by Marriage Status in Thomaston
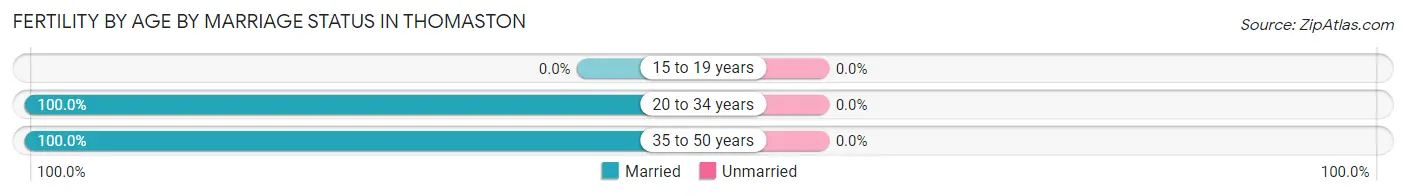
| Age Bracket | Married | Unmarried |
| 15 to 19 years | 0 (0.0%) | 0 (0.0%) |
| 20 to 34 years | 7 (100.0%) | 0 (0.0%) |
| 35 to 50 years | 14 (100.0%) | 0 (0.0%) |
| Total | 21 (100.0%) | 0 (0.0%) |
Fertility by Education in Thomaston
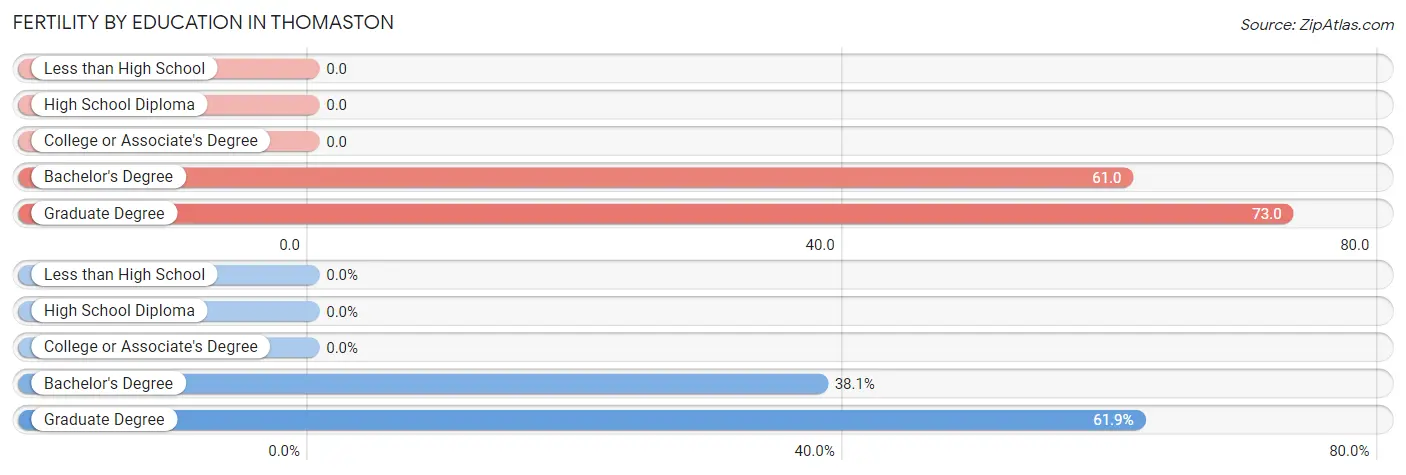
| Educational Attainment | Women with Births | Births / 1,000 Women |
| Less than High School | 0 (0.0%) | 0.0 |
| High School Diploma | 0 (0.0%) | 0.0 |
| College or Associate's Degree | 0 (0.0%) | 0.0 |
| Bachelor's Degree | 8 (38.1%) | 61.0 |
| Graduate Degree | 13 (61.9%) | 73.0 |
| Total | 21 (100.0%) | 38.0 |
Fertility by Education by Marriage Status in Thomaston
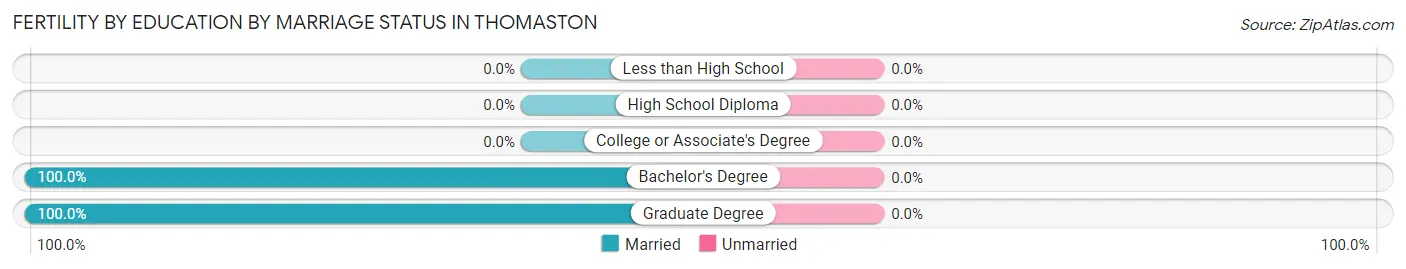
| Educational Attainment | Married | Unmarried |
| Less than High School | 0 (0.0%) | 0 (0.0%) |
| High School Diploma | 0 (0.0%) | 0 (0.0%) |
| College or Associate's Degree | 0 (0.0%) | 0 (0.0%) |
| Bachelor's Degree | 8 (100.0%) | 0 (0.0%) |
| Graduate Degree | 13 (100.0%) | 0 (0.0%) |
| Total | 21 (100.0%) | 0 (0.0%) |
Employment Characteristics in Thomaston
Employment by Class of Employer in Thomaston
Among the 1,312 employed individuals in Thomaston, private company employees (776 | 59.2%), self-employed (incorporated) (151 | 11.5%), and self-employed (not incorporated) (112 | 8.5%) make up the most common classes of employment.
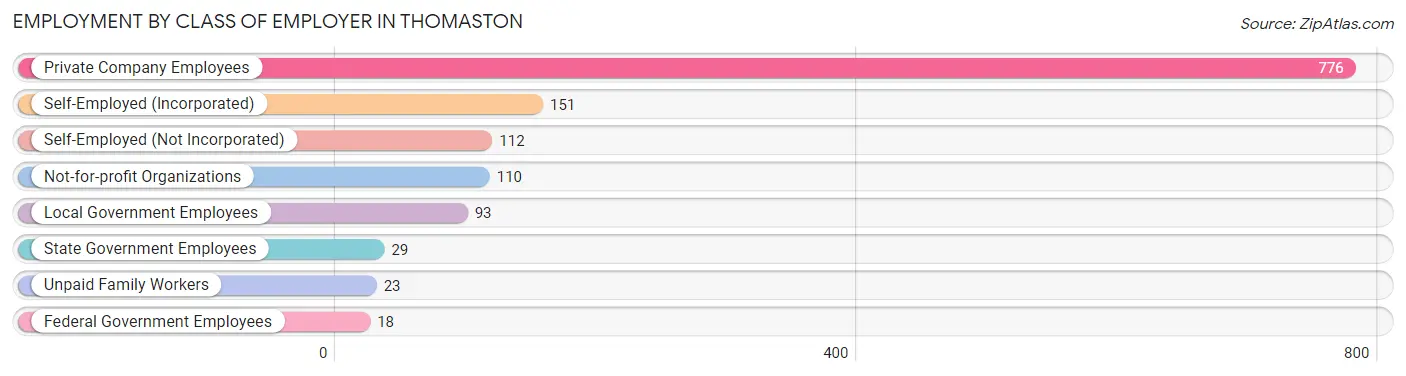
| Employer Class | # Employees | % Employees |
| Private Company Employees | 776 | 59.2% |
| Self-Employed (Incorporated) | 151 | 11.5% |
| Self-Employed (Not Incorporated) | 112 | 8.5% |
| Not-for-profit Organizations | 110 | 8.4% |
| Local Government Employees | 93 | 7.1% |
| State Government Employees | 29 | 2.2% |
| Federal Government Employees | 18 | 1.4% |
| Unpaid Family Workers | 23 | 1.8% |
| Total | 1,312 | 100.0% |
Employment Status by Age in Thomaston
According to the labor force statistics for Thomaston, out of the total population over 16 years of age (2,201), 63.1% or 1,389 individuals are in the labor force, with 3.2% or 44 of them unemployed. The age group with the highest labor force participation rate is 55 to 59 years, with 92.3% or 181 individuals in the labor force. Within the labor force, the 20 to 24 years age range has the highest percentage of unemployed individuals, with 27.5% or 19 of them being unemployed.
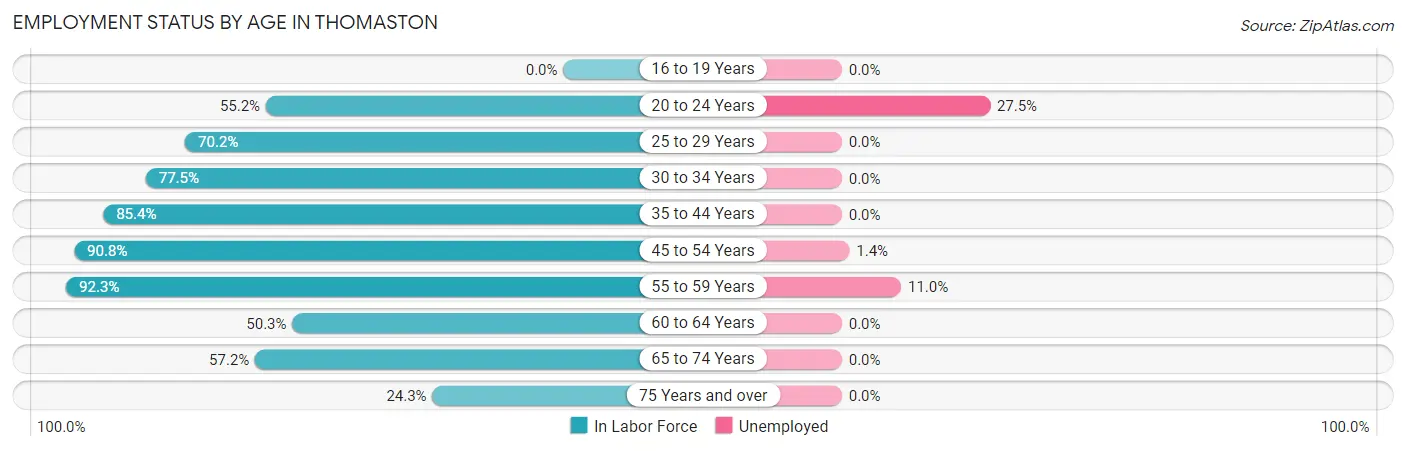
| Age Bracket | In Labor Force | Unemployed |
| 16 to 19 Years | 0 (0.0%) | 0 (0.0%) |
| 20 to 24 Years | 69 (55.2%) | 19 (27.5%) |
| 25 to 29 Years | 59 (70.2%) | 0 (0.0%) |
| 30 to 34 Years | 100 (77.5%) | 0 (0.0%) |
| 35 to 44 Years | 223 (85.4%) | 0 (0.0%) |
| 45 to 54 Years | 436 (90.8%) | 6 (1.4%) |
| 55 to 59 Years | 181 (92.3%) | 20 (11.0%) |
| 60 to 64 Years | 81 (50.3%) | 0 (0.0%) |
| 65 to 74 Years | 170 (57.2%) | 0 (0.0%) |
| 75 Years and over | 70 (24.3%) | 0 (0.0%) |
| Total | 1,389 (63.1%) | 44 (3.2%) |
Employment Status by Educational Attainment in Thomaston
According to labor force statistics for Thomaston, 82.4% of individuals (1,080) out of the total population between 25 and 64 years of age (1,311) are in the labor force, with 2.4% or 26 of them being unemployed. The group with the highest labor force participation rate are those with the educational attainment of less than high school, with 90.4% or 47 individuals in the labor force. Within the labor force, individuals with bachelor's degree or higher education have the highest percentage of unemployment, with 3.5% or 26 of them being unemployed.
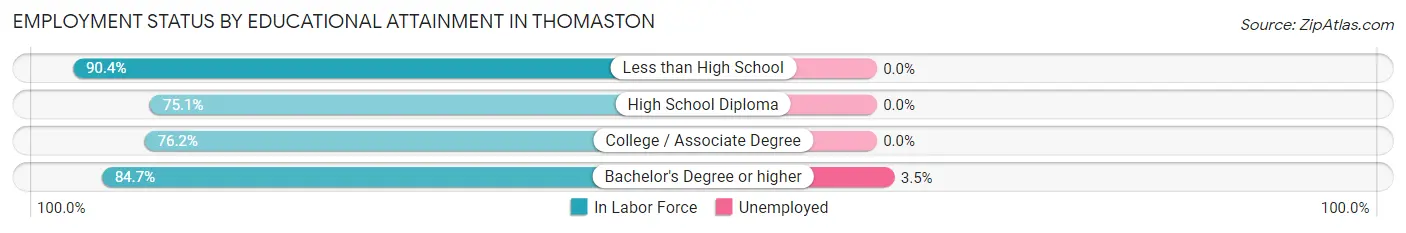
| Educational Attainment | In Labor Force | Unemployed |
| Less than High School | 47 (90.4%) | 0 (0.0%) |
| High School Diploma | 145 (75.1%) | 0 (0.0%) |
| College / Associate Degree | 138 (76.2%) | 0 (0.0%) |
| Bachelor's Degree or higher | 750 (84.7%) | 31 (3.5%) |
| Total | 1,080 (82.4%) | 31 (2.4%) |
Employment Occupations by Sex in Thomaston
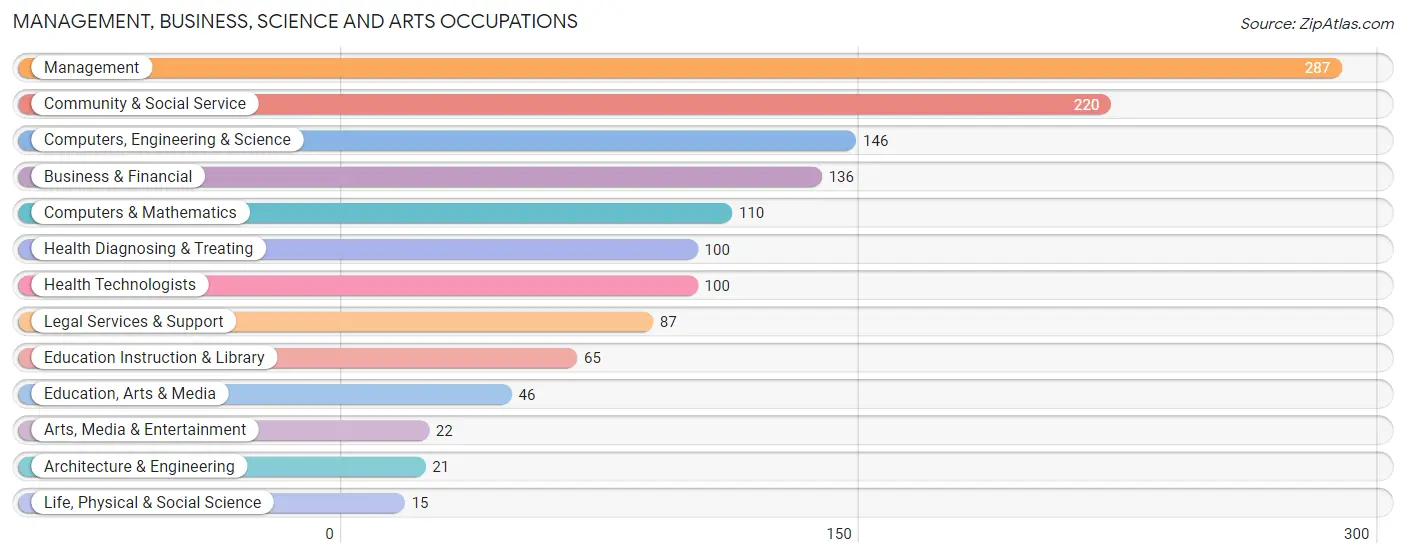
Management, Business, Science and Arts Occupations
The most common Management, Business, Science and Arts occupations in Thomaston are Management (287 | 21.3%), Community & Social Service (220 | 16.4%), Computers, Engineering & Science (146 | 10.9%), Business & Financial (136 | 10.1%), and Computers & Mathematics (110 | 8.2%).
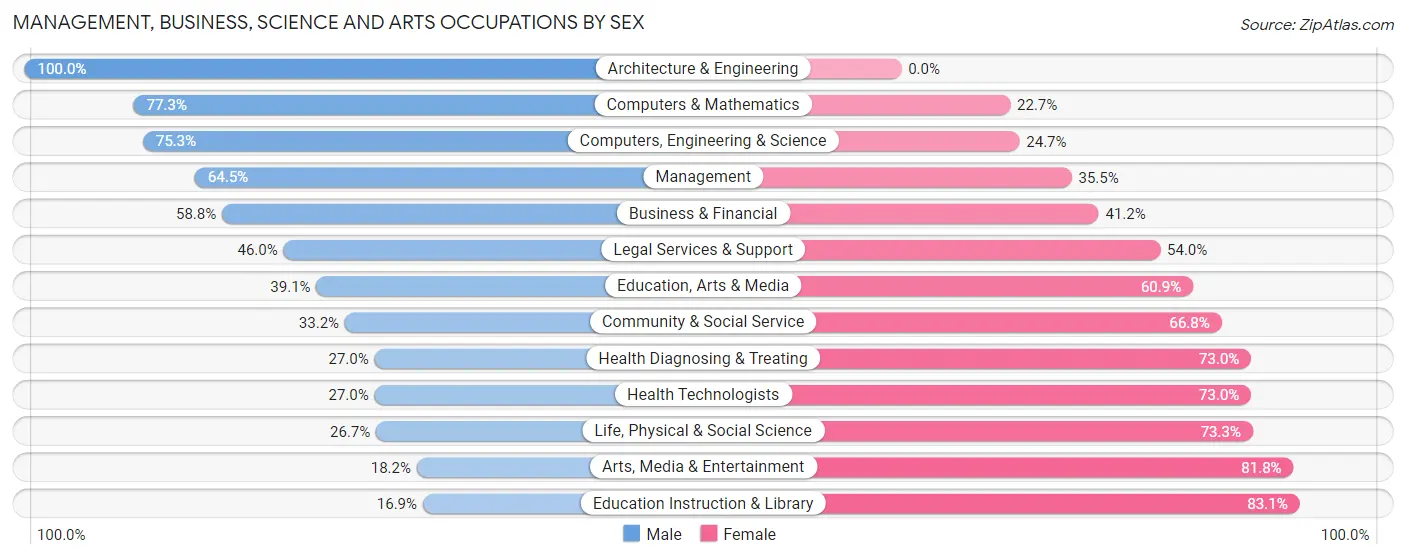
Management, Business, Science and Arts Occupations by Sex
Within the Management, Business, Science and Arts occupations in Thomaston, the most male-oriented occupations are Architecture & Engineering (100.0%), Computers & Mathematics (77.3%), and Computers, Engineering & Science (75.3%), while the most female-oriented occupations are Education Instruction & Library (83.1%), Arts, Media & Entertainment (81.8%), and Life, Physical & Social Science (73.3%).
| Occupation | Male | Female |
| Management | 185 (64.5%) | 102 (35.5%) |
| Business & Financial | 80 (58.8%) | 56 (41.2%) |
| Computers, Engineering & Science | 110 (75.3%) | 36 (24.7%) |
| Computers & Mathematics | 85 (77.3%) | 25 (22.7%) |
| Architecture & Engineering | 21 (100.0%) | 0 (0.0%) |
| Life, Physical & Social Science | 4 (26.7%) | 11 (73.3%) |
| Community & Social Service | 73 (33.2%) | 147 (66.8%) |
| Education, Arts & Media | 18 (39.1%) | 28 (60.9%) |
| Legal Services & Support | 40 (46.0%) | 47 (54.0%) |
| Education Instruction & Library | 11 (16.9%) | 54 (83.1%) |
| Arts, Media & Entertainment | 4 (18.2%) | 18 (81.8%) |
| Health Diagnosing & Treating | 27 (27.0%) | 73 (73.0%) |
| Health Technologists | 27 (27.0%) | 73 (73.0%) |
| Total (Category) | 475 (53.4%) | 414 (46.6%) |
| Total (Overall) | 699 (52.0%) | 645 (48.0%) |
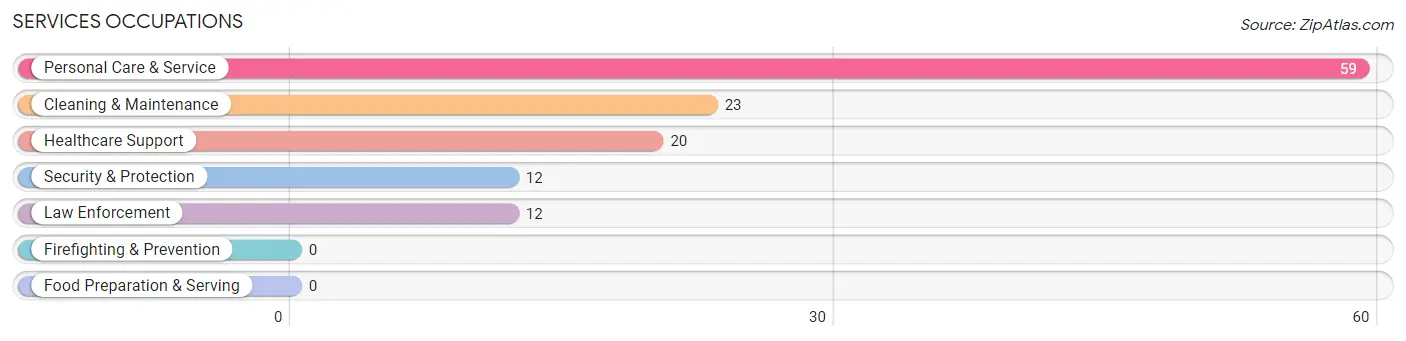
Services Occupations
The most common Services occupations in Thomaston are Personal Care & Service (59 | 4.4%), Cleaning & Maintenance (23 | 1.7%), Healthcare Support (20 | 1.5%), Security & Protection (12 | 0.9%), and Law Enforcement (12 | 0.9%).
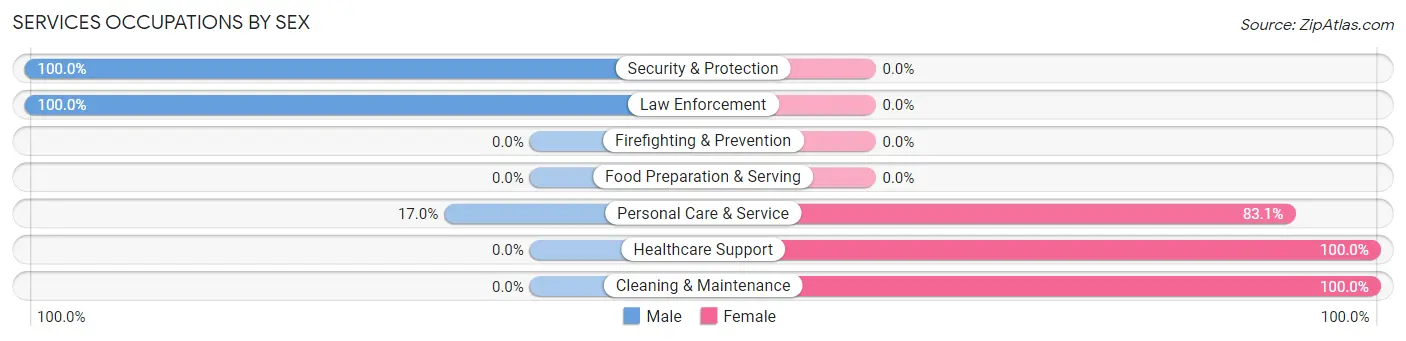
Services Occupations by Sex
Within the Services occupations in Thomaston, the most male-oriented occupations are Security & Protection (100.0%), Law Enforcement (100.0%), and Personal Care & Service (17.0%), while the most female-oriented occupations are Healthcare Support (100.0%), Cleaning & Maintenance (100.0%), and Personal Care & Service (83.1%).
| Occupation | Male | Female |
| Healthcare Support | 0 (0.0%) | 20 (100.0%) |
| Security & Protection | 12 (100.0%) | 0 (0.0%) |
| Firefighting & Prevention | 0 (0.0%) | 0 (0.0%) |
| Law Enforcement | 12 (100.0%) | 0 (0.0%) |
| Food Preparation & Serving | 0 (0.0%) | 0 (0.0%) |
| Cleaning & Maintenance | 0 (0.0%) | 23 (100.0%) |
| Personal Care & Service | 10 (17.0%) | 49 (83.1%) |
| Total (Category) | 22 (19.3%) | 92 (80.7%) |
| Total (Overall) | 699 (52.0%) | 645 (48.0%) |
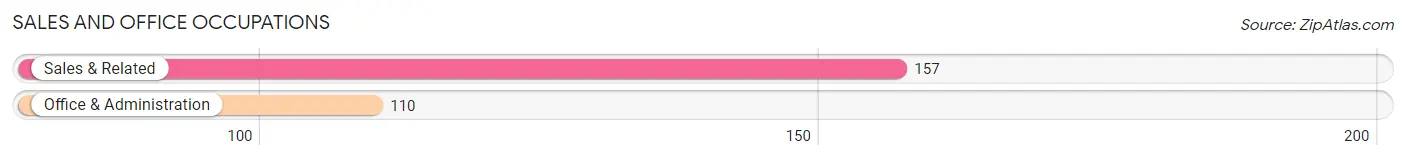
Sales and Office Occupations
The most common Sales and Office occupations in Thomaston are Sales & Related (157 | 11.7%), and Office & Administration (110 | 8.2%).
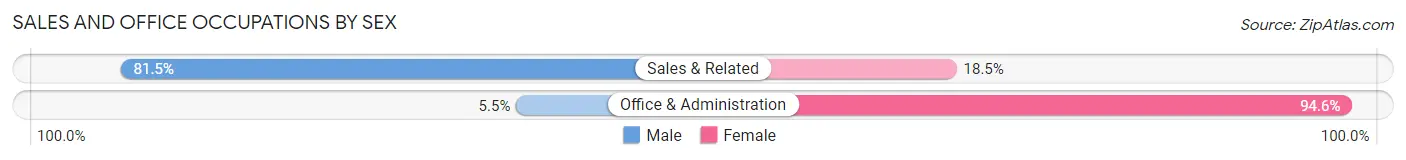
Sales and Office Occupations by Sex
| Occupation | Male | Female |
| Sales & Related | 128 (81.5%) | 29 (18.5%) |
| Office & Administration | 6 (5.4%) | 104 (94.6%) |
| Total (Category) | 134 (50.2%) | 133 (49.8%) |
| Total (Overall) | 699 (52.0%) | 645 (48.0%) |
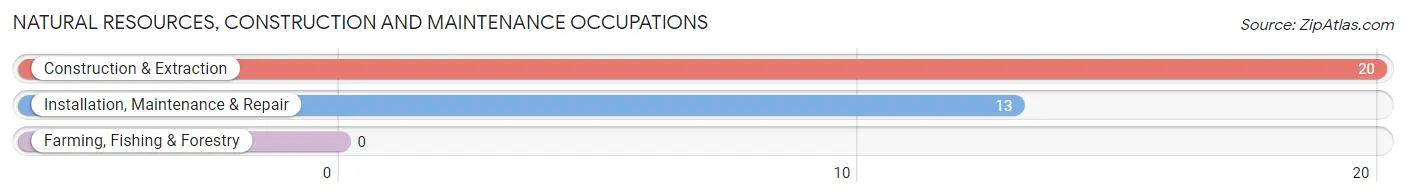
Natural Resources, Construction and Maintenance Occupations
The most common Natural Resources, Construction and Maintenance occupations in Thomaston are Construction & Extraction (20 | 1.5%), and Installation, Maintenance & Repair (13 | 1.0%).
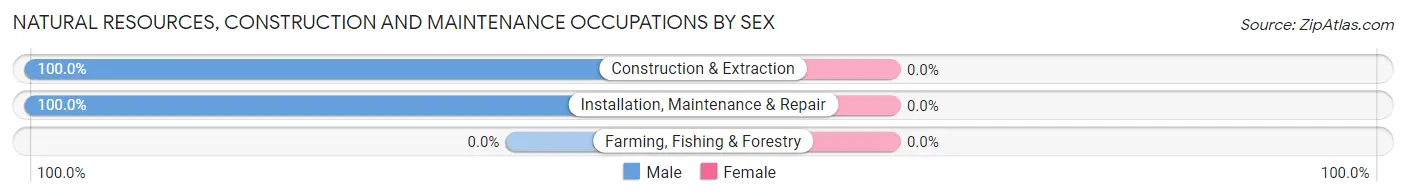
Natural Resources, Construction and Maintenance Occupations by Sex
| Occupation | Male | Female |
| Farming, Fishing & Forestry | 0 (0.0%) | 0 (0.0%) |
| Construction & Extraction | 20 (100.0%) | 0 (0.0%) |
| Installation, Maintenance & Repair | 13 (100.0%) | 0 (0.0%) |
| Total (Category) | 33 (100.0%) | 0 (0.0%) |
| Total (Overall) | 699 (52.0%) | 645 (48.0%) |
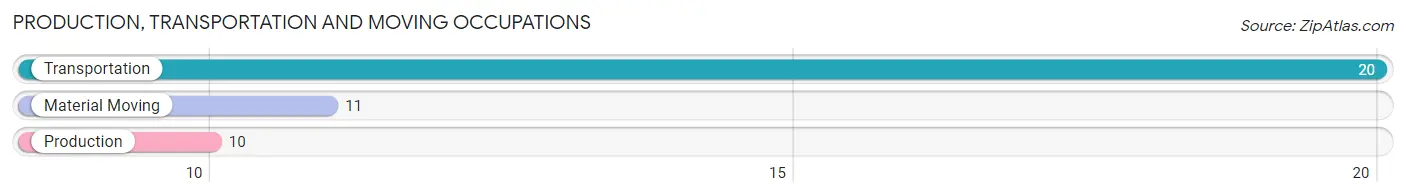
Production, Transportation and Moving Occupations
The most common Production, Transportation and Moving occupations in Thomaston are Transportation (20 | 1.5%), Material Moving (11 | 0.8%), and Production (10 | 0.7%).
Production, Transportation and Moving Occupations by Sex
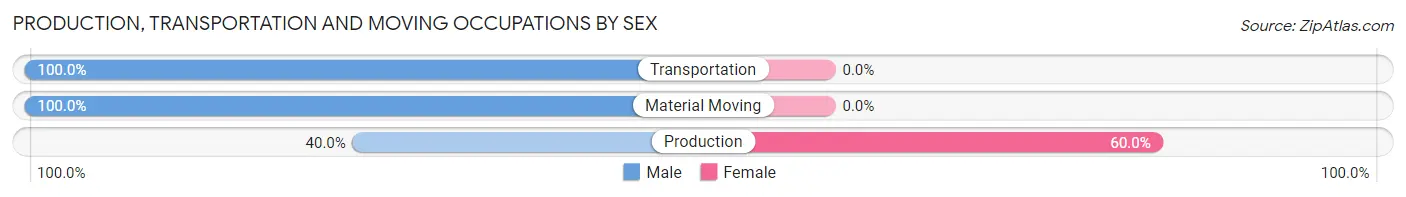
| Occupation | Male | Female |
| Production | 4 (40.0%) | 6 (60.0%) |
| Transportation | 20 (100.0%) | 0 (0.0%) |
| Material Moving | 11 (100.0%) | 0 (0.0%) |
| Total (Category) | 35 (85.4%) | 6 (14.6%) |
| Total (Overall) | 699 (52.0%) | 645 (48.0%) |
Employment Industries by Sex in Thomaston
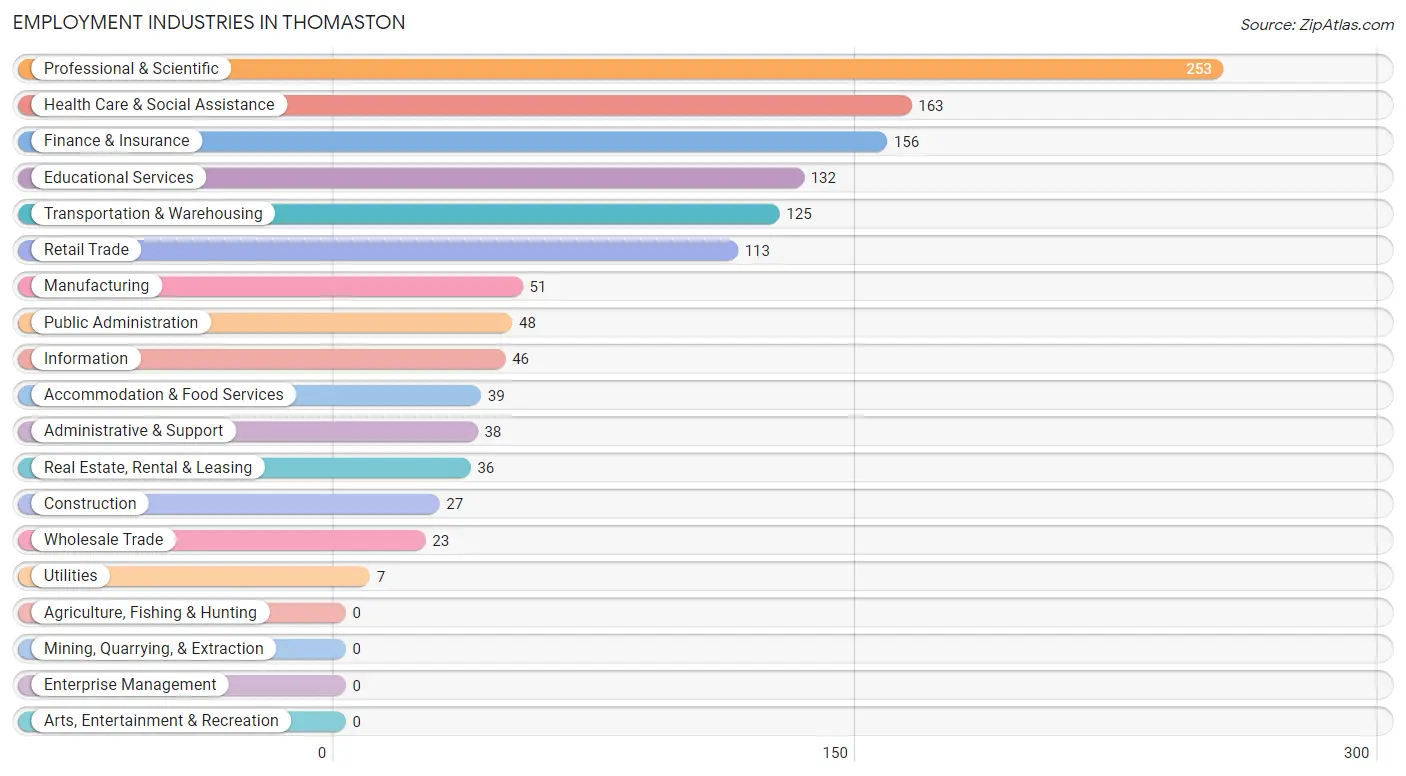
Employment Industries in Thomaston
The major employment industries in Thomaston include Professional & Scientific (253 | 18.8%), Health Care & Social Assistance (163 | 12.1%), Finance & Insurance (156 | 11.6%), Educational Services (132 | 9.8%), and Transportation & Warehousing (125 | 9.3%).
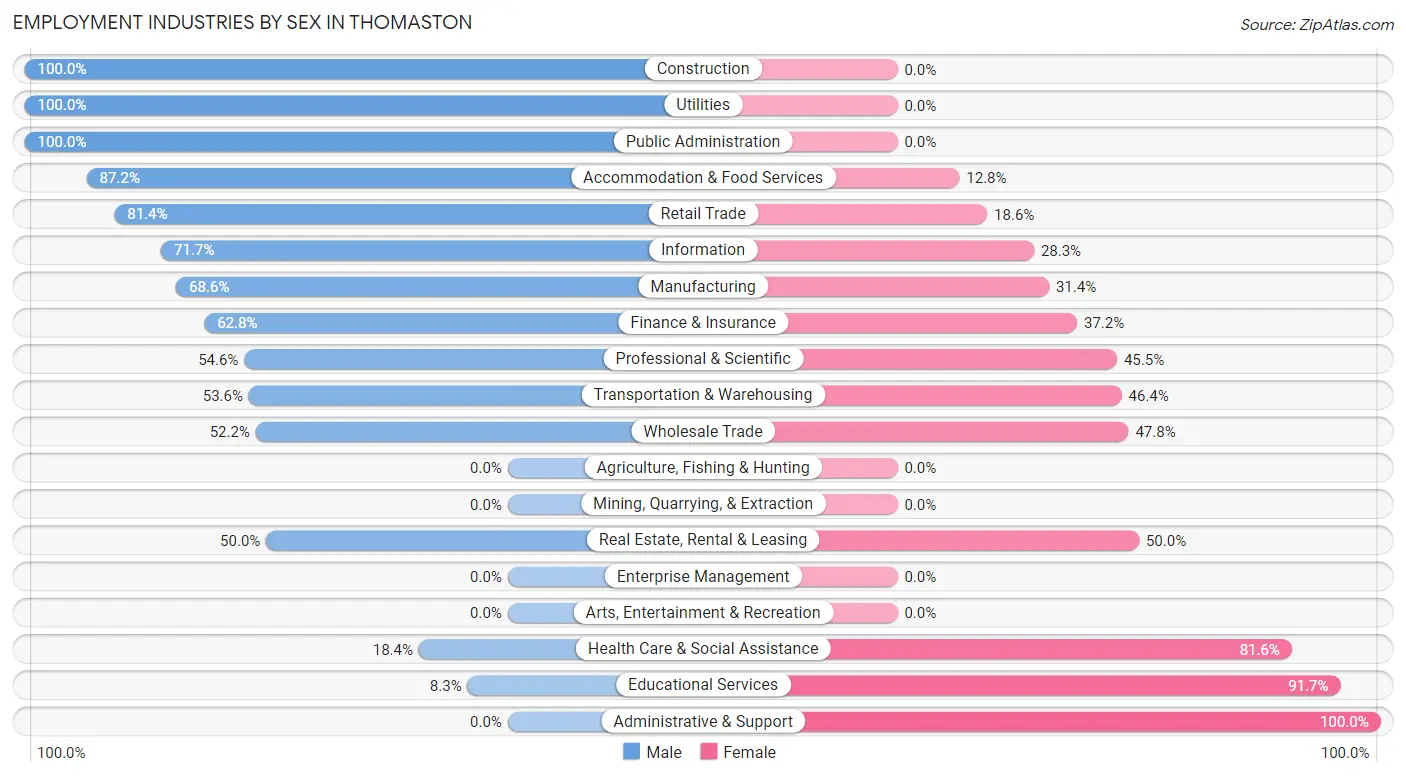
Employment Industries by Sex in Thomaston
The Thomaston industries that see more men than women are Construction (100.0%), Utilities (100.0%), and Public Administration (100.0%), whereas the industries that tend to have a higher number of women are Administrative & Support (100.0%), Educational Services (91.7%), and Health Care & Social Assistance (81.6%).
| Industry | Male | Female |
| Agriculture, Fishing & Hunting | 0 (0.0%) | 0 (0.0%) |
| Mining, Quarrying, & Extraction | 0 (0.0%) | 0 (0.0%) |
| Construction | 27 (100.0%) | 0 (0.0%) |
| Manufacturing | 35 (68.6%) | 16 (31.4%) |
| Wholesale Trade | 12 (52.2%) | 11 (47.8%) |
| Retail Trade | 92 (81.4%) | 21 (18.6%) |
| Transportation & Warehousing | 67 (53.6%) | 58 (46.4%) |
| Utilities | 7 (100.0%) | 0 (0.0%) |
| Information | 33 (71.7%) | 13 (28.3%) |
| Finance & Insurance | 98 (62.8%) | 58 (37.2%) |
| Real Estate, Rental & Leasing | 18 (50.0%) | 18 (50.0%) |
| Professional & Scientific | 138 (54.5%) | 115 (45.5%) |
| Enterprise Management | 0 (0.0%) | 0 (0.0%) |
| Administrative & Support | 0 (0.0%) | 38 (100.0%) |
| Educational Services | 11 (8.3%) | 121 (91.7%) |
| Health Care & Social Assistance | 30 (18.4%) | 133 (81.6%) |
| Arts, Entertainment & Recreation | 0 (0.0%) | 0 (0.0%) |
| Accommodation & Food Services | 34 (87.2%) | 5 (12.8%) |
| Public Administration | 48 (100.0%) | 0 (0.0%) |
| Total | 699 (52.0%) | 645 (48.0%) |
Education in Thomaston
School Enrollment in Thomaston
The most common levels of schooling among the 721 students in Thomaston are high school (219 | 30.4%), middle school (212 | 29.4%), and elementary school (100 | 13.9%).
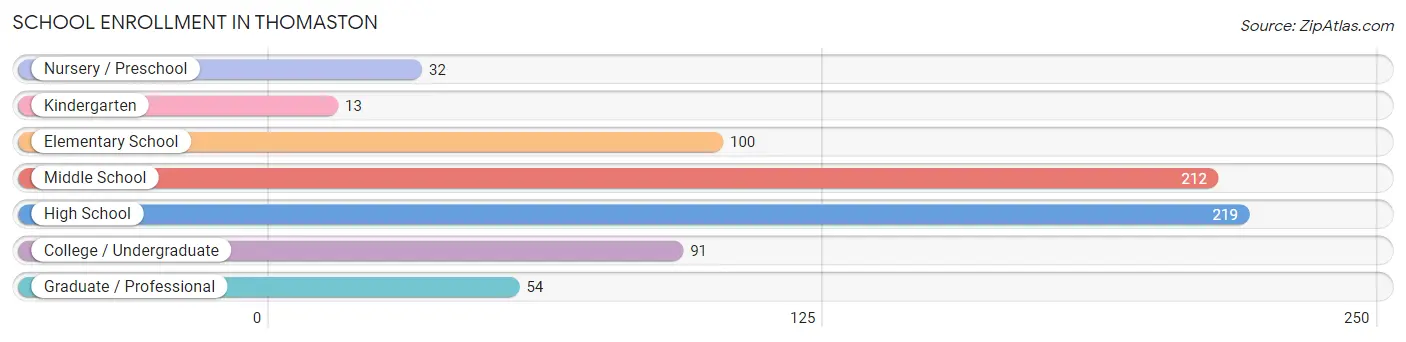
| School Level | # Students | % Students |
| Nursery / Preschool | 32 | 4.4% |
| Kindergarten | 13 | 1.8% |
| Elementary School | 100 | 13.9% |
| Middle School | 212 | 29.4% |
| High School | 219 | 30.4% |
| College / Undergraduate | 91 | 12.6% |
| Graduate / Professional | 54 | 7.5% |
| Total | 721 | 100.0% |
School Enrollment by Age by Funding Source in Thomaston
Out of a total of 721 students who are enrolled in schools in Thomaston, 253 (35.1%) attend a private institution, while the remaining 468 (64.9%) are enrolled in public schools. The age group of 25 to 34 year olds has the highest likelihood of being enrolled in private schools, with 7 (100.0% in the age bracket) enrolled. Conversely, the age group of 35 years and over has the lowest likelihood of being enrolled in a private school, with 8 (100.0% in the age bracket) attending a public institution.
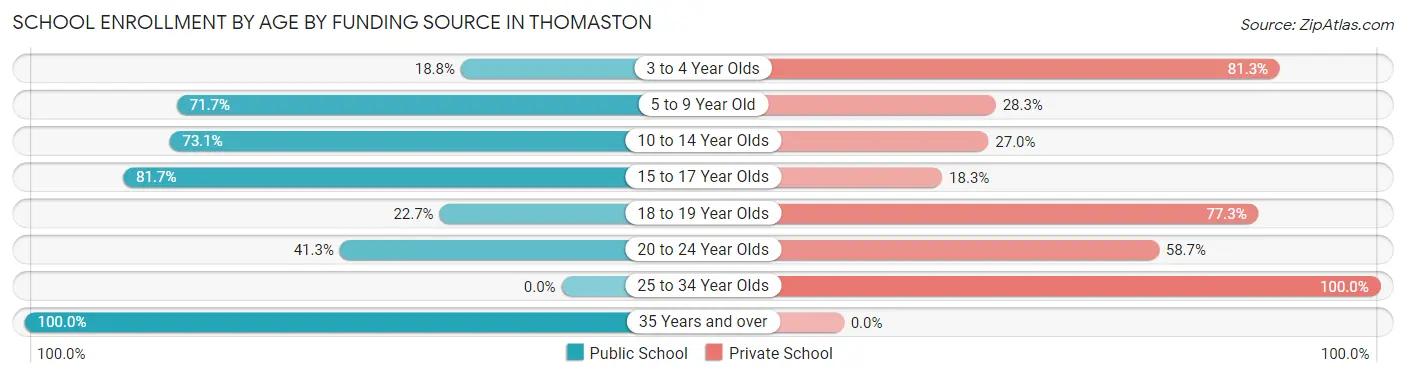
| Age Bracket | Public School | Private School |
| 3 to 4 Year Olds | 6 (18.8%) | 26 (81.2%) |
| 5 to 9 Year Old | 81 (71.7%) | 32 (28.3%) |
| 10 to 14 Year Olds | 187 (73.1%) | 69 (27.0%) |
| 15 to 17 Year Olds | 138 (81.7%) | 31 (18.3%) |
| 18 to 19 Year Olds | 10 (22.7%) | 34 (77.3%) |
| 20 to 24 Year Olds | 38 (41.3%) | 54 (58.7%) |
| 25 to 34 Year Olds | 0 (0.0%) | 7 (100.0%) |
| 35 Years and over | 8 (100.0%) | 0 (0.0%) |
| Total | 468 (64.9%) | 253 (35.1%) |
Educational Attainment by Field of Study in Thomaston
Business (255 | 17.9%), social sciences (236 | 16.6%), literature & languages (139 | 9.8%), education (118 | 8.3%), and science & technology (109 | 7.7%) are the most common fields of study among 1,422 individuals in Thomaston who have obtained a bachelor's degree or higher.
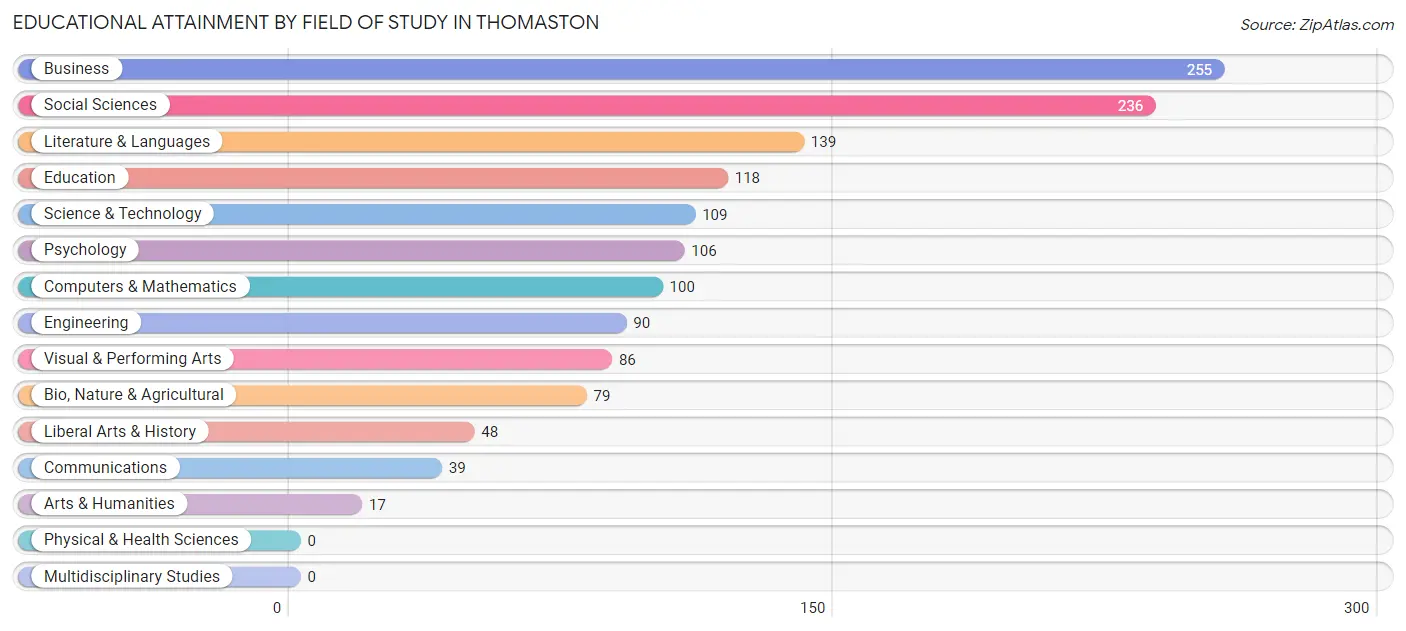
| Field of Study | # Graduates | % Graduates |
| Computers & Mathematics | 100 | 7.0% |
| Bio, Nature & Agricultural | 79 | 5.6% |
| Physical & Health Sciences | 0 | 0.0% |
| Psychology | 106 | 7.4% |
| Social Sciences | 236 | 16.6% |
| Engineering | 90 | 6.3% |
| Multidisciplinary Studies | 0 | 0.0% |
| Science & Technology | 109 | 7.7% |
| Business | 255 | 17.9% |
| Education | 118 | 8.3% |
| Literature & Languages | 139 | 9.8% |
| Liberal Arts & History | 48 | 3.4% |
| Visual & Performing Arts | 86 | 6.0% |
| Communications | 39 | 2.7% |
| Arts & Humanities | 17 | 1.2% |
| Total | 1,422 | 100.0% |
Transportation & Commute in Thomaston
Vehicle Availability by Sex in Thomaston
The most prevalent vehicle ownership categories in Thomaston are males with 2 vehicles (390, accounting for 56.8%) and females with 2 vehicles (319, making up 62.9%).
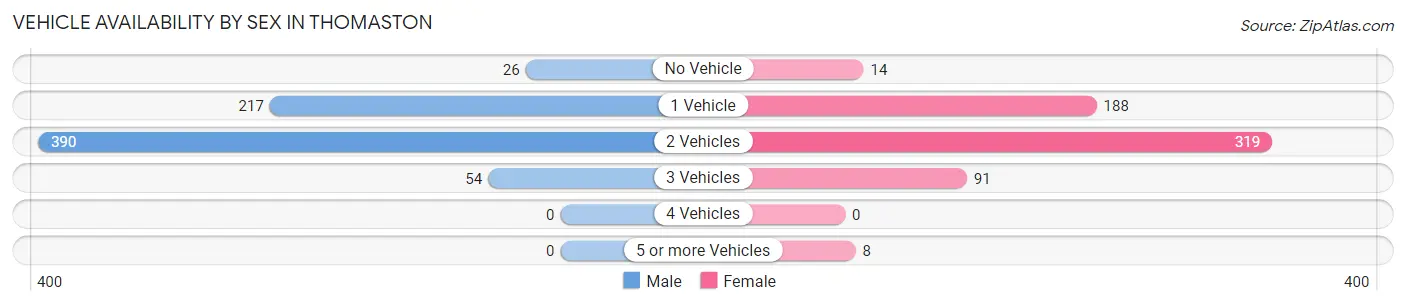
| Vehicles Available | Male | Female |
| No Vehicle | 26 (3.8%) | 14 (2.3%) |
| 1 Vehicle | 217 (31.6%) | 188 (30.3%) |
| 2 Vehicles | 390 (56.8%) | 319 (51.4%) |
| 3 Vehicles | 54 (7.9%) | 91 (14.7%) |
| 4 Vehicles | 0 (0.0%) | 0 (0.0%) |
| 5 or more Vehicles | 0 (0.0%) | 8 (1.3%) |
| Total | 687 (100.0%) | 620 (100.0%) |
Commute Time in Thomaston
The most frequently occuring commute durations in Thomaston are 60 to 89 minutes (266 commuters, 24.4%), 20 to 24 minutes (136 commuters, 12.4%), and 45 to 59 minutes (121 commuters, 11.1%).
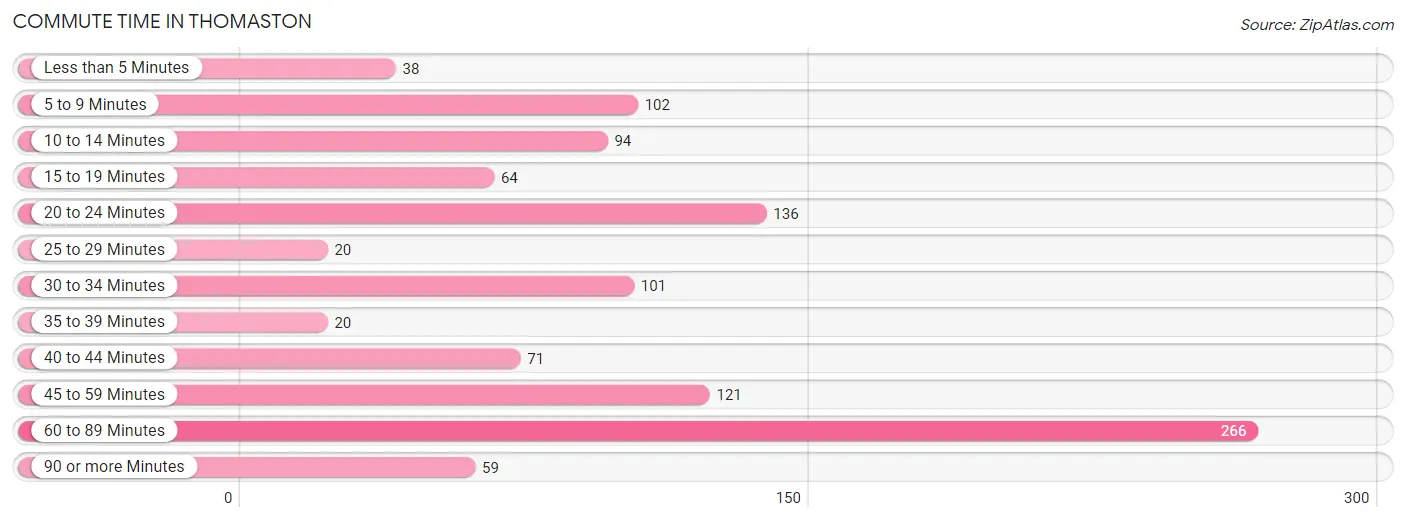
| Commute Time | # Commuters | % Commuters |
| Less than 5 Minutes | 38 | 3.5% |
| 5 to 9 Minutes | 102 | 9.3% |
| 10 to 14 Minutes | 94 | 8.6% |
| 15 to 19 Minutes | 64 | 5.9% |
| 20 to 24 Minutes | 136 | 12.4% |
| 25 to 29 Minutes | 20 | 1.8% |
| 30 to 34 Minutes | 101 | 9.2% |
| 35 to 39 Minutes | 20 | 1.8% |
| 40 to 44 Minutes | 71 | 6.5% |
| 45 to 59 Minutes | 121 | 11.1% |
| 60 to 89 Minutes | 266 | 24.4% |
| 90 or more Minutes | 59 | 5.4% |
Commute Time by Sex in Thomaston
The most common commute times in Thomaston are 60 to 89 minutes (153 commuters, 25.8%) for males and 60 to 89 minutes (113 commuters, 22.7%) for females.
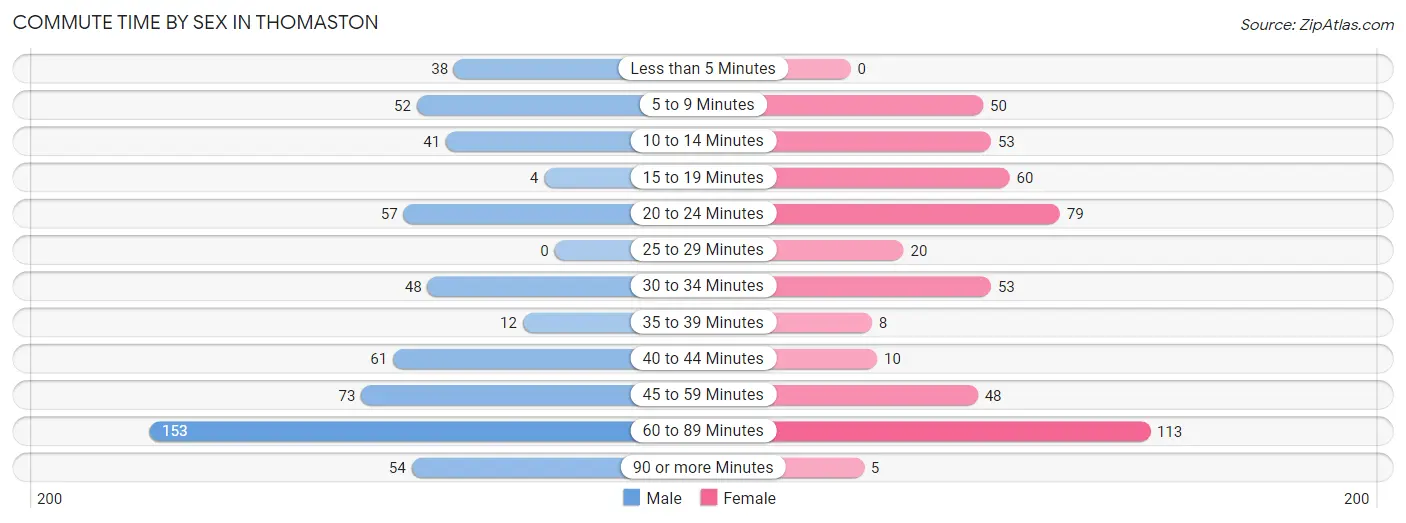
| Commute Time | Male | Female |
| Less than 5 Minutes | 38 (6.4%) | 0 (0.0%) |
| 5 to 9 Minutes | 52 (8.8%) | 50 (10.0%) |
| 10 to 14 Minutes | 41 (6.9%) | 53 (10.6%) |
| 15 to 19 Minutes | 4 (0.7%) | 60 (12.0%) |
| 20 to 24 Minutes | 57 (9.6%) | 79 (15.8%) |
| 25 to 29 Minutes | 0 (0.0%) | 20 (4.0%) |
| 30 to 34 Minutes | 48 (8.1%) | 53 (10.6%) |
| 35 to 39 Minutes | 12 (2.0%) | 8 (1.6%) |
| 40 to 44 Minutes | 61 (10.3%) | 10 (2.0%) |
| 45 to 59 Minutes | 73 (12.3%) | 48 (9.6%) |
| 60 to 89 Minutes | 153 (25.8%) | 113 (22.7%) |
| 90 or more Minutes | 54 (9.1%) | 5 (1.0%) |
Time of Departure to Work by Sex in Thomaston
The most frequent times of departure to work in Thomaston are 9:00 AM to 9:59 AM (188, 31.7%) for males and 7:30 AM to 7:59 AM (117, 23.4%) for females.
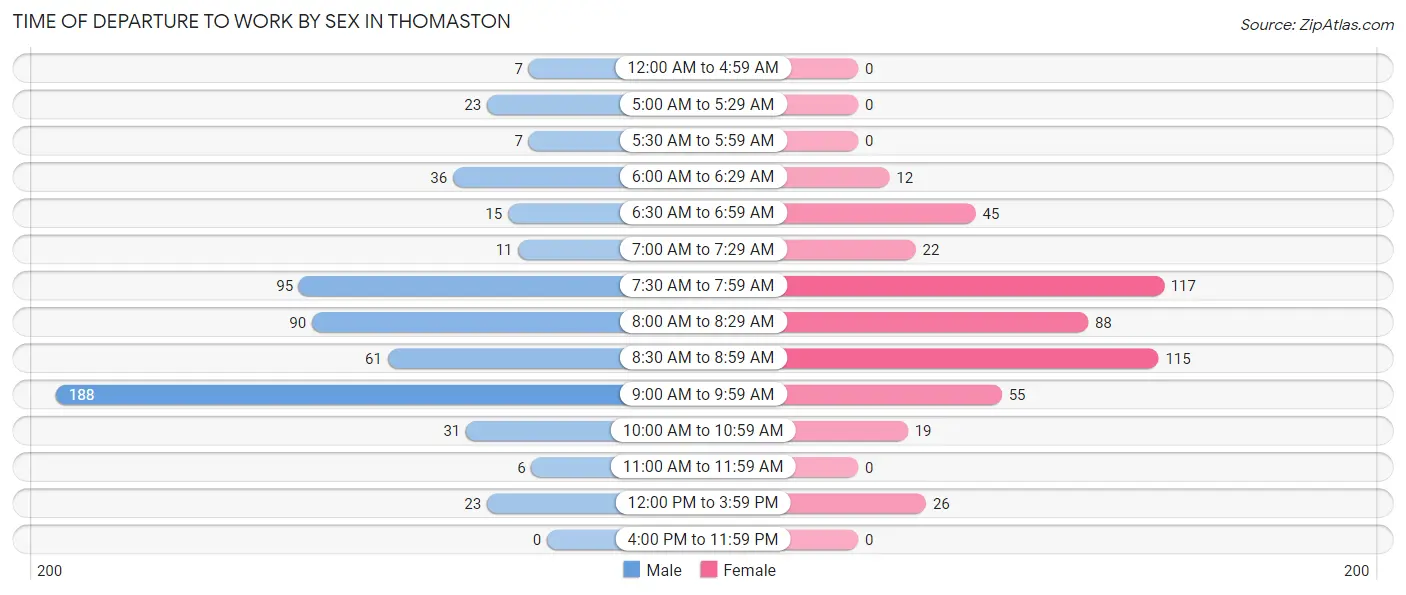
| Time of Departure | Male | Female |
| 12:00 AM to 4:59 AM | 7 (1.2%) | 0 (0.0%) |
| 5:00 AM to 5:29 AM | 23 (3.9%) | 0 (0.0%) |
| 5:30 AM to 5:59 AM | 7 (1.2%) | 0 (0.0%) |
| 6:00 AM to 6:29 AM | 36 (6.1%) | 12 (2.4%) |
| 6:30 AM to 6:59 AM | 15 (2.5%) | 45 (9.0%) |
| 7:00 AM to 7:29 AM | 11 (1.8%) | 22 (4.4%) |
| 7:30 AM to 7:59 AM | 95 (16.0%) | 117 (23.4%) |
| 8:00 AM to 8:29 AM | 90 (15.2%) | 88 (17.6%) |
| 8:30 AM to 8:59 AM | 61 (10.3%) | 115 (23.1%) |
| 9:00 AM to 9:59 AM | 188 (31.7%) | 55 (11.0%) |
| 10:00 AM to 10:59 AM | 31 (5.2%) | 19 (3.8%) |
| 11:00 AM to 11:59 AM | 6 (1.0%) | 0 (0.0%) |
| 12:00 PM to 3:59 PM | 23 (3.9%) | 26 (5.2%) |
| 4:00 PM to 11:59 PM | 0 (0.0%) | 0 (0.0%) |
| Total | 593 (100.0%) | 499 (100.0%) |
Housing Occupancy in Thomaston
Occupancy by Ownership in Thomaston
Of the total 1,043 dwellings in Thomaston, owner-occupied units account for 918 (88.0%), while renter-occupied units make up 125 (12.0%).
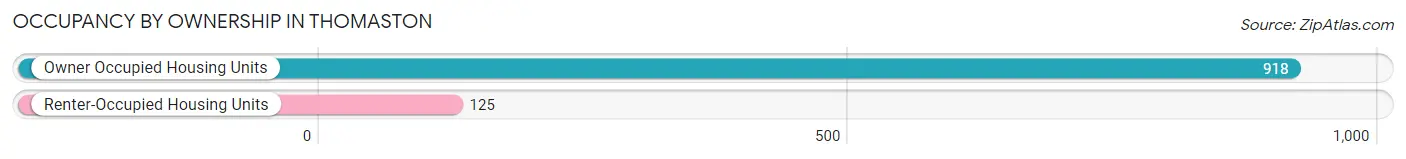
| Occupancy | # Housing Units | % Housing Units |
| Owner Occupied Housing Units | 918 | 88.0% |
| Renter-Occupied Housing Units | 125 | 12.0% |
| Total Occupied Housing Units | 1,043 | 100.0% |
Occupancy by Household Size in Thomaston
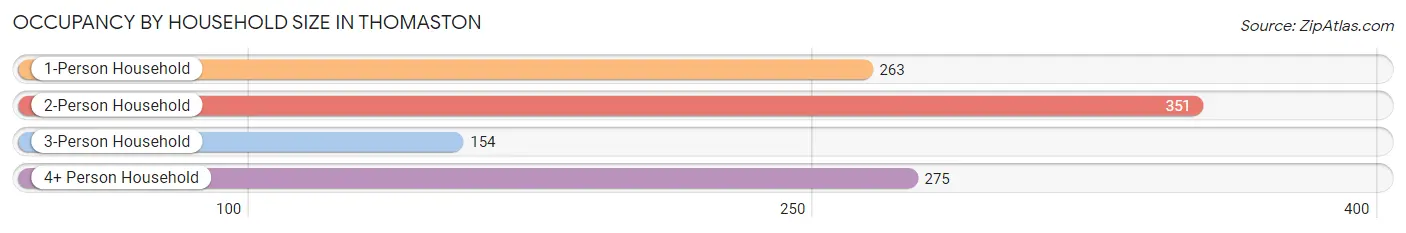
| Household Size | # Housing Units | % Housing Units |
| 1-Person Household | 263 | 25.2% |
| 2-Person Household | 351 | 33.7% |
| 3-Person Household | 154 | 14.8% |
| 4+ Person Household | 275 | 26.4% |
| Total Housing Units | 1,043 | 100.0% |
Occupancy by Ownership by Household Size in Thomaston
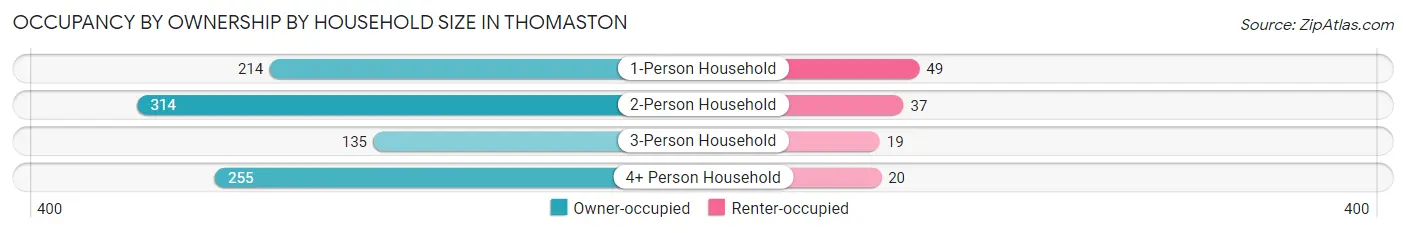
| Household Size | Owner-occupied | Renter-occupied |
| 1-Person Household | 214 (81.4%) | 49 (18.6%) |
| 2-Person Household | 314 (89.5%) | 37 (10.5%) |
| 3-Person Household | 135 (87.7%) | 19 (12.3%) |
| 4+ Person Household | 255 (92.7%) | 20 (7.3%) |
| Total Housing Units | 918 (88.0%) | 125 (12.0%) |
Occupancy by Educational Attainment in Thomaston
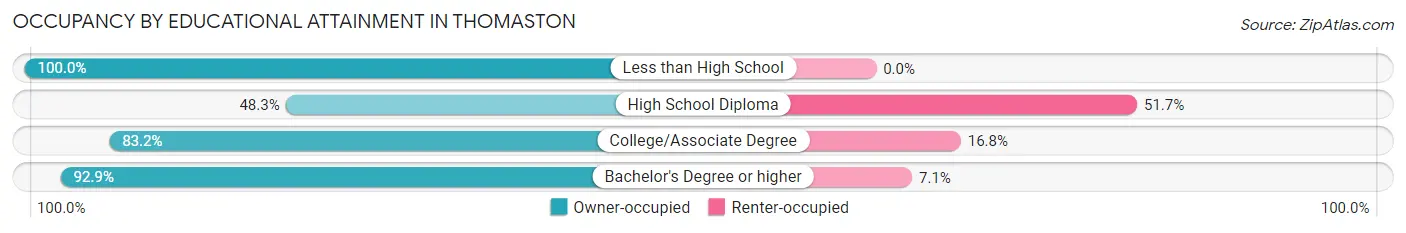
| Household Size | Owner-occupied | Renter-occupied |
| Less than High School | 35 (100.0%) | 0 (0.0%) |
| High School Diploma | 42 (48.3%) | 45 (51.7%) |
| College/Associate Degree | 124 (83.2%) | 25 (16.8%) |
| Bachelor's Degree or higher | 717 (92.9%) | 55 (7.1%) |
Occupancy by Age of Householder in Thomaston
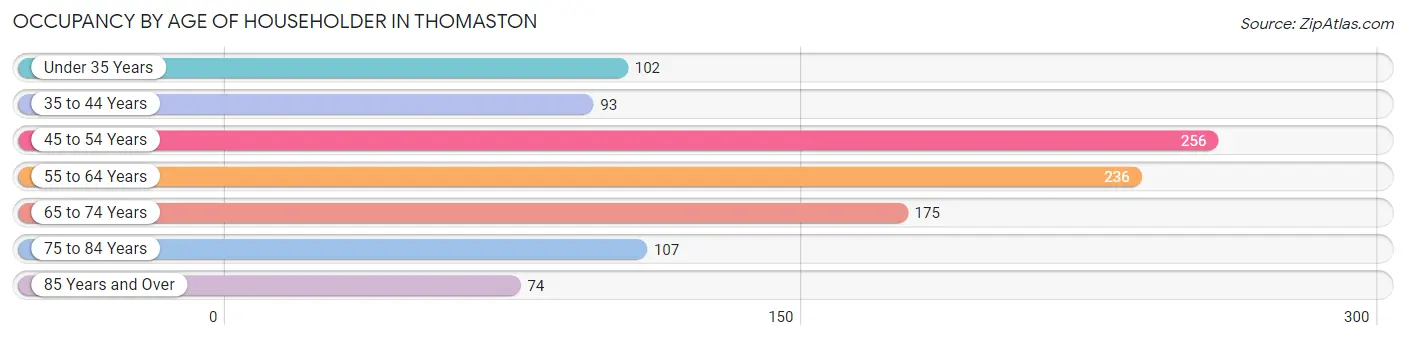
| Age Bracket | # Households | % Households |
| Under 35 Years | 102 | 9.8% |
| 35 to 44 Years | 93 | 8.9% |
| 45 to 54 Years | 256 | 24.5% |
| 55 to 64 Years | 236 | 22.6% |
| 65 to 74 Years | 175 | 16.8% |
| 75 to 84 Years | 107 | 10.3% |
| 85 Years and Over | 74 | 7.1% |
| Total | 1,043 | 100.0% |
Housing Finances in Thomaston
Median Income by Occupancy in Thomaston
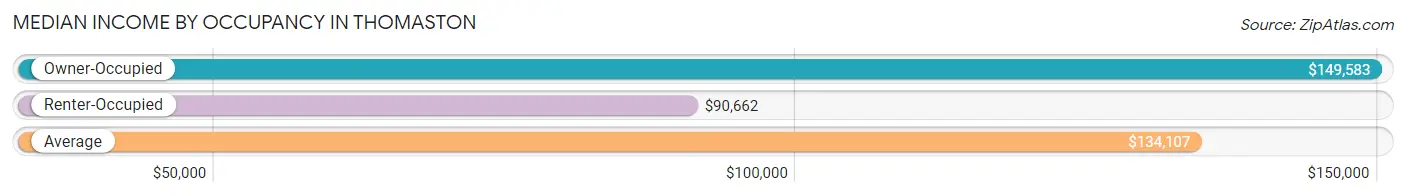
| Occupancy Type | # Households | Median Income |
| Owner-Occupied | 918 (88.0%) | $149,583 |
| Renter-Occupied | 125 (12.0%) | $90,662 |
| Average | 1,043 (100.0%) | $134,107 |
Occupancy by Householder Income Bracket in Thomaston
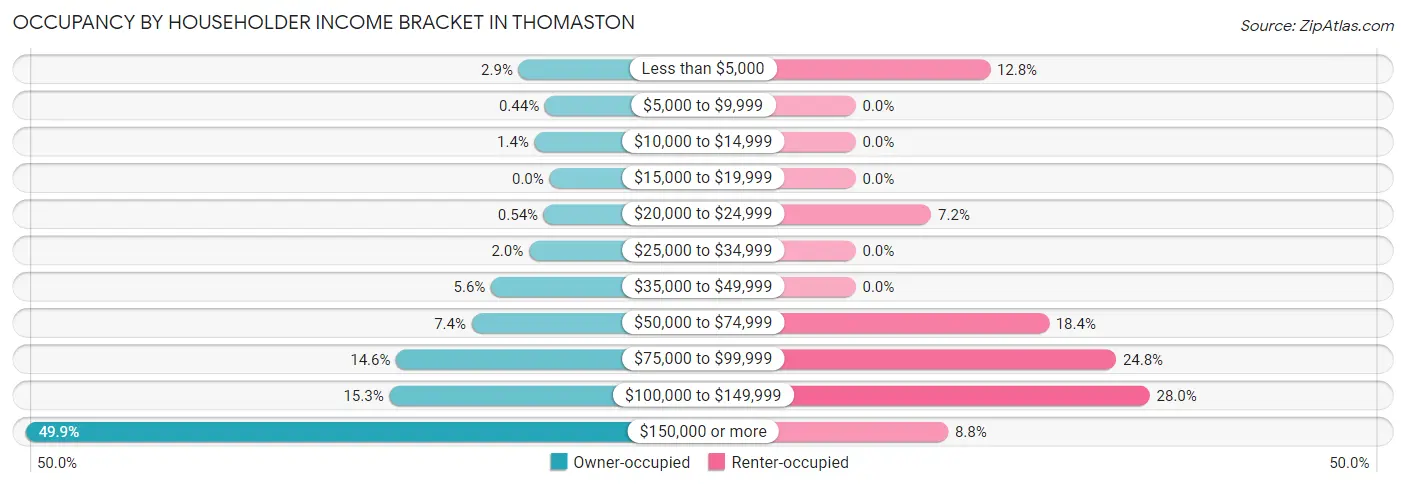
| Income Bracket | Owner-occupied | Renter-occupied |
| Less than $5,000 | 27 (2.9%) | 16 (12.8%) |
| $5,000 to $9,999 | 4 (0.4%) | 0 (0.0%) |
| $10,000 to $14,999 | 13 (1.4%) | 0 (0.0%) |
| $15,000 to $19,999 | 0 (0.0%) | 0 (0.0%) |
| $20,000 to $24,999 | 5 (0.5%) | 9 (7.2%) |
| $25,000 to $34,999 | 18 (2.0%) | 0 (0.0%) |
| $35,000 to $49,999 | 51 (5.6%) | 0 (0.0%) |
| $50,000 to $74,999 | 68 (7.4%) | 23 (18.4%) |
| $75,000 to $99,999 | 134 (14.6%) | 31 (24.8%) |
| $100,000 to $149,999 | 140 (15.2%) | 35 (28.0%) |
| $150,000 or more | 458 (49.9%) | 11 (8.8%) |
| Total | 918 (100.0%) | 125 (100.0%) |
Monthly Housing Cost Tiers in Thomaston
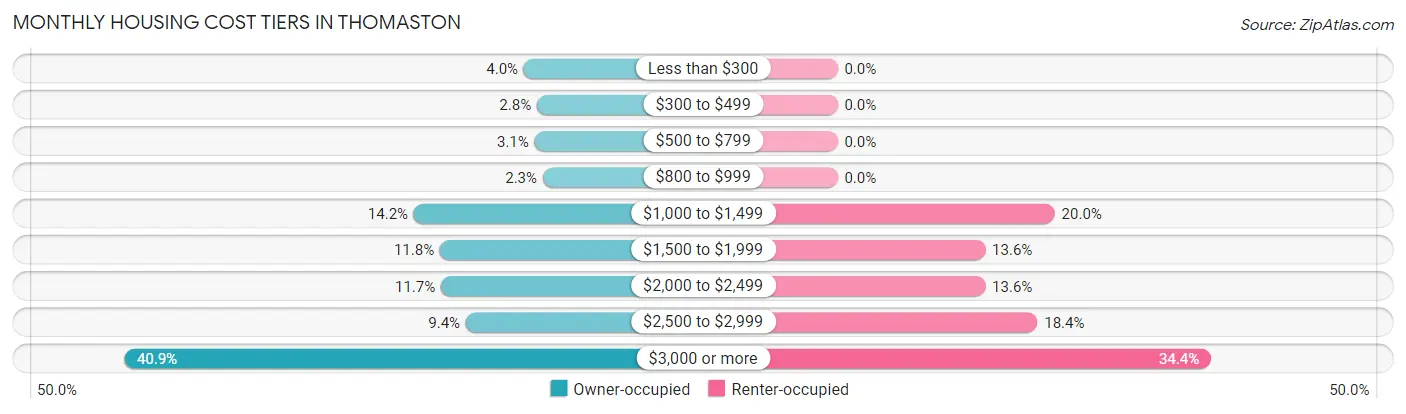
| Monthly Cost | Owner-occupied | Renter-occupied |
| Less than $300 | 37 (4.0%) | 0 (0.0%) |
| $300 to $499 | 26 (2.8%) | 0 (0.0%) |
| $500 to $799 | 28 (3.0%) | 0 (0.0%) |
| $800 to $999 | 21 (2.3%) | 0 (0.0%) |
| $1,000 to $1,499 | 130 (14.2%) | 25 (20.0%) |
| $1,500 to $1,999 | 108 (11.8%) | 17 (13.6%) |
| $2,000 to $2,499 | 107 (11.7%) | 17 (13.6%) |
| $2,500 to $2,999 | 86 (9.4%) | 23 (18.4%) |
| $3,000 or more | 375 (40.8%) | 43 (34.4%) |
| Total | 918 (100.0%) | 125 (100.0%) |
Physical Housing Characteristics in Thomaston
Housing Structures in Thomaston
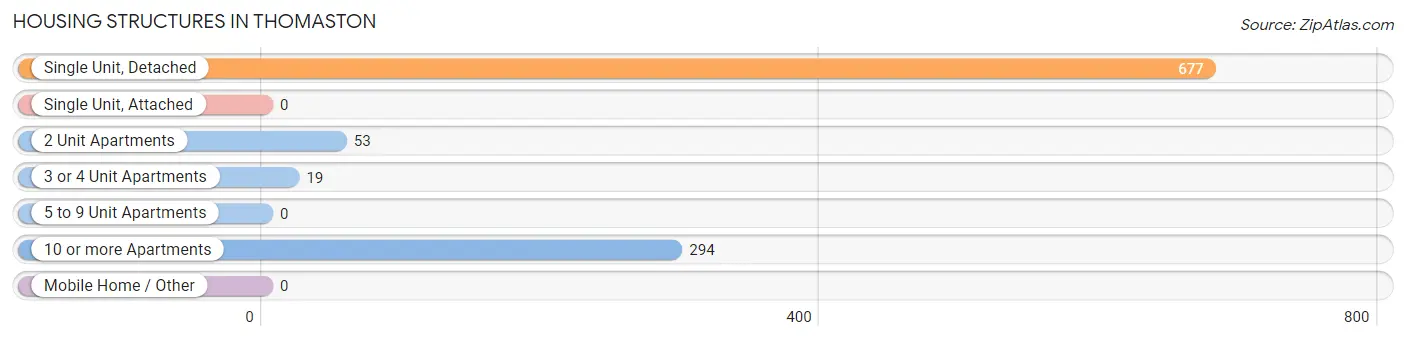
| Structure Type | # Housing Units | % Housing Units |
| Single Unit, Detached | 677 | 64.9% |
| Single Unit, Attached | 0 | 0.0% |
| 2 Unit Apartments | 53 | 5.1% |
| 3 or 4 Unit Apartments | 19 | 1.8% |
| 5 to 9 Unit Apartments | 0 | 0.0% |
| 10 or more Apartments | 294 | 28.2% |
| Mobile Home / Other | 0 | 0.0% |
| Total | 1,043 | 100.0% |
Housing Structures by Occupancy in Thomaston
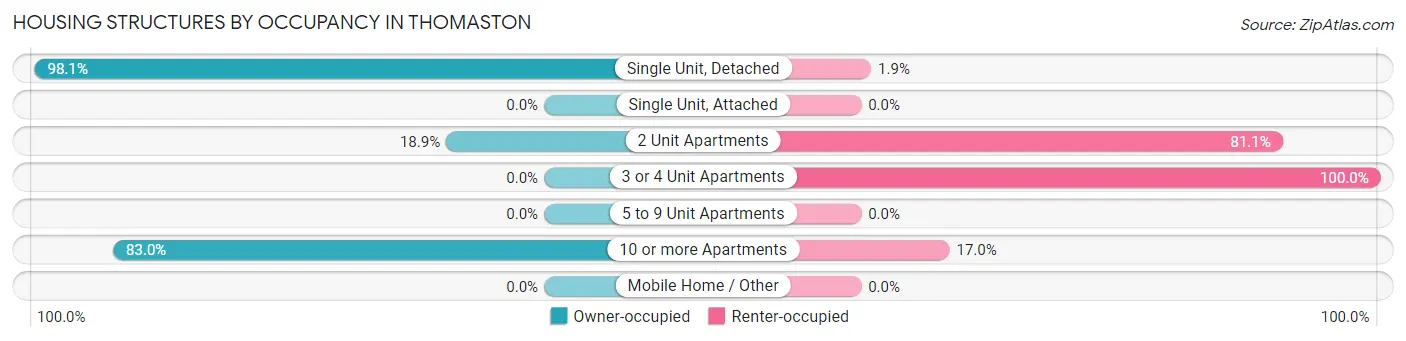
| Structure Type | Owner-occupied | Renter-occupied |
| Single Unit, Detached | 664 (98.1%) | 13 (1.9%) |
| Single Unit, Attached | 0 (0.0%) | 0 (0.0%) |
| 2 Unit Apartments | 10 (18.9%) | 43 (81.1%) |
| 3 or 4 Unit Apartments | 0 (0.0%) | 19 (100.0%) |
| 5 to 9 Unit Apartments | 0 (0.0%) | 0 (0.0%) |
| 10 or more Apartments | 244 (83.0%) | 50 (17.0%) |
| Mobile Home / Other | 0 (0.0%) | 0 (0.0%) |
| Total | 918 (88.0%) | 125 (12.0%) |
Housing Structures by Number of Rooms in Thomaston
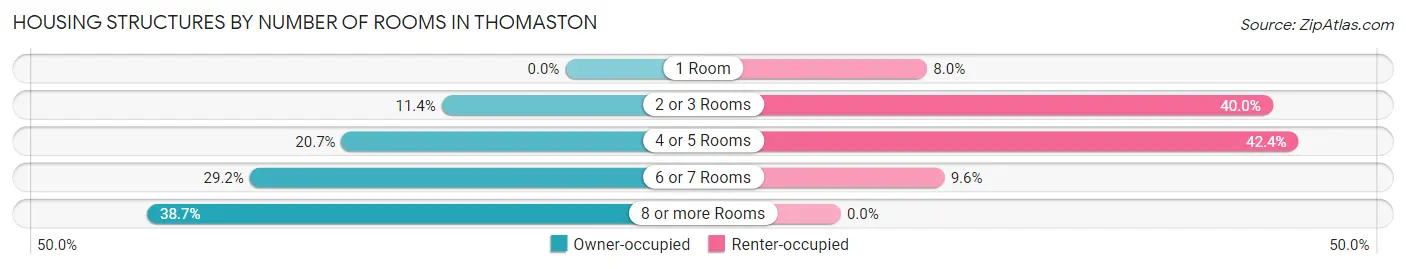
| Number of Rooms | Owner-occupied | Renter-occupied |
| 1 Room | 0 (0.0%) | 10 (8.0%) |
| 2 or 3 Rooms | 105 (11.4%) | 50 (40.0%) |
| 4 or 5 Rooms | 190 (20.7%) | 53 (42.4%) |
| 6 or 7 Rooms | 268 (29.2%) | 12 (9.6%) |
| 8 or more Rooms | 355 (38.7%) | 0 (0.0%) |
| Total | 918 (100.0%) | 125 (100.0%) |
Housing Structure by Heating Type in Thomaston
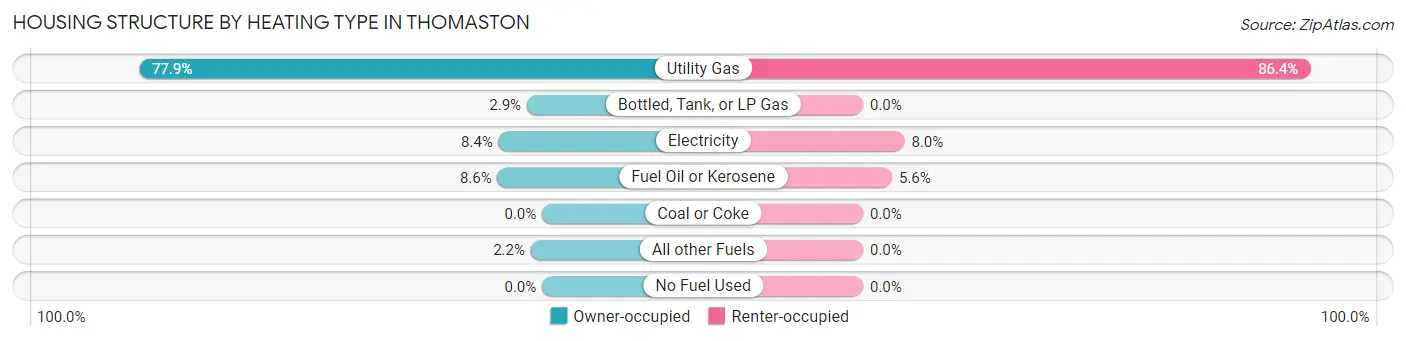
| Heating Type | Owner-occupied | Renter-occupied |
| Utility Gas | 715 (77.9%) | 108 (86.4%) |
| Bottled, Tank, or LP Gas | 27 (2.9%) | 0 (0.0%) |
| Electricity | 77 (8.4%) | 10 (8.0%) |
| Fuel Oil or Kerosene | 79 (8.6%) | 7 (5.6%) |
| Coal or Coke | 0 (0.0%) | 0 (0.0%) |
| All other Fuels | 20 (2.2%) | 0 (0.0%) |
| No Fuel Used | 0 (0.0%) | 0 (0.0%) |
| Total | 918 (100.0%) | 125 (100.0%) |
Household Vehicle Usage in Thomaston
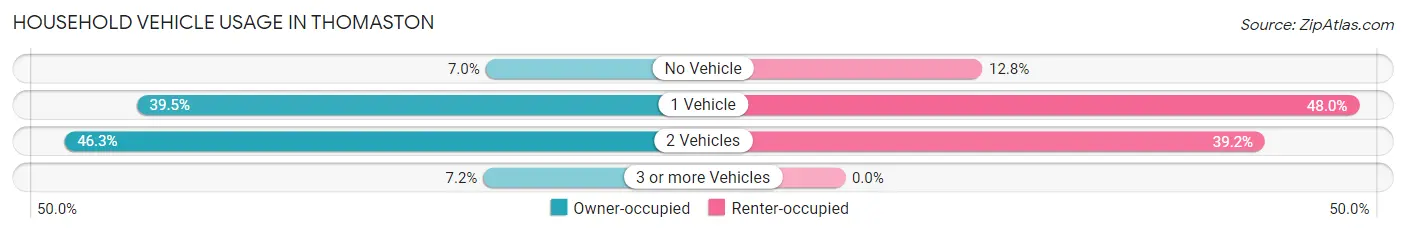
| Vehicles per Household | Owner-occupied | Renter-occupied |
| No Vehicle | 64 (7.0%) | 16 (12.8%) |
| 1 Vehicle | 363 (39.5%) | 60 (48.0%) |
| 2 Vehicles | 425 (46.3%) | 49 (39.2%) |
| 3 or more Vehicles | 66 (7.2%) | 0 (0.0%) |
| Total | 918 (100.0%) | 125 (100.0%) |
Real Estate & Mortgages in Thomaston
Real Estate and Mortgage Overview in Thomaston
| Characteristic | Without Mortgage | With Mortgage |
| Housing Units | 487 | 431 |
| Median Property Value | $1,035,800 | $1,161,600 |
| Median Household Income | $134,821 | $233 |
| Monthly Housing Costs | $1,501 | $329 |
| Real Estate Taxes | $10,001 | $71 |
Property Value by Mortgage Status in Thomaston
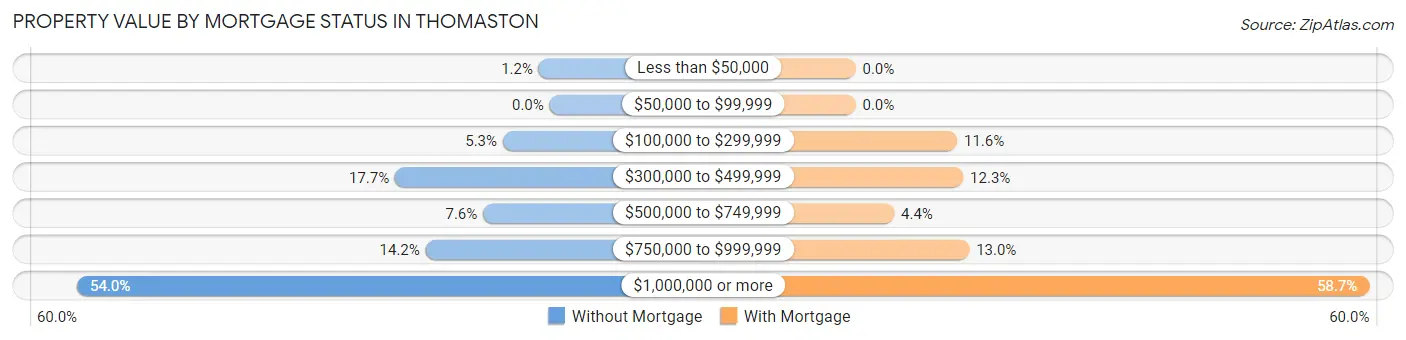
| Property Value | Without Mortgage | With Mortgage |
| Less than $50,000 | 6 (1.2%) | 0 (0.0%) |
| $50,000 to $99,999 | 0 (0.0%) | 0 (0.0%) |
| $100,000 to $299,999 | 26 (5.3%) | 50 (11.6%) |
| $300,000 to $499,999 | 86 (17.7%) | 53 (12.3%) |
| $500,000 to $749,999 | 37 (7.6%) | 19 (4.4%) |
| $750,000 to $999,999 | 69 (14.2%) | 56 (13.0%) |
| $1,000,000 or more | 263 (54.0%) | 253 (58.7%) |
| Total | 487 (100.0%) | 431 (100.0%) |
Household Income by Mortgage Status in Thomaston
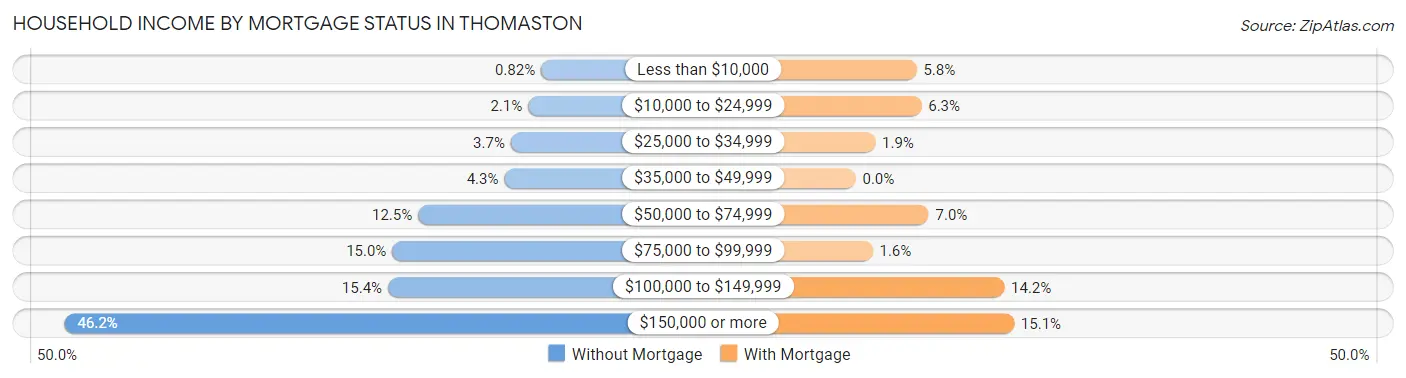
| Household Income | Without Mortgage | With Mortgage |
| Less than $10,000 | 4 (0.8%) | 25 (5.8%) |
| $10,000 to $24,999 | 10 (2.1%) | 27 (6.3%) |
| $25,000 to $34,999 | 18 (3.7%) | 8 (1.9%) |
| $35,000 to $49,999 | 21 (4.3%) | 0 (0.0%) |
| $50,000 to $74,999 | 61 (12.5%) | 30 (7.0%) |
| $75,000 to $99,999 | 73 (15.0%) | 7 (1.6%) |
| $100,000 to $149,999 | 75 (15.4%) | 61 (14.1%) |
| $150,000 or more | 225 (46.2%) | 65 (15.1%) |
| Total | 487 (100.0%) | 431 (100.0%) |
Property Value to Household Income Ratio in Thomaston
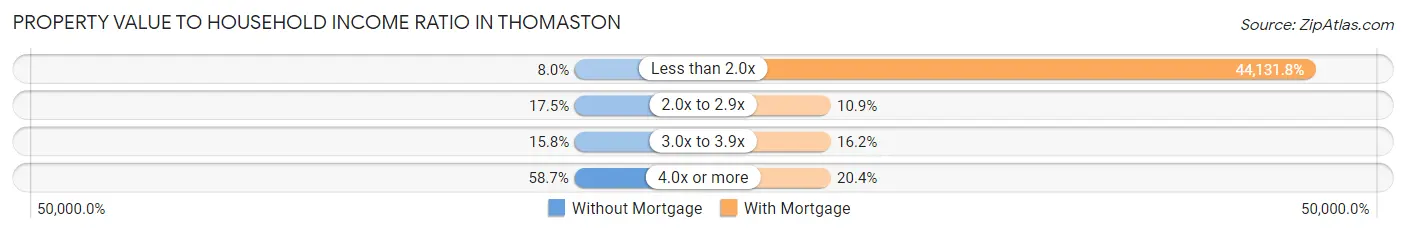
| Value-to-Income Ratio | Without Mortgage | With Mortgage |
| Less than 2.0x | 39 (8.0%) | 190,208 (44,131.8%) |
| 2.0x to 2.9x | 85 (17.4%) | 47 (10.9%) |
| 3.0x to 3.9x | 77 (15.8%) | 70 (16.2%) |
| 4.0x or more | 286 (58.7%) | 88 (20.4%) |
| Total | 487 (100.0%) | 431 (100.0%) |
Real Estate Taxes by Mortgage Status in Thomaston
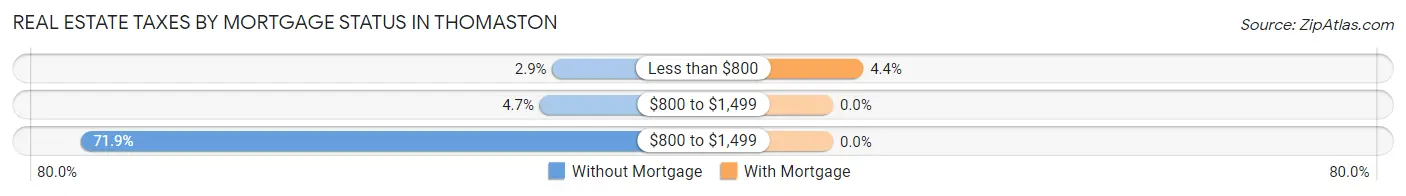
| Property Taxes | Without Mortgage | With Mortgage |
| Less than $800 | 14 (2.9%) | 19 (4.4%) |
| $800 to $1,499 | 23 (4.7%) | 0 (0.0%) |
| $800 to $1,499 | 350 (71.9%) | 0 (0.0%) |
| Total | 487 (100.0%) | 431 (100.0%) |
Health & Disability in Thomaston
Health Insurance Coverage by Age in Thomaston
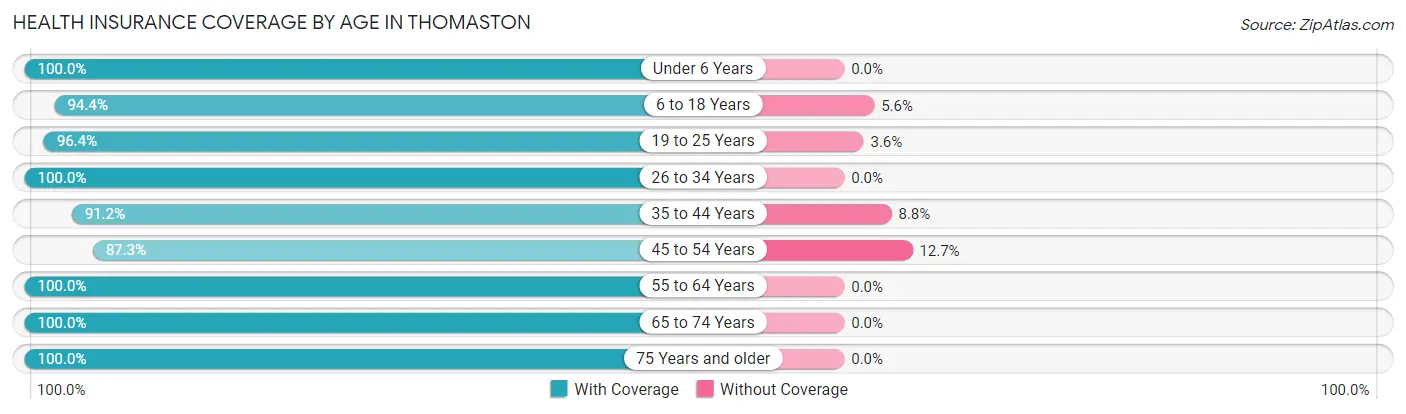
| Age Bracket | With Coverage | Without Coverage |
| Under 6 Years | 120 (100.0%) | 0 (0.0%) |
| 6 to 18 Years | 575 (94.4%) | 34 (5.6%) |
| 19 to 25 Years | 161 (96.4%) | 6 (3.6%) |
| 26 to 34 Years | 171 (100.0%) | 0 (0.0%) |
| 35 to 44 Years | 238 (91.2%) | 23 (8.8%) |
| 45 to 54 Years | 419 (87.3%) | 61 (12.7%) |
| 55 to 64 Years | 357 (100.0%) | 0 (0.0%) |
| 65 to 74 Years | 297 (100.0%) | 0 (0.0%) |
| 75 Years and older | 288 (100.0%) | 0 (0.0%) |
| Total | 2,626 (95.5%) | 124 (4.5%) |
Health Insurance Coverage by Citizenship Status in Thomaston
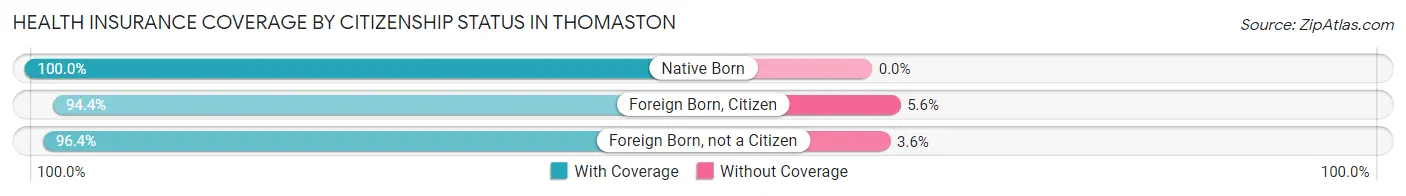
| Citizenship Status | With Coverage | Without Coverage |
| Native Born | 120 (100.0%) | 0 (0.0%) |
| Foreign Born, Citizen | 575 (94.4%) | 34 (5.6%) |
| Foreign Born, not a Citizen | 161 (96.4%) | 6 (3.6%) |
Health Insurance Coverage by Household Income in Thomaston
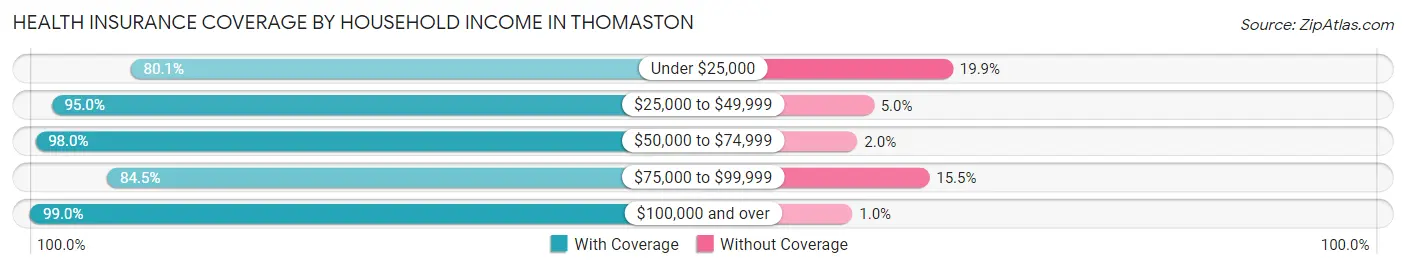
| Household Income | With Coverage | Without Coverage |
| Under $25,000 | 121 (80.1%) | 30 (19.9%) |
| $25,000 to $49,999 | 132 (95.0%) | 7 (5.0%) |
| $50,000 to $74,999 | 197 (98.0%) | 4 (2.0%) |
| $75,000 to $99,999 | 350 (84.5%) | 64 (15.5%) |
| $100,000 and over | 1,816 (99.0%) | 19 (1.0%) |
Public vs Private Health Insurance Coverage by Age in Thomaston
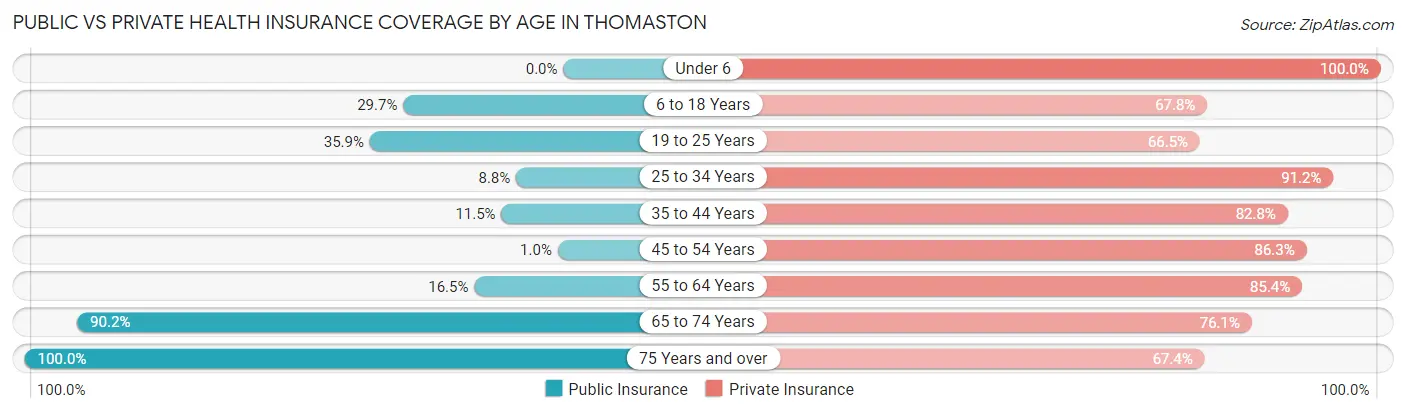
| Age Bracket | Public Insurance | Private Insurance |
| Under 6 | 0 (0.0%) | 120 (100.0%) |
| 6 to 18 Years | 181 (29.7%) | 413 (67.8%) |
| 19 to 25 Years | 60 (35.9%) | 111 (66.5%) |
| 25 to 34 Years | 15 (8.8%) | 156 (91.2%) |
| 35 to 44 Years | 30 (11.5%) | 216 (82.8%) |
| 45 to 54 Years | 5 (1.0%) | 414 (86.3%) |
| 55 to 64 Years | 59 (16.5%) | 305 (85.4%) |
| 65 to 74 Years | 268 (90.2%) | 226 (76.1%) |
| 75 Years and over | 288 (100.0%) | 194 (67.4%) |
| Total | 906 (33.0%) | 2,155 (78.4%) |
Disability Status by Sex by Age in Thomaston
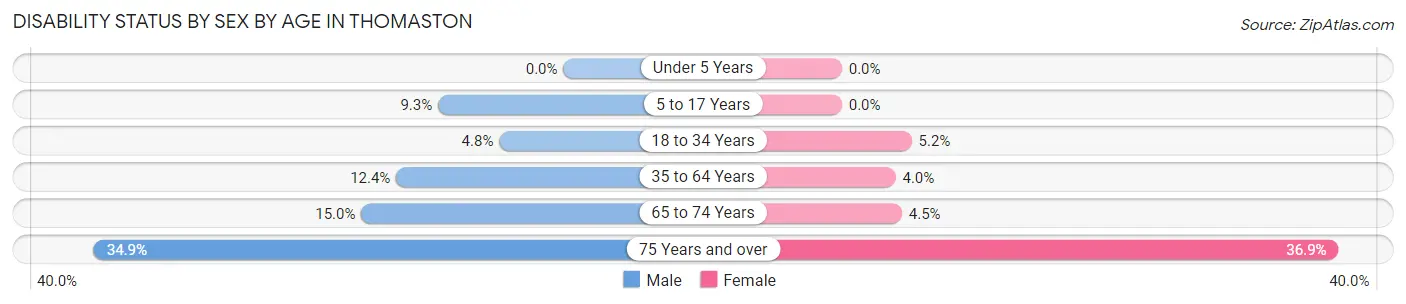
| Age Bracket | Male | Female |
| Under 5 Years | 0 (0.0%) | 0 (0.0%) |
| 5 to 17 Years | 24 (9.3%) | 0 (0.0%) |
| 18 to 34 Years | 9 (4.8%) | 10 (5.2%) |
| 35 to 64 Years | 71 (12.4%) | 21 (4.0%) |
| 65 to 74 Years | 21 (15.0%) | 7 (4.5%) |
| 75 Years and over | 38 (34.9%) | 66 (36.9%) |
Disability Class by Sex by Age in Thomaston
Disability Class: Hearing Difficulty
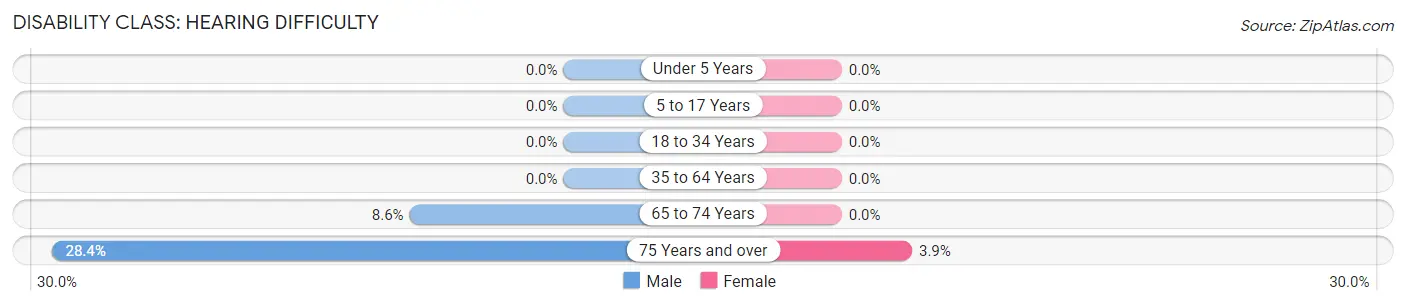
| Age Bracket | Male | Female |
| Under 5 Years | 0 (0.0%) | 0 (0.0%) |
| 5 to 17 Years | 0 (0.0%) | 0 (0.0%) |
| 18 to 34 Years | 0 (0.0%) | 0 (0.0%) |
| 35 to 64 Years | 0 (0.0%) | 0 (0.0%) |
| 65 to 74 Years | 12 (8.6%) | 0 (0.0%) |
| 75 Years and over | 31 (28.4%) | 7 (3.9%) |
Disability Class: Vision Difficulty
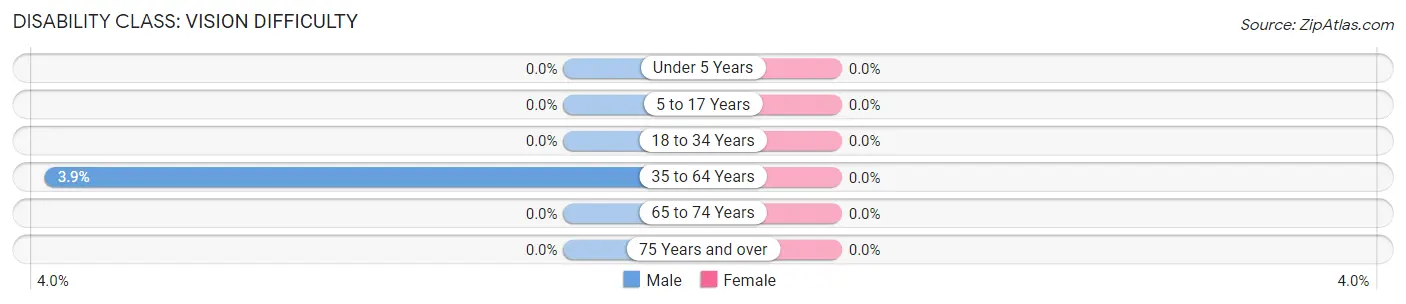
| Age Bracket | Male | Female |
| Under 5 Years | 0 (0.0%) | 0 (0.0%) |
| 5 to 17 Years | 0 (0.0%) | 0 (0.0%) |
| 18 to 34 Years | 0 (0.0%) | 0 (0.0%) |
| 35 to 64 Years | 22 (3.8%) | 0 (0.0%) |
| 65 to 74 Years | 0 (0.0%) | 0 (0.0%) |
| 75 Years and over | 0 (0.0%) | 0 (0.0%) |
Disability Class: Cognitive Difficulty
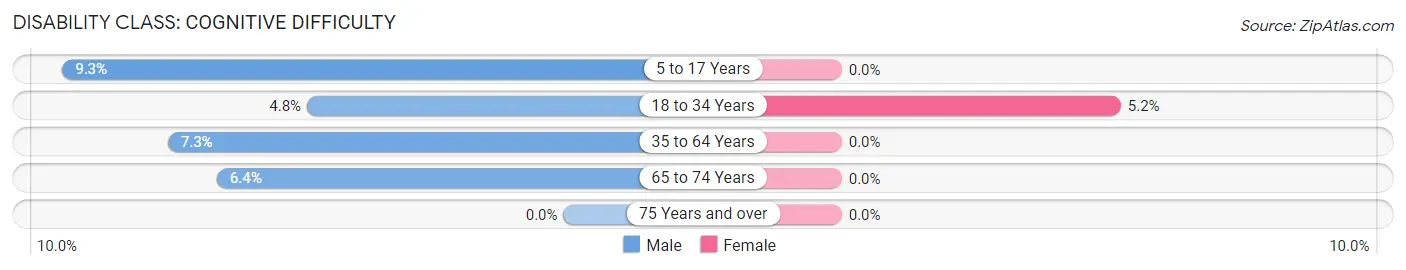
| Age Bracket | Male | Female |
| 5 to 17 Years | 24 (9.3%) | 0 (0.0%) |
| 18 to 34 Years | 9 (4.8%) | 10 (5.2%) |
| 35 to 64 Years | 42 (7.3%) | 0 (0.0%) |
| 65 to 74 Years | 9 (6.4%) | 0 (0.0%) |
| 75 Years and over | 0 (0.0%) | 0 (0.0%) |
Disability Class: Ambulatory Difficulty
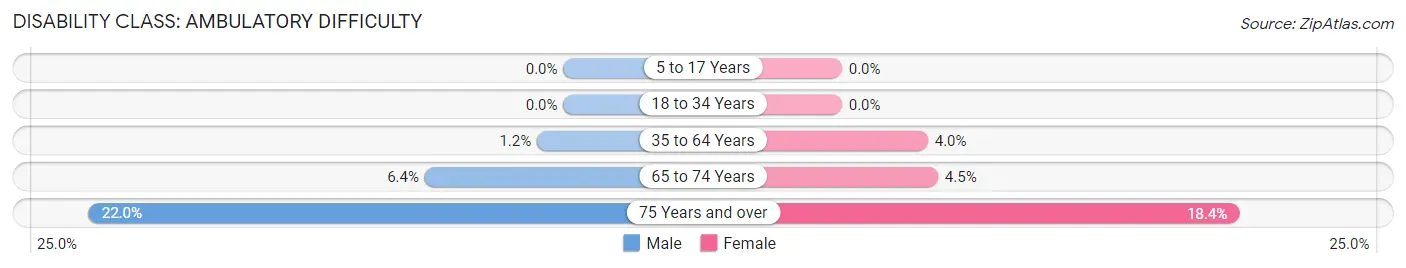
| Age Bracket | Male | Female |
| 5 to 17 Years | 0 (0.0%) | 0 (0.0%) |
| 18 to 34 Years | 0 (0.0%) | 0 (0.0%) |
| 35 to 64 Years | 7 (1.2%) | 21 (4.0%) |
| 65 to 74 Years | 9 (6.4%) | 7 (4.5%) |
| 75 Years and over | 24 (22.0%) | 33 (18.4%) |
Disability Class: Self-Care Difficulty
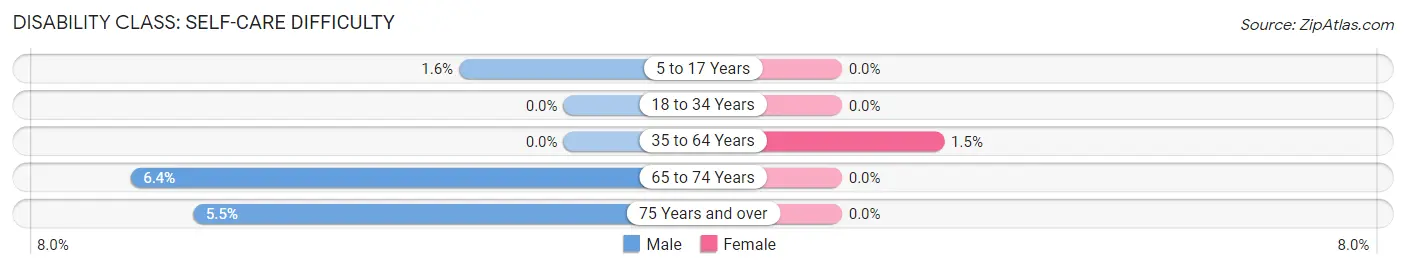
| Age Bracket | Male | Female |
| 5 to 17 Years | 4 (1.5%) | 0 (0.0%) |
| 18 to 34 Years | 0 (0.0%) | 0 (0.0%) |
| 35 to 64 Years | 0 (0.0%) | 8 (1.5%) |
| 65 to 74 Years | 9 (6.4%) | 0 (0.0%) |
| 75 Years and over | 6 (5.5%) | 0 (0.0%) |
Technology Access in Thomaston
Computing Device Access in Thomaston
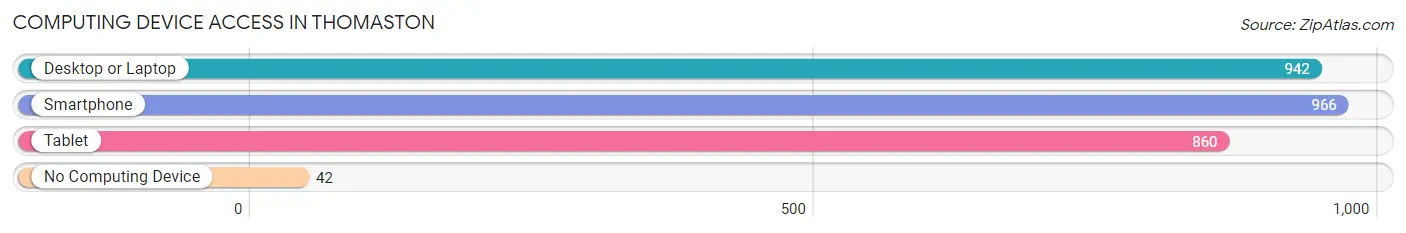
| Device Type | # Households | % Households |
| Desktop or Laptop | 942 | 90.3% |
| Smartphone | 966 | 92.6% |
| Tablet | 860 | 82.5% |
| No Computing Device | 42 | 4.0% |
| Total | 1,043 | 100.0% |
Internet Access in Thomaston
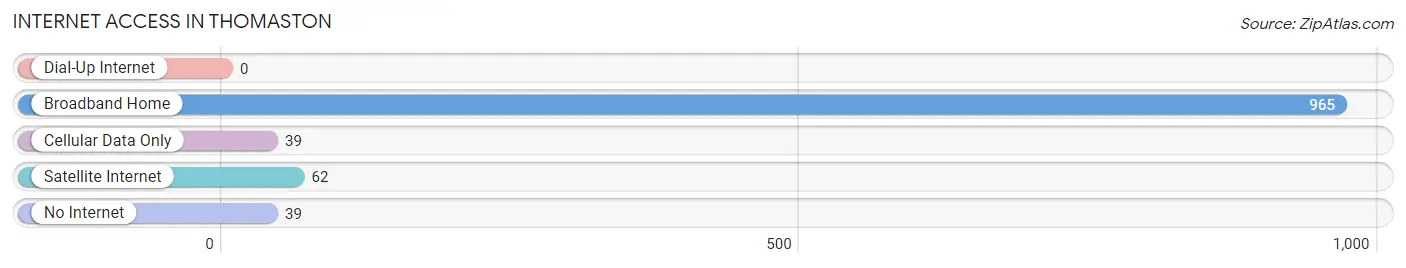
| Internet Type | # Households | % Households |
| Dial-Up Internet | 0 | 0.0% |
| Broadband Home | 965 | 92.5% |
| Cellular Data Only | 39 | 3.7% |
| Satellite Internet | 62 | 5.9% |
| No Internet | 39 | 3.7% |
| Total | 1,043 | 100.0% |
Thomaston Summary
Thomaston, NY is a small town located in the state of New York. It is situated in the southeastern part of the state, in the county of Ulster. The town is bordered by the towns of Gardiner, Shawangunk, and Wawarsing. The population of Thomaston was estimated to be 2,845 in 2019.
History
Thomaston was first settled in 1720 by Dutch settlers. The town was originally known as “New Dorlach” and was part of the town of Shawangunk. In 1797, the town was renamed Thomaston after the Revolutionary War hero, General Thomas Sumter. The town was officially incorporated in 1809.
In the 19th century, Thomaston was a rural farming community. The town was known for its production of apples, potatoes, and other crops. The town also had several mills, including a grist mill, a saw mill, and a cider mill.
Geography
Thomaston is located in the southeastern part of New York State, in the county of Ulster. The town is bordered by the towns of Gardiner, Shawangunk, and Wawarsing. The town is situated in the foothills of the Shawangunk Mountains. The terrain is mostly hilly and wooded, with some flat areas. The highest point in the town is 1,400 feet above sea level.
The town is home to several small lakes, including Lake Minnewaska, Lake Awosting, and Lake Maratanza. The town is also home to several streams, including the Wallkill River, the Rondout Creek, and the Neversink River.
Economy
Thomaston’s economy is largely based on agriculture and tourism. The town is home to several farms, which produce apples, potatoes, and other crops. The town is also home to several wineries, which produce a variety of wines.
The town is also home to several small businesses, including restaurants, shops, and galleries. The town is also home to several bed and breakfasts, which attract tourists from all over the world.
Demographics
As of 2019, the population of Thomaston was estimated to be 2,845. The town has a median age of 44.7 years, with a gender ratio of 50.3% male and 49.7% female. The town has a median household income of $60,945. The town is predominantly white, with a population that is 94.3% white, 1.7% Hispanic or Latino, 1.2% Asian, and 0.8% African American.
Conclusion
Thomaston, NY is a small town located in the southeastern part of New York State. The town has a rich history, with roots that date back to the 18th century. The town is home to several small businesses, farms, and wineries, and is a popular tourist destination. The town has a population of 2,845, with a median age of 44.7 years and a median household income of $60,945. The town is predominantly white, with a population that is 94.3% white, 1.7% Hispanic or Latino, 1.2% Asian, and 0.8% African American.
Common Questions
What is Per Capita Income in Thomaston?
Per Capita income in Thomaston is $74,562.
What is the Median Family Income in Thomaston?
Median Family Income in Thomaston is $162,420.
What is the Median Household income in Thomaston?
Median Household Income in Thomaston is $134,107.
What is Income or Wage Gap in Thomaston?
Income or Wage Gap in Thomaston is 38.1%.
Women in Thomaston earn 61.9 cents for every dollar earned by a man.
What is Inequality or Gini Index in Thomaston?
Inequality or Gini Index in Thomaston is 0.47.
What is the Total Population of Thomaston?
Total Population of Thomaston is 2,750.
What is the Total Male Population of Thomaston?
Total Male Population of Thomaston is 1,339.
What is the Total Female Population of Thomaston?
Total Female Population of Thomaston is 1,411.
What is the Ratio of Males per 100 Females in Thomaston?
There are 94.90 Males per 100 Females in Thomaston.
What is the Ratio of Females per 100 Males in Thomaston?
There are 105.38 Females per 100 Males in Thomaston.
What is the Median Population Age in Thomaston?
Median Population Age in Thomaston is 45.9 Years.
What is the Average Family Size in Thomaston
Average Family Size in Thomaston is 3.1 People.
What is the Average Household Size in Thomaston
Average Household Size in Thomaston is 2.6 People.
How Large is the Labor Force in Thomaston?
There are 1,389 People in the Labor Forcein in Thomaston.
What is the Percentage of People in the Labor Force in Thomaston?
63.1% of People are in the Labor Force in Thomaston.
What is the Unemployment Rate in Thomaston?
Unemployment Rate in Thomaston is 3.2%.