Thousand Island Park, NY Map & Demographics
Thousand Island Park Map
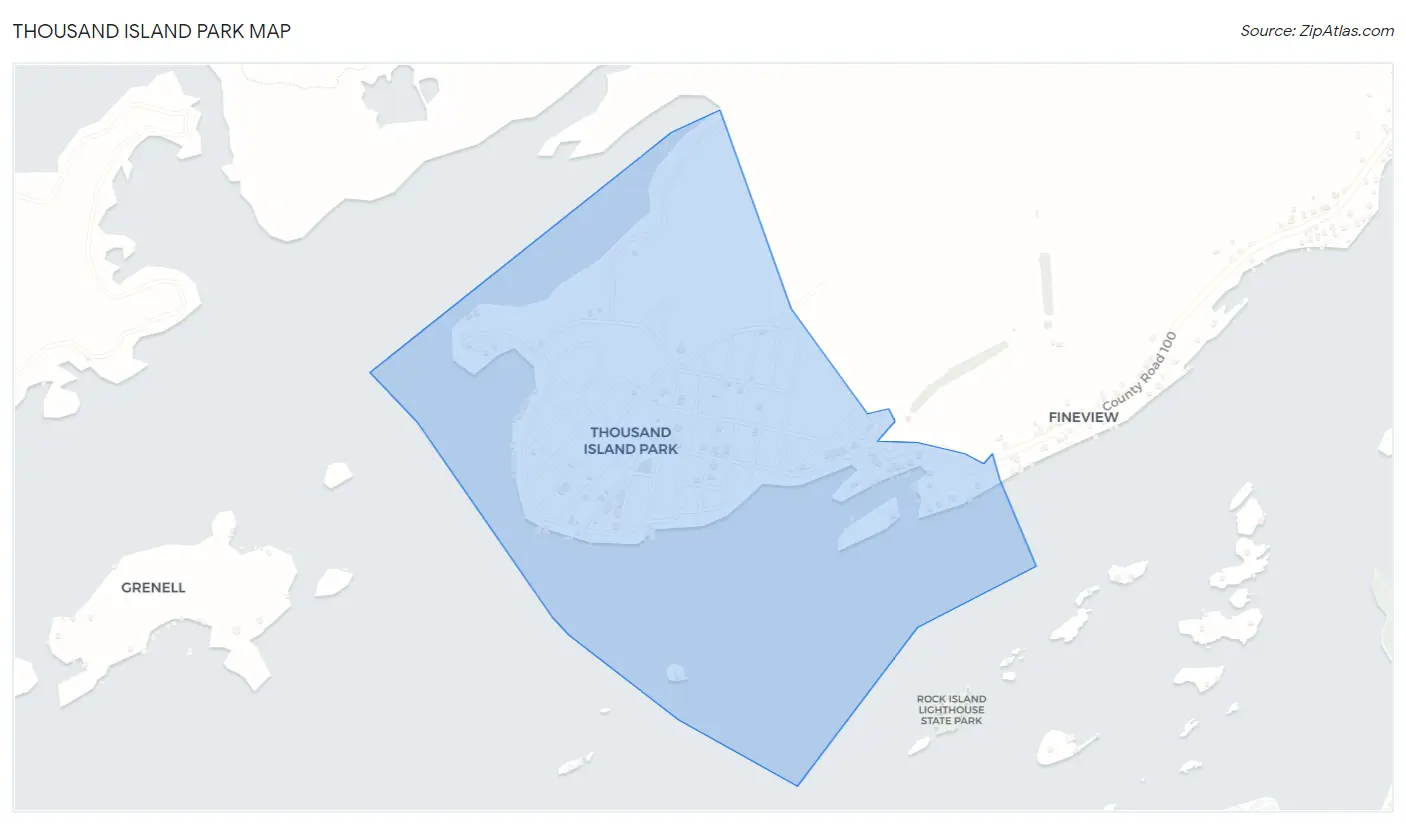
Thousand Island Park Overview
$108,492
PER CAPITA INCOME
$215,357
AVG FAMILY INCOME
$153,750
AVG HOUSEHOLD INCOME
20.3%
WAGE / INCOME GAP [ % ]
79.7¢/ $1
WAGE / INCOME GAP [ $ ]
0.46
INEQUALITY / GINI INDEX
216
TOTAL POPULATION
108
MALE POPULATION
108
FEMALE POPULATION
100.00
MALES / 100 FEMALES
100.00
FEMALES / 100 MALES
60.3
MEDIAN AGE
2.9
AVG FAMILY SIZE
2.5
AVG HOUSEHOLD SIZE
113
LABOR FORCE [ PEOPLE ]
57.7%
PERCENT IN LABOR FORCE
10.6%
UNEMPLOYMENT RATE
Thousand Island Park Zip Codes
Thousand Island Park Area Codes
Income in Thousand Island Park
Income Overview in Thousand Island Park
Per Capita Income in Thousand Island Park is $108,492, while median incomes of families and households are $215,357 and $153,750 respectively.
| Characteristic | Number | Measure |
| Per Capita Income | 216 | $108,492 |
| Median Family Income | 70 | $215,357 |
| Mean Family Income | 70 | $300,923 |
| Median Household Income | 85 | $153,750 |
| Mean Household Income | 85 | $253,888 |
| Income Deficit | 70 | $0 |
| Wage / Income Gap (%) | 216 | 20.34% |
| Wage / Income Gap ($) | 216 | 79.66¢ per $1 |
| Gini / Inequality Index | 216 | 0.46 |
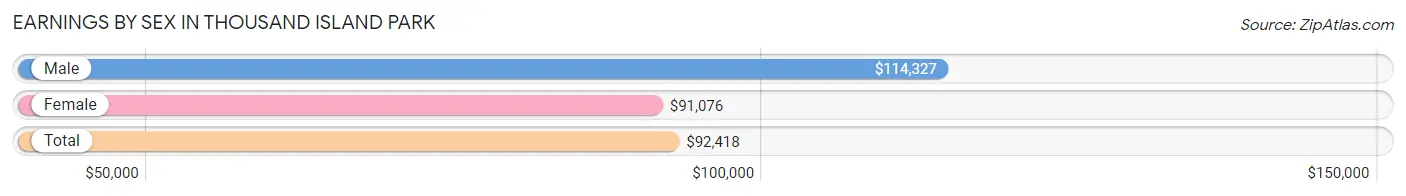
Earnings by Sex in Thousand Island Park
Average Earnings in Thousand Island Park are $92,418, $114,327 for men and $91,076 for women, a difference of 20.3%.
| Sex | Number | Average Earnings |
| Male | 58 (51.3%) | $114,327 |
| Female | 55 (48.7%) | $91,076 |
| Total | 113 (100.0%) | $92,418 |
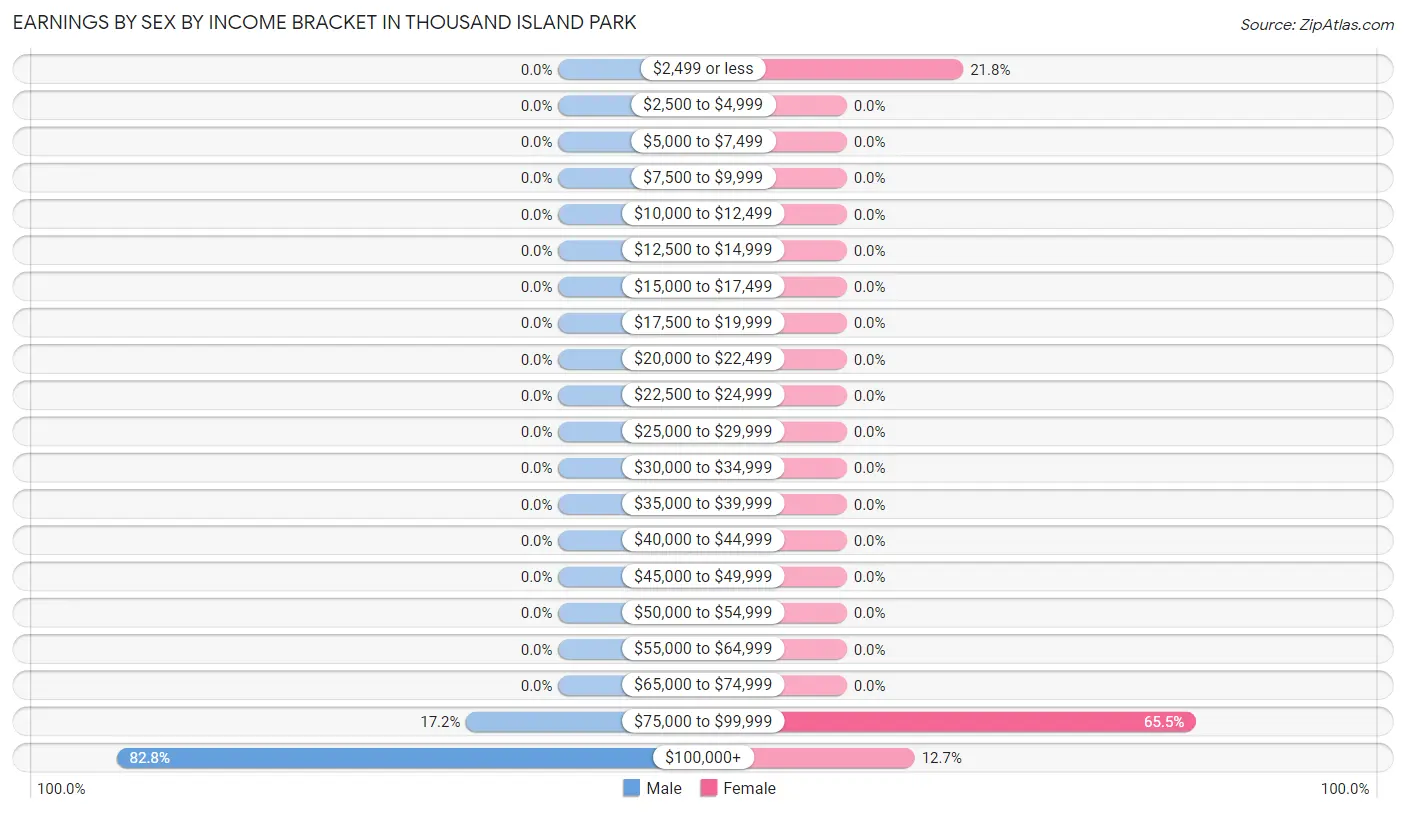
Earnings by Sex by Income Bracket in Thousand Island Park
The most common earnings brackets in Thousand Island Park are $100,000+ for men (48 | 82.8%) and $75,000 to $99,999 for women (36 | 65.4%).
| Income | Male | Female |
| $2,499 or less | 0 (0.0%) | 12 (21.8%) |
| $2,500 to $4,999 | 0 (0.0%) | 0 (0.0%) |
| $5,000 to $7,499 | 0 (0.0%) | 0 (0.0%) |
| $7,500 to $9,999 | 0 (0.0%) | 0 (0.0%) |
| $10,000 to $12,499 | 0 (0.0%) | 0 (0.0%) |
| $12,500 to $14,999 | 0 (0.0%) | 0 (0.0%) |
| $15,000 to $17,499 | 0 (0.0%) | 0 (0.0%) |
| $17,500 to $19,999 | 0 (0.0%) | 0 (0.0%) |
| $20,000 to $22,499 | 0 (0.0%) | 0 (0.0%) |
| $22,500 to $24,999 | 0 (0.0%) | 0 (0.0%) |
| $25,000 to $29,999 | 0 (0.0%) | 0 (0.0%) |
| $30,000 to $34,999 | 0 (0.0%) | 0 (0.0%) |
| $35,000 to $39,999 | 0 (0.0%) | 0 (0.0%) |
| $40,000 to $44,999 | 0 (0.0%) | 0 (0.0%) |
| $45,000 to $49,999 | 0 (0.0%) | 0 (0.0%) |
| $50,000 to $54,999 | 0 (0.0%) | 0 (0.0%) |
| $55,000 to $64,999 | 0 (0.0%) | 0 (0.0%) |
| $65,000 to $74,999 | 0 (0.0%) | 0 (0.0%) |
| $75,000 to $99,999 | 10 (17.2%) | 36 (65.4%) |
| $100,000+ | 48 (82.8%) | 7 (12.7%) |
| Total | 58 (100.0%) | 55 (100.0%) |
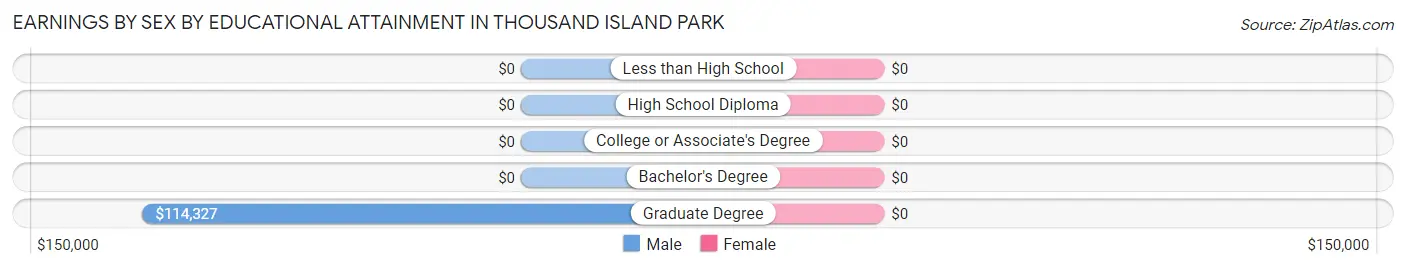
Earnings by Sex by Educational Attainment in Thousand Island Park
| Educational Attainment | Male Income | Female Income |
| Less than High School | - | - |
| High School Diploma | - | - |
| College or Associate's Degree | - | - |
| Bachelor's Degree | - | - |
| Graduate Degree | $114,327 | $0 |
| Total | $114,327 | $91,076 |
Family Income in Thousand Island Park
Family Income Brackets in Thousand Island Park
According to the Thousand Island Park family income data, there are 36 families falling into the $200,000+ income range, which is the most common income bracket and makes up 51.4% of all families.
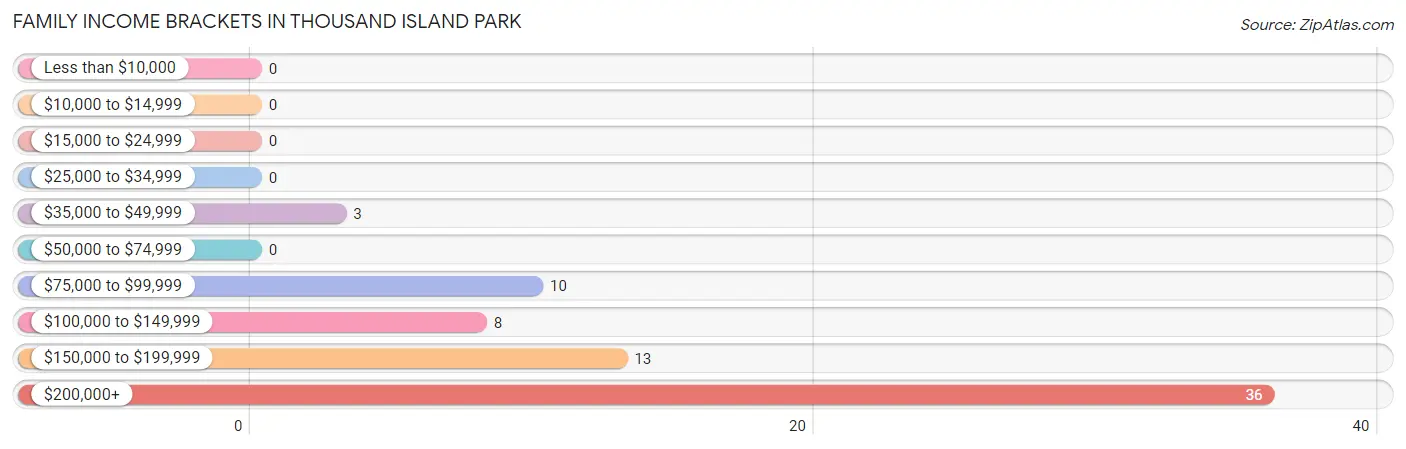
| Income Bracket | # Families | % Families |
| Less than $10,000 | 0 | 0.0% |
| $10,000 to $14,999 | 0 | 0.0% |
| $15,000 to $24,999 | 0 | 0.0% |
| $25,000 to $34,999 | 0 | 0.0% |
| $35,000 to $49,999 | 3 | 4.3% |
| $50,000 to $74,999 | 0 | 0.0% |
| $75,000 to $99,999 | 10 | 14.3% |
| $100,000 to $149,999 | 8 | 11.4% |
| $150,000 to $199,999 | 13 | 18.6% |
| $200,000+ | 36 | 51.4% |
Family Income by Famaliy Size in Thousand Island Park
2-person families (38 | 54.3%) account for the highest median family income in Thousand Island Park with $154,038 per family, while 2-person families (38 | 54.3%) have the highest median income of $77,019 per family member.
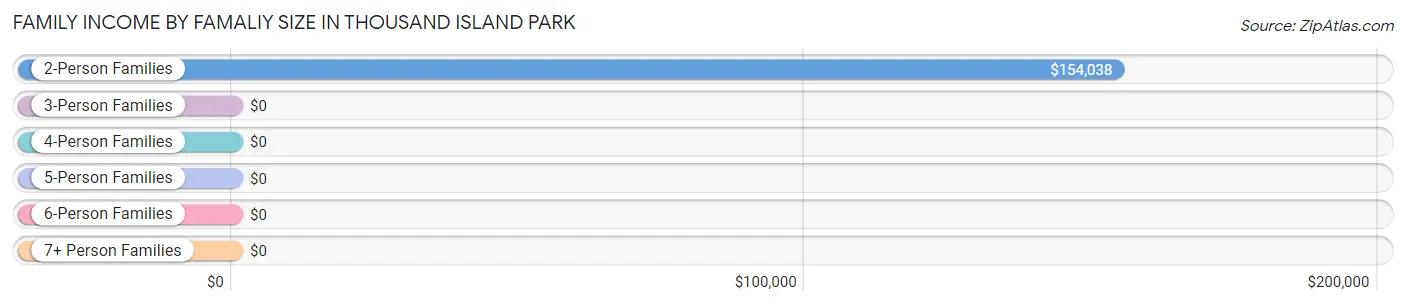
| Income Bracket | # Families | Median Income |
| 2-Person Families | 38 (54.3%) | $154,038 |
| 3-Person Families | 22 (31.4%) | $0 |
| 4-Person Families | 10 (14.3%) | $0 |
| 5-Person Families | 0 (0.0%) | $0 |
| 6-Person Families | 0 (0.0%) | $0 |
| 7+ Person Families | 0 (0.0%) | $0 |
| Total | 70 (100.0%) | $215,357 |
Family Income by Number of Earners in Thousand Island Park
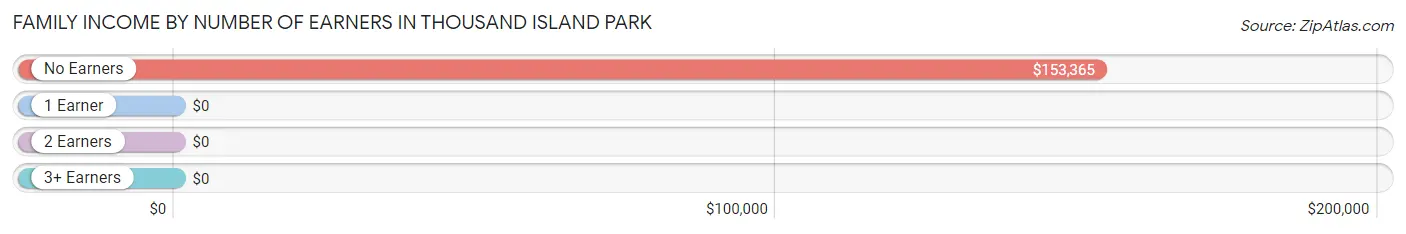
| Number of Earners | # Families | Median Income |
| No Earners | 31 (44.3%) | $153,365 |
| 1 Earner | 7 (10.0%) | $0 |
| 2 Earners | 10 (14.3%) | $0 |
| 3+ Earners | 22 (31.4%) | $0 |
| Total | 70 (100.0%) | $215,357 |
Household Income in Thousand Island Park
Household Income Brackets in Thousand Island Park
With 36 households falling in the category, the $200,000+ income range is the most frequent in Thousand Island Park, accounting for 42.3% of all households.
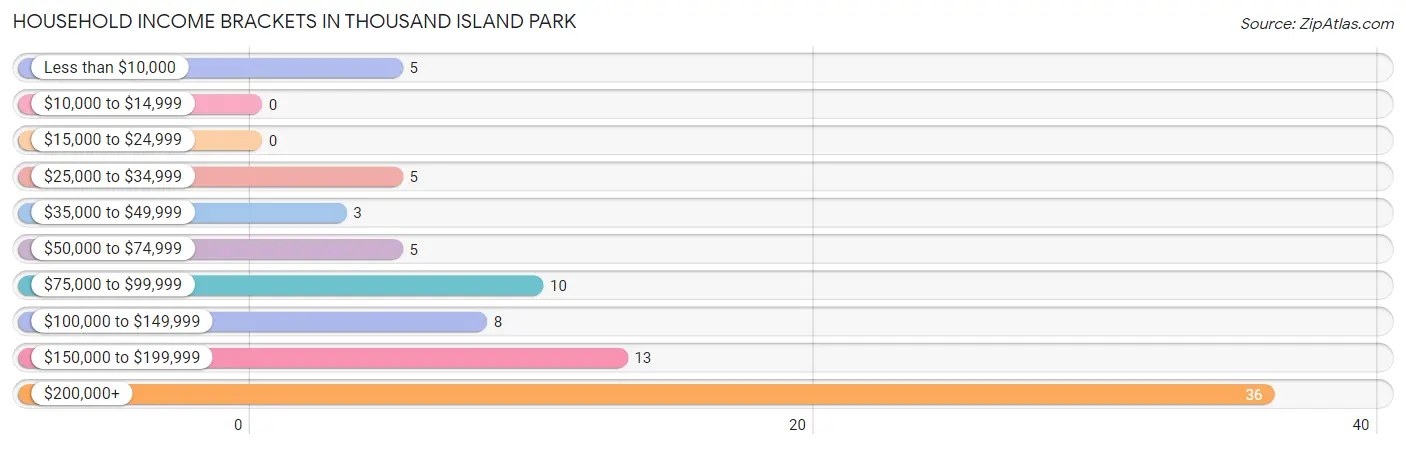
| Income Bracket | # Households | % Households |
| Less than $10,000 | 5 | 5.9% |
| $10,000 to $14,999 | 0 | 0.0% |
| $15,000 to $24,999 | 0 | 0.0% |
| $25,000 to $34,999 | 5 | 5.9% |
| $35,000 to $49,999 | 3 | 3.5% |
| $50,000 to $74,999 | 5 | 5.9% |
| $75,000 to $99,999 | 10 | 11.8% |
| $100,000 to $149,999 | 8 | 9.4% |
| $150,000 to $199,999 | 13 | 15.3% |
| $200,000+ | 36 | 42.4% |
Household Income by Householder Age in Thousand Island Park
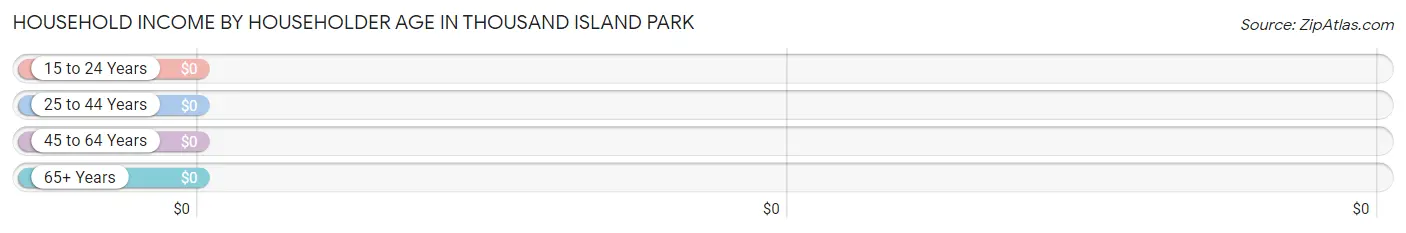
| Income Bracket | # Households | Median Income |
| 15 to 24 Years | 0 (0.0%) | $0 |
| 25 to 44 Years | 10 (11.8%) | $0 |
| 45 to 64 Years | 12 (14.1%) | $0 |
| 65+ Years | 63 (74.1%) | $0 |
| Total | 85 (100.0%) | $153,750 |
Poverty in Thousand Island Park
Income Below Poverty by Sex and Age in Thousand Island Park
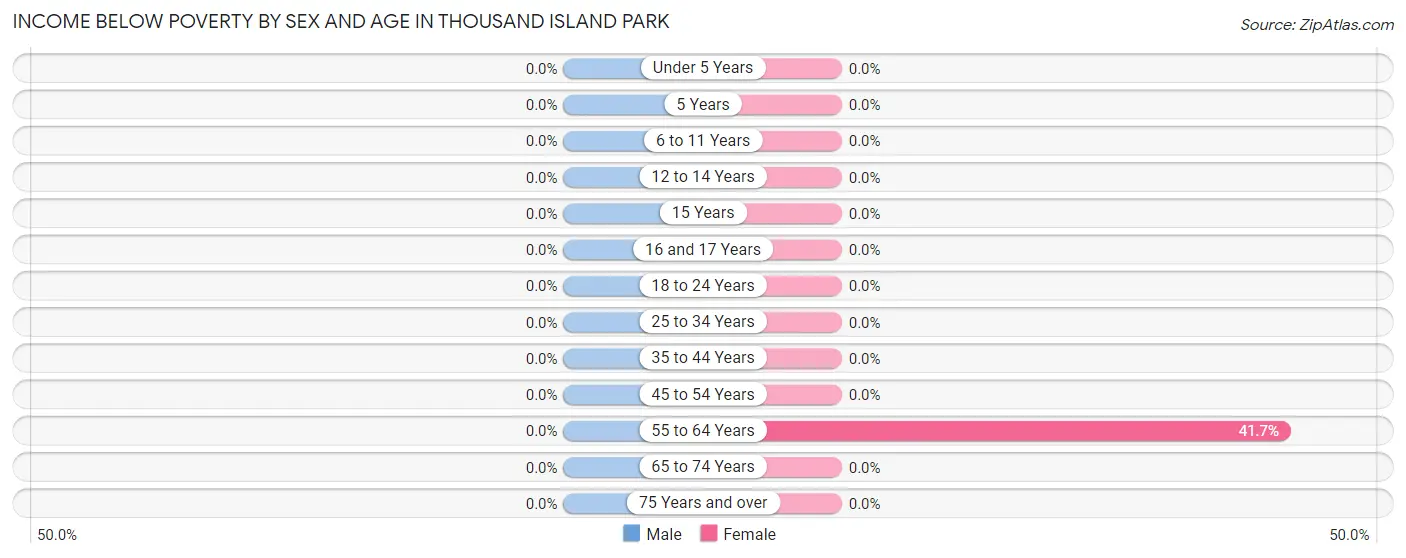
| Age Bracket | Male | Female |
| Under 5 Years | 0 (0.0%) | 0 (0.0%) |
| 5 Years | 0 (0.0%) | 0 (0.0%) |
| 6 to 11 Years | 0 (0.0%) | 0 (0.0%) |
| 12 to 14 Years | 0 (0.0%) | 0 (0.0%) |
| 15 Years | 0 (0.0%) | 0 (0.0%) |
| 16 and 17 Years | 0 (0.0%) | 0 (0.0%) |
| 18 to 24 Years | 0 (0.0%) | 0 (0.0%) |
| 25 to 34 Years | 0 (0.0%) | 0 (0.0%) |
| 35 to 44 Years | 0 (0.0%) | 0 (0.0%) |
| 45 to 54 Years | 0 (0.0%) | 0 (0.0%) |
| 55 to 64 Years | 0 (0.0%) | 5 (41.7%) |
| 65 to 74 Years | 0 (0.0%) | 0 (0.0%) |
| 75 Years and over | 0 (0.0%) | 0 (0.0%) |
| Total | 0 (0.0%) | 5 (4.6%) |
Income Above Poverty by Sex and Age in Thousand Island Park
According to the poverty statistics in Thousand Island Park, males aged 6 to 11 years and females aged 6 to 11 years are the age groups that are most secure financially, with 100.0% of males and 100.0% of females in these age groups living above the poverty line.
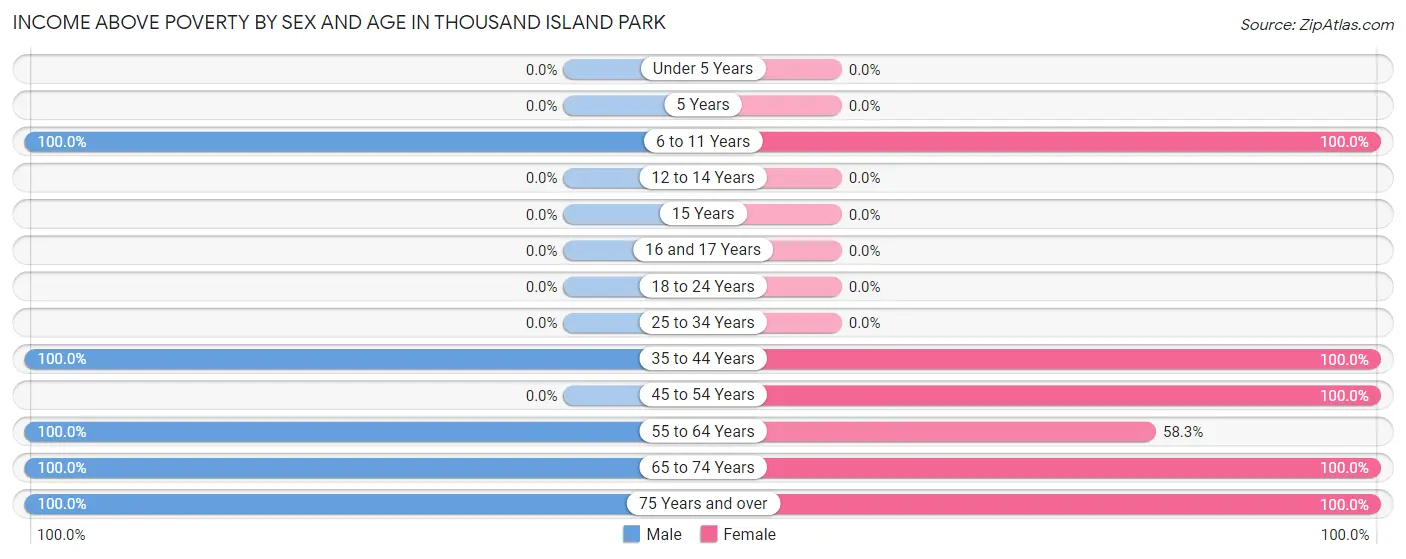
| Age Bracket | Male | Female |
| Under 5 Years | 0 (0.0%) | 0 (0.0%) |
| 5 Years | 0 (0.0%) | 0 (0.0%) |
| 6 to 11 Years | 8 (100.0%) | 12 (100.0%) |
| 12 to 14 Years | 0 (0.0%) | 0 (0.0%) |
| 15 Years | 0 (0.0%) | 0 (0.0%) |
| 16 and 17 Years | 0 (0.0%) | 0 (0.0%) |
| 18 to 24 Years | 0 (0.0%) | 0 (0.0%) |
| 25 to 34 Years | 0 (0.0%) | 0 (0.0%) |
| 35 to 44 Years | 36 (100.0%) | 12 (100.0%) |
| 45 to 54 Years | 0 (0.0%) | 36 (100.0%) |
| 55 to 64 Years | 7 (100.0%) | 7 (58.3%) |
| 65 to 74 Years | 20 (100.0%) | 12 (100.0%) |
| 75 Years and over | 37 (100.0%) | 24 (100.0%) |
| Total | 108 (100.0%) | 103 (95.4%) |
Income Below Poverty Among Married-Couple Families in Thousand Island Park
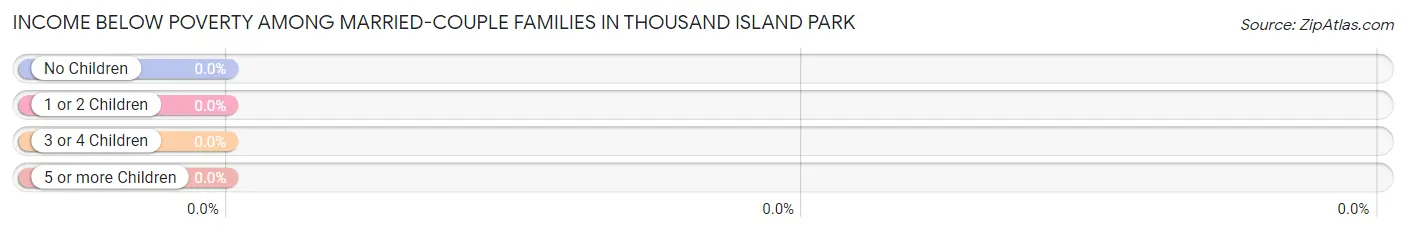
| Children | Above Poverty | Below Poverty |
| No Children | 60 (100.0%) | 0 (0.0%) |
| 1 or 2 Children | 10 (100.0%) | 0 (0.0%) |
| 3 or 4 Children | 0 (0.0%) | 0 (0.0%) |
| 5 or more Children | 0 (0.0%) | 0 (0.0%) |
| Total | 70 (100.0%) | 0 (0.0%) |
Income Below Poverty Among Single-Parent Households in Thousand Island Park
| Children | Single Father | Single Mother |
| No Children | 0 (0.0%) | 0 (0.0%) |
| 1 or 2 Children | 0 (0.0%) | 0 (0.0%) |
| 3 or 4 Children | 0 (0.0%) | 0 (0.0%) |
| 5 or more Children | 0 (0.0%) | 0 (0.0%) |
| Total | 0 (0.0%) | 0 (0.0%) |
Income Below Poverty Among Married-Couple vs Single-Parent Households in Thousand Island Park
| Children | Married-Couple Families | Single-Parent Households |
| No Children | 0 (0.0%) | 0 (0.0%) |
| 1 or 2 Children | 0 (0.0%) | 0 (0.0%) |
| 3 or 4 Children | 0 (0.0%) | 0 (0.0%) |
| 5 or more Children | 0 (0.0%) | 0 (0.0%) |
| Total | 0 (0.0%) | 0 (0.0%) |
Race in Thousand Island Park
The most populous races in Thousand Island Park are , and White / Caucasian (216 | 100.0%).
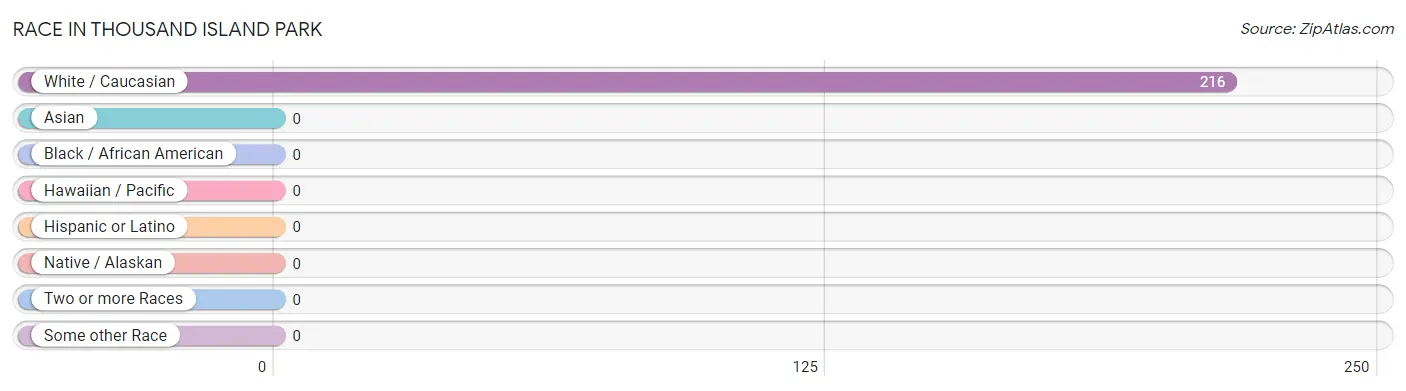
| Race | # Population | % Population |
| Asian | 0 | 0.0% |
| Black / African American | 0 | 0.0% |
| Hawaiian / Pacific | 0 | 0.0% |
| Hispanic or Latino | 0 | 0.0% |
| Native / Alaskan | 0 | 0.0% |
| White / Caucasian | 216 | 100.0% |
| Two or more Races | 0 | 0.0% |
| Some other Race | 0 | 0.0% |
| Total | 216 | 100.0% |
Ancestry in Thousand Island Park
The most populous ancestries reported in Thousand Island Park are Irish (58 | 26.9%), Italian (55 | 25.5%), Scottish (36 | 16.7%), German (35 | 16.2%), and English (26 | 12.0%), together accounting for 97.2% of all Thousand Island Park residents.
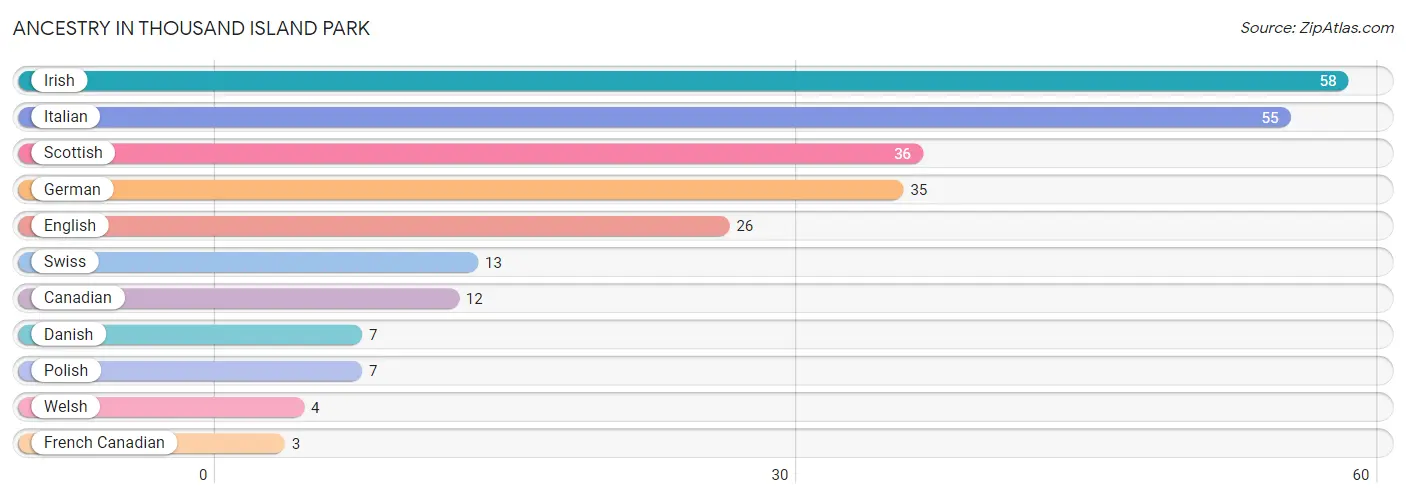
| Ancestry | # Population | % Population |
| Canadian | 12 | 5.6% |
| Danish | 7 | 3.2% |
| English | 26 | 12.0% |
| French Canadian | 3 | 1.4% |
| German | 35 | 16.2% |
| Irish | 58 | 26.9% |
| Italian | 55 | 25.5% |
| Polish | 7 | 3.2% |
| Scottish | 36 | 16.7% |
| Swiss | 13 | 6.0% |
| Welsh | 4 | 1.8% | View All 11 Rows |
Immigrants in Thousand Island Park
The most numerous immigrant groups reported in Thousand Island Park came from , and Canada (5 | 2.3%), together accounting for 2.3% of all Thousand Island Park residents.

| Immigration Origin | # Population | % Population |
| Canada | 5 | 2.3% | View All 1 Rows |
Sex and Age in Thousand Island Park
Sex and Age in Thousand Island Park
The most populous age groups in Thousand Island Park are 40 to 44 Years (36 | 33.3%) for men and 45 to 49 Years (36 | 33.3%) for women.
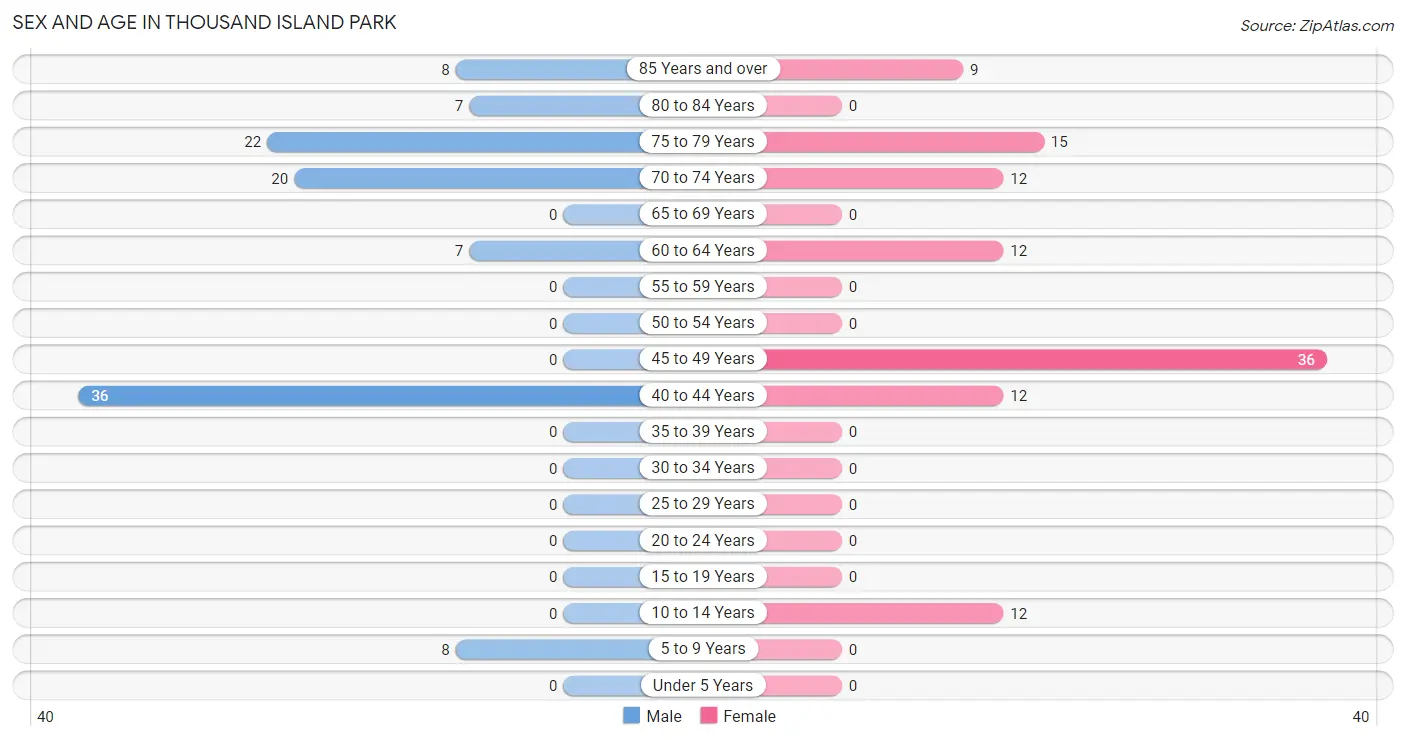
| Age Bracket | Male | Female |
| Under 5 Years | 0 (0.0%) | 0 (0.0%) |
| 5 to 9 Years | 8 (7.4%) | 0 (0.0%) |
| 10 to 14 Years | 0 (0.0%) | 12 (11.1%) |
| 15 to 19 Years | 0 (0.0%) | 0 (0.0%) |
| 20 to 24 Years | 0 (0.0%) | 0 (0.0%) |
| 25 to 29 Years | 0 (0.0%) | 0 (0.0%) |
| 30 to 34 Years | 0 (0.0%) | 0 (0.0%) |
| 35 to 39 Years | 0 (0.0%) | 0 (0.0%) |
| 40 to 44 Years | 36 (33.3%) | 12 (11.1%) |
| 45 to 49 Years | 0 (0.0%) | 36 (33.3%) |
| 50 to 54 Years | 0 (0.0%) | 0 (0.0%) |
| 55 to 59 Years | 0 (0.0%) | 0 (0.0%) |
| 60 to 64 Years | 7 (6.5%) | 12 (11.1%) |
| 65 to 69 Years | 0 (0.0%) | 0 (0.0%) |
| 70 to 74 Years | 20 (18.5%) | 12 (11.1%) |
| 75 to 79 Years | 22 (20.4%) | 15 (13.9%) |
| 80 to 84 Years | 7 (6.5%) | 0 (0.0%) |
| 85 Years and over | 8 (7.4%) | 9 (8.3%) |
| Total | 108 (100.0%) | 108 (100.0%) |
Families and Households in Thousand Island Park
Median Family Size in Thousand Island Park
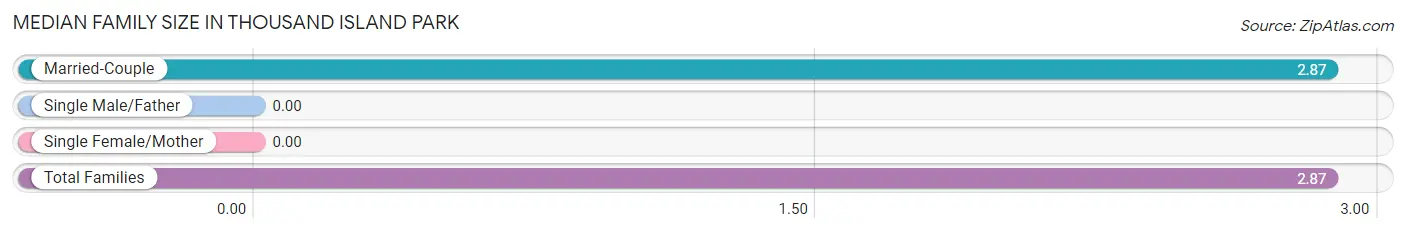
| Family Type | # Families | Family Size |
| Married-Couple | 70 (100.0%) | 2.87 |
| Single Male/Father | 0 (0.0%) | - |
| Single Female/Mother | 0 (0.0%) | - |
| Total Families | 70 (100.0%) | 2.87 |
Median Household Size in Thousand Island Park
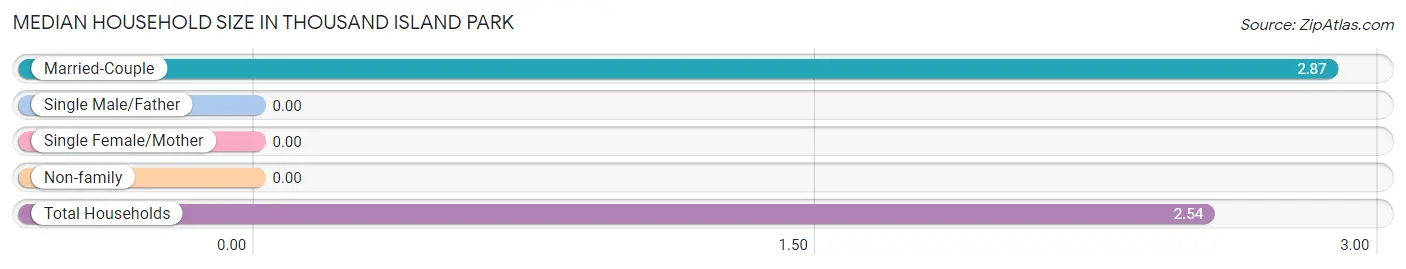
| Household Type | # Households | Household Size |
| Married-Couple | 70 (82.4%) | 2.87 |
| Single Male/Father | 0 (0.0%) | - |
| Single Female/Mother | 0 (0.0%) | - |
| Non-family | 15 (17.6%) | - |
| Total Households | 85 (100.0%) | 2.54 |
Household Size by Marriage Status in Thousand Island Park
Out of a total of 85 households in Thousand Island Park, 70 (82.4%) are family households, while 15 (17.6%) are nonfamily households. The most numerous type of family households are 2-person households, comprising 38, and the most common type of nonfamily households are 1-person households, comprising 15.
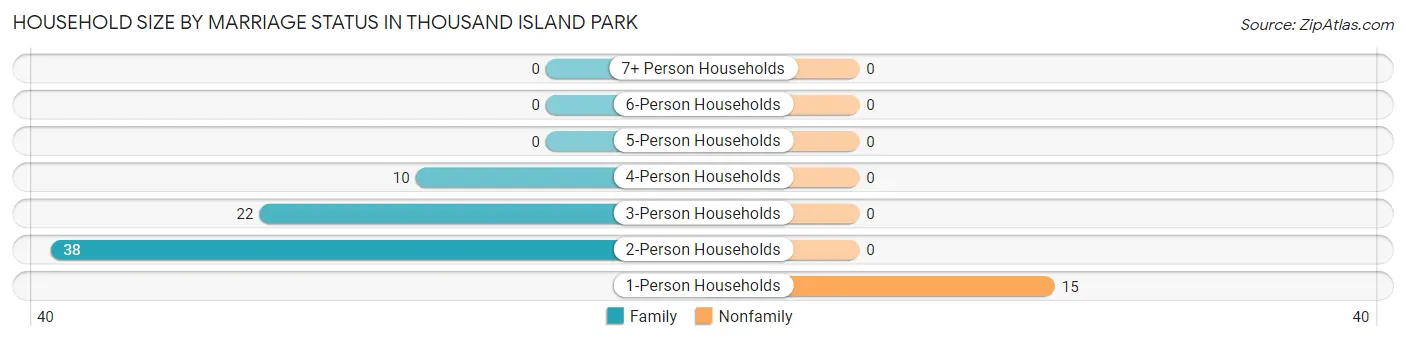
| Household Size | Family Households | Nonfamily Households |
| 1-Person Households | - | 15 (17.6%) |
| 2-Person Households | 38 (44.7%) | 0 (0.0%) |
| 3-Person Households | 22 (25.9%) | 0 (0.0%) |
| 4-Person Households | 10 (11.8%) | 0 (0.0%) |
| 5-Person Households | 0 (0.0%) | 0 (0.0%) |
| 6-Person Households | 0 (0.0%) | 0 (0.0%) |
| 7+ Person Households | 0 (0.0%) | 0 (0.0%) |
| Total | 70 (82.4%) | 15 (17.6%) |
Female Fertility in Thousand Island Park
Fertility by Age in Thousand Island Park
| Age Bracket | Women with Births | Births / 1,000 Women |
| 15 to 19 years | 0 (0.0%) | 0.0 |
| 20 to 34 years | 0 (0.0%) | 0.0 |
| 35 to 50 years | 0 (0.0%) | 0.0 |
| Total | 0 (0.0%) | 0.0 |
Fertility by Age by Marriage Status in Thousand Island Park
| Age Bracket | Married | Unmarried |
| 15 to 19 years | 0 (0.0%) | 0 (0.0%) |
| 20 to 34 years | 0 (0.0%) | 0 (0.0%) |
| 35 to 50 years | 0 (0.0%) | 0 (0.0%) |
| Total | 0 (0.0%) | 0 (0.0%) |
Fertility by Education in Thousand Island Park
| Educational Attainment | Women with Births | Births / 1,000 Women |
| Less than High School | 0 (0.0%) | 0.0 |
| High School Diploma | 0 (0.0%) | 0.0 |
| College or Associate's Degree | 0 (0.0%) | 0.0 |
| Bachelor's Degree | 0 (0.0%) | 0.0 |
| Graduate Degree | 0 (0.0%) | 0.0 |
| Total | 0 (0.0%) | 0.0 |
Fertility by Education by Marriage Status in Thousand Island Park
| Educational Attainment | Married | Unmarried |
| Less than High School | 0 (0.0%) | 0 (0.0%) |
| High School Diploma | 0 (0.0%) | 0 (0.0%) |
| College or Associate's Degree | 0 (0.0%) | 0 (0.0%) |
| Bachelor's Degree | 0 (0.0%) | 0 (0.0%) |
| Graduate Degree | 0 (0.0%) | 0 (0.0%) |
| Total | 0 (0.0%) | 0 (0.0%) |
Employment Characteristics in Thousand Island Park
Employment by Class of Employer in Thousand Island Park
Among the 101 employed individuals in Thousand Island Park, not-for-profit organizations (36 | 35.6%), private company employees (33 | 32.7%), and self-employed (not incorporated) (22 | 21.8%) make up the most common classes of employment.
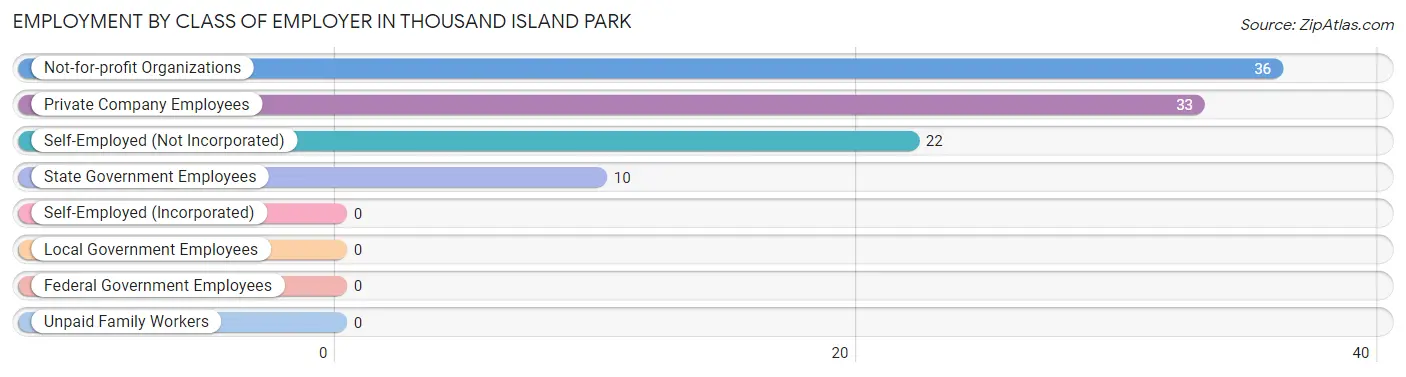
| Employer Class | # Employees | % Employees |
| Private Company Employees | 33 | 32.7% |
| Self-Employed (Incorporated) | 0 | 0.0% |
| Self-Employed (Not Incorporated) | 22 | 21.8% |
| Not-for-profit Organizations | 36 | 35.6% |
| Local Government Employees | 0 | 0.0% |
| State Government Employees | 10 | 9.9% |
| Federal Government Employees | 0 | 0.0% |
| Unpaid Family Workers | 0 | 0.0% |
| Total | 101 | 100.0% |
Employment Status by Age in Thousand Island Park
According to the labor force statistics for Thousand Island Park, out of the total population over 16 years of age (196), 57.7% or 113 individuals are in the labor force, with 10.6% or 12 of them unemployed. The age group with the highest labor force participation rate is 35 to 44 years, with 100.0% or 48 individuals in the labor force. Within the labor force, the 35 to 44 years age range has the highest percentage of unemployed individuals, with 25.0% or 12 of them being unemployed.
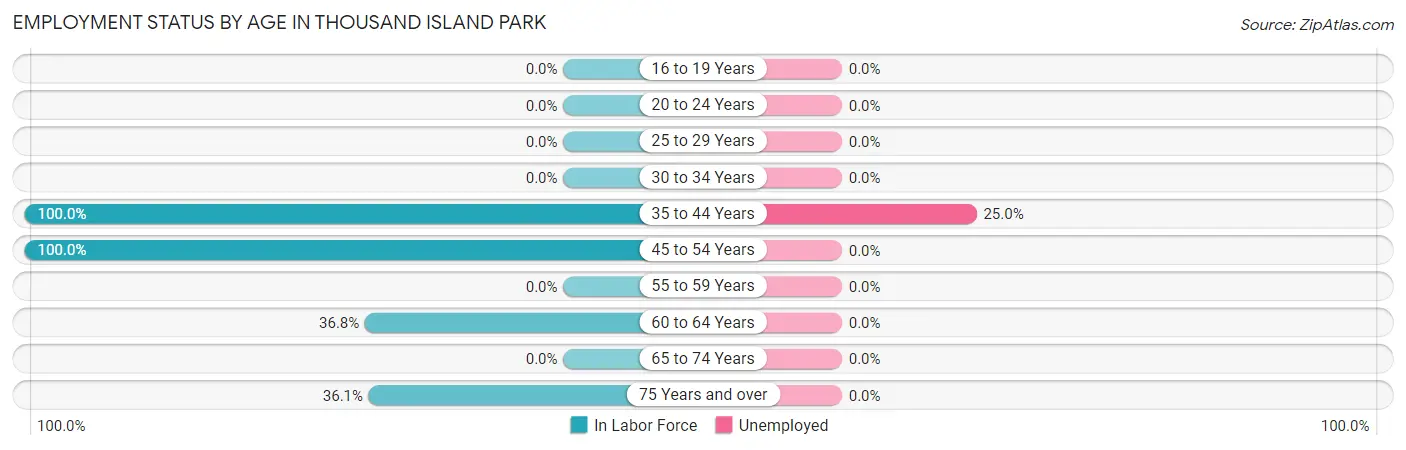
| Age Bracket | In Labor Force | Unemployed |
| 16 to 19 Years | 0 (0.0%) | 0 (0.0%) |
| 20 to 24 Years | 0 (0.0%) | 0 (0.0%) |
| 25 to 29 Years | 0 (0.0%) | 0 (0.0%) |
| 30 to 34 Years | 0 (0.0%) | 0 (0.0%) |
| 35 to 44 Years | 48 (100.0%) | 12 (25.0%) |
| 45 to 54 Years | 36 (100.0%) | 0 (0.0%) |
| 55 to 59 Years | 0 (0.0%) | 0 (0.0%) |
| 60 to 64 Years | 7 (36.8%) | 0 (0.0%) |
| 65 to 74 Years | 0 (0.0%) | 0 (0.0%) |
| 75 Years and over | 22 (36.1%) | 0 (0.0%) |
| Total | 113 (57.7%) | 12 (10.6%) |
Employment Status by Educational Attainment in Thousand Island Park
According to labor force statistics for Thousand Island Park, 88.3% of individuals (91) out of the total population between 25 and 64 years of age (103) are in the labor force, with 13.2% or 12 of them being unemployed. The group with the highest labor force participation rate are those with the educational attainment of college / associate degree, with 89.6% or 43 individuals in the labor force. Within the labor force, individuals with bachelor's degree or higher education have the highest percentage of unemployment, with 25.0% or 12 of them being unemployed.
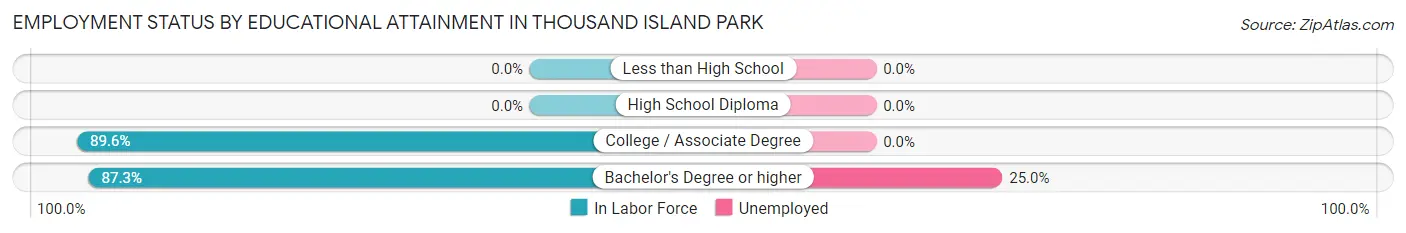
| Educational Attainment | In Labor Force | Unemployed |
| Less than High School | 0 (0.0%) | 0 (0.0%) |
| High School Diploma | 0 (0.0%) | 0 (0.0%) |
| College / Associate Degree | 43 (89.6%) | 0 (0.0%) |
| Bachelor's Degree or higher | 48 (87.3%) | 14 (25.0%) |
| Total | 91 (88.3%) | 14 (13.2%) |
Employment Occupations by Sex in Thousand Island Park
Management, Business, Science and Arts Occupations
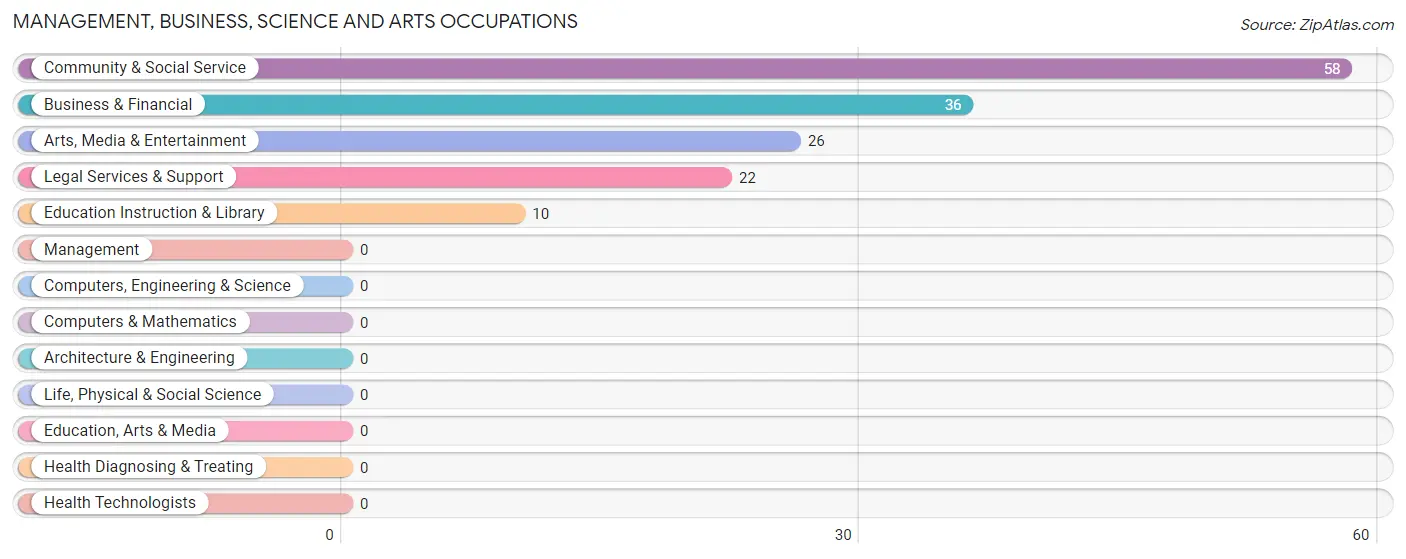
The most common Management, Business, Science and Arts occupations in Thousand Island Park are Community & Social Service (58 | 57.4%), Business & Financial (36 | 35.6%), Arts, Media & Entertainment (26 | 25.7%), Legal Services & Support (22 | 21.8%), and Education Instruction & Library (10 | 9.9%).
Management, Business, Science and Arts Occupations by Sex
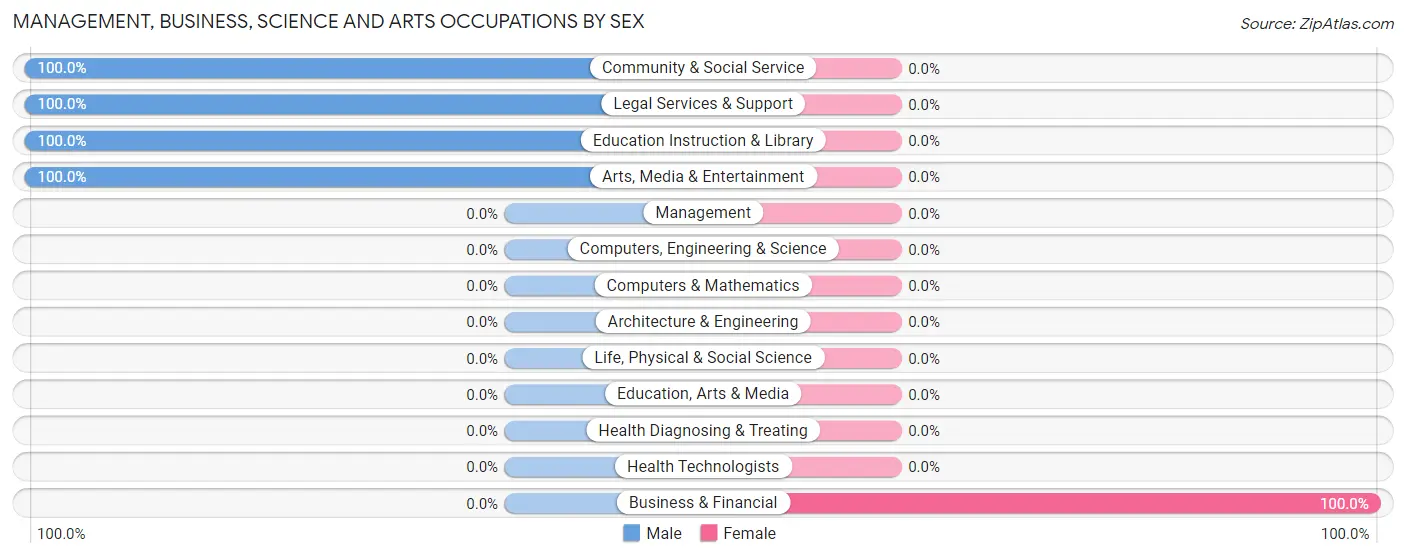
| Occupation | Male | Female |
| Management | 0 (0.0%) | 0 (0.0%) |
| Business & Financial | 0 (0.0%) | 36 (100.0%) |
| Computers, Engineering & Science | 0 (0.0%) | 0 (0.0%) |
| Computers & Mathematics | 0 (0.0%) | 0 (0.0%) |
| Architecture & Engineering | 0 (0.0%) | 0 (0.0%) |
| Life, Physical & Social Science | 0 (0.0%) | 0 (0.0%) |
| Community & Social Service | 58 (100.0%) | 0 (0.0%) |
| Education, Arts & Media | 0 (0.0%) | 0 (0.0%) |
| Legal Services & Support | 22 (100.0%) | 0 (0.0%) |
| Education Instruction & Library | 10 (100.0%) | 0 (0.0%) |
| Arts, Media & Entertainment | 26 (100.0%) | 0 (0.0%) |
| Health Diagnosing & Treating | 0 (0.0%) | 0 (0.0%) |
| Health Technologists | 0 (0.0%) | 0 (0.0%) |
| Total (Category) | 58 (61.7%) | 36 (38.3%) |
| Total (Overall) | 58 (57.4%) | 43 (42.6%) |
Services Occupations
Services Occupations by Sex
| Occupation | Male | Female |
| Healthcare Support | 0 (0.0%) | 0 (0.0%) |
| Security & Protection | 0 (0.0%) | 0 (0.0%) |
| Firefighting & Prevention | 0 (0.0%) | 0 (0.0%) |
| Law Enforcement | 0 (0.0%) | 0 (0.0%) |
| Food Preparation & Serving | 0 (0.0%) | 0 (0.0%) |
| Cleaning & Maintenance | 0 (0.0%) | 0 (0.0%) |
| Personal Care & Service | 0 (0.0%) | 0 (0.0%) |
| Total (Category) | 0 (0.0%) | 0 (0.0%) |
| Total (Overall) | 58 (57.4%) | 43 (42.6%) |
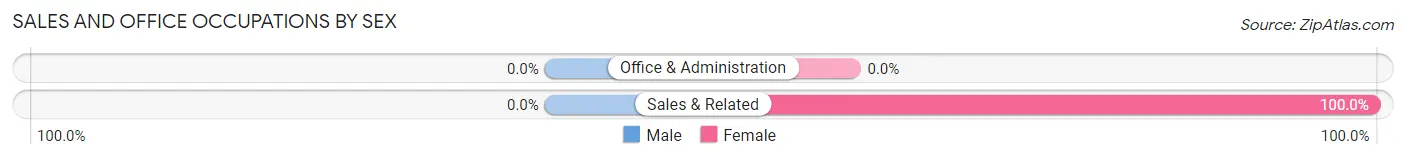
Sales and Office Occupations
The most common Sales and Office occupations in Thousand Island Park are , and Sales & Related (7 | 6.9%).
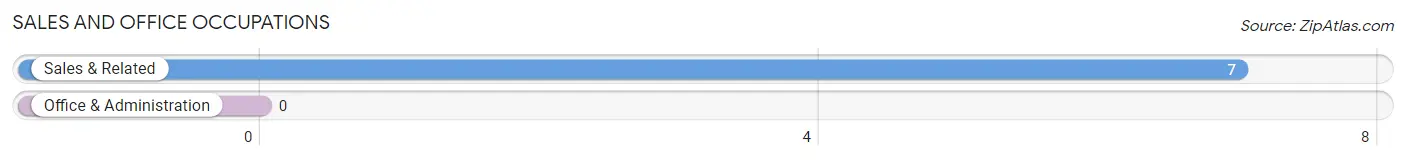
Sales and Office Occupations by Sex
| Occupation | Male | Female |
| Sales & Related | 0 (0.0%) | 7 (100.0%) |
| Office & Administration | 0 (0.0%) | 0 (0.0%) |
| Total (Category) | 0 (0.0%) | 7 (100.0%) |
| Total (Overall) | 58 (57.4%) | 43 (42.6%) |
Natural Resources, Construction and Maintenance Occupations
Natural Resources, Construction and Maintenance Occupations by Sex
| Occupation | Male | Female |
| Farming, Fishing & Forestry | 0 (0.0%) | 0 (0.0%) |
| Construction & Extraction | 0 (0.0%) | 0 (0.0%) |
| Installation, Maintenance & Repair | 0 (0.0%) | 0 (0.0%) |
| Total (Category) | 0 (0.0%) | 0 (0.0%) |
| Total (Overall) | 58 (57.4%) | 43 (42.6%) |
Production, Transportation and Moving Occupations
Production, Transportation and Moving Occupations by Sex
| Occupation | Male | Female |
| Production | 0 (0.0%) | 0 (0.0%) |
| Transportation | 0 (0.0%) | 0 (0.0%) |
| Material Moving | 0 (0.0%) | 0 (0.0%) |
| Total (Category) | 0 (0.0%) | 0 (0.0%) |
| Total (Overall) | 58 (57.4%) | 43 (42.6%) |
Employment Industries by Sex in Thousand Island Park
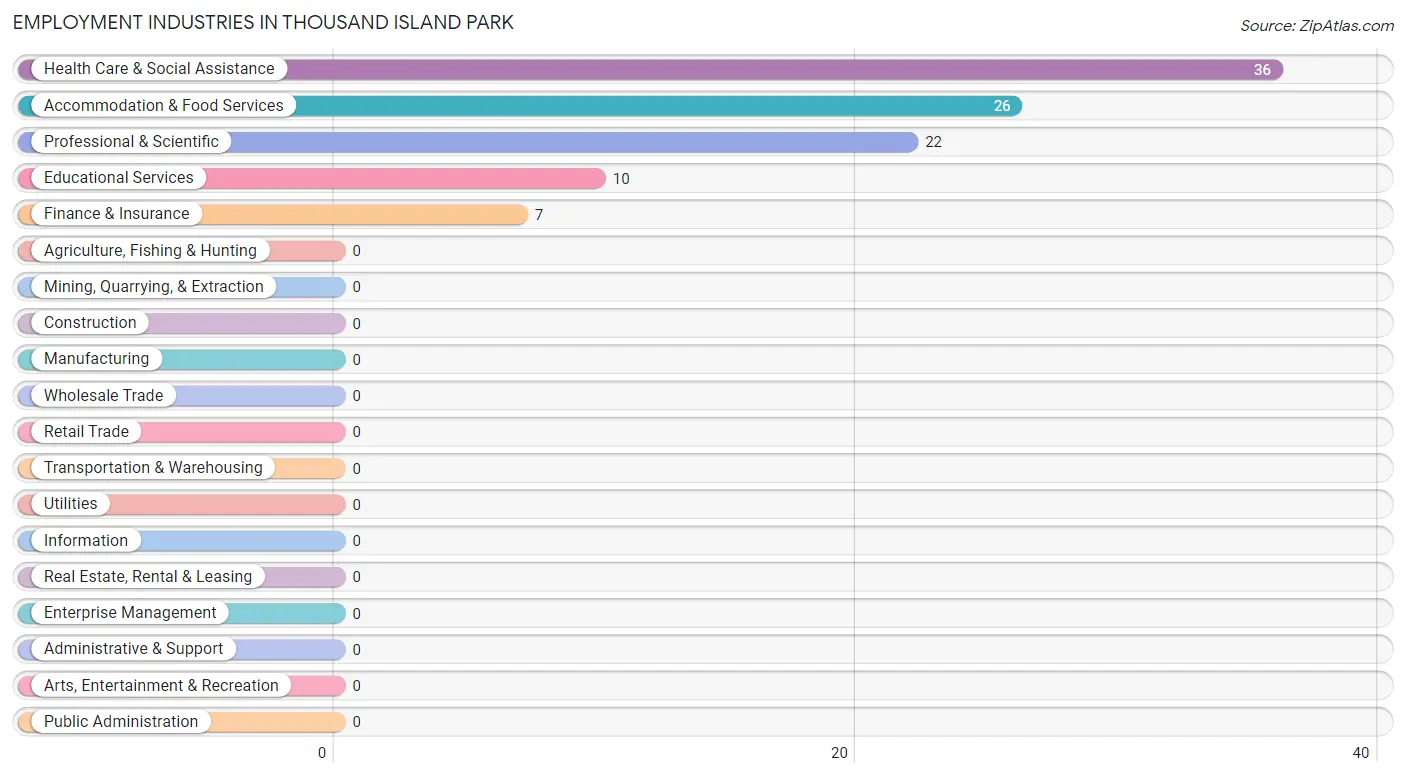
Employment Industries in Thousand Island Park
The major employment industries in Thousand Island Park include Health Care & Social Assistance (36 | 35.6%), Accommodation & Food Services (26 | 25.7%), Professional & Scientific (22 | 21.8%), Educational Services (10 | 9.9%), and Finance & Insurance (7 | 6.9%).
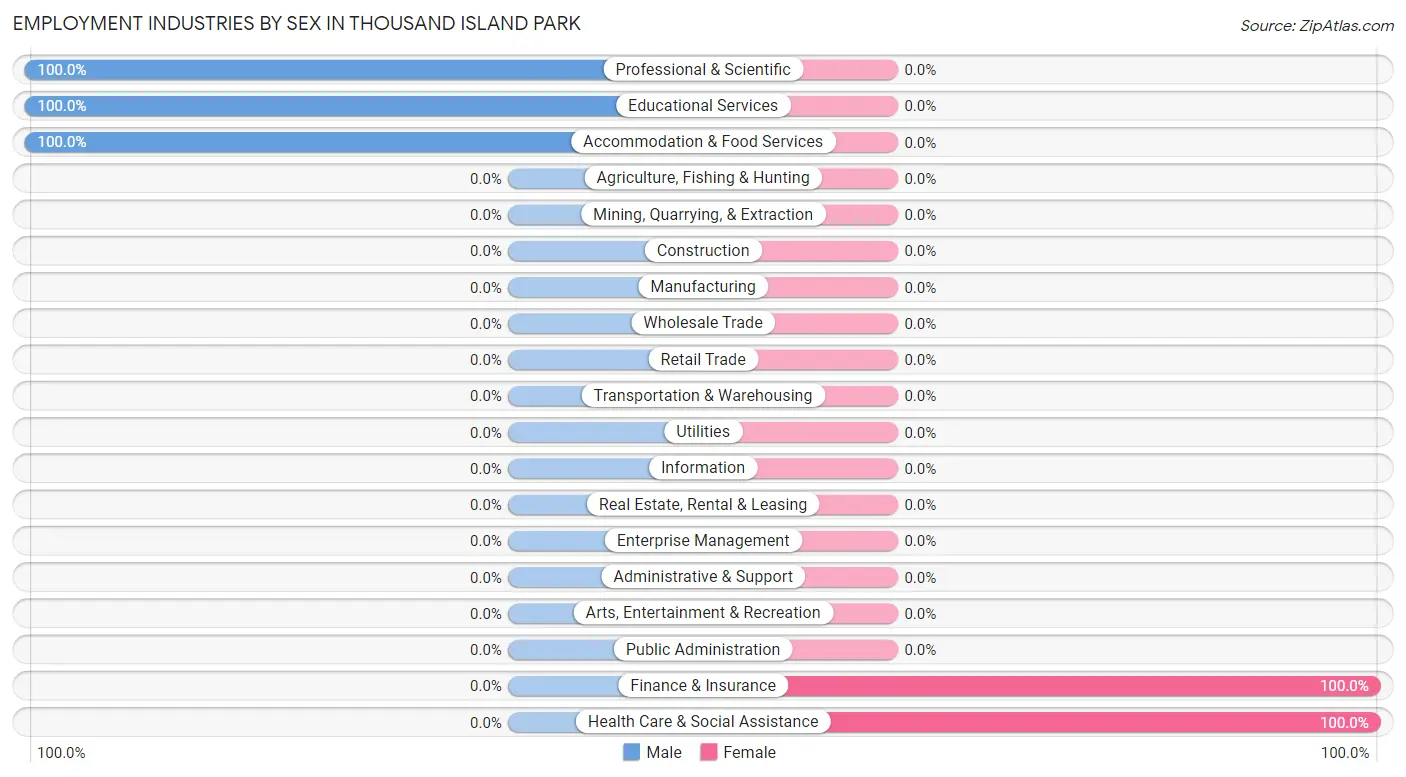
Employment Industries by Sex in Thousand Island Park
The Thousand Island Park industries that see more men than women are Professional & Scientific (100.0%), Educational Services (100.0%), and Accommodation & Food Services (100.0%), whereas the industries that tend to have a higher number of women are Finance & Insurance (100.0%), and Health Care & Social Assistance (100.0%).
| Industry | Male | Female |
| Agriculture, Fishing & Hunting | 0 (0.0%) | 0 (0.0%) |
| Mining, Quarrying, & Extraction | 0 (0.0%) | 0 (0.0%) |
| Construction | 0 (0.0%) | 0 (0.0%) |
| Manufacturing | 0 (0.0%) | 0 (0.0%) |
| Wholesale Trade | 0 (0.0%) | 0 (0.0%) |
| Retail Trade | 0 (0.0%) | 0 (0.0%) |
| Transportation & Warehousing | 0 (0.0%) | 0 (0.0%) |
| Utilities | 0 (0.0%) | 0 (0.0%) |
| Information | 0 (0.0%) | 0 (0.0%) |
| Finance & Insurance | 0 (0.0%) | 7 (100.0%) |
| Real Estate, Rental & Leasing | 0 (0.0%) | 0 (0.0%) |
| Professional & Scientific | 22 (100.0%) | 0 (0.0%) |
| Enterprise Management | 0 (0.0%) | 0 (0.0%) |
| Administrative & Support | 0 (0.0%) | 0 (0.0%) |
| Educational Services | 10 (100.0%) | 0 (0.0%) |
| Health Care & Social Assistance | 0 (0.0%) | 36 (100.0%) |
| Arts, Entertainment & Recreation | 0 (0.0%) | 0 (0.0%) |
| Accommodation & Food Services | 26 (100.0%) | 0 (0.0%) |
| Public Administration | 0 (0.0%) | 0 (0.0%) |
| Total | 58 (57.4%) | 43 (42.6%) |
Education in Thousand Island Park
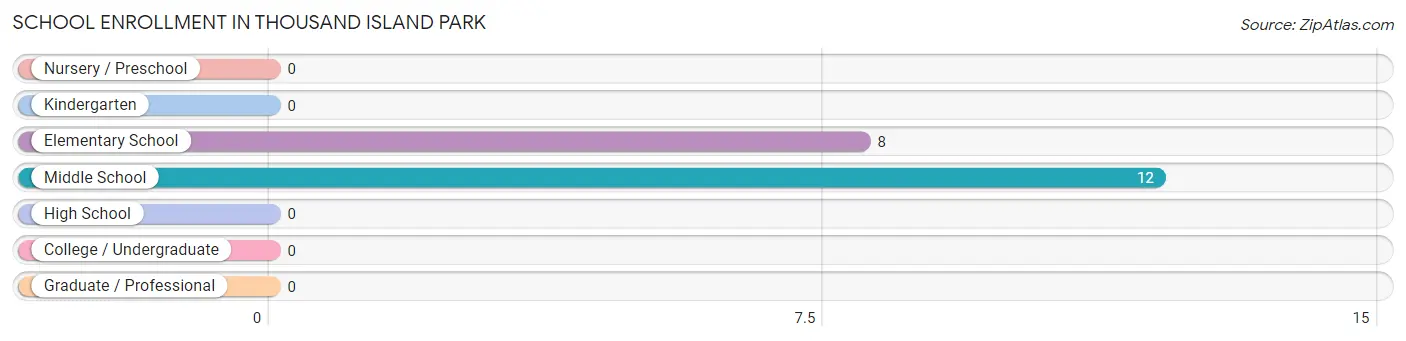
School Enrollment in Thousand Island Park
The most common levels of schooling among the 20 students in Thousand Island Park are middle school (12 | 60.0%), and elementary school (8 | 40.0%).
| School Level | # Students | % Students |
| Nursery / Preschool | 0 | 0.0% |
| Kindergarten | 0 | 0.0% |
| Elementary School | 8 | 40.0% |
| Middle School | 12 | 60.0% |
| High School | 0 | 0.0% |
| College / Undergraduate | 0 | 0.0% |
| Graduate / Professional | 0 | 0.0% |
| Total | 20 | 100.0% |
School Enrollment by Age by Funding Source in Thousand Island Park
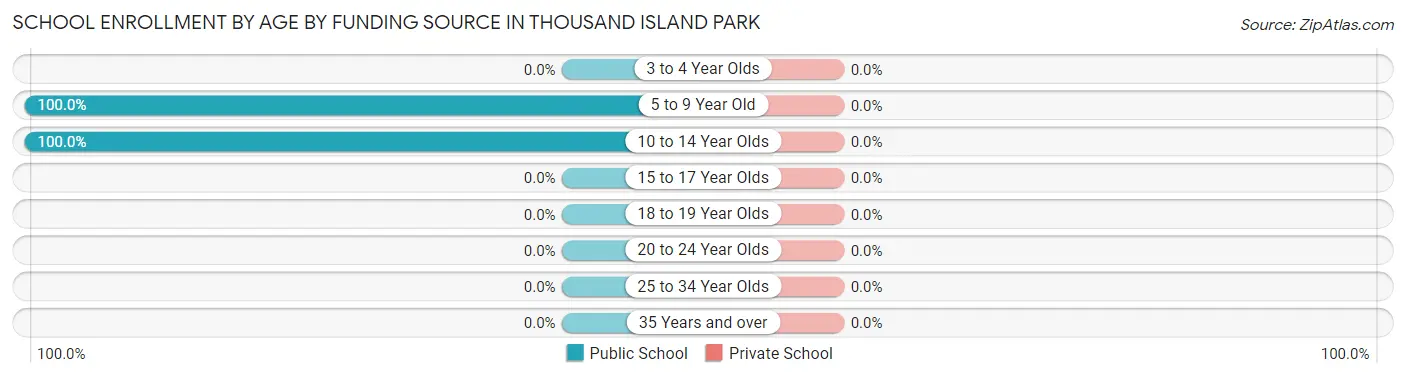
| Age Bracket | Public School | Private School |
| 3 to 4 Year Olds | 0 (0.0%) | 0 (0.0%) |
| 5 to 9 Year Old | 8 (100.0%) | 0 (0.0%) |
| 10 to 14 Year Olds | 12 (100.0%) | 0 (0.0%) |
| 15 to 17 Year Olds | 0 (0.0%) | 0 (0.0%) |
| 18 to 19 Year Olds | 0 (0.0%) | 0 (0.0%) |
| 20 to 24 Year Olds | 0 (0.0%) | 0 (0.0%) |
| 25 to 34 Year Olds | 0 (0.0%) | 0 (0.0%) |
| 35 Years and over | 0 (0.0%) | 0 (0.0%) |
| Total | 20 (100.0%) | 0 (0.0%) |
Educational Attainment by Field of Study in Thousand Island Park
Business (30 | 23.8%), social sciences (29 | 23.0%), psychology (22 | 17.5%), engineering (20 | 15.9%), and visual & performing arts (13 | 10.3%) are the most common fields of study among 126 individuals in Thousand Island Park who have obtained a bachelor's degree or higher.
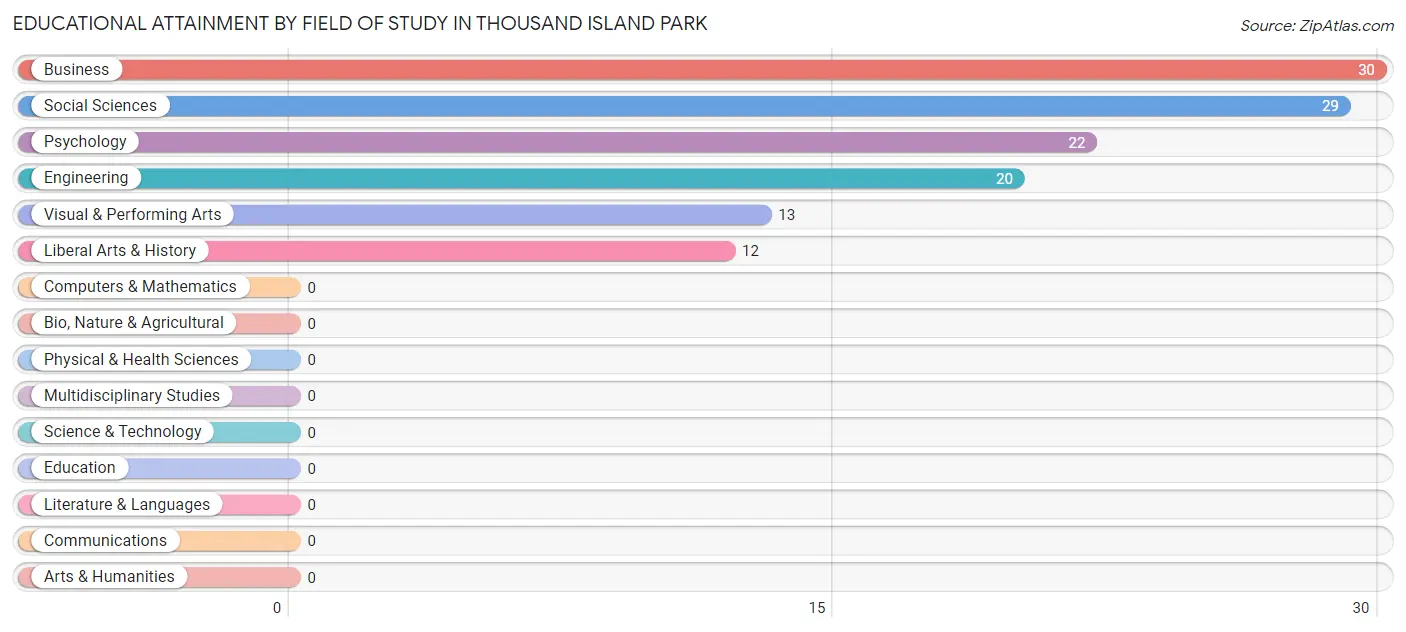
| Field of Study | # Graduates | % Graduates |
| Computers & Mathematics | 0 | 0.0% |
| Bio, Nature & Agricultural | 0 | 0.0% |
| Physical & Health Sciences | 0 | 0.0% |
| Psychology | 22 | 17.5% |
| Social Sciences | 29 | 23.0% |
| Engineering | 20 | 15.9% |
| Multidisciplinary Studies | 0 | 0.0% |
| Science & Technology | 0 | 0.0% |
| Business | 30 | 23.8% |
| Education | 0 | 0.0% |
| Literature & Languages | 0 | 0.0% |
| Liberal Arts & History | 12 | 9.5% |
| Visual & Performing Arts | 13 | 10.3% |
| Communications | 0 | 0.0% |
| Arts & Humanities | 0 | 0.0% |
| Total | 126 | 100.0% |
Transportation & Commute in Thousand Island Park
Vehicle Availability by Sex in Thousand Island Park
The most prevalent vehicle ownership categories in Thousand Island Park are males with 2 vehicles (48, accounting for 82.8%) and females with 2 vehicles (43, making up 111.6%).
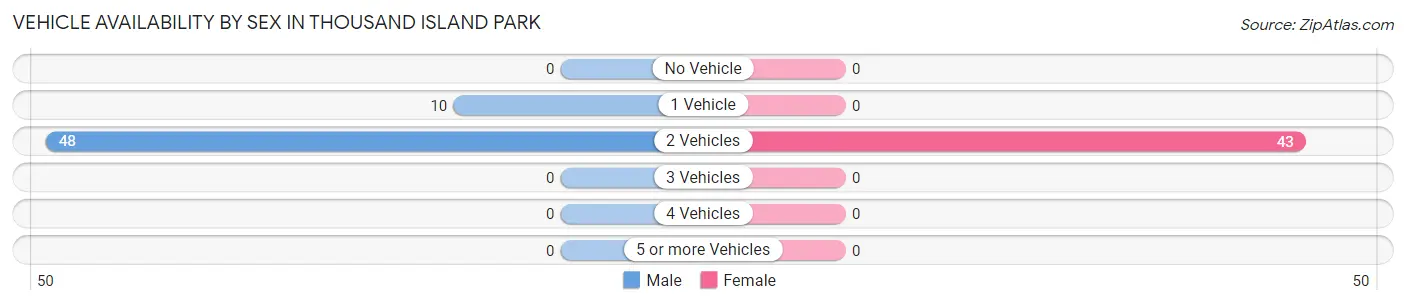
| Vehicles Available | Male | Female |
| No Vehicle | 0 (0.0%) | 0 (0.0%) |
| 1 Vehicle | 10 (17.2%) | 0 (0.0%) |
| 2 Vehicles | 48 (82.8%) | 43 (100.0%) |
| 3 Vehicles | 0 (0.0%) | 0 (0.0%) |
| 4 Vehicles | 0 (0.0%) | 0 (0.0%) |
| 5 or more Vehicles | 0 (0.0%) | 0 (0.0%) |
| Total | 58 (100.0%) | 43 (100.0%) |
Commute Time in Thousand Island Park
The most frequently occuring commute durations in Thousand Island Park are 10 to 14 minutes (7 commuters, 100.0%), less than 5 minutes (0 commuters, 0.0%), and 5 to 9 minutes (0 commuters, 0.0%).
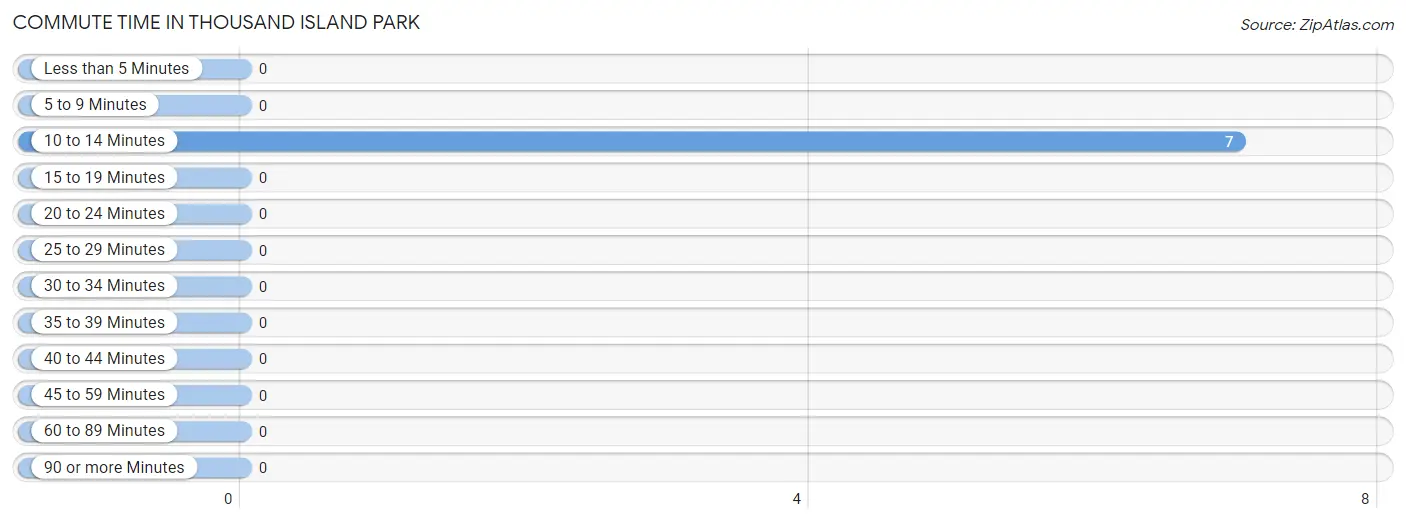
| Commute Time | # Commuters | % Commuters |
| Less than 5 Minutes | 0 | 0.0% |
| 5 to 9 Minutes | 0 | 0.0% |
| 10 to 14 Minutes | 7 | 100.0% |
| 15 to 19 Minutes | 0 | 0.0% |
| 20 to 24 Minutes | 0 | 0.0% |
| 25 to 29 Minutes | 0 | 0.0% |
| 30 to 34 Minutes | 0 | 0.0% |
| 35 to 39 Minutes | 0 | 0.0% |
| 40 to 44 Minutes | 0 | 0.0% |
| 45 to 59 Minutes | 0 | 0.0% |
| 60 to 89 Minutes | 0 | 0.0% |
| 90 or more Minutes | 0 | 0.0% |
Commute Time by Sex in Thousand Island Park
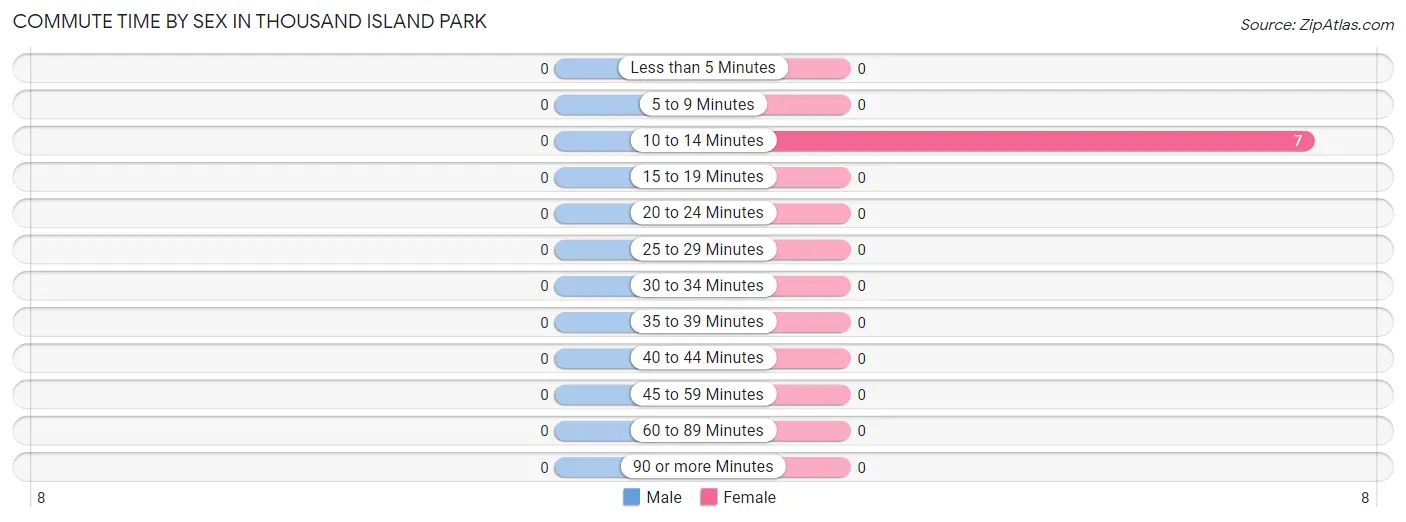
| Commute Time | Male | Female |
| Less than 5 Minutes | 0 (0.0%) | 0 (0.0%) |
| 5 to 9 Minutes | 0 (0.0%) | 0 (0.0%) |
| 10 to 14 Minutes | 0 (0.0%) | 7 (100.0%) |
| 15 to 19 Minutes | 0 (0.0%) | 0 (0.0%) |
| 20 to 24 Minutes | 0 (0.0%) | 0 (0.0%) |
| 25 to 29 Minutes | 0 (0.0%) | 0 (0.0%) |
| 30 to 34 Minutes | 0 (0.0%) | 0 (0.0%) |
| 35 to 39 Minutes | 0 (0.0%) | 0 (0.0%) |
| 40 to 44 Minutes | 0 (0.0%) | 0 (0.0%) |
| 45 to 59 Minutes | 0 (0.0%) | 0 (0.0%) |
| 60 to 89 Minutes | 0 (0.0%) | 0 (0.0%) |
| 90 or more Minutes | 0 (0.0%) | 0 (0.0%) |
Time of Departure to Work by Sex in Thousand Island Park
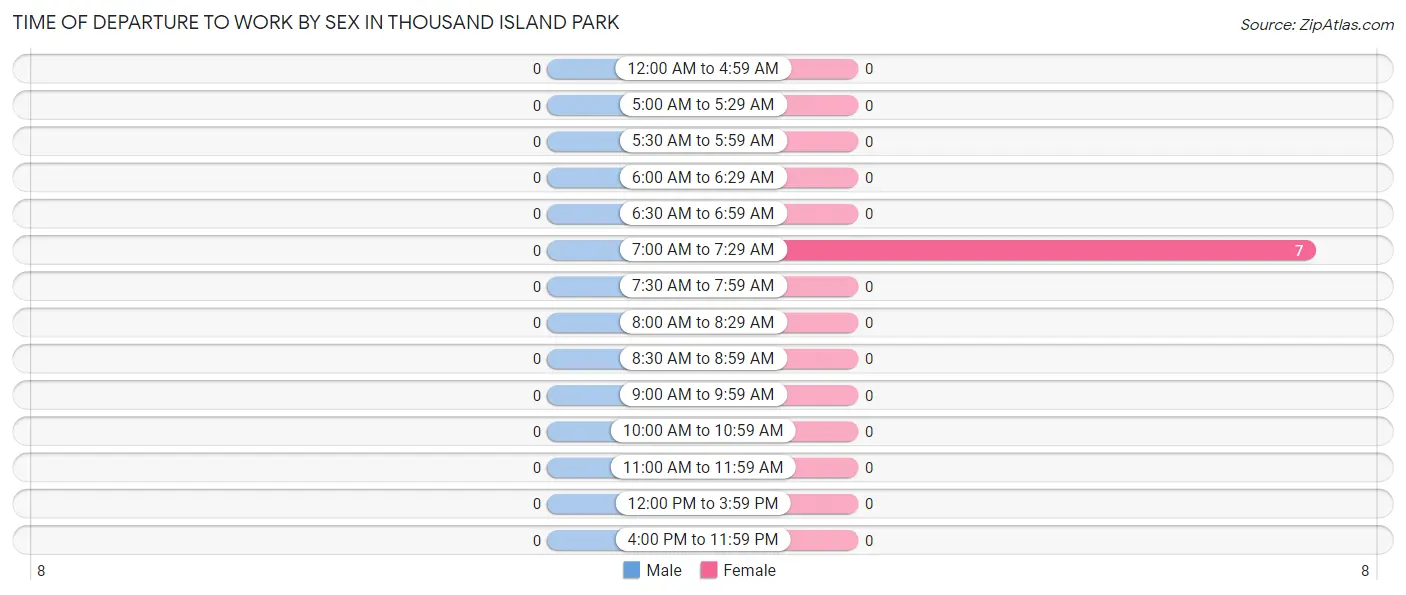
| Time of Departure | Male | Female |
| 12:00 AM to 4:59 AM | 0 (0.0%) | 0 (0.0%) |
| 5:00 AM to 5:29 AM | 0 (0.0%) | 0 (0.0%) |
| 5:30 AM to 5:59 AM | 0 (0.0%) | 0 (0.0%) |
| 6:00 AM to 6:29 AM | 0 (0.0%) | 0 (0.0%) |
| 6:30 AM to 6:59 AM | 0 (0.0%) | 0 (0.0%) |
| 7:00 AM to 7:29 AM | 0 (0.0%) | 7 (100.0%) |
| 7:30 AM to 7:59 AM | 0 (0.0%) | 0 (0.0%) |
| 8:00 AM to 8:29 AM | 0 (0.0%) | 0 (0.0%) |
| 8:30 AM to 8:59 AM | 0 (0.0%) | 0 (0.0%) |
| 9:00 AM to 9:59 AM | 0 (0.0%) | 0 (0.0%) |
| 10:00 AM to 10:59 AM | 0 (0.0%) | 0 (0.0%) |
| 11:00 AM to 11:59 AM | 0 (0.0%) | 0 (0.0%) |
| 12:00 PM to 3:59 PM | 0 (0.0%) | 0 (0.0%) |
| 4:00 PM to 11:59 PM | 0 (0.0%) | 0 (0.0%) |
| Total | 0 (0.0%) | 7 (100.0%) |
Housing Occupancy in Thousand Island Park
Occupancy by Ownership in Thousand Island Park
Of the total 85 dwellings in Thousand Island Park, owner-occupied units account for 80 (94.1%), while renter-occupied units make up 5 (5.9%).
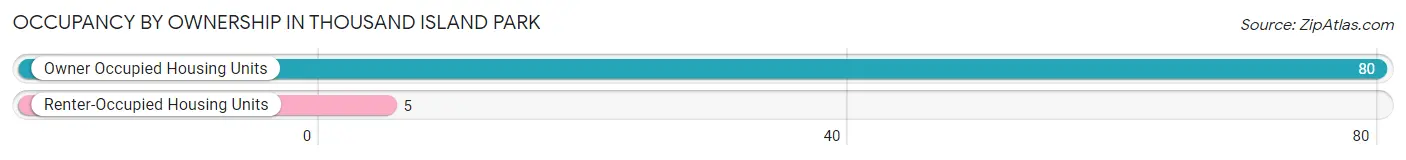
| Occupancy | # Housing Units | % Housing Units |
| Owner Occupied Housing Units | 80 | 94.1% |
| Renter-Occupied Housing Units | 5 | 5.9% |
| Total Occupied Housing Units | 85 | 100.0% |
Occupancy by Household Size in Thousand Island Park
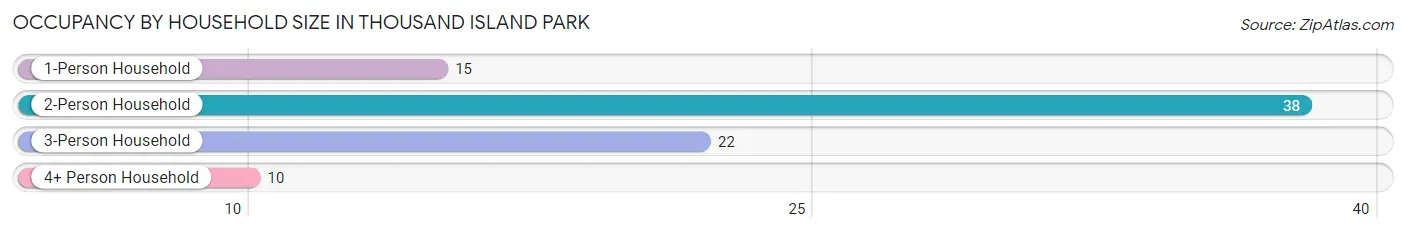
| Household Size | # Housing Units | % Housing Units |
| 1-Person Household | 15 | 17.6% |
| 2-Person Household | 38 | 44.7% |
| 3-Person Household | 22 | 25.9% |
| 4+ Person Household | 10 | 11.8% |
| Total Housing Units | 85 | 100.0% |
Occupancy by Ownership by Household Size in Thousand Island Park
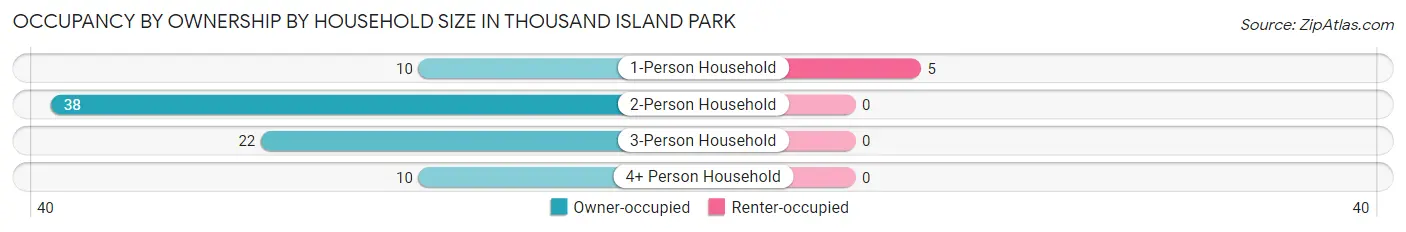
| Household Size | Owner-occupied | Renter-occupied |
| 1-Person Household | 10 (66.7%) | 5 (33.3%) |
| 2-Person Household | 38 (100.0%) | 0 (0.0%) |
| 3-Person Household | 22 (100.0%) | 0 (0.0%) |
| 4+ Person Household | 10 (100.0%) | 0 (0.0%) |
| Total Housing Units | 80 (94.1%) | 5 (5.9%) |
Occupancy by Educational Attainment in Thousand Island Park
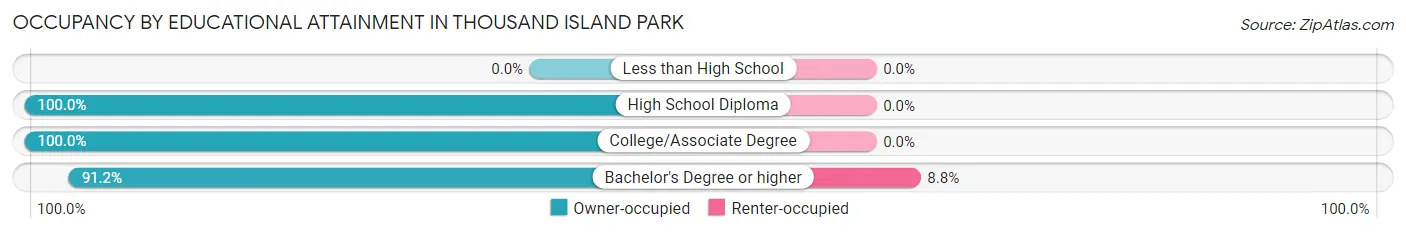
| Household Size | Owner-occupied | Renter-occupied |
| Less than High School | 0 (0.0%) | 0 (0.0%) |
| High School Diploma | 8 (100.0%) | 0 (0.0%) |
| College/Associate Degree | 20 (100.0%) | 0 (0.0%) |
| Bachelor's Degree or higher | 52 (91.2%) | 5 (8.8%) |
Occupancy by Age of Householder in Thousand Island Park
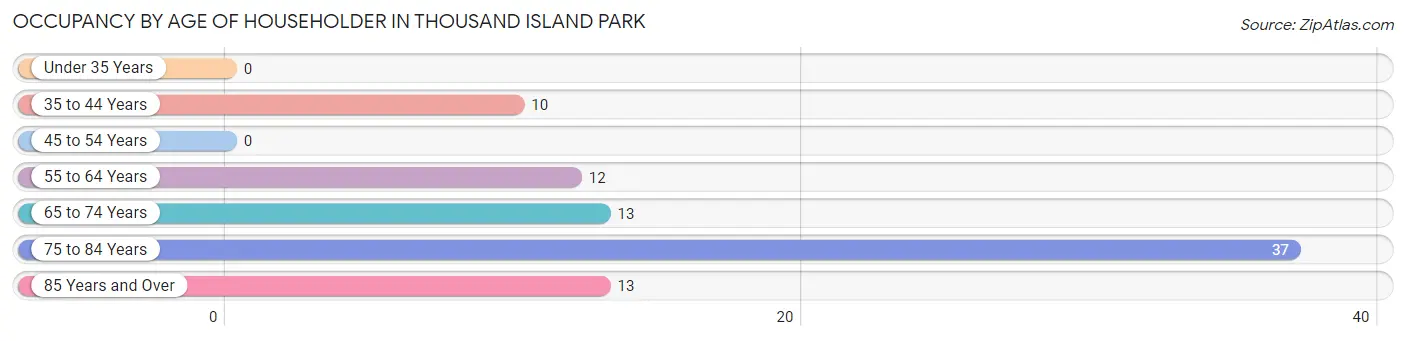
| Age Bracket | # Households | % Households |
| Under 35 Years | 0 | 0.0% |
| 35 to 44 Years | 10 | 11.8% |
| 45 to 54 Years | 0 | 0.0% |
| 55 to 64 Years | 12 | 14.1% |
| 65 to 74 Years | 13 | 15.3% |
| 75 to 84 Years | 37 | 43.5% |
| 85 Years and Over | 13 | 15.3% |
| Total | 85 | 100.0% |
Housing Finances in Thousand Island Park
Median Income by Occupancy in Thousand Island Park
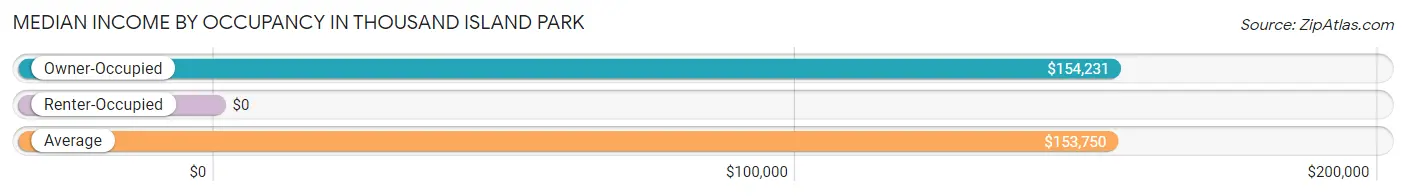
| Occupancy Type | # Households | Median Income |
| Owner-Occupied | 80 (94.1%) | $154,231 |
| Renter-Occupied | 5 (5.9%) | $0 |
| Average | 85 (100.0%) | $153,750 |
Occupancy by Householder Income Bracket in Thousand Island Park
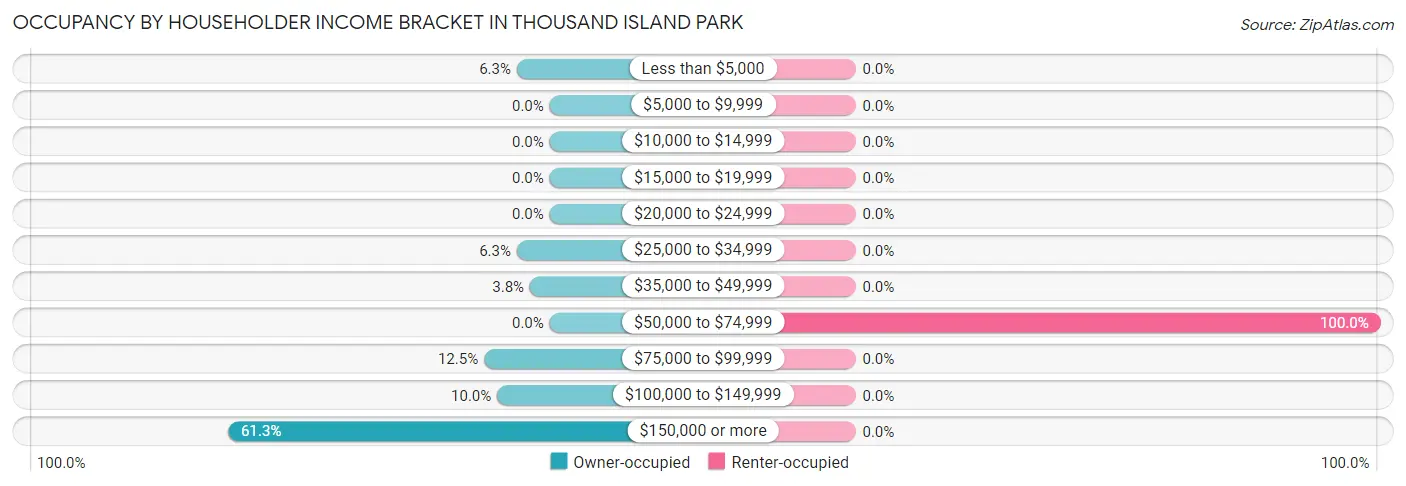
| Income Bracket | Owner-occupied | Renter-occupied |
| Less than $5,000 | 5 (6.2%) | 0 (0.0%) |
| $5,000 to $9,999 | 0 (0.0%) | 0 (0.0%) |
| $10,000 to $14,999 | 0 (0.0%) | 0 (0.0%) |
| $15,000 to $19,999 | 0 (0.0%) | 0 (0.0%) |
| $20,000 to $24,999 | 0 (0.0%) | 0 (0.0%) |
| $25,000 to $34,999 | 5 (6.2%) | 0 (0.0%) |
| $35,000 to $49,999 | 3 (3.7%) | 0 (0.0%) |
| $50,000 to $74,999 | 0 (0.0%) | 5 (100.0%) |
| $75,000 to $99,999 | 10 (12.5%) | 0 (0.0%) |
| $100,000 to $149,999 | 8 (10.0%) | 0 (0.0%) |
| $150,000 or more | 49 (61.3%) | 0 (0.0%) |
| Total | 80 (100.0%) | 5 (100.0%) |
Monthly Housing Cost Tiers in Thousand Island Park
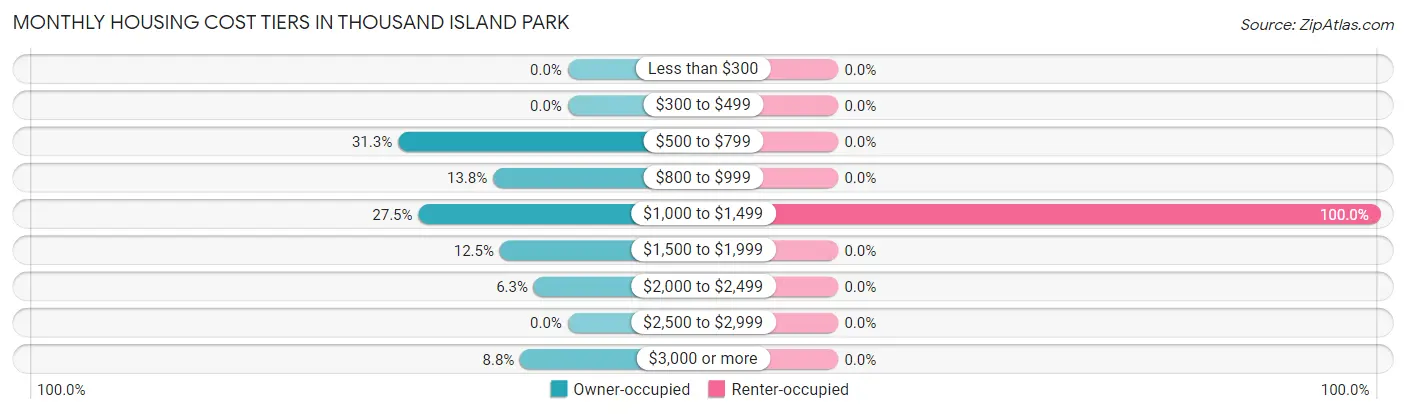
| Monthly Cost | Owner-occupied | Renter-occupied |
| Less than $300 | 0 (0.0%) | 0 (0.0%) |
| $300 to $499 | 0 (0.0%) | 0 (0.0%) |
| $500 to $799 | 25 (31.2%) | 0 (0.0%) |
| $800 to $999 | 11 (13.8%) | 0 (0.0%) |
| $1,000 to $1,499 | 22 (27.5%) | 5 (100.0%) |
| $1,500 to $1,999 | 10 (12.5%) | 0 (0.0%) |
| $2,000 to $2,499 | 5 (6.2%) | 0 (0.0%) |
| $2,500 to $2,999 | 0 (0.0%) | 0 (0.0%) |
| $3,000 or more | 7 (8.7%) | 0 (0.0%) |
| Total | 80 (100.0%) | 5 (100.0%) |
Physical Housing Characteristics in Thousand Island Park
Housing Structures in Thousand Island Park
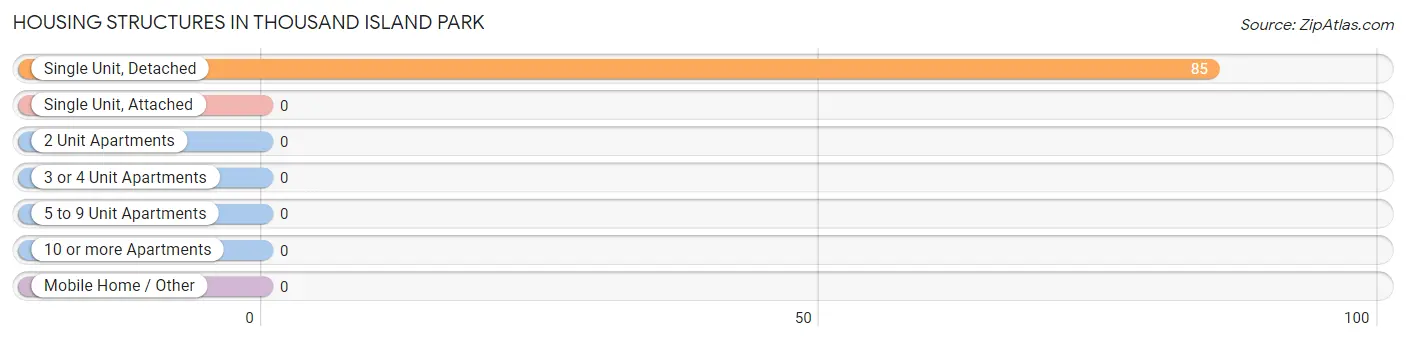
| Structure Type | # Housing Units | % Housing Units |
| Single Unit, Detached | 85 | 100.0% |
| Single Unit, Attached | 0 | 0.0% |
| 2 Unit Apartments | 0 | 0.0% |
| 3 or 4 Unit Apartments | 0 | 0.0% |
| 5 to 9 Unit Apartments | 0 | 0.0% |
| 10 or more Apartments | 0 | 0.0% |
| Mobile Home / Other | 0 | 0.0% |
| Total | 85 | 100.0% |
Housing Structures by Occupancy in Thousand Island Park
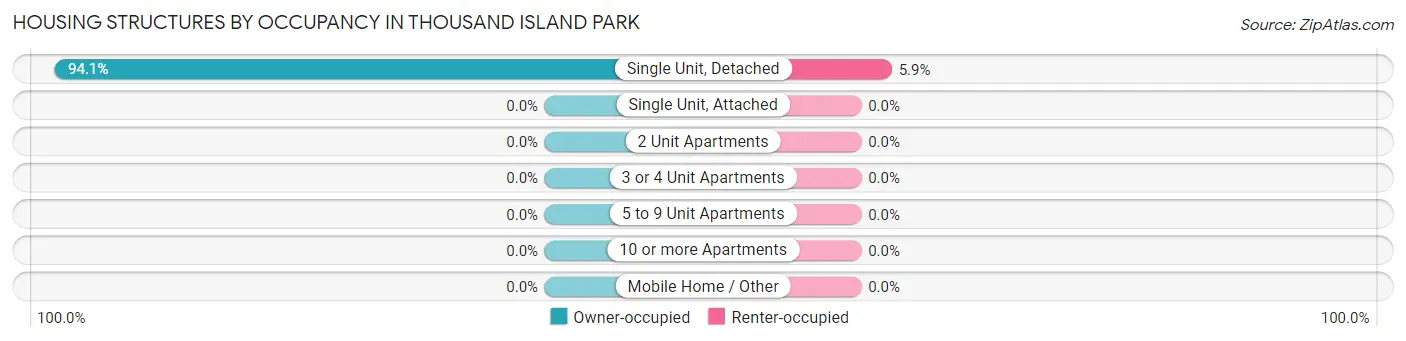
| Structure Type | Owner-occupied | Renter-occupied |
| Single Unit, Detached | 80 (94.1%) | 5 (5.9%) |
| Single Unit, Attached | 0 (0.0%) | 0 (0.0%) |
| 2 Unit Apartments | 0 (0.0%) | 0 (0.0%) |
| 3 or 4 Unit Apartments | 0 (0.0%) | 0 (0.0%) |
| 5 to 9 Unit Apartments | 0 (0.0%) | 0 (0.0%) |
| 10 or more Apartments | 0 (0.0%) | 0 (0.0%) |
| Mobile Home / Other | 0 (0.0%) | 0 (0.0%) |
| Total | 80 (94.1%) | 5 (5.9%) |
Housing Structures by Number of Rooms in Thousand Island Park
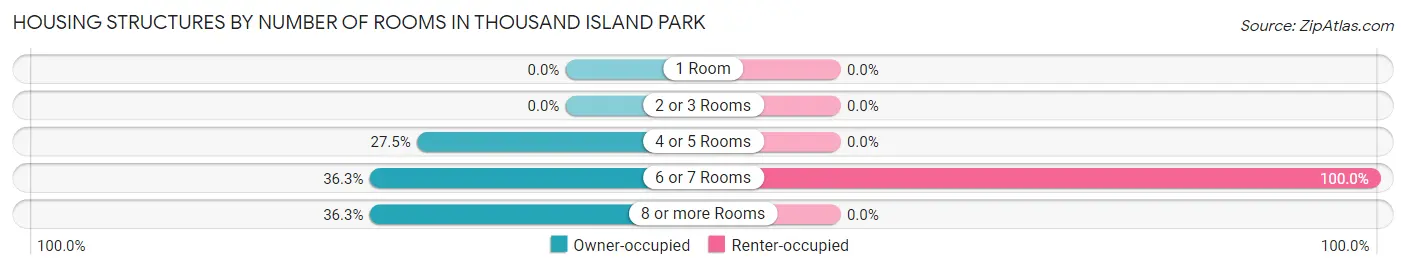
| Number of Rooms | Owner-occupied | Renter-occupied |
| 1 Room | 0 (0.0%) | 0 (0.0%) |
| 2 or 3 Rooms | 0 (0.0%) | 0 (0.0%) |
| 4 or 5 Rooms | 22 (27.5%) | 0 (0.0%) |
| 6 or 7 Rooms | 29 (36.2%) | 5 (100.0%) |
| 8 or more Rooms | 29 (36.2%) | 0 (0.0%) |
| Total | 80 (100.0%) | 5 (100.0%) |
Housing Structure by Heating Type in Thousand Island Park
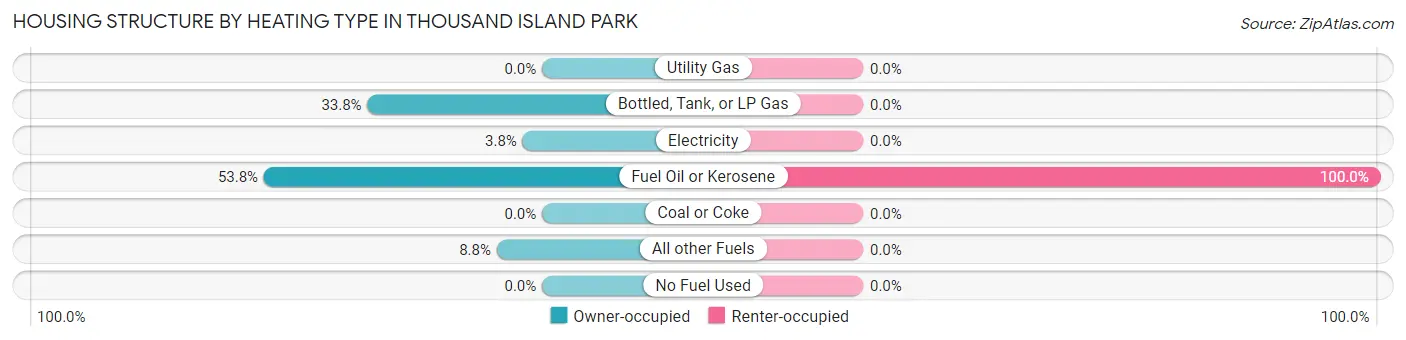
| Heating Type | Owner-occupied | Renter-occupied |
| Utility Gas | 0 (0.0%) | 0 (0.0%) |
| Bottled, Tank, or LP Gas | 27 (33.8%) | 0 (0.0%) |
| Electricity | 3 (3.7%) | 0 (0.0%) |
| Fuel Oil or Kerosene | 43 (53.7%) | 5 (100.0%) |
| Coal or Coke | 0 (0.0%) | 0 (0.0%) |
| All other Fuels | 7 (8.7%) | 0 (0.0%) |
| No Fuel Used | 0 (0.0%) | 0 (0.0%) |
| Total | 80 (100.0%) | 5 (100.0%) |
Household Vehicle Usage in Thousand Island Park
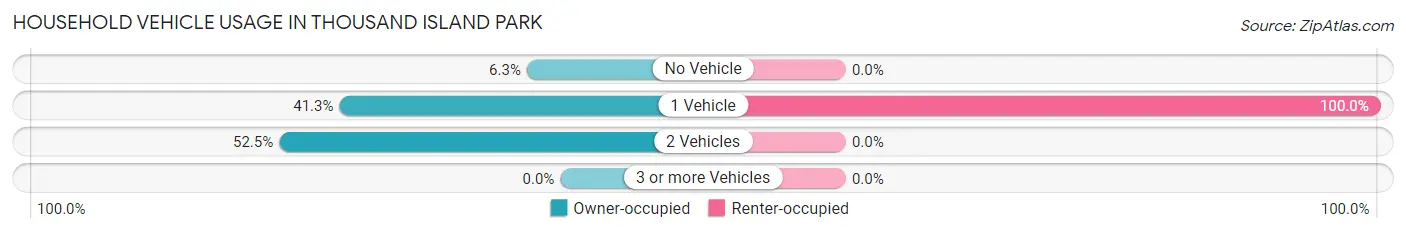
| Vehicles per Household | Owner-occupied | Renter-occupied |
| No Vehicle | 5 (6.2%) | 0 (0.0%) |
| 1 Vehicle | 33 (41.2%) | 5 (100.0%) |
| 2 Vehicles | 42 (52.5%) | 0 (0.0%) |
| 3 or more Vehicles | 0 (0.0%) | 0 (0.0%) |
| Total | 80 (100.0%) | 5 (100.0%) |
Real Estate & Mortgages in Thousand Island Park
Real Estate and Mortgage Overview in Thousand Island Park
| Characteristic | Without Mortgage | With Mortgage |
| Housing Units | 73 | 7 |
| Median Property Value | $283,600 | $0 |
| Median Household Income | $153,558 | $7 |
| Monthly Housing Costs | $1,302 | $7 |
| Real Estate Taxes | $8,173 | $0 |
Property Value by Mortgage Status in Thousand Island Park
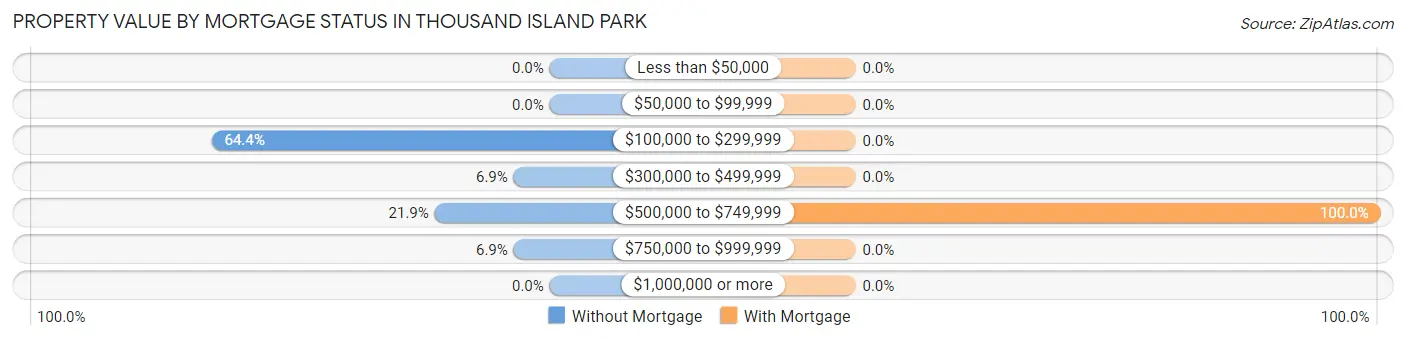
| Property Value | Without Mortgage | With Mortgage |
| Less than $50,000 | 0 (0.0%) | 0 (0.0%) |
| $50,000 to $99,999 | 0 (0.0%) | 0 (0.0%) |
| $100,000 to $299,999 | 47 (64.4%) | 0 (0.0%) |
| $300,000 to $499,999 | 5 (6.9%) | 0 (0.0%) |
| $500,000 to $749,999 | 16 (21.9%) | 7 (100.0%) |
| $750,000 to $999,999 | 5 (6.9%) | 0 (0.0%) |
| $1,000,000 or more | 0 (0.0%) | 0 (0.0%) |
| Total | 73 (100.0%) | 7 (100.0%) |
Household Income by Mortgage Status in Thousand Island Park
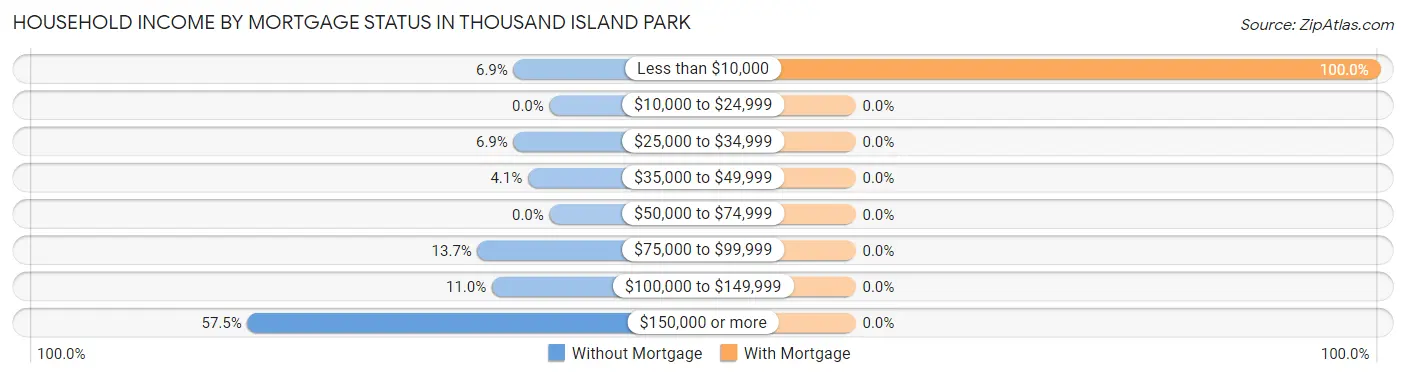
| Household Income | Without Mortgage | With Mortgage |
| Less than $10,000 | 5 (6.9%) | 7 (100.0%) |
| $10,000 to $24,999 | 0 (0.0%) | 0 (0.0%) |
| $25,000 to $34,999 | 5 (6.9%) | 0 (0.0%) |
| $35,000 to $49,999 | 3 (4.1%) | 0 (0.0%) |
| $50,000 to $74,999 | 0 (0.0%) | 0 (0.0%) |
| $75,000 to $99,999 | 10 (13.7%) | 0 (0.0%) |
| $100,000 to $149,999 | 8 (11.0%) | 0 (0.0%) |
| $150,000 or more | 42 (57.5%) | 0 (0.0%) |
| Total | 73 (100.0%) | 7 (100.0%) |
Property Value to Household Income Ratio in Thousand Island Park
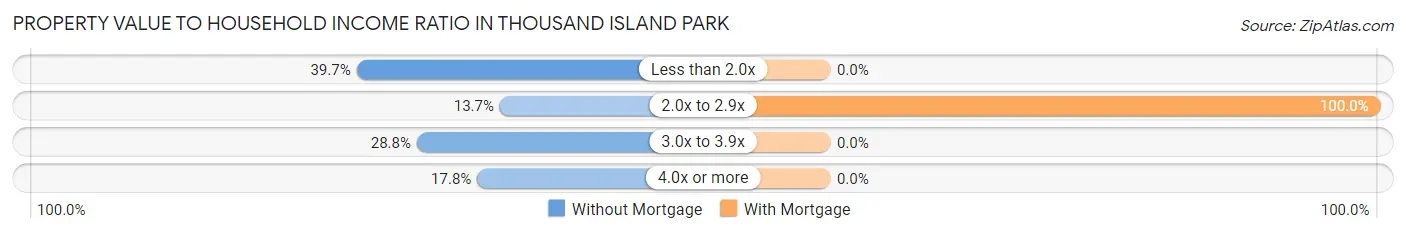
| Value-to-Income Ratio | Without Mortgage | With Mortgage |
| Less than 2.0x | 29 (39.7%) | 0 (0.0%) |
| 2.0x to 2.9x | 10 (13.7%) | 7 (100.0%) |
| 3.0x to 3.9x | 21 (28.8%) | 0 (0.0%) |
| 4.0x or more | 13 (17.8%) | 0 (0.0%) |
| Total | 73 (100.0%) | 7 (100.0%) |
Real Estate Taxes by Mortgage Status in Thousand Island Park
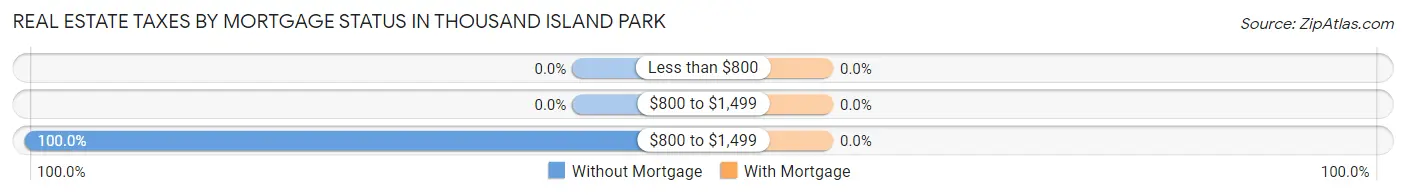
| Property Taxes | Without Mortgage | With Mortgage |
| Less than $800 | 0 (0.0%) | 0 (0.0%) |
| $800 to $1,499 | 0 (0.0%) | 0 (0.0%) |
| $800 to $1,499 | 73 (100.0%) | 0 (0.0%) |
| Total | 73 (100.0%) | 7 (100.0%) |
Health & Disability in Thousand Island Park
Health Insurance Coverage by Age in Thousand Island Park
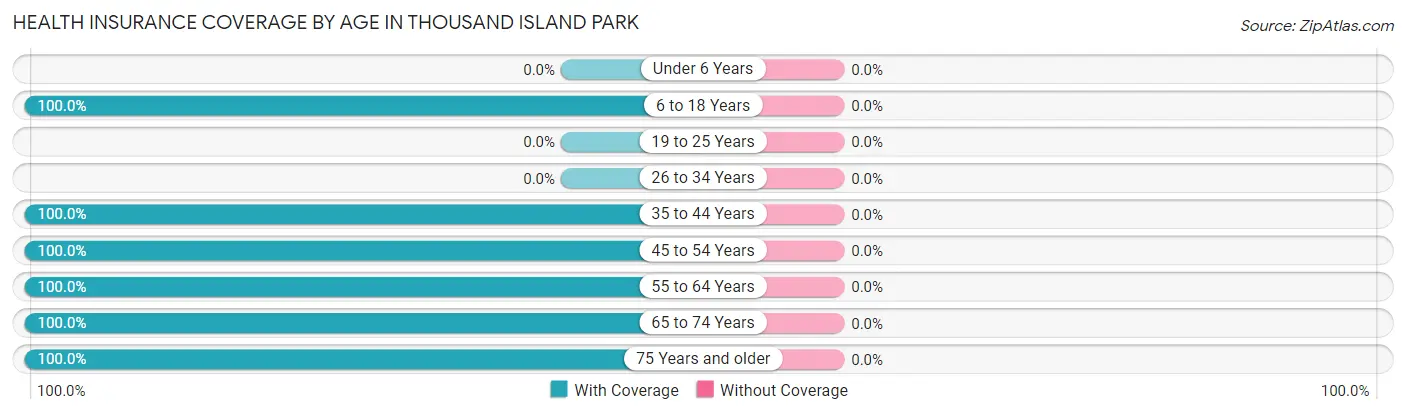
| Age Bracket | With Coverage | Without Coverage |
| Under 6 Years | 0 (0.0%) | 0 (0.0%) |
| 6 to 18 Years | 20 (100.0%) | 0 (0.0%) |
| 19 to 25 Years | 0 (0.0%) | 0 (0.0%) |
| 26 to 34 Years | 0 (0.0%) | 0 (0.0%) |
| 35 to 44 Years | 48 (100.0%) | 0 (0.0%) |
| 45 to 54 Years | 36 (100.0%) | 0 (0.0%) |
| 55 to 64 Years | 19 (100.0%) | 0 (0.0%) |
| 65 to 74 Years | 32 (100.0%) | 0 (0.0%) |
| 75 Years and older | 61 (100.0%) | 0 (0.0%) |
| Total | 216 (100.0%) | 0 (0.0%) |
Health Insurance Coverage by Citizenship Status in Thousand Island Park
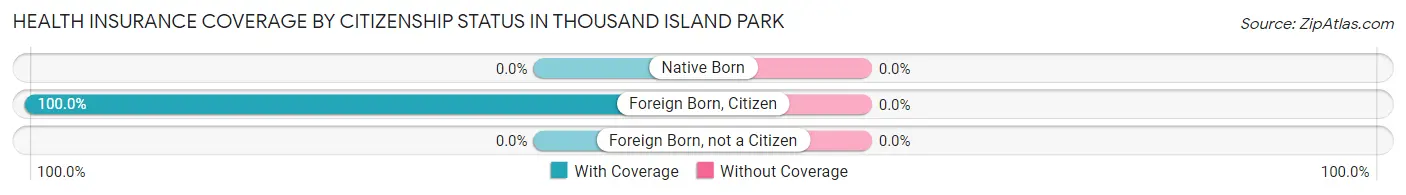
| Citizenship Status | With Coverage | Without Coverage |
| Native Born | 0 (0.0%) | 0 (0.0%) |
| Foreign Born, Citizen | 20 (100.0%) | 0 (0.0%) |
| Foreign Born, not a Citizen | 0 (0.0%) | 0 (0.0%) |
Health Insurance Coverage by Household Income in Thousand Island Park
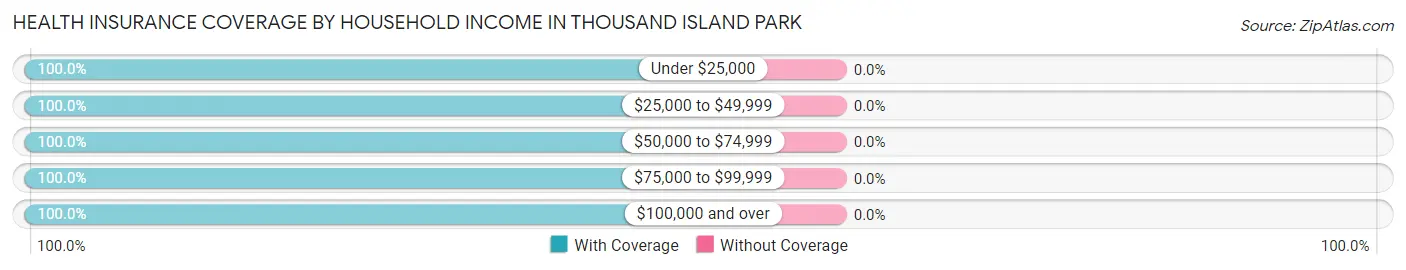
| Household Income | With Coverage | Without Coverage |
| Under $25,000 | 5 (100.0%) | 0 (0.0%) |
| $25,000 to $49,999 | 12 (100.0%) | 0 (0.0%) |
| $50,000 to $74,999 | 5 (100.0%) | 0 (0.0%) |
| $75,000 to $99,999 | 42 (100.0%) | 0 (0.0%) |
| $100,000 and over | 152 (100.0%) | 0 (0.0%) |
Public vs Private Health Insurance Coverage by Age in Thousand Island Park
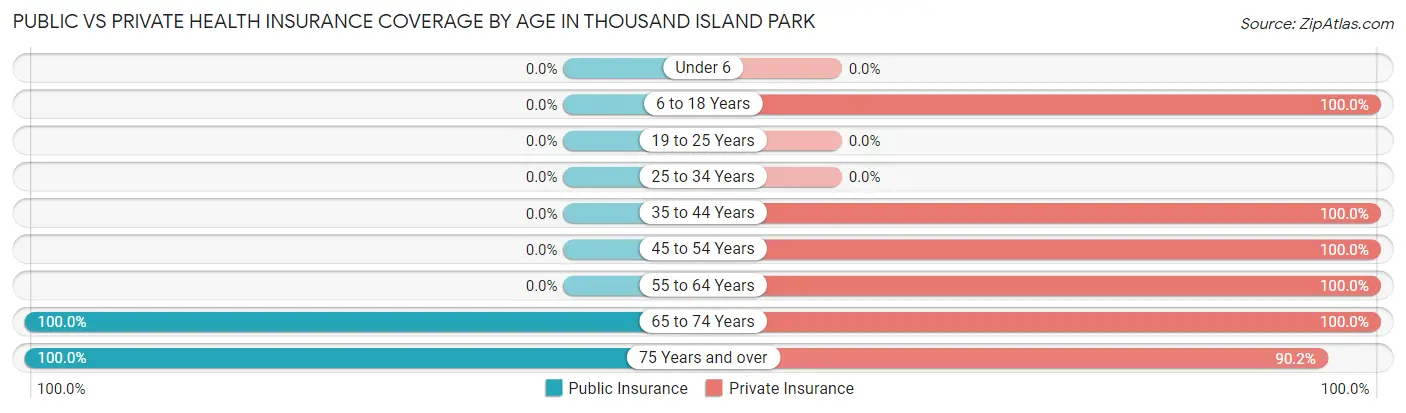
| Age Bracket | Public Insurance | Private Insurance |
| Under 6 | 0 (0.0%) | 0 (0.0%) |
| 6 to 18 Years | 0 (0.0%) | 20 (100.0%) |
| 19 to 25 Years | 0 (0.0%) | 0 (0.0%) |
| 25 to 34 Years | 0 (0.0%) | 0 (0.0%) |
| 35 to 44 Years | 0 (0.0%) | 48 (100.0%) |
| 45 to 54 Years | 0 (0.0%) | 36 (100.0%) |
| 55 to 64 Years | 0 (0.0%) | 19 (100.0%) |
| 65 to 74 Years | 32 (100.0%) | 32 (100.0%) |
| 75 Years and over | 61 (100.0%) | 55 (90.2%) |
| Total | 93 (43.1%) | 210 (97.2%) |
Disability Status by Sex by Age in Thousand Island Park
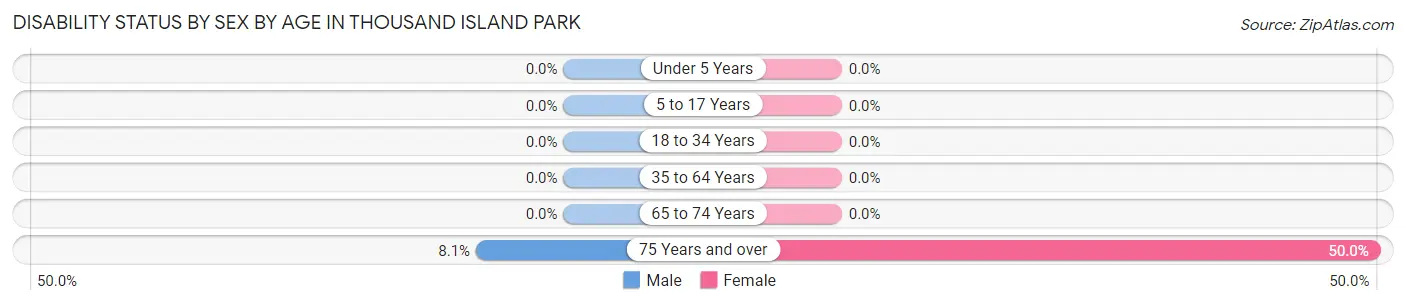
| Age Bracket | Male | Female |
| Under 5 Years | 0 (0.0%) | 0 (0.0%) |
| 5 to 17 Years | 0 (0.0%) | 0 (0.0%) |
| 18 to 34 Years | 0 (0.0%) | 0 (0.0%) |
| 35 to 64 Years | 0 (0.0%) | 0 (0.0%) |
| 65 to 74 Years | 0 (0.0%) | 0 (0.0%) |
| 75 Years and over | 3 (8.1%) | 12 (50.0%) |
Disability Class by Sex by Age in Thousand Island Park
Disability Class: Hearing Difficulty
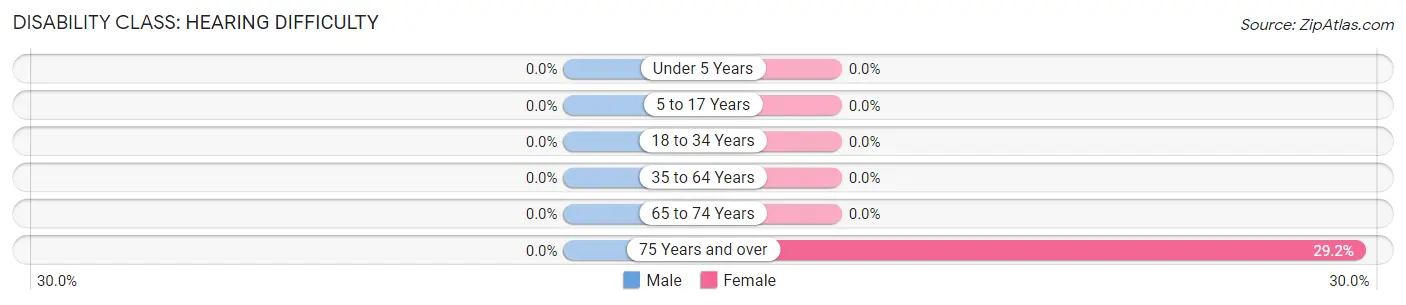
| Age Bracket | Male | Female |
| Under 5 Years | 0 (0.0%) | 0 (0.0%) |
| 5 to 17 Years | 0 (0.0%) | 0 (0.0%) |
| 18 to 34 Years | 0 (0.0%) | 0 (0.0%) |
| 35 to 64 Years | 0 (0.0%) | 0 (0.0%) |
| 65 to 74 Years | 0 (0.0%) | 0 (0.0%) |
| 75 Years and over | 0 (0.0%) | 7 (29.2%) |
Disability Class: Vision Difficulty
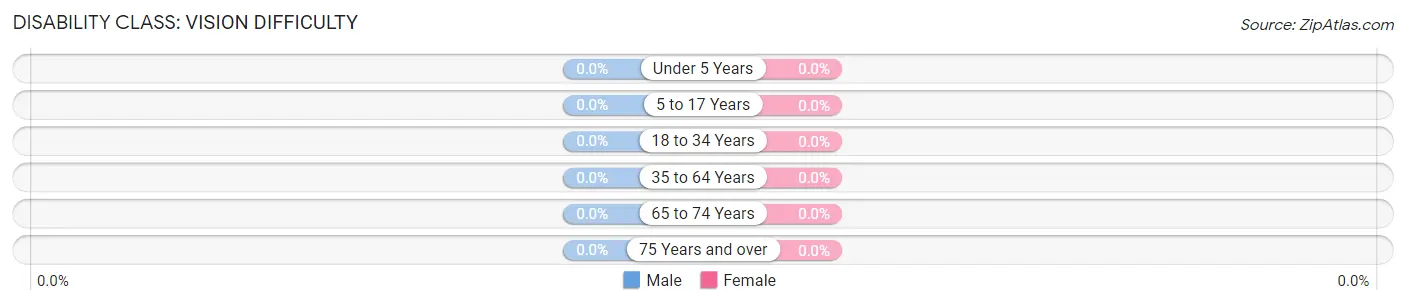
| Age Bracket | Male | Female |
| Under 5 Years | 0 (0.0%) | 0 (0.0%) |
| 5 to 17 Years | 0 (0.0%) | 0 (0.0%) |
| 18 to 34 Years | 0 (0.0%) | 0 (0.0%) |
| 35 to 64 Years | 0 (0.0%) | 0 (0.0%) |
| 65 to 74 Years | 0 (0.0%) | 0 (0.0%) |
| 75 Years and over | 0 (0.0%) | 0 (0.0%) |
Disability Class: Cognitive Difficulty
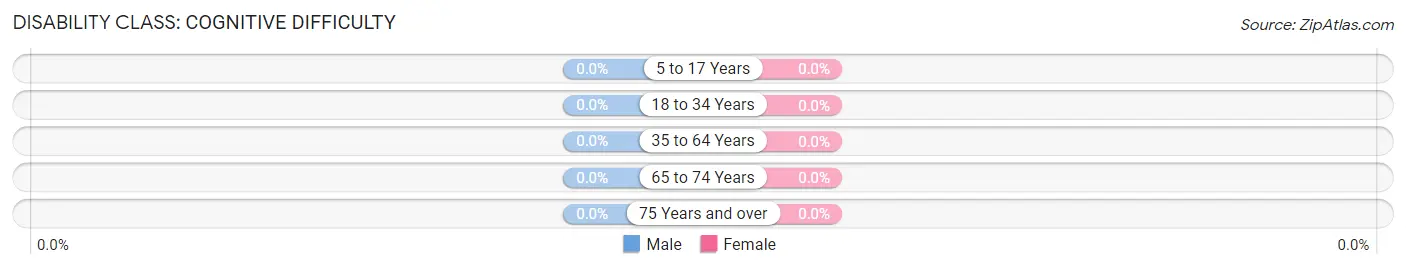
| Age Bracket | Male | Female |
| 5 to 17 Years | 0 (0.0%) | 0 (0.0%) |
| 18 to 34 Years | 0 (0.0%) | 0 (0.0%) |
| 35 to 64 Years | 0 (0.0%) | 0 (0.0%) |
| 65 to 74 Years | 0 (0.0%) | 0 (0.0%) |
| 75 Years and over | 0 (0.0%) | 0 (0.0%) |
Disability Class: Ambulatory Difficulty
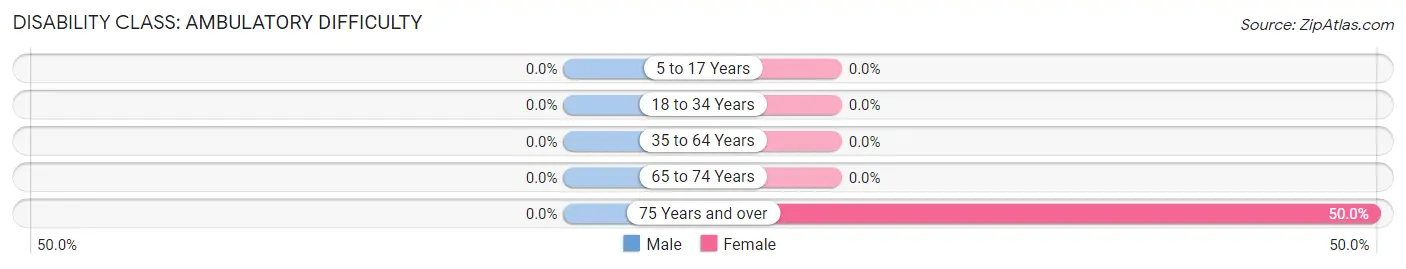
| Age Bracket | Male | Female |
| 5 to 17 Years | 0 (0.0%) | 0 (0.0%) |
| 18 to 34 Years | 0 (0.0%) | 0 (0.0%) |
| 35 to 64 Years | 0 (0.0%) | 0 (0.0%) |
| 65 to 74 Years | 0 (0.0%) | 0 (0.0%) |
| 75 Years and over | 0 (0.0%) | 12 (50.0%) |
Disability Class: Self-Care Difficulty
| Age Bracket | Male | Female |
| 5 to 17 Years | 0 (0.0%) | 0 (0.0%) |
| 18 to 34 Years | 0 (0.0%) | 0 (0.0%) |
| 35 to 64 Years | 0 (0.0%) | 0 (0.0%) |
| 65 to 74 Years | 0 (0.0%) | 0 (0.0%) |
| 75 Years and over | 0 (0.0%) | 0 (0.0%) |
Technology Access in Thousand Island Park
Computing Device Access in Thousand Island Park
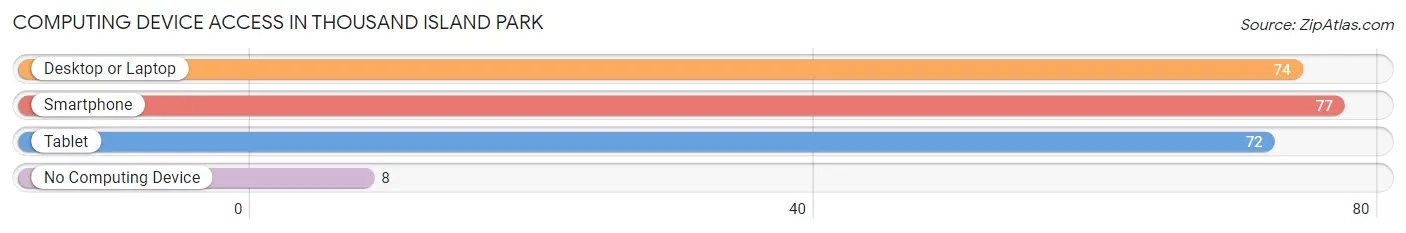
| Device Type | # Households | % Households |
| Desktop or Laptop | 74 | 87.1% |
| Smartphone | 77 | 90.6% |
| Tablet | 72 | 84.7% |
| No Computing Device | 8 | 9.4% |
| Total | 85 | 100.0% |
Internet Access in Thousand Island Park
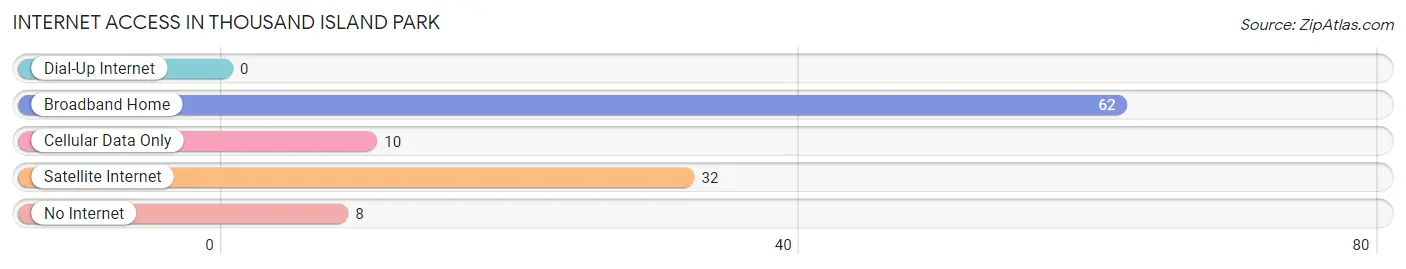
| Internet Type | # Households | % Households |
| Dial-Up Internet | 0 | 0.0% |
| Broadband Home | 62 | 72.9% |
| Cellular Data Only | 10 | 11.8% |
| Satellite Internet | 32 | 37.7% |
| No Internet | 8 | 9.4% |
| Total | 85 | 100.0% |
Thousand Island Park Summary
Thousand Island Park is a small village located on Wellesley Island in the Thousand Islands region of northern New York. It is situated on the St. Lawrence River, just south of the Canadian border. The village is part of the Town of Orleans in Jefferson County.
History
The area that is now Thousand Island Park was originally inhabited by the Iroquois Nation. The first European settlers arrived in the area in the late 1700s. The area was known as “The Thousand Islands” due to the large number of islands in the St. Lawrence River.
In the mid-1800s, the area began to attract wealthy vacationers from the United States and Canada. The Thousand Islands region was seen as a desirable destination for those looking to escape the hustle and bustle of city life.
In 1875, the Thousand Island Park Association was formed to develop the area into a resort community. The association purchased land on Wellesley Island and began to construct a series of cottages and other buildings. The association also built a hotel, a casino, and a boardwalk.
By the early 1900s, Thousand Island Park had become a popular summer destination for wealthy vacationers. The village was known for its grand Victorian-style homes and its picturesque views of the St. Lawrence River.
Geography
Thousand Island Park is located on Wellesley Island, which is part of the Thousand Islands region of northern New York. The village is situated on the St. Lawrence River, just south of the Canadian border.
The village is surrounded by the St. Lawrence River to the north, east, and west. To the south, the village is bordered by the Town of Orleans.
The village has a total area of 0.6 square miles, all of which is land. The village is located at an elevation of approximately 200 feet above sea level.
Economy
The economy of Thousand Island Park is largely based on tourism. The village is a popular summer destination for vacationers from the United States and Canada.
The village is home to several hotels, restaurants, and other businesses that cater to tourists. The village also has a marina, which provides boat rentals and other services.
Demographics
As of the 2010 census, the population of Thousand Island Park was 545. The population density was 890.7 people per square mile.
The racial makeup of the village was 97.3% White, 0.7% African American, 0.2% Native American, 0.2% Asian, 0.2% from other races, and 1.6% from two or more races. Hispanic or Latino of any race were 0.7% of the population.
The median household income in the village was $50,000. The per capita income was $25,000. About 8.3% of the population was below the poverty line.
Common Questions
What is Per Capita Income in Thousand Island Park?
Per Capita income in Thousand Island Park is $108,492.
What is the Median Family Income in Thousand Island Park?
Median Family Income in Thousand Island Park is $215,357.
What is the Median Household income in Thousand Island Park?
Median Household Income in Thousand Island Park is $153,750.
What is Income or Wage Gap in Thousand Island Park?
Income or Wage Gap in Thousand Island Park is 20.3%.
Women in Thousand Island Park earn 79.7 cents for every dollar earned by a man.
What is Inequality or Gini Index in Thousand Island Park?
Inequality or Gini Index in Thousand Island Park is 0.46.
What is the Total Population of Thousand Island Park?
Total Population of Thousand Island Park is 216.
What is the Total Male Population of Thousand Island Park?
Total Male Population of Thousand Island Park is 108.
What is the Total Female Population of Thousand Island Park?
Total Female Population of Thousand Island Park is 108.
What is the Ratio of Males per 100 Females in Thousand Island Park?
There are 100.00 Males per 100 Females in Thousand Island Park.
What is the Ratio of Females per 100 Males in Thousand Island Park?
There are 100.00 Females per 100 Males in Thousand Island Park.
What is the Median Population Age in Thousand Island Park?
Median Population Age in Thousand Island Park is 60.3 Years.
What is the Average Family Size in Thousand Island Park
Average Family Size in Thousand Island Park is 2.9 People.
What is the Average Household Size in Thousand Island Park
Average Household Size in Thousand Island Park is 2.5 People.
How Large is the Labor Force in Thousand Island Park?
There are 113 People in the Labor Forcein in Thousand Island Park.
What is the Percentage of People in the Labor Force in Thousand Island Park?
57.7% of People are in the Labor Force in Thousand Island Park.
What is the Unemployment Rate in Thousand Island Park?
Unemployment Rate in Thousand Island Park is 10.6%.