Harbor Isle, NY Map & Demographics
Harbor Isle Map
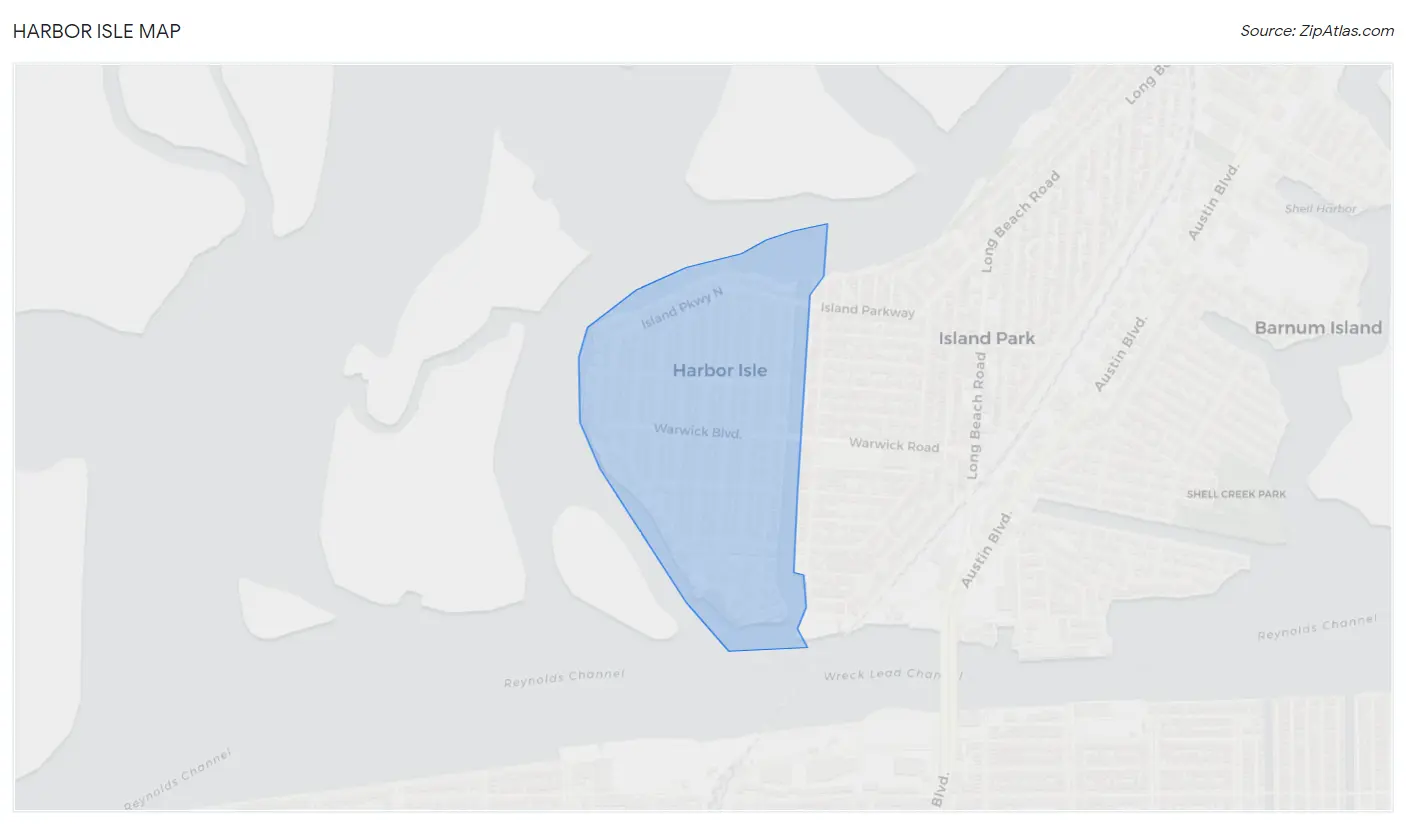
Harbor Isle Overview
$58,076
PER CAPITA INCOME
$197,300
AVG FAMILY INCOME
$170,694
AVG HOUSEHOLD INCOME
19.3%
WAGE / INCOME GAP [ % ]
80.7¢/ $1
WAGE / INCOME GAP [ $ ]
0.36
INEQUALITY / GINI INDEX
1,360
TOTAL POPULATION
747
MALE POPULATION
613
FEMALE POPULATION
121.86
MALES / 100 FEMALES
82.06
FEMALES / 100 MALES
45.3
MEDIAN AGE
3.6
AVG FAMILY SIZE
3.4
AVG HOUSEHOLD SIZE
736
LABOR FORCE [ PEOPLE ]
66.4%
PERCENT IN LABOR FORCE
3.4%
UNEMPLOYMENT RATE
Income in Harbor Isle
Income Overview in Harbor Isle
Per Capita Income in Harbor Isle is $58,076, while median incomes of families and households are $197,300 and $170,694 respectively.
| Characteristic | Number | Measure |
| Per Capita Income | 1,360 | $58,076 |
| Median Family Income | 346 | $197,300 |
| Mean Family Income | 346 | $210,642 |
| Median Household Income | 405 | $170,694 |
| Mean Household Income | 405 | $187,859 |
| Income Deficit | 346 | $0 |
| Wage / Income Gap (%) | 1,360 | 19.34% |
| Wage / Income Gap ($) | 1,360 | 80.66¢ per $1 |
| Gini / Inequality Index | 1,360 | 0.36 |
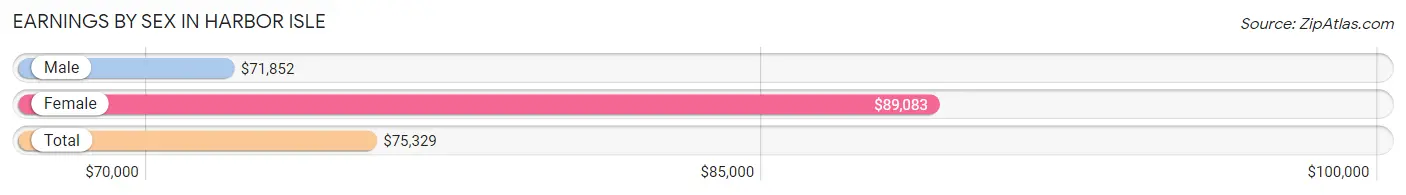
Earnings by Sex in Harbor Isle
Average Earnings in Harbor Isle are $75,329, $71,852 for men and $89,083 for women, a difference of 19.3%.
| Sex | Number | Average Earnings |
| Male | 430 (57.4%) | $71,852 |
| Female | 319 (42.6%) | $89,083 |
| Total | 749 (100.0%) | $75,329 |
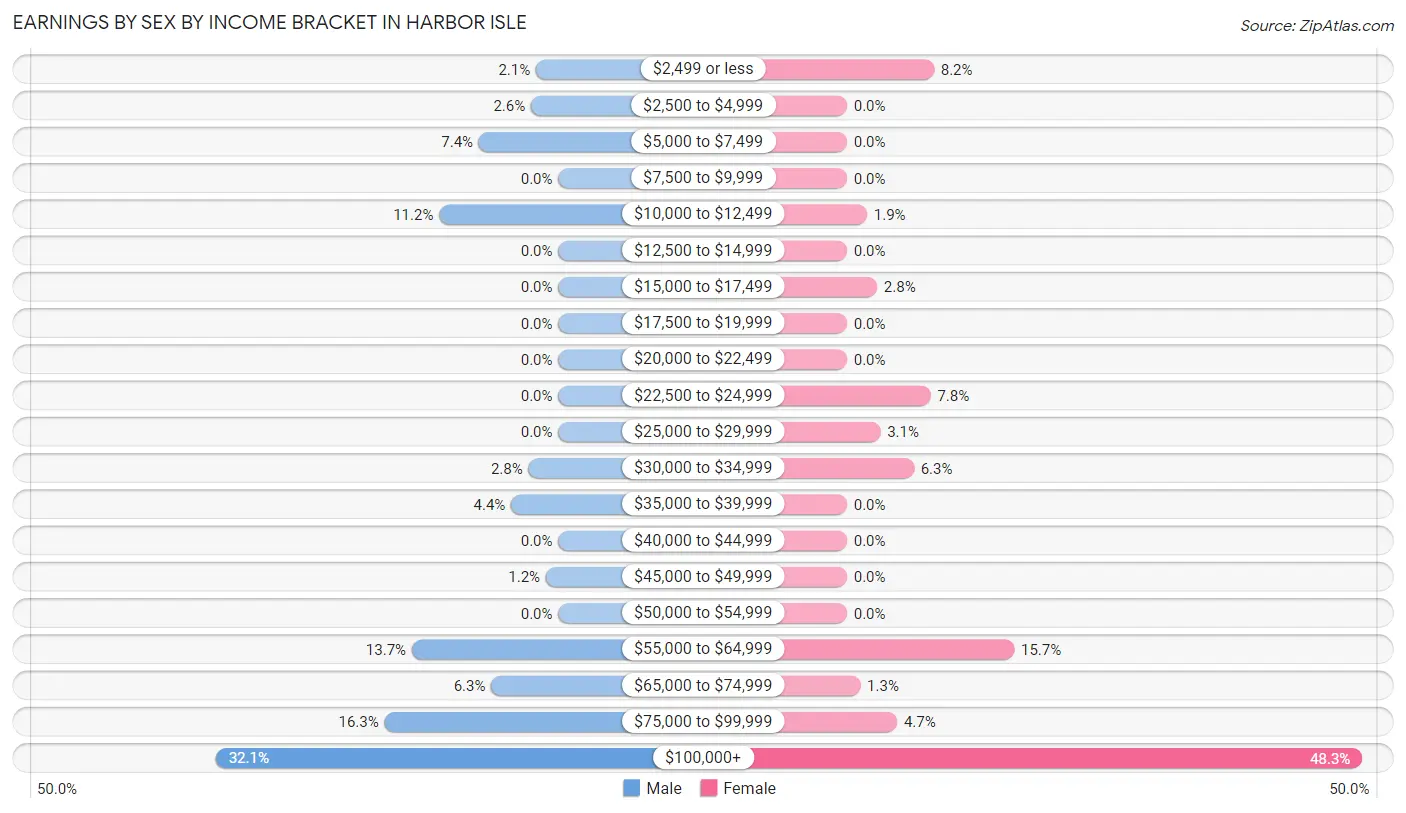
Earnings by Sex by Income Bracket in Harbor Isle
The most common earnings brackets in Harbor Isle are $100,000+ for men (138 | 32.1%) and $100,000+ for women (154 | 48.3%).
| Income | Male | Female |
| $2,499 or less | 9 (2.1%) | 26 (8.2%) |
| $2,500 to $4,999 | 11 (2.6%) | 0 (0.0%) |
| $5,000 to $7,499 | 32 (7.4%) | 0 (0.0%) |
| $7,500 to $9,999 | 0 (0.0%) | 0 (0.0%) |
| $10,000 to $12,499 | 48 (11.2%) | 6 (1.9%) |
| $12,500 to $14,999 | 0 (0.0%) | 0 (0.0%) |
| $15,000 to $17,499 | 0 (0.0%) | 9 (2.8%) |
| $17,500 to $19,999 | 0 (0.0%) | 0 (0.0%) |
| $20,000 to $22,499 | 0 (0.0%) | 0 (0.0%) |
| $22,500 to $24,999 | 0 (0.0%) | 25 (7.8%) |
| $25,000 to $29,999 | 0 (0.0%) | 10 (3.1%) |
| $30,000 to $34,999 | 12 (2.8%) | 20 (6.3%) |
| $35,000 to $39,999 | 19 (4.4%) | 0 (0.0%) |
| $40,000 to $44,999 | 0 (0.0%) | 0 (0.0%) |
| $45,000 to $49,999 | 5 (1.2%) | 0 (0.0%) |
| $50,000 to $54,999 | 0 (0.0%) | 0 (0.0%) |
| $55,000 to $64,999 | 59 (13.7%) | 50 (15.7%) |
| $65,000 to $74,999 | 27 (6.3%) | 4 (1.3%) |
| $75,000 to $99,999 | 70 (16.3%) | 15 (4.7%) |
| $100,000+ | 138 (32.1%) | 154 (48.3%) |
| Total | 430 (100.0%) | 319 (100.0%) |
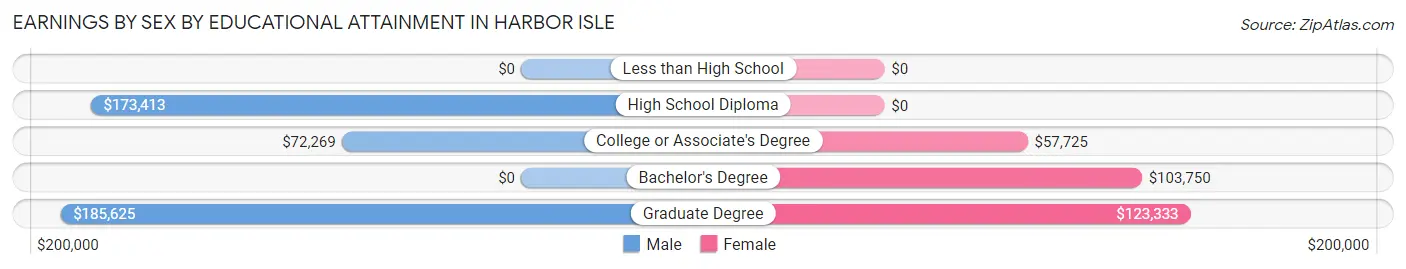
Earnings by Sex by Educational Attainment in Harbor Isle
Average earnings in Harbor Isle are $76,645 for men and $102,861 for women, a difference of 25.5%. Men with an educational attainment of graduate degree enjoy the highest average annual earnings of $185,625, while those with college or associate's degree education earn the least with $72,269. Women with an educational attainment of graduate degree earn the most with the average annual earnings of $123,333, while those with college or associate's degree education have the smallest earnings of $57,725.
| Educational Attainment | Male Income | Female Income |
| Less than High School | - | - |
| High School Diploma | $173,413 | $0 |
| College or Associate's Degree | $72,269 | $57,725 |
| Bachelor's Degree | - | - |
| Graduate Degree | $185,625 | $123,333 |
| Total | $76,645 | $102,861 |
Family Income in Harbor Isle
Family Income Brackets in Harbor Isle
According to the Harbor Isle family income data, there are 171 families falling into the $200,000+ income range, which is the most common income bracket and makes up 49.4% of all families.
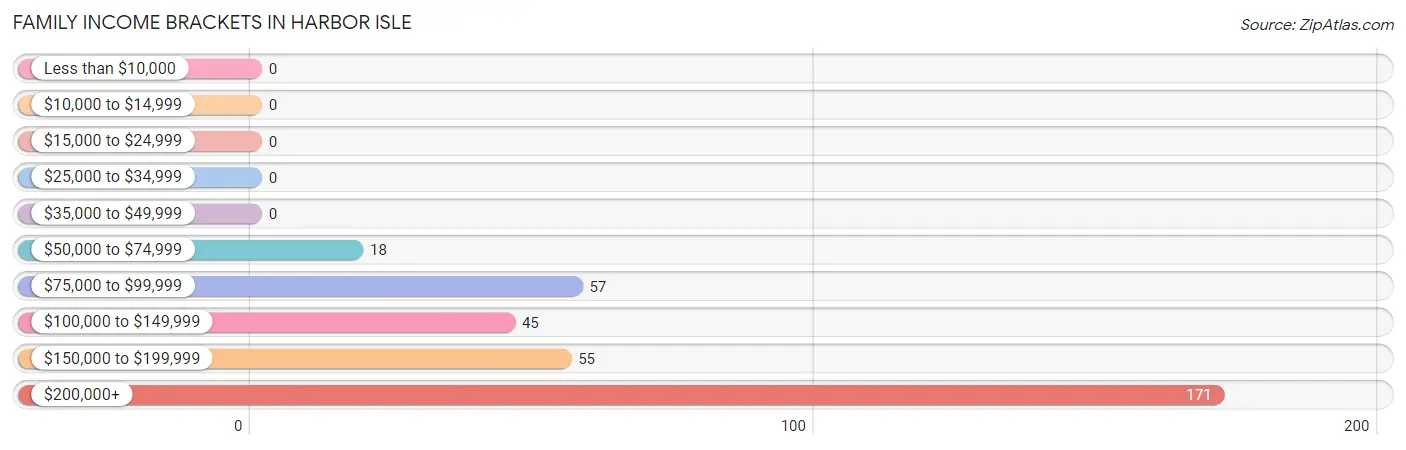
| Income Bracket | # Families | % Families |
| Less than $10,000 | 0 | 0.0% |
| $10,000 to $14,999 | 0 | 0.0% |
| $15,000 to $24,999 | 0 | 0.0% |
| $25,000 to $34,999 | 0 | 0.0% |
| $35,000 to $49,999 | 0 | 0.0% |
| $50,000 to $74,999 | 18 | 5.2% |
| $75,000 to $99,999 | 57 | 16.5% |
| $100,000 to $149,999 | 45 | 13.0% |
| $150,000 to $199,999 | 55 | 15.9% |
| $200,000+ | 171 | 49.4% |
Family Income by Famaliy Size in Harbor Isle
4-person families (155 | 44.8%) account for the highest median family income in Harbor Isle with $250,001 per family, while 3-person families (65 | 18.8%) have the highest median income of $71,925 per family member.
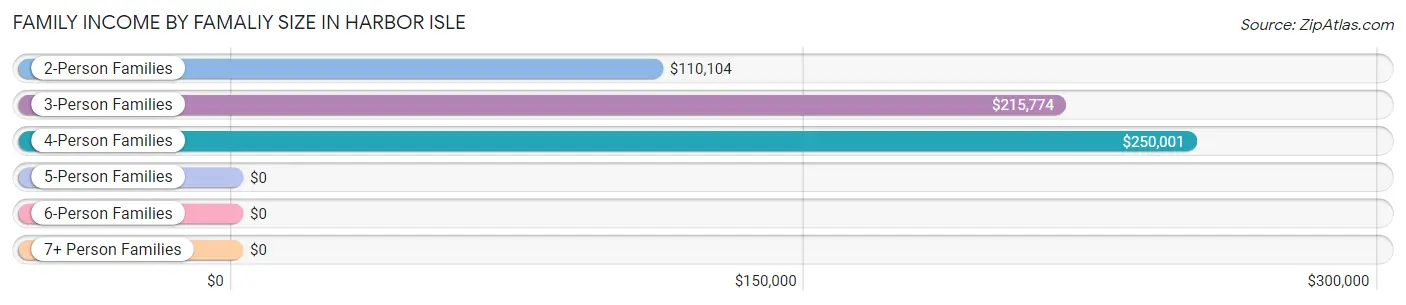
| Income Bracket | # Families | Median Income |
| 2-Person Families | 97 (28.0%) | $110,104 |
| 3-Person Families | 65 (18.8%) | $215,774 |
| 4-Person Families | 155 (44.8%) | $250,001 |
| 5-Person Families | 24 (6.9%) | $0 |
| 6-Person Families | 0 (0.0%) | $0 |
| 7+ Person Families | 5 (1.5%) | $0 |
| Total | 346 (100.0%) | $197,300 |
Family Income by Number of Earners in Harbor Isle
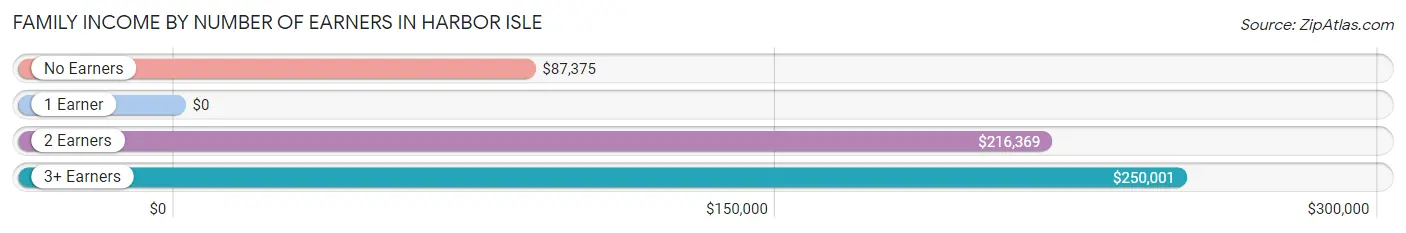
| Number of Earners | # Families | Median Income |
| No Earners | 71 (20.5%) | $87,375 |
| 1 Earner | 79 (22.8%) | $0 |
| 2 Earners | 77 (22.3%) | $216,369 |
| 3+ Earners | 119 (34.4%) | $250,001 |
| Total | 346 (100.0%) | $197,300 |
Household Income in Harbor Isle
Household Income Brackets in Harbor Isle
With 171 households falling in the category, the $200,000+ income range is the most frequent in Harbor Isle, accounting for 42.2% of all households.
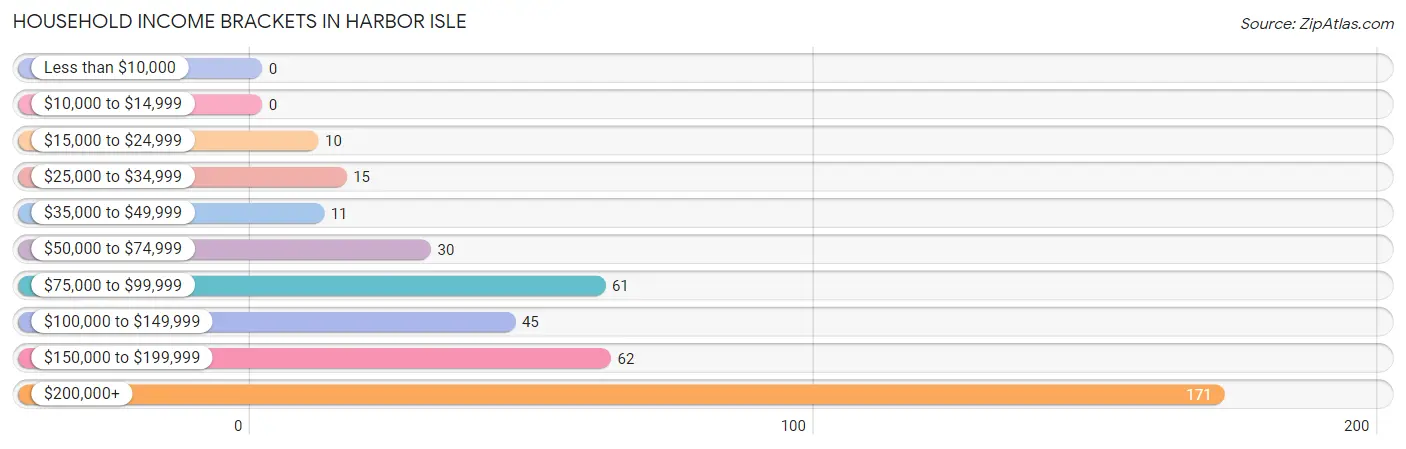
| Income Bracket | # Households | % Households |
| Less than $10,000 | 0 | 0.0% |
| $10,000 to $14,999 | 0 | 0.0% |
| $15,000 to $24,999 | 10 | 2.5% |
| $25,000 to $34,999 | 15 | 3.7% |
| $35,000 to $49,999 | 11 | 2.7% |
| $50,000 to $74,999 | 30 | 7.4% |
| $75,000 to $99,999 | 61 | 15.1% |
| $100,000 to $149,999 | 45 | 11.1% |
| $150,000 to $199,999 | 62 | 15.3% |
| $200,000+ | 171 | 42.2% |
Household Income by Householder Age in Harbor Isle
The median household income in Harbor Isle is $170,694, with the highest median household income of $250,001 found in the 45 to 64 years age bracket for the primary householder. A total of 176 households (43.5%) fall into this category.
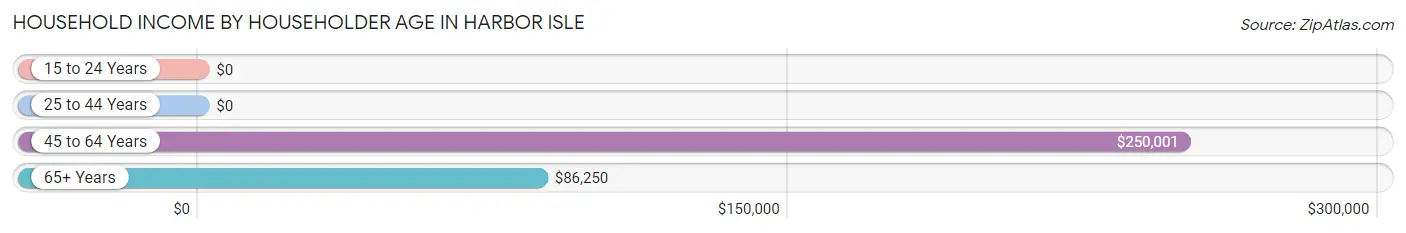
| Income Bracket | # Households | Median Income |
| 15 to 24 Years | 0 (0.0%) | $0 |
| 25 to 44 Years | 57 (14.1%) | $0 |
| 45 to 64 Years | 176 (43.5%) | $250,001 |
| 65+ Years | 172 (42.5%) | $86,250 |
| Total | 405 (100.0%) | $170,694 |
Poverty in Harbor Isle
Income Below Poverty by Sex and Age in Harbor Isle
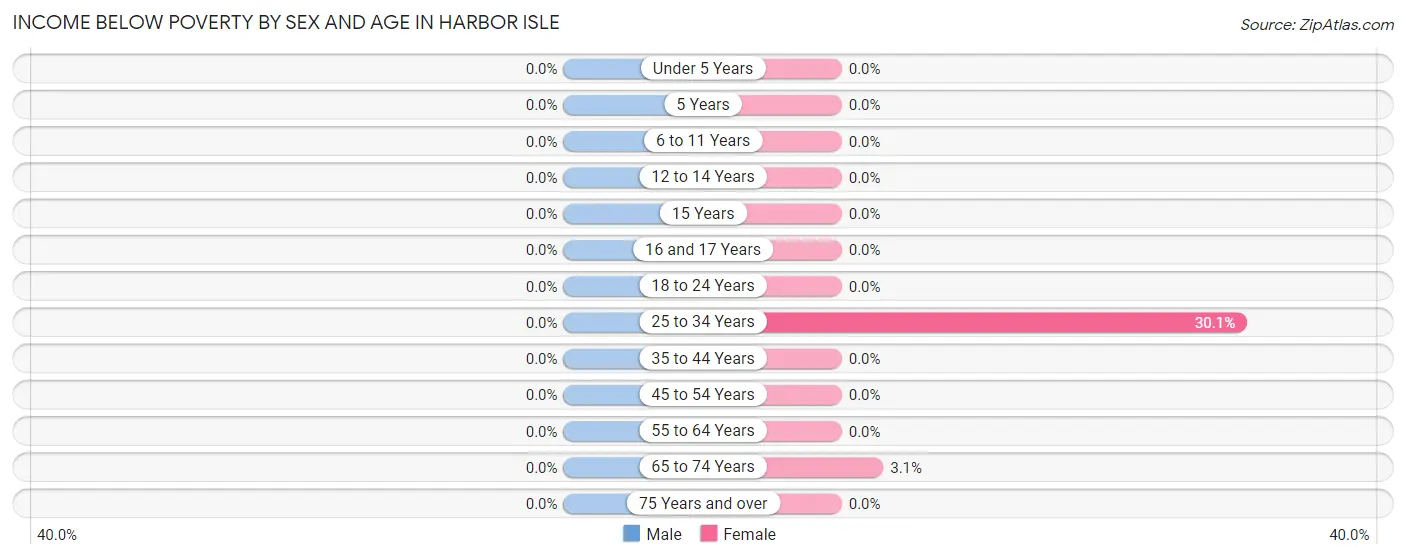
| Age Bracket | Male | Female |
| Under 5 Years | 0 (0.0%) | 0 (0.0%) |
| 5 Years | 0 (0.0%) | 0 (0.0%) |
| 6 to 11 Years | 0 (0.0%) | 0 (0.0%) |
| 12 to 14 Years | 0 (0.0%) | 0 (0.0%) |
| 15 Years | 0 (0.0%) | 0 (0.0%) |
| 16 and 17 Years | 0 (0.0%) | 0 (0.0%) |
| 18 to 24 Years | 0 (0.0%) | 0 (0.0%) |
| 25 to 34 Years | 0 (0.0%) | 37 (30.1%) |
| 35 to 44 Years | 0 (0.0%) | 0 (0.0%) |
| 45 to 54 Years | 0 (0.0%) | 0 (0.0%) |
| 55 to 64 Years | 0 (0.0%) | 0 (0.0%) |
| 65 to 74 Years | 0 (0.0%) | 4 (3.1%) |
| 75 Years and over | 0 (0.0%) | 0 (0.0%) |
| Total | 0 (0.0%) | 41 (6.7%) |
Income Above Poverty by Sex and Age in Harbor Isle
According to the poverty statistics in Harbor Isle, males aged 5 years and females aged under 5 years are the age groups that are most secure financially, with 100.0% of males and 100.0% of females in these age groups living above the poverty line.
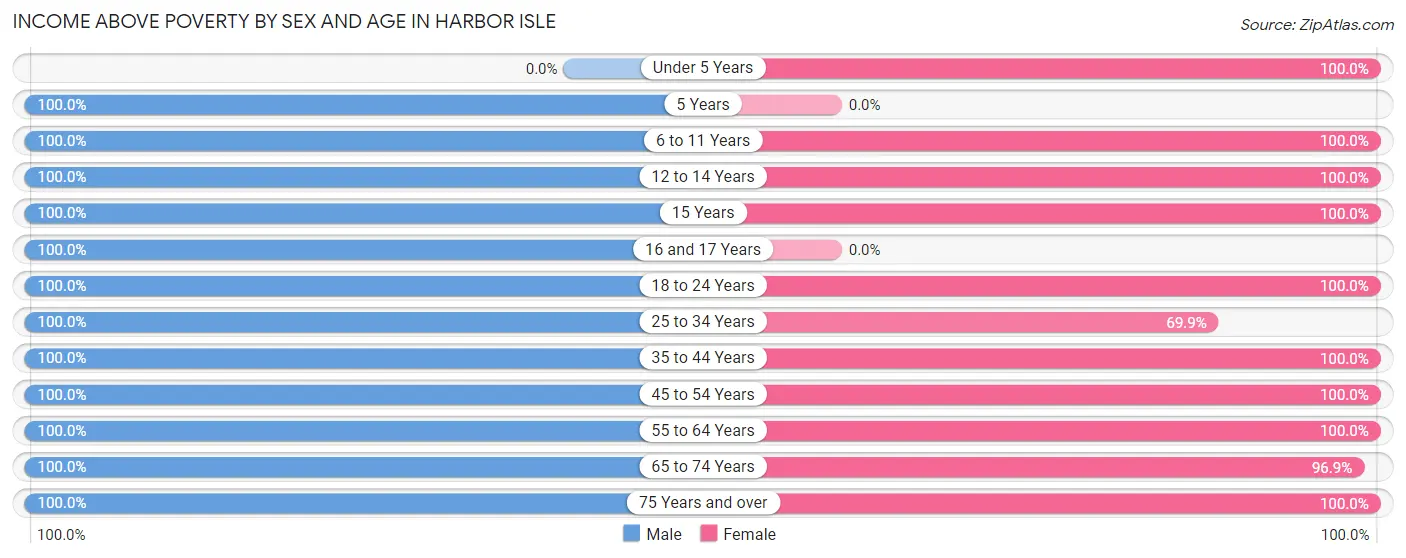
| Age Bracket | Male | Female |
| Under 5 Years | 0 (0.0%) | 58 (100.0%) |
| 5 Years | 58 (100.0%) | 0 (0.0%) |
| 6 to 11 Years | 61 (100.0%) | 3 (100.0%) |
| 12 to 14 Years | 8 (100.0%) | 17 (100.0%) |
| 15 Years | 17 (100.0%) | 14 (100.0%) |
| 16 and 17 Years | 25 (100.0%) | 0 (0.0%) |
| 18 to 24 Years | 30 (100.0%) | 26 (100.0%) |
| 25 to 34 Years | 152 (100.0%) | 86 (69.9%) |
| 35 to 44 Years | 46 (100.0%) | 16 (100.0%) |
| 45 to 54 Years | 98 (100.0%) | 108 (100.0%) |
| 55 to 64 Years | 130 (100.0%) | 93 (100.0%) |
| 65 to 74 Years | 90 (100.0%) | 126 (96.9%) |
| 75 Years and over | 16 (100.0%) | 25 (100.0%) |
| Total | 731 (100.0%) | 572 (93.3%) |
Income Below Poverty Among Married-Couple Families in Harbor Isle
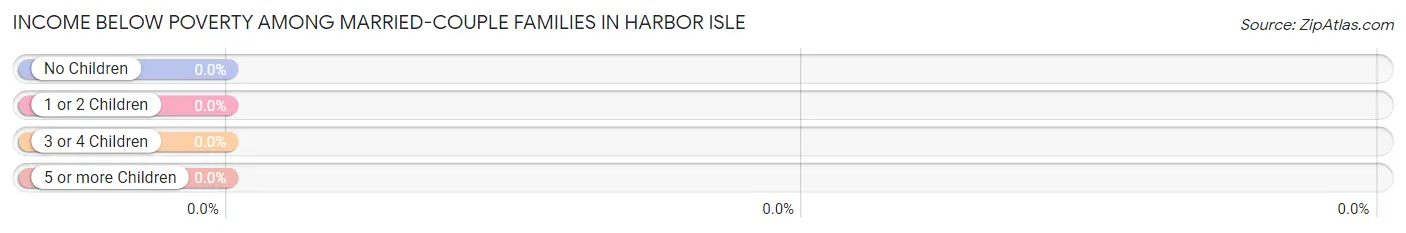
| Children | Above Poverty | Below Poverty |
| No Children | 198 (100.0%) | 0 (0.0%) |
| 1 or 2 Children | 73 (100.0%) | 0 (0.0%) |
| 3 or 4 Children | 5 (100.0%) | 0 (0.0%) |
| 5 or more Children | 0 (0.0%) | 0 (0.0%) |
| Total | 276 (100.0%) | 0 (0.0%) |
Income Below Poverty Among Single-Parent Households in Harbor Isle
| Children | Single Father | Single Mother |
| No Children | 0 (0.0%) | 0 (0.0%) |
| 1 or 2 Children | 0 (0.0%) | 0 (0.0%) |
| 3 or 4 Children | 0 (0.0%) | 0 (0.0%) |
| 5 or more Children | 0 (0.0%) | 0 (0.0%) |
| Total | 0 (0.0%) | 0 (0.0%) |
Income Below Poverty Among Married-Couple vs Single-Parent Households in Harbor Isle
| Children | Married-Couple Families | Single-Parent Households |
| No Children | 0 (0.0%) | 0 (0.0%) |
| 1 or 2 Children | 0 (0.0%) | 0 (0.0%) |
| 3 or 4 Children | 0 (0.0%) | 0 (0.0%) |
| 5 or more Children | 0 (0.0%) | 0 (0.0%) |
| Total | 0 (0.0%) | 0 (0.0%) |
Race in Harbor Isle
The most populous races in Harbor Isle are White / Caucasian (1,350 | 99.3%), Hispanic or Latino (81 | 6.0%), and Some other Race (10 | 0.7%).
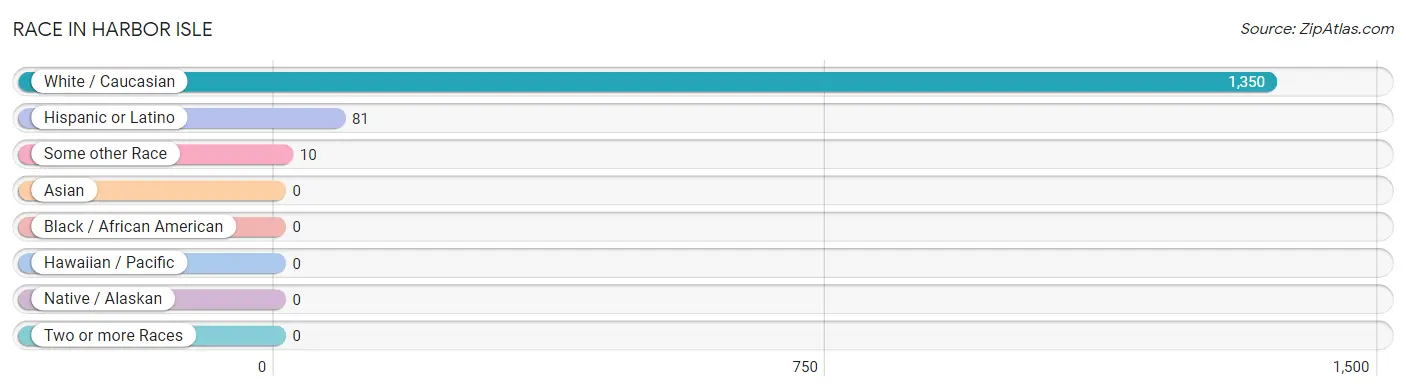
| Race | # Population | % Population |
| Asian | 0 | 0.0% |
| Black / African American | 0 | 0.0% |
| Hawaiian / Pacific | 0 | 0.0% |
| Hispanic or Latino | 81 | 6.0% |
| Native / Alaskan | 0 | 0.0% |
| White / Caucasian | 1,350 | 99.3% |
| Two or more Races | 0 | 0.0% |
| Some other Race | 10 | 0.7% |
| Total | 1,360 | 100.0% |
Ancestry in Harbor Isle
The most populous ancestries reported in Harbor Isle are Irish (718 | 52.8%), Italian (316 | 23.2%), German (230 | 16.9%), American (85 | 6.2%), and Argentinean (55 | 4.0%), together accounting for 103.2% of all Harbor Isle residents.
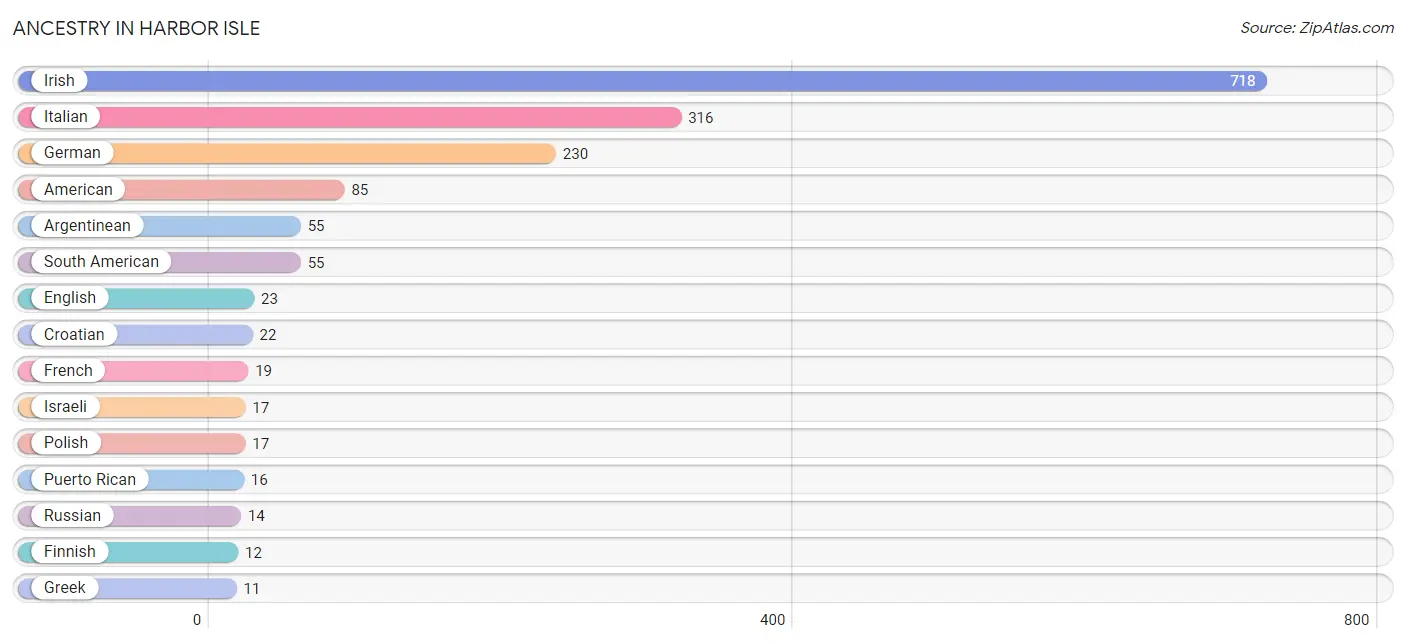
| Ancestry | # Population | % Population |
| American | 85 | 6.2% |
| Argentinean | 55 | 4.0% |
| Croatian | 22 | 1.6% |
| English | 23 | 1.7% |
| Finnish | 12 | 0.9% |
| French | 19 | 1.4% |
| German | 230 | 16.9% |
| Greek | 11 | 0.8% |
| Hungarian | 5 | 0.4% |
| Irish | 718 | 52.8% |
| Israeli | 17 | 1.3% |
| Italian | 316 | 23.2% |
| Polish | 17 | 1.3% |
| Puerto Rican | 16 | 1.2% |
| Russian | 14 | 1.0% |
| South American | 55 | 4.0% | View All 16 Rows |
Immigrants in Harbor Isle
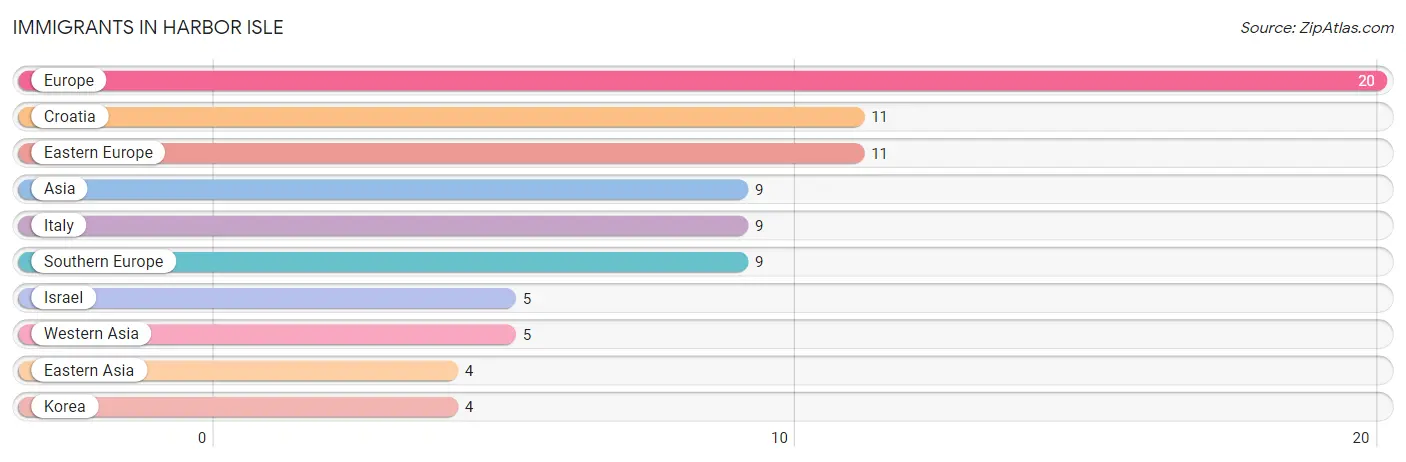
The most numerous immigrant groups reported in Harbor Isle came from Europe (20 | 1.5%), Croatia (11 | 0.8%), Eastern Europe (11 | 0.8%), Asia (9 | 0.7%), and Italy (9 | 0.7%), together accounting for 4.4% of all Harbor Isle residents.
| Immigration Origin | # Population | % Population |
| Asia | 9 | 0.7% |
| Croatia | 11 | 0.8% |
| Eastern Asia | 4 | 0.3% |
| Eastern Europe | 11 | 0.8% |
| Europe | 20 | 1.5% |
| Israel | 5 | 0.4% |
| Italy | 9 | 0.7% |
| Korea | 4 | 0.3% |
| Southern Europe | 9 | 0.7% |
| Western Asia | 5 | 0.4% | View All 10 Rows |
Sex and Age in Harbor Isle
Sex and Age in Harbor Isle
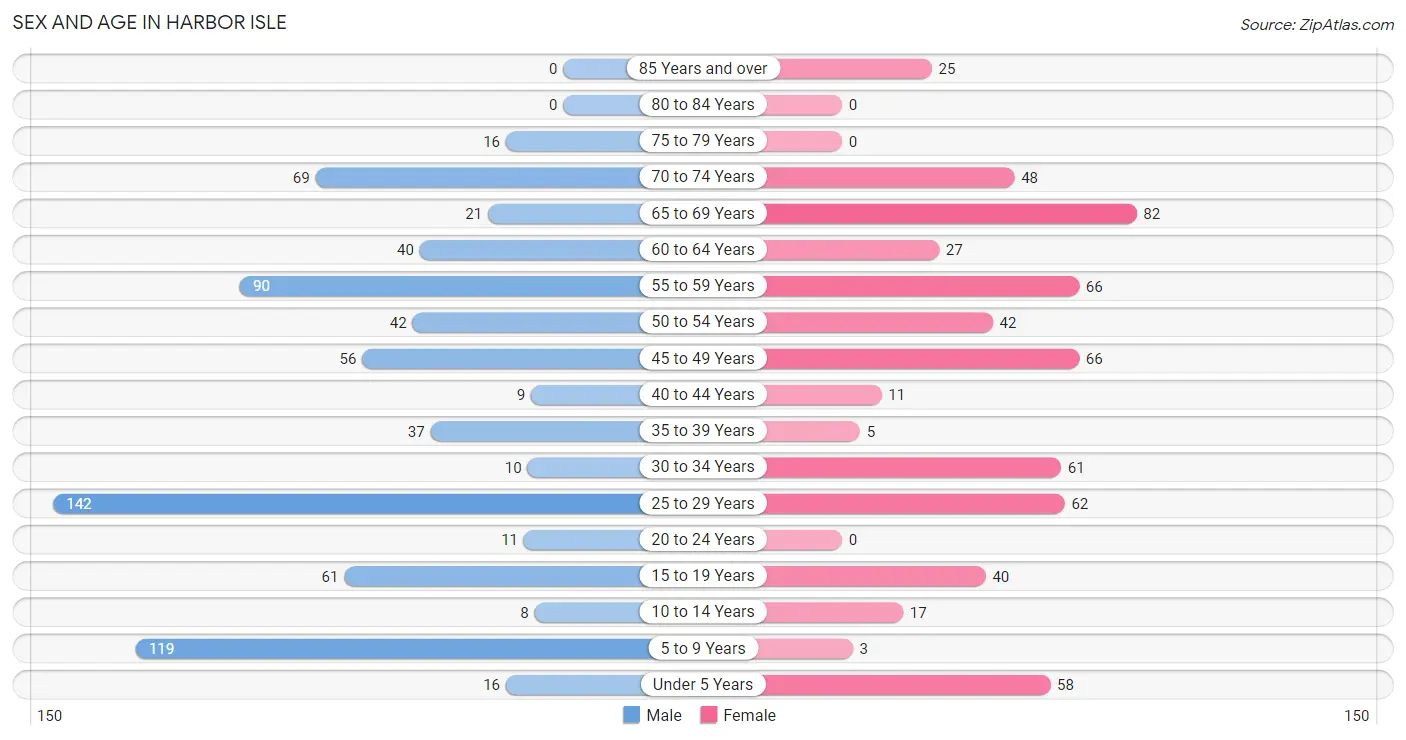
The most populous age groups in Harbor Isle are 25 to 29 Years (142 | 19.0%) for men and 65 to 69 Years (82 | 13.4%) for women.
| Age Bracket | Male | Female |
| Under 5 Years | 16 (2.1%) | 58 (9.5%) |
| 5 to 9 Years | 119 (15.9%) | 3 (0.5%) |
| 10 to 14 Years | 8 (1.1%) | 17 (2.8%) |
| 15 to 19 Years | 61 (8.2%) | 40 (6.5%) |
| 20 to 24 Years | 11 (1.5%) | 0 (0.0%) |
| 25 to 29 Years | 142 (19.0%) | 62 (10.1%) |
| 30 to 34 Years | 10 (1.3%) | 61 (10.0%) |
| 35 to 39 Years | 37 (5.0%) | 5 (0.8%) |
| 40 to 44 Years | 9 (1.2%) | 11 (1.8%) |
| 45 to 49 Years | 56 (7.5%) | 66 (10.8%) |
| 50 to 54 Years | 42 (5.6%) | 42 (6.9%) |
| 55 to 59 Years | 90 (12.0%) | 66 (10.8%) |
| 60 to 64 Years | 40 (5.3%) | 27 (4.4%) |
| 65 to 69 Years | 21 (2.8%) | 82 (13.4%) |
| 70 to 74 Years | 69 (9.2%) | 48 (7.8%) |
| 75 to 79 Years | 16 (2.1%) | 0 (0.0%) |
| 80 to 84 Years | 0 (0.0%) | 0 (0.0%) |
| 85 Years and over | 0 (0.0%) | 25 (4.1%) |
| Total | 747 (100.0%) | 613 (100.0%) |
Families and Households in Harbor Isle
Median Family Size in Harbor Isle
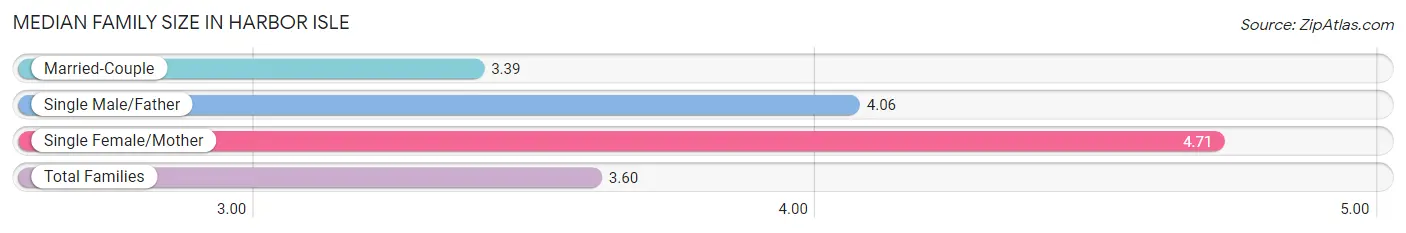
The median family size in Harbor Isle is 3.60 persons per family, with single female/mother families (38 | 11.0%) accounting for the largest median family size of 4.71 persons per family. On the other hand, married-couple families (276 | 79.8%) represent the smallest median family size with 3.39 persons per family.
| Family Type | # Families | Family Size |
| Married-Couple | 276 (79.8%) | 3.39 |
| Single Male/Father | 32 (9.2%) | 4.06 |
| Single Female/Mother | 38 (11.0%) | 4.71 |
| Total Families | 346 (100.0%) | 3.60 |
Median Household Size in Harbor Isle
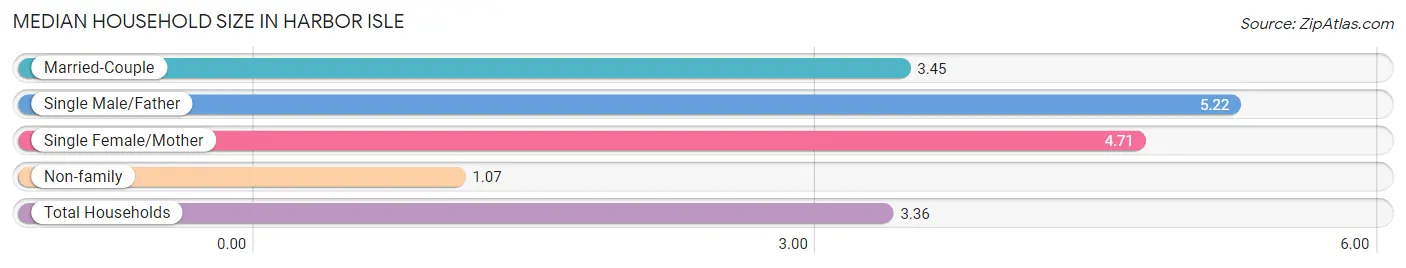
The median household size in Harbor Isle is 3.36 persons per household, with single male/father households (32 | 7.9%) accounting for the largest median household size of 5.22 persons per household. non-family households (59 | 14.6%) represent the smallest median household size with 1.07 persons per household.
| Household Type | # Households | Household Size |
| Married-Couple | 276 (68.1%) | 3.45 |
| Single Male/Father | 32 (7.9%) | 5.22 |
| Single Female/Mother | 38 (9.4%) | 4.71 |
| Non-family | 59 (14.6%) | 1.07 |
| Total Households | 405 (100.0%) | 3.36 |
Household Size by Marriage Status in Harbor Isle
Out of a total of 405 households in Harbor Isle, 346 (85.4%) are family households, while 59 (14.6%) are nonfamily households. The most numerous type of family households are 4-person households, comprising 133, and the most common type of nonfamily households are 1-person households, comprising 55.
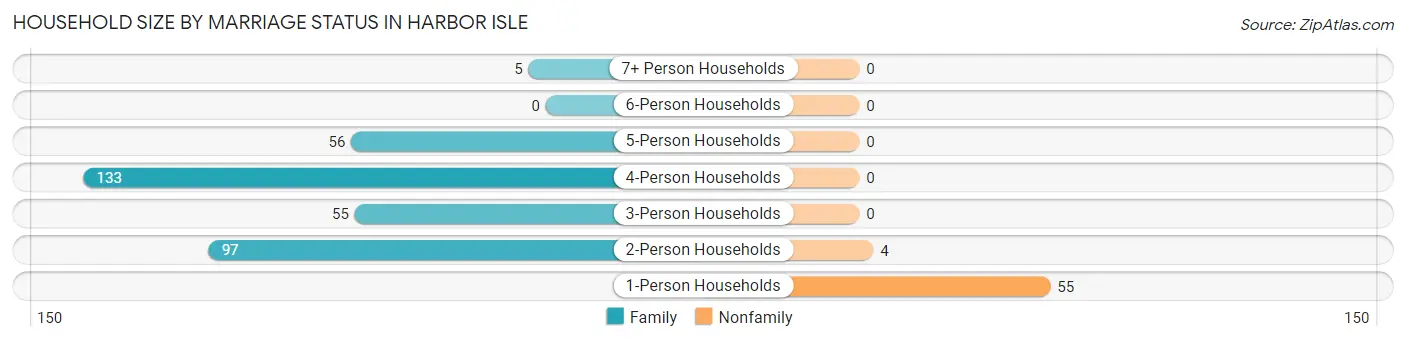
| Household Size | Family Households | Nonfamily Households |
| 1-Person Households | - | 55 (13.6%) |
| 2-Person Households | 97 (23.9%) | 4 (1.0%) |
| 3-Person Households | 55 (13.6%) | 0 (0.0%) |
| 4-Person Households | 133 (32.8%) | 0 (0.0%) |
| 5-Person Households | 56 (13.8%) | 0 (0.0%) |
| 6-Person Households | 0 (0.0%) | 0 (0.0%) |
| 7+ Person Households | 5 (1.2%) | 0 (0.0%) |
| Total | 346 (85.4%) | 59 (14.6%) |
Female Fertility in Harbor Isle
Fertility by Age in Harbor Isle
| Age Bracket | Women with Births | Births / 1,000 Women |
| 15 to 19 years | 0 (0.0%) | 0.0 |
| 20 to 34 years | 0 (0.0%) | 0.0 |
| 35 to 50 years | 0 (0.0%) | 0.0 |
| Total | 0 (0.0%) | 0.0 |
Fertility by Age by Marriage Status in Harbor Isle
| Age Bracket | Married | Unmarried |
| 15 to 19 years | 0 (0.0%) | 0 (0.0%) |
| 20 to 34 years | 0 (0.0%) | 0 (0.0%) |
| 35 to 50 years | 0 (0.0%) | 0 (0.0%) |
| Total | 0 (0.0%) | 0 (0.0%) |
Fertility by Education in Harbor Isle
| Educational Attainment | Women with Births | Births / 1,000 Women |
| Less than High School | 0 (0.0%) | 0.0 |
| High School Diploma | 0 (0.0%) | 0.0 |
| College or Associate's Degree | 0 (0.0%) | 0.0 |
| Bachelor's Degree | 0 (0.0%) | 0.0 |
| Graduate Degree | 0 (0.0%) | 0.0 |
| Total | 0 (0.0%) | 0.0 |
Fertility by Education by Marriage Status in Harbor Isle
| Educational Attainment | Married | Unmarried |
| Less than High School | 0 (0.0%) | 0 (0.0%) |
| High School Diploma | 0 (0.0%) | 0 (0.0%) |
| College or Associate's Degree | 0 (0.0%) | 0 (0.0%) |
| Bachelor's Degree | 0 (0.0%) | 0 (0.0%) |
| Graduate Degree | 0 (0.0%) | 0 (0.0%) |
| Total | 0 (0.0%) | 0 (0.0%) |
Employment Characteristics in Harbor Isle
Employment by Class of Employer in Harbor Isle
Among the 686 employed individuals in Harbor Isle, private company employees (435 | 63.4%), local government employees (162 | 23.6%), and self-employed (not incorporated) (38 | 5.5%) make up the most common classes of employment.
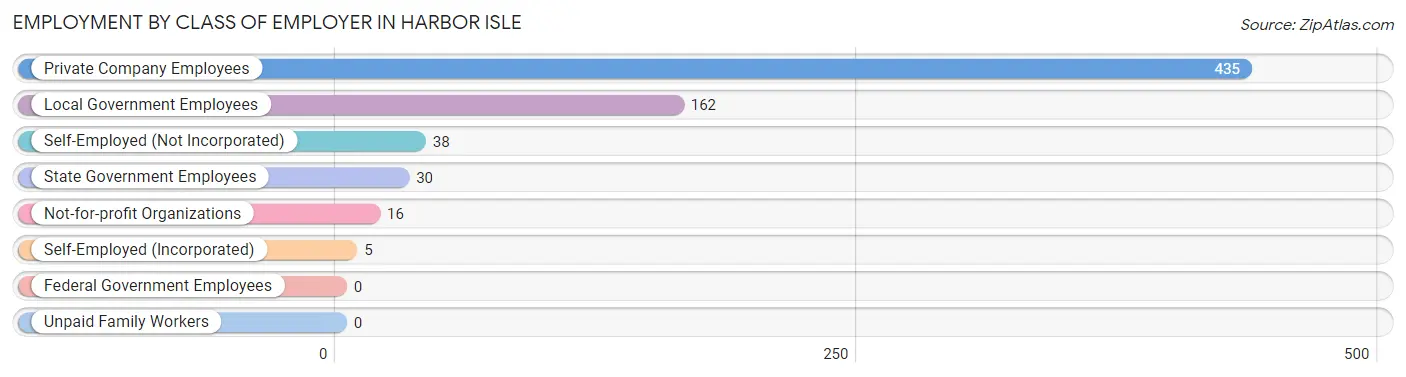
| Employer Class | # Employees | % Employees |
| Private Company Employees | 435 | 63.4% |
| Self-Employed (Incorporated) | 5 | 0.7% |
| Self-Employed (Not Incorporated) | 38 | 5.5% |
| Not-for-profit Organizations | 16 | 2.3% |
| Local Government Employees | 162 | 23.6% |
| State Government Employees | 30 | 4.4% |
| Federal Government Employees | 0 | 0.0% |
| Unpaid Family Workers | 0 | 0.0% |
| Total | 686 | 100.0% |
Employment Status by Age in Harbor Isle
According to the labor force statistics for Harbor Isle, out of the total population over 16 years of age (1,108), 66.4% or 736 individuals are in the labor force, with 3.4% or 25 of them unemployed. The age group with the highest labor force participation rate is 20 to 24 years, with 100.0% or 11 individuals in the labor force. Within the labor force, the 65 to 74 years age range has the highest percentage of unemployed individuals, with 61.0% or 25 of them being unemployed.
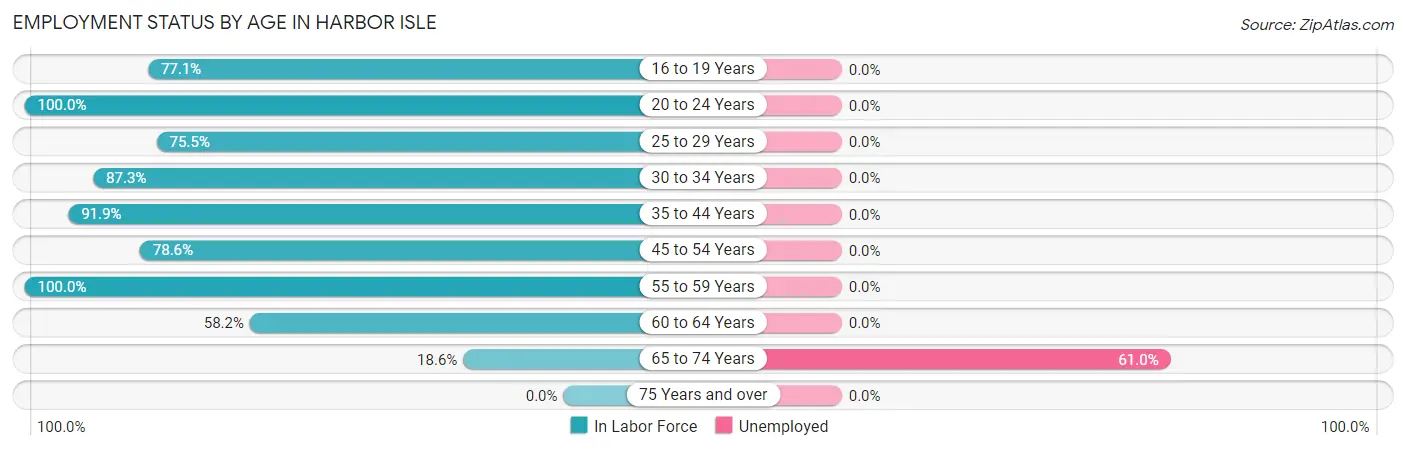
| Age Bracket | In Labor Force | Unemployed |
| 16 to 19 Years | 54 (77.1%) | 0 (0.0%) |
| 20 to 24 Years | 11 (100.0%) | 0 (0.0%) |
| 25 to 29 Years | 154 (75.5%) | 0 (0.0%) |
| 30 to 34 Years | 62 (87.3%) | 0 (0.0%) |
| 35 to 44 Years | 57 (91.9%) | 0 (0.0%) |
| 45 to 54 Years | 162 (78.6%) | 0 (0.0%) |
| 55 to 59 Years | 156 (100.0%) | 0 (0.0%) |
| 60 to 64 Years | 39 (58.2%) | 0 (0.0%) |
| 65 to 74 Years | 41 (18.6%) | 25 (61.0%) |
| 75 Years and over | 0 (0.0%) | 0 (0.0%) |
| Total | 736 (66.4%) | 25 (3.4%) |
Employment Status by Educational Attainment in Harbor Isle
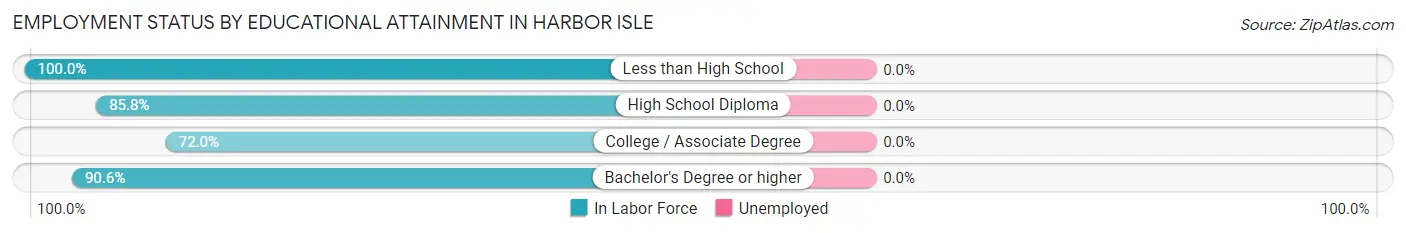
| Educational Attainment | In Labor Force | Unemployed |
| Less than High School | 12 (100.0%) | 0 (0.0%) |
| High School Diploma | 97 (85.8%) | 0 (0.0%) |
| College / Associate Degree | 232 (72.0%) | 0 (0.0%) |
| Bachelor's Degree or higher | 289 (90.6%) | 0 (0.0%) |
| Total | 630 (82.2%) | 0 (0.0%) |
Employment Occupations by Sex in Harbor Isle
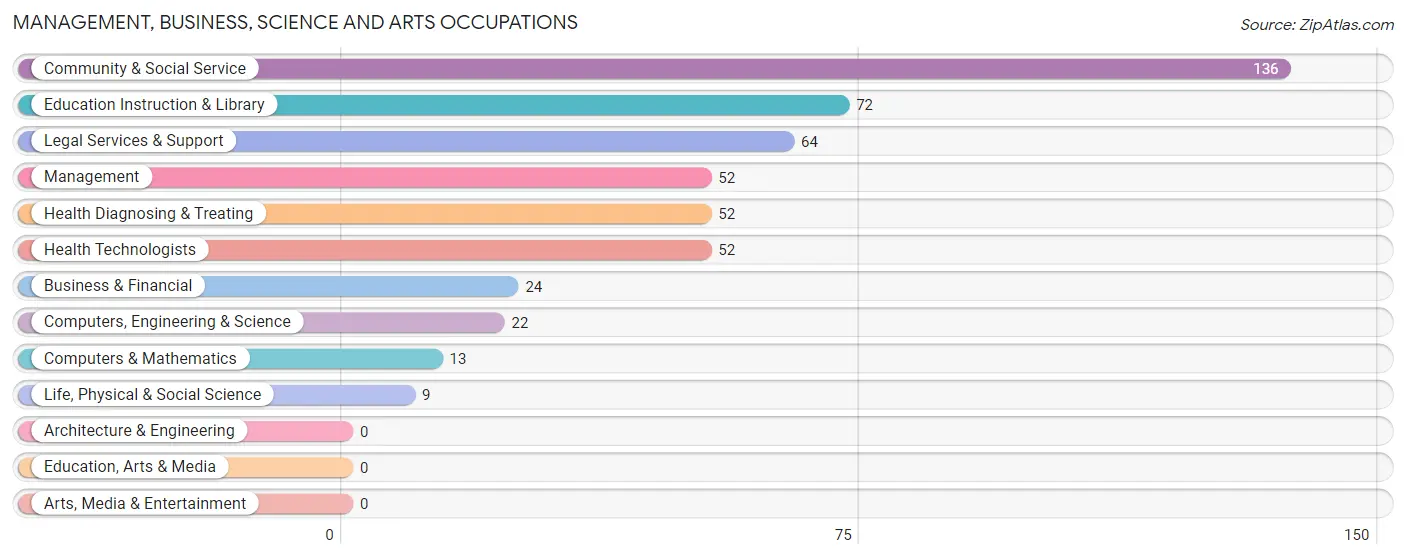
Management, Business, Science and Arts Occupations
The most common Management, Business, Science and Arts occupations in Harbor Isle are Community & Social Service (136 | 19.1%), Education Instruction & Library (72 | 10.1%), Legal Services & Support (64 | 9.0%), Management (52 | 7.3%), and Health Diagnosing & Treating (52 | 7.3%).
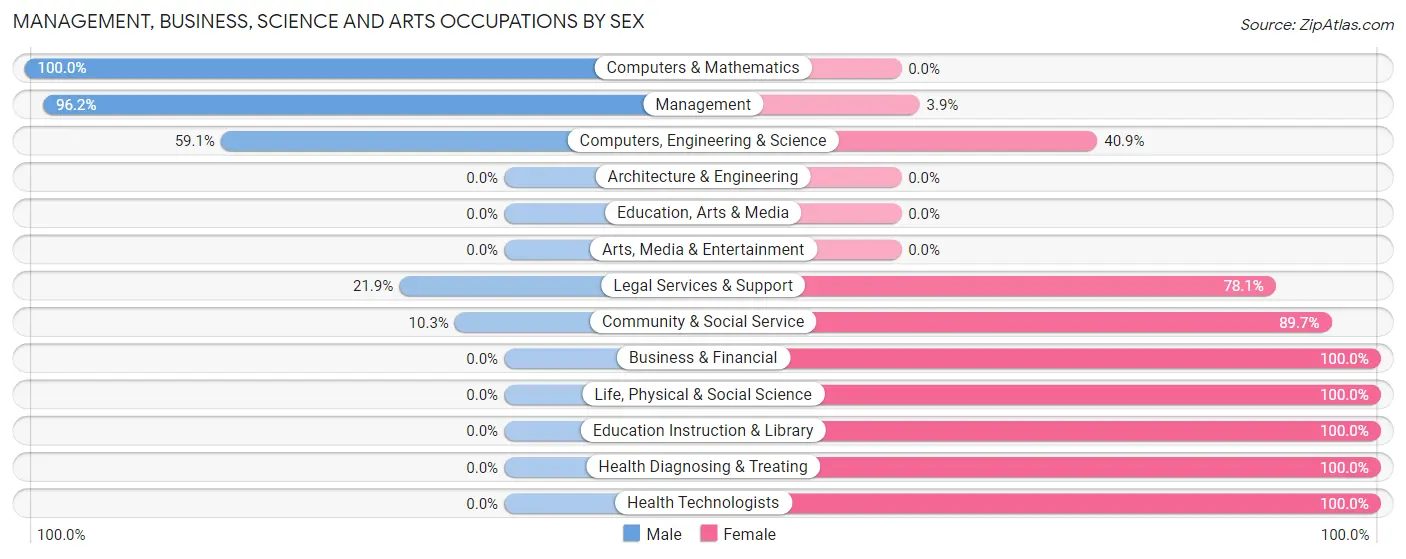
Management, Business, Science and Arts Occupations by Sex
Within the Management, Business, Science and Arts occupations in Harbor Isle, the most male-oriented occupations are Computers & Mathematics (100.0%), Management (96.2%), and Computers, Engineering & Science (59.1%), while the most female-oriented occupations are Business & Financial (100.0%), Life, Physical & Social Science (100.0%), and Education Instruction & Library (100.0%).
| Occupation | Male | Female |
| Management | 50 (96.2%) | 2 (3.8%) |
| Business & Financial | 0 (0.0%) | 24 (100.0%) |
| Computers, Engineering & Science | 13 (59.1%) | 9 (40.9%) |
| Computers & Mathematics | 13 (100.0%) | 0 (0.0%) |
| Architecture & Engineering | 0 (0.0%) | 0 (0.0%) |
| Life, Physical & Social Science | 0 (0.0%) | 9 (100.0%) |
| Community & Social Service | 14 (10.3%) | 122 (89.7%) |
| Education, Arts & Media | 0 (0.0%) | 0 (0.0%) |
| Legal Services & Support | 14 (21.9%) | 50 (78.1%) |
| Education Instruction & Library | 0 (0.0%) | 72 (100.0%) |
| Arts, Media & Entertainment | 0 (0.0%) | 0 (0.0%) |
| Health Diagnosing & Treating | 0 (0.0%) | 52 (100.0%) |
| Health Technologists | 0 (0.0%) | 52 (100.0%) |
| Total (Category) | 77 (26.9%) | 209 (73.1%) |
| Total (Overall) | 417 (58.7%) | 294 (41.3%) |
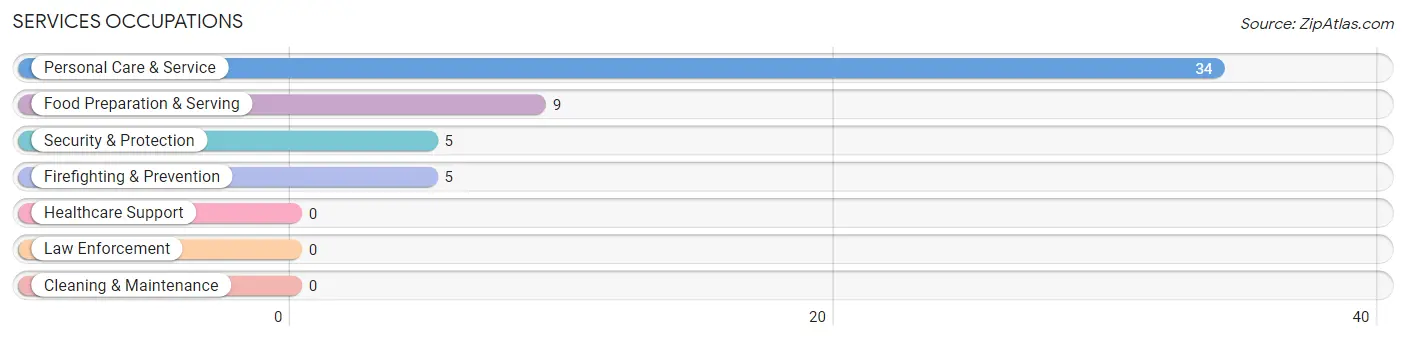
Services Occupations
The most common Services occupations in Harbor Isle are Personal Care & Service (34 | 4.8%), Food Preparation & Serving (9 | 1.3%), Security & Protection (5 | 0.7%), and Firefighting & Prevention (5 | 0.7%).
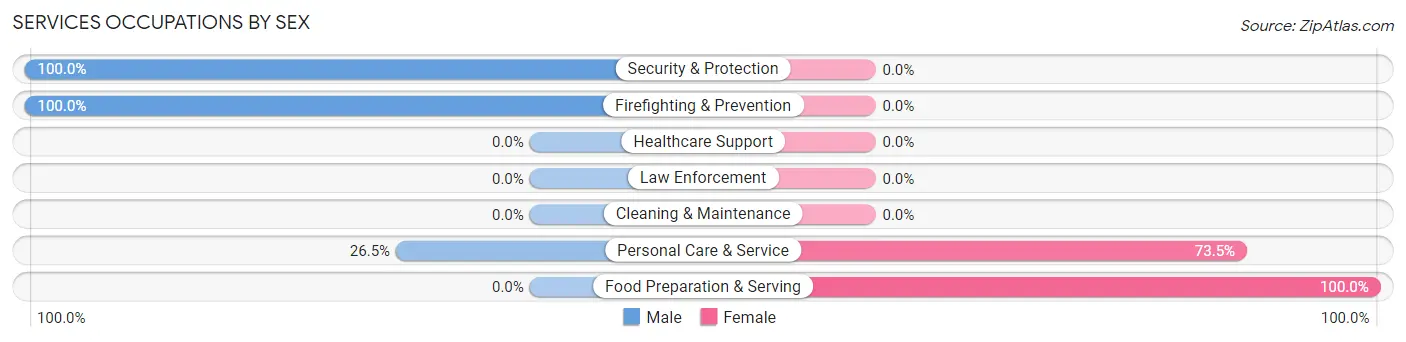
Services Occupations by Sex
Within the Services occupations in Harbor Isle, the most male-oriented occupations are Security & Protection (100.0%), Firefighting & Prevention (100.0%), and Personal Care & Service (26.5%), while the most female-oriented occupations are Food Preparation & Serving (100.0%), and Personal Care & Service (73.5%).
| Occupation | Male | Female |
| Healthcare Support | 0 (0.0%) | 0 (0.0%) |
| Security & Protection | 5 (100.0%) | 0 (0.0%) |
| Firefighting & Prevention | 5 (100.0%) | 0 (0.0%) |
| Law Enforcement | 0 (0.0%) | 0 (0.0%) |
| Food Preparation & Serving | 0 (0.0%) | 9 (100.0%) |
| Cleaning & Maintenance | 0 (0.0%) | 0 (0.0%) |
| Personal Care & Service | 9 (26.5%) | 25 (73.5%) |
| Total (Category) | 14 (29.2%) | 34 (70.8%) |
| Total (Overall) | 417 (58.7%) | 294 (41.3%) |
Sales and Office Occupations
The most common Sales and Office occupations in Harbor Isle are Sales & Related (57 | 8.0%), and Office & Administration (30 | 4.2%).
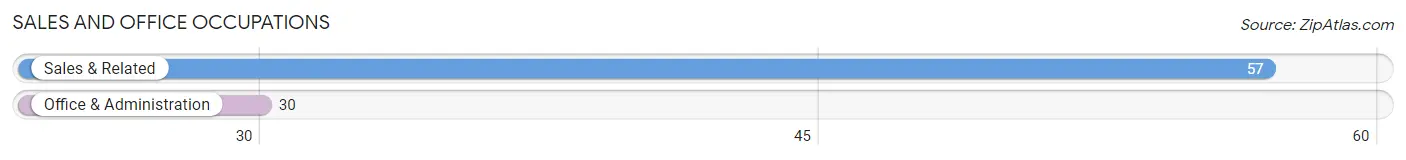
Sales and Office Occupations by Sex
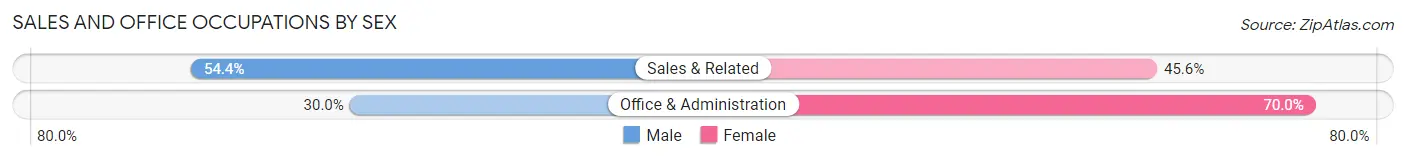
| Occupation | Male | Female |
| Sales & Related | 31 (54.4%) | 26 (45.6%) |
| Office & Administration | 9 (30.0%) | 21 (70.0%) |
| Total (Category) | 40 (46.0%) | 47 (54.0%) |
| Total (Overall) | 417 (58.7%) | 294 (41.3%) |
Natural Resources, Construction and Maintenance Occupations
The most common Natural Resources, Construction and Maintenance occupations in Harbor Isle are Construction & Extraction (106 | 14.9%), and Installation, Maintenance & Repair (52 | 7.3%).
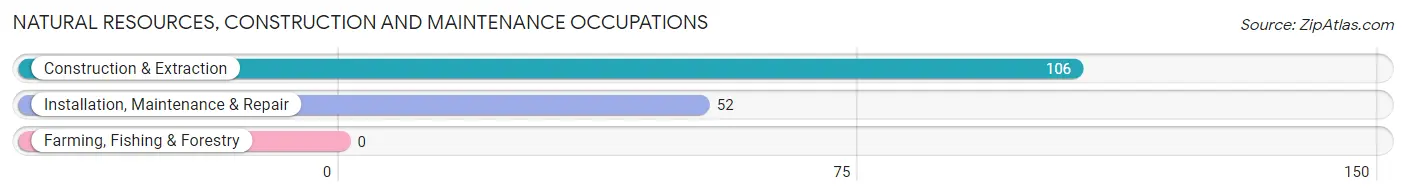
Natural Resources, Construction and Maintenance Occupations by Sex
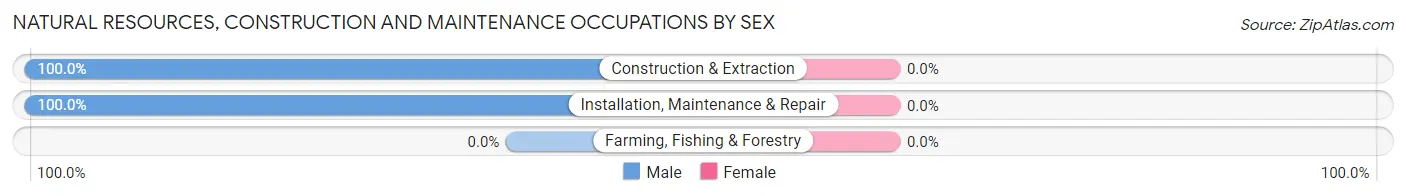
| Occupation | Male | Female |
| Farming, Fishing & Forestry | 0 (0.0%) | 0 (0.0%) |
| Construction & Extraction | 106 (100.0%) | 0 (0.0%) |
| Installation, Maintenance & Repair | 52 (100.0%) | 0 (0.0%) |
| Total (Category) | 158 (100.0%) | 0 (0.0%) |
| Total (Overall) | 417 (58.7%) | 294 (41.3%) |
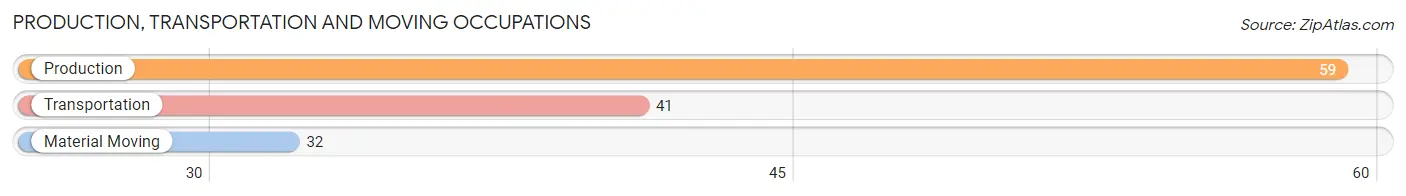
Production, Transportation and Moving Occupations
The most common Production, Transportation and Moving occupations in Harbor Isle are Production (59 | 8.3%), Transportation (41 | 5.8%), and Material Moving (32 | 4.5%).
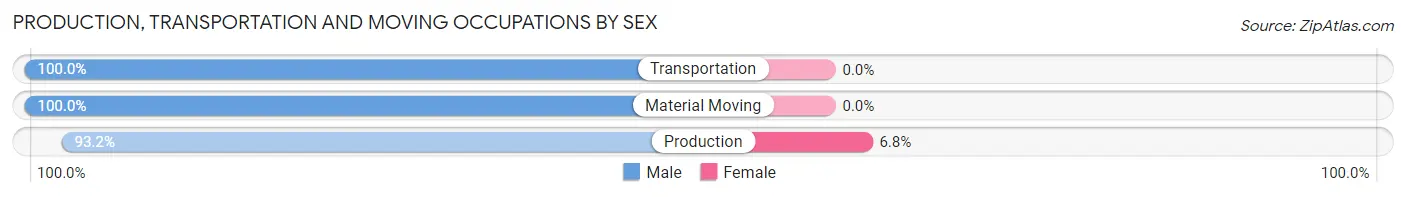
Production, Transportation and Moving Occupations by Sex
| Occupation | Male | Female |
| Production | 55 (93.2%) | 4 (6.8%) |
| Transportation | 41 (100.0%) | 0 (0.0%) |
| Material Moving | 32 (100.0%) | 0 (0.0%) |
| Total (Category) | 128 (97.0%) | 4 (3.0%) |
| Total (Overall) | 417 (58.7%) | 294 (41.3%) |
Employment Industries by Sex in Harbor Isle
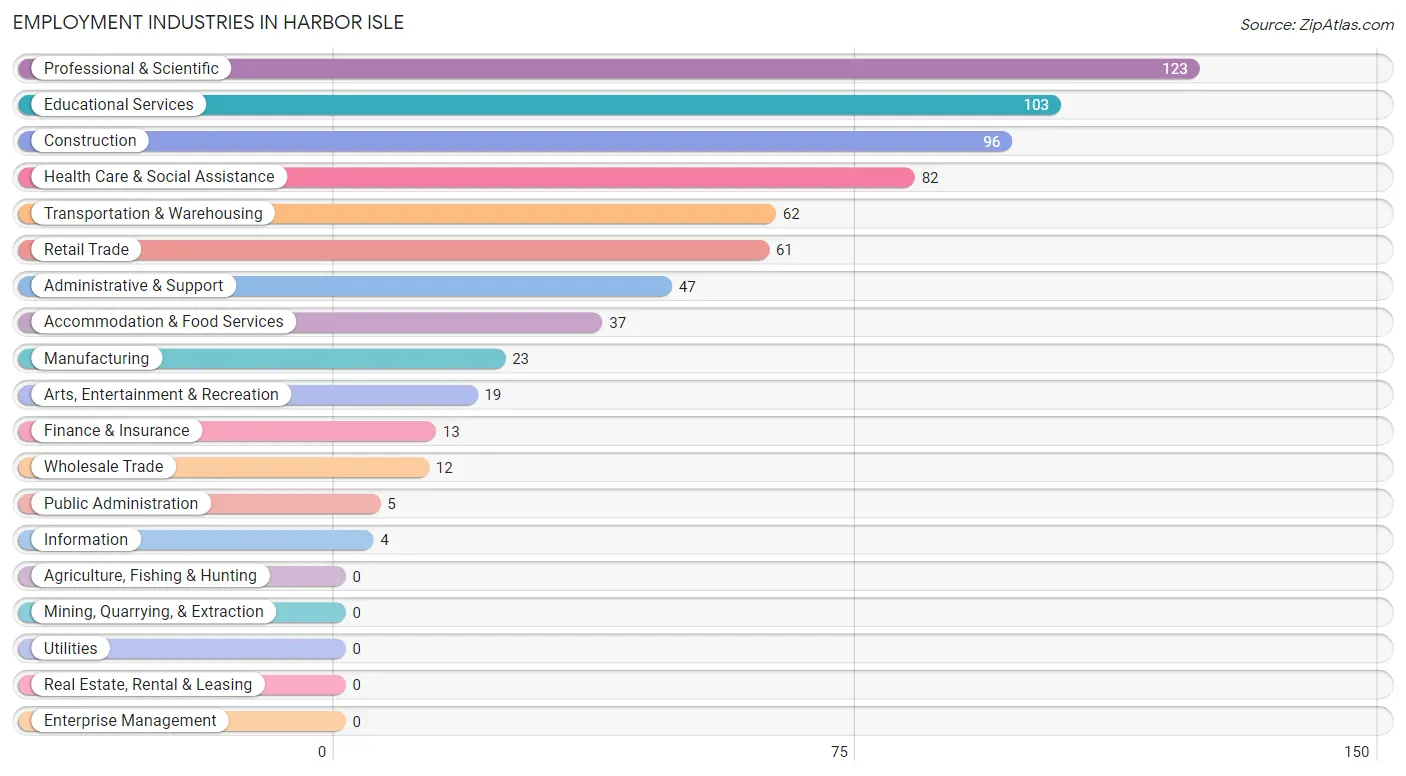
Employment Industries in Harbor Isle
The major employment industries in Harbor Isle include Professional & Scientific (123 | 17.3%), Educational Services (103 | 14.5%), Construction (96 | 13.5%), Health Care & Social Assistance (82 | 11.5%), and Transportation & Warehousing (62 | 8.7%).
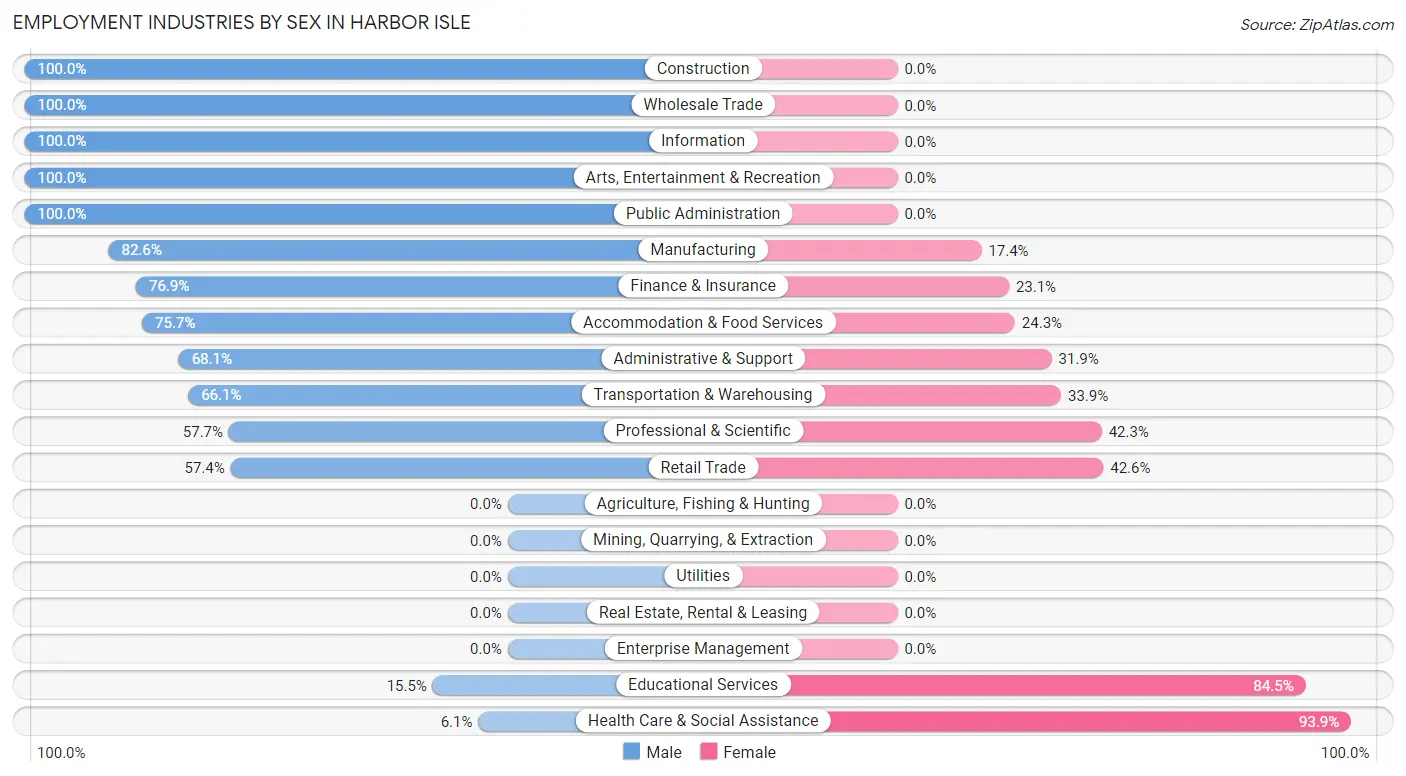
Employment Industries by Sex in Harbor Isle
The Harbor Isle industries that see more men than women are Construction (100.0%), Wholesale Trade (100.0%), and Information (100.0%), whereas the industries that tend to have a higher number of women are Health Care & Social Assistance (93.9%), Educational Services (84.5%), and Retail Trade (42.6%).
| Industry | Male | Female |
| Agriculture, Fishing & Hunting | 0 (0.0%) | 0 (0.0%) |
| Mining, Quarrying, & Extraction | 0 (0.0%) | 0 (0.0%) |
| Construction | 96 (100.0%) | 0 (0.0%) |
| Manufacturing | 19 (82.6%) | 4 (17.4%) |
| Wholesale Trade | 12 (100.0%) | 0 (0.0%) |
| Retail Trade | 35 (57.4%) | 26 (42.6%) |
| Transportation & Warehousing | 41 (66.1%) | 21 (33.9%) |
| Utilities | 0 (0.0%) | 0 (0.0%) |
| Information | 4 (100.0%) | 0 (0.0%) |
| Finance & Insurance | 10 (76.9%) | 3 (23.1%) |
| Real Estate, Rental & Leasing | 0 (0.0%) | 0 (0.0%) |
| Professional & Scientific | 71 (57.7%) | 52 (42.3%) |
| Enterprise Management | 0 (0.0%) | 0 (0.0%) |
| Administrative & Support | 32 (68.1%) | 15 (31.9%) |
| Educational Services | 16 (15.5%) | 87 (84.5%) |
| Health Care & Social Assistance | 5 (6.1%) | 77 (93.9%) |
| Arts, Entertainment & Recreation | 19 (100.0%) | 0 (0.0%) |
| Accommodation & Food Services | 28 (75.7%) | 9 (24.3%) |
| Public Administration | 5 (100.0%) | 0 (0.0%) |
| Total | 417 (58.7%) | 294 (41.3%) |
Education in Harbor Isle
School Enrollment in Harbor Isle
The most common levels of schooling among the 292 students in Harbor Isle are high school (90 | 30.8%), elementary school (62 | 21.2%), and kindergarten (60 | 20.5%).
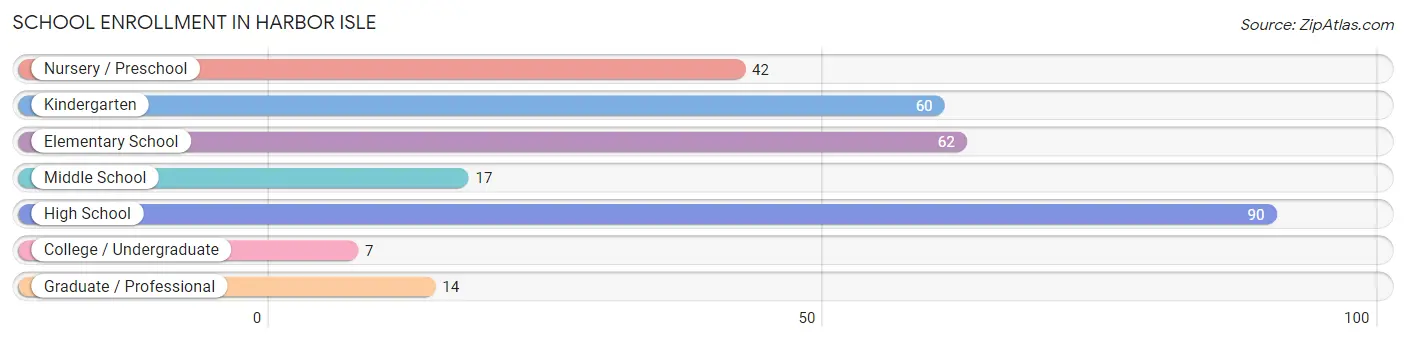
| School Level | # Students | % Students |
| Nursery / Preschool | 42 | 14.4% |
| Kindergarten | 60 | 20.5% |
| Elementary School | 62 | 21.2% |
| Middle School | 17 | 5.8% |
| High School | 90 | 30.8% |
| College / Undergraduate | 7 | 2.4% |
| Graduate / Professional | 14 | 4.8% |
| Total | 292 | 100.0% |
School Enrollment by Age by Funding Source in Harbor Isle
Out of a total of 292 students who are enrolled in schools in Harbor Isle, 66 (22.6%) attend a private institution, while the remaining 226 (77.4%) are enrolled in public schools. The age group of 3 to 4 year olds has the highest likelihood of being enrolled in private schools, with 32 (76.2% in the age bracket) enrolled. Conversely, the age group of 15 to 17 year olds has the lowest likelihood of being enrolled in a private school, with 56 (100.0% in the age bracket) attending a public institution.
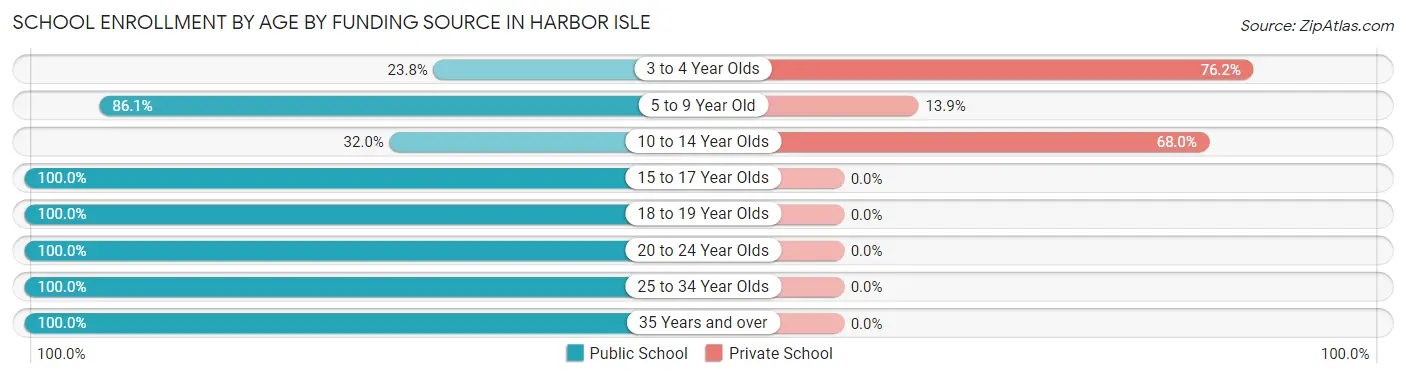
| Age Bracket | Public School | Private School |
| 3 to 4 Year Olds | 10 (23.8%) | 32 (76.2%) |
| 5 to 9 Year Old | 105 (86.1%) | 17 (13.9%) |
| 10 to 14 Year Olds | 8 (32.0%) | 17 (68.0%) |
| 15 to 17 Year Olds | 56 (100.0%) | 0 (0.0%) |
| 18 to 19 Year Olds | 26 (100.0%) | 0 (0.0%) |
| 20 to 24 Year Olds | 7 (100.0%) | 0 (0.0%) |
| 25 to 34 Year Olds | 5 (100.0%) | 0 (0.0%) |
| 35 Years and over | 9 (100.0%) | 0 (0.0%) |
| Total | 226 (77.4%) | 66 (22.6%) |
Educational Attainment by Field of Study in Harbor Isle
Business (178 | 33.3%), education (109 | 20.4%), communications (59 | 11.0%), science & technology (57 | 10.6%), and social sciences (49 | 9.2%) are the most common fields of study among 535 individuals in Harbor Isle who have obtained a bachelor's degree or higher.
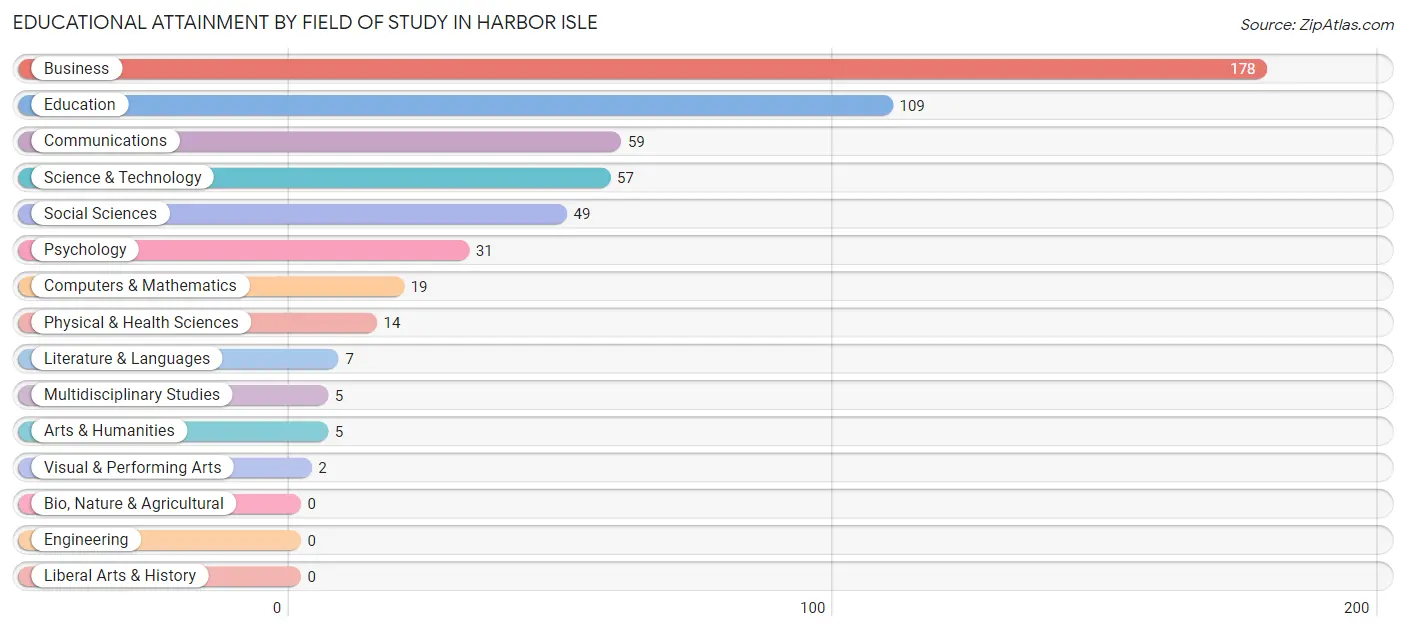
| Field of Study | # Graduates | % Graduates |
| Computers & Mathematics | 19 | 3.5% |
| Bio, Nature & Agricultural | 0 | 0.0% |
| Physical & Health Sciences | 14 | 2.6% |
| Psychology | 31 | 5.8% |
| Social Sciences | 49 | 9.2% |
| Engineering | 0 | 0.0% |
| Multidisciplinary Studies | 5 | 0.9% |
| Science & Technology | 57 | 10.6% |
| Business | 178 | 33.3% |
| Education | 109 | 20.4% |
| Literature & Languages | 7 | 1.3% |
| Liberal Arts & History | 0 | 0.0% |
| Visual & Performing Arts | 2 | 0.4% |
| Communications | 59 | 11.0% |
| Arts & Humanities | 5 | 0.9% |
| Total | 535 | 100.0% |
Transportation & Commute in Harbor Isle
Vehicle Availability by Sex in Harbor Isle
The most prevalent vehicle ownership categories in Harbor Isle are males with 3 vehicles (173, accounting for 41.5%) and females with 3 vehicles (139, making up 64.3%).
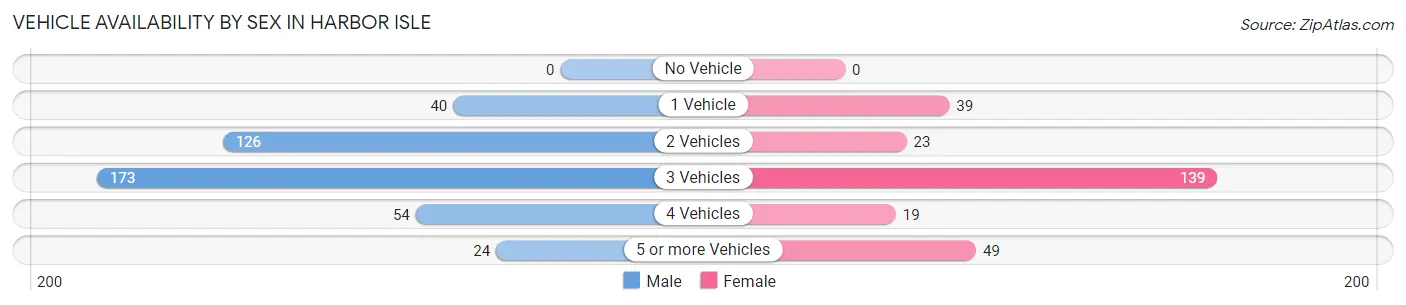
| Vehicles Available | Male | Female |
| No Vehicle | 0 (0.0%) | 0 (0.0%) |
| 1 Vehicle | 40 (9.6%) | 39 (14.5%) |
| 2 Vehicles | 126 (30.2%) | 23 (8.6%) |
| 3 Vehicles | 173 (41.5%) | 139 (51.7%) |
| 4 Vehicles | 54 (13.0%) | 19 (7.1%) |
| 5 or more Vehicles | 24 (5.8%) | 49 (18.2%) |
| Total | 417 (100.0%) | 269 (100.0%) |
Commute Time in Harbor Isle
The most frequently occuring commute durations in Harbor Isle are 90 or more minutes (145 commuters, 23.8%), 60 to 89 minutes (117 commuters, 19.2%), and 45 to 59 minutes (90 commuters, 14.8%).
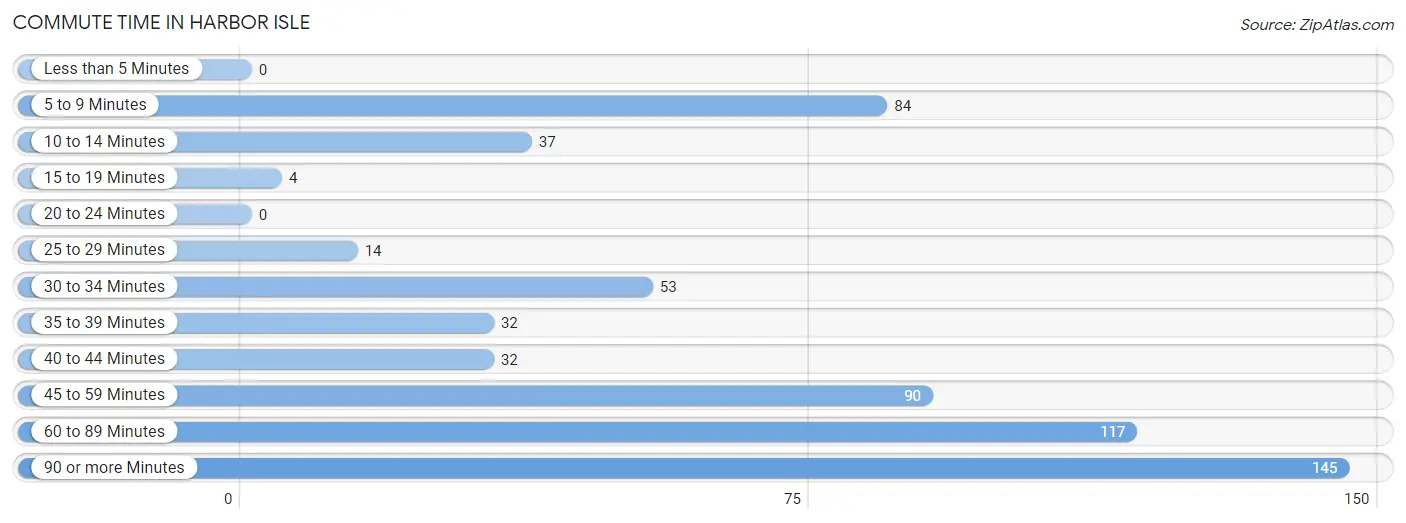
| Commute Time | # Commuters | % Commuters |
| Less than 5 Minutes | 0 | 0.0% |
| 5 to 9 Minutes | 84 | 13.8% |
| 10 to 14 Minutes | 37 | 6.1% |
| 15 to 19 Minutes | 4 | 0.7% |
| 20 to 24 Minutes | 0 | 0.0% |
| 25 to 29 Minutes | 14 | 2.3% |
| 30 to 34 Minutes | 53 | 8.7% |
| 35 to 39 Minutes | 32 | 5.3% |
| 40 to 44 Minutes | 32 | 5.3% |
| 45 to 59 Minutes | 90 | 14.8% |
| 60 to 89 Minutes | 117 | 19.2% |
| 90 or more Minutes | 145 | 23.8% |
Commute Time by Sex in Harbor Isle
The most common commute times in Harbor Isle are 90 or more minutes (130 commuters, 35.1%) for males and 60 to 89 minutes (75 commuters, 31.5%) for females.
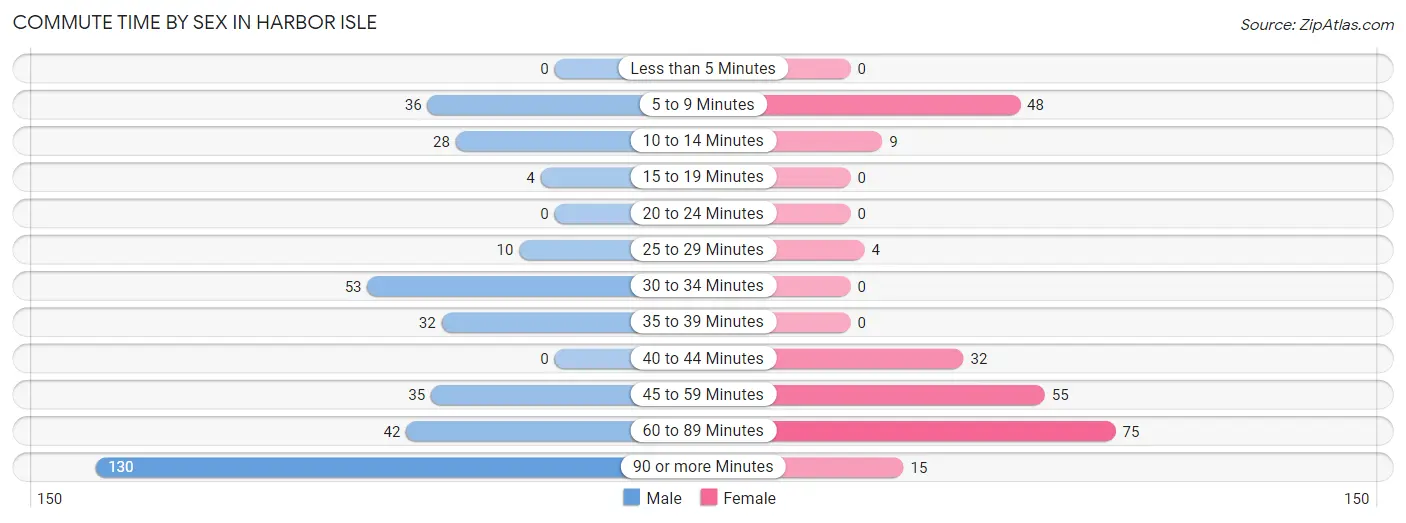
| Commute Time | Male | Female |
| Less than 5 Minutes | 0 (0.0%) | 0 (0.0%) |
| 5 to 9 Minutes | 36 (9.7%) | 48 (20.2%) |
| 10 to 14 Minutes | 28 (7.6%) | 9 (3.8%) |
| 15 to 19 Minutes | 4 (1.1%) | 0 (0.0%) |
| 20 to 24 Minutes | 0 (0.0%) | 0 (0.0%) |
| 25 to 29 Minutes | 10 (2.7%) | 4 (1.7%) |
| 30 to 34 Minutes | 53 (14.3%) | 0 (0.0%) |
| 35 to 39 Minutes | 32 (8.6%) | 0 (0.0%) |
| 40 to 44 Minutes | 0 (0.0%) | 32 (13.5%) |
| 45 to 59 Minutes | 35 (9.5%) | 55 (23.1%) |
| 60 to 89 Minutes | 42 (11.4%) | 75 (31.5%) |
| 90 or more Minutes | 130 (35.1%) | 15 (6.3%) |
Time of Departure to Work by Sex in Harbor Isle
The most frequent times of departure to work in Harbor Isle are 5:30 AM to 5:59 AM (61, 16.5%) for males and 4:00 PM to 11:59 PM (87, 36.5%) for females.
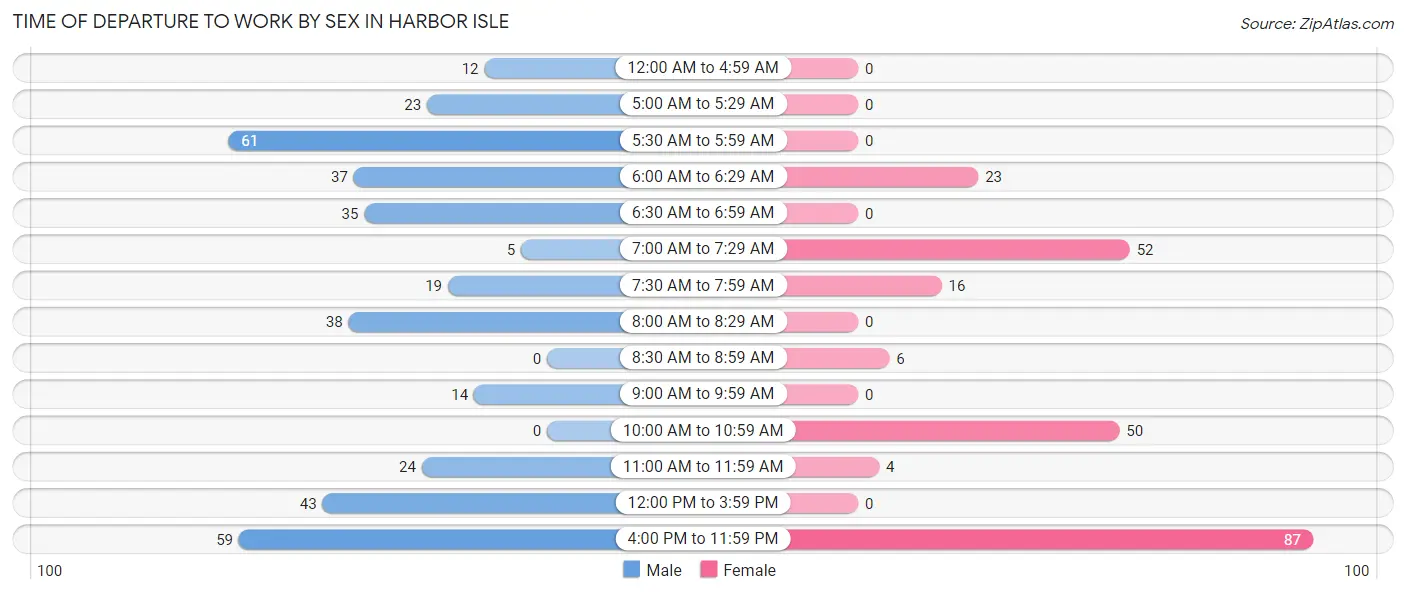
| Time of Departure | Male | Female |
| 12:00 AM to 4:59 AM | 12 (3.2%) | 0 (0.0%) |
| 5:00 AM to 5:29 AM | 23 (6.2%) | 0 (0.0%) |
| 5:30 AM to 5:59 AM | 61 (16.5%) | 0 (0.0%) |
| 6:00 AM to 6:29 AM | 37 (10.0%) | 23 (9.7%) |
| 6:30 AM to 6:59 AM | 35 (9.5%) | 0 (0.0%) |
| 7:00 AM to 7:29 AM | 5 (1.3%) | 52 (21.8%) |
| 7:30 AM to 7:59 AM | 19 (5.1%) | 16 (6.7%) |
| 8:00 AM to 8:29 AM | 38 (10.3%) | 0 (0.0%) |
| 8:30 AM to 8:59 AM | 0 (0.0%) | 6 (2.5%) |
| 9:00 AM to 9:59 AM | 14 (3.8%) | 0 (0.0%) |
| 10:00 AM to 10:59 AM | 0 (0.0%) | 50 (21.0%) |
| 11:00 AM to 11:59 AM | 24 (6.5%) | 4 (1.7%) |
| 12:00 PM to 3:59 PM | 43 (11.6%) | 0 (0.0%) |
| 4:00 PM to 11:59 PM | 59 (16.0%) | 87 (36.5%) |
| Total | 370 (100.0%) | 238 (100.0%) |
Housing Occupancy in Harbor Isle
Occupancy by Ownership in Harbor Isle
Of the total 405 dwellings in Harbor Isle, owner-occupied units account for 405 (100.0%), while renter-occupied units make up 0 (0.0%).
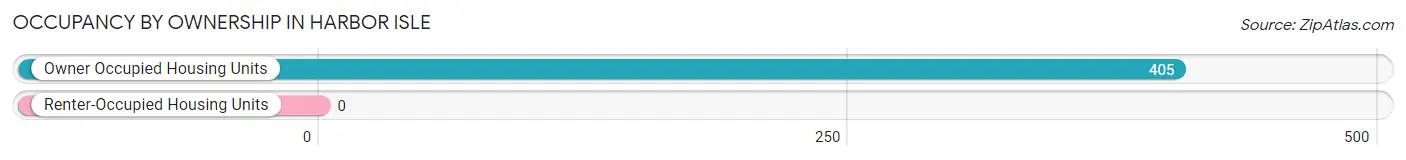
| Occupancy | # Housing Units | % Housing Units |
| Owner Occupied Housing Units | 405 | 100.0% |
| Renter-Occupied Housing Units | 0 | 0.0% |
| Total Occupied Housing Units | 405 | 100.0% |
Occupancy by Household Size in Harbor Isle
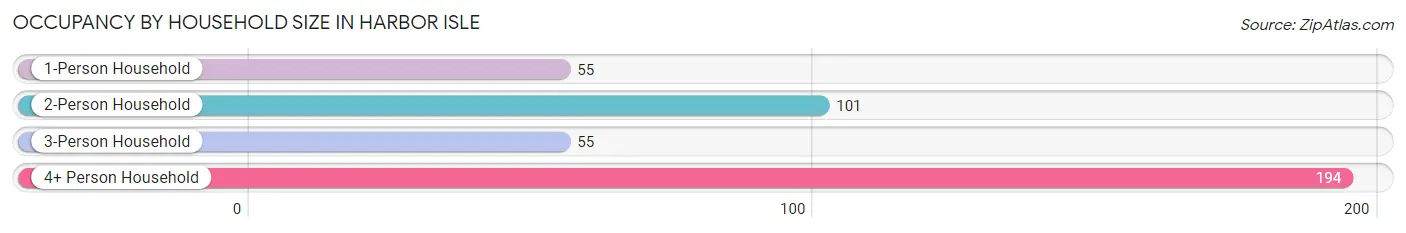
| Household Size | # Housing Units | % Housing Units |
| 1-Person Household | 55 | 13.6% |
| 2-Person Household | 101 | 24.9% |
| 3-Person Household | 55 | 13.6% |
| 4+ Person Household | 194 | 47.9% |
| Total Housing Units | 405 | 100.0% |
Occupancy by Ownership by Household Size in Harbor Isle
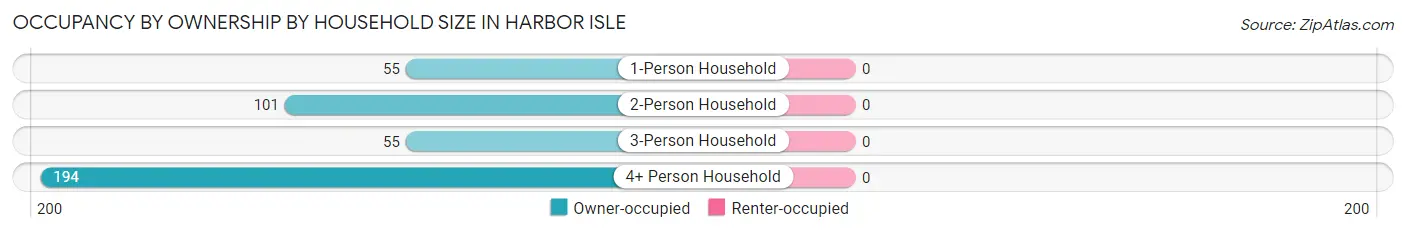
| Household Size | Owner-occupied | Renter-occupied |
| 1-Person Household | 55 (100.0%) | 0 (0.0%) |
| 2-Person Household | 101 (100.0%) | 0 (0.0%) |
| 3-Person Household | 55 (100.0%) | 0 (0.0%) |
| 4+ Person Household | 194 (100.0%) | 0 (0.0%) |
| Total Housing Units | 405 (100.0%) | 0 (0.0%) |
Occupancy by Educational Attainment in Harbor Isle
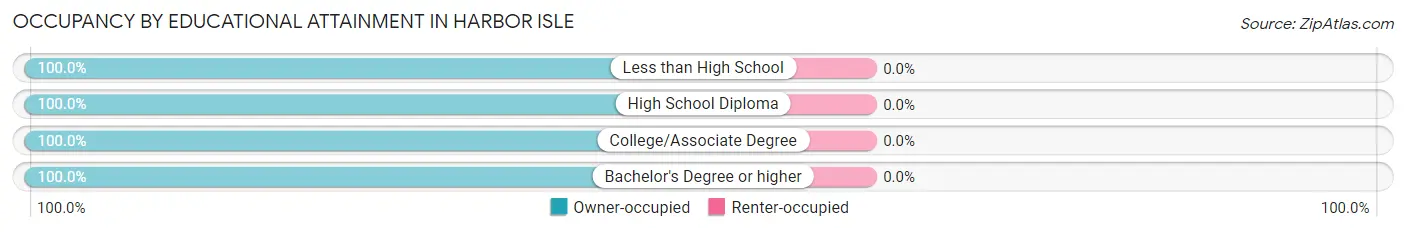
| Household Size | Owner-occupied | Renter-occupied |
| Less than High School | 10 (100.0%) | 0 (0.0%) |
| High School Diploma | 66 (100.0%) | 0 (0.0%) |
| College/Associate Degree | 164 (100.0%) | 0 (0.0%) |
| Bachelor's Degree or higher | 165 (100.0%) | 0 (0.0%) |
Occupancy by Age of Householder in Harbor Isle
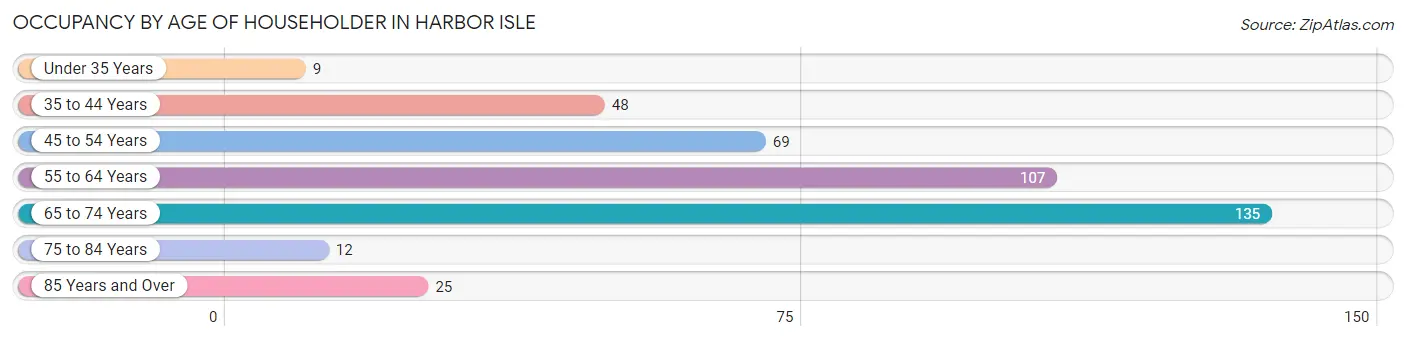
| Age Bracket | # Households | % Households |
| Under 35 Years | 9 | 2.2% |
| 35 to 44 Years | 48 | 11.8% |
| 45 to 54 Years | 69 | 17.0% |
| 55 to 64 Years | 107 | 26.4% |
| 65 to 74 Years | 135 | 33.3% |
| 75 to 84 Years | 12 | 3.0% |
| 85 Years and Over | 25 | 6.2% |
| Total | 405 | 100.0% |
Housing Finances in Harbor Isle
Median Income by Occupancy in Harbor Isle
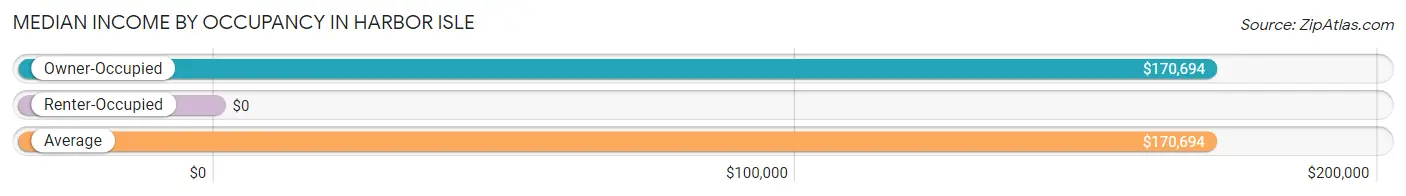
| Occupancy Type | # Households | Median Income |
| Owner-Occupied | 405 (100.0%) | $170,694 |
| Renter-Occupied | 0 (0.0%) | $0 |
| Average | 405 (100.0%) | $170,694 |
Occupancy by Householder Income Bracket in Harbor Isle
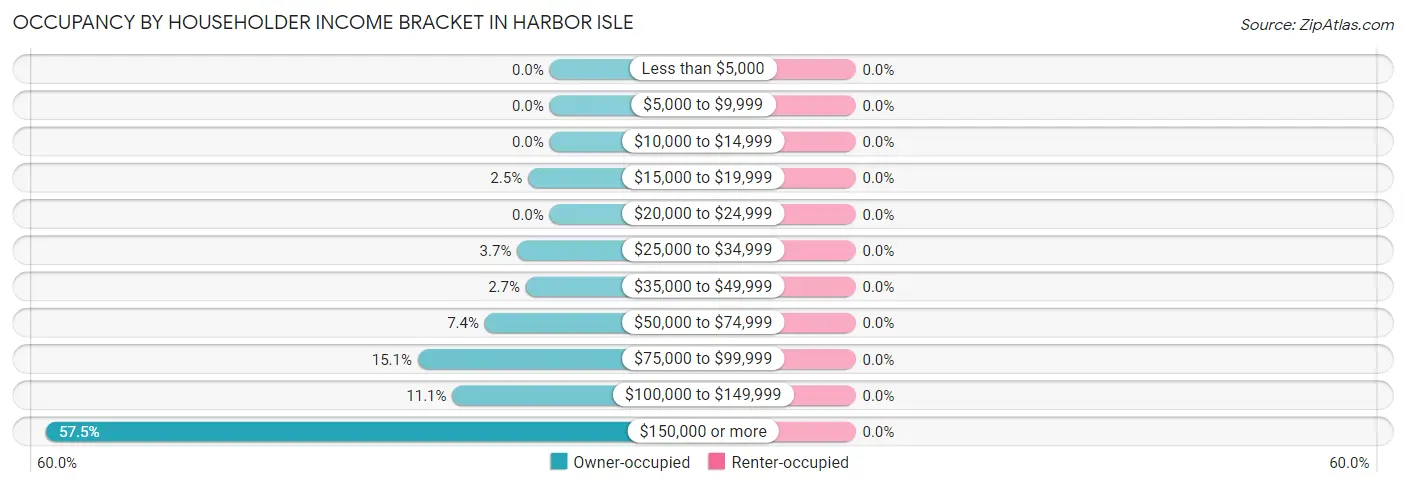
| Income Bracket | Owner-occupied | Renter-occupied |
| Less than $5,000 | 0 (0.0%) | 0 (0.0%) |
| $5,000 to $9,999 | 0 (0.0%) | 0 (0.0%) |
| $10,000 to $14,999 | 0 (0.0%) | 0 (0.0%) |
| $15,000 to $19,999 | 10 (2.5%) | 0 (0.0%) |
| $20,000 to $24,999 | 0 (0.0%) | 0 (0.0%) |
| $25,000 to $34,999 | 15 (3.7%) | 0 (0.0%) |
| $35,000 to $49,999 | 11 (2.7%) | 0 (0.0%) |
| $50,000 to $74,999 | 30 (7.4%) | 0 (0.0%) |
| $75,000 to $99,999 | 61 (15.1%) | 0 (0.0%) |
| $100,000 to $149,999 | 45 (11.1%) | 0 (0.0%) |
| $150,000 or more | 233 (57.5%) | 0 (0.0%) |
| Total | 405 (100.0%) | 0 (0.0%) |
Monthly Housing Cost Tiers in Harbor Isle
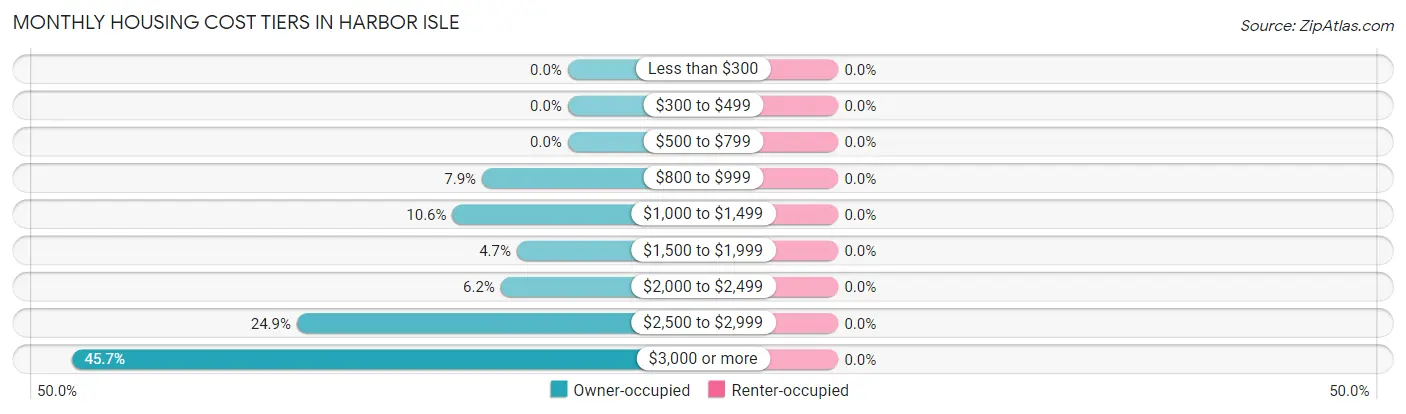
| Monthly Cost | Owner-occupied | Renter-occupied |
| Less than $300 | 0 (0.0%) | 0 (0.0%) |
| $300 to $499 | 0 (0.0%) | 0 (0.0%) |
| $500 to $799 | 0 (0.0%) | 0 (0.0%) |
| $800 to $999 | 32 (7.9%) | 0 (0.0%) |
| $1,000 to $1,499 | 43 (10.6%) | 0 (0.0%) |
| $1,500 to $1,999 | 19 (4.7%) | 0 (0.0%) |
| $2,000 to $2,499 | 25 (6.2%) | 0 (0.0%) |
| $2,500 to $2,999 | 101 (24.9%) | 0 (0.0%) |
| $3,000 or more | 185 (45.7%) | 0 (0.0%) |
| Total | 405 (100.0%) | 0 (0.0%) |
Physical Housing Characteristics in Harbor Isle
Housing Structures in Harbor Isle
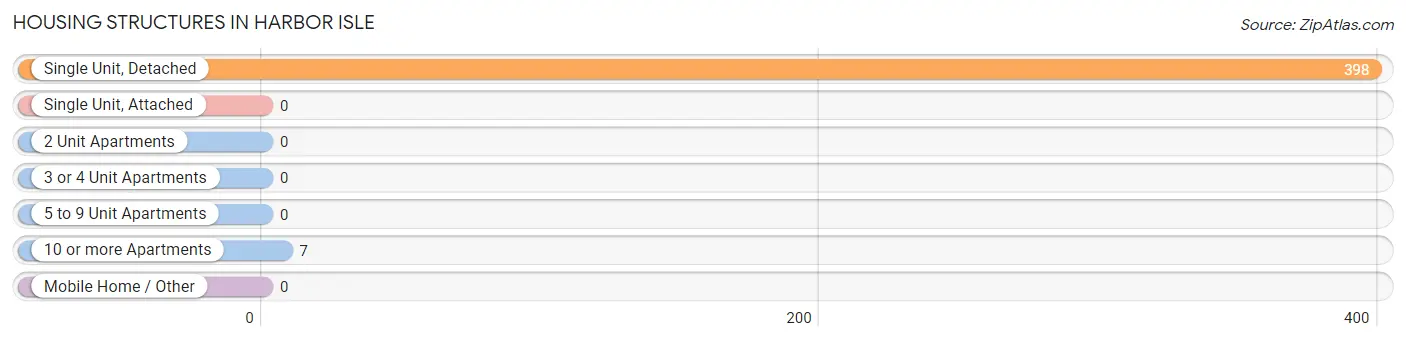
| Structure Type | # Housing Units | % Housing Units |
| Single Unit, Detached | 398 | 98.3% |
| Single Unit, Attached | 0 | 0.0% |
| 2 Unit Apartments | 0 | 0.0% |
| 3 or 4 Unit Apartments | 0 | 0.0% |
| 5 to 9 Unit Apartments | 0 | 0.0% |
| 10 or more Apartments | 7 | 1.7% |
| Mobile Home / Other | 0 | 0.0% |
| Total | 405 | 100.0% |
Housing Structures by Occupancy in Harbor Isle
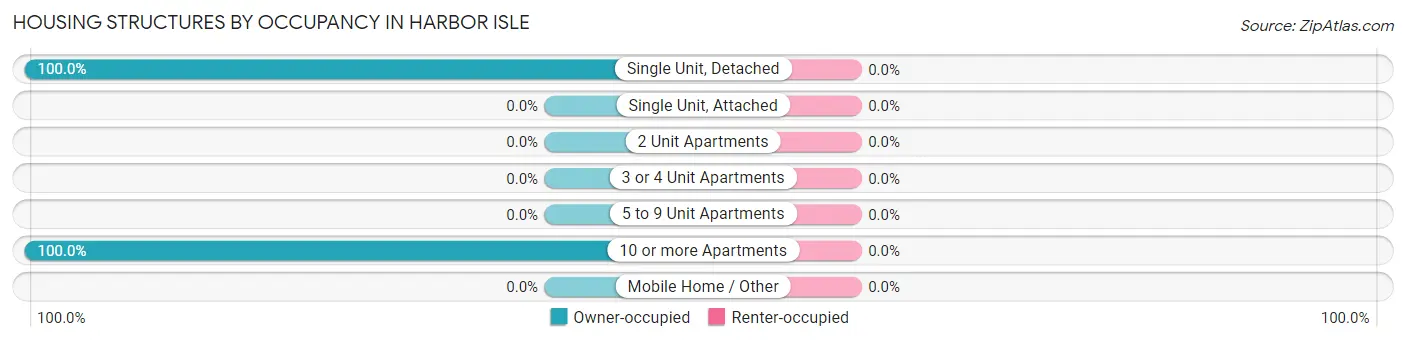
| Structure Type | Owner-occupied | Renter-occupied |
| Single Unit, Detached | 398 (100.0%) | 0 (0.0%) |
| Single Unit, Attached | 0 (0.0%) | 0 (0.0%) |
| 2 Unit Apartments | 0 (0.0%) | 0 (0.0%) |
| 3 or 4 Unit Apartments | 0 (0.0%) | 0 (0.0%) |
| 5 to 9 Unit Apartments | 0 (0.0%) | 0 (0.0%) |
| 10 or more Apartments | 7 (100.0%) | 0 (0.0%) |
| Mobile Home / Other | 0 (0.0%) | 0 (0.0%) |
| Total | 405 (100.0%) | 0 (0.0%) |
Housing Structures by Number of Rooms in Harbor Isle
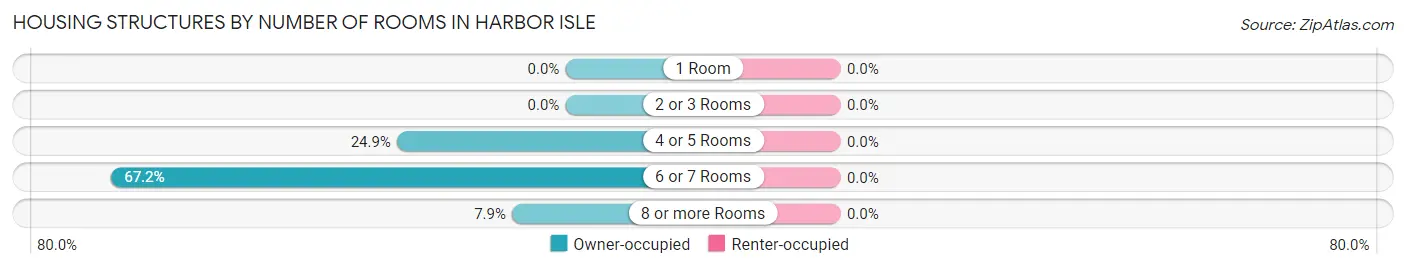
| Number of Rooms | Owner-occupied | Renter-occupied |
| 1 Room | 0 (0.0%) | 0 (0.0%) |
| 2 or 3 Rooms | 0 (0.0%) | 0 (0.0%) |
| 4 or 5 Rooms | 101 (24.9%) | 0 (0.0%) |
| 6 or 7 Rooms | 272 (67.2%) | 0 (0.0%) |
| 8 or more Rooms | 32 (7.9%) | 0 (0.0%) |
| Total | 405 (100.0%) | 0 (0.0%) |
Housing Structure by Heating Type in Harbor Isle
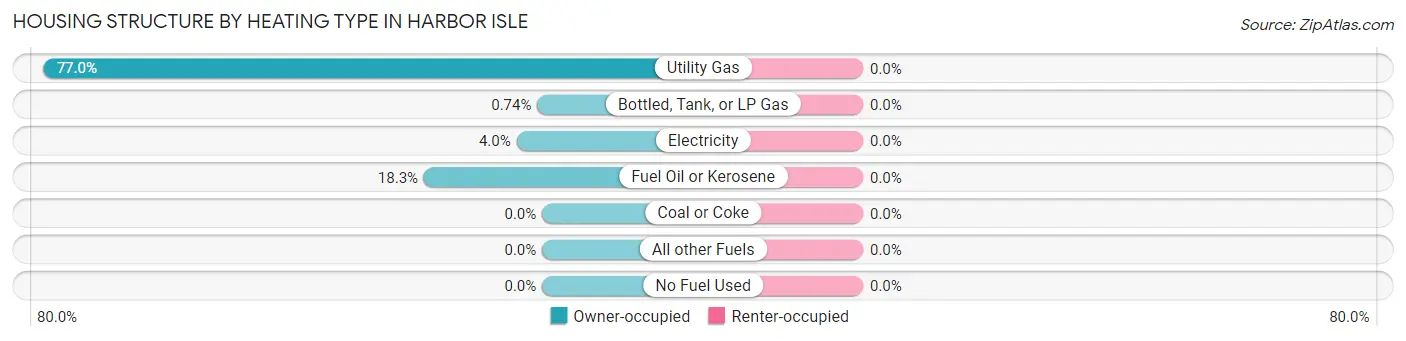
| Heating Type | Owner-occupied | Renter-occupied |
| Utility Gas | 312 (77.0%) | 0 (0.0%) |
| Bottled, Tank, or LP Gas | 3 (0.7%) | 0 (0.0%) |
| Electricity | 16 (4.0%) | 0 (0.0%) |
| Fuel Oil or Kerosene | 74 (18.3%) | 0 (0.0%) |
| Coal or Coke | 0 (0.0%) | 0 (0.0%) |
| All other Fuels | 0 (0.0%) | 0 (0.0%) |
| No Fuel Used | 0 (0.0%) | 0 (0.0%) |
| Total | 405 (100.0%) | 0 (0.0%) |
Household Vehicle Usage in Harbor Isle
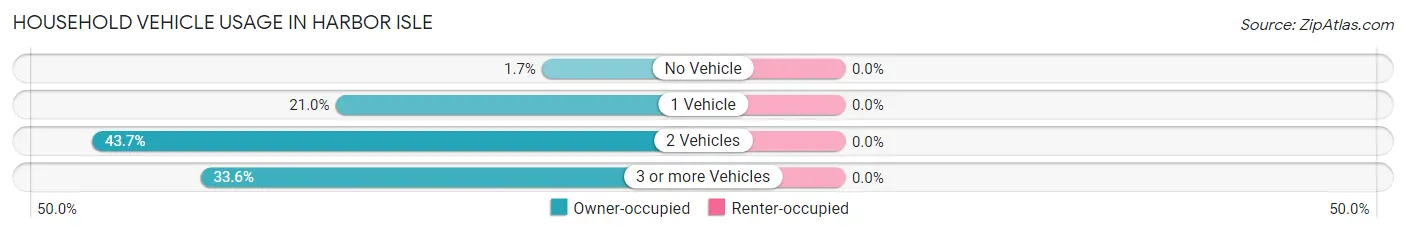
| Vehicles per Household | Owner-occupied | Renter-occupied |
| No Vehicle | 7 (1.7%) | 0 (0.0%) |
| 1 Vehicle | 85 (21.0%) | 0 (0.0%) |
| 2 Vehicles | 177 (43.7%) | 0 (0.0%) |
| 3 or more Vehicles | 136 (33.6%) | 0 (0.0%) |
| Total | 405 (100.0%) | 0 (0.0%) |
Real Estate & Mortgages in Harbor Isle
Real Estate and Mortgage Overview in Harbor Isle
| Characteristic | Without Mortgage | With Mortgage |
| Housing Units | 116 | 289 |
| Median Property Value | $548,600 | $612,900 |
| Median Household Income | $81,500 | $194 |
| Monthly Housing Costs | $1,320 | $173 |
| Real Estate Taxes | $7,805 | $0 |
Property Value by Mortgage Status in Harbor Isle
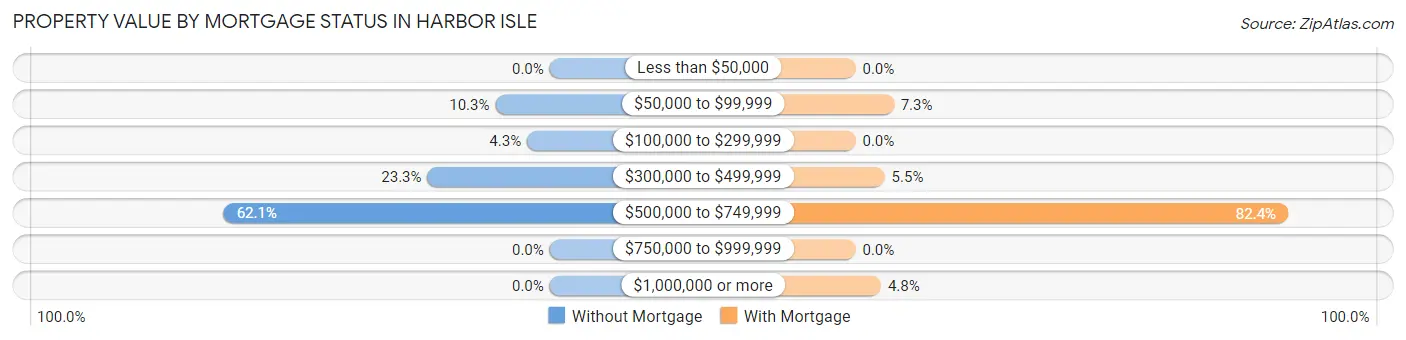
| Property Value | Without Mortgage | With Mortgage |
| Less than $50,000 | 0 (0.0%) | 0 (0.0%) |
| $50,000 to $99,999 | 12 (10.3%) | 21 (7.3%) |
| $100,000 to $299,999 | 5 (4.3%) | 0 (0.0%) |
| $300,000 to $499,999 | 27 (23.3%) | 16 (5.5%) |
| $500,000 to $749,999 | 72 (62.1%) | 238 (82.4%) |
| $750,000 to $999,999 | 0 (0.0%) | 0 (0.0%) |
| $1,000,000 or more | 0 (0.0%) | 14 (4.8%) |
| Total | 116 (100.0%) | 289 (100.0%) |
Household Income by Mortgage Status in Harbor Isle
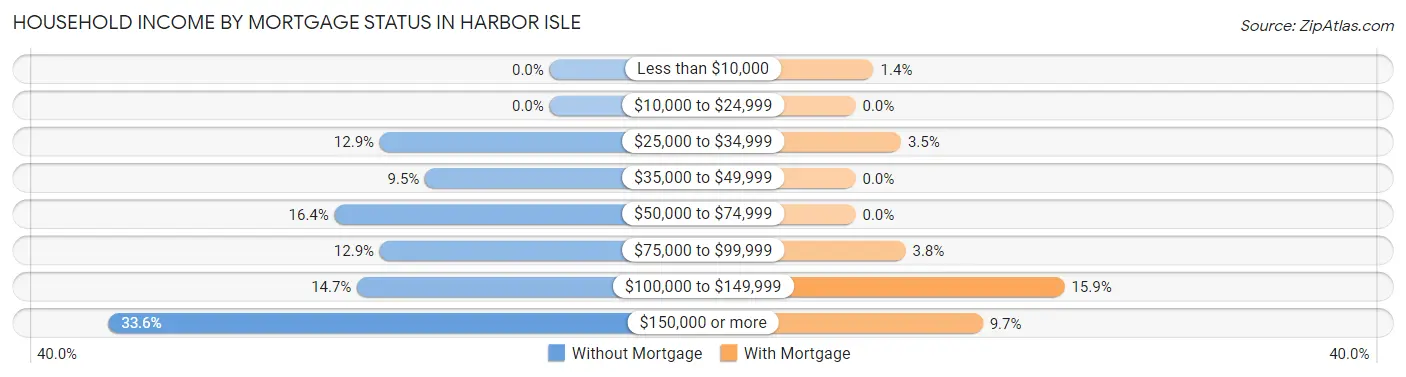
| Household Income | Without Mortgage | With Mortgage |
| Less than $10,000 | 0 (0.0%) | 4 (1.4%) |
| $10,000 to $24,999 | 0 (0.0%) | 0 (0.0%) |
| $25,000 to $34,999 | 15 (12.9%) | 10 (3.5%) |
| $35,000 to $49,999 | 11 (9.5%) | 0 (0.0%) |
| $50,000 to $74,999 | 19 (16.4%) | 0 (0.0%) |
| $75,000 to $99,999 | 15 (12.9%) | 11 (3.8%) |
| $100,000 to $149,999 | 17 (14.7%) | 46 (15.9%) |
| $150,000 or more | 39 (33.6%) | 28 (9.7%) |
| Total | 116 (100.0%) | 289 (100.0%) |
Property Value to Household Income Ratio in Harbor Isle
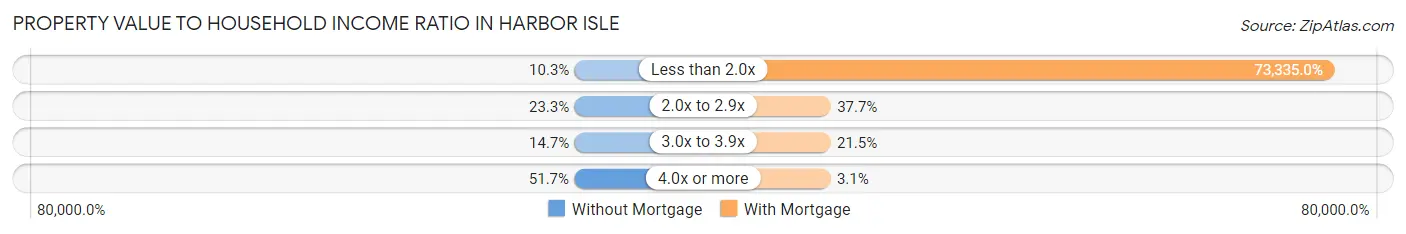
| Value-to-Income Ratio | Without Mortgage | With Mortgage |
| Less than 2.0x | 12 (10.3%) | 211,938 (73,335.0%) |
| 2.0x to 2.9x | 27 (23.3%) | 109 (37.7%) |
| 3.0x to 3.9x | 17 (14.7%) | 62 (21.4%) |
| 4.0x or more | 60 (51.7%) | 9 (3.1%) |
| Total | 116 (100.0%) | 289 (100.0%) |
Real Estate Taxes by Mortgage Status in Harbor Isle
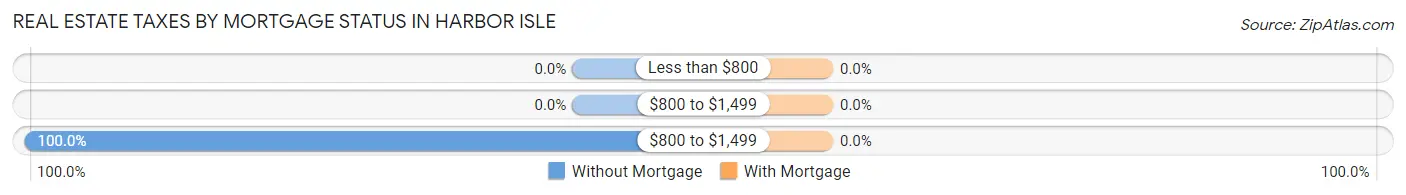
| Property Taxes | Without Mortgage | With Mortgage |
| Less than $800 | 0 (0.0%) | 0 (0.0%) |
| $800 to $1,499 | 0 (0.0%) | 0 (0.0%) |
| $800 to $1,499 | 116 (100.0%) | 0 (0.0%) |
| Total | 116 (100.0%) | 289 (100.0%) |
Health & Disability in Harbor Isle
Health Insurance Coverage by Age in Harbor Isle
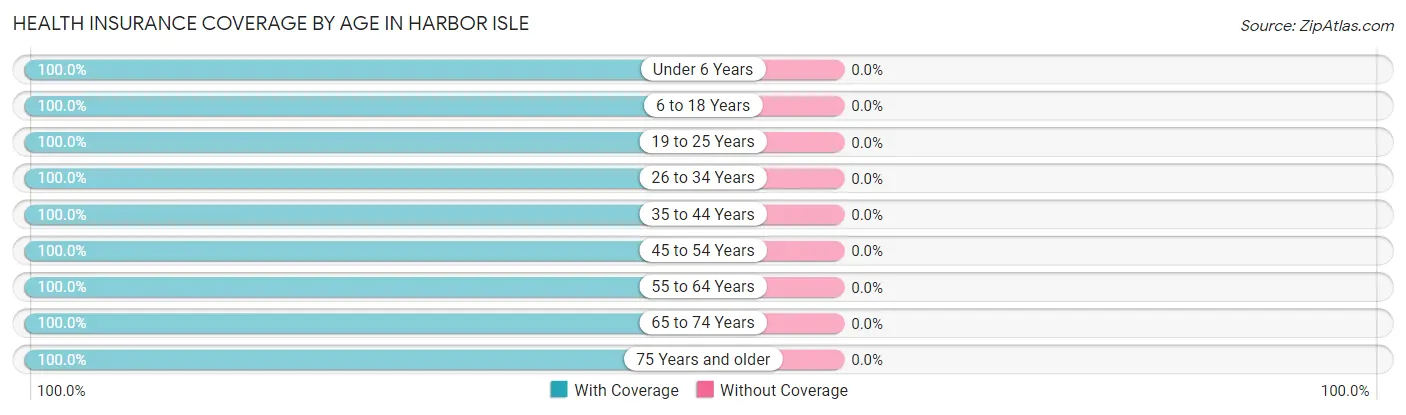
| Age Bracket | With Coverage | Without Coverage |
| Under 6 Years | 132 (100.0%) | 0 (0.0%) |
| 6 to 18 Years | 171 (100.0%) | 0 (0.0%) |
| 19 to 25 Years | 113 (100.0%) | 0 (0.0%) |
| 26 to 34 Years | 192 (100.0%) | 0 (0.0%) |
| 35 to 44 Years | 62 (100.0%) | 0 (0.0%) |
| 45 to 54 Years | 206 (100.0%) | 0 (0.0%) |
| 55 to 64 Years | 223 (100.0%) | 0 (0.0%) |
| 65 to 74 Years | 220 (100.0%) | 0 (0.0%) |
| 75 Years and older | 41 (100.0%) | 0 (0.0%) |
| Total | 1,360 (100.0%) | 0 (0.0%) |
Health Insurance Coverage by Citizenship Status in Harbor Isle
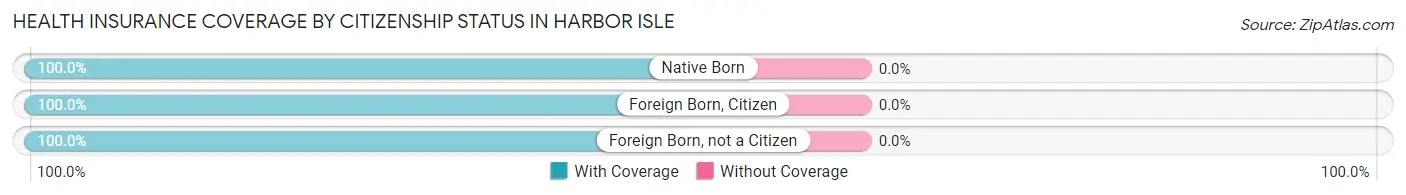
| Citizenship Status | With Coverage | Without Coverage |
| Native Born | 132 (100.0%) | 0 (0.0%) |
| Foreign Born, Citizen | 171 (100.0%) | 0 (0.0%) |
| Foreign Born, not a Citizen | 113 (100.0%) | 0 (0.0%) |
Health Insurance Coverage by Household Income in Harbor Isle
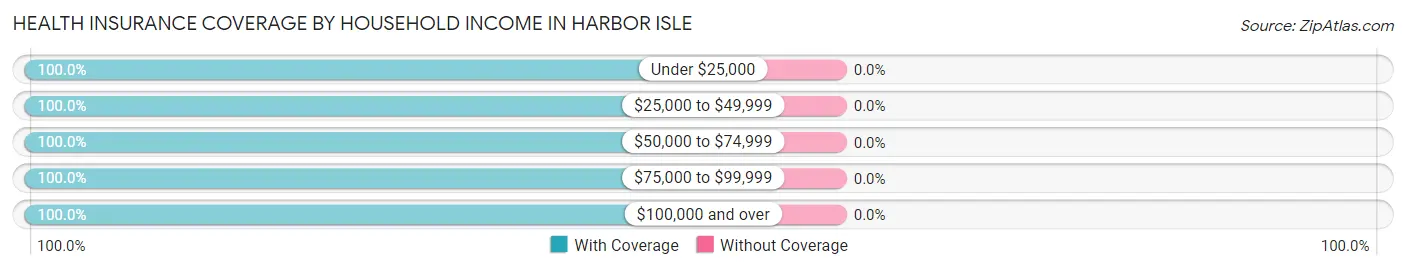
| Household Income | With Coverage | Without Coverage |
| Under $25,000 | 10 (100.0%) | 0 (0.0%) |
| $25,000 to $49,999 | 26 (100.0%) | 0 (0.0%) |
| $50,000 to $74,999 | 47 (100.0%) | 0 (0.0%) |
| $75,000 to $99,999 | 224 (100.0%) | 0 (0.0%) |
| $100,000 and over | 1,053 (100.0%) | 0 (0.0%) |
Public vs Private Health Insurance Coverage by Age in Harbor Isle
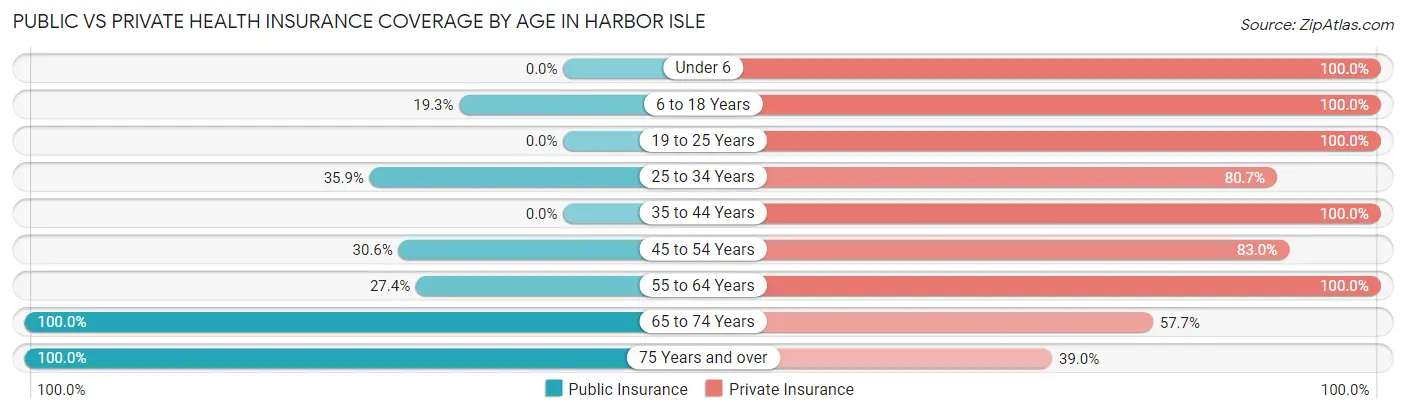
| Age Bracket | Public Insurance | Private Insurance |
| Under 6 | 0 (0.0%) | 132 (100.0%) |
| 6 to 18 Years | 33 (19.3%) | 171 (100.0%) |
| 19 to 25 Years | 0 (0.0%) | 113 (100.0%) |
| 25 to 34 Years | 69 (35.9%) | 155 (80.7%) |
| 35 to 44 Years | 0 (0.0%) | 62 (100.0%) |
| 45 to 54 Years | 63 (30.6%) | 171 (83.0%) |
| 55 to 64 Years | 61 (27.4%) | 223 (100.0%) |
| 65 to 74 Years | 220 (100.0%) | 127 (57.7%) |
| 75 Years and over | 41 (100.0%) | 16 (39.0%) |
| Total | 487 (35.8%) | 1,170 (86.0%) |
Disability Status by Sex by Age in Harbor Isle
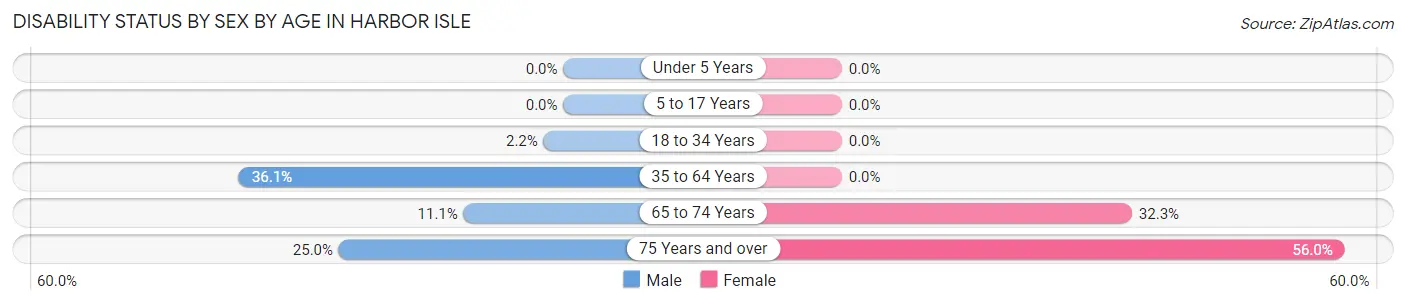
| Age Bracket | Male | Female |
| Under 5 Years | 0 (0.0%) | 0 (0.0%) |
| 5 to 17 Years | 0 (0.0%) | 0 (0.0%) |
| 18 to 34 Years | 4 (2.2%) | 0 (0.0%) |
| 35 to 64 Years | 99 (36.1%) | 0 (0.0%) |
| 65 to 74 Years | 10 (11.1%) | 42 (32.3%) |
| 75 Years and over | 4 (25.0%) | 14 (56.0%) |
Disability Class by Sex by Age in Harbor Isle
Disability Class: Hearing Difficulty
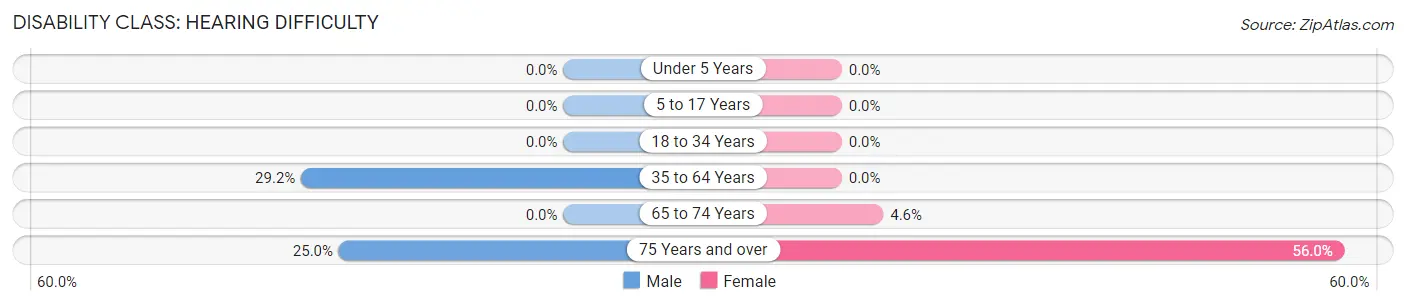
| Age Bracket | Male | Female |
| Under 5 Years | 0 (0.0%) | 0 (0.0%) |
| 5 to 17 Years | 0 (0.0%) | 0 (0.0%) |
| 18 to 34 Years | 0 (0.0%) | 0 (0.0%) |
| 35 to 64 Years | 80 (29.2%) | 0 (0.0%) |
| 65 to 74 Years | 0 (0.0%) | 6 (4.6%) |
| 75 Years and over | 4 (25.0%) | 14 (56.0%) |
Disability Class: Vision Difficulty
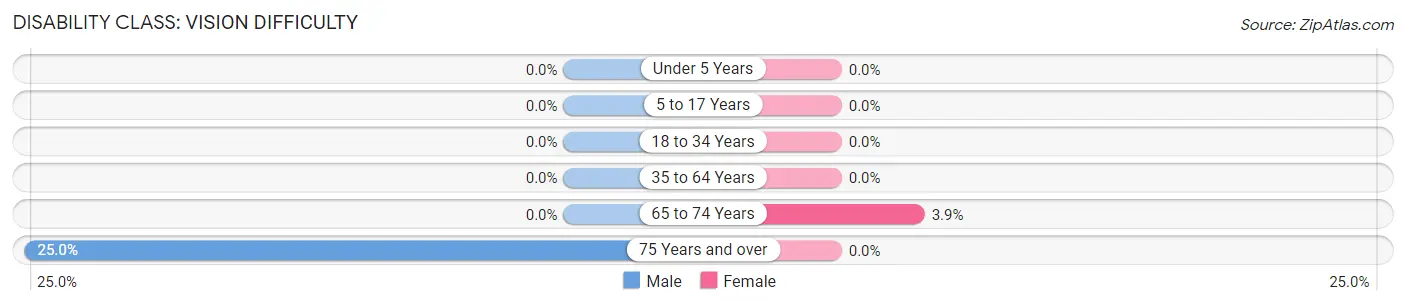
| Age Bracket | Male | Female |
| Under 5 Years | 0 (0.0%) | 0 (0.0%) |
| 5 to 17 Years | 0 (0.0%) | 0 (0.0%) |
| 18 to 34 Years | 0 (0.0%) | 0 (0.0%) |
| 35 to 64 Years | 0 (0.0%) | 0 (0.0%) |
| 65 to 74 Years | 0 (0.0%) | 5 (3.8%) |
| 75 Years and over | 4 (25.0%) | 0 (0.0%) |
Disability Class: Cognitive Difficulty
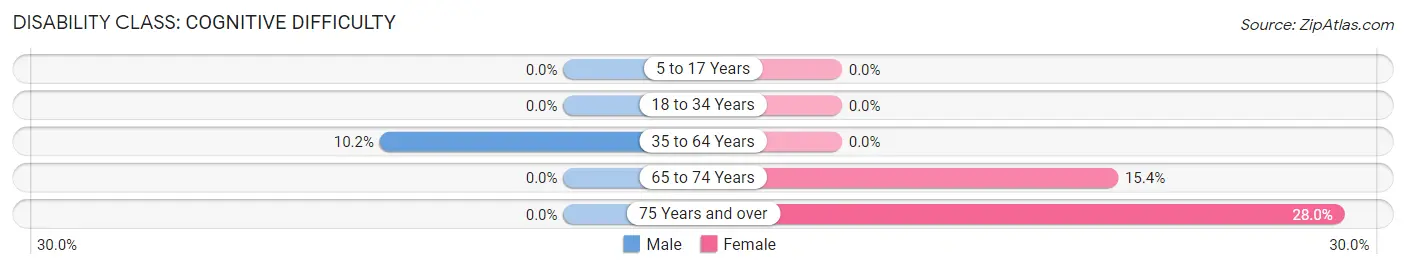
| Age Bracket | Male | Female |
| 5 to 17 Years | 0 (0.0%) | 0 (0.0%) |
| 18 to 34 Years | 0 (0.0%) | 0 (0.0%) |
| 35 to 64 Years | 28 (10.2%) | 0 (0.0%) |
| 65 to 74 Years | 0 (0.0%) | 20 (15.4%) |
| 75 Years and over | 0 (0.0%) | 7 (28.0%) |
Disability Class: Ambulatory Difficulty
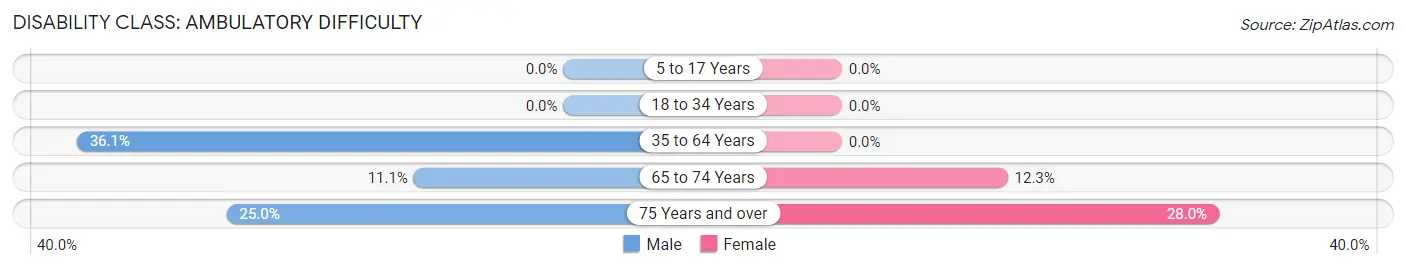
| Age Bracket | Male | Female |
| 5 to 17 Years | 0 (0.0%) | 0 (0.0%) |
| 18 to 34 Years | 0 (0.0%) | 0 (0.0%) |
| 35 to 64 Years | 99 (36.1%) | 0 (0.0%) |
| 65 to 74 Years | 10 (11.1%) | 16 (12.3%) |
| 75 Years and over | 4 (25.0%) | 7 (28.0%) |
Disability Class: Self-Care Difficulty
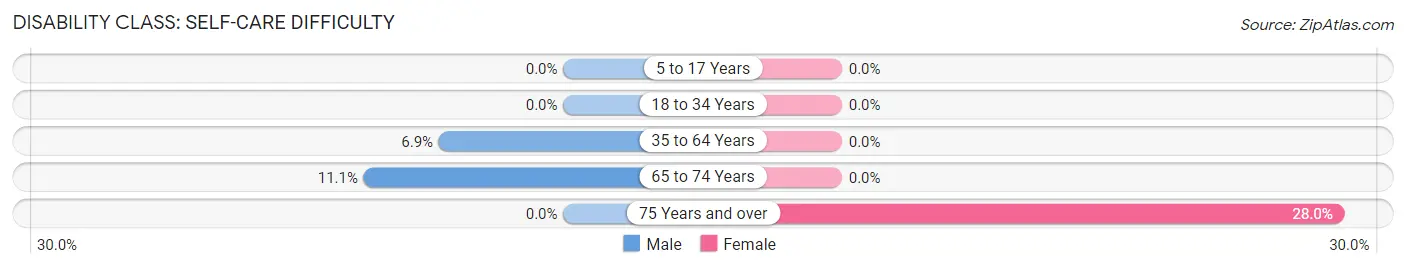
| Age Bracket | Male | Female |
| 5 to 17 Years | 0 (0.0%) | 0 (0.0%) |
| 18 to 34 Years | 0 (0.0%) | 0 (0.0%) |
| 35 to 64 Years | 19 (6.9%) | 0 (0.0%) |
| 65 to 74 Years | 10 (11.1%) | 0 (0.0%) |
| 75 Years and over | 0 (0.0%) | 7 (28.0%) |
Technology Access in Harbor Isle
Computing Device Access in Harbor Isle
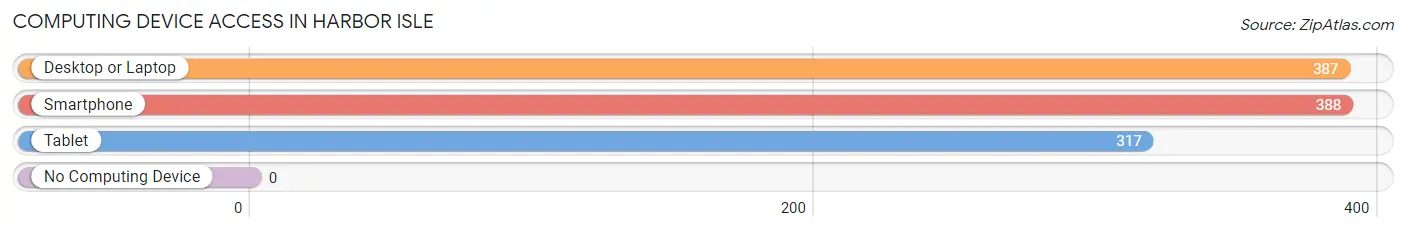
| Device Type | # Households | % Households |
| Desktop or Laptop | 387 | 95.6% |
| Smartphone | 388 | 95.8% |
| Tablet | 317 | 78.3% |
| No Computing Device | 0 | 0.0% |
| Total | 405 | 100.0% |
Internet Access in Harbor Isle
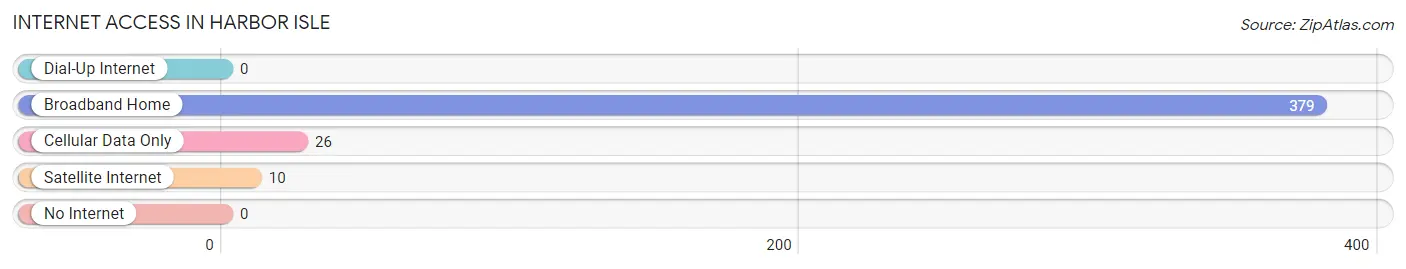
| Internet Type | # Households | % Households |
| Dial-Up Internet | 0 | 0.0% |
| Broadband Home | 379 | 93.6% |
| Cellular Data Only | 26 | 6.4% |
| Satellite Internet | 10 | 2.5% |
| No Internet | 0 | 0.0% |
| Total | 405 | 100.0% |
Harbor Isle Summary
Harbor Isle is a small hamlet located in the Town of Brookhaven in Suffolk County, New York. It is situated on the north shore of Long Island, approximately 60 miles east of New York City. The hamlet is bordered by the Great South Bay to the north, the hamlet of East Patchogue to the east, and the hamlet of Bellport to the south.
History
Harbor Isle was originally inhabited by the Secatogue Indians, a sub-tribe of the Montaukett Indians. The Secatogue Indians were a peaceful tribe that lived off the land and the waters of the Great South Bay. The first European settlers arrived in the area in the late 1600s. The hamlet was originally known as “Old Field” and was part of the Town of Brookhaven. In the late 1800s, the area was renamed “Harbor Isle” after the nearby harbor.
In the early 1900s, the hamlet began to develop as a summer resort community. The area was known for its beautiful beaches and fishing. In the 1920s, the area was home to several large hotels and resorts. The area was also home to a number of small businesses, including a general store, a post office, and a movie theater.
In the 1950s, the area began to decline as a resort destination. Many of the hotels and resorts closed and the area became a quiet residential community. In the 1970s, the area began to experience a resurgence as a popular summer destination. The area is now home to a number of small businesses, including restaurants, shops, and marinas.
Geography
Harbor Isle is located on the north shore of Long Island, approximately 60 miles east of New York City. The hamlet is bordered by the Great South Bay to the north, the hamlet of East Patchogue to the east, and the hamlet of Bellport to the south. The hamlet is located on a peninsula, with the Great South Bay to the north and the Patchogue River to the south.
The area is mostly flat, with some low hills in the western part of the hamlet. The area is home to several small parks, including the Harbor Isle Park and the Harbor Isle Nature Preserve. The area is also home to several marinas, including the Harbor Isle Marina and the Bellport Marina.
Economy
The economy of Harbor Isle is largely based on tourism and recreation. The area is home to several small businesses, including restaurants, shops, and marinas. The area is also home to a number of small businesses that cater to the summer tourist season, including ice cream shops, souvenir shops, and boat rental companies.
The area is also home to a number of small manufacturing companies, including a boat manufacturing company and a furniture manufacturing company. The area is also home to a number of small farms, including a vegetable farm and a dairy farm.
Demographics
As of the 2010 census, the population of Harbor Isle was 2,845. The population is largely white (90.2%), with small percentages of African American (3.2%), Asian (2.2%), and Hispanic (2.2%) residents. The median household income is $77,917, and the median home value is $400,000. The area is largely residential, with a small number of businesses.
Common Questions
What is Per Capita Income in Harbor Isle?
Per Capita income in Harbor Isle is $58,076.
What is the Median Family Income in Harbor Isle?
Median Family Income in Harbor Isle is $197,300.
What is the Median Household income in Harbor Isle?
Median Household Income in Harbor Isle is $170,694.
What is Income or Wage Gap in Harbor Isle?
Income or Wage Gap in Harbor Isle is 19.3%.
Women in Harbor Isle earn 80.7 cents for every dollar earned by a man.
What is Inequality or Gini Index in Harbor Isle?
Inequality or Gini Index in Harbor Isle is 0.36.
What is the Total Population of Harbor Isle?
Total Population of Harbor Isle is 1,360.
What is the Total Male Population of Harbor Isle?
Total Male Population of Harbor Isle is 747.
What is the Total Female Population of Harbor Isle?
Total Female Population of Harbor Isle is 613.
What is the Ratio of Males per 100 Females in Harbor Isle?
There are 121.86 Males per 100 Females in Harbor Isle.
What is the Ratio of Females per 100 Males in Harbor Isle?
There are 82.06 Females per 100 Males in Harbor Isle.
What is the Median Population Age in Harbor Isle?
Median Population Age in Harbor Isle is 45.3 Years.
What is the Average Family Size in Harbor Isle
Average Family Size in Harbor Isle is 3.6 People.
What is the Average Household Size in Harbor Isle
Average Household Size in Harbor Isle is 3.4 People.
How Large is the Labor Force in Harbor Isle?
There are 736 People in the Labor Forcein in Harbor Isle.
What is the Percentage of People in the Labor Force in Harbor Isle?
66.4% of People are in the Labor Force in Harbor Isle.
What is the Unemployment Rate in Harbor Isle?
Unemployment Rate in Harbor Isle is 3.4%.