Wainscott, NY Map & Demographics
Wainscott Map
Wainscott Overview
$126,952
PER CAPITA INCOME
$250,001
AVG FAMILY INCOME
$172,500
AVG HOUSEHOLD INCOME
0.53
INEQUALITY / GINI INDEX
585
TOTAL POPULATION
321
MALE POPULATION
264
FEMALE POPULATION
121.59
MALES / 100 FEMALES
82.24
FEMALES / 100 MALES
59.6
MEDIAN AGE
2.2
AVG FAMILY SIZE
1.9
AVG HOUSEHOLD SIZE
311
LABOR FORCE [ PEOPLE ]
56.0%
PERCENT IN LABOR FORCE
5.5%
UNEMPLOYMENT RATE
Wainscott Zip Codes
Wainscott Area Codes
Income in Wainscott
Income Overview in Wainscott
Per Capita Income in Wainscott is $126,952, while median incomes of families and households are $250,001 and $172,500 respectively.
| Characteristic | Number | Measure |
| Per Capita Income | 585 | $126,952 |
| Median Family Income | 158 | $250,001 |
| Mean Family Income | 158 | $459,039 |
| Median Household Income | 296 | $172,500 |
| Mean Household Income | 296 | $307,122 |
| Income Deficit | 158 | $0 |
| Wage / Income Gap (%) | 585 | 0.00% |
| Wage / Income Gap ($) | 585 | 100.00¢ per $1 |
| Gini / Inequality Index | 585 | 0.53 |
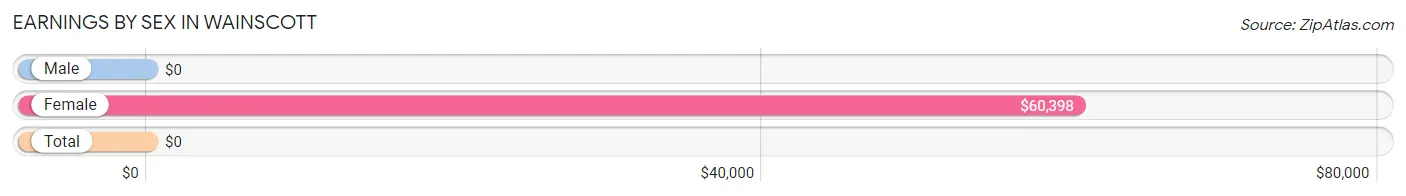
Earnings by Sex in Wainscott
| Sex | Number | Average Earnings |
| Male | 193 (60.7%) | $0 |
| Female | 125 (39.3%) | $60,398 |
| Total | 318 (100.0%) | $0 |
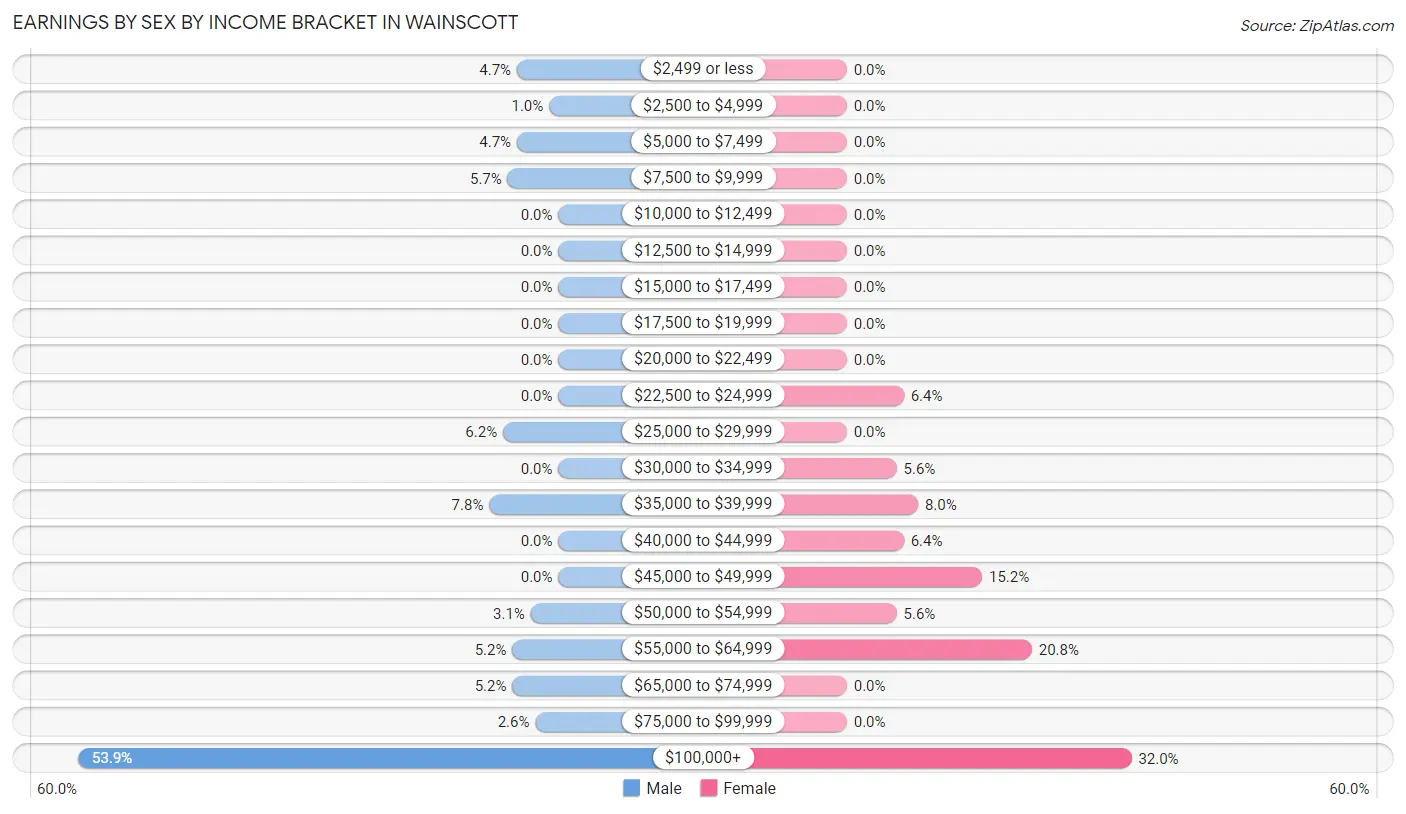
Earnings by Sex by Income Bracket in Wainscott
The most common earnings brackets in Wainscott are $100,000+ for men (104 | 53.9%) and $100,000+ for women (40 | 32.0%).
| Income | Male | Female |
| $2,499 or less | 9 (4.7%) | 0 (0.0%) |
| $2,500 to $4,999 | 2 (1.0%) | 0 (0.0%) |
| $5,000 to $7,499 | 9 (4.7%) | 0 (0.0%) |
| $7,500 to $9,999 | 11 (5.7%) | 0 (0.0%) |
| $10,000 to $12,499 | 0 (0.0%) | 0 (0.0%) |
| $12,500 to $14,999 | 0 (0.0%) | 0 (0.0%) |
| $15,000 to $17,499 | 0 (0.0%) | 0 (0.0%) |
| $17,500 to $19,999 | 0 (0.0%) | 0 (0.0%) |
| $20,000 to $22,499 | 0 (0.0%) | 0 (0.0%) |
| $22,500 to $24,999 | 0 (0.0%) | 8 (6.4%) |
| $25,000 to $29,999 | 12 (6.2%) | 0 (0.0%) |
| $30,000 to $34,999 | 0 (0.0%) | 7 (5.6%) |
| $35,000 to $39,999 | 15 (7.8%) | 10 (8.0%) |
| $40,000 to $44,999 | 0 (0.0%) | 8 (6.4%) |
| $45,000 to $49,999 | 0 (0.0%) | 19 (15.2%) |
| $50,000 to $54,999 | 6 (3.1%) | 7 (5.6%) |
| $55,000 to $64,999 | 10 (5.2%) | 26 (20.8%) |
| $65,000 to $74,999 | 10 (5.2%) | 0 (0.0%) |
| $75,000 to $99,999 | 5 (2.6%) | 0 (0.0%) |
| $100,000+ | 104 (53.9%) | 40 (32.0%) |
| Total | 193 (100.0%) | 125 (100.0%) |
Earnings by Sex by Educational Attainment in Wainscott
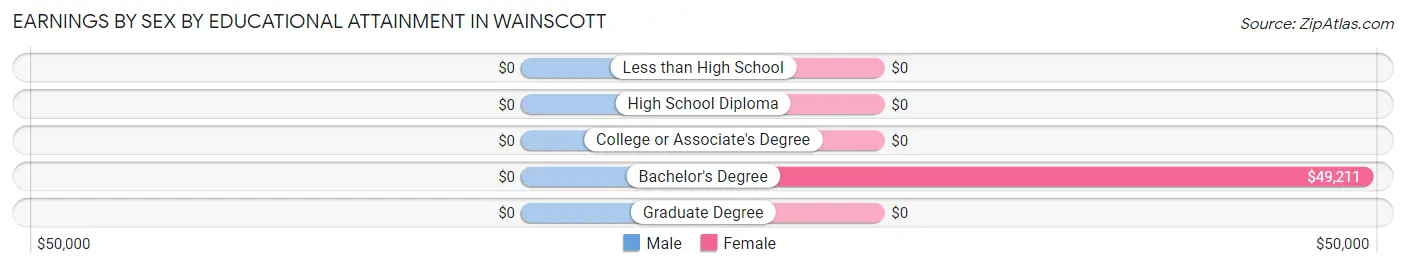
| Educational Attainment | Male Income | Female Income |
| Less than High School | - | - |
| High School Diploma | - | - |
| College or Associate's Degree | - | - |
| Bachelor's Degree | - | - |
| Graduate Degree | - | - |
| Total | $135,313 | $60,795 |
Family Income in Wainscott
Family Income Brackets in Wainscott
According to the Wainscott family income data, there are 109 families falling into the $200,000+ income range, which is the most common income bracket and makes up 69.0% of all families.
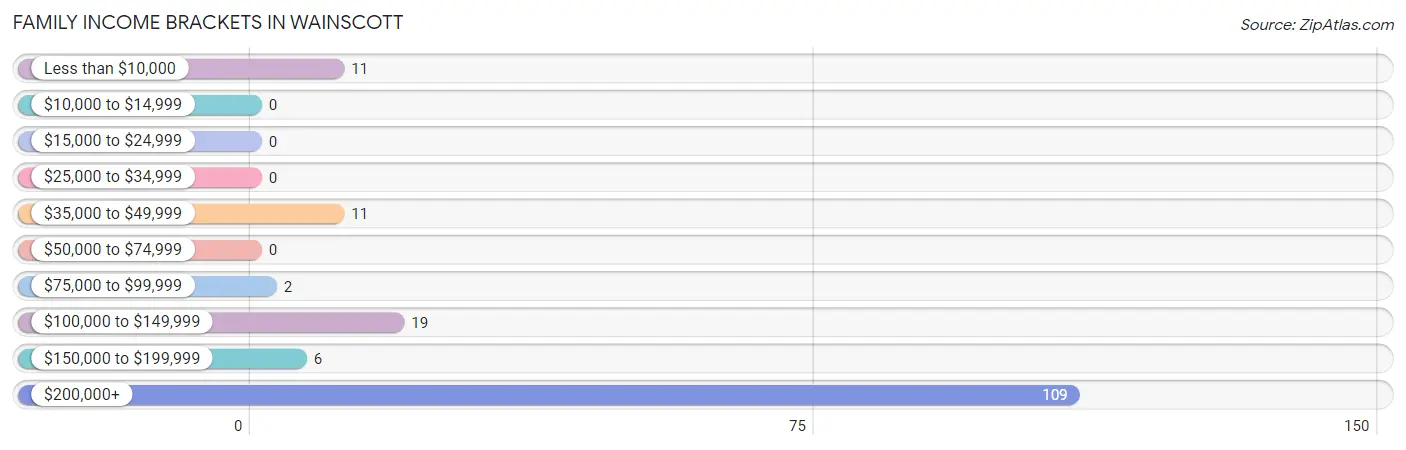
| Income Bracket | # Families | % Families |
| Less than $10,000 | 11 | 7.0% |
| $10,000 to $14,999 | 0 | 0.0% |
| $15,000 to $24,999 | 0 | 0.0% |
| $25,000 to $34,999 | 0 | 0.0% |
| $35,000 to $49,999 | 11 | 7.0% |
| $50,000 to $74,999 | 0 | 0.0% |
| $75,000 to $99,999 | 2 | 1.3% |
| $100,000 to $149,999 | 19 | 12.0% |
| $150,000 to $199,999 | 6 | 3.8% |
| $200,000+ | 109 | 69.0% |
Family Income by Famaliy Size in Wainscott
2-person families (69 | 43.7%) account for the highest median family income in Wainscott with $250,001 per family, while 2-person families (69 | 43.7%) have the highest median income of $125,000 per family member.
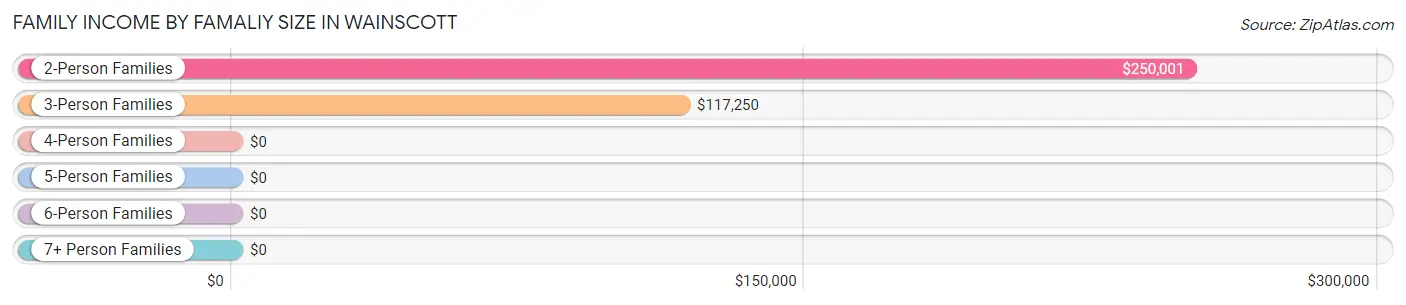
| Income Bracket | # Families | Median Income |
| 2-Person Families | 69 (43.7%) | $250,001 |
| 3-Person Families | 40 (25.3%) | $117,250 |
| 4-Person Families | 49 (31.0%) | $0 |
| 5-Person Families | 0 (0.0%) | $0 |
| 6-Person Families | 0 (0.0%) | $0 |
| 7+ Person Families | 0 (0.0%) | $0 |
| Total | 158 (100.0%) | $250,001 |
Family Income by Number of Earners in Wainscott
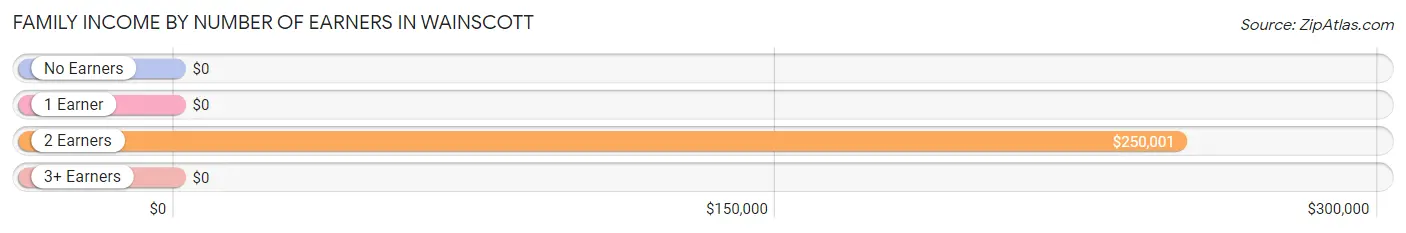
| Number of Earners | # Families | Median Income |
| No Earners | 35 (22.2%) | $0 |
| 1 Earner | 31 (19.6%) | $0 |
| 2 Earners | 82 (51.9%) | $250,001 |
| 3+ Earners | 10 (6.3%) | $0 |
| Total | 158 (100.0%) | $250,001 |
Household Income in Wainscott
Household Income Brackets in Wainscott
With 142 households falling in the category, the $200,000+ income range is the most frequent in Wainscott, accounting for 48.0% of all households.
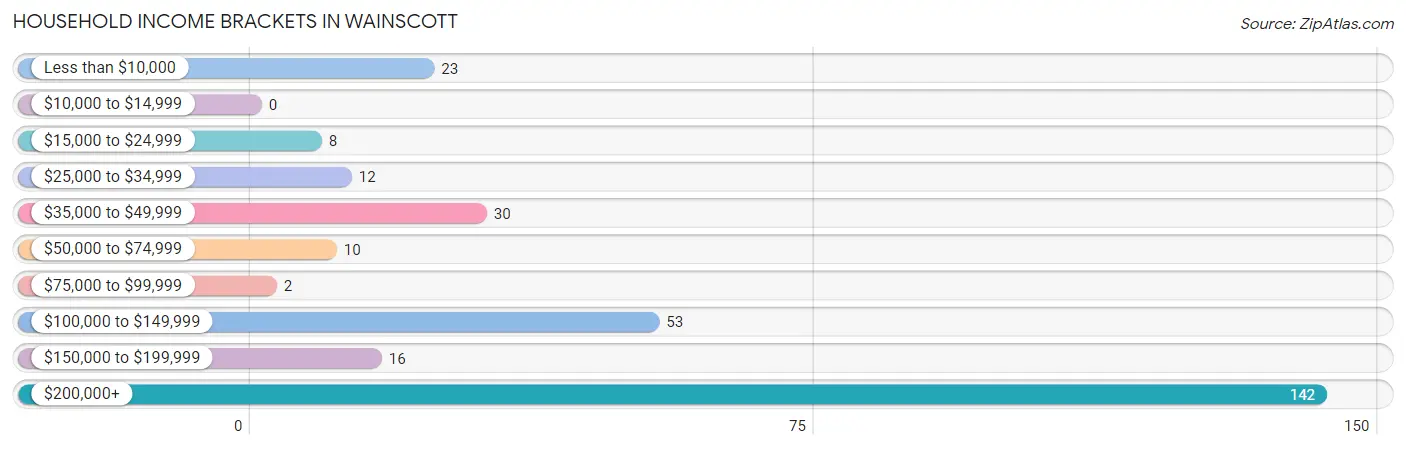
| Income Bracket | # Households | % Households |
| Less than $10,000 | 23 | 7.8% |
| $10,000 to $14,999 | 0 | 0.0% |
| $15,000 to $24,999 | 8 | 2.7% |
| $25,000 to $34,999 | 12 | 4.1% |
| $35,000 to $49,999 | 30 | 10.1% |
| $50,000 to $74,999 | 10 | 3.4% |
| $75,000 to $99,999 | 2 | 0.7% |
| $100,000 to $149,999 | 53 | 17.9% |
| $150,000 to $199,999 | 16 | 5.4% |
| $200,000+ | 142 | 48.0% |
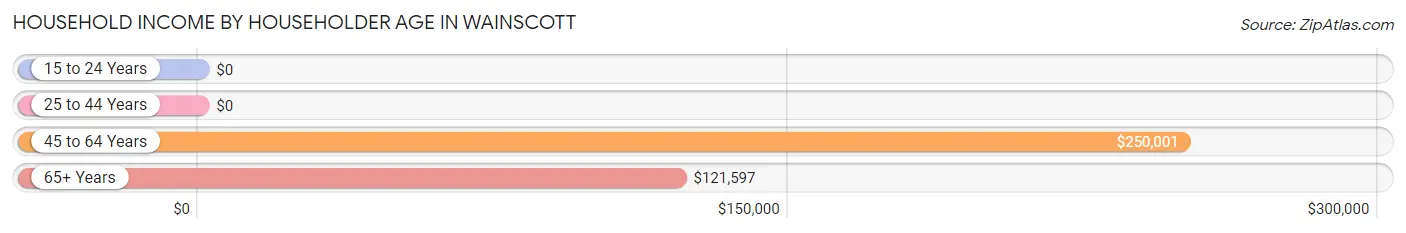
Household Income by Householder Age in Wainscott
The median household income in Wainscott is $172,500, with the highest median household income of $250,001 found in the 45 to 64 years age bracket for the primary householder. A total of 145 households (49.0%) fall into this category.
| Income Bracket | # Households | Median Income |
| 15 to 24 Years | 0 (0.0%) | $0 |
| 25 to 44 Years | 16 (5.4%) | $0 |
| 45 to 64 Years | 145 (49.0%) | $250,001 |
| 65+ Years | 135 (45.6%) | $121,597 |
| Total | 296 (100.0%) | $172,500 |
Poverty in Wainscott
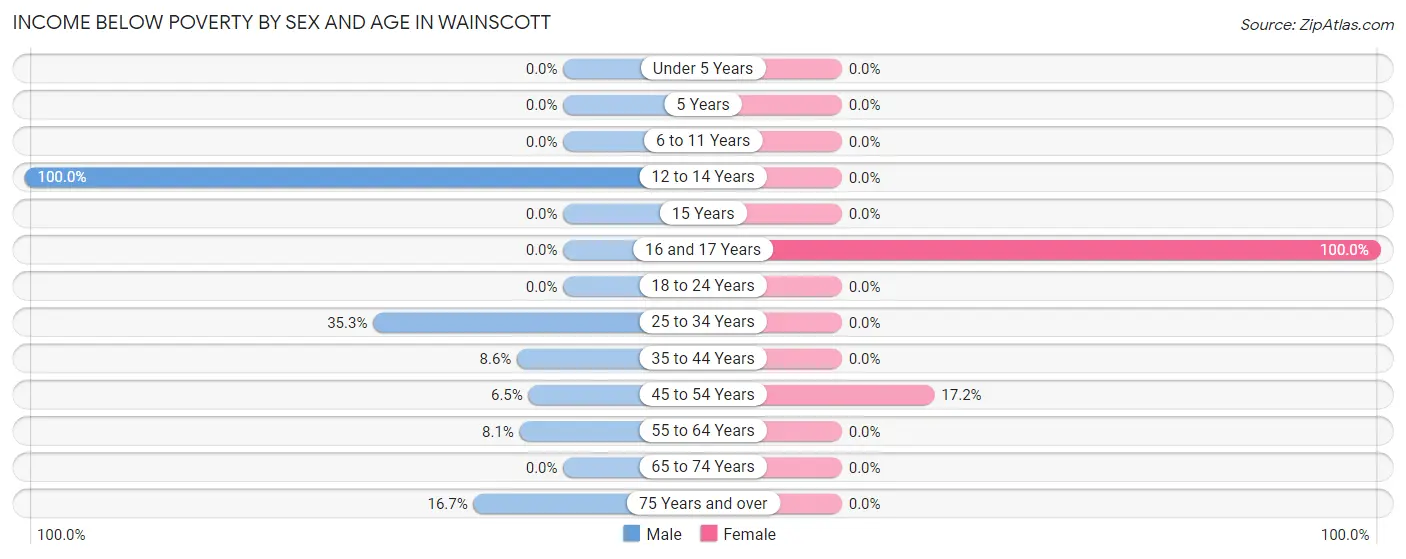
Income Below Poverty by Sex and Age in Wainscott
With 14.9% poverty level for males and 8.3% for females among the residents of Wainscott, 12 to 14 year old males and 16 and 17 year old females are the most vulnerable to poverty, with 10 males (100.0%) and 11 females (100.0%) in their respective age groups living below the poverty level.
| Age Bracket | Male | Female |
| Under 5 Years | 0 (0.0%) | 0 (0.0%) |
| 5 Years | 0 (0.0%) | 0 (0.0%) |
| 6 to 11 Years | 0 (0.0%) | 0 (0.0%) |
| 12 to 14 Years | 10 (100.0%) | 0 (0.0%) |
| 15 Years | 0 (0.0%) | 0 (0.0%) |
| 16 and 17 Years | 0 (0.0%) | 11 (100.0%) |
| 18 to 24 Years | 0 (0.0%) | 0 (0.0%) |
| 25 to 34 Years | 18 (35.3%) | 0 (0.0%) |
| 35 to 44 Years | 3 (8.6%) | 0 (0.0%) |
| 45 to 54 Years | 2 (6.5%) | 11 (17.2%) |
| 55 to 64 Years | 3 (8.1%) | 0 (0.0%) |
| 65 to 74 Years | 0 (0.0%) | 0 (0.0%) |
| 75 Years and over | 12 (16.7%) | 0 (0.0%) |
| Total | 48 (14.9%) | 22 (8.3%) |
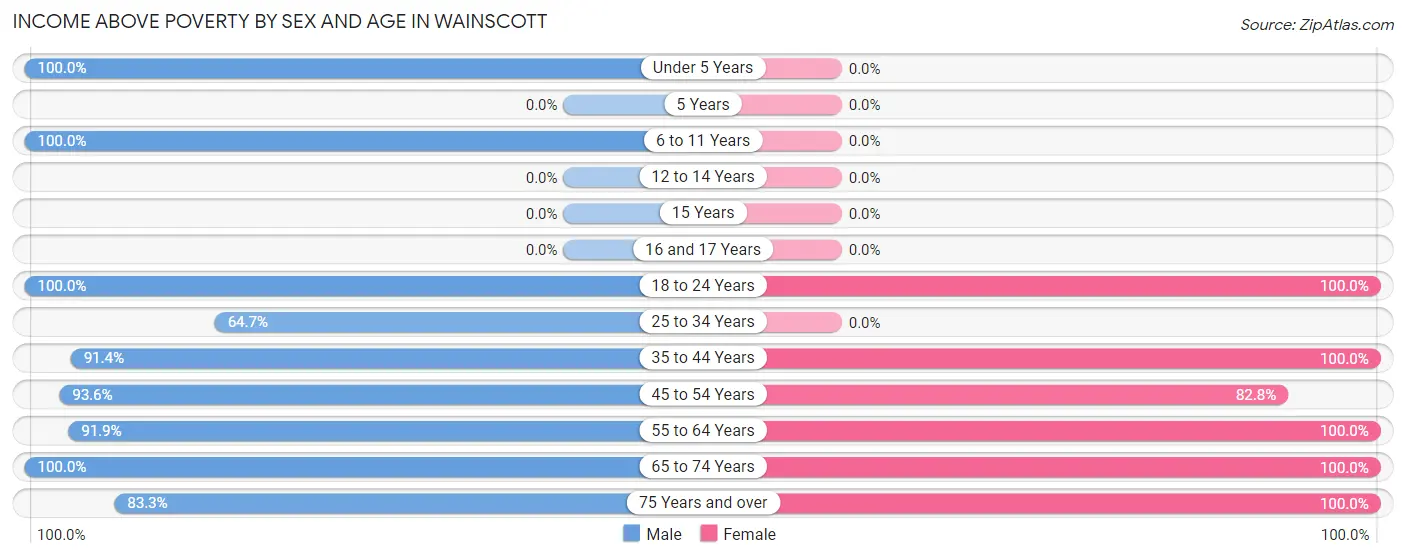
Income Above Poverty by Sex and Age in Wainscott
According to the poverty statistics in Wainscott, males aged under 5 years and females aged 18 to 24 years are the age groups that are most secure financially, with 100.0% of males and 100.0% of females in these age groups living above the poverty line.
| Age Bracket | Male | Female |
| Under 5 Years | 13 (100.0%) | 0 (0.0%) |
| 5 Years | 0 (0.0%) | 0 (0.0%) |
| 6 to 11 Years | 7 (100.0%) | 0 (0.0%) |
| 12 to 14 Years | 0 (0.0%) | 0 (0.0%) |
| 15 Years | 0 (0.0%) | 0 (0.0%) |
| 16 and 17 Years | 0 (0.0%) | 0 (0.0%) |
| 18 to 24 Years | 6 (100.0%) | 7 (100.0%) |
| 25 to 34 Years | 33 (64.7%) | 0 (0.0%) |
| 35 to 44 Years | 32 (91.4%) | 22 (100.0%) |
| 45 to 54 Years | 29 (93.5%) | 53 (82.8%) |
| 55 to 64 Years | 34 (91.9%) | 64 (100.0%) |
| 65 to 74 Years | 59 (100.0%) | 51 (100.0%) |
| 75 Years and over | 60 (83.3%) | 45 (100.0%) |
| Total | 273 (85.1%) | 242 (91.7%) |
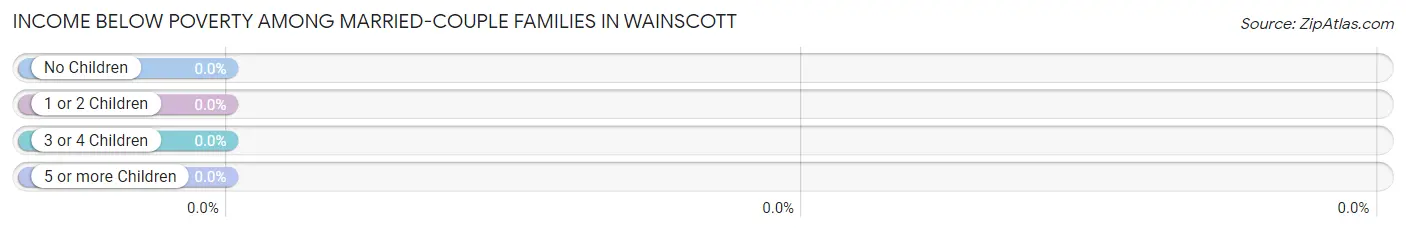
Income Below Poverty Among Married-Couple Families in Wainscott
| Children | Above Poverty | Below Poverty |
| No Children | 77 (100.0%) | 0 (0.0%) |
| 1 or 2 Children | 49 (100.0%) | 0 (0.0%) |
| 3 or 4 Children | 0 (0.0%) | 0 (0.0%) |
| 5 or more Children | 0 (0.0%) | 0 (0.0%) |
| Total | 126 (100.0%) | 0 (0.0%) |
Income Below Poverty Among Single-Parent Households in Wainscott
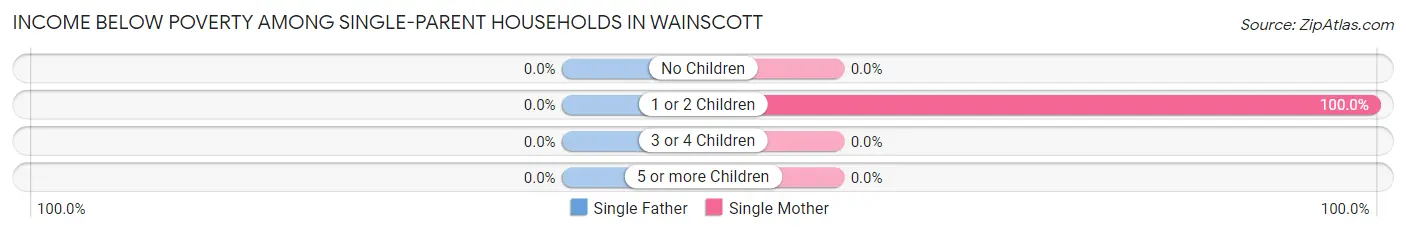
| Children | Single Father | Single Mother |
| No Children | 0 (0.0%) | 0 (0.0%) |
| 1 or 2 Children | 0 (0.0%) | 11 (100.0%) |
| 3 or 4 Children | 0 (0.0%) | 0 (0.0%) |
| 5 or more Children | 0 (0.0%) | 0 (0.0%) |
| Total | 0 (0.0%) | 11 (100.0%) |
Income Below Poverty Among Married-Couple vs Single-Parent Households in Wainscott
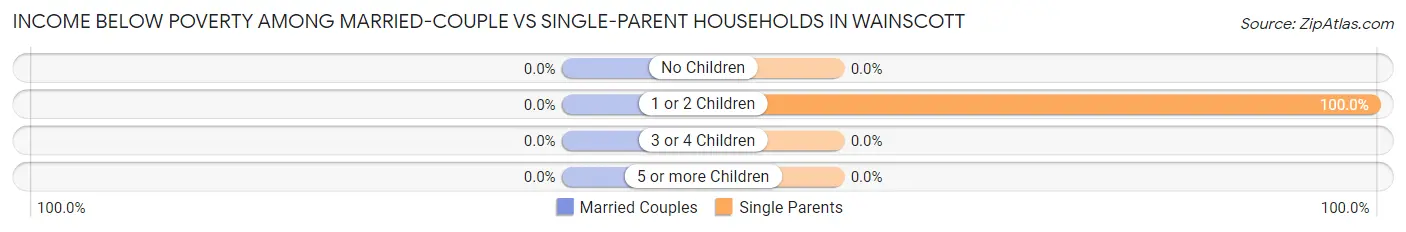
| Children | Married-Couple Families | Single-Parent Households |
| No Children | 0 (0.0%) | 0 (0.0%) |
| 1 or 2 Children | 0 (0.0%) | 11 (100.0%) |
| 3 or 4 Children | 0 (0.0%) | 0 (0.0%) |
| 5 or more Children | 0 (0.0%) | 0 (0.0%) |
| Total | 0 (0.0%) | 11 (34.4%) |
Race in Wainscott
The most populous races in Wainscott are White / Caucasian (485 | 82.9%), Two or more Races (63 | 10.8%), and Black / African American (27 | 4.6%).
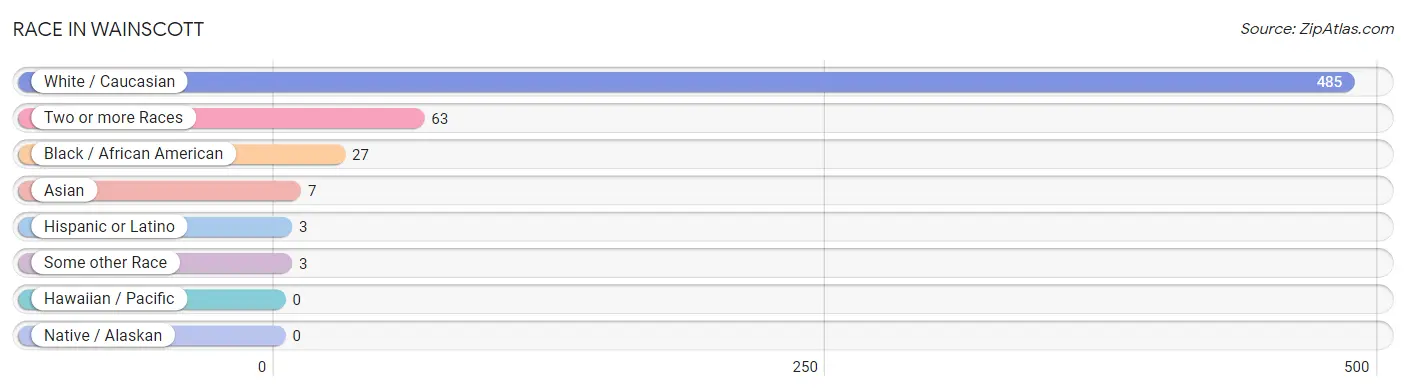
| Race | # Population | % Population |
| Asian | 7 | 1.2% |
| Black / African American | 27 | 4.6% |
| Hawaiian / Pacific | 0 | 0.0% |
| Hispanic or Latino | 3 | 0.5% |
| Native / Alaskan | 0 | 0.0% |
| White / Caucasian | 485 | 82.9% |
| Two or more Races | 63 | 10.8% |
| Some other Race | 3 | 0.5% |
| Total | 585 | 100.0% |
Ancestry in Wainscott
The most populous ancestries reported in Wainscott are Irish (113 | 19.3%), German (98 | 16.8%), Burmese (56 | 9.6%), English (56 | 9.6%), and Polish (43 | 7.3%), together accounting for 62.6% of all Wainscott residents.
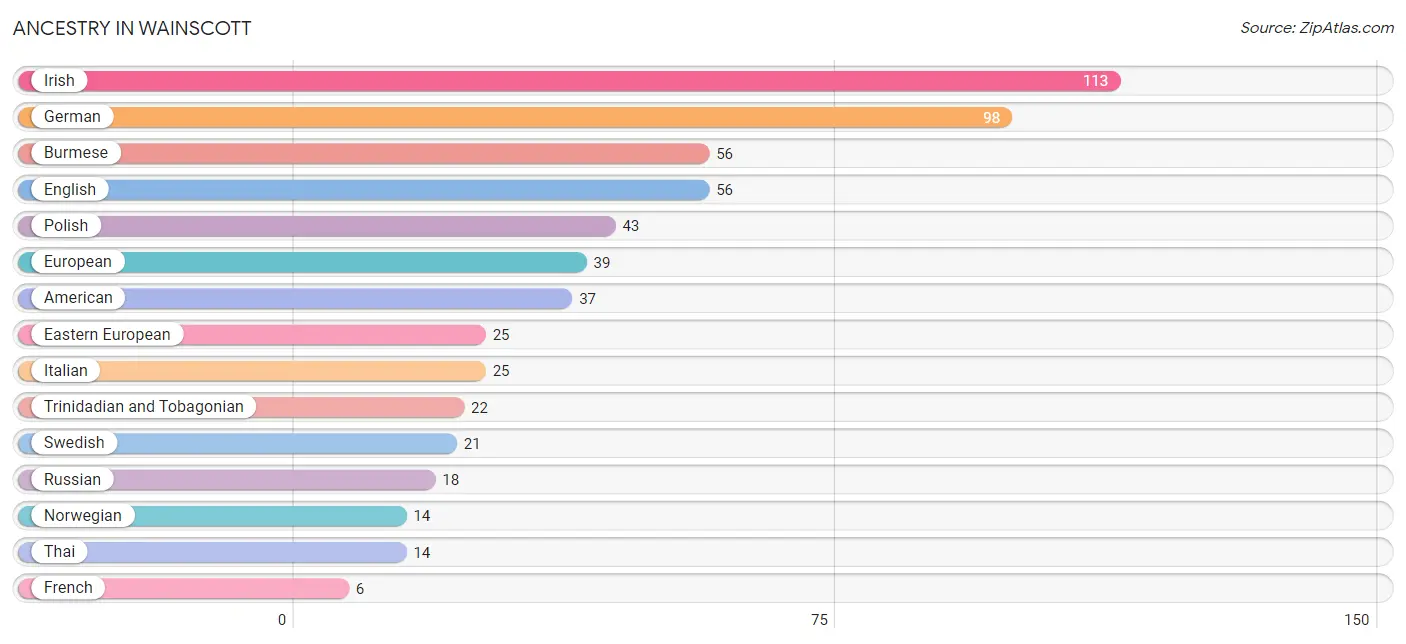
| Ancestry | # Population | % Population |
| American | 37 | 6.3% |
| Austrian | 5 | 0.9% |
| Burmese | 56 | 9.6% |
| Eastern European | 25 | 4.3% |
| English | 56 | 9.6% |
| European | 39 | 6.7% |
| French | 6 | 1.0% |
| German | 98 | 16.8% |
| Irish | 113 | 19.3% |
| Italian | 25 | 4.3% |
| Norwegian | 14 | 2.4% |
| Polish | 43 | 7.3% |
| Russian | 18 | 3.1% |
| Scottish | 1 | 0.2% |
| Swedish | 21 | 3.6% |
| Thai | 14 | 2.4% |
| Trinidadian and Tobagonian | 22 | 3.8% | View All 17 Rows |
Immigrants in Wainscott
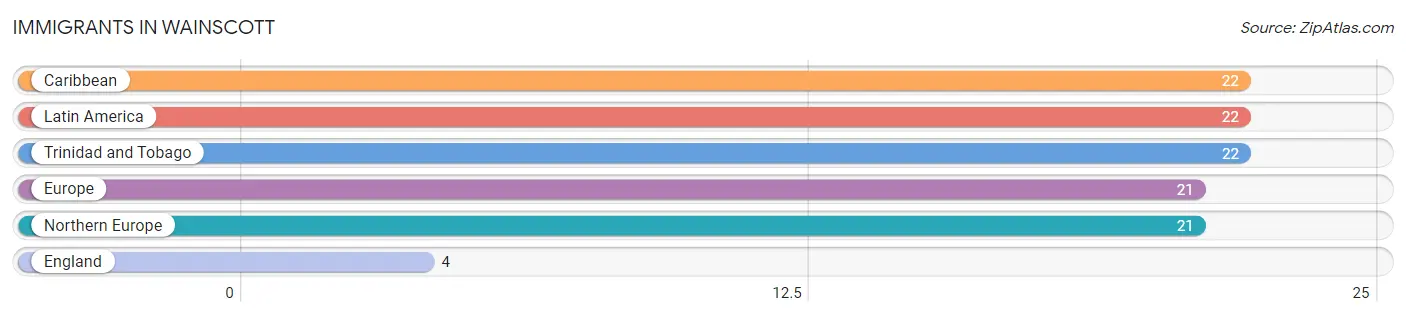
The most numerous immigrant groups reported in Wainscott came from Caribbean (22 | 3.8%), Latin America (22 | 3.8%), Trinidad and Tobago (22 | 3.8%), Europe (21 | 3.6%), and Northern Europe (21 | 3.6%), together accounting for 18.5% of all Wainscott residents.
| Immigration Origin | # Population | % Population |
| Caribbean | 22 | 3.8% |
| England | 4 | 0.7% |
| Europe | 21 | 3.6% |
| Latin America | 22 | 3.8% |
| Northern Europe | 21 | 3.6% |
| Trinidad and Tobago | 22 | 3.8% | View All 6 Rows |
Sex and Age in Wainscott
Sex and Age in Wainscott
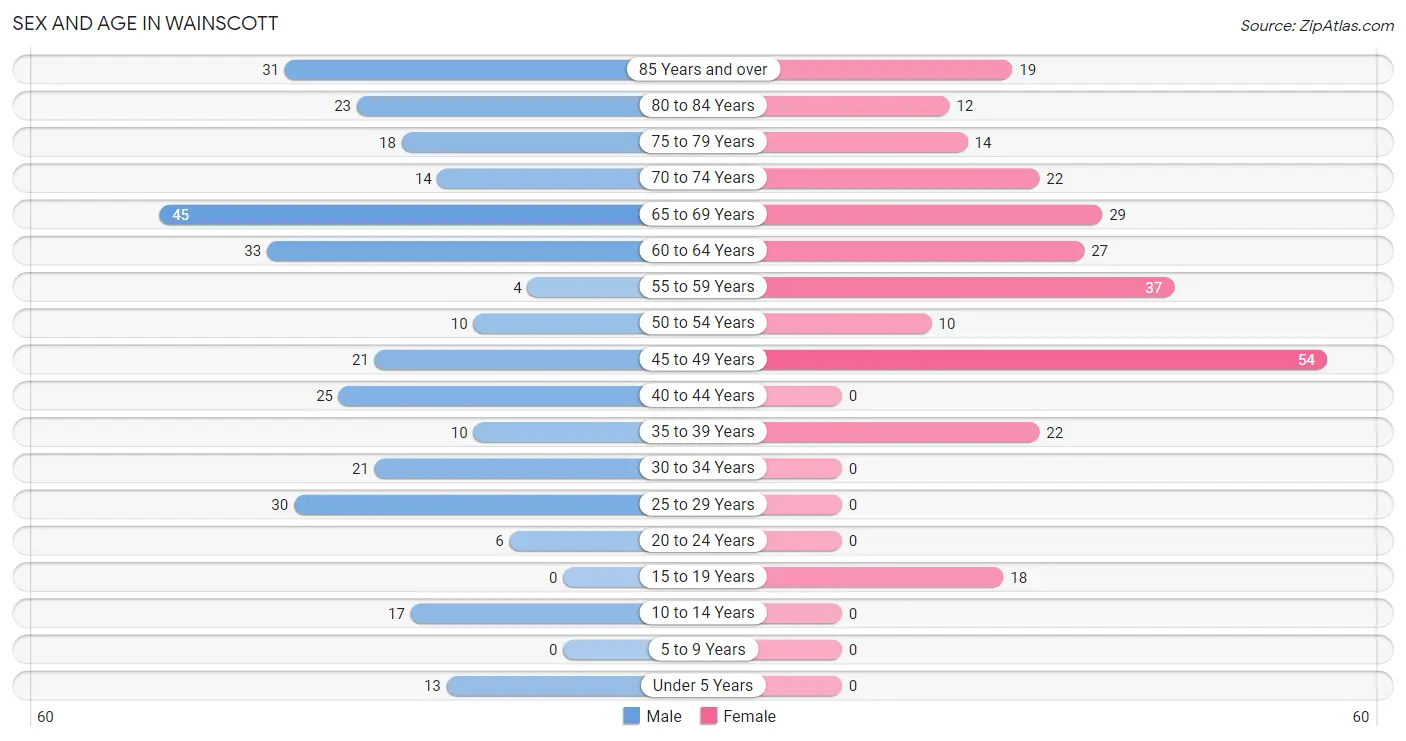
The most populous age groups in Wainscott are 65 to 69 Years (45 | 14.0%) for men and 45 to 49 Years (54 | 20.4%) for women.
| Age Bracket | Male | Female |
| Under 5 Years | 13 (4.1%) | 0 (0.0%) |
| 5 to 9 Years | 0 (0.0%) | 0 (0.0%) |
| 10 to 14 Years | 17 (5.3%) | 0 (0.0%) |
| 15 to 19 Years | 0 (0.0%) | 18 (6.8%) |
| 20 to 24 Years | 6 (1.9%) | 0 (0.0%) |
| 25 to 29 Years | 30 (9.3%) | 0 (0.0%) |
| 30 to 34 Years | 21 (6.5%) | 0 (0.0%) |
| 35 to 39 Years | 10 (3.1%) | 22 (8.3%) |
| 40 to 44 Years | 25 (7.8%) | 0 (0.0%) |
| 45 to 49 Years | 21 (6.5%) | 54 (20.4%) |
| 50 to 54 Years | 10 (3.1%) | 10 (3.8%) |
| 55 to 59 Years | 4 (1.3%) | 37 (14.0%) |
| 60 to 64 Years | 33 (10.3%) | 27 (10.2%) |
| 65 to 69 Years | 45 (14.0%) | 29 (11.0%) |
| 70 to 74 Years | 14 (4.4%) | 22 (8.3%) |
| 75 to 79 Years | 18 (5.6%) | 14 (5.3%) |
| 80 to 84 Years | 23 (7.2%) | 12 (4.5%) |
| 85 Years and over | 31 (9.7%) | 19 (7.2%) |
| Total | 321 (100.0%) | 264 (100.0%) |
Families and Households in Wainscott
Median Family Size in Wainscott
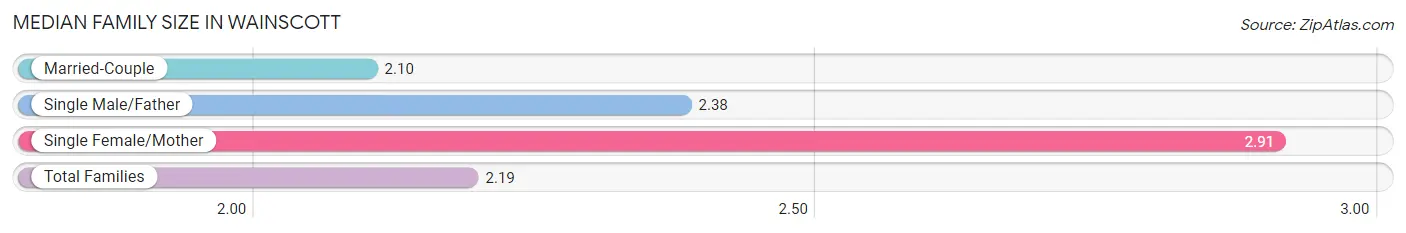
The median family size in Wainscott is 2.19 persons per family, with single female/mother families (11 | 7.0%) accounting for the largest median family size of 2.91 persons per family. On the other hand, married-couple families (126 | 79.7%) represent the smallest median family size with 2.10 persons per family.
| Family Type | # Families | Family Size |
| Married-Couple | 126 (79.7%) | 2.10 |
| Single Male/Father | 21 (13.3%) | 2.38 |
| Single Female/Mother | 11 (7.0%) | 2.91 |
| Total Families | 158 (100.0%) | 2.19 |
Median Household Size in Wainscott
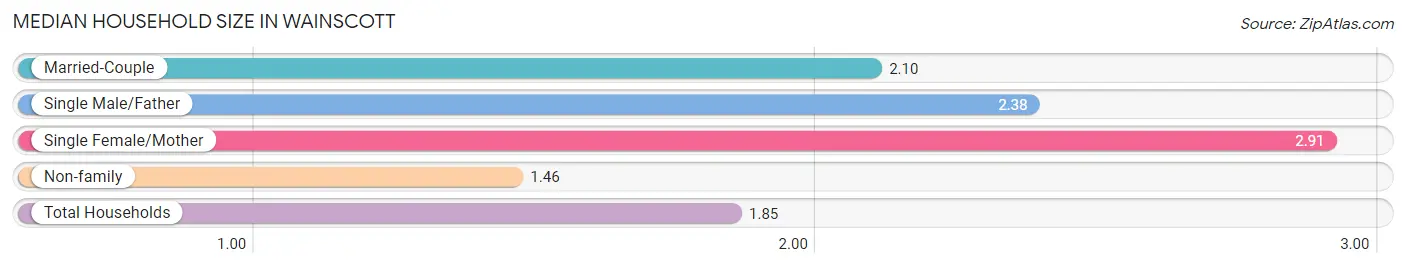
The median household size in Wainscott is 1.85 persons per household, with single female/mother households (11 | 3.7%) accounting for the largest median household size of 2.91 persons per household. non-family households (138 | 46.6%) represent the smallest median household size with 1.46 persons per household.
| Household Type | # Households | Household Size |
| Married-Couple | 126 (42.6%) | 2.10 |
| Single Male/Father | 21 (7.1%) | 2.38 |
| Single Female/Mother | 11 (3.7%) | 2.91 |
| Non-family | 138 (46.6%) | 1.46 |
| Total Households | 296 (100.0%) | 1.85 |
Household Size by Marriage Status in Wainscott
Out of a total of 296 households in Wainscott, 158 (53.4%) are family households, while 138 (46.6%) are nonfamily households. The most numerous type of family households are 2-person households, comprising 69, and the most common type of nonfamily households are 1-person households, comprising 77.
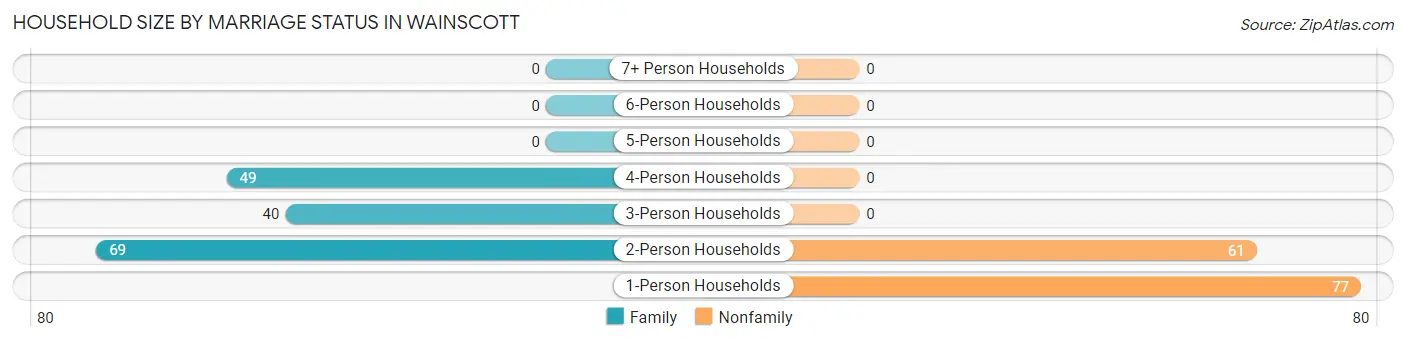
| Household Size | Family Households | Nonfamily Households |
| 1-Person Households | - | 77 (26.0%) |
| 2-Person Households | 69 (23.3%) | 61 (20.6%) |
| 3-Person Households | 40 (13.5%) | 0 (0.0%) |
| 4-Person Households | 49 (16.6%) | 0 (0.0%) |
| 5-Person Households | 0 (0.0%) | 0 (0.0%) |
| 6-Person Households | 0 (0.0%) | 0 (0.0%) |
| 7+ Person Households | 0 (0.0%) | 0 (0.0%) |
| Total | 158 (53.4%) | 138 (46.6%) |
Female Fertility in Wainscott
Fertility by Age in Wainscott
| Age Bracket | Women with Births | Births / 1,000 Women |
| 15 to 19 years | 0 (0.0%) | 0.0 |
| 20 to 34 years | 0 (0.0%) | 0.0 |
| 35 to 50 years | 0 (0.0%) | 0.0 |
| Total | 0 (0.0%) | 0.0 |
Fertility by Age by Marriage Status in Wainscott
| Age Bracket | Married | Unmarried |
| 15 to 19 years | 0 (0.0%) | 0 (0.0%) |
| 20 to 34 years | 0 (0.0%) | 0 (0.0%) |
| 35 to 50 years | 0 (0.0%) | 0 (0.0%) |
| Total | 0 (0.0%) | 0 (0.0%) |
Fertility by Education in Wainscott
| Educational Attainment | Women with Births | Births / 1,000 Women |
| Less than High School | 0 (0.0%) | 0.0 |
| High School Diploma | 0 (0.0%) | 0.0 |
| College or Associate's Degree | 0 (0.0%) | 0.0 |
| Bachelor's Degree | 0 (0.0%) | 0.0 |
| Graduate Degree | 0 (0.0%) | 0.0 |
| Total | 0 (0.0%) | 0.0 |
Fertility by Education by Marriage Status in Wainscott
| Educational Attainment | Married | Unmarried |
| Less than High School | 0 (0.0%) | 0 (0.0%) |
| High School Diploma | 0 (0.0%) | 0 (0.0%) |
| College or Associate's Degree | 0 (0.0%) | 0 (0.0%) |
| Bachelor's Degree | 0 (0.0%) | 0 (0.0%) |
| Graduate Degree | 0 (0.0%) | 0 (0.0%) |
| Total | 0 (0.0%) | 0 (0.0%) |
Employment Characteristics in Wainscott
Employment by Class of Employer in Wainscott
Among the 294 employed individuals in Wainscott, self-employed (not incorporated) (88 | 29.9%), local government employees (64 | 21.8%), and self-employed (incorporated) (63 | 21.4%) make up the most common classes of employment.
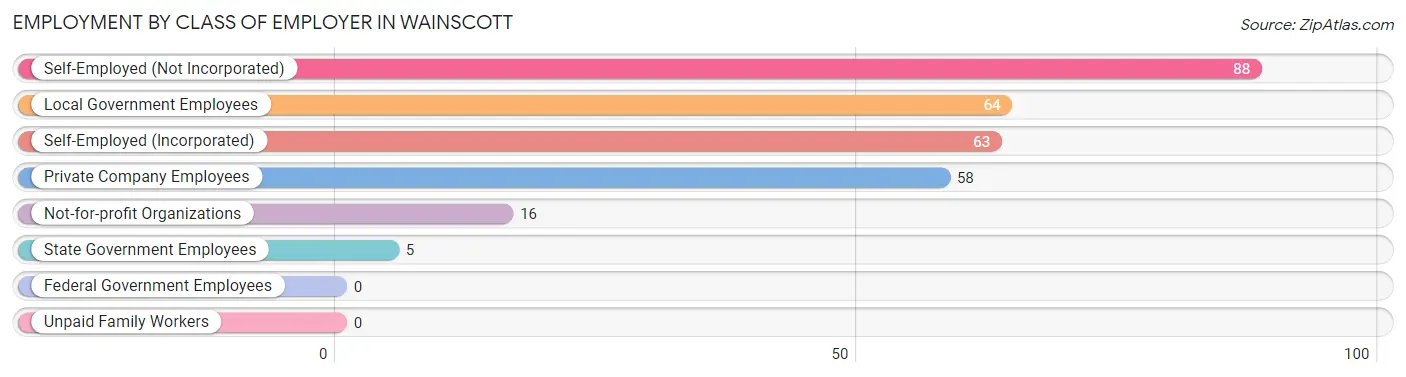
| Employer Class | # Employees | % Employees |
| Private Company Employees | 58 | 19.7% |
| Self-Employed (Incorporated) | 63 | 21.4% |
| Self-Employed (Not Incorporated) | 88 | 29.9% |
| Not-for-profit Organizations | 16 | 5.4% |
| Local Government Employees | 64 | 21.8% |
| State Government Employees | 5 | 1.7% |
| Federal Government Employees | 0 | 0.0% |
| Unpaid Family Workers | 0 | 0.0% |
| Total | 294 | 100.0% |
Employment Status by Age in Wainscott
According to the labor force statistics for Wainscott, out of the total population over 16 years of age (555), 56.0% or 311 individuals are in the labor force, with 5.5% or 17 of them unemployed. The age group with the highest labor force participation rate is 55 to 59 years, with 100.0% or 41 individuals in the labor force. Within the labor force, the 25 to 29 years age range has the highest percentage of unemployed individuals, with 28.6% or 6 of them being unemployed.
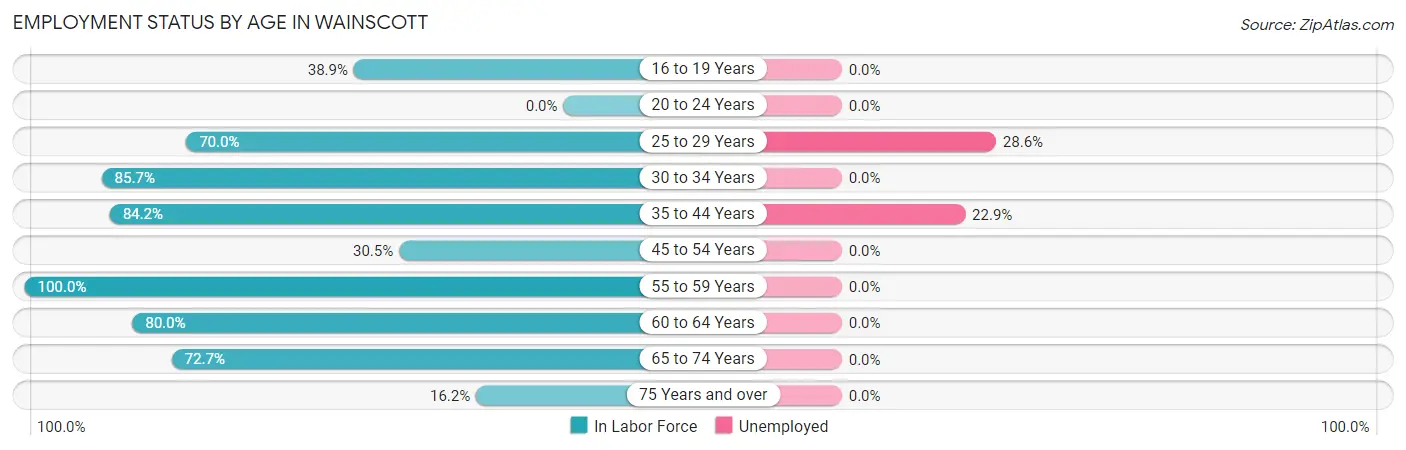
| Age Bracket | In Labor Force | Unemployed |
| 16 to 19 Years | 7 (38.9%) | 0 (0.0%) |
| 20 to 24 Years | 0 (0.0%) | 0 (0.0%) |
| 25 to 29 Years | 21 (70.0%) | 6 (28.6%) |
| 30 to 34 Years | 18 (85.7%) | 0 (0.0%) |
| 35 to 44 Years | 48 (84.2%) | 11 (22.9%) |
| 45 to 54 Years | 29 (30.5%) | 0 (0.0%) |
| 55 to 59 Years | 41 (100.0%) | 0 (0.0%) |
| 60 to 64 Years | 48 (80.0%) | 0 (0.0%) |
| 65 to 74 Years | 80 (72.7%) | 0 (0.0%) |
| 75 Years and over | 19 (16.2%) | 0 (0.0%) |
| Total | 311 (56.0%) | 17 (5.5%) |
Employment Status by Educational Attainment in Wainscott
According to labor force statistics for Wainscott, 67.4% of individuals (205) out of the total population between 25 and 64 years of age (304) are in the labor force, with 8.3% or 17 of them being unemployed. The group with the highest labor force participation rate are those with the educational attainment of college / associate degree, with 79.7% or 55 individuals in the labor force. Within the labor force, individuals with high school diploma education have the highest percentage of unemployment, with 15.0% or 3 of them being unemployed.
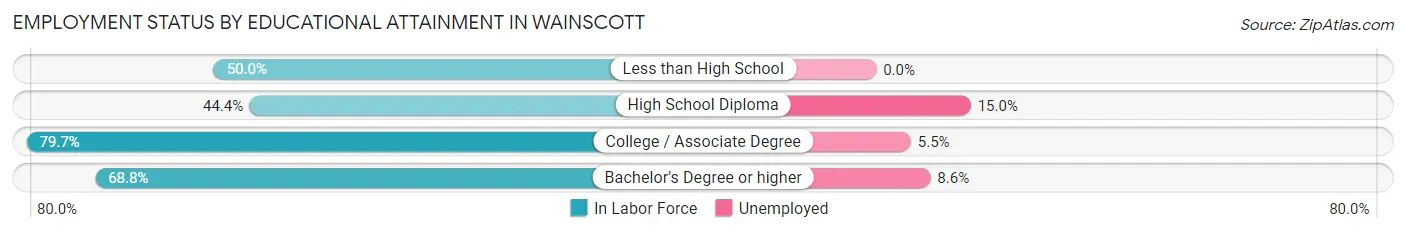
| Educational Attainment | In Labor Force | Unemployed |
| Less than High School | 2 (50.0%) | 0 (0.0%) |
| High School Diploma | 20 (44.4%) | 7 (15.0%) |
| College / Associate Degree | 55 (79.7%) | 4 (5.5%) |
| Bachelor's Degree or higher | 128 (68.8%) | 16 (8.6%) |
| Total | 205 (67.4%) | 25 (8.3%) |
Employment Occupations by Sex in Wainscott
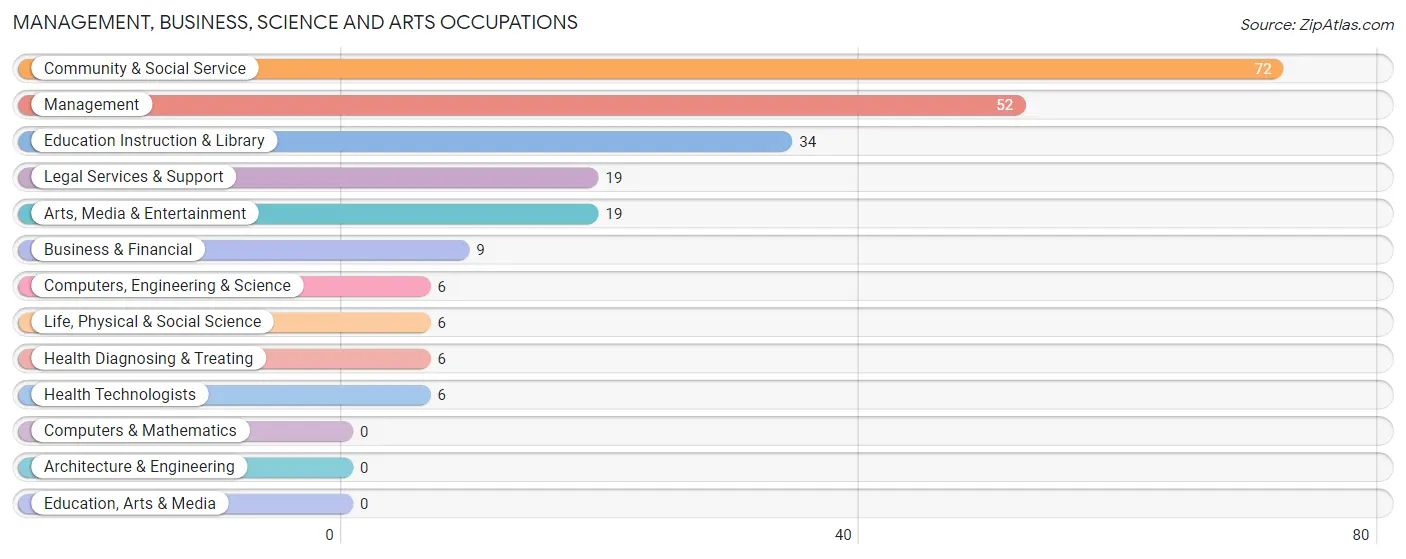
Management, Business, Science and Arts Occupations
The most common Management, Business, Science and Arts occupations in Wainscott are Community & Social Service (72 | 24.5%), Management (52 | 17.7%), Education Instruction & Library (34 | 11.6%), Legal Services & Support (19 | 6.5%), and Arts, Media & Entertainment (19 | 6.5%).
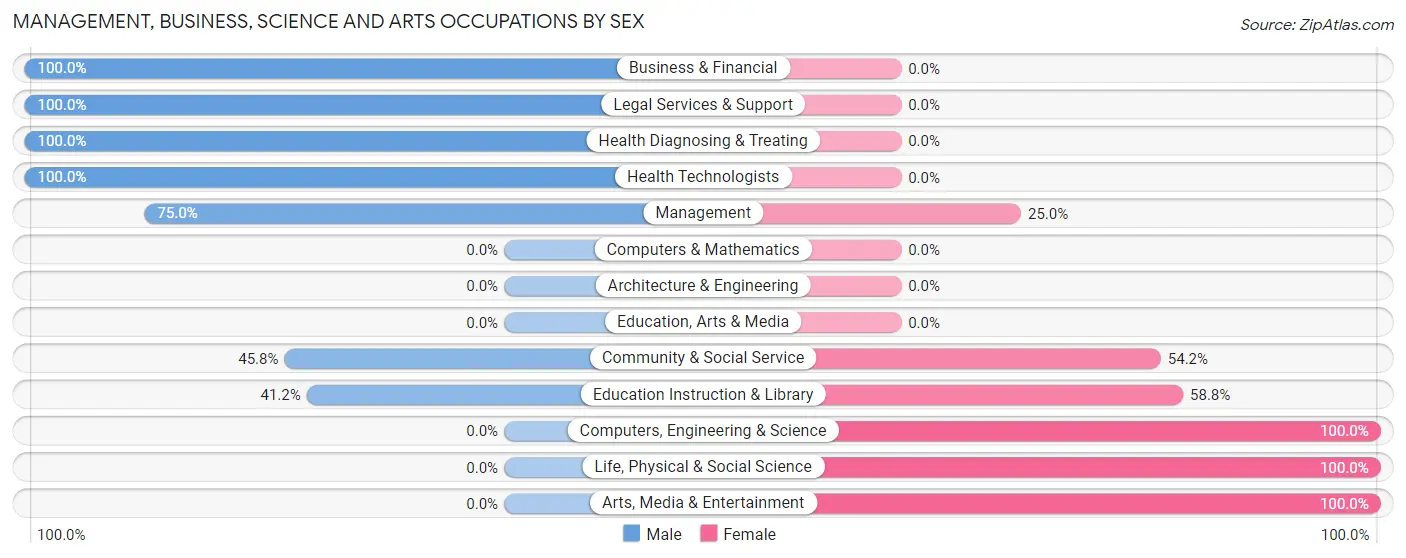
Management, Business, Science and Arts Occupations by Sex
Within the Management, Business, Science and Arts occupations in Wainscott, the most male-oriented occupations are Business & Financial (100.0%), Legal Services & Support (100.0%), and Health Diagnosing & Treating (100.0%), while the most female-oriented occupations are Computers, Engineering & Science (100.0%), Life, Physical & Social Science (100.0%), and Arts, Media & Entertainment (100.0%).
| Occupation | Male | Female |
| Management | 39 (75.0%) | 13 (25.0%) |
| Business & Financial | 9 (100.0%) | 0 (0.0%) |
| Computers, Engineering & Science | 0 (0.0%) | 6 (100.0%) |
| Computers & Mathematics | 0 (0.0%) | 0 (0.0%) |
| Architecture & Engineering | 0 (0.0%) | 0 (0.0%) |
| Life, Physical & Social Science | 0 (0.0%) | 6 (100.0%) |
| Community & Social Service | 33 (45.8%) | 39 (54.2%) |
| Education, Arts & Media | 0 (0.0%) | 0 (0.0%) |
| Legal Services & Support | 19 (100.0%) | 0 (0.0%) |
| Education Instruction & Library | 14 (41.2%) | 20 (58.8%) |
| Arts, Media & Entertainment | 0 (0.0%) | 19 (100.0%) |
| Health Diagnosing & Treating | 6 (100.0%) | 0 (0.0%) |
| Health Technologists | 6 (100.0%) | 0 (0.0%) |
| Total (Category) | 87 (60.0%) | 58 (40.0%) |
| Total (Overall) | 169 (57.5%) | 125 (42.5%) |
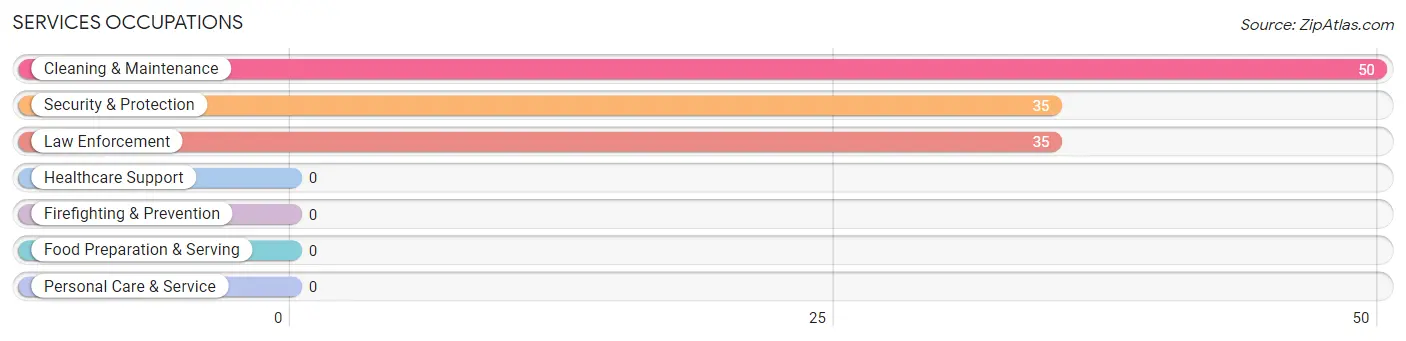
Services Occupations
The most common Services occupations in Wainscott are Cleaning & Maintenance (50 | 17.0%), Security & Protection (35 | 11.9%), and Law Enforcement (35 | 11.9%).
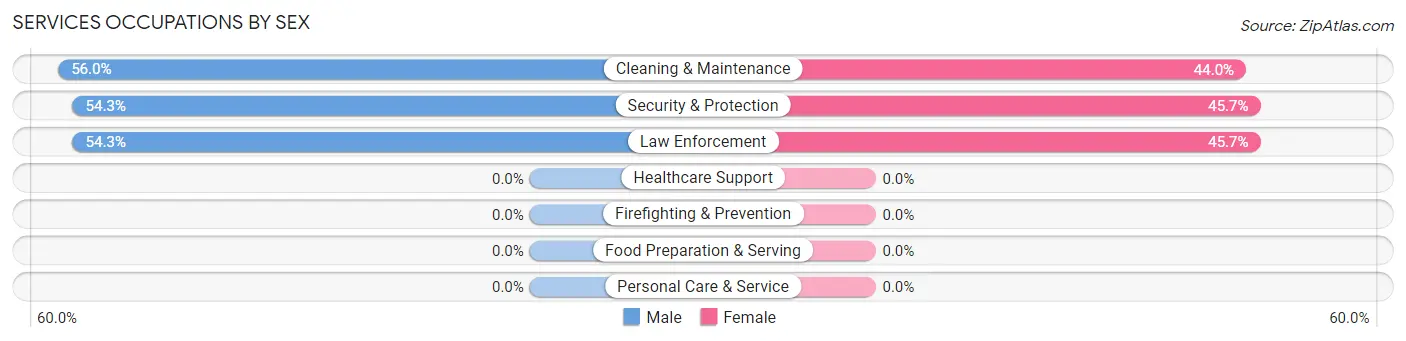
Services Occupations by Sex
Within the Services occupations in Wainscott, the most male-oriented occupations are Cleaning & Maintenance (56.0%), Security & Protection (54.3%), and Law Enforcement (54.3%), while the most female-oriented occupations are Security & Protection (45.7%), Law Enforcement (45.7%), and Cleaning & Maintenance (44.0%).
| Occupation | Male | Female |
| Healthcare Support | 0 (0.0%) | 0 (0.0%) |
| Security & Protection | 19 (54.3%) | 16 (45.7%) |
| Firefighting & Prevention | 0 (0.0%) | 0 (0.0%) |
| Law Enforcement | 19 (54.3%) | 16 (45.7%) |
| Food Preparation & Serving | 0 (0.0%) | 0 (0.0%) |
| Cleaning & Maintenance | 28 (56.0%) | 22 (44.0%) |
| Personal Care & Service | 0 (0.0%) | 0 (0.0%) |
| Total (Category) | 47 (55.3%) | 38 (44.7%) |
| Total (Overall) | 169 (57.5%) | 125 (42.5%) |
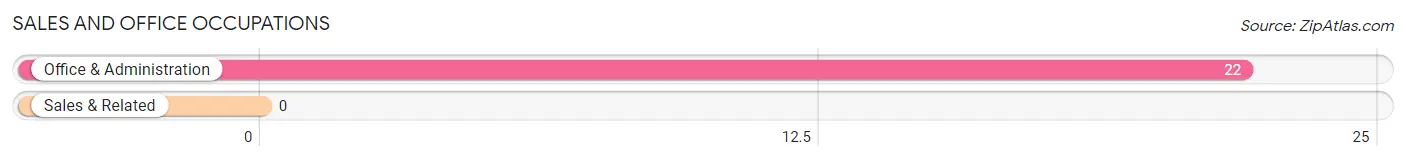
Sales and Office Occupations
The most common Sales and Office occupations in Wainscott are , and Office & Administration (22 | 7.5%).
Sales and Office Occupations by Sex
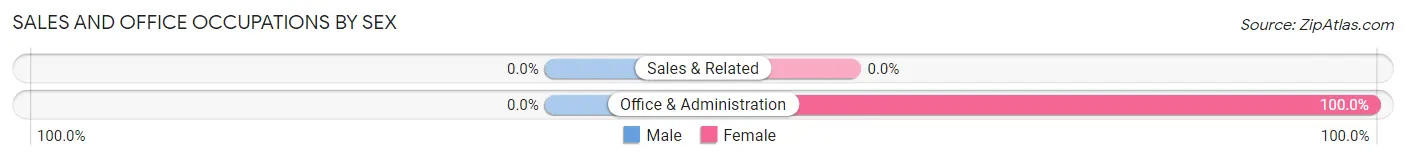
| Occupation | Male | Female |
| Sales & Related | 0 (0.0%) | 0 (0.0%) |
| Office & Administration | 0 (0.0%) | 22 (100.0%) |
| Total (Category) | 0 (0.0%) | 22 (100.0%) |
| Total (Overall) | 169 (57.5%) | 125 (42.5%) |
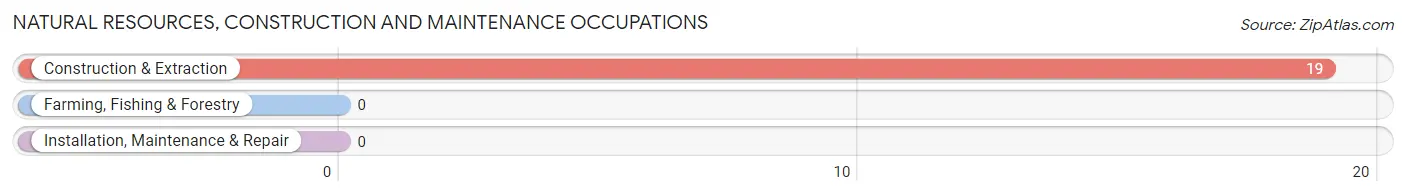
Natural Resources, Construction and Maintenance Occupations
The most common Natural Resources, Construction and Maintenance occupations in Wainscott are , and Construction & Extraction (19 | 6.5%).
Natural Resources, Construction and Maintenance Occupations by Sex
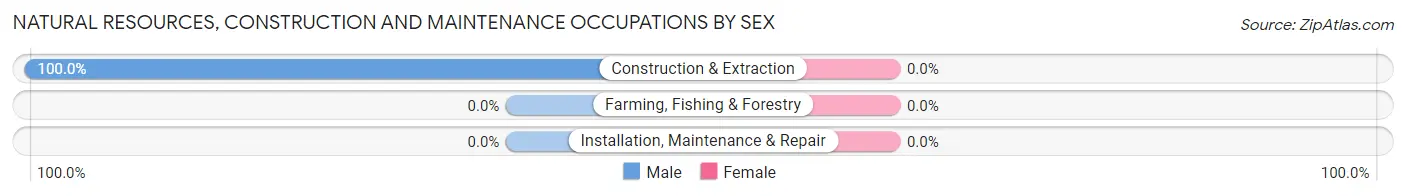
| Occupation | Male | Female |
| Farming, Fishing & Forestry | 0 (0.0%) | 0 (0.0%) |
| Construction & Extraction | 19 (100.0%) | 0 (0.0%) |
| Installation, Maintenance & Repair | 0 (0.0%) | 0 (0.0%) |
| Total (Category) | 19 (100.0%) | 0 (0.0%) |
| Total (Overall) | 169 (57.5%) | 125 (42.5%) |
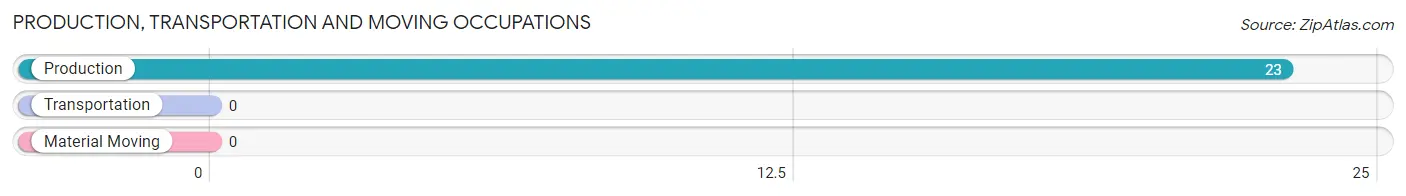
Production, Transportation and Moving Occupations
The most common Production, Transportation and Moving occupations in Wainscott are , and Production (23 | 7.8%).
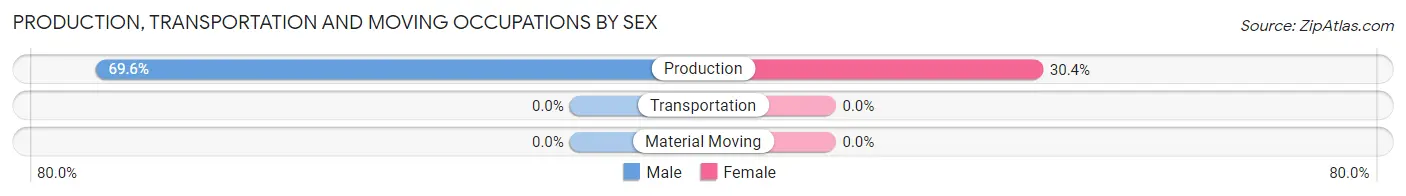
Production, Transportation and Moving Occupations by Sex
| Occupation | Male | Female |
| Production | 16 (69.6%) | 7 (30.4%) |
| Transportation | 0 (0.0%) | 0 (0.0%) |
| Material Moving | 0 (0.0%) | 0 (0.0%) |
| Total (Category) | 16 (69.6%) | 7 (30.4%) |
| Total (Overall) | 169 (57.5%) | 125 (42.5%) |
Employment Industries by Sex in Wainscott
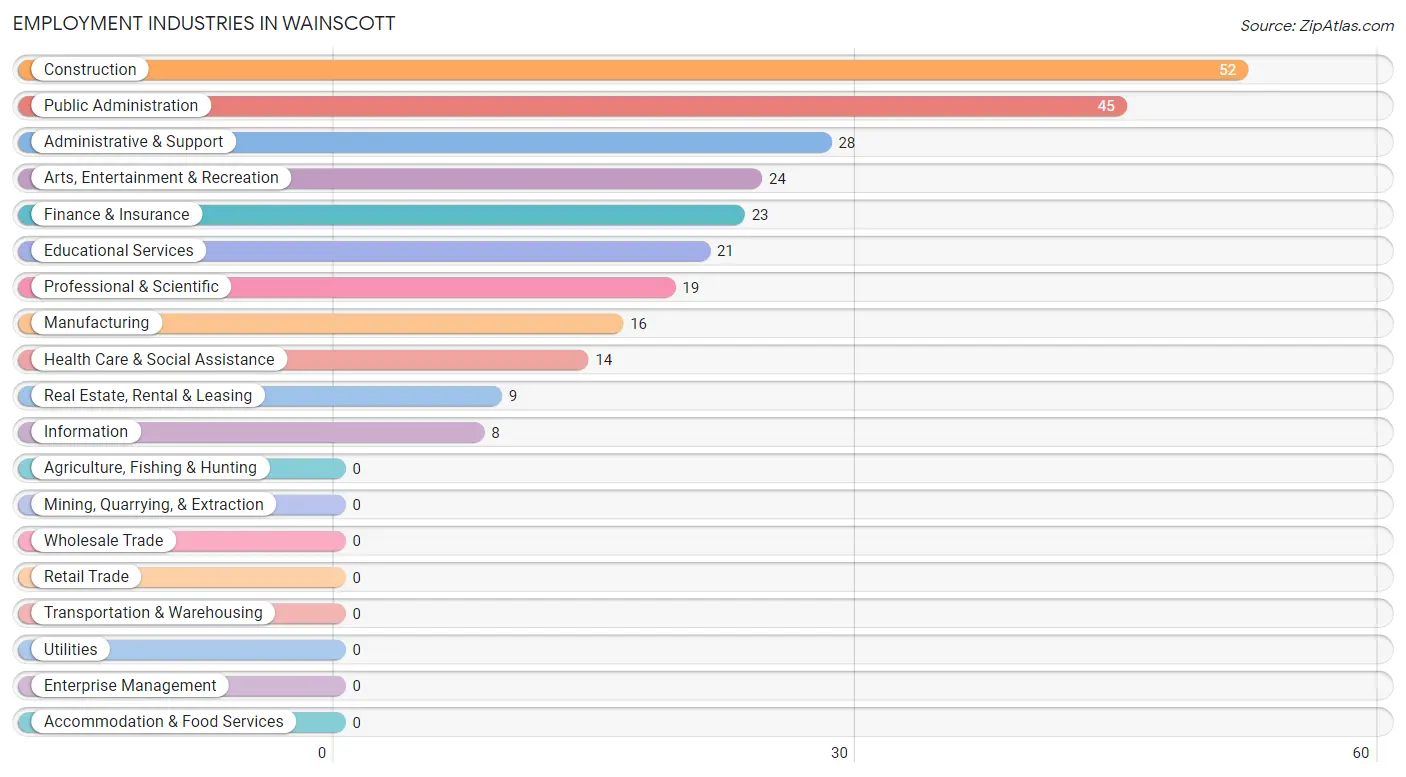
Employment Industries in Wainscott
The major employment industries in Wainscott include Construction (52 | 17.7%), Public Administration (45 | 15.3%), Administrative & Support (28 | 9.5%), Arts, Entertainment & Recreation (24 | 8.2%), and Finance & Insurance (23 | 7.8%).
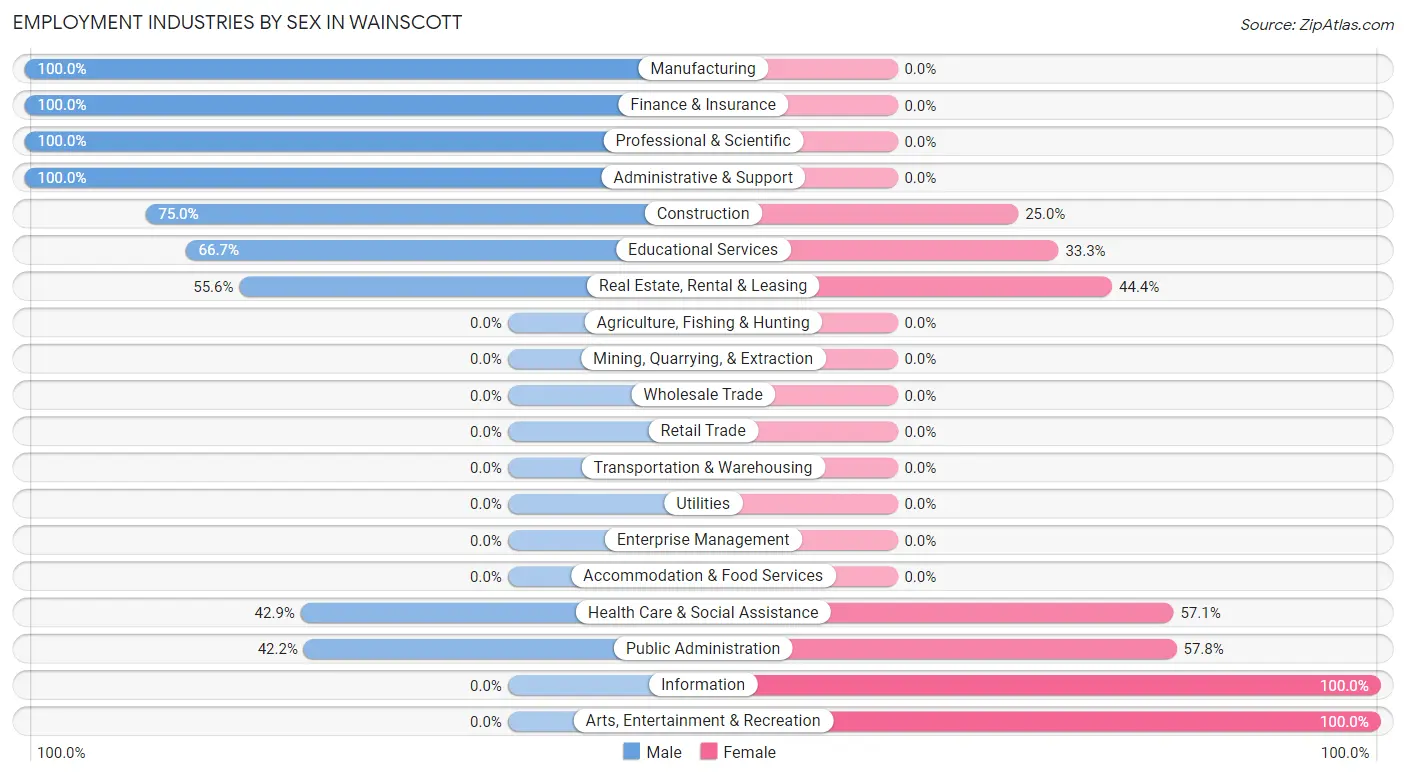
Employment Industries by Sex in Wainscott
The Wainscott industries that see more men than women are Manufacturing (100.0%), Finance & Insurance (100.0%), and Professional & Scientific (100.0%), whereas the industries that tend to have a higher number of women are Information (100.0%), Arts, Entertainment & Recreation (100.0%), and Public Administration (57.8%).
| Industry | Male | Female |
| Agriculture, Fishing & Hunting | 0 (0.0%) | 0 (0.0%) |
| Mining, Quarrying, & Extraction | 0 (0.0%) | 0 (0.0%) |
| Construction | 39 (75.0%) | 13 (25.0%) |
| Manufacturing | 16 (100.0%) | 0 (0.0%) |
| Wholesale Trade | 0 (0.0%) | 0 (0.0%) |
| Retail Trade | 0 (0.0%) | 0 (0.0%) |
| Transportation & Warehousing | 0 (0.0%) | 0 (0.0%) |
| Utilities | 0 (0.0%) | 0 (0.0%) |
| Information | 0 (0.0%) | 8 (100.0%) |
| Finance & Insurance | 23 (100.0%) | 0 (0.0%) |
| Real Estate, Rental & Leasing | 5 (55.6%) | 4 (44.4%) |
| Professional & Scientific | 19 (100.0%) | 0 (0.0%) |
| Enterprise Management | 0 (0.0%) | 0 (0.0%) |
| Administrative & Support | 28 (100.0%) | 0 (0.0%) |
| Educational Services | 14 (66.7%) | 7 (33.3%) |
| Health Care & Social Assistance | 6 (42.9%) | 8 (57.1%) |
| Arts, Entertainment & Recreation | 0 (0.0%) | 24 (100.0%) |
| Accommodation & Food Services | 0 (0.0%) | 0 (0.0%) |
| Public Administration | 19 (42.2%) | 26 (57.8%) |
| Total | 169 (57.5%) | 125 (42.5%) |
Education in Wainscott
School Enrollment in Wainscott
The most common levels of schooling among the 46 students in Wainscott are middle school (17 | 37.0%), high school (11 | 23.9%), and graduate / professional (11 | 23.9%).
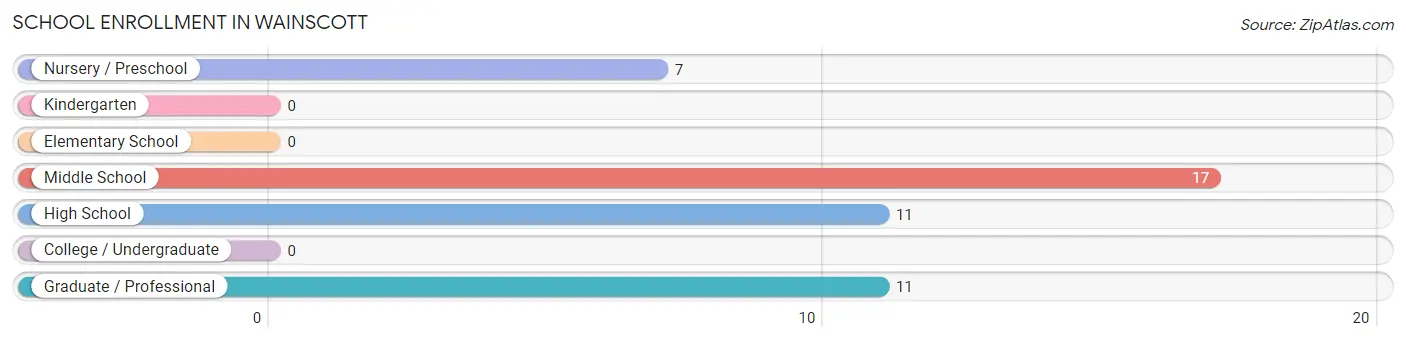
| School Level | # Students | % Students |
| Nursery / Preschool | 7 | 15.2% |
| Kindergarten | 0 | 0.0% |
| Elementary School | 0 | 0.0% |
| Middle School | 17 | 37.0% |
| High School | 11 | 23.9% |
| College / Undergraduate | 0 | 0.0% |
| Graduate / Professional | 11 | 23.9% |
| Total | 46 | 100.0% |
School Enrollment by Age by Funding Source in Wainscott
Out of a total of 46 students who are enrolled in schools in Wainscott, 11 (23.9%) attend a private institution, while the remaining 35 (76.1%) are enrolled in public schools. The age group of 35 years and over has the highest likelihood of being enrolled in private schools, with 11 (100.0% in the age bracket) enrolled. Conversely, the age group of 3 to 4 year olds has the lowest likelihood of being enrolled in a private school, with 7 (100.0% in the age bracket) attending a public institution.
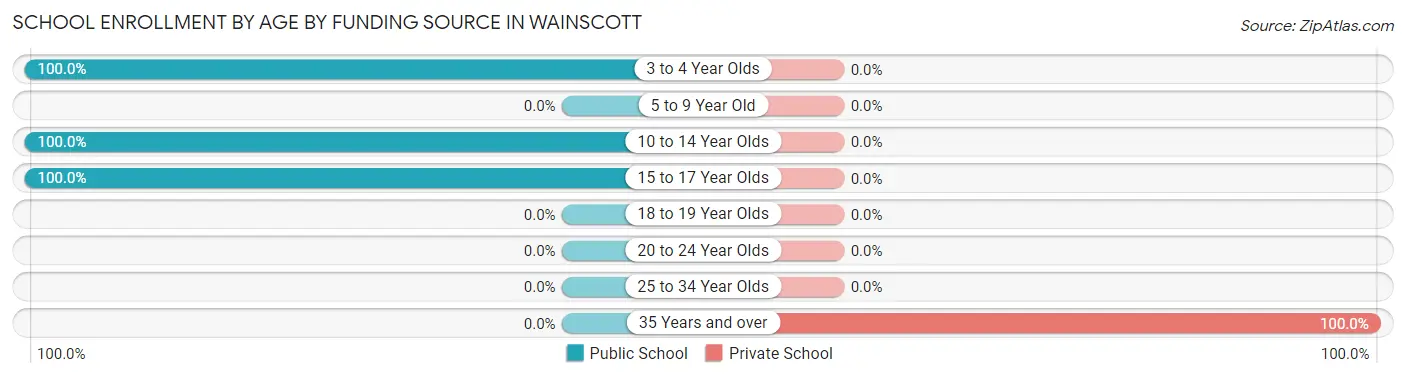
| Age Bracket | Public School | Private School |
| 3 to 4 Year Olds | 7 (100.0%) | 0 (0.0%) |
| 5 to 9 Year Old | 0 (0.0%) | 0 (0.0%) |
| 10 to 14 Year Olds | 17 (100.0%) | 0 (0.0%) |
| 15 to 17 Year Olds | 11 (100.0%) | 0 (0.0%) |
| 18 to 19 Year Olds | 0 (0.0%) | 0 (0.0%) |
| 20 to 24 Year Olds | 0 (0.0%) | 0 (0.0%) |
| 25 to 34 Year Olds | 0 (0.0%) | 0 (0.0%) |
| 35 Years and over | 0 (0.0%) | 11 (100.0%) |
| Total | 35 (76.1%) | 11 (23.9%) |
Educational Attainment by Field of Study in Wainscott
Business (92 | 29.0%), liberal arts & history (57 | 18.0%), visual & performing arts (57 | 18.0%), science & technology (44 | 13.9%), and social sciences (23 | 7.3%) are the most common fields of study among 317 individuals in Wainscott who have obtained a bachelor's degree or higher.
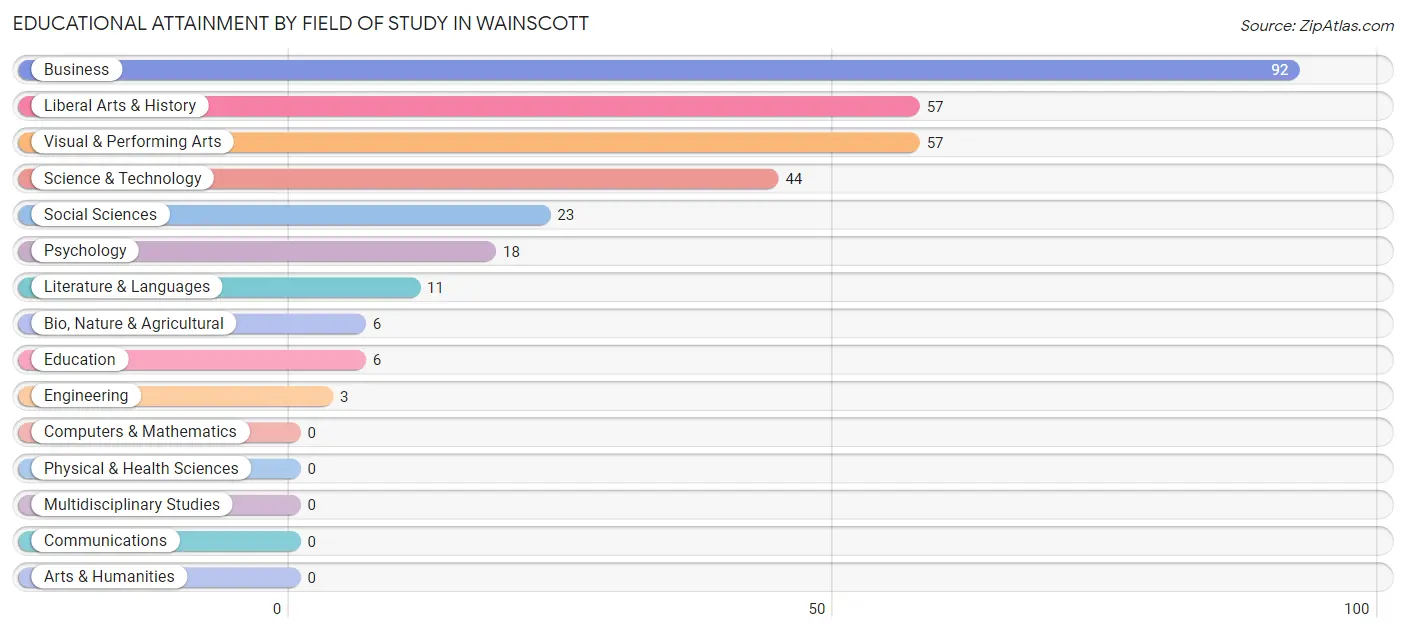
| Field of Study | # Graduates | % Graduates |
| Computers & Mathematics | 0 | 0.0% |
| Bio, Nature & Agricultural | 6 | 1.9% |
| Physical & Health Sciences | 0 | 0.0% |
| Psychology | 18 | 5.7% |
| Social Sciences | 23 | 7.3% |
| Engineering | 3 | 0.9% |
| Multidisciplinary Studies | 0 | 0.0% |
| Science & Technology | 44 | 13.9% |
| Business | 92 | 29.0% |
| Education | 6 | 1.9% |
| Literature & Languages | 11 | 3.5% |
| Liberal Arts & History | 57 | 18.0% |
| Visual & Performing Arts | 57 | 18.0% |
| Communications | 0 | 0.0% |
| Arts & Humanities | 0 | 0.0% |
| Total | 317 | 100.0% |
Transportation & Commute in Wainscott
Vehicle Availability by Sex in Wainscott
The most prevalent vehicle ownership categories in Wainscott are males with 2 vehicles (85, accounting for 51.8%) and females with 2 vehicles (66, making up 68.0%).
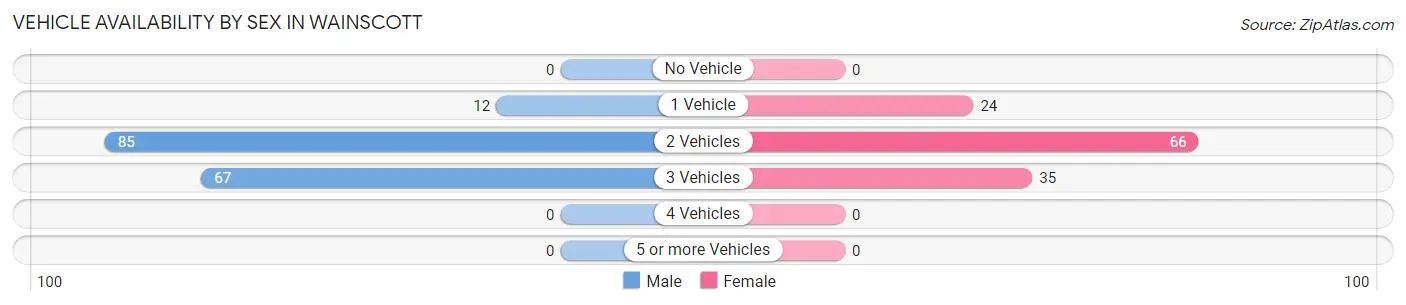
| Vehicles Available | Male | Female |
| No Vehicle | 0 (0.0%) | 0 (0.0%) |
| 1 Vehicle | 12 (7.3%) | 24 (19.2%) |
| 2 Vehicles | 85 (51.8%) | 66 (52.8%) |
| 3 Vehicles | 67 (40.8%) | 35 (28.0%) |
| 4 Vehicles | 0 (0.0%) | 0 (0.0%) |
| 5 or more Vehicles | 0 (0.0%) | 0 (0.0%) |
| Total | 164 (100.0%) | 125 (100.0%) |
Commute Time in Wainscott
The most frequently occuring commute durations in Wainscott are 10 to 14 minutes (76 commuters, 38.8%), 5 to 9 minutes (40 commuters, 20.4%), and less than 5 minutes (33 commuters, 16.8%).
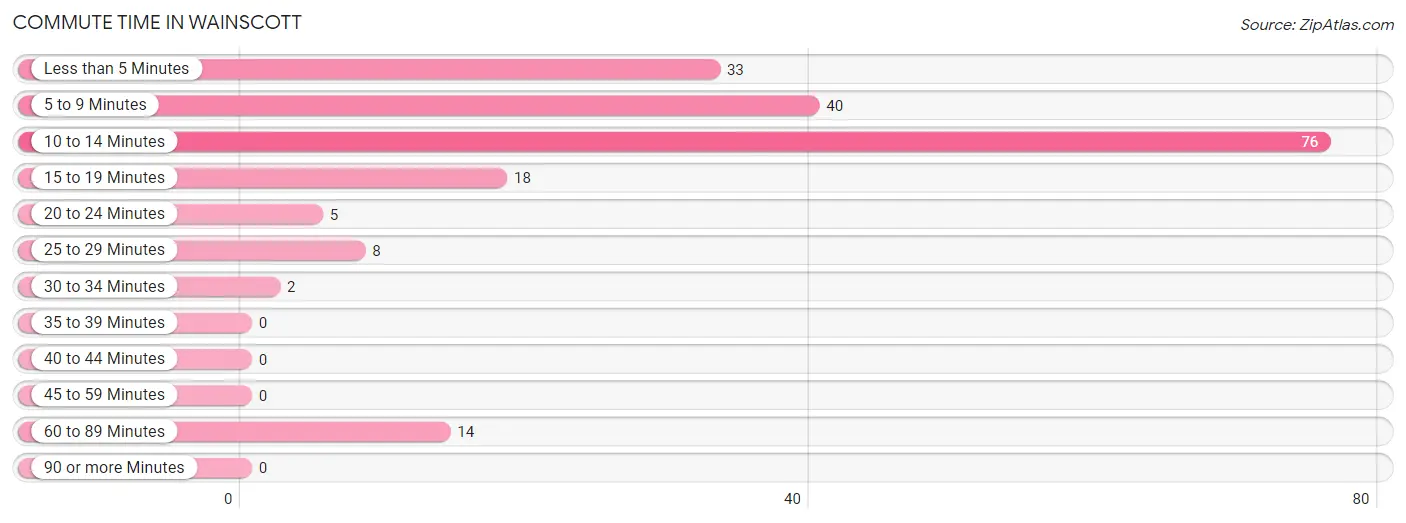
| Commute Time | # Commuters | % Commuters |
| Less than 5 Minutes | 33 | 16.8% |
| 5 to 9 Minutes | 40 | 20.4% |
| 10 to 14 Minutes | 76 | 38.8% |
| 15 to 19 Minutes | 18 | 9.2% |
| 20 to 24 Minutes | 5 | 2.5% |
| 25 to 29 Minutes | 8 | 4.1% |
| 30 to 34 Minutes | 2 | 1.0% |
| 35 to 39 Minutes | 0 | 0.0% |
| 40 to 44 Minutes | 0 | 0.0% |
| 45 to 59 Minutes | 0 | 0.0% |
| 60 to 89 Minutes | 14 | 7.1% |
| 90 or more Minutes | 0 | 0.0% |
Commute Time by Sex in Wainscott
The most common commute times in Wainscott are 10 to 14 minutes (40 commuters, 30.8%) for males and 10 to 14 minutes (36 commuters, 54.5%) for females.
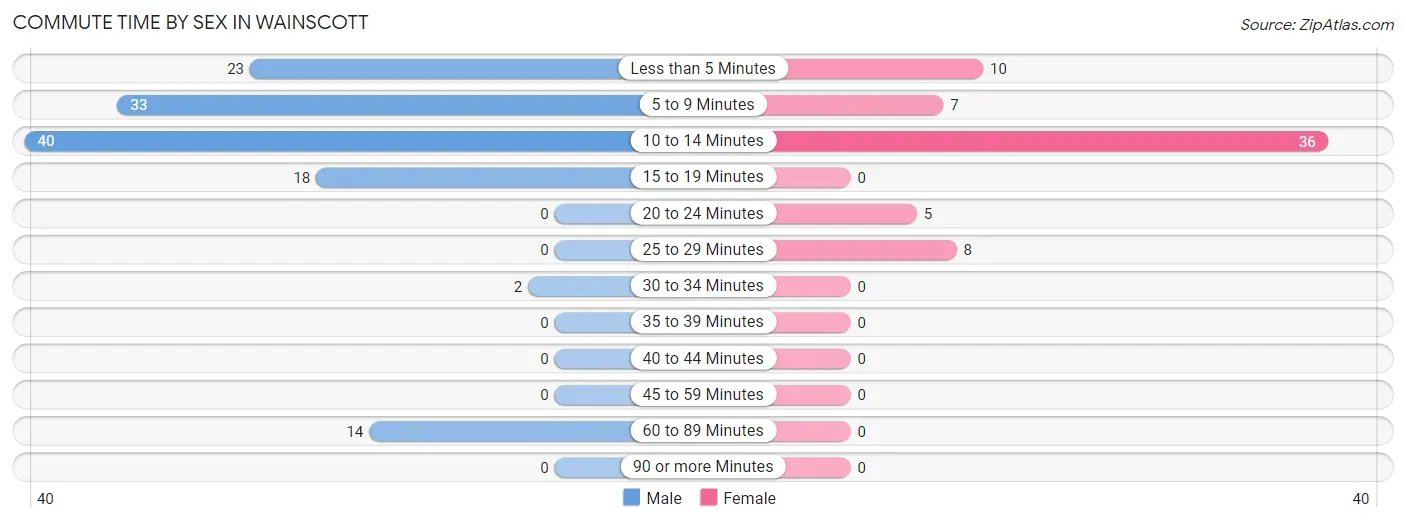
| Commute Time | Male | Female |
| Less than 5 Minutes | 23 (17.7%) | 10 (15.1%) |
| 5 to 9 Minutes | 33 (25.4%) | 7 (10.6%) |
| 10 to 14 Minutes | 40 (30.8%) | 36 (54.5%) |
| 15 to 19 Minutes | 18 (13.9%) | 0 (0.0%) |
| 20 to 24 Minutes | 0 (0.0%) | 5 (7.6%) |
| 25 to 29 Minutes | 0 (0.0%) | 8 (12.1%) |
| 30 to 34 Minutes | 2 (1.5%) | 0 (0.0%) |
| 35 to 39 Minutes | 0 (0.0%) | 0 (0.0%) |
| 40 to 44 Minutes | 0 (0.0%) | 0 (0.0%) |
| 45 to 59 Minutes | 0 (0.0%) | 0 (0.0%) |
| 60 to 89 Minutes | 14 (10.8%) | 0 (0.0%) |
| 90 or more Minutes | 0 (0.0%) | 0 (0.0%) |
Time of Departure to Work by Sex in Wainscott
The most frequent times of departure to work in Wainscott are 8:30 AM to 8:59 AM (28, 21.5%) for males and 5:30 AM to 5:59 AM (23, 34.8%) for females.
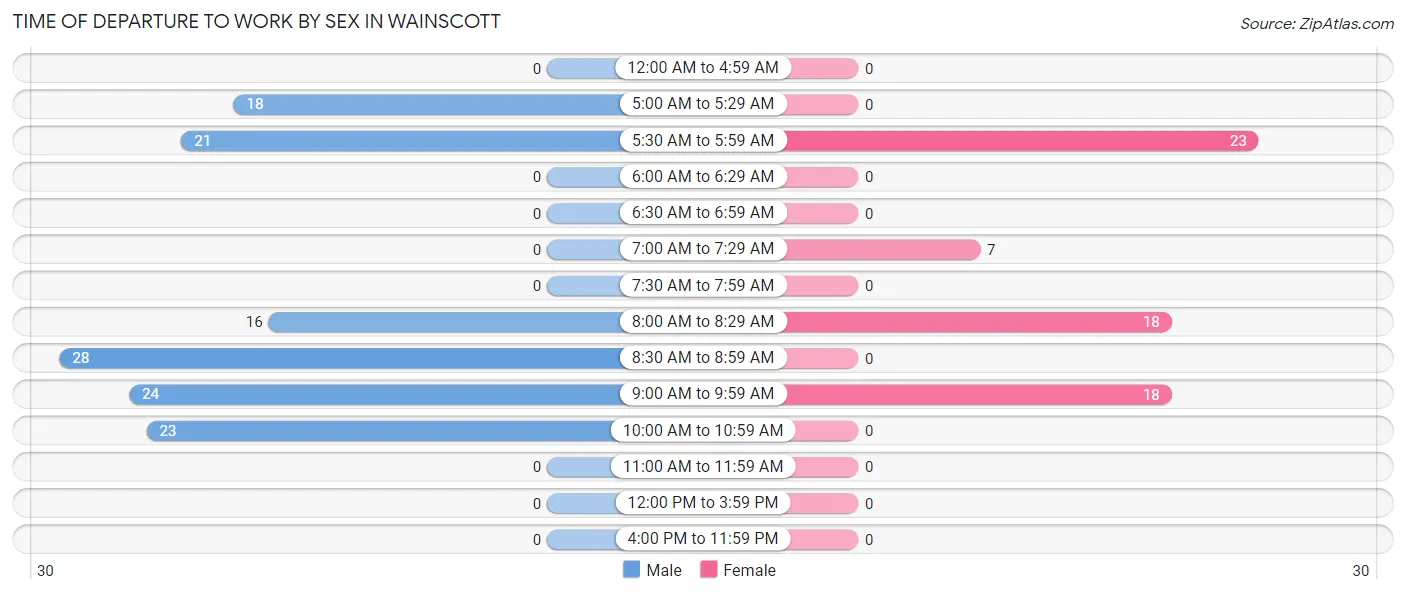
| Time of Departure | Male | Female |
| 12:00 AM to 4:59 AM | 0 (0.0%) | 0 (0.0%) |
| 5:00 AM to 5:29 AM | 18 (13.9%) | 0 (0.0%) |
| 5:30 AM to 5:59 AM | 21 (16.2%) | 23 (34.8%) |
| 6:00 AM to 6:29 AM | 0 (0.0%) | 0 (0.0%) |
| 6:30 AM to 6:59 AM | 0 (0.0%) | 0 (0.0%) |
| 7:00 AM to 7:29 AM | 0 (0.0%) | 7 (10.6%) |
| 7:30 AM to 7:59 AM | 0 (0.0%) | 0 (0.0%) |
| 8:00 AM to 8:29 AM | 16 (12.3%) | 18 (27.3%) |
| 8:30 AM to 8:59 AM | 28 (21.5%) | 0 (0.0%) |
| 9:00 AM to 9:59 AM | 24 (18.5%) | 18 (27.3%) |
| 10:00 AM to 10:59 AM | 23 (17.7%) | 0 (0.0%) |
| 11:00 AM to 11:59 AM | 0 (0.0%) | 0 (0.0%) |
| 12:00 PM to 3:59 PM | 0 (0.0%) | 0 (0.0%) |
| 4:00 PM to 11:59 PM | 0 (0.0%) | 0 (0.0%) |
| Total | 130 (100.0%) | 66 (100.0%) |
Housing Occupancy in Wainscott
Occupancy by Ownership in Wainscott
Of the total 296 dwellings in Wainscott, owner-occupied units account for 286 (96.6%), while renter-occupied units make up 10 (3.4%).
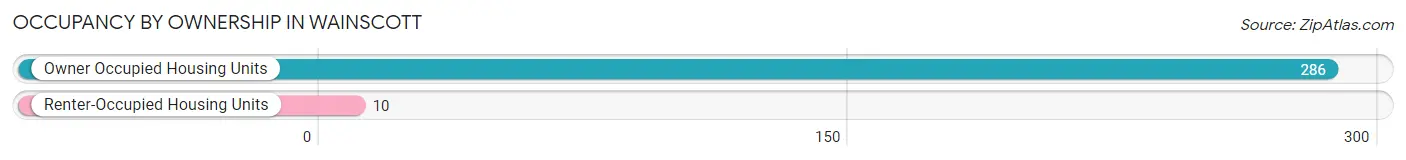
| Occupancy | # Housing Units | % Housing Units |
| Owner Occupied Housing Units | 286 | 96.6% |
| Renter-Occupied Housing Units | 10 | 3.4% |
| Total Occupied Housing Units | 296 | 100.0% |
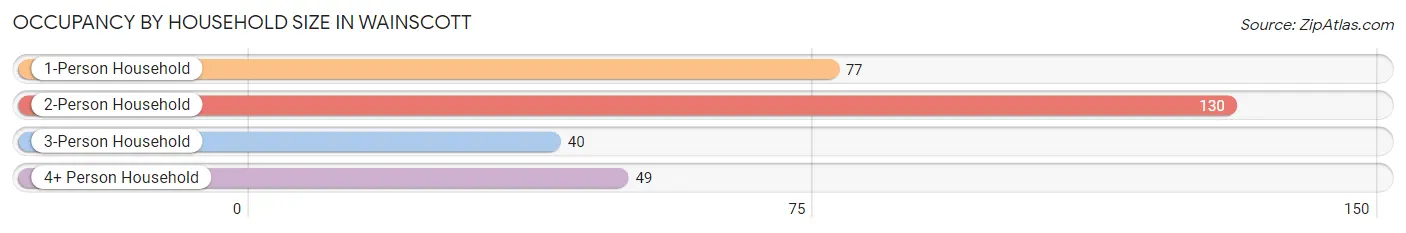
Occupancy by Household Size in Wainscott
| Household Size | # Housing Units | % Housing Units |
| 1-Person Household | 77 | 26.0% |
| 2-Person Household | 130 | 43.9% |
| 3-Person Household | 40 | 13.5% |
| 4+ Person Household | 49 | 16.6% |
| Total Housing Units | 296 | 100.0% |
Occupancy by Ownership by Household Size in Wainscott
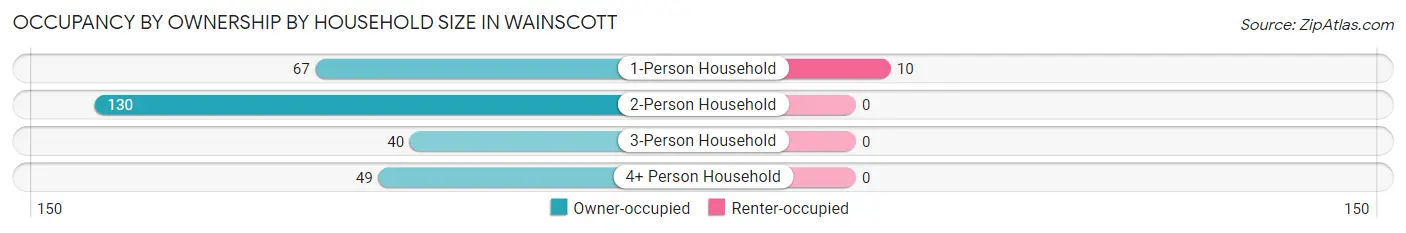
| Household Size | Owner-occupied | Renter-occupied |
| 1-Person Household | 67 (87.0%) | 10 (13.0%) |
| 2-Person Household | 130 (100.0%) | 0 (0.0%) |
| 3-Person Household | 40 (100.0%) | 0 (0.0%) |
| 4+ Person Household | 49 (100.0%) | 0 (0.0%) |
| Total Housing Units | 286 (96.6%) | 10 (3.4%) |
Occupancy by Educational Attainment in Wainscott
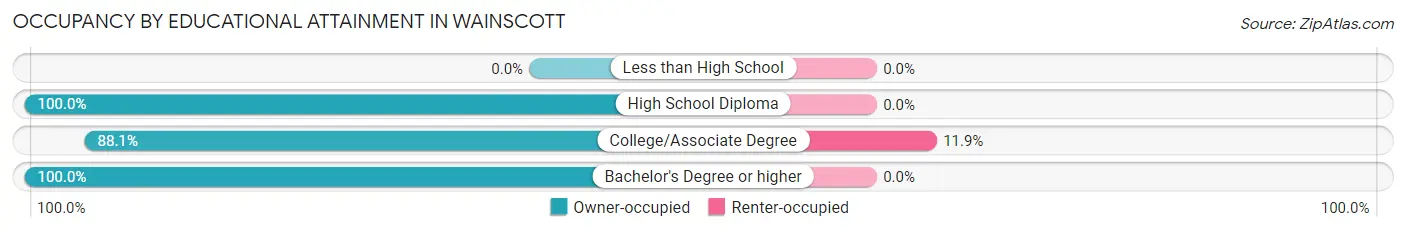
| Household Size | Owner-occupied | Renter-occupied |
| Less than High School | 0 (0.0%) | 0 (0.0%) |
| High School Diploma | 54 (100.0%) | 0 (0.0%) |
| College/Associate Degree | 74 (88.1%) | 10 (11.9%) |
| Bachelor's Degree or higher | 158 (100.0%) | 0 (0.0%) |
Occupancy by Age of Householder in Wainscott
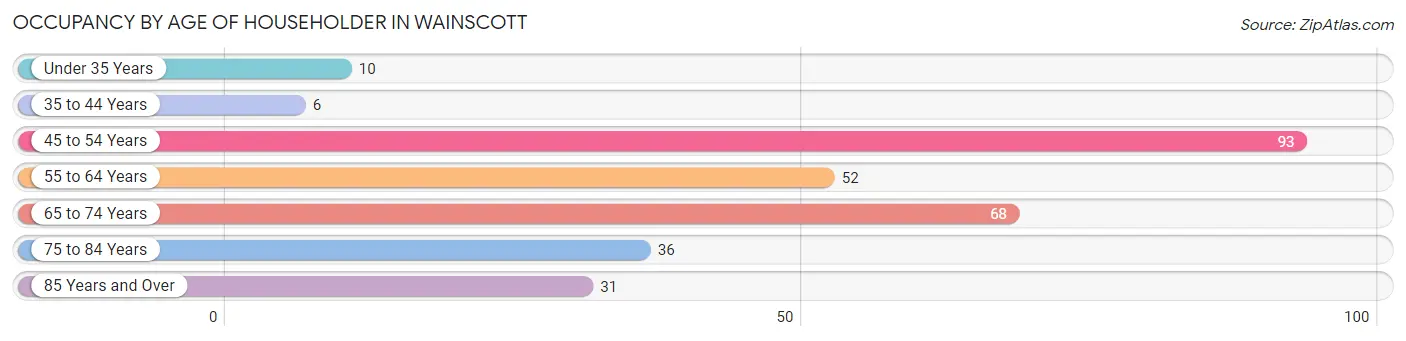
| Age Bracket | # Households | % Households |
| Under 35 Years | 10 | 3.4% |
| 35 to 44 Years | 6 | 2.0% |
| 45 to 54 Years | 93 | 31.4% |
| 55 to 64 Years | 52 | 17.6% |
| 65 to 74 Years | 68 | 23.0% |
| 75 to 84 Years | 36 | 12.2% |
| 85 Years and Over | 31 | 10.5% |
| Total | 296 | 100.0% |
Housing Finances in Wainscott
Median Income by Occupancy in Wainscott
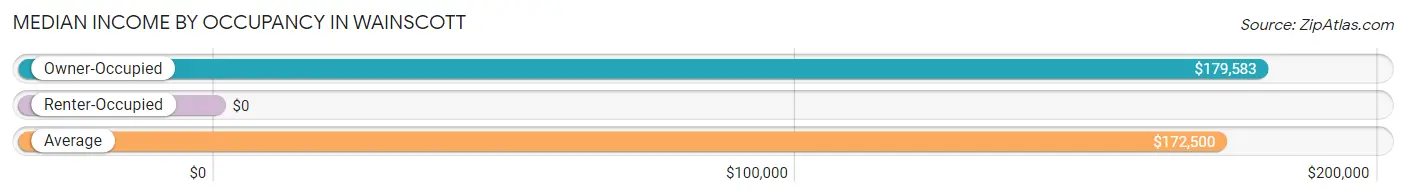
| Occupancy Type | # Households | Median Income |
| Owner-Occupied | 286 (96.6%) | $179,583 |
| Renter-Occupied | 10 (3.4%) | $0 |
| Average | 296 (100.0%) | $172,500 |
Occupancy by Householder Income Bracket in Wainscott
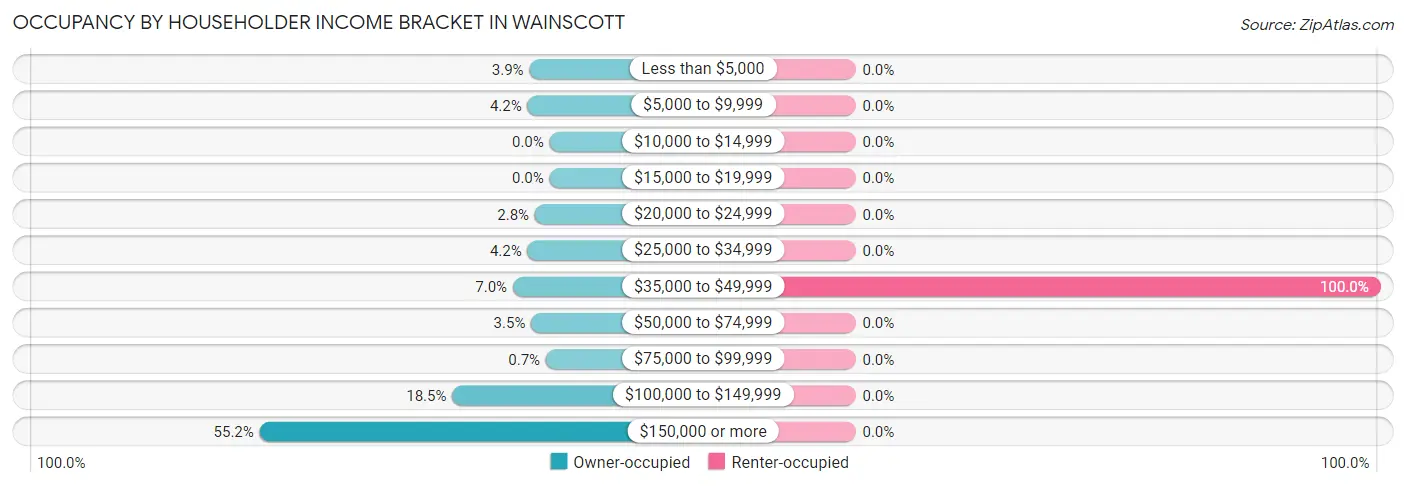
| Income Bracket | Owner-occupied | Renter-occupied |
| Less than $5,000 | 11 (3.8%) | 0 (0.0%) |
| $5,000 to $9,999 | 12 (4.2%) | 0 (0.0%) |
| $10,000 to $14,999 | 0 (0.0%) | 0 (0.0%) |
| $15,000 to $19,999 | 0 (0.0%) | 0 (0.0%) |
| $20,000 to $24,999 | 8 (2.8%) | 0 (0.0%) |
| $25,000 to $34,999 | 12 (4.2%) | 0 (0.0%) |
| $35,000 to $49,999 | 20 (7.0%) | 10 (100.0%) |
| $50,000 to $74,999 | 10 (3.5%) | 0 (0.0%) |
| $75,000 to $99,999 | 2 (0.7%) | 0 (0.0%) |
| $100,000 to $149,999 | 53 (18.5%) | 0 (0.0%) |
| $150,000 or more | 158 (55.2%) | 0 (0.0%) |
| Total | 286 (100.0%) | 10 (100.0%) |
Monthly Housing Cost Tiers in Wainscott
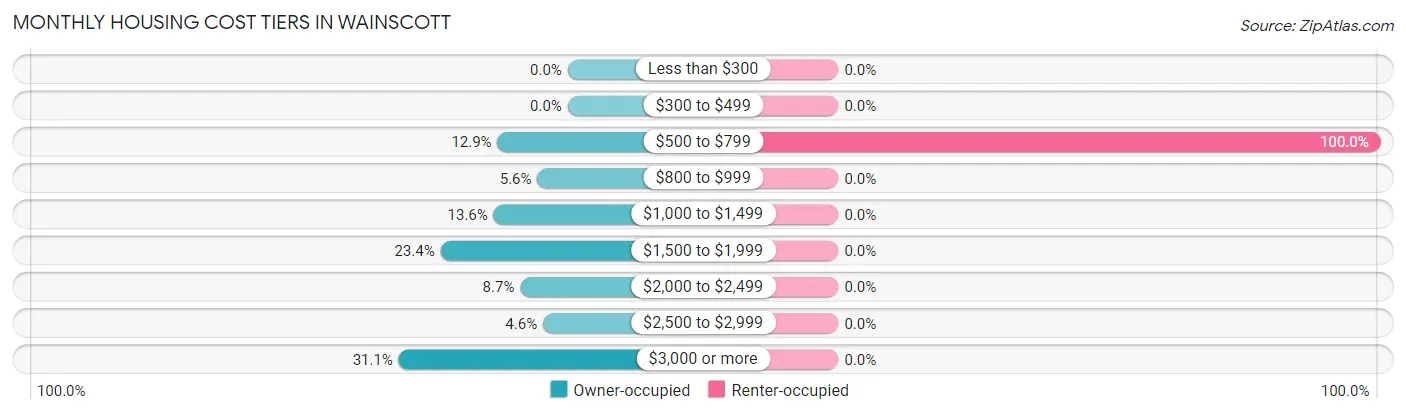
| Monthly Cost | Owner-occupied | Renter-occupied |
| Less than $300 | 0 (0.0%) | 0 (0.0%) |
| $300 to $499 | 0 (0.0%) | 0 (0.0%) |
| $500 to $799 | 37 (12.9%) | 10 (100.0%) |
| $800 to $999 | 16 (5.6%) | 0 (0.0%) |
| $1,000 to $1,499 | 39 (13.6%) | 0 (0.0%) |
| $1,500 to $1,999 | 67 (23.4%) | 0 (0.0%) |
| $2,000 to $2,499 | 25 (8.7%) | 0 (0.0%) |
| $2,500 to $2,999 | 13 (4.5%) | 0 (0.0%) |
| $3,000 or more | 89 (31.1%) | 0 (0.0%) |
| Total | 286 (100.0%) | 10 (100.0%) |
Physical Housing Characteristics in Wainscott
Housing Structures in Wainscott
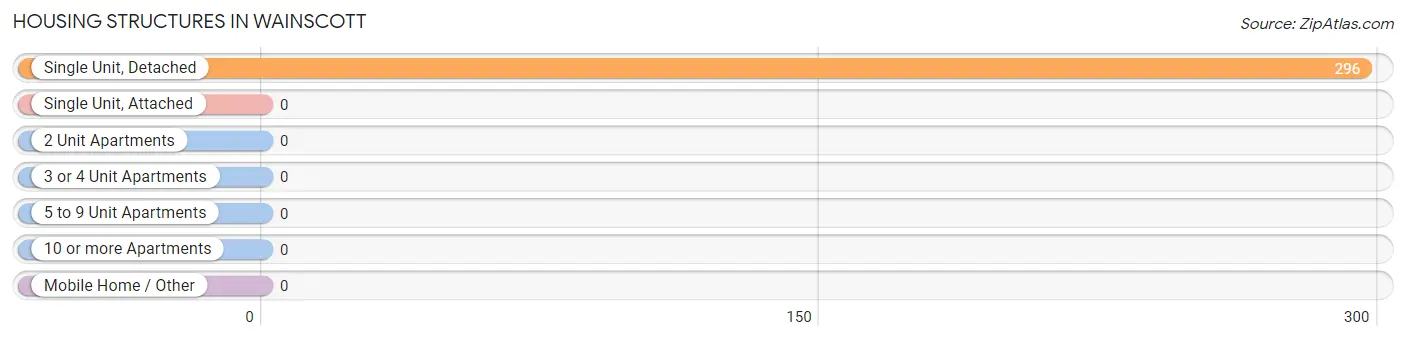
| Structure Type | # Housing Units | % Housing Units |
| Single Unit, Detached | 296 | 100.0% |
| Single Unit, Attached | 0 | 0.0% |
| 2 Unit Apartments | 0 | 0.0% |
| 3 or 4 Unit Apartments | 0 | 0.0% |
| 5 to 9 Unit Apartments | 0 | 0.0% |
| 10 or more Apartments | 0 | 0.0% |
| Mobile Home / Other | 0 | 0.0% |
| Total | 296 | 100.0% |
Housing Structures by Occupancy in Wainscott
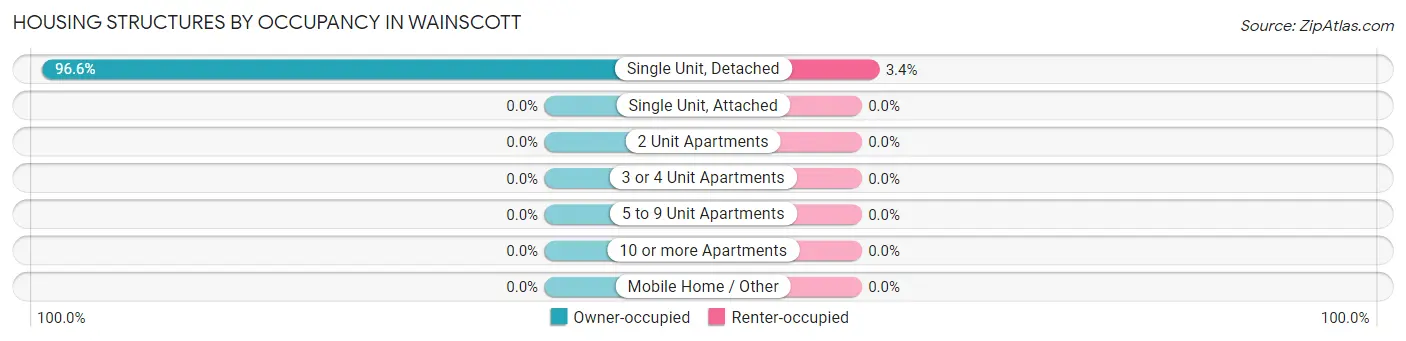
| Structure Type | Owner-occupied | Renter-occupied |
| Single Unit, Detached | 286 (96.6%) | 10 (3.4%) |
| Single Unit, Attached | 0 (0.0%) | 0 (0.0%) |
| 2 Unit Apartments | 0 (0.0%) | 0 (0.0%) |
| 3 or 4 Unit Apartments | 0 (0.0%) | 0 (0.0%) |
| 5 to 9 Unit Apartments | 0 (0.0%) | 0 (0.0%) |
| 10 or more Apartments | 0 (0.0%) | 0 (0.0%) |
| Mobile Home / Other | 0 (0.0%) | 0 (0.0%) |
| Total | 286 (96.6%) | 10 (3.4%) |
Housing Structures by Number of Rooms in Wainscott
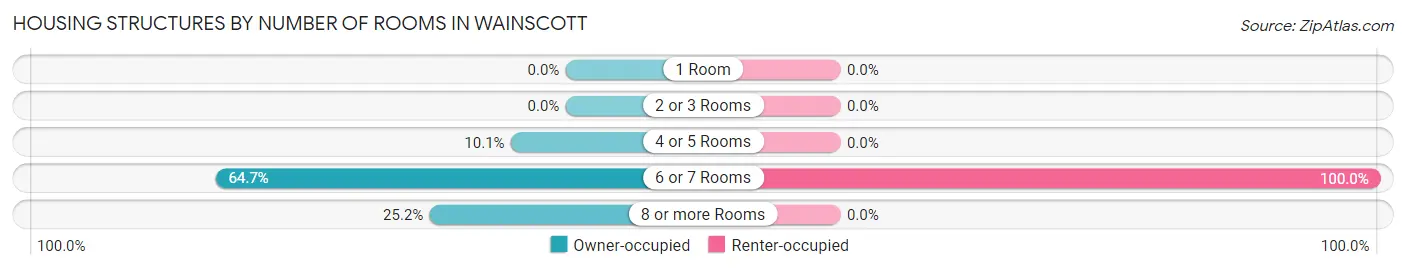
| Number of Rooms | Owner-occupied | Renter-occupied |
| 1 Room | 0 (0.0%) | 0 (0.0%) |
| 2 or 3 Rooms | 0 (0.0%) | 0 (0.0%) |
| 4 or 5 Rooms | 29 (10.1%) | 0 (0.0%) |
| 6 or 7 Rooms | 185 (64.7%) | 10 (100.0%) |
| 8 or more Rooms | 72 (25.2%) | 0 (0.0%) |
| Total | 286 (100.0%) | 10 (100.0%) |
Housing Structure by Heating Type in Wainscott
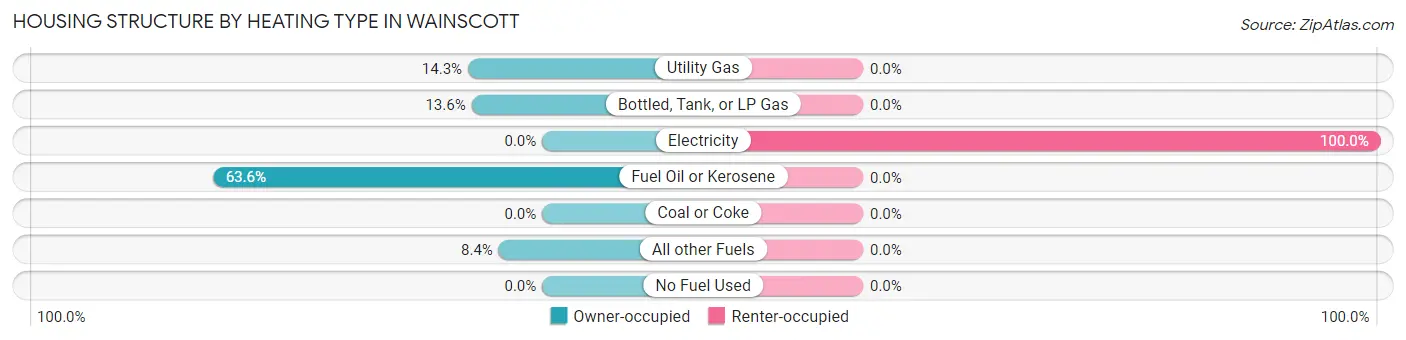
| Heating Type | Owner-occupied | Renter-occupied |
| Utility Gas | 41 (14.3%) | 0 (0.0%) |
| Bottled, Tank, or LP Gas | 39 (13.6%) | 0 (0.0%) |
| Electricity | 0 (0.0%) | 10 (100.0%) |
| Fuel Oil or Kerosene | 182 (63.6%) | 0 (0.0%) |
| Coal or Coke | 0 (0.0%) | 0 (0.0%) |
| All other Fuels | 24 (8.4%) | 0 (0.0%) |
| No Fuel Used | 0 (0.0%) | 0 (0.0%) |
| Total | 286 (100.0%) | 10 (100.0%) |
Household Vehicle Usage in Wainscott
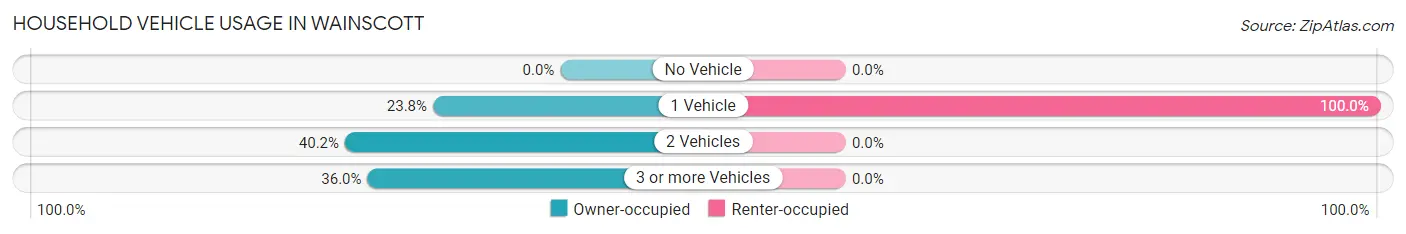
| Vehicles per Household | Owner-occupied | Renter-occupied |
| No Vehicle | 0 (0.0%) | 0 (0.0%) |
| 1 Vehicle | 68 (23.8%) | 10 (100.0%) |
| 2 Vehicles | 115 (40.2%) | 0 (0.0%) |
| 3 or more Vehicles | 103 (36.0%) | 0 (0.0%) |
| Total | 286 (100.0%) | 10 (100.0%) |
Real Estate & Mortgages in Wainscott
Real Estate and Mortgage Overview in Wainscott
| Characteristic | Without Mortgage | With Mortgage |
| Housing Units | 149 | 137 |
| Median Property Value | $2,000,001 | $1,734,400 |
| Median Household Income | - | - |
| Monthly Housing Costs | $1,356 | $75 |
| Real Estate Taxes | $7,770 | $0 |
Property Value by Mortgage Status in Wainscott
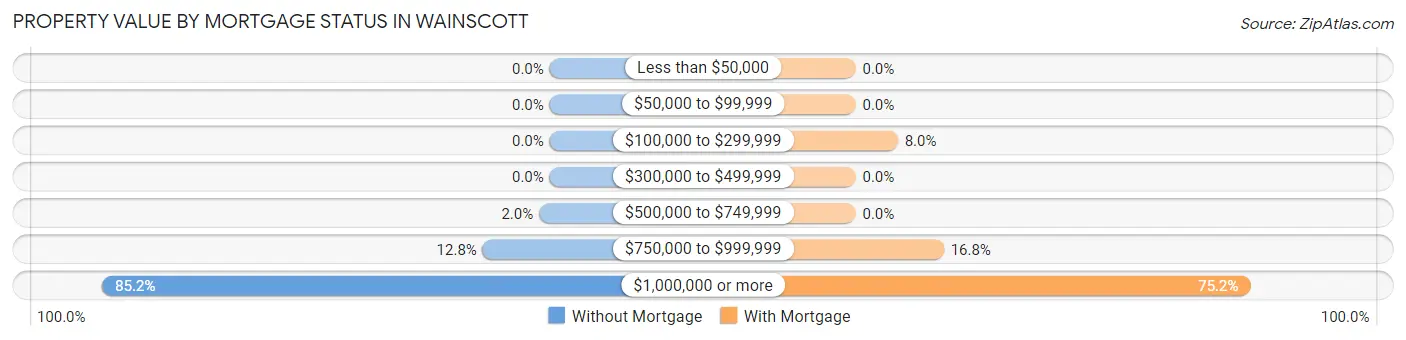
| Property Value | Without Mortgage | With Mortgage |
| Less than $50,000 | 0 (0.0%) | 0 (0.0%) |
| $50,000 to $99,999 | 0 (0.0%) | 0 (0.0%) |
| $100,000 to $299,999 | 0 (0.0%) | 11 (8.0%) |
| $300,000 to $499,999 | 0 (0.0%) | 0 (0.0%) |
| $500,000 to $749,999 | 3 (2.0%) | 0 (0.0%) |
| $750,000 to $999,999 | 19 (12.8%) | 23 (16.8%) |
| $1,000,000 or more | 127 (85.2%) | 103 (75.2%) |
| Total | 149 (100.0%) | 137 (100.0%) |
Household Income by Mortgage Status in Wainscott
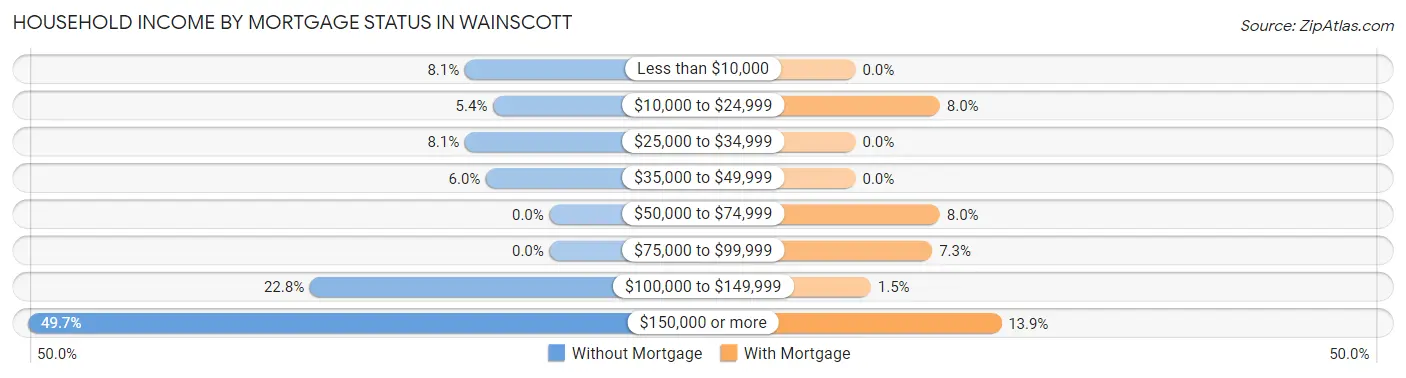
| Household Income | Without Mortgage | With Mortgage |
| Less than $10,000 | 12 (8.1%) | 0 (0.0%) |
| $10,000 to $24,999 | 8 (5.4%) | 11 (8.0%) |
| $25,000 to $34,999 | 12 (8.1%) | 0 (0.0%) |
| $35,000 to $49,999 | 9 (6.0%) | 0 (0.0%) |
| $50,000 to $74,999 | 0 (0.0%) | 11 (8.0%) |
| $75,000 to $99,999 | 0 (0.0%) | 10 (7.3%) |
| $100,000 to $149,999 | 34 (22.8%) | 2 (1.5%) |
| $150,000 or more | 74 (49.7%) | 19 (13.9%) |
| Total | 149 (100.0%) | 137 (100.0%) |
Property Value to Household Income Ratio in Wainscott
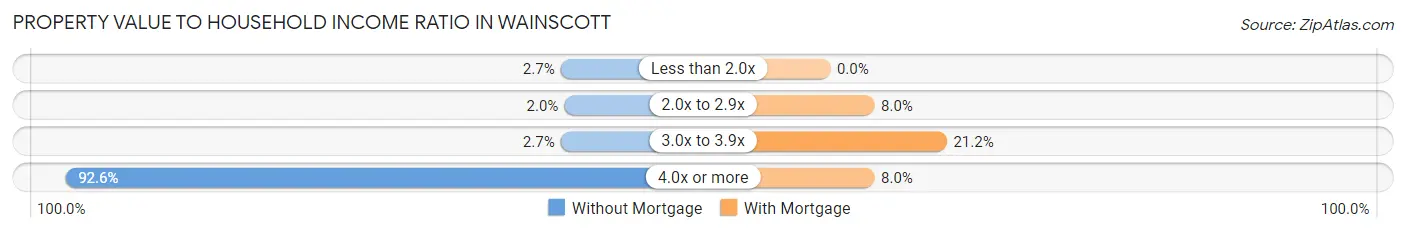
| Value-to-Income Ratio | Without Mortgage | With Mortgage |
| Less than 2.0x | 4 (2.7%) | 0 (0.0%) |
| 2.0x to 2.9x | 3 (2.0%) | 11 (8.0%) |
| 3.0x to 3.9x | 4 (2.7%) | 29 (21.2%) |
| 4.0x or more | 138 (92.6%) | 11 (8.0%) |
| Total | 149 (100.0%) | 137 (100.0%) |
Real Estate Taxes by Mortgage Status in Wainscott
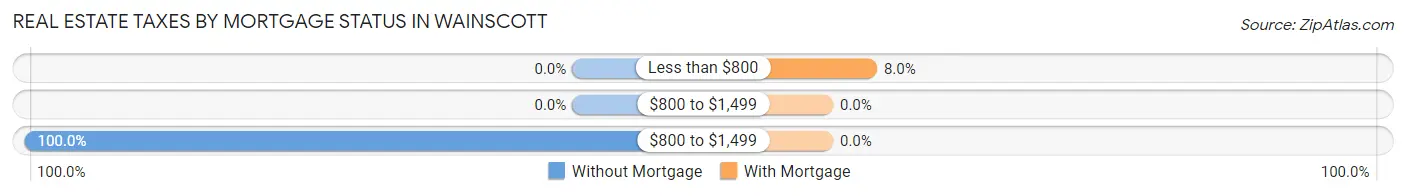
| Property Taxes | Without Mortgage | With Mortgage |
| Less than $800 | 0 (0.0%) | 11 (8.0%) |
| $800 to $1,499 | 0 (0.0%) | 0 (0.0%) |
| $800 to $1,499 | 149 (100.0%) | 0 (0.0%) |
| Total | 149 (100.0%) | 137 (100.0%) |
Health & Disability in Wainscott
Health Insurance Coverage by Age in Wainscott
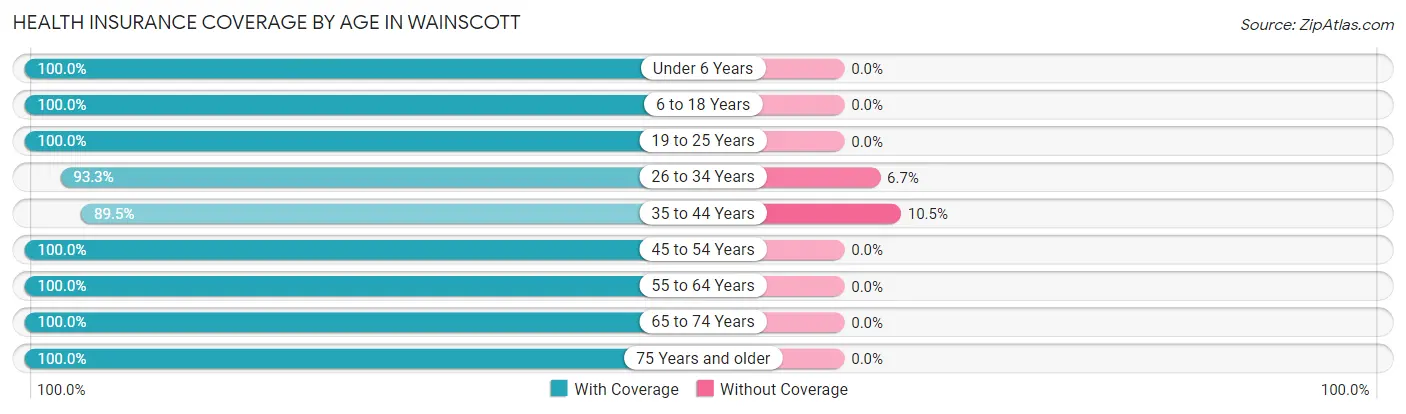
| Age Bracket | With Coverage | Without Coverage |
| Under 6 Years | 13 (100.0%) | 0 (0.0%) |
| 6 to 18 Years | 35 (100.0%) | 0 (0.0%) |
| 19 to 25 Years | 12 (100.0%) | 0 (0.0%) |
| 26 to 34 Years | 42 (93.3%) | 3 (6.7%) |
| 35 to 44 Years | 51 (89.5%) | 6 (10.5%) |
| 45 to 54 Years | 95 (100.0%) | 0 (0.0%) |
| 55 to 64 Years | 101 (100.0%) | 0 (0.0%) |
| 65 to 74 Years | 110 (100.0%) | 0 (0.0%) |
| 75 Years and older | 117 (100.0%) | 0 (0.0%) |
| Total | 576 (98.5%) | 9 (1.5%) |
Health Insurance Coverage by Citizenship Status in Wainscott

| Citizenship Status | With Coverage | Without Coverage |
| Native Born | 13 (100.0%) | 0 (0.0%) |
| Foreign Born, Citizen | 35 (100.0%) | 0 (0.0%) |
| Foreign Born, not a Citizen | 12 (100.0%) | 0 (0.0%) |
Health Insurance Coverage by Household Income in Wainscott
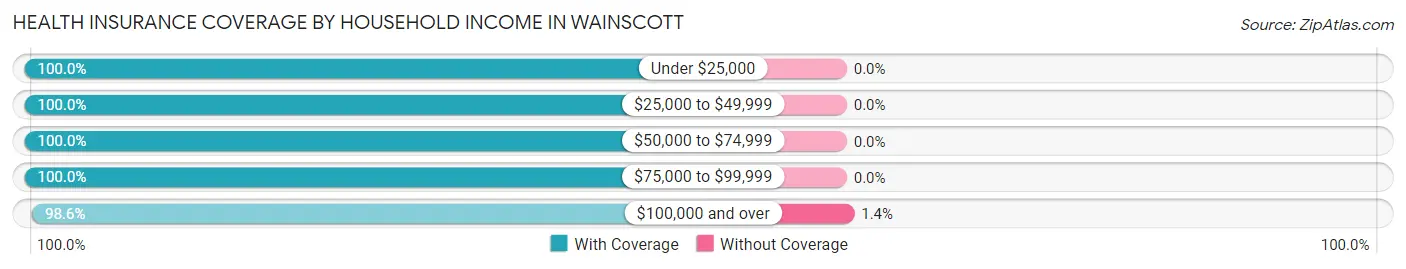
| Household Income | With Coverage | Without Coverage |
| Under $25,000 | 52 (100.0%) | 0 (0.0%) |
| $25,000 to $49,999 | 54 (100.0%) | 0 (0.0%) |
| $50,000 to $74,999 | 10 (100.0%) | 0 (0.0%) |
| $75,000 to $99,999 | 3 (100.0%) | 0 (0.0%) |
| $100,000 and over | 423 (98.6%) | 6 (1.4%) |
Public vs Private Health Insurance Coverage by Age in Wainscott
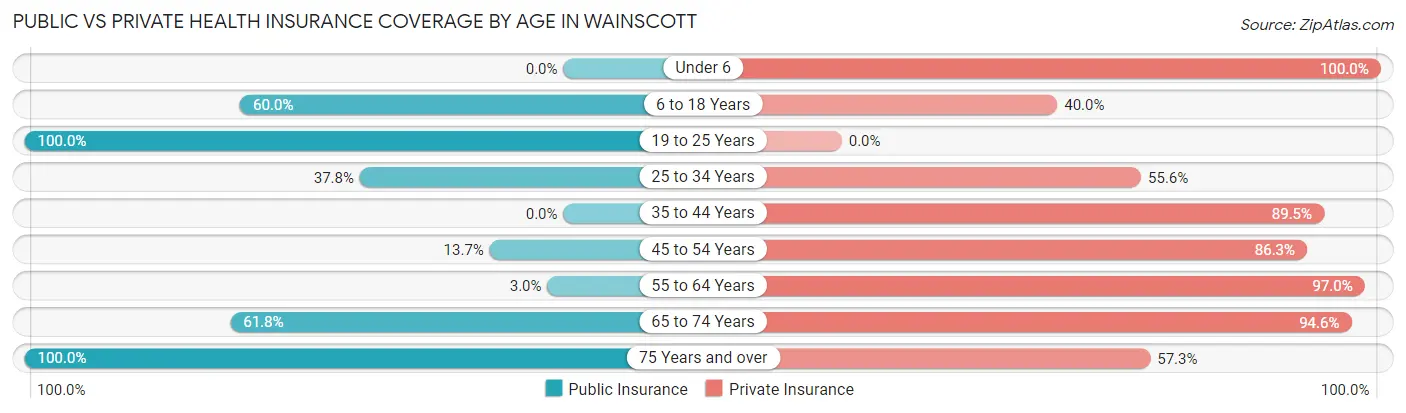
| Age Bracket | Public Insurance | Private Insurance |
| Under 6 | 0 (0.0%) | 13 (100.0%) |
| 6 to 18 Years | 21 (60.0%) | 14 (40.0%) |
| 19 to 25 Years | 12 (100.0%) | 0 (0.0%) |
| 25 to 34 Years | 17 (37.8%) | 25 (55.6%) |
| 35 to 44 Years | 0 (0.0%) | 51 (89.5%) |
| 45 to 54 Years | 13 (13.7%) | 82 (86.3%) |
| 55 to 64 Years | 3 (3.0%) | 98 (97.0%) |
| 65 to 74 Years | 68 (61.8%) | 104 (94.6%) |
| 75 Years and over | 117 (100.0%) | 67 (57.3%) |
| Total | 251 (42.9%) | 454 (77.6%) |
Disability Status by Sex by Age in Wainscott
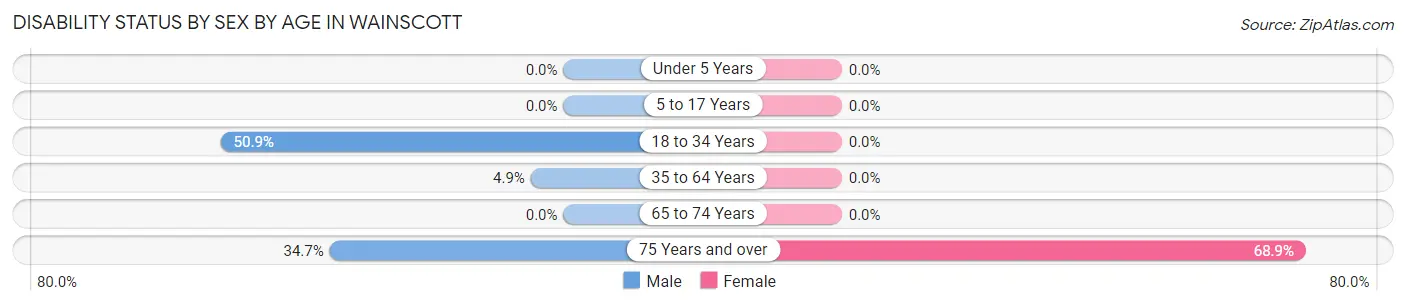
| Age Bracket | Male | Female |
| Under 5 Years | 0 (0.0%) | 0 (0.0%) |
| 5 to 17 Years | 0 (0.0%) | 0 (0.0%) |
| 18 to 34 Years | 29 (50.9%) | 0 (0.0%) |
| 35 to 64 Years | 5 (4.9%) | 0 (0.0%) |
| 65 to 74 Years | 0 (0.0%) | 0 (0.0%) |
| 75 Years and over | 25 (34.7%) | 31 (68.9%) |
Disability Class by Sex by Age in Wainscott
Disability Class: Hearing Difficulty
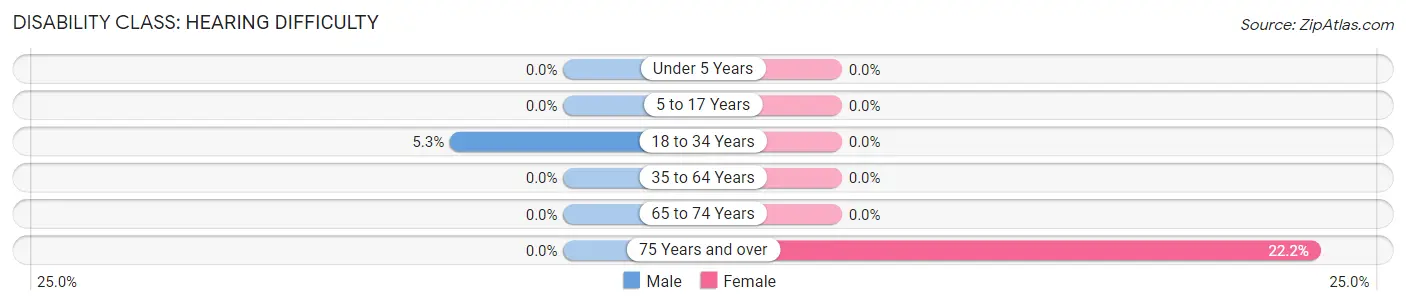
| Age Bracket | Male | Female |
| Under 5 Years | 0 (0.0%) | 0 (0.0%) |
| 5 to 17 Years | 0 (0.0%) | 0 (0.0%) |
| 18 to 34 Years | 3 (5.3%) | 0 (0.0%) |
| 35 to 64 Years | 0 (0.0%) | 0 (0.0%) |
| 65 to 74 Years | 0 (0.0%) | 0 (0.0%) |
| 75 Years and over | 0 (0.0%) | 10 (22.2%) |
Disability Class: Vision Difficulty
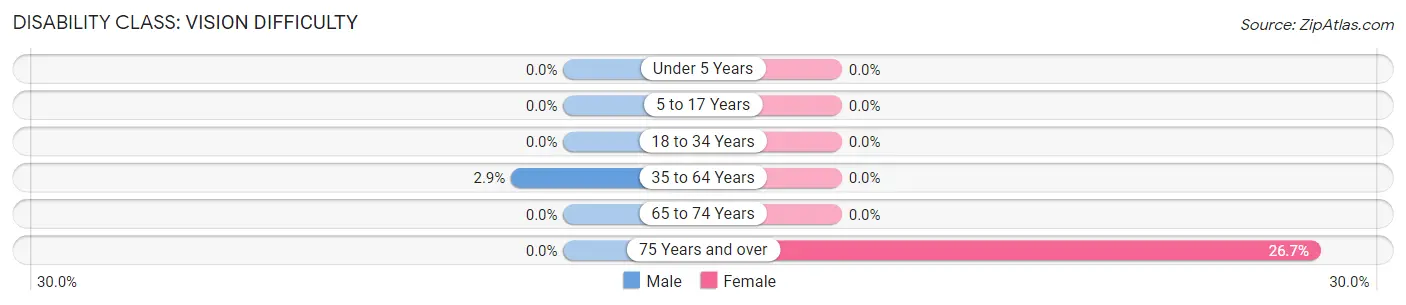
| Age Bracket | Male | Female |
| Under 5 Years | 0 (0.0%) | 0 (0.0%) |
| 5 to 17 Years | 0 (0.0%) | 0 (0.0%) |
| 18 to 34 Years | 0 (0.0%) | 0 (0.0%) |
| 35 to 64 Years | 3 (2.9%) | 0 (0.0%) |
| 65 to 74 Years | 0 (0.0%) | 0 (0.0%) |
| 75 Years and over | 0 (0.0%) | 12 (26.7%) |
Disability Class: Cognitive Difficulty
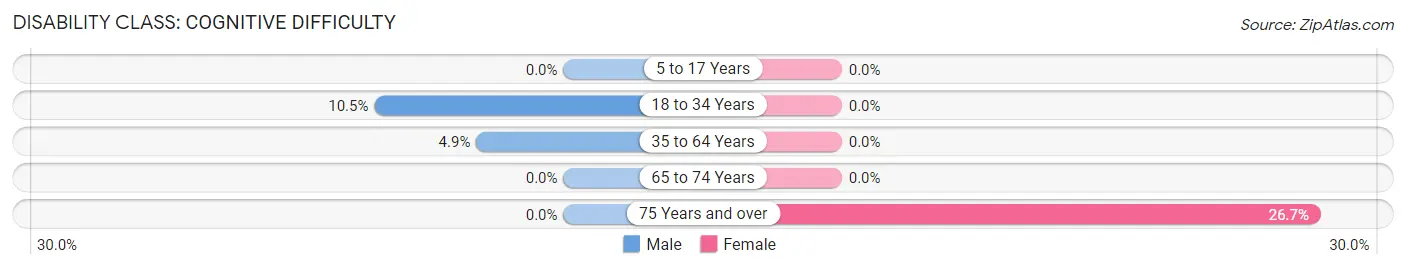
| Age Bracket | Male | Female |
| 5 to 17 Years | 0 (0.0%) | 0 (0.0%) |
| 18 to 34 Years | 6 (10.5%) | 0 (0.0%) |
| 35 to 64 Years | 5 (4.9%) | 0 (0.0%) |
| 65 to 74 Years | 0 (0.0%) | 0 (0.0%) |
| 75 Years and over | 0 (0.0%) | 12 (26.7%) |
Disability Class: Ambulatory Difficulty
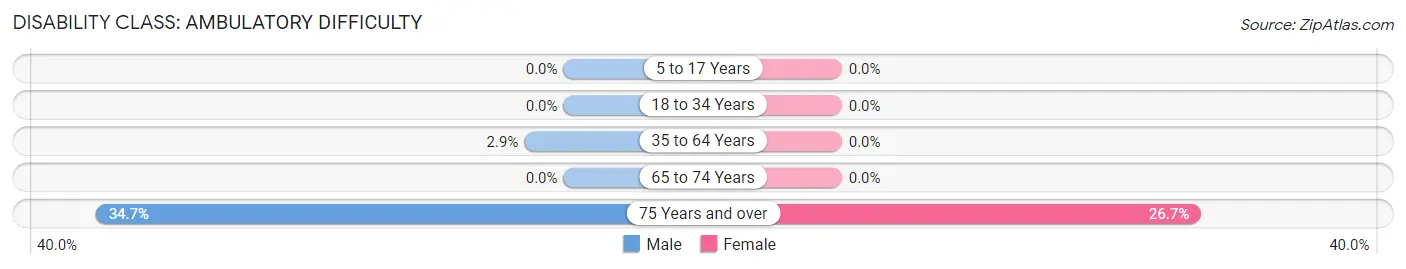
| Age Bracket | Male | Female |
| 5 to 17 Years | 0 (0.0%) | 0 (0.0%) |
| 18 to 34 Years | 0 (0.0%) | 0 (0.0%) |
| 35 to 64 Years | 3 (2.9%) | 0 (0.0%) |
| 65 to 74 Years | 0 (0.0%) | 0 (0.0%) |
| 75 Years and over | 25 (34.7%) | 12 (26.7%) |
Disability Class: Self-Care Difficulty
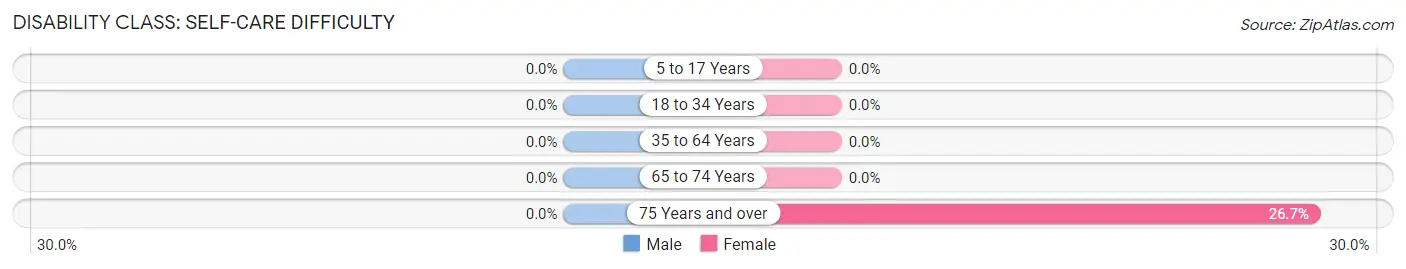
| Age Bracket | Male | Female |
| 5 to 17 Years | 0 (0.0%) | 0 (0.0%) |
| 18 to 34 Years | 0 (0.0%) | 0 (0.0%) |
| 35 to 64 Years | 0 (0.0%) | 0 (0.0%) |
| 65 to 74 Years | 0 (0.0%) | 0 (0.0%) |
| 75 Years and over | 0 (0.0%) | 12 (26.7%) |
Technology Access in Wainscott
Computing Device Access in Wainscott
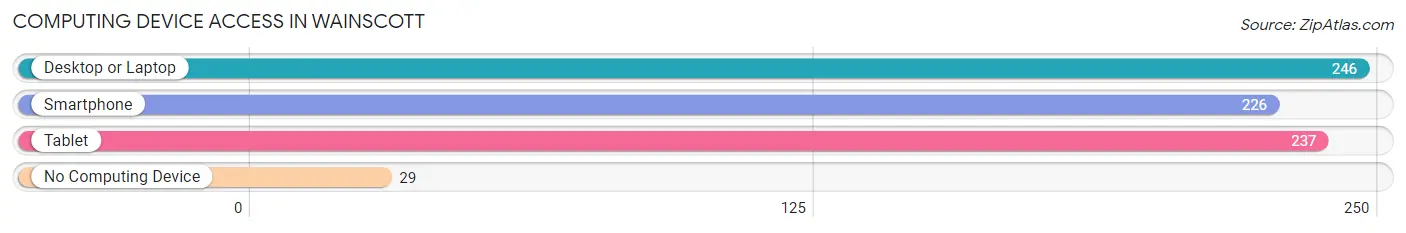
| Device Type | # Households | % Households |
| Desktop or Laptop | 246 | 83.1% |
| Smartphone | 226 | 76.3% |
| Tablet | 237 | 80.1% |
| No Computing Device | 29 | 9.8% |
| Total | 296 | 100.0% |
Internet Access in Wainscott
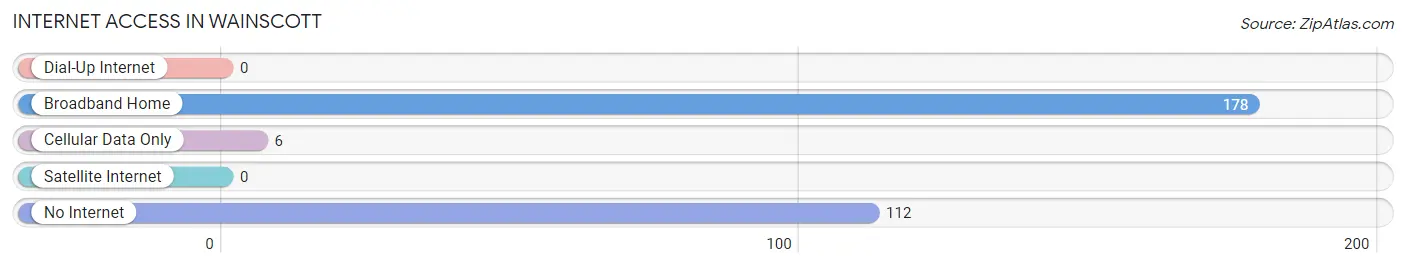
| Internet Type | # Households | % Households |
| Dial-Up Internet | 0 | 0.0% |
| Broadband Home | 178 | 60.1% |
| Cellular Data Only | 6 | 2.0% |
| Satellite Internet | 0 | 0.0% |
| No Internet | 112 | 37.8% |
| Total | 296 | 100.0% |
Wainscott Summary
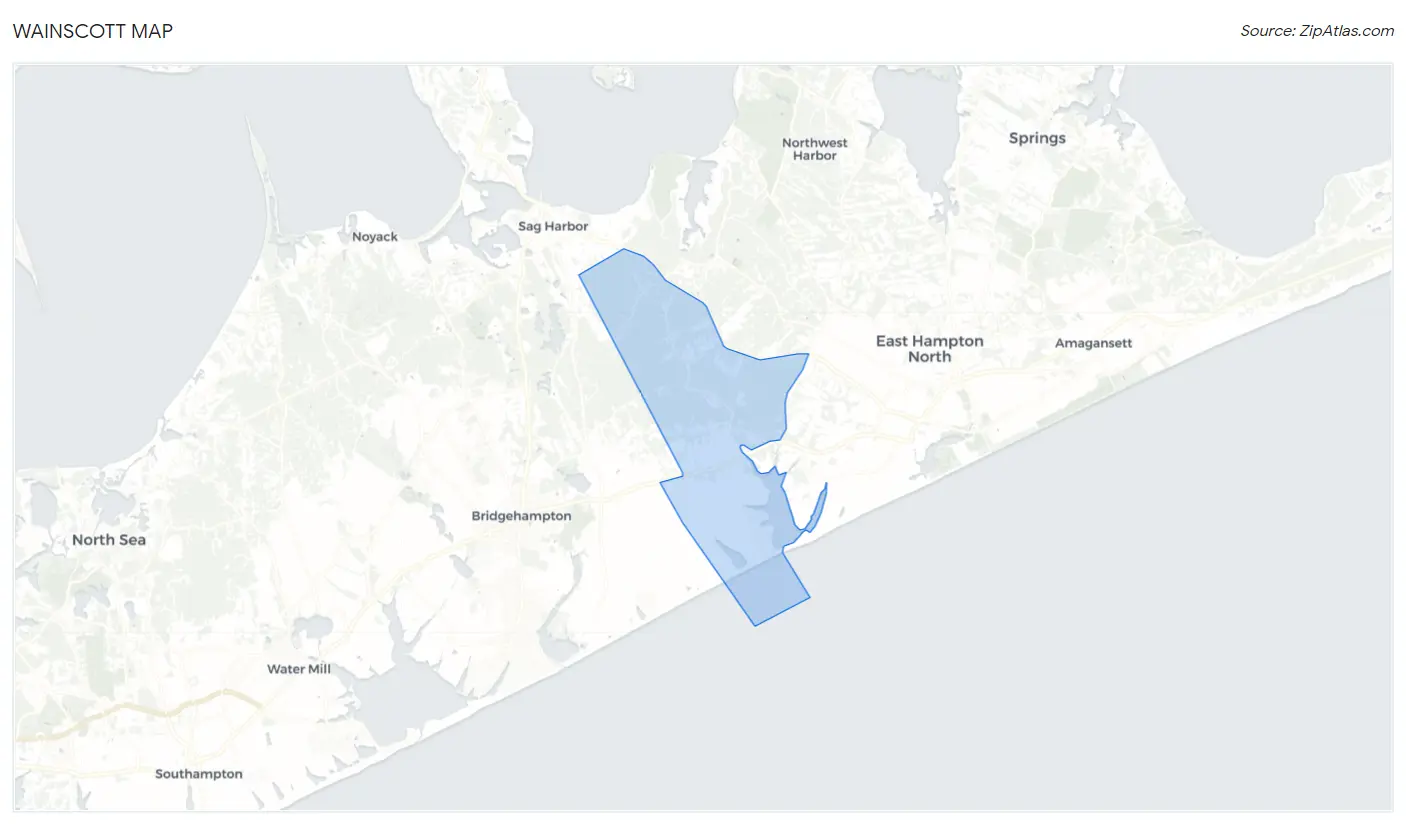
Wainscott is a hamlet located in the Town of East Hampton in Suffolk County, New York. It is situated on the South Fork of Long Island, approximately 90 miles east of New York City. The hamlet is bordered by the Atlantic Ocean to the south, the Town of Southampton to the west, and the hamlet of East Hampton to the north. Wainscott is a small, rural community with a population of approximately 1,000 people.
Geography
Wainscott is located on the South Fork of Long Island, approximately 90 miles east of New York City. The hamlet is bordered by the Atlantic Ocean to the south, the Town of Southampton to the west, and the hamlet of East Hampton to the north. The hamlet is situated on a peninsula, with the Atlantic Ocean to the south and the Peconic Bay to the north. The hamlet is approximately 4.5 square miles in size, with a total land area of approximately 11.5 square miles.
The terrain of Wainscott is mostly flat, with some rolling hills. The hamlet is home to several freshwater ponds, including Wainscott Pond, which is located in the center of the hamlet. The hamlet is also home to several beaches, including Wainscott Beach, which is located on the Atlantic Ocean.
History
The area that is now Wainscott was originally inhabited by the Shinnecock Native American tribe. The first European settlers arrived in the area in the late 1600s, and the hamlet was officially established in 1703. The hamlet was named after the Wainscott family, who were among the first settlers in the area.
In the late 1800s, Wainscott became a popular summer destination for wealthy New Yorkers. The hamlet was home to several large estates, including the Wainscott Estate, which was owned by the Wainscott family. The hamlet also became a popular destination for artists, writers, and other creative types.
Economy
The economy of Wainscott is largely based on tourism and agriculture. The hamlet is home to several farms, which produce a variety of fruits and vegetables. The hamlet is also home to several wineries, which produce a variety of wines.
The hamlet is also home to several small businesses, including restaurants, shops, and galleries. The hamlet is also home to several bed and breakfasts, which cater to tourists.
Demographics
As of the 2010 census, the population of Wainscott was 1,000 people. The racial makeup of the hamlet was 94.2% White, 2.2% African American, 0.7% Asian, 0.3% Native American, and 2.6% from other races. The median household income in Wainscott was $75,000, and the median family income was $90,000.
The hamlet is home to several churches, including the Wainscott United Methodist Church and the Wainscott Presbyterian Church. The hamlet is also home to several schools, including the Wainscott Elementary School and the Wainscott High School.
Conclusion
Wainscott is a small, rural hamlet located on the South Fork of Long Island, approximately 90 miles east of New York City. The hamlet is bordered by the Atlantic Ocean to the south, the Town of Southampton to the west, and the hamlet of East Hampton to the north. The hamlet is home to approximately 1,000 people, and the economy is largely based on tourism and agriculture. The hamlet is home to several churches, schools, farms, wineries, restaurants, shops, and galleries.
Common Questions
What is Per Capita Income in Wainscott?
Per Capita income in Wainscott is $126,952.
What is the Median Family Income in Wainscott?
Median Family Income in Wainscott is $250,001.
What is the Median Household income in Wainscott?
Median Household Income in Wainscott is $172,500.
What is Inequality or Gini Index in Wainscott?
Inequality or Gini Index in Wainscott is 0.53.
What is the Total Population of Wainscott?
Total Population of Wainscott is 585.
What is the Total Male Population of Wainscott?
Total Male Population of Wainscott is 321.
What is the Total Female Population of Wainscott?
Total Female Population of Wainscott is 264.
What is the Ratio of Males per 100 Females in Wainscott?
There are 121.59 Males per 100 Females in Wainscott.
What is the Ratio of Females per 100 Males in Wainscott?
There are 82.24 Females per 100 Males in Wainscott.
What is the Median Population Age in Wainscott?
Median Population Age in Wainscott is 59.6 Years.
What is the Average Family Size in Wainscott
Average Family Size in Wainscott is 2.2 People.
What is the Average Household Size in Wainscott
Average Household Size in Wainscott is 1.9 People.
How Large is the Labor Force in Wainscott?
There are 311 People in the Labor Forcein in Wainscott.
What is the Percentage of People in the Labor Force in Wainscott?
56.0% of People are in the Labor Force in Wainscott.
What is the Unemployment Rate in Wainscott?
Unemployment Rate in Wainscott is 5.5%.