Long Lake, NY Map & Demographics
Long Lake Map
Long Lake Overview
$40,760
PER CAPITA INCOME
$85,625
AVG FAMILY INCOME
$67,917
AVG HOUSEHOLD INCOME
47.1%
WAGE / INCOME GAP [ % ]
52.9¢/ $1
WAGE / INCOME GAP [ $ ]
0.45
INEQUALITY / GINI INDEX
666
TOTAL POPULATION
330
MALE POPULATION
336
FEMALE POPULATION
98.21
MALES / 100 FEMALES
101.82
FEMALES / 100 MALES
59.3
MEDIAN AGE
3.5
AVG FAMILY SIZE
2.8
AVG HOUSEHOLD SIZE
315
LABOR FORCE [ PEOPLE ]
53.0%
PERCENT IN LABOR FORCE
15.2%
UNEMPLOYMENT RATE
Long Lake Zip Codes
Long Lake Area Codes
Income in Long Lake
Income Overview in Long Lake
Per Capita Income in Long Lake is $40,760, while median incomes of families and households are $85,625 and $67,917 respectively.
| Characteristic | Number | Measure |
| Per Capita Income | 666 | $40,760 |
| Median Family Income | 147 | $85,625 |
| Mean Family Income | 147 | $124,743 |
| Median Household Income | 225 | $67,917 |
| Mean Household Income | 225 | $99,643 |
| Income Deficit | 147 | $0 |
| Wage / Income Gap (%) | 666 | 47.15% |
| Wage / Income Gap ($) | 666 | 52.85¢ per $1 |
| Gini / Inequality Index | 666 | 0.45 |
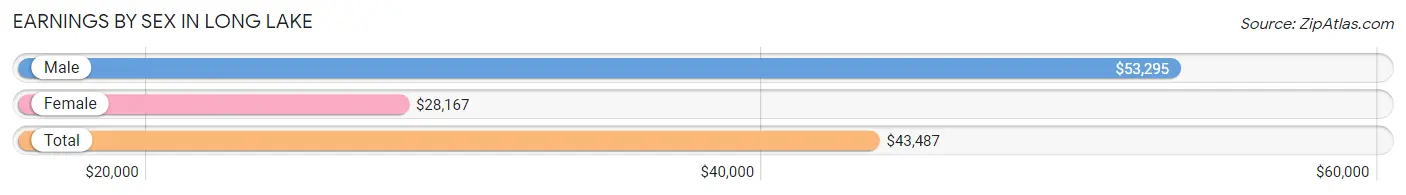
Earnings by Sex in Long Lake
Average Earnings in Long Lake are $43,487, $53,295 for men and $28,167 for women, a difference of 47.1%.
| Sex | Number | Average Earnings |
| Male | 160 (46.2%) | $53,295 |
| Female | 186 (53.8%) | $28,167 |
| Total | 346 (100.0%) | $43,487 |
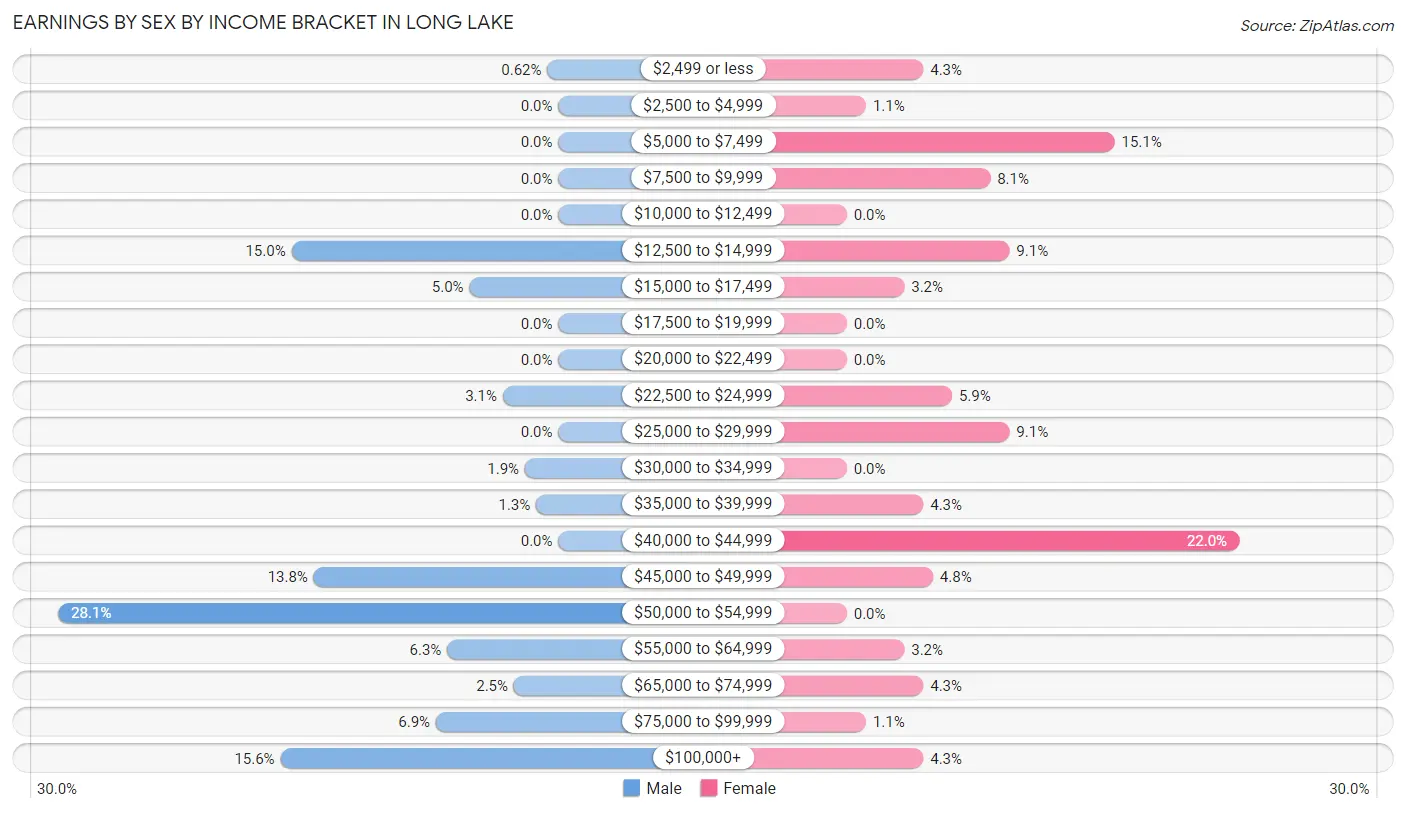
Earnings by Sex by Income Bracket in Long Lake
The most common earnings brackets in Long Lake are $50,000 to $54,999 for men (45 | 28.1%) and $40,000 to $44,999 for women (41 | 22.0%).
| Income | Male | Female |
| $2,499 or less | 1 (0.6%) | 8 (4.3%) |
| $2,500 to $4,999 | 0 (0.0%) | 2 (1.1%) |
| $5,000 to $7,499 | 0 (0.0%) | 28 (15.0%) |
| $7,500 to $9,999 | 0 (0.0%) | 15 (8.1%) |
| $10,000 to $12,499 | 0 (0.0%) | 0 (0.0%) |
| $12,500 to $14,999 | 24 (15.0%) | 17 (9.1%) |
| $15,000 to $17,499 | 8 (5.0%) | 6 (3.2%) |
| $17,500 to $19,999 | 0 (0.0%) | 0 (0.0%) |
| $20,000 to $22,499 | 0 (0.0%) | 0 (0.0%) |
| $22,500 to $24,999 | 5 (3.1%) | 11 (5.9%) |
| $25,000 to $29,999 | 0 (0.0%) | 17 (9.1%) |
| $30,000 to $34,999 | 3 (1.9%) | 0 (0.0%) |
| $35,000 to $39,999 | 2 (1.3%) | 8 (4.3%) |
| $40,000 to $44,999 | 0 (0.0%) | 41 (22.0%) |
| $45,000 to $49,999 | 22 (13.8%) | 9 (4.8%) |
| $50,000 to $54,999 | 45 (28.1%) | 0 (0.0%) |
| $55,000 to $64,999 | 10 (6.2%) | 6 (3.2%) |
| $65,000 to $74,999 | 4 (2.5%) | 8 (4.3%) |
| $75,000 to $99,999 | 11 (6.9%) | 2 (1.1%) |
| $100,000+ | 25 (15.6%) | 8 (4.3%) |
| Total | 160 (100.0%) | 186 (100.0%) |
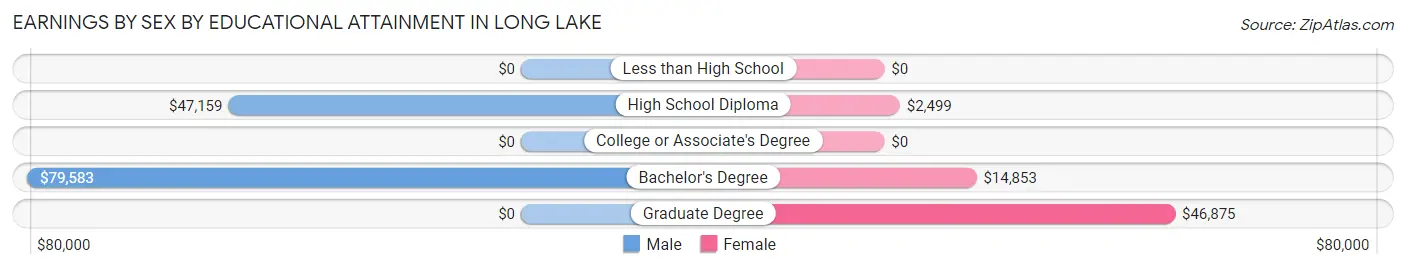
Earnings by Sex by Educational Attainment in Long Lake
Average earnings in Long Lake are $53,295 for men and $17,083 for women, a difference of 67.9%. Men with an educational attainment of bachelor's degree enjoy the highest average annual earnings of $79,583, while those with high school diploma education earn the least with $47,159. Women with an educational attainment of graduate degree earn the most with the average annual earnings of $46,875, while those with high school diploma education have the smallest earnings of $2,499.
| Educational Attainment | Male Income | Female Income |
| Less than High School | - | - |
| High School Diploma | $47,159 | $2,499 |
| College or Associate's Degree | - | - |
| Bachelor's Degree | $79,583 | $14,853 |
| Graduate Degree | - | - |
| Total | $53,295 | $17,083 |
Family Income in Long Lake
Family Income Brackets in Long Lake
According to the Long Lake family income data, there are 31 families falling into the $75,000 to $99,999 income range, which is the most common income bracket and makes up 21.1% of all families.
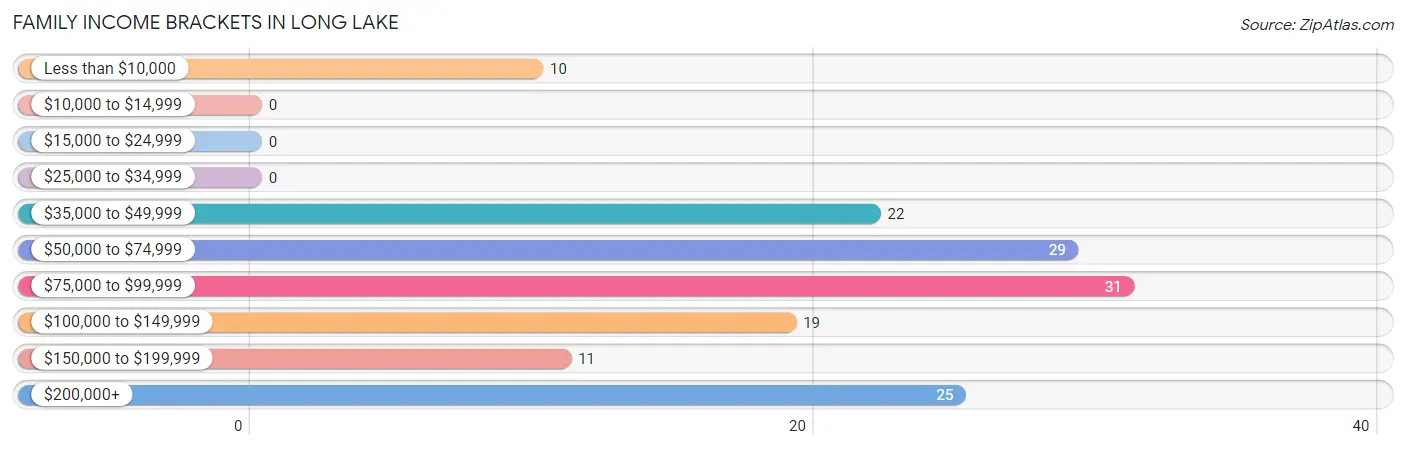
| Income Bracket | # Families | % Families |
| Less than $10,000 | 10 | 6.8% |
| $10,000 to $14,999 | 0 | 0.0% |
| $15,000 to $24,999 | 0 | 0.0% |
| $25,000 to $34,999 | 0 | 0.0% |
| $35,000 to $49,999 | 22 | 15.0% |
| $50,000 to $74,999 | 29 | 19.7% |
| $75,000 to $99,999 | 31 | 21.1% |
| $100,000 to $149,999 | 19 | 12.9% |
| $150,000 to $199,999 | 11 | 7.5% |
| $200,000+ | 25 | 17.0% |
Family Income by Famaliy Size in Long Lake
2-person families (93 | 63.3%) account for the highest median family income in Long Lake with $82,813 per family, while 2-person families (93 | 63.3%) have the highest median income of $41,406 per family member.
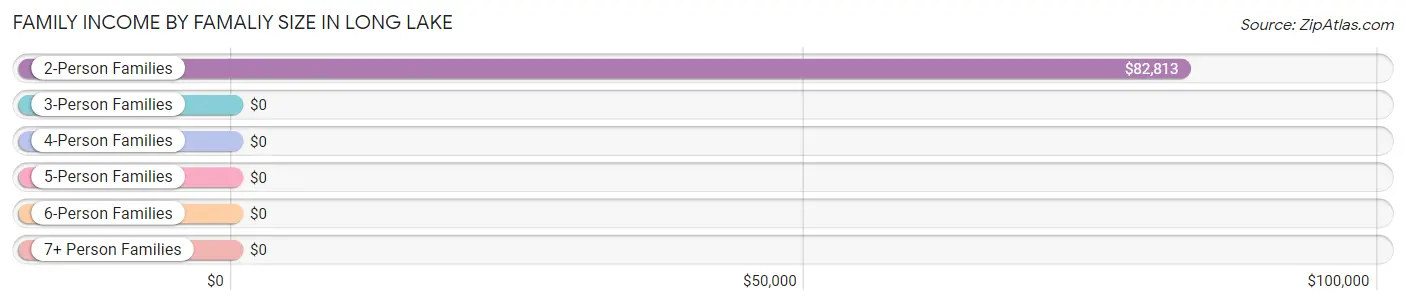
| Income Bracket | # Families | Median Income |
| 2-Person Families | 93 (63.3%) | $82,813 |
| 3-Person Families | 31 (21.1%) | $0 |
| 4-Person Families | 5 (3.4%) | $0 |
| 5-Person Families | 9 (6.1%) | $0 |
| 6-Person Families | 9 (6.1%) | $0 |
| 7+ Person Families | 0 (0.0%) | $0 |
| Total | 147 (100.0%) | $85,625 |
Family Income by Number of Earners in Long Lake
The median family income in Long Lake is $85,625, with families comprising 3+ earners (13) having the highest median family income of $250,001, while families with no earners (28) have the lowest median family income of $49,375, accounting for 8.8% and 19.1% of families, respectively.
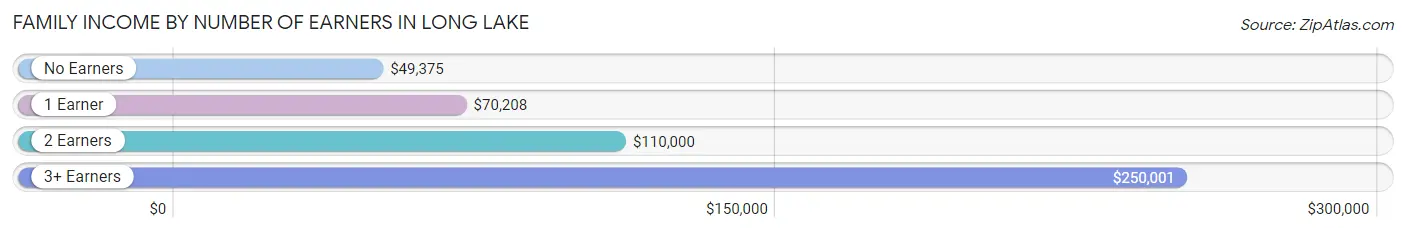
| Number of Earners | # Families | Median Income |
| No Earners | 28 (19.1%) | $49,375 |
| 1 Earner | 42 (28.6%) | $70,208 |
| 2 Earners | 64 (43.5%) | $110,000 |
| 3+ Earners | 13 (8.8%) | $250,001 |
| Total | 147 (100.0%) | $85,625 |
Household Income in Long Lake
Household Income Brackets in Long Lake
With 69 households falling in the category, the $50,000 to $74,999 income range is the most frequent in Long Lake, accounting for 30.7% of all households. In contrast, only 3 households (1.3%) fall into the $25,000 to $34,999 income bracket, making it the least populous group.
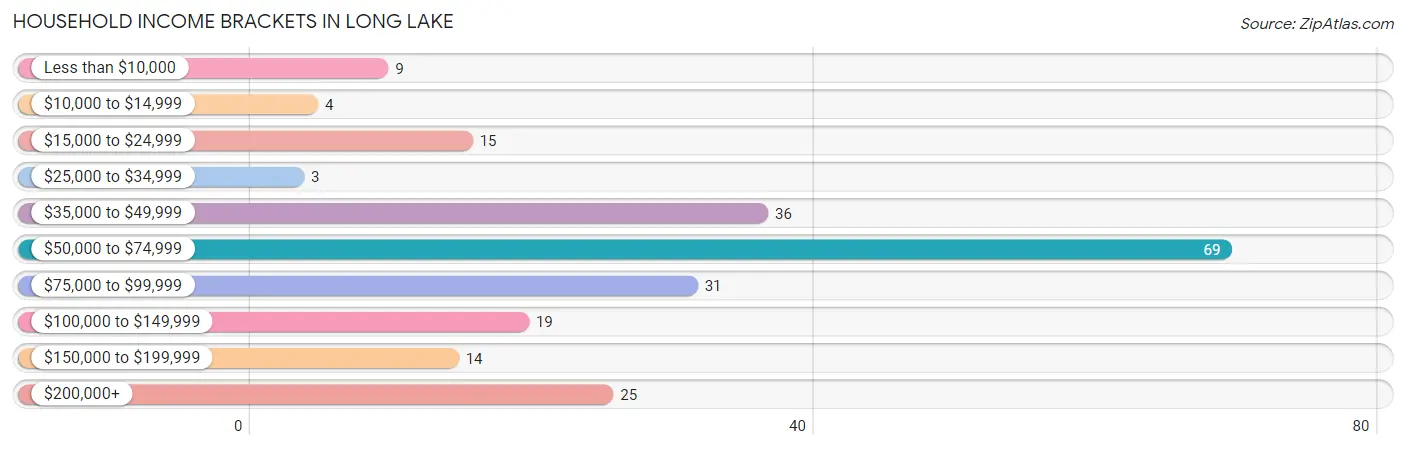
| Income Bracket | # Households | % Households |
| Less than $10,000 | 9 | 4.0% |
| $10,000 to $14,999 | 4 | 1.8% |
| $15,000 to $24,999 | 15 | 6.7% |
| $25,000 to $34,999 | 3 | 1.3% |
| $35,000 to $49,999 | 36 | 16.0% |
| $50,000 to $74,999 | 69 | 30.7% |
| $75,000 to $99,999 | 31 | 13.8% |
| $100,000 to $149,999 | 19 | 8.4% |
| $150,000 to $199,999 | 14 | 6.2% |
| $200,000+ | 25 | 11.1% |
Household Income by Householder Age in Long Lake
The median household income in Long Lake is $67,917, with the highest median household income of $71,667 found in the 45 to 64 years age bracket for the primary householder. A total of 96 households (42.7%) fall into this category. Meanwhile, the 15 to 24 years age bracket for the primary householder has the lowest median household income of $0, with 3 households (1.3%) in this group.
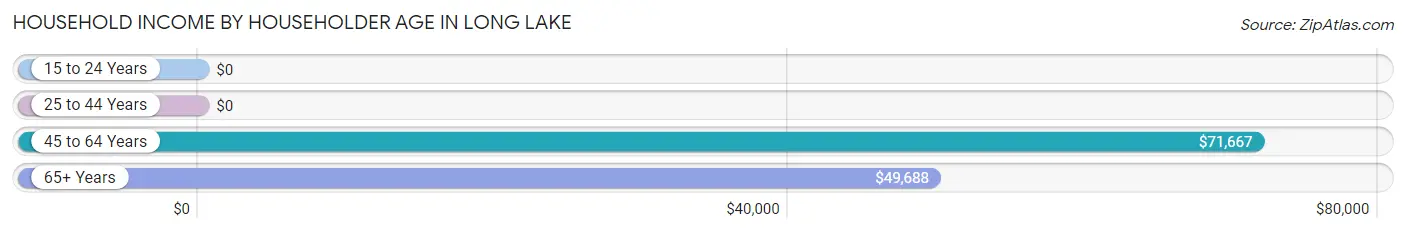
| Income Bracket | # Households | Median Income |
| 15 to 24 Years | 3 (1.3%) | $0 |
| 25 to 44 Years | 32 (14.2%) | $0 |
| 45 to 64 Years | 96 (42.7%) | $71,667 |
| 65+ Years | 94 (41.8%) | $49,688 |
| Total | 225 (100.0%) | $67,917 |
Poverty in Long Lake
Income Below Poverty by Sex and Age in Long Lake
With 22.7% poverty level for males and 8.3% for females among the residents of Long Lake, 6 to 11 year old males and 45 to 54 year old females are the most vulnerable to poverty, with 14 males (100.0%) and 13 females (56.5%) in their respective age groups living below the poverty level.
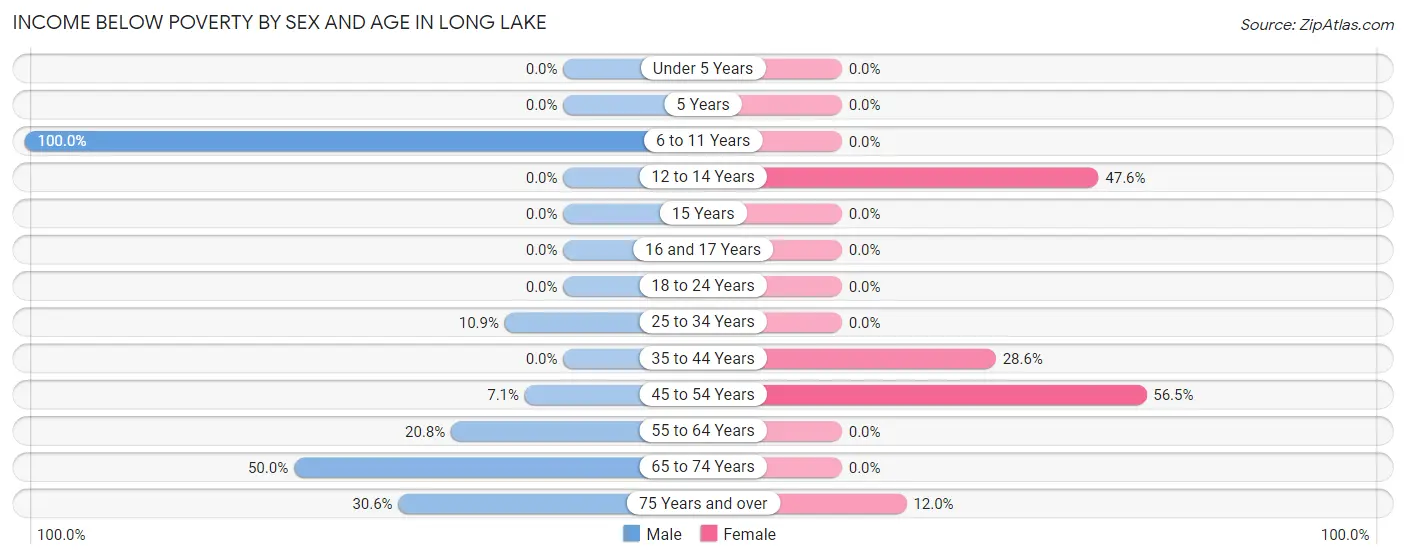
| Age Bracket | Male | Female |
| Under 5 Years | 0 (0.0%) | 0 (0.0%) |
| 5 Years | 0 (0.0%) | 0 (0.0%) |
| 6 to 11 Years | 14 (100.0%) | 0 (0.0%) |
| 12 to 14 Years | 0 (0.0%) | 10 (47.6%) |
| 15 Years | 0 (0.0%) | 0 (0.0%) |
| 16 and 17 Years | 0 (0.0%) | 0 (0.0%) |
| 18 to 24 Years | 0 (0.0%) | 0 (0.0%) |
| 25 to 34 Years | 5 (10.9%) | 0 (0.0%) |
| 35 to 44 Years | 0 (0.0%) | 2 (28.6%) |
| 45 to 54 Years | 2 (7.1%) | 13 (56.5%) |
| 55 to 64 Years | 15 (20.8%) | 0 (0.0%) |
| 65 to 74 Years | 24 (50.0%) | 0 (0.0%) |
| 75 Years and over | 15 (30.6%) | 3 (12.0%) |
| Total | 75 (22.7%) | 28 (8.3%) |
Income Above Poverty by Sex and Age in Long Lake
According to the poverty statistics in Long Lake, males aged under 5 years and females aged under 5 years are the age groups that are most secure financially, with 100.0% of males and 100.0% of females in these age groups living above the poverty line.
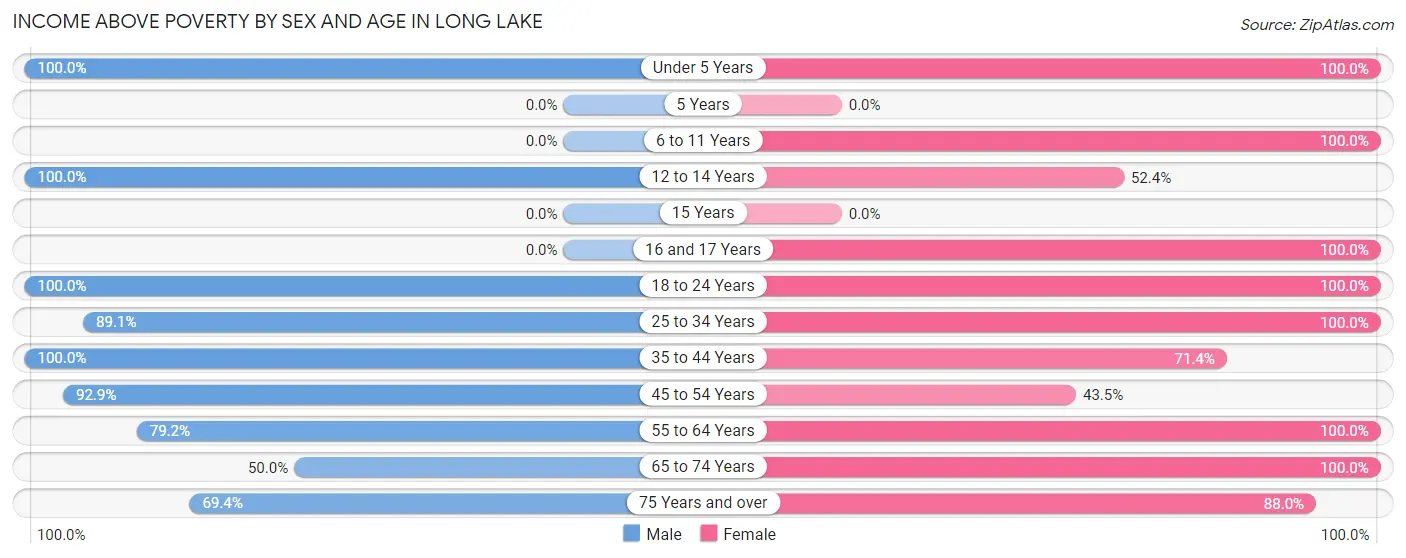
| Age Bracket | Male | Female |
| Under 5 Years | 13 (100.0%) | 12 (100.0%) |
| 5 Years | 0 (0.0%) | 0 (0.0%) |
| 6 to 11 Years | 0 (0.0%) | 2 (100.0%) |
| 12 to 14 Years | 10 (100.0%) | 11 (52.4%) |
| 15 Years | 0 (0.0%) | 0 (0.0%) |
| 16 and 17 Years | 0 (0.0%) | 8 (100.0%) |
| 18 to 24 Years | 32 (100.0%) | 38 (100.0%) |
| 25 to 34 Years | 41 (89.1%) | 33 (100.0%) |
| 35 to 44 Years | 18 (100.0%) | 5 (71.4%) |
| 45 to 54 Years | 26 (92.9%) | 10 (43.5%) |
| 55 to 64 Years | 57 (79.2%) | 76 (100.0%) |
| 65 to 74 Years | 24 (50.0%) | 91 (100.0%) |
| 75 Years and over | 34 (69.4%) | 22 (88.0%) |
| Total | 255 (77.3%) | 308 (91.7%) |
Income Below Poverty Among Married-Couple Families in Long Lake
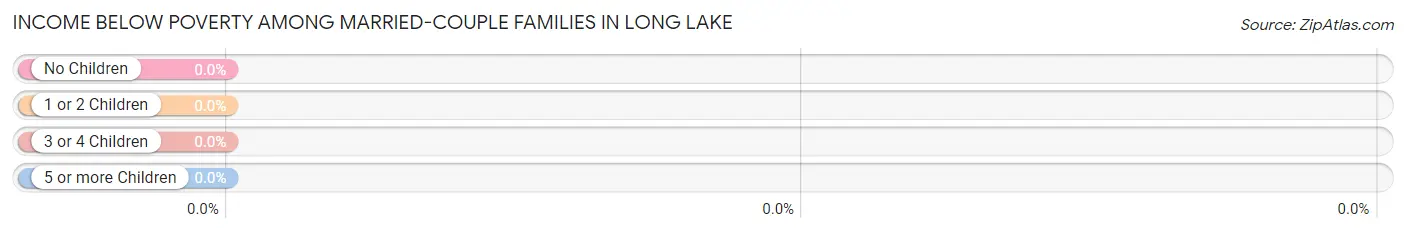
| Children | Above Poverty | Below Poverty |
| No Children | 89 (100.0%) | 0 (0.0%) |
| 1 or 2 Children | 41 (100.0%) | 0 (0.0%) |
| 3 or 4 Children | 0 (0.0%) | 0 (0.0%) |
| 5 or more Children | 0 (0.0%) | 0 (0.0%) |
| Total | 130 (100.0%) | 0 (0.0%) |
Income Below Poverty Among Single-Parent Households in Long Lake
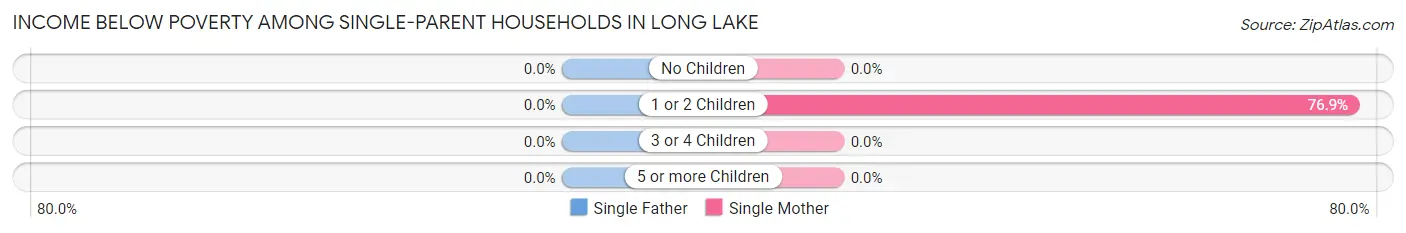
| Children | Single Father | Single Mother |
| No Children | 0 (0.0%) | 0 (0.0%) |
| 1 or 2 Children | 0 (0.0%) | 10 (76.9%) |
| 3 or 4 Children | 0 (0.0%) | 0 (0.0%) |
| 5 or more Children | 0 (0.0%) | 0 (0.0%) |
| Total | 0 (0.0%) | 10 (58.8%) |
Income Below Poverty Among Married-Couple vs Single-Parent Households in Long Lake
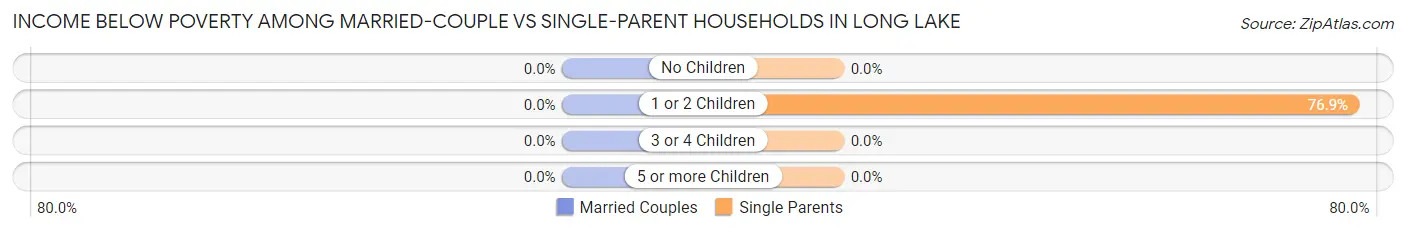
| Children | Married-Couple Families | Single-Parent Households |
| No Children | 0 (0.0%) | 0 (0.0%) |
| 1 or 2 Children | 0 (0.0%) | 10 (76.9%) |
| 3 or 4 Children | 0 (0.0%) | 0 (0.0%) |
| 5 or more Children | 0 (0.0%) | 0 (0.0%) |
| Total | 0 (0.0%) | 10 (58.8%) |
Race in Long Lake
The most populous races in Long Lake are White / Caucasian (579 | 86.9%), Hispanic or Latino (36 | 5.4%), and Some other Race (36 | 5.4%).
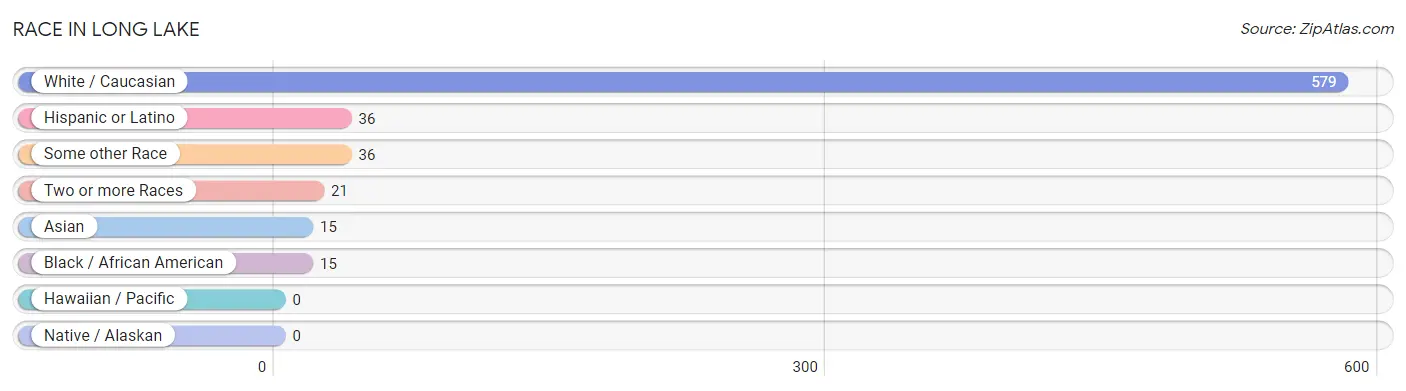
| Race | # Population | % Population |
| Asian | 15 | 2.2% |
| Black / African American | 15 | 2.2% |
| Hawaiian / Pacific | 0 | 0.0% |
| Hispanic or Latino | 36 | 5.4% |
| Native / Alaskan | 0 | 0.0% |
| White / Caucasian | 579 | 86.9% |
| Two or more Races | 21 | 3.2% |
| Some other Race | 36 | 5.4% |
| Total | 666 | 100.0% |
Ancestry in Long Lake
The most populous ancestries reported in Long Lake are English (326 | 48.9%), Irish (163 | 24.5%), Polish (49 | 7.4%), German (45 | 6.8%), and Italian (42 | 6.3%), together accounting for 93.9% of all Long Lake residents.
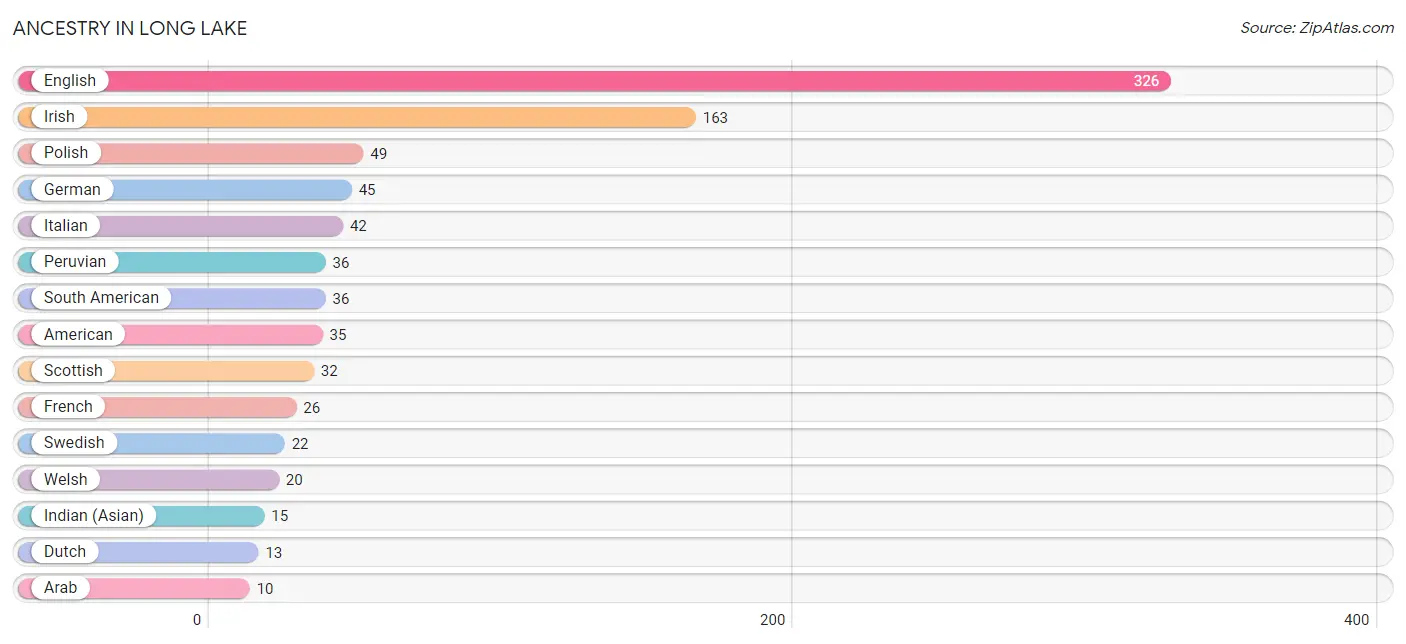
| Ancestry | # Population | % Population |
| American | 35 | 5.3% |
| Arab | 10 | 1.5% |
| Canadian | 3 | 0.4% |
| Dutch | 13 | 1.9% |
| Eastern European | 2 | 0.3% |
| English | 326 | 48.9% |
| French | 26 | 3.9% |
| French Canadian | 5 | 0.7% |
| German | 45 | 6.8% |
| Hungarian | 4 | 0.6% |
| Indian (Asian) | 15 | 2.2% |
| Irish | 163 | 24.5% |
| Italian | 42 | 6.3% |
| Lebanese | 10 | 1.5% |
| Norwegian | 9 | 1.3% |
| Peruvian | 36 | 5.4% |
| Polish | 49 | 7.4% |
| Romanian | 3 | 0.4% |
| Scotch-Irish | 9 | 1.3% |
| Scottish | 32 | 4.8% |
| South American | 36 | 5.4% |
| Swedish | 22 | 3.3% |
| Welsh | 20 | 3.0% | View All 23 Rows |
Immigrants in Long Lake
The most numerous immigrant groups reported in Long Lake came from Latin America (51 | 7.7%), Peru (36 | 5.4%), South America (36 | 5.4%), Caribbean (15 | 2.2%), and Jamaica (15 | 2.2%), together accounting for 23.0% of all Long Lake residents.
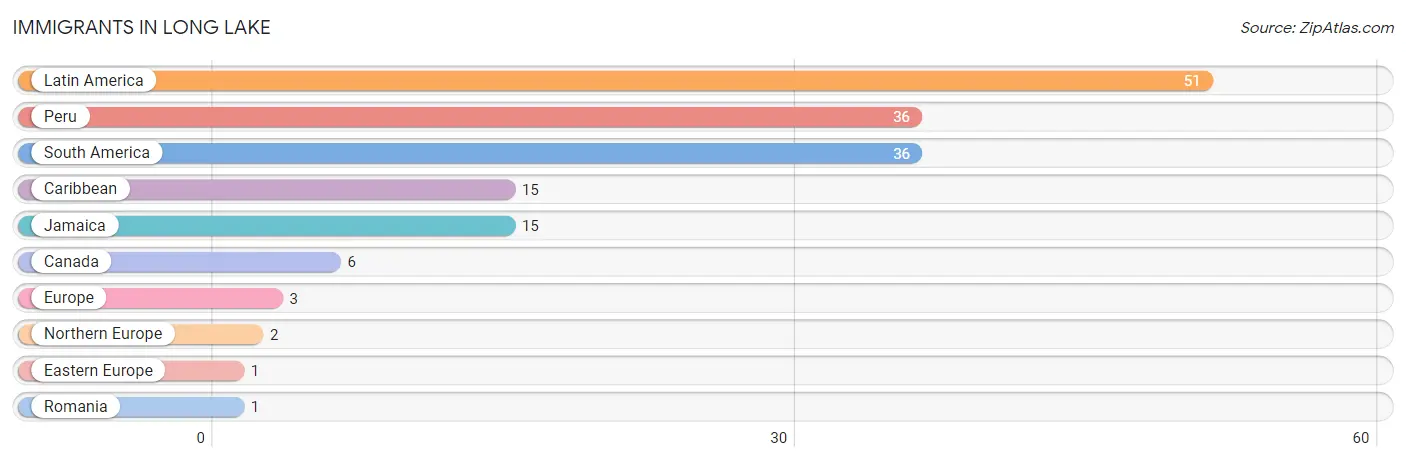
| Immigration Origin | # Population | % Population |
| Canada | 6 | 0.9% |
| Caribbean | 15 | 2.2% |
| Eastern Europe | 1 | 0.2% |
| Europe | 3 | 0.4% |
| Jamaica | 15 | 2.2% |
| Latin America | 51 | 7.7% |
| Northern Europe | 2 | 0.3% |
| Peru | 36 | 5.4% |
| Romania | 1 | 0.2% |
| South America | 36 | 5.4% | View All 10 Rows |
Sex and Age in Long Lake
Sex and Age in Long Lake
The most populous age groups in Long Lake are 60 to 64 Years (50 | 15.1%) for men and 65 to 69 Years (56 | 16.7%) for women.
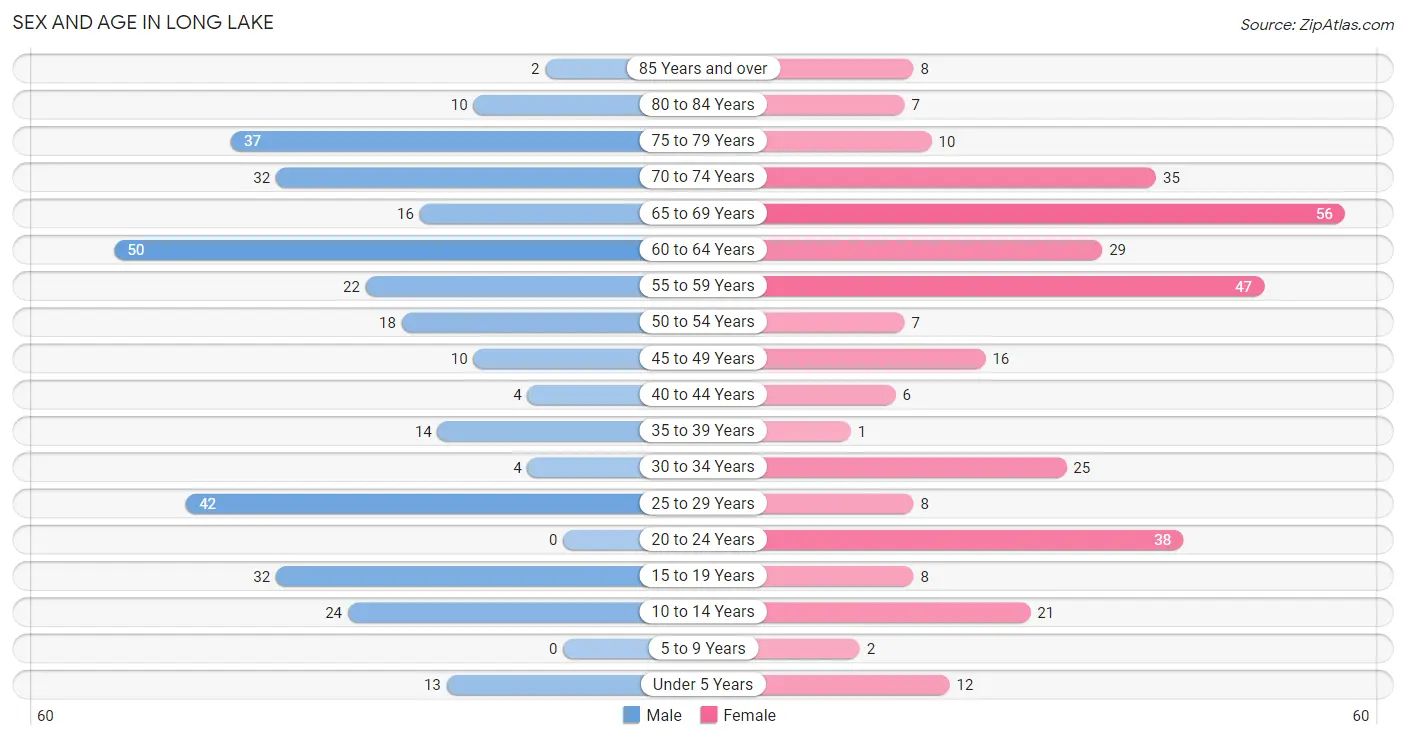
| Age Bracket | Male | Female |
| Under 5 Years | 13 (3.9%) | 12 (3.6%) |
| 5 to 9 Years | 0 (0.0%) | 2 (0.6%) |
| 10 to 14 Years | 24 (7.3%) | 21 (6.2%) |
| 15 to 19 Years | 32 (9.7%) | 8 (2.4%) |
| 20 to 24 Years | 0 (0.0%) | 38 (11.3%) |
| 25 to 29 Years | 42 (12.7%) | 8 (2.4%) |
| 30 to 34 Years | 4 (1.2%) | 25 (7.4%) |
| 35 to 39 Years | 14 (4.2%) | 1 (0.3%) |
| 40 to 44 Years | 4 (1.2%) | 6 (1.8%) |
| 45 to 49 Years | 10 (3.0%) | 16 (4.8%) |
| 50 to 54 Years | 18 (5.4%) | 7 (2.1%) |
| 55 to 59 Years | 22 (6.7%) | 47 (14.0%) |
| 60 to 64 Years | 50 (15.1%) | 29 (8.6%) |
| 65 to 69 Years | 16 (4.9%) | 56 (16.7%) |
| 70 to 74 Years | 32 (9.7%) | 35 (10.4%) |
| 75 to 79 Years | 37 (11.2%) | 10 (3.0%) |
| 80 to 84 Years | 10 (3.0%) | 7 (2.1%) |
| 85 Years and over | 2 (0.6%) | 8 (2.4%) |
| Total | 330 (100.0%) | 336 (100.0%) |
Families and Households in Long Lake
Median Family Size in Long Lake
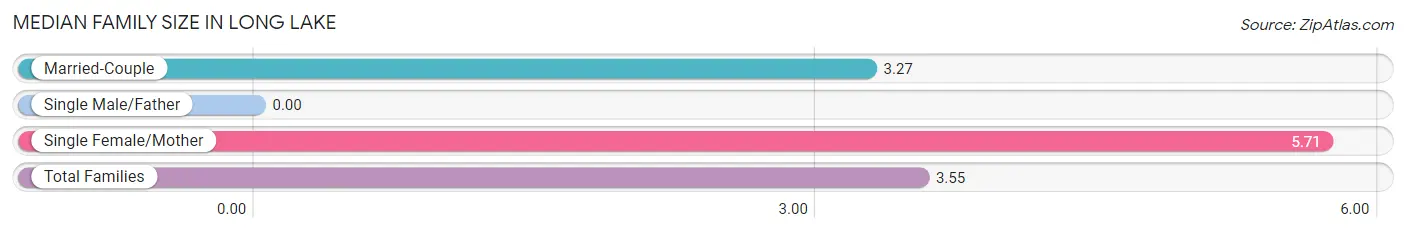
| Family Type | # Families | Family Size |
| Married-Couple | 130 (88.4%) | 3.27 |
| Single Male/Father | 0 (0.0%) | - |
| Single Female/Mother | 17 (11.6%) | 5.71 |
| Total Families | 147 (100.0%) | 3.55 |
Median Household Size in Long Lake
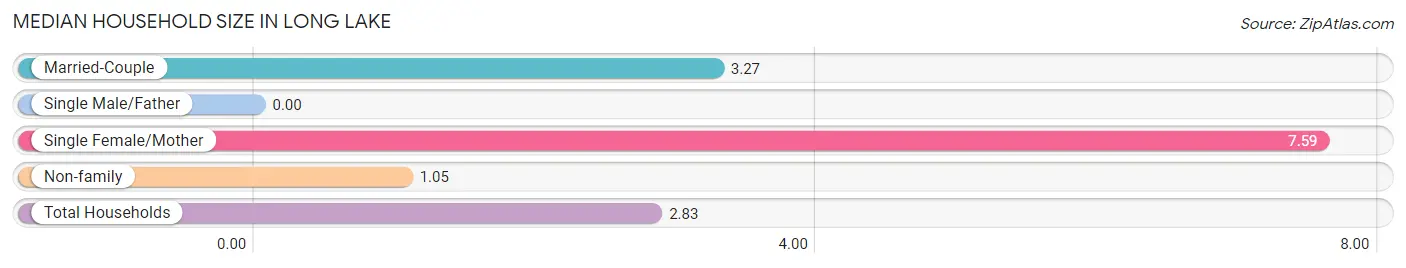
| Household Type | # Households | Household Size |
| Married-Couple | 130 (57.8%) | 3.27 |
| Single Male/Father | 0 (0.0%) | - |
| Single Female/Mother | 17 (7.6%) | 7.59 |
| Non-family | 78 (34.7%) | 1.05 |
| Total Households | 225 (100.0%) | 2.83 |
Household Size by Marriage Status in Long Lake
Out of a total of 225 households in Long Lake, 147 (65.3%) are family households, while 78 (34.7%) are nonfamily households. The most numerous type of family households are 2-person households, comprising 89, and the most common type of nonfamily households are 1-person households, comprising 71.
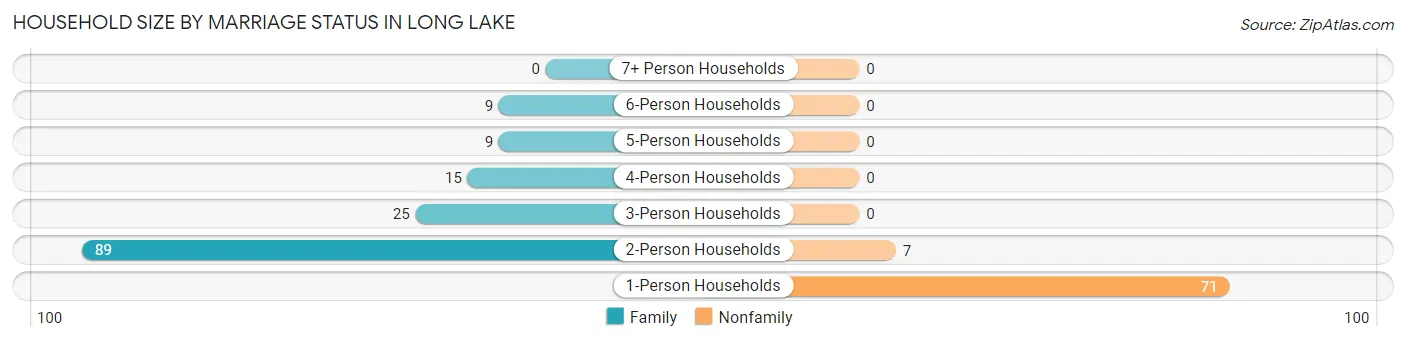
| Household Size | Family Households | Nonfamily Households |
| 1-Person Households | - | 71 (31.6%) |
| 2-Person Households | 89 (39.6%) | 7 (3.1%) |
| 3-Person Households | 25 (11.1%) | 0 (0.0%) |
| 4-Person Households | 15 (6.7%) | 0 (0.0%) |
| 5-Person Households | 9 (4.0%) | 0 (0.0%) |
| 6-Person Households | 9 (4.0%) | 0 (0.0%) |
| 7+ Person Households | 0 (0.0%) | 0 (0.0%) |
| Total | 147 (65.3%) | 78 (34.7%) |
Female Fertility in Long Lake
Fertility by Age in Long Lake
Average fertility rate in Long Lake is 98.0 births per 1,000 women. Women in the age bracket of 20 to 34 years have the highest fertility rate with 141.0 births per 1,000 women. Women in the age bracket of 20 to 34 years acount for 100.0% of all women with births.
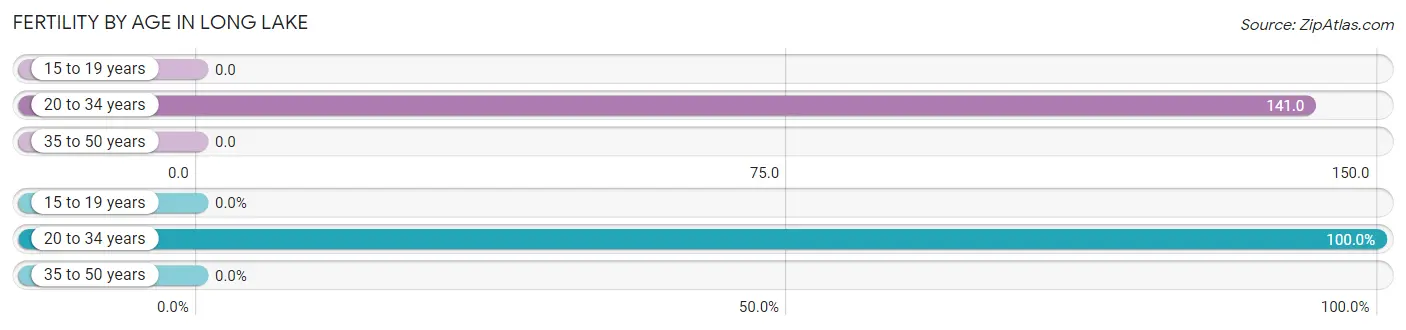
| Age Bracket | Women with Births | Births / 1,000 Women |
| 15 to 19 years | 0 (0.0%) | 0.0 |
| 20 to 34 years | 10 (100.0%) | 141.0 |
| 35 to 50 years | 0 (0.0%) | 0.0 |
| Total | 10 (100.0%) | 98.0 |
Fertility by Age by Marriage Status in Long Lake
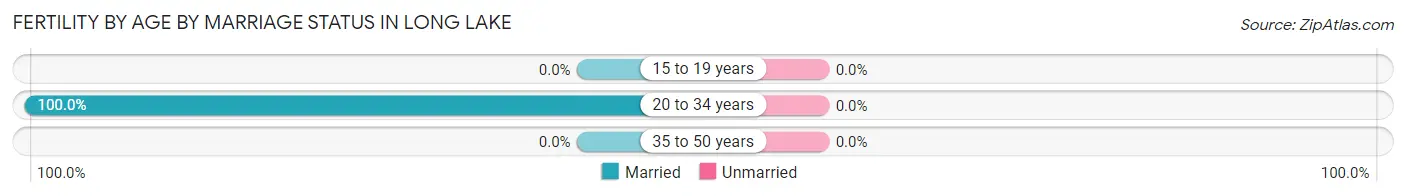
| Age Bracket | Married | Unmarried |
| 15 to 19 years | 0 (0.0%) | 0 (0.0%) |
| 20 to 34 years | 10 (100.0%) | 0 (0.0%) |
| 35 to 50 years | 0 (0.0%) | 0 (0.0%) |
| Total | 10 (100.0%) | 0 (0.0%) |
Fertility by Education in Long Lake
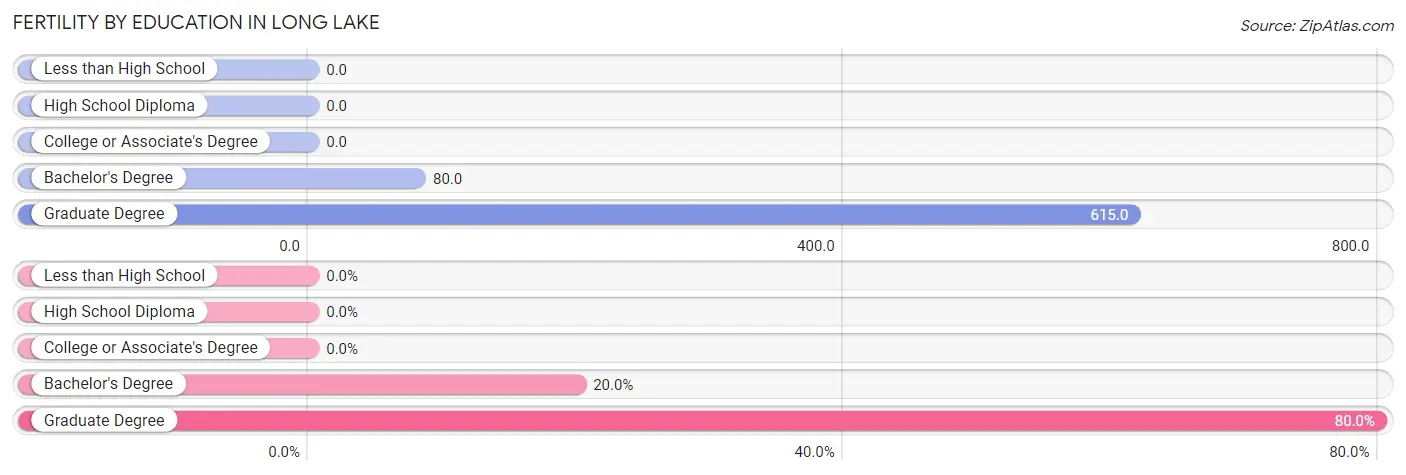
| Educational Attainment | Women with Births | Births / 1,000 Women |
| Less than High School | 0 (0.0%) | 0.0 |
| High School Diploma | 0 (0.0%) | 0.0 |
| College or Associate's Degree | 0 (0.0%) | 0.0 |
| Bachelor's Degree | 2 (20.0%) | 80.0 |
| Graduate Degree | 8 (80.0%) | 615.0 |
| Total | 10 (100.0%) | 98.0 |
Fertility by Education by Marriage Status in Long Lake
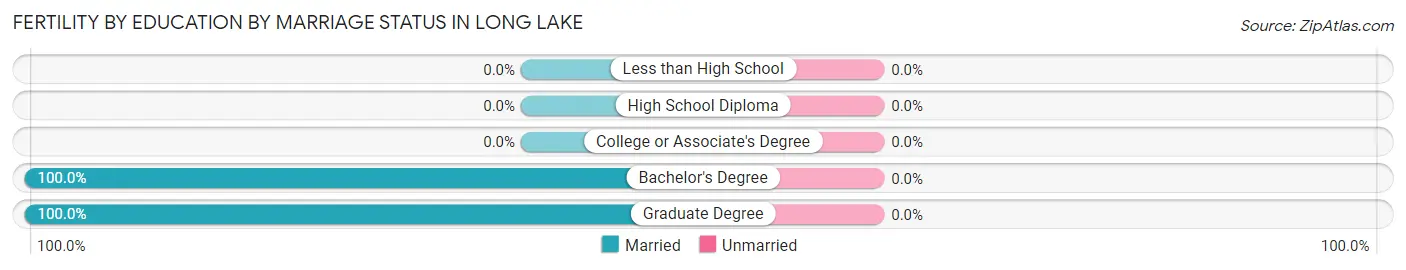
| Educational Attainment | Married | Unmarried |
| Less than High School | 0 (0.0%) | 0 (0.0%) |
| High School Diploma | 0 (0.0%) | 0 (0.0%) |
| College or Associate's Degree | 0 (0.0%) | 0 (0.0%) |
| Bachelor's Degree | 2 (100.0%) | 0 (0.0%) |
| Graduate Degree | 8 (100.0%) | 0 (0.0%) |
| Total | 10 (100.0%) | 0 (0.0%) |
Employment Characteristics in Long Lake
Employment by Class of Employer in Long Lake
Among the 267 employed individuals in Long Lake, private company employees (94 | 35.2%), local government employees (77 | 28.8%), and self-employed (not incorporated) (70 | 26.2%) make up the most common classes of employment.
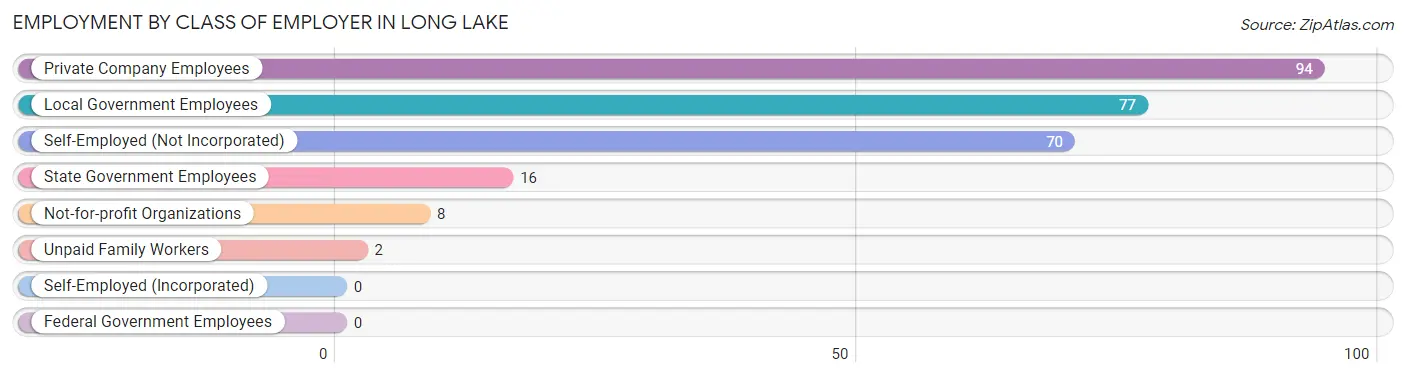
| Employer Class | # Employees | % Employees |
| Private Company Employees | 94 | 35.2% |
| Self-Employed (Incorporated) | 0 | 0.0% |
| Self-Employed (Not Incorporated) | 70 | 26.2% |
| Not-for-profit Organizations | 8 | 3.0% |
| Local Government Employees | 77 | 28.8% |
| State Government Employees | 16 | 6.0% |
| Federal Government Employees | 0 | 0.0% |
| Unpaid Family Workers | 2 | 0.7% |
| Total | 267 | 100.0% |
Employment Status by Age in Long Lake
According to the labor force statistics for Long Lake, out of the total population over 16 years of age (594), 53.0% or 315 individuals are in the labor force, with 15.2% or 48 of them unemployed. The age group with the highest labor force participation rate is 20 to 24 years, with 100.0% or 38 individuals in the labor force. Within the labor force, the 20 to 24 years age range has the highest percentage of unemployed individuals, with 92.1% or 35 of them being unemployed.
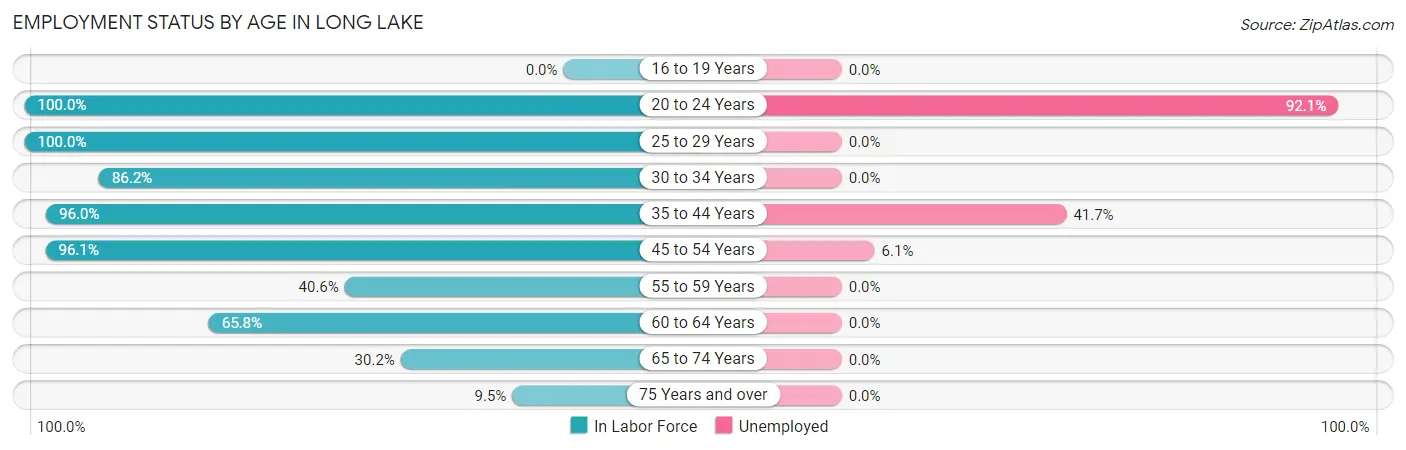
| Age Bracket | In Labor Force | Unemployed |
| 16 to 19 Years | 0 (0.0%) | 0 (0.0%) |
| 20 to 24 Years | 38 (100.0%) | 35 (92.1%) |
| 25 to 29 Years | 50 (100.0%) | 0 (0.0%) |
| 30 to 34 Years | 25 (86.2%) | 0 (0.0%) |
| 35 to 44 Years | 24 (96.0%) | 10 (41.7%) |
| 45 to 54 Years | 49 (96.1%) | 3 (6.1%) |
| 55 to 59 Years | 28 (40.6%) | 0 (0.0%) |
| 60 to 64 Years | 52 (65.8%) | 0 (0.0%) |
| 65 to 74 Years | 42 (30.2%) | 0 (0.0%) |
| 75 Years and over | 7 (9.5%) | 0 (0.0%) |
| Total | 315 (53.0%) | 48 (15.2%) |
Employment Status by Educational Attainment in Long Lake
According to labor force statistics for Long Lake, 75.2% of individuals (228) out of the total population between 25 and 64 years of age (303) are in the labor force, with 5.7% or 13 of them being unemployed. The group with the highest labor force participation rate are those with the educational attainment of high school diploma, with 96.1% or 99 individuals in the labor force. Within the labor force, individuals with less than high school education have the highest percentage of unemployment, with 66.7% or 8 of them being unemployed.
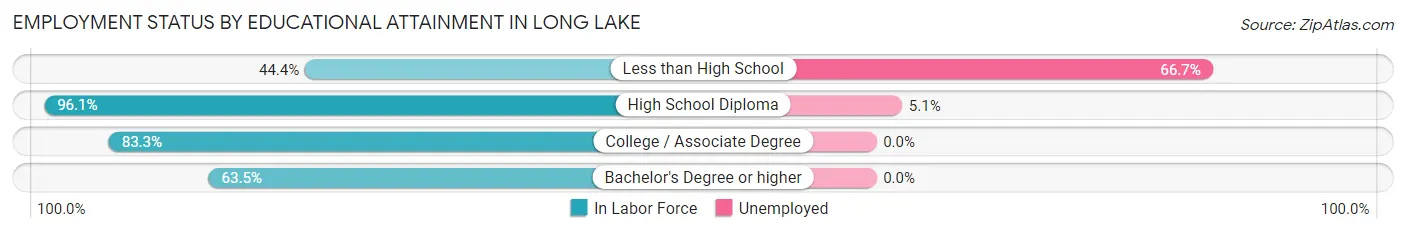
| Educational Attainment | In Labor Force | Unemployed |
| Less than High School | 12 (44.4%) | 18 (66.7%) |
| High School Diploma | 99 (96.1%) | 5 (5.1%) |
| College / Associate Degree | 30 (83.3%) | 0 (0.0%) |
| Bachelor's Degree or higher | 87 (63.5%) | 0 (0.0%) |
| Total | 228 (75.2%) | 17 (5.7%) |
Employment Occupations by Sex in Long Lake
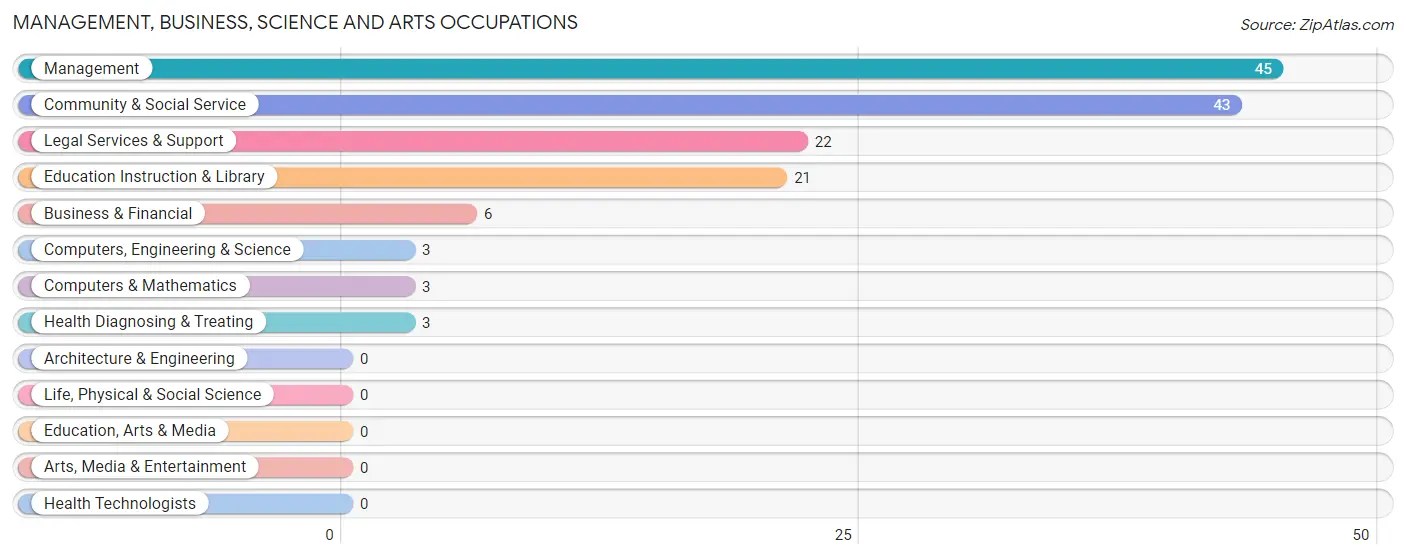
Management, Business, Science and Arts Occupations
The most common Management, Business, Science and Arts occupations in Long Lake are Management (45 | 16.9%), Community & Social Service (43 | 16.1%), Legal Services & Support (22 | 8.2%), Education Instruction & Library (21 | 7.9%), and Business & Financial (6 | 2.2%).
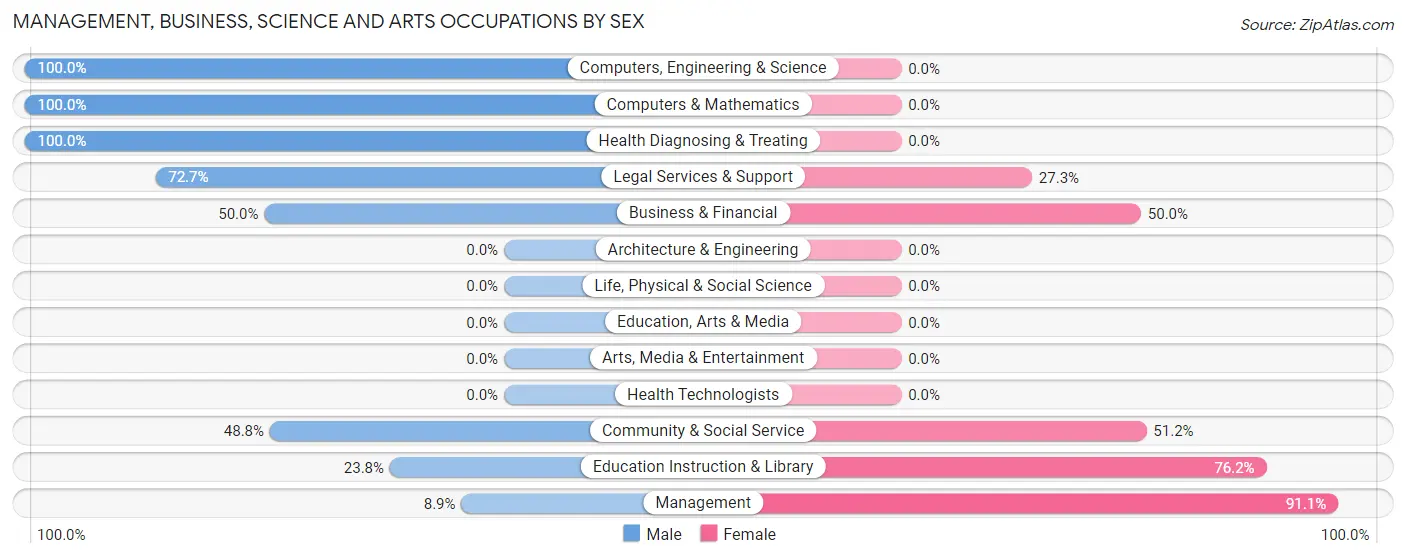
Management, Business, Science and Arts Occupations by Sex
Within the Management, Business, Science and Arts occupations in Long Lake, the most male-oriented occupations are Computers, Engineering & Science (100.0%), Computers & Mathematics (100.0%), and Health Diagnosing & Treating (100.0%), while the most female-oriented occupations are Management (91.1%), Education Instruction & Library (76.2%), and Community & Social Service (51.2%).
| Occupation | Male | Female |
| Management | 4 (8.9%) | 41 (91.1%) |
| Business & Financial | 3 (50.0%) | 3 (50.0%) |
| Computers, Engineering & Science | 3 (100.0%) | 0 (0.0%) |
| Computers & Mathematics | 3 (100.0%) | 0 (0.0%) |
| Architecture & Engineering | 0 (0.0%) | 0 (0.0%) |
| Life, Physical & Social Science | 0 (0.0%) | 0 (0.0%) |
| Community & Social Service | 21 (48.8%) | 22 (51.2%) |
| Education, Arts & Media | 0 (0.0%) | 0 (0.0%) |
| Legal Services & Support | 16 (72.7%) | 6 (27.3%) |
| Education Instruction & Library | 5 (23.8%) | 16 (76.2%) |
| Arts, Media & Entertainment | 0 (0.0%) | 0 (0.0%) |
| Health Diagnosing & Treating | 3 (100.0%) | 0 (0.0%) |
| Health Technologists | 0 (0.0%) | 0 (0.0%) |
| Total (Category) | 34 (34.0%) | 66 (66.0%) |
| Total (Overall) | 150 (56.2%) | 117 (43.8%) |
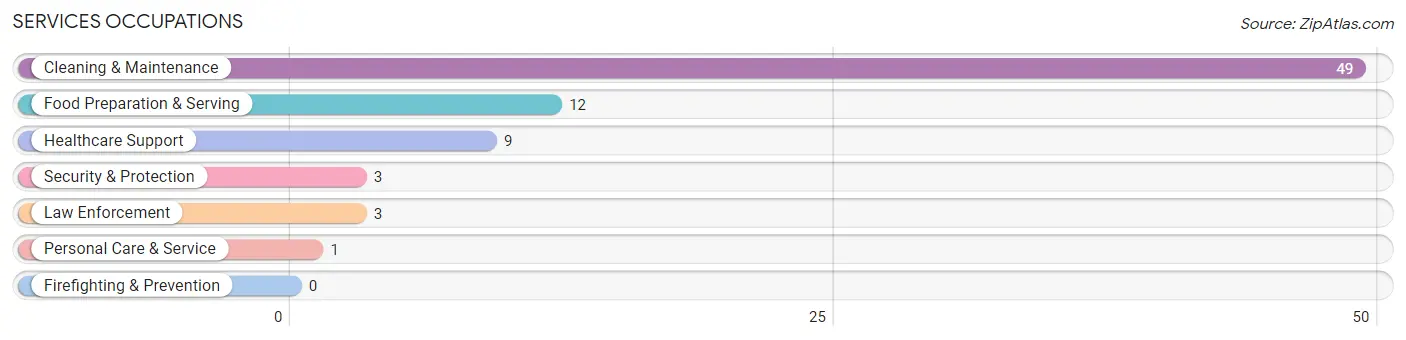
Services Occupations
The most common Services occupations in Long Lake are Cleaning & Maintenance (49 | 18.3%), Food Preparation & Serving (12 | 4.5%), Healthcare Support (9 | 3.4%), Security & Protection (3 | 1.1%), and Law Enforcement (3 | 1.1%).
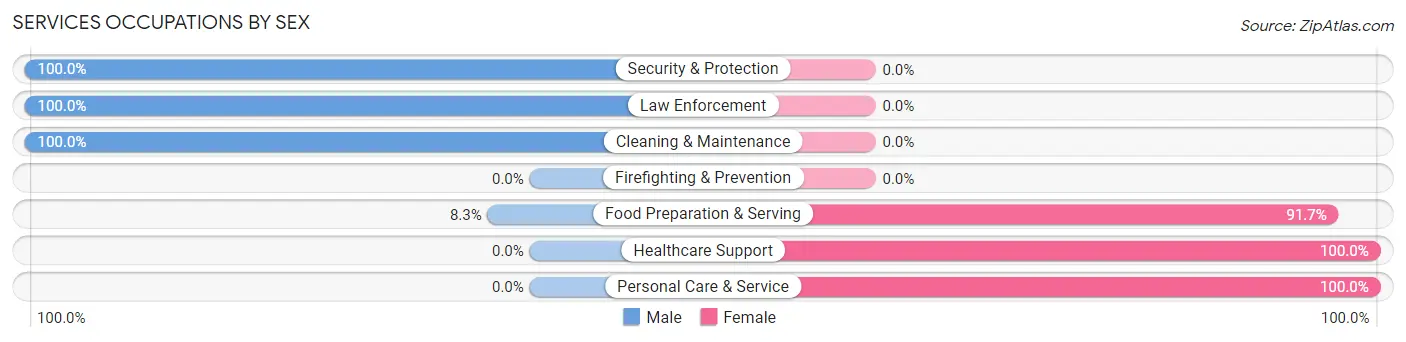
Services Occupations by Sex
Within the Services occupations in Long Lake, the most male-oriented occupations are Security & Protection (100.0%), Law Enforcement (100.0%), and Cleaning & Maintenance (100.0%), while the most female-oriented occupations are Healthcare Support (100.0%), Personal Care & Service (100.0%), and Food Preparation & Serving (91.7%).
| Occupation | Male | Female |
| Healthcare Support | 0 (0.0%) | 9 (100.0%) |
| Security & Protection | 3 (100.0%) | 0 (0.0%) |
| Firefighting & Prevention | 0 (0.0%) | 0 (0.0%) |
| Law Enforcement | 3 (100.0%) | 0 (0.0%) |
| Food Preparation & Serving | 1 (8.3%) | 11 (91.7%) |
| Cleaning & Maintenance | 49 (100.0%) | 0 (0.0%) |
| Personal Care & Service | 0 (0.0%) | 1 (100.0%) |
| Total (Category) | 53 (71.6%) | 21 (28.4%) |
| Total (Overall) | 150 (56.2%) | 117 (43.8%) |
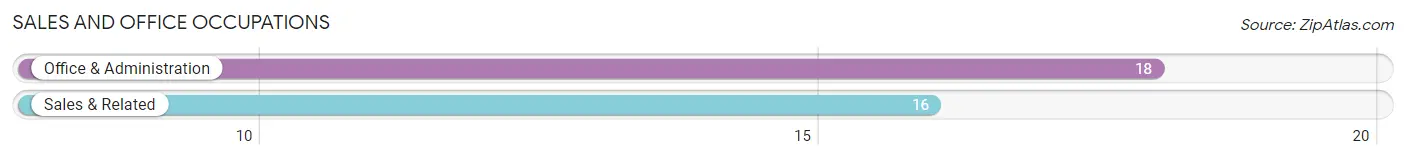
Sales and Office Occupations
The most common Sales and Office occupations in Long Lake are Office & Administration (18 | 6.7%), and Sales & Related (16 | 6.0%).
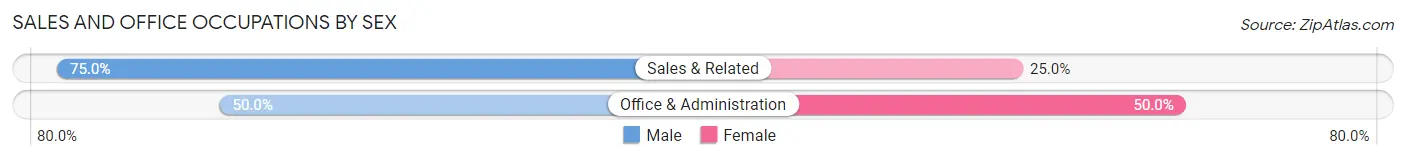
Sales and Office Occupations by Sex
| Occupation | Male | Female |
| Sales & Related | 12 (75.0%) | 4 (25.0%) |
| Office & Administration | 9 (50.0%) | 9 (50.0%) |
| Total (Category) | 21 (61.8%) | 13 (38.2%) |
| Total (Overall) | 150 (56.2%) | 117 (43.8%) |
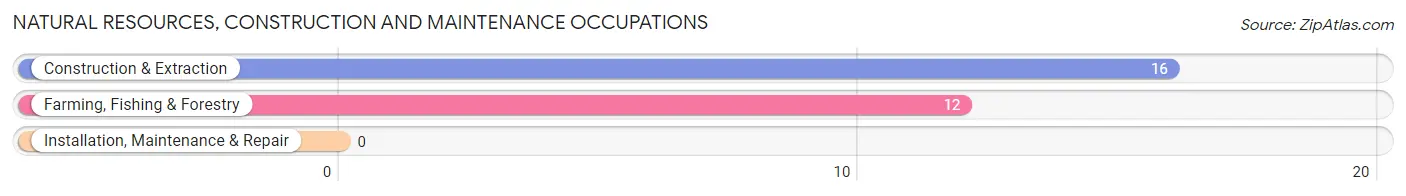
Natural Resources, Construction and Maintenance Occupations
The most common Natural Resources, Construction and Maintenance occupations in Long Lake are Construction & Extraction (16 | 6.0%), and Farming, Fishing & Forestry (12 | 4.5%).
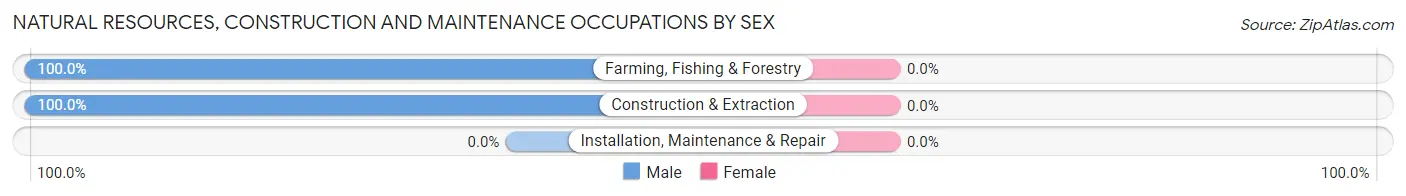
Natural Resources, Construction and Maintenance Occupations by Sex
| Occupation | Male | Female |
| Farming, Fishing & Forestry | 12 (100.0%) | 0 (0.0%) |
| Construction & Extraction | 16 (100.0%) | 0 (0.0%) |
| Installation, Maintenance & Repair | 0 (0.0%) | 0 (0.0%) |
| Total (Category) | 28 (100.0%) | 0 (0.0%) |
| Total (Overall) | 150 (56.2%) | 117 (43.8%) |
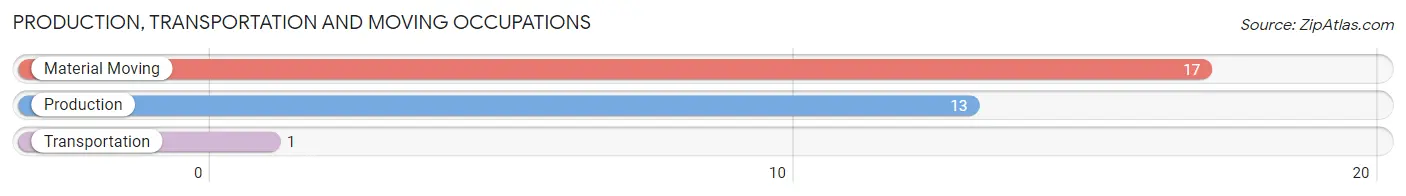
Production, Transportation and Moving Occupations
The most common Production, Transportation and Moving occupations in Long Lake are Material Moving (17 | 6.4%), Production (13 | 4.9%), and Transportation (1 | 0.4%).
Production, Transportation and Moving Occupations by Sex
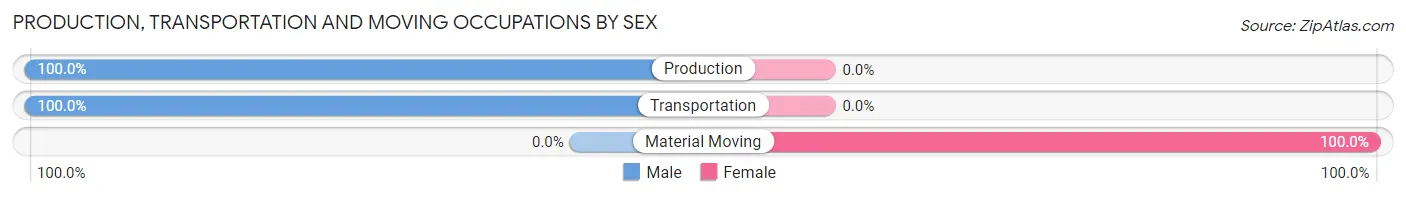
| Occupation | Male | Female |
| Production | 13 (100.0%) | 0 (0.0%) |
| Transportation | 1 (100.0%) | 0 (0.0%) |
| Material Moving | 0 (0.0%) | 17 (100.0%) |
| Total (Category) | 14 (45.2%) | 17 (54.8%) |
| Total (Overall) | 150 (56.2%) | 117 (43.8%) |
Employment Industries by Sex in Long Lake
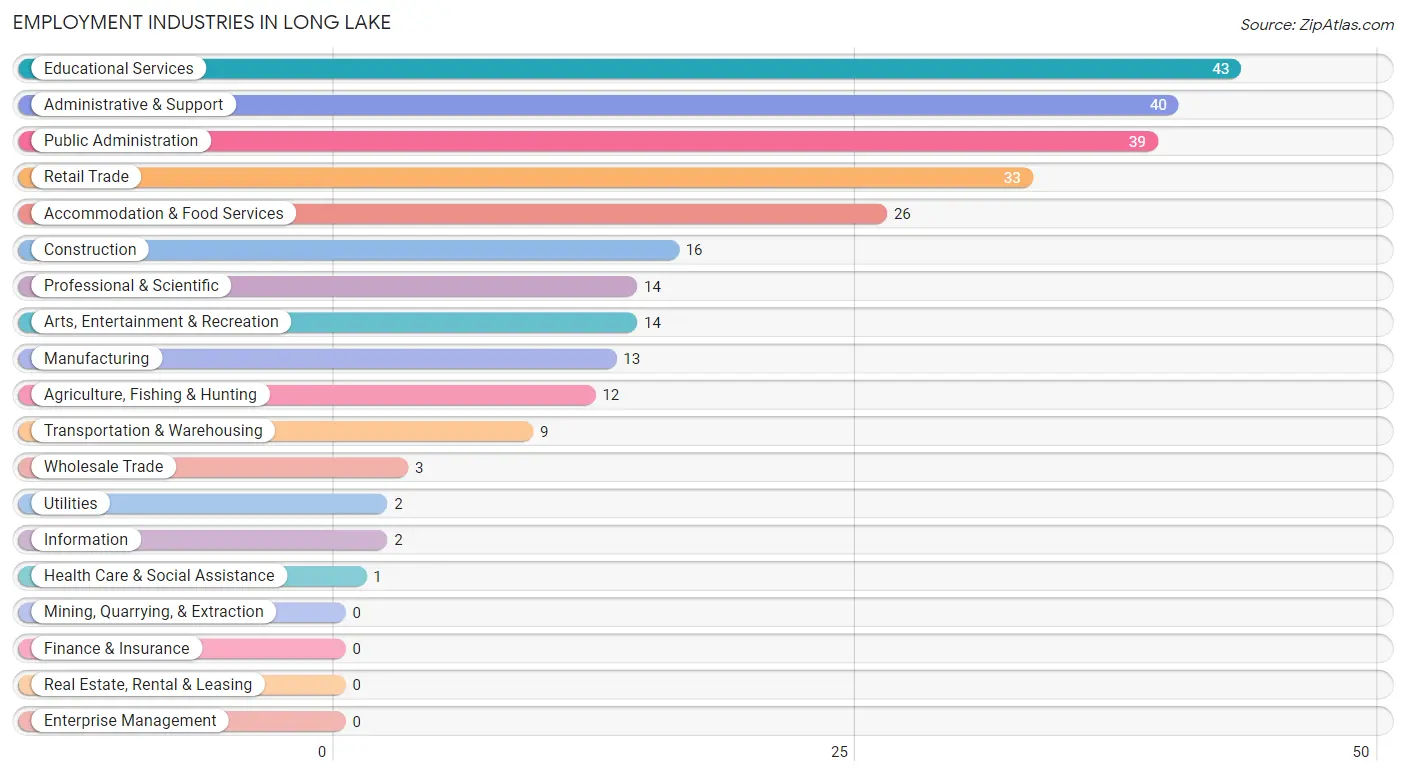
Employment Industries in Long Lake
The major employment industries in Long Lake include Educational Services (43 | 16.1%), Administrative & Support (40 | 15.0%), Public Administration (39 | 14.6%), Retail Trade (33 | 12.4%), and Accommodation & Food Services (26 | 9.7%).
Employment Industries by Sex in Long Lake
The Long Lake industries that see more men than women are Agriculture, Fishing & Hunting (100.0%), Manufacturing (100.0%), and Wholesale Trade (100.0%), whereas the industries that tend to have a higher number of women are Information (100.0%), Health Care & Social Assistance (100.0%), and Accommodation & Food Services (96.2%).
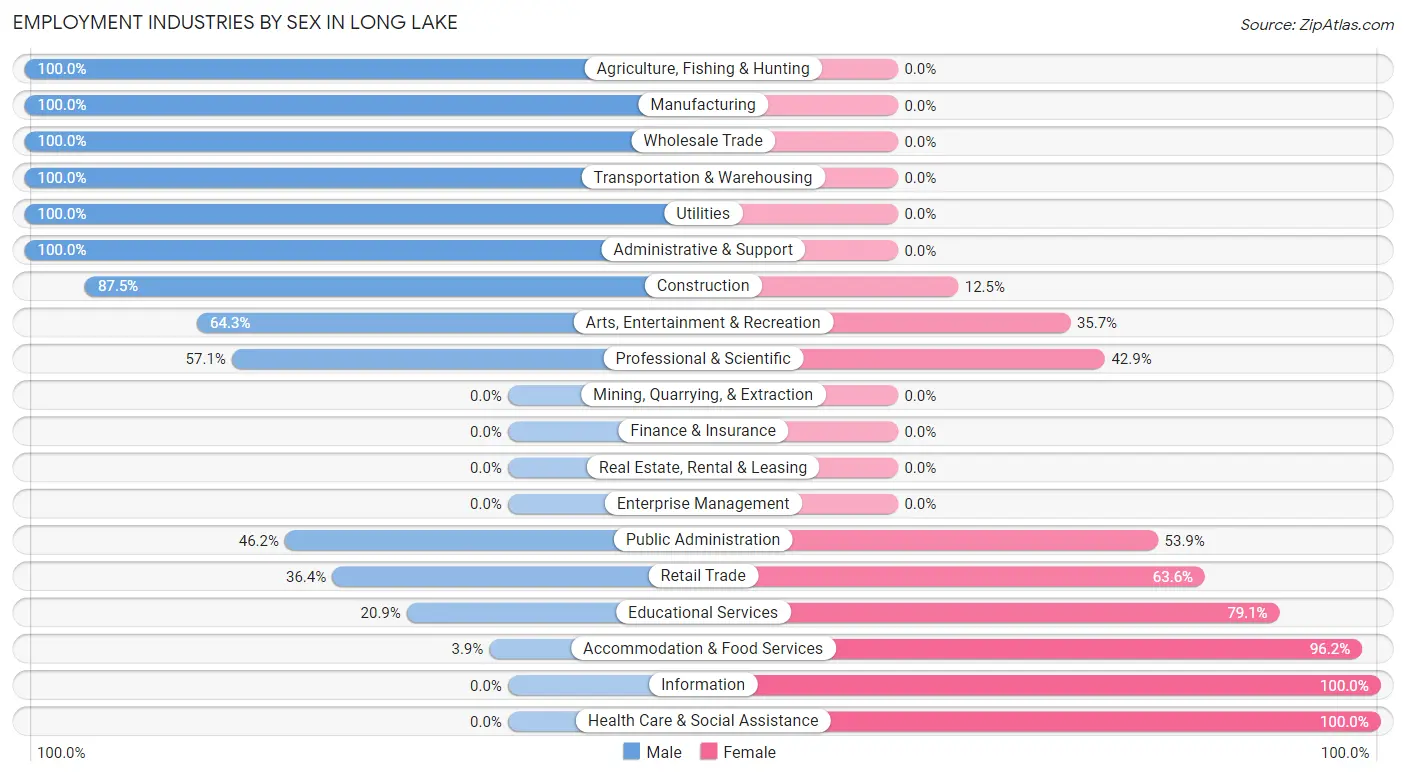
| Industry | Male | Female |
| Agriculture, Fishing & Hunting | 12 (100.0%) | 0 (0.0%) |
| Mining, Quarrying, & Extraction | 0 (0.0%) | 0 (0.0%) |
| Construction | 14 (87.5%) | 2 (12.5%) |
| Manufacturing | 13 (100.0%) | 0 (0.0%) |
| Wholesale Trade | 3 (100.0%) | 0 (0.0%) |
| Retail Trade | 12 (36.4%) | 21 (63.6%) |
| Transportation & Warehousing | 9 (100.0%) | 0 (0.0%) |
| Utilities | 2 (100.0%) | 0 (0.0%) |
| Information | 0 (0.0%) | 2 (100.0%) |
| Finance & Insurance | 0 (0.0%) | 0 (0.0%) |
| Real Estate, Rental & Leasing | 0 (0.0%) | 0 (0.0%) |
| Professional & Scientific | 8 (57.1%) | 6 (42.9%) |
| Enterprise Management | 0 (0.0%) | 0 (0.0%) |
| Administrative & Support | 40 (100.0%) | 0 (0.0%) |
| Educational Services | 9 (20.9%) | 34 (79.1%) |
| Health Care & Social Assistance | 0 (0.0%) | 1 (100.0%) |
| Arts, Entertainment & Recreation | 9 (64.3%) | 5 (35.7%) |
| Accommodation & Food Services | 1 (3.8%) | 25 (96.2%) |
| Public Administration | 18 (46.2%) | 21 (53.8%) |
| Total | 150 (56.2%) | 117 (43.8%) |
Education in Long Lake
School Enrollment in Long Lake
The most common levels of schooling among the 108 students in Long Lake are high school (51 | 47.2%), middle school (34 | 31.5%), and college / undergraduate (17 | 15.7%).
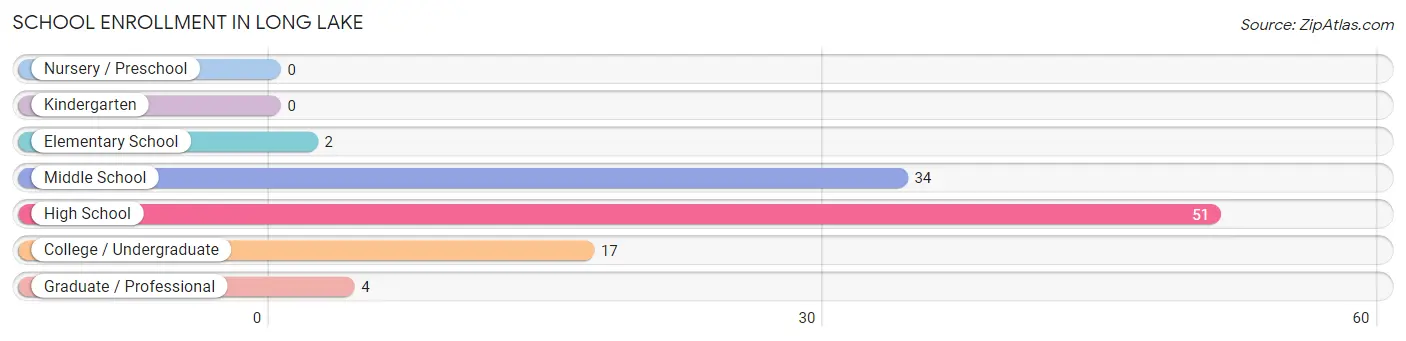
| School Level | # Students | % Students |
| Nursery / Preschool | 0 | 0.0% |
| Kindergarten | 0 | 0.0% |
| Elementary School | 2 | 1.8% |
| Middle School | 34 | 31.5% |
| High School | 51 | 47.2% |
| College / Undergraduate | 17 | 15.7% |
| Graduate / Professional | 4 | 3.7% |
| Total | 108 | 100.0% |
School Enrollment by Age by Funding Source in Long Lake
Out of a total of 108 students who are enrolled in schools in Long Lake, 4 (3.7%) attend a private institution, while the remaining 104 (96.3%) are enrolled in public schools. The age group of 20 to 24 year olds has the highest likelihood of being enrolled in private schools, with 3 (100.0% in the age bracket) enrolled. Conversely, the age group of 5 to 9 year old has the lowest likelihood of being enrolled in a private school, with 2 (100.0% in the age bracket) attending a public institution.
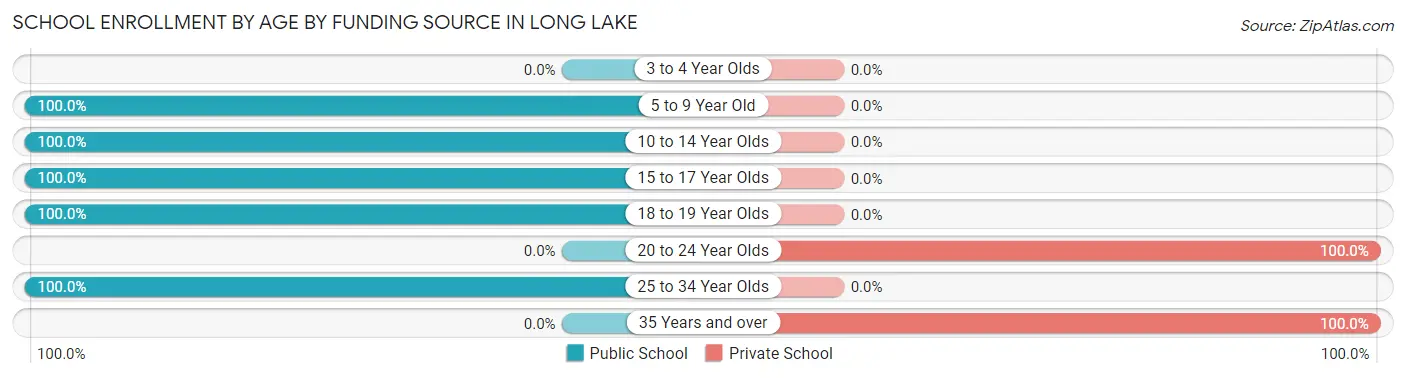
| Age Bracket | Public School | Private School |
| 3 to 4 Year Olds | 0 (0.0%) | 0 (0.0%) |
| 5 to 9 Year Old | 2 (100.0%) | 0 (0.0%) |
| 10 to 14 Year Olds | 45 (100.0%) | 0 (0.0%) |
| 15 to 17 Year Olds | 8 (100.0%) | 0 (0.0%) |
| 18 to 19 Year Olds | 32 (100.0%) | 0 (0.0%) |
| 20 to 24 Year Olds | 0 (0.0%) | 3 (100.0%) |
| 25 to 34 Year Olds | 17 (100.0%) | 0 (0.0%) |
| 35 Years and over | 0 (0.0%) | 1 (100.0%) |
| Total | 104 (96.3%) | 4 (3.7%) |
Educational Attainment by Field of Study in Long Lake
Science & technology (60 | 26.6%), education (39 | 17.3%), business (26 | 11.5%), bio, nature & agricultural (21 | 9.3%), and literature & languages (19 | 8.4%) are the most common fields of study among 226 individuals in Long Lake who have obtained a bachelor's degree or higher.
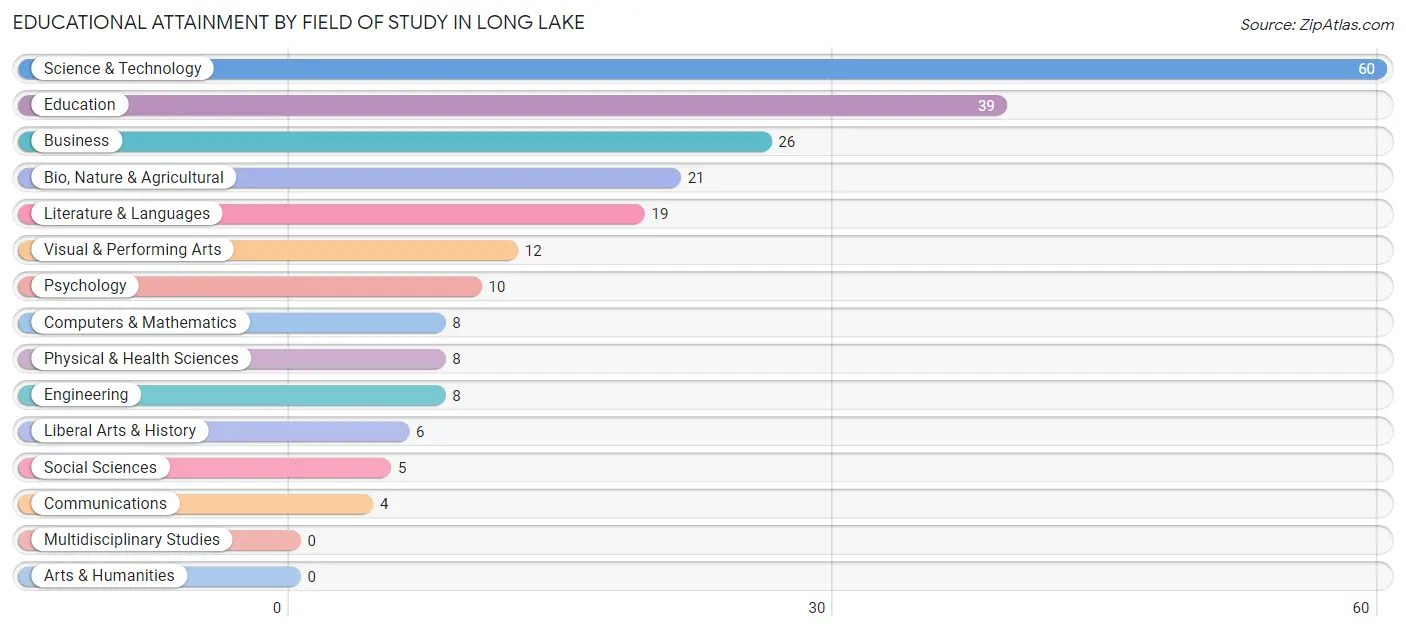
| Field of Study | # Graduates | % Graduates |
| Computers & Mathematics | 8 | 3.5% |
| Bio, Nature & Agricultural | 21 | 9.3% |
| Physical & Health Sciences | 8 | 3.5% |
| Psychology | 10 | 4.4% |
| Social Sciences | 5 | 2.2% |
| Engineering | 8 | 3.5% |
| Multidisciplinary Studies | 0 | 0.0% |
| Science & Technology | 60 | 26.6% |
| Business | 26 | 11.5% |
| Education | 39 | 17.3% |
| Literature & Languages | 19 | 8.4% |
| Liberal Arts & History | 6 | 2.6% |
| Visual & Performing Arts | 12 | 5.3% |
| Communications | 4 | 1.8% |
| Arts & Humanities | 0 | 0.0% |
| Total | 226 | 100.0% |
Transportation & Commute in Long Lake
Vehicle Availability by Sex in Long Lake
The most prevalent vehicle ownership categories in Long Lake are males with 2 vehicles (61, accounting for 40.7%) and females with 2 vehicles (74, making up 52.1%).
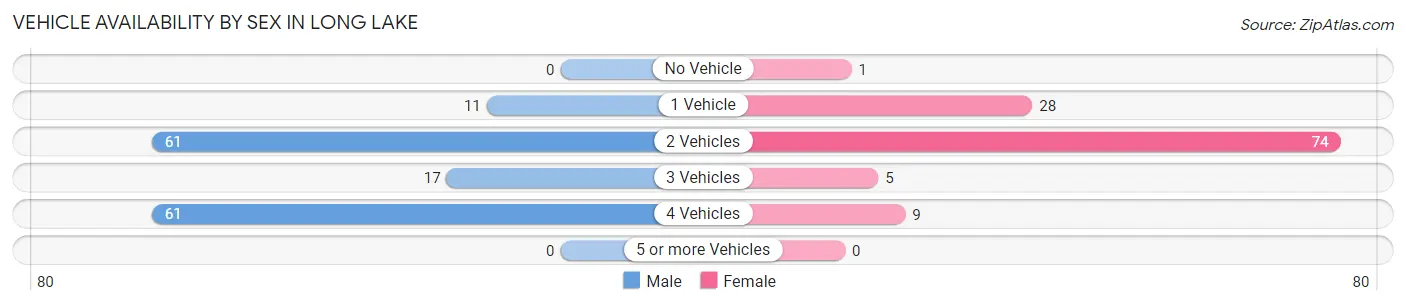
| Vehicles Available | Male | Female |
| No Vehicle | 0 (0.0%) | 1 (0.9%) |
| 1 Vehicle | 11 (7.3%) | 28 (23.9%) |
| 2 Vehicles | 61 (40.7%) | 74 (63.2%) |
| 3 Vehicles | 17 (11.3%) | 5 (4.3%) |
| 4 Vehicles | 61 (40.7%) | 9 (7.7%) |
| 5 or more Vehicles | 0 (0.0%) | 0 (0.0%) |
| Total | 150 (100.0%) | 117 (100.0%) |
Commute Time in Long Lake
The most frequently occuring commute durations in Long Lake are 5 to 9 minutes (127 commuters, 52.9%), 45 to 59 minutes (41 commuters, 17.1%), and 30 to 34 minutes (13 commuters, 5.4%).
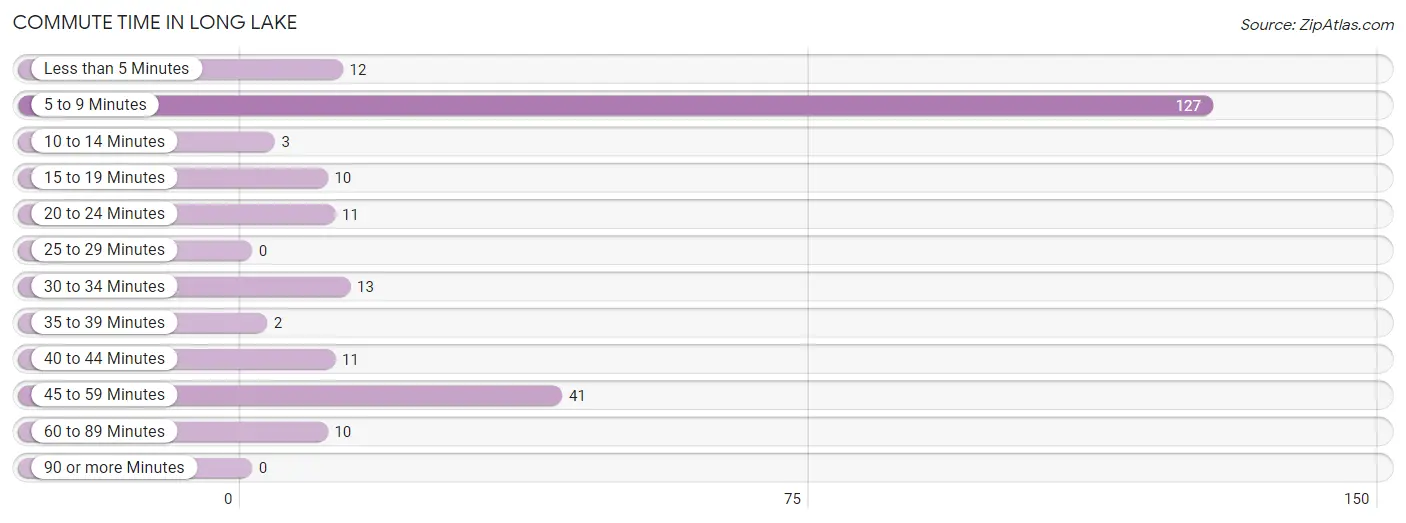
| Commute Time | # Commuters | % Commuters |
| Less than 5 Minutes | 12 | 5.0% |
| 5 to 9 Minutes | 127 | 52.9% |
| 10 to 14 Minutes | 3 | 1.3% |
| 15 to 19 Minutes | 10 | 4.2% |
| 20 to 24 Minutes | 11 | 4.6% |
| 25 to 29 Minutes | 0 | 0.0% |
| 30 to 34 Minutes | 13 | 5.4% |
| 35 to 39 Minutes | 2 | 0.8% |
| 40 to 44 Minutes | 11 | 4.6% |
| 45 to 59 Minutes | 41 | 17.1% |
| 60 to 89 Minutes | 10 | 4.2% |
| 90 or more Minutes | 0 | 0.0% |
Commute Time by Sex in Long Lake
The most common commute times in Long Lake are 5 to 9 minutes (60 commuters, 45.5%) for males and 5 to 9 minutes (67 commuters, 62.0%) for females.
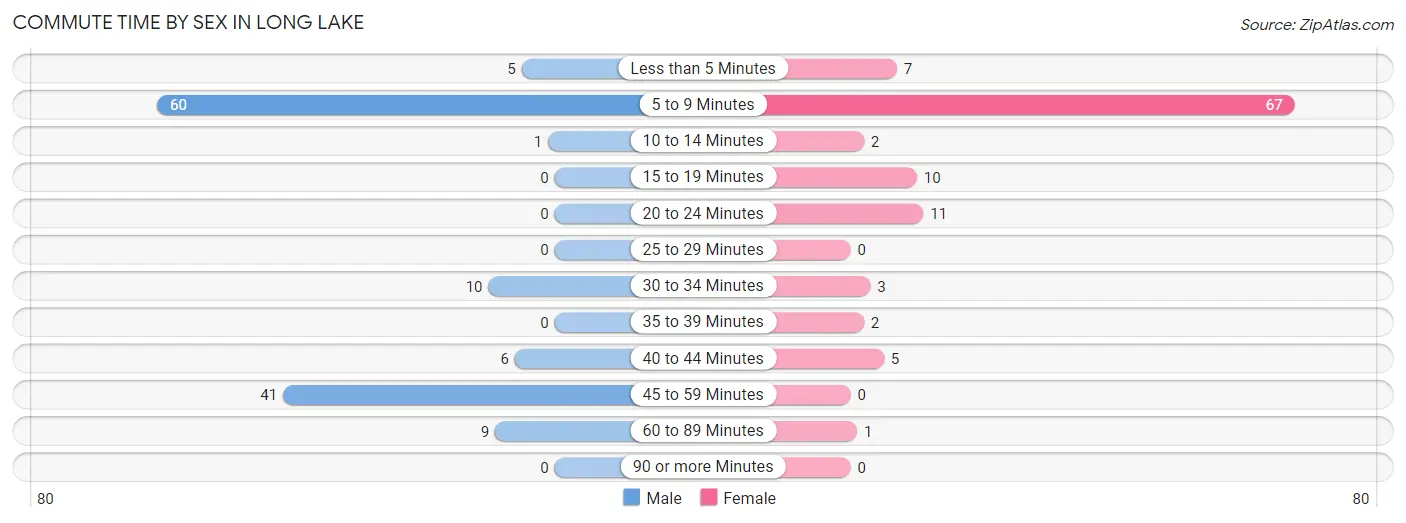
| Commute Time | Male | Female |
| Less than 5 Minutes | 5 (3.8%) | 7 (6.5%) |
| 5 to 9 Minutes | 60 (45.5%) | 67 (62.0%) |
| 10 to 14 Minutes | 1 (0.8%) | 2 (1.8%) |
| 15 to 19 Minutes | 0 (0.0%) | 10 (9.3%) |
| 20 to 24 Minutes | 0 (0.0%) | 11 (10.2%) |
| 25 to 29 Minutes | 0 (0.0%) | 0 (0.0%) |
| 30 to 34 Minutes | 10 (7.6%) | 3 (2.8%) |
| 35 to 39 Minutes | 0 (0.0%) | 2 (1.8%) |
| 40 to 44 Minutes | 6 (4.5%) | 5 (4.6%) |
| 45 to 59 Minutes | 41 (31.1%) | 0 (0.0%) |
| 60 to 89 Minutes | 9 (6.8%) | 1 (0.9%) |
| 90 or more Minutes | 0 (0.0%) | 0 (0.0%) |
Time of Departure to Work by Sex in Long Lake
The most frequent times of departure to work in Long Lake are 7:00 AM to 7:29 AM (74, 56.1%) for males and 12:00 AM to 4:59 AM (21, 19.4%) for females.
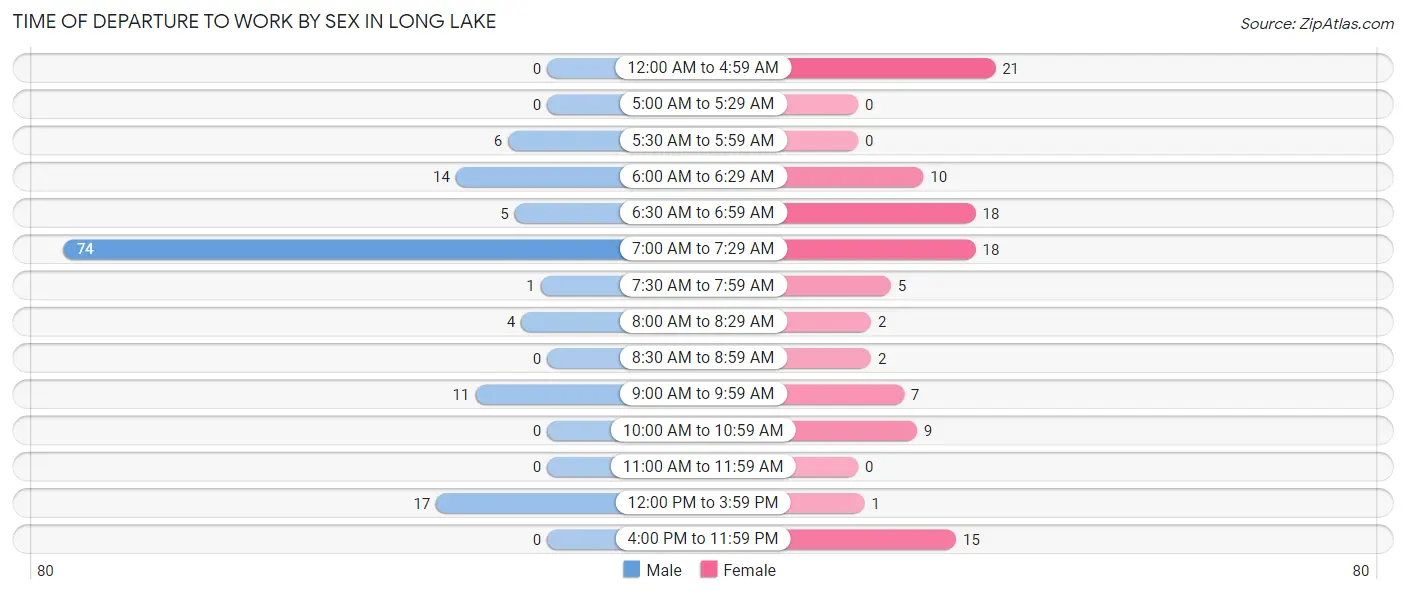
| Time of Departure | Male | Female |
| 12:00 AM to 4:59 AM | 0 (0.0%) | 21 (19.4%) |
| 5:00 AM to 5:29 AM | 0 (0.0%) | 0 (0.0%) |
| 5:30 AM to 5:59 AM | 6 (4.5%) | 0 (0.0%) |
| 6:00 AM to 6:29 AM | 14 (10.6%) | 10 (9.3%) |
| 6:30 AM to 6:59 AM | 5 (3.8%) | 18 (16.7%) |
| 7:00 AM to 7:29 AM | 74 (56.1%) | 18 (16.7%) |
| 7:30 AM to 7:59 AM | 1 (0.8%) | 5 (4.6%) |
| 8:00 AM to 8:29 AM | 4 (3.0%) | 2 (1.8%) |
| 8:30 AM to 8:59 AM | 0 (0.0%) | 2 (1.8%) |
| 9:00 AM to 9:59 AM | 11 (8.3%) | 7 (6.5%) |
| 10:00 AM to 10:59 AM | 0 (0.0%) | 9 (8.3%) |
| 11:00 AM to 11:59 AM | 0 (0.0%) | 0 (0.0%) |
| 12:00 PM to 3:59 PM | 17 (12.9%) | 1 (0.9%) |
| 4:00 PM to 11:59 PM | 0 (0.0%) | 15 (13.9%) |
| Total | 132 (100.0%) | 108 (100.0%) |
Housing Occupancy in Long Lake
Occupancy by Ownership in Long Lake
Of the total 225 dwellings in Long Lake, owner-occupied units account for 210 (93.3%), while renter-occupied units make up 15 (6.7%).
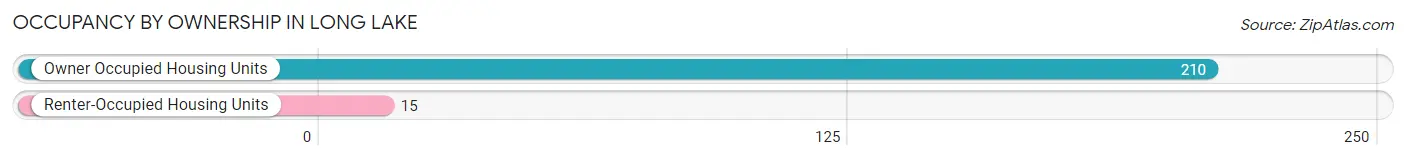
| Occupancy | # Housing Units | % Housing Units |
| Owner Occupied Housing Units | 210 | 93.3% |
| Renter-Occupied Housing Units | 15 | 6.7% |
| Total Occupied Housing Units | 225 | 100.0% |
Occupancy by Household Size in Long Lake
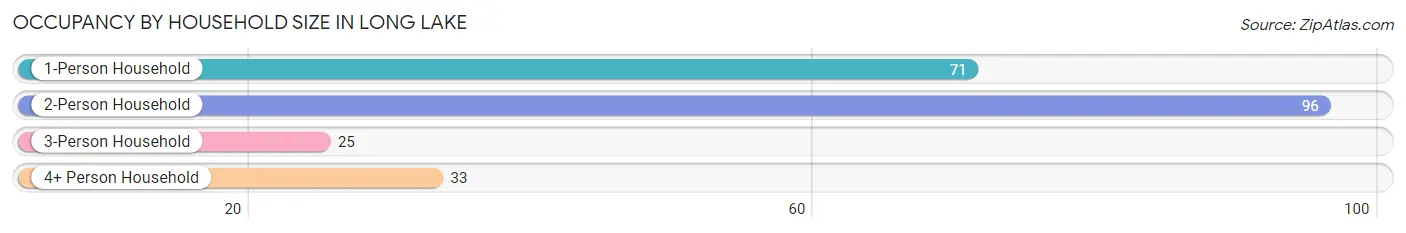
| Household Size | # Housing Units | % Housing Units |
| 1-Person Household | 71 | 31.6% |
| 2-Person Household | 96 | 42.7% |
| 3-Person Household | 25 | 11.1% |
| 4+ Person Household | 33 | 14.7% |
| Total Housing Units | 225 | 100.0% |
Occupancy by Ownership by Household Size in Long Lake
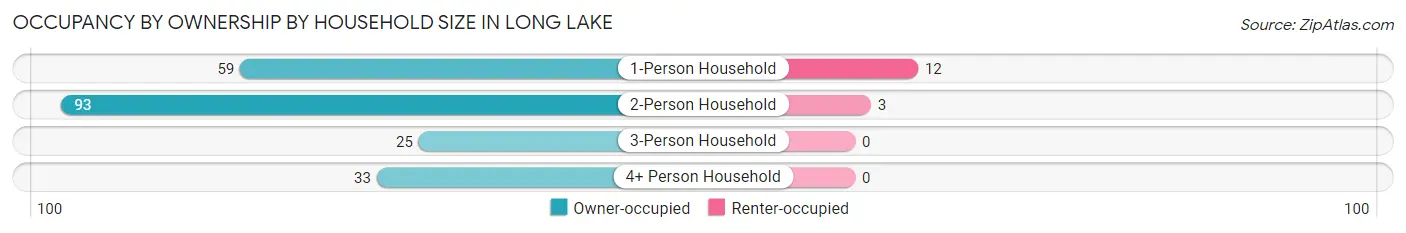
| Household Size | Owner-occupied | Renter-occupied |
| 1-Person Household | 59 (83.1%) | 12 (16.9%) |
| 2-Person Household | 93 (96.9%) | 3 (3.1%) |
| 3-Person Household | 25 (100.0%) | 0 (0.0%) |
| 4+ Person Household | 33 (100.0%) | 0 (0.0%) |
| Total Housing Units | 210 (93.3%) | 15 (6.7%) |
Occupancy by Educational Attainment in Long Lake
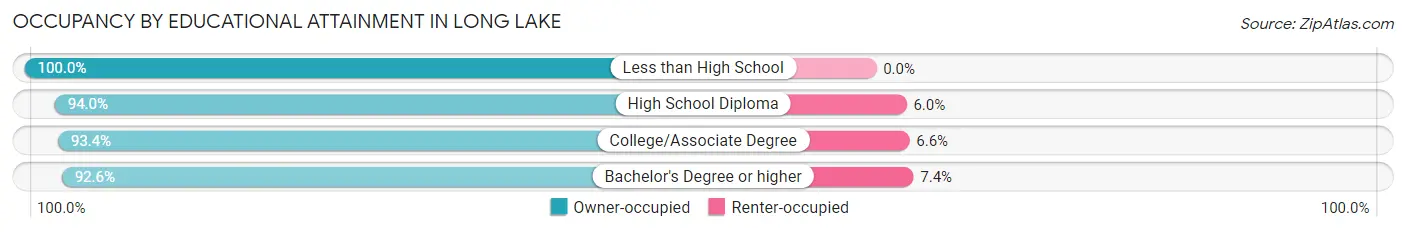
| Household Size | Owner-occupied | Renter-occupied |
| Less than High School | 4 (100.0%) | 0 (0.0%) |
| High School Diploma | 47 (94.0%) | 3 (6.0%) |
| College/Associate Degree | 71 (93.4%) | 5 (6.6%) |
| Bachelor's Degree or higher | 88 (92.6%) | 7 (7.4%) |
Occupancy by Age of Householder in Long Lake
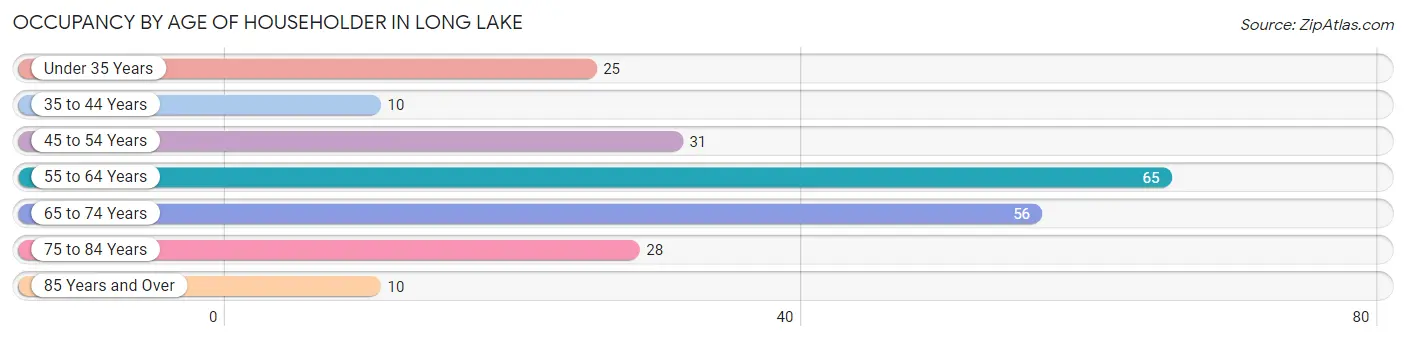
| Age Bracket | # Households | % Households |
| Under 35 Years | 25 | 11.1% |
| 35 to 44 Years | 10 | 4.4% |
| 45 to 54 Years | 31 | 13.8% |
| 55 to 64 Years | 65 | 28.9% |
| 65 to 74 Years | 56 | 24.9% |
| 75 to 84 Years | 28 | 12.4% |
| 85 Years and Over | 10 | 4.4% |
| Total | 225 | 100.0% |
Housing Finances in Long Lake
Median Income by Occupancy in Long Lake
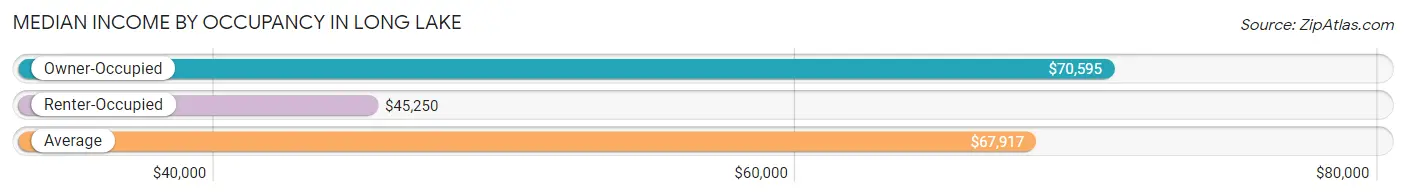
| Occupancy Type | # Households | Median Income |
| Owner-Occupied | 210 (93.3%) | $70,595 |
| Renter-Occupied | 15 (6.7%) | $45,250 |
| Average | 225 (100.0%) | $67,917 |
Occupancy by Householder Income Bracket in Long Lake
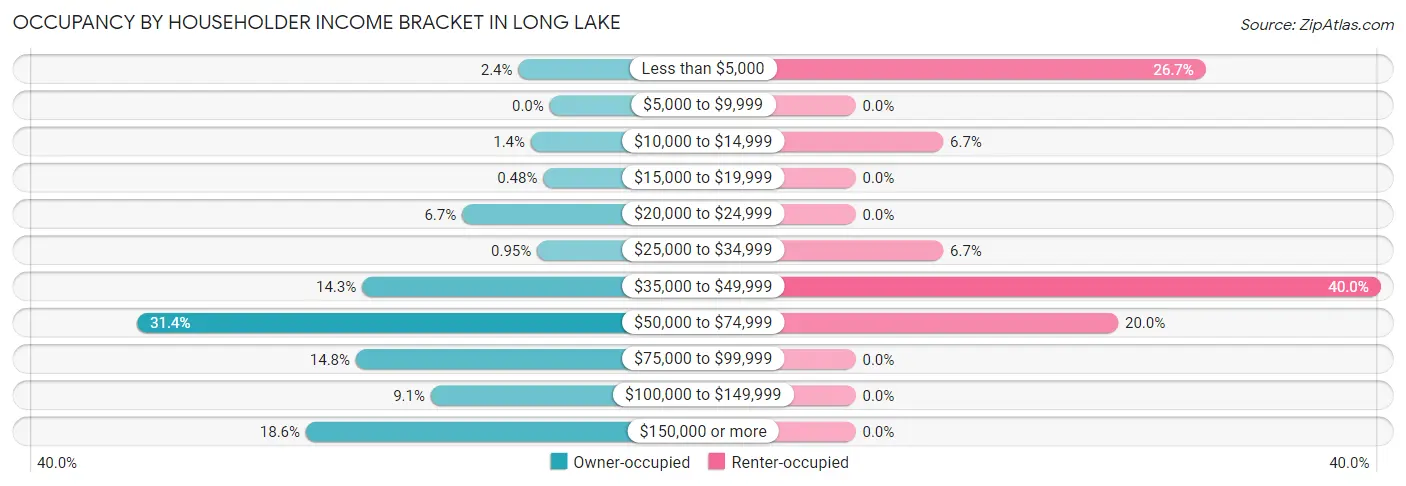
| Income Bracket | Owner-occupied | Renter-occupied |
| Less than $5,000 | 5 (2.4%) | 4 (26.7%) |
| $5,000 to $9,999 | 0 (0.0%) | 0 (0.0%) |
| $10,000 to $14,999 | 3 (1.4%) | 1 (6.7%) |
| $15,000 to $19,999 | 1 (0.5%) | 0 (0.0%) |
| $20,000 to $24,999 | 14 (6.7%) | 0 (0.0%) |
| $25,000 to $34,999 | 2 (0.9%) | 1 (6.7%) |
| $35,000 to $49,999 | 30 (14.3%) | 6 (40.0%) |
| $50,000 to $74,999 | 66 (31.4%) | 3 (20.0%) |
| $75,000 to $99,999 | 31 (14.8%) | 0 (0.0%) |
| $100,000 to $149,999 | 19 (9.0%) | 0 (0.0%) |
| $150,000 or more | 39 (18.6%) | 0 (0.0%) |
| Total | 210 (100.0%) | 15 (100.0%) |
Monthly Housing Cost Tiers in Long Lake
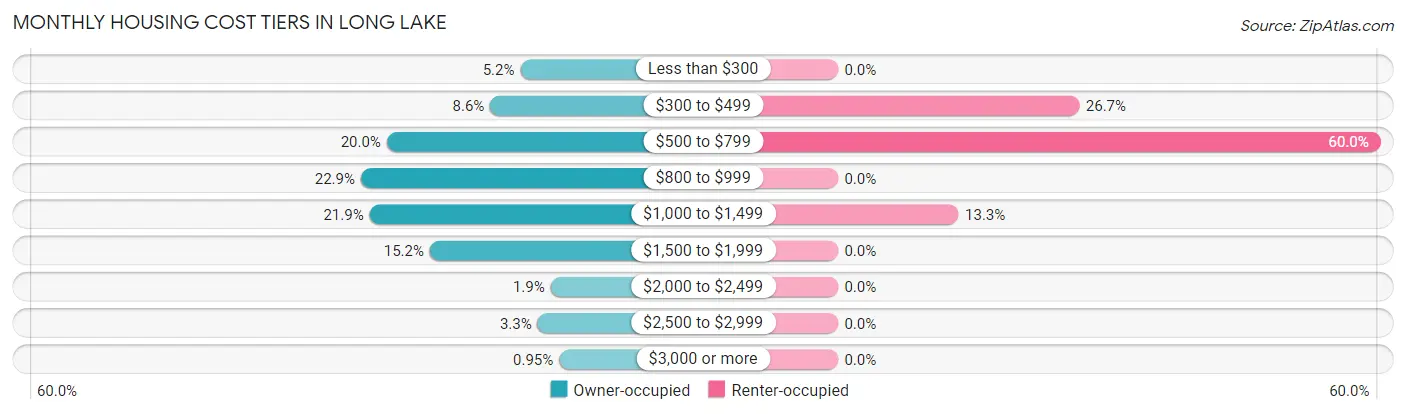
| Monthly Cost | Owner-occupied | Renter-occupied |
| Less than $300 | 11 (5.2%) | 0 (0.0%) |
| $300 to $499 | 18 (8.6%) | 4 (26.7%) |
| $500 to $799 | 42 (20.0%) | 9 (60.0%) |
| $800 to $999 | 48 (22.9%) | 0 (0.0%) |
| $1,000 to $1,499 | 46 (21.9%) | 2 (13.3%) |
| $1,500 to $1,999 | 32 (15.2%) | 0 (0.0%) |
| $2,000 to $2,499 | 4 (1.9%) | 0 (0.0%) |
| $2,500 to $2,999 | 7 (3.3%) | 0 (0.0%) |
| $3,000 or more | 2 (0.9%) | 0 (0.0%) |
| Total | 210 (100.0%) | 15 (100.0%) |
Physical Housing Characteristics in Long Lake
Housing Structures in Long Lake
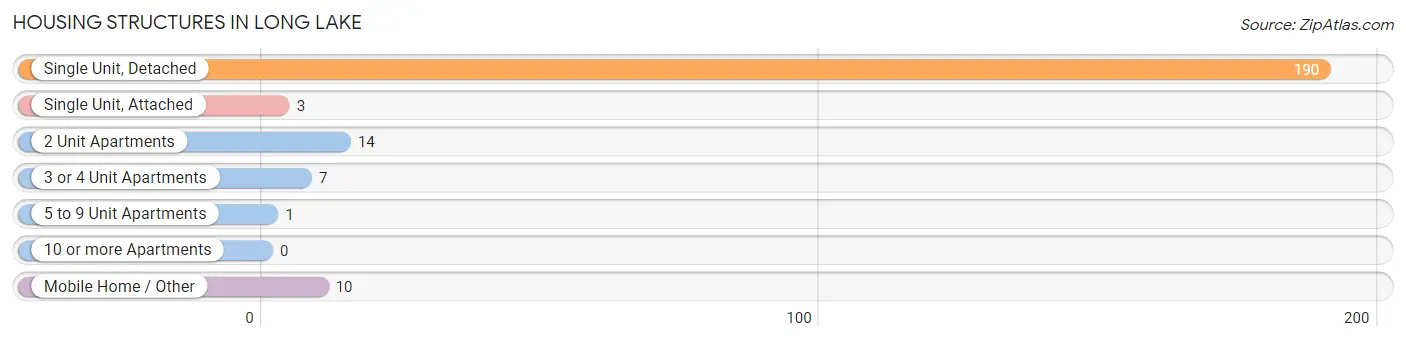
| Structure Type | # Housing Units | % Housing Units |
| Single Unit, Detached | 190 | 84.4% |
| Single Unit, Attached | 3 | 1.3% |
| 2 Unit Apartments | 14 | 6.2% |
| 3 or 4 Unit Apartments | 7 | 3.1% |
| 5 to 9 Unit Apartments | 1 | 0.4% |
| 10 or more Apartments | 0 | 0.0% |
| Mobile Home / Other | 10 | 4.4% |
| Total | 225 | 100.0% |
Housing Structures by Occupancy in Long Lake
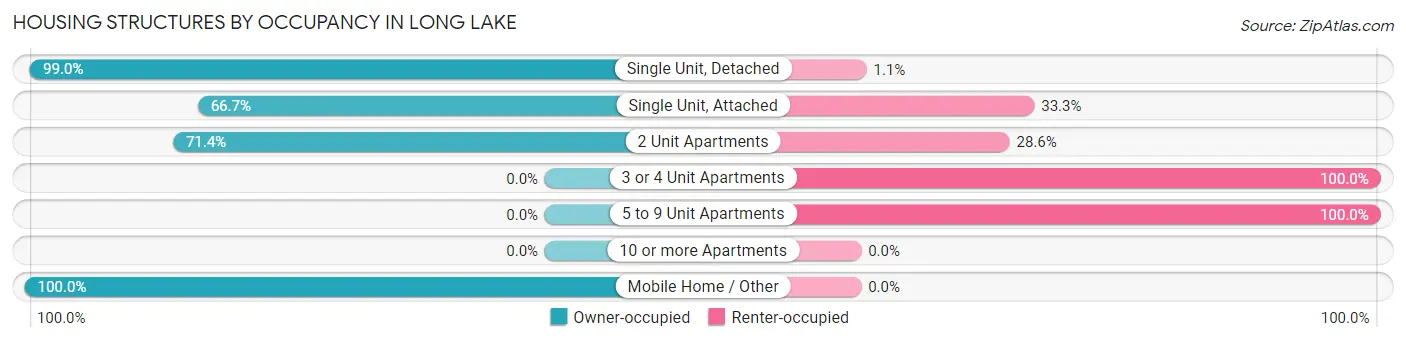
| Structure Type | Owner-occupied | Renter-occupied |
| Single Unit, Detached | 188 (99.0%) | 2 (1.1%) |
| Single Unit, Attached | 2 (66.7%) | 1 (33.3%) |
| 2 Unit Apartments | 10 (71.4%) | 4 (28.6%) |
| 3 or 4 Unit Apartments | 0 (0.0%) | 7 (100.0%) |
| 5 to 9 Unit Apartments | 0 (0.0%) | 1 (100.0%) |
| 10 or more Apartments | 0 (0.0%) | 0 (0.0%) |
| Mobile Home / Other | 10 (100.0%) | 0 (0.0%) |
| Total | 210 (93.3%) | 15 (6.7%) |
Housing Structures by Number of Rooms in Long Lake
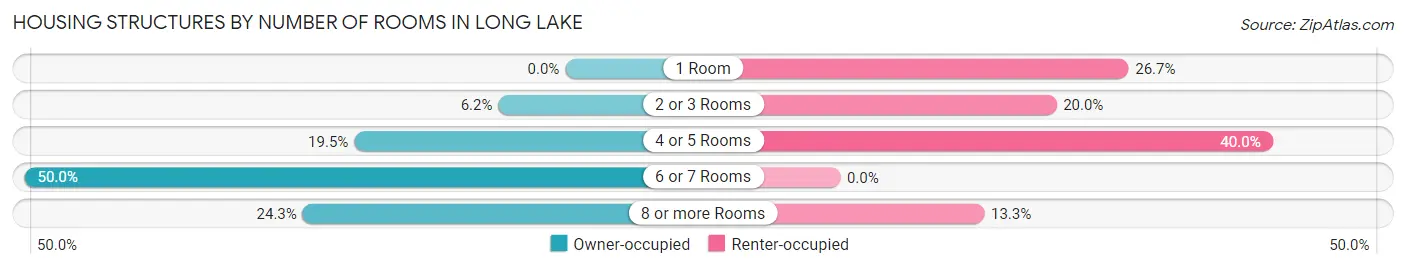
| Number of Rooms | Owner-occupied | Renter-occupied |
| 1 Room | 0 (0.0%) | 4 (26.7%) |
| 2 or 3 Rooms | 13 (6.2%) | 3 (20.0%) |
| 4 or 5 Rooms | 41 (19.5%) | 6 (40.0%) |
| 6 or 7 Rooms | 105 (50.0%) | 0 (0.0%) |
| 8 or more Rooms | 51 (24.3%) | 2 (13.3%) |
| Total | 210 (100.0%) | 15 (100.0%) |
Housing Structure by Heating Type in Long Lake
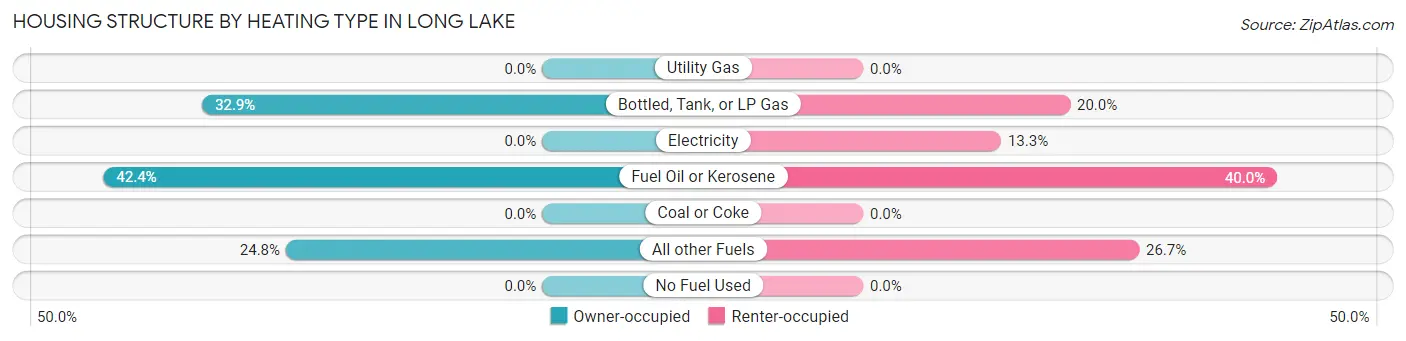
| Heating Type | Owner-occupied | Renter-occupied |
| Utility Gas | 0 (0.0%) | 0 (0.0%) |
| Bottled, Tank, or LP Gas | 69 (32.9%) | 3 (20.0%) |
| Electricity | 0 (0.0%) | 2 (13.3%) |
| Fuel Oil or Kerosene | 89 (42.4%) | 6 (40.0%) |
| Coal or Coke | 0 (0.0%) | 0 (0.0%) |
| All other Fuels | 52 (24.8%) | 4 (26.7%) |
| No Fuel Used | 0 (0.0%) | 0 (0.0%) |
| Total | 210 (100.0%) | 15 (100.0%) |
Household Vehicle Usage in Long Lake
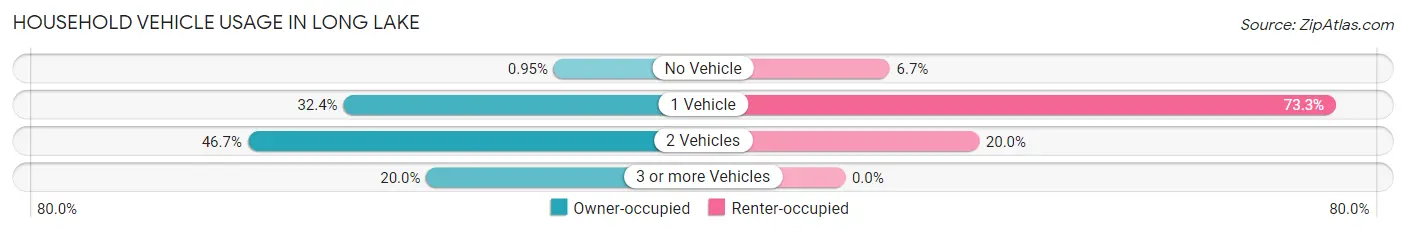
| Vehicles per Household | Owner-occupied | Renter-occupied |
| No Vehicle | 2 (0.9%) | 1 (6.7%) |
| 1 Vehicle | 68 (32.4%) | 11 (73.3%) |
| 2 Vehicles | 98 (46.7%) | 3 (20.0%) |
| 3 or more Vehicles | 42 (20.0%) | 0 (0.0%) |
| Total | 210 (100.0%) | 15 (100.0%) |
Real Estate & Mortgages in Long Lake
Real Estate and Mortgage Overview in Long Lake
| Characteristic | Without Mortgage | With Mortgage |
| Housing Units | 92 | 118 |
| Median Property Value | $233,300 | $173,200 |
| Median Household Income | $53,500 | $34 |
| Monthly Housing Costs | $636 | $2 |
| Real Estate Taxes | $2,154 | $0 |
Property Value by Mortgage Status in Long Lake
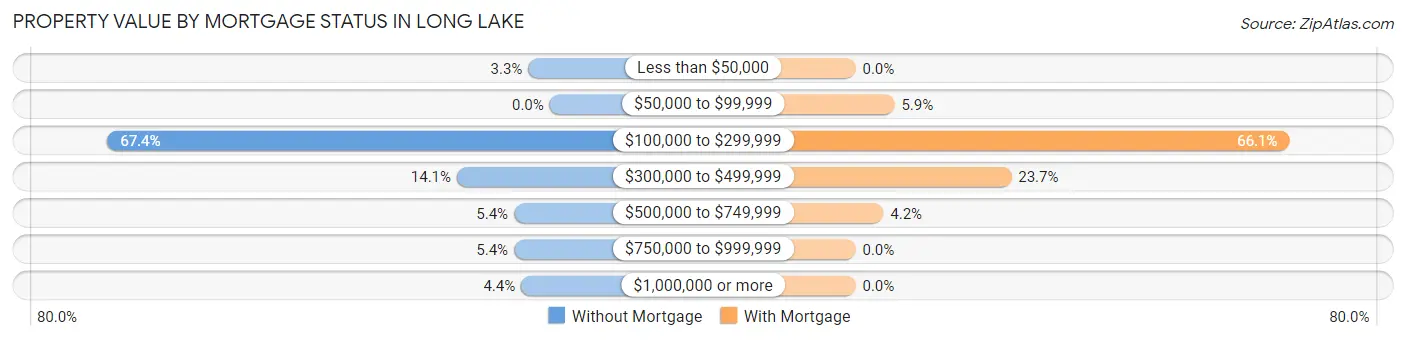
| Property Value | Without Mortgage | With Mortgage |
| Less than $50,000 | 3 (3.3%) | 0 (0.0%) |
| $50,000 to $99,999 | 0 (0.0%) | 7 (5.9%) |
| $100,000 to $299,999 | 62 (67.4%) | 78 (66.1%) |
| $300,000 to $499,999 | 13 (14.1%) | 28 (23.7%) |
| $500,000 to $749,999 | 5 (5.4%) | 5 (4.2%) |
| $750,000 to $999,999 | 5 (5.4%) | 0 (0.0%) |
| $1,000,000 or more | 4 (4.3%) | 0 (0.0%) |
| Total | 92 (100.0%) | 118 (100.0%) |
Household Income by Mortgage Status in Long Lake
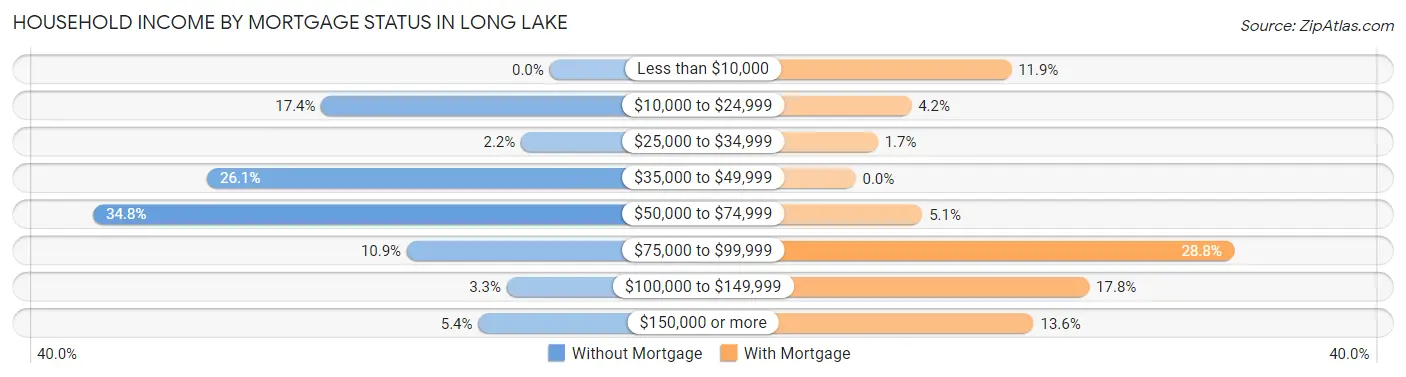
| Household Income | Without Mortgage | With Mortgage |
| Less than $10,000 | 0 (0.0%) | 14 (11.9%) |
| $10,000 to $24,999 | 16 (17.4%) | 5 (4.2%) |
| $25,000 to $34,999 | 2 (2.2%) | 2 (1.7%) |
| $35,000 to $49,999 | 24 (26.1%) | 0 (0.0%) |
| $50,000 to $74,999 | 32 (34.8%) | 6 (5.1%) |
| $75,000 to $99,999 | 10 (10.9%) | 34 (28.8%) |
| $100,000 to $149,999 | 3 (3.3%) | 21 (17.8%) |
| $150,000 or more | 5 (5.4%) | 16 (13.6%) |
| Total | 92 (100.0%) | 118 (100.0%) |
Property Value to Household Income Ratio in Long Lake
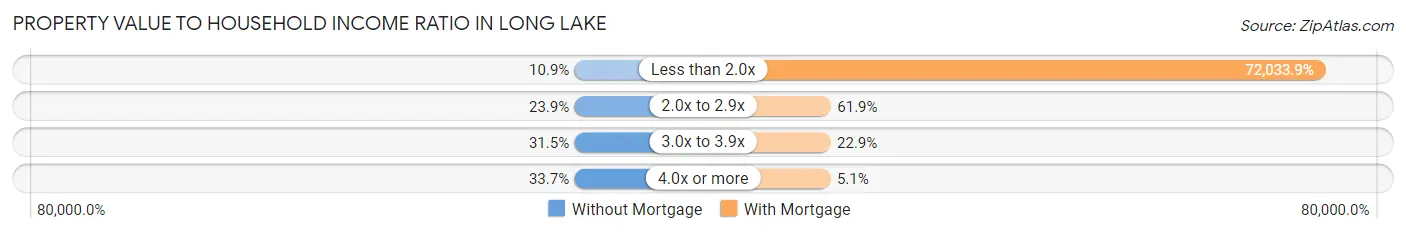
| Value-to-Income Ratio | Without Mortgage | With Mortgage |
| Less than 2.0x | 10 (10.9%) | 85,000 (72,033.9%) |
| 2.0x to 2.9x | 22 (23.9%) | 73 (61.9%) |
| 3.0x to 3.9x | 29 (31.5%) | 27 (22.9%) |
| 4.0x or more | 31 (33.7%) | 6 (5.1%) |
| Total | 92 (100.0%) | 118 (100.0%) |
Real Estate Taxes by Mortgage Status in Long Lake
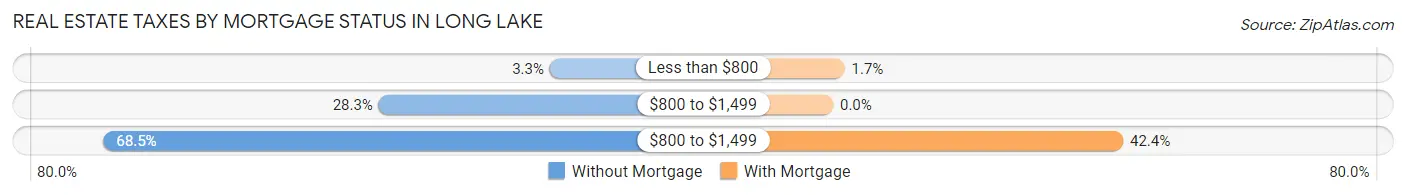
| Property Taxes | Without Mortgage | With Mortgage |
| Less than $800 | 3 (3.3%) | 2 (1.7%) |
| $800 to $1,499 | 26 (28.3%) | 0 (0.0%) |
| $800 to $1,499 | 63 (68.5%) | 50 (42.4%) |
| Total | 92 (100.0%) | 118 (100.0%) |
Health & Disability in Long Lake
Health Insurance Coverage by Age in Long Lake
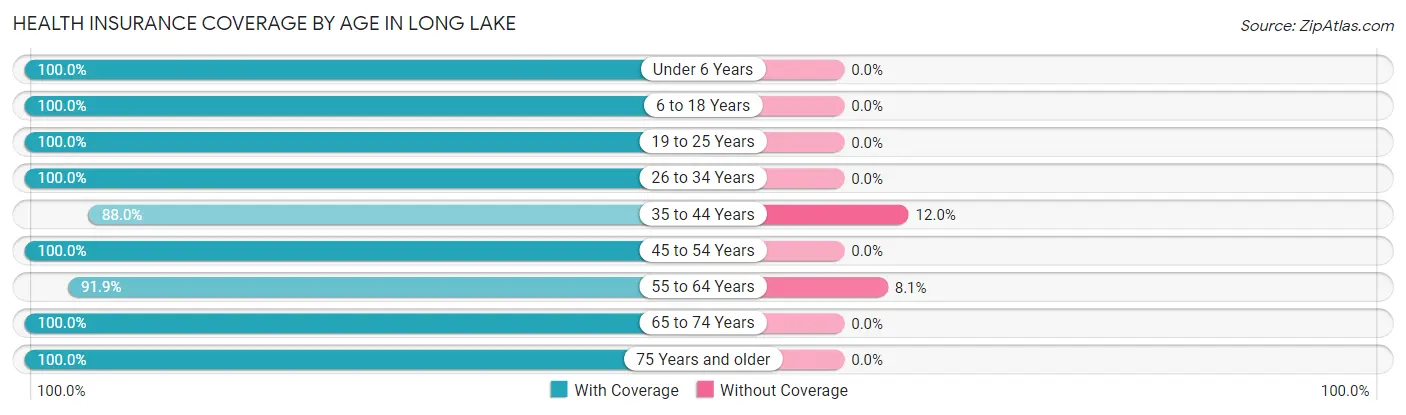
| Age Bracket | With Coverage | Without Coverage |
| Under 6 Years | 25 (100.0%) | 0 (0.0%) |
| 6 to 18 Years | 71 (100.0%) | 0 (0.0%) |
| 19 to 25 Years | 58 (100.0%) | 0 (0.0%) |
| 26 to 34 Years | 75 (100.0%) | 0 (0.0%) |
| 35 to 44 Years | 22 (88.0%) | 3 (12.0%) |
| 45 to 54 Years | 51 (100.0%) | 0 (0.0%) |
| 55 to 64 Years | 136 (91.9%) | 12 (8.1%) |
| 65 to 74 Years | 139 (100.0%) | 0 (0.0%) |
| 75 Years and older | 74 (100.0%) | 0 (0.0%) |
| Total | 651 (97.8%) | 15 (2.2%) |
Health Insurance Coverage by Citizenship Status in Long Lake
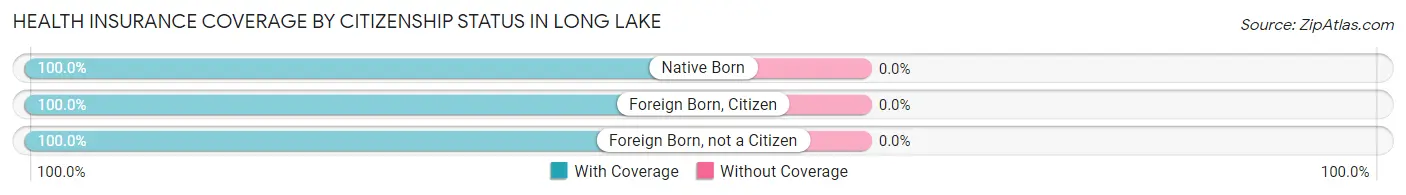
| Citizenship Status | With Coverage | Without Coverage |
| Native Born | 25 (100.0%) | 0 (0.0%) |
| Foreign Born, Citizen | 71 (100.0%) | 0 (0.0%) |
| Foreign Born, not a Citizen | 58 (100.0%) | 0 (0.0%) |
Health Insurance Coverage by Household Income in Long Lake
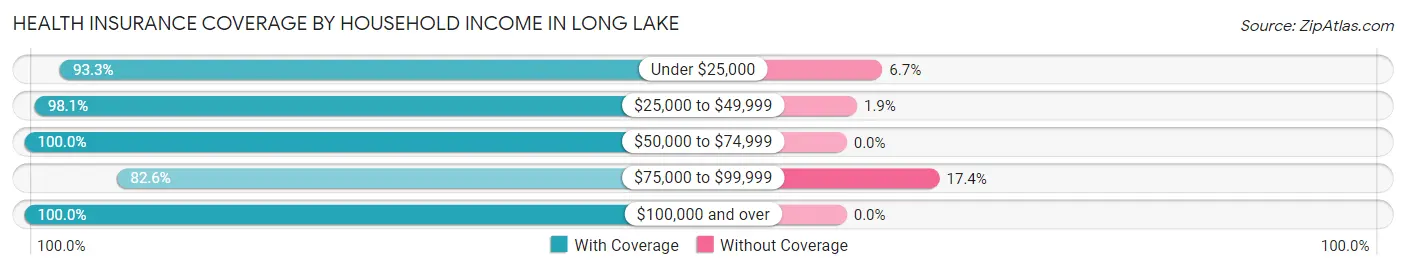
| Household Income | With Coverage | Without Coverage |
| Under $25,000 | 28 (93.3%) | 2 (6.7%) |
| $25,000 to $49,999 | 51 (98.1%) | 1 (1.9%) |
| $50,000 to $74,999 | 230 (100.0%) | 0 (0.0%) |
| $75,000 to $99,999 | 57 (82.6%) | 12 (17.4%) |
| $100,000 and over | 255 (100.0%) | 0 (0.0%) |
Public vs Private Health Insurance Coverage by Age in Long Lake
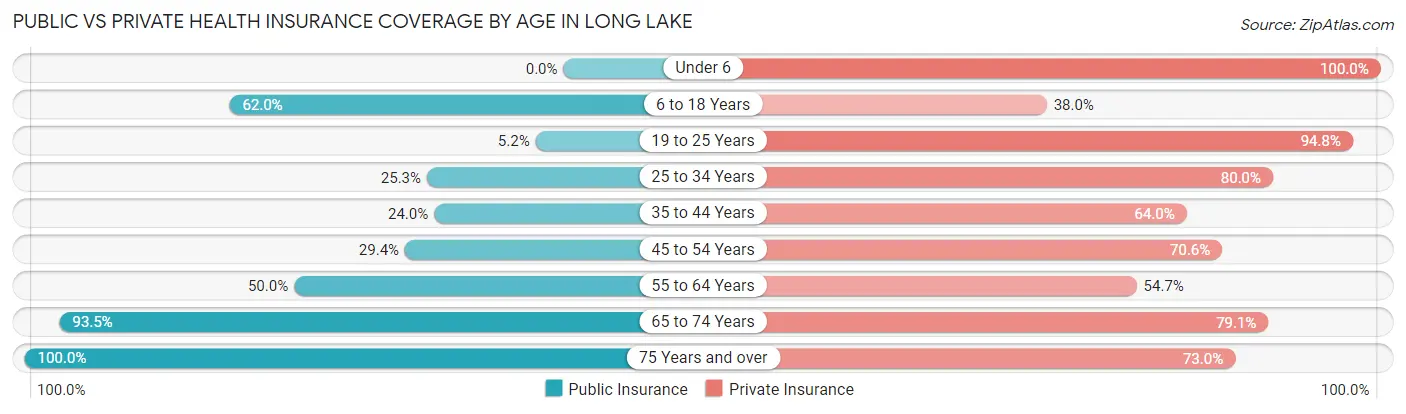
| Age Bracket | Public Insurance | Private Insurance |
| Under 6 | 0 (0.0%) | 25 (100.0%) |
| 6 to 18 Years | 44 (62.0%) | 27 (38.0%) |
| 19 to 25 Years | 3 (5.2%) | 55 (94.8%) |
| 25 to 34 Years | 19 (25.3%) | 60 (80.0%) |
| 35 to 44 Years | 6 (24.0%) | 16 (64.0%) |
| 45 to 54 Years | 15 (29.4%) | 36 (70.6%) |
| 55 to 64 Years | 74 (50.0%) | 81 (54.7%) |
| 65 to 74 Years | 130 (93.5%) | 110 (79.1%) |
| 75 Years and over | 74 (100.0%) | 54 (73.0%) |
| Total | 365 (54.8%) | 464 (69.7%) |
Disability Status by Sex by Age in Long Lake
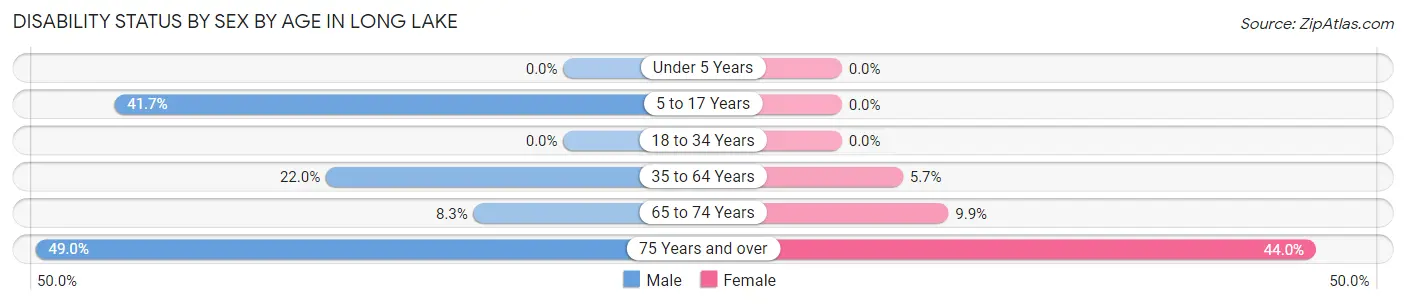
| Age Bracket | Male | Female |
| Under 5 Years | 0 (0.0%) | 0 (0.0%) |
| 5 to 17 Years | 10 (41.7%) | 0 (0.0%) |
| 18 to 34 Years | 0 (0.0%) | 0 (0.0%) |
| 35 to 64 Years | 26 (22.0%) | 6 (5.7%) |
| 65 to 74 Years | 4 (8.3%) | 9 (9.9%) |
| 75 Years and over | 24 (49.0%) | 11 (44.0%) |
Disability Class by Sex by Age in Long Lake
Disability Class: Hearing Difficulty
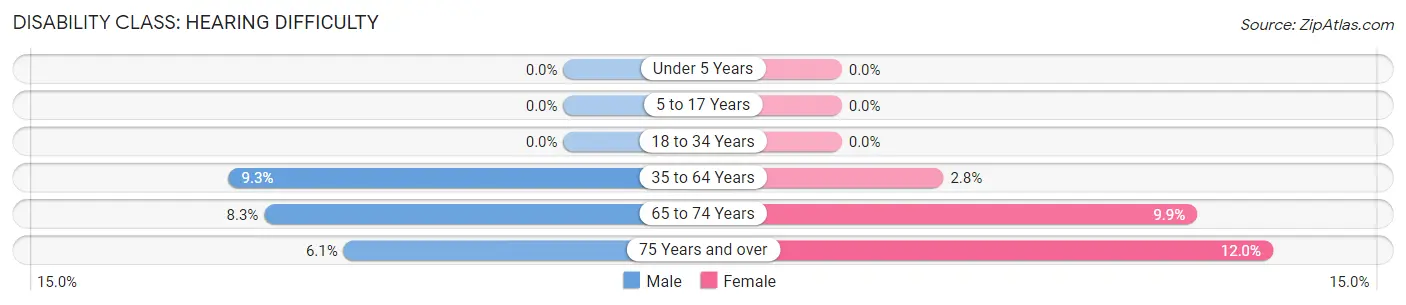
| Age Bracket | Male | Female |
| Under 5 Years | 0 (0.0%) | 0 (0.0%) |
| 5 to 17 Years | 0 (0.0%) | 0 (0.0%) |
| 18 to 34 Years | 0 (0.0%) | 0 (0.0%) |
| 35 to 64 Years | 11 (9.3%) | 3 (2.8%) |
| 65 to 74 Years | 4 (8.3%) | 9 (9.9%) |
| 75 Years and over | 3 (6.1%) | 3 (12.0%) |
Disability Class: Vision Difficulty
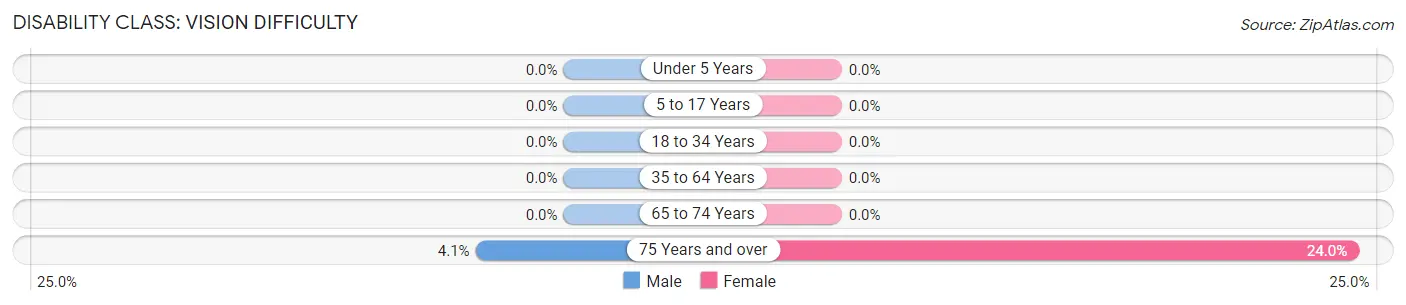
| Age Bracket | Male | Female |
| Under 5 Years | 0 (0.0%) | 0 (0.0%) |
| 5 to 17 Years | 0 (0.0%) | 0 (0.0%) |
| 18 to 34 Years | 0 (0.0%) | 0 (0.0%) |
| 35 to 64 Years | 0 (0.0%) | 0 (0.0%) |
| 65 to 74 Years | 0 (0.0%) | 0 (0.0%) |
| 75 Years and over | 2 (4.1%) | 6 (24.0%) |
Disability Class: Cognitive Difficulty
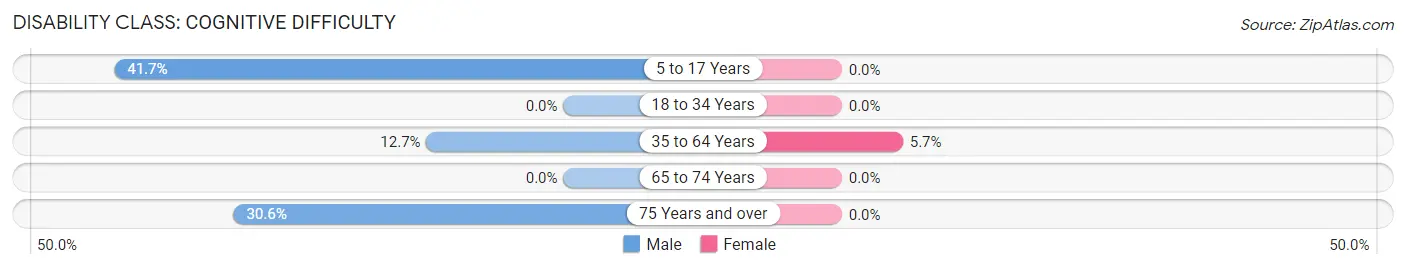
| Age Bracket | Male | Female |
| 5 to 17 Years | 10 (41.7%) | 0 (0.0%) |
| 18 to 34 Years | 0 (0.0%) | 0 (0.0%) |
| 35 to 64 Years | 15 (12.7%) | 6 (5.7%) |
| 65 to 74 Years | 0 (0.0%) | 0 (0.0%) |
| 75 Years and over | 15 (30.6%) | 0 (0.0%) |
Disability Class: Ambulatory Difficulty
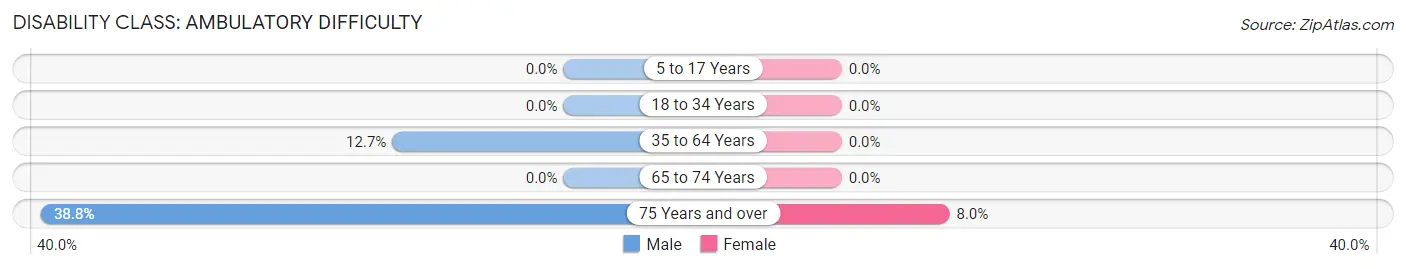
| Age Bracket | Male | Female |
| 5 to 17 Years | 0 (0.0%) | 0 (0.0%) |
| 18 to 34 Years | 0 (0.0%) | 0 (0.0%) |
| 35 to 64 Years | 15 (12.7%) | 0 (0.0%) |
| 65 to 74 Years | 0 (0.0%) | 0 (0.0%) |
| 75 Years and over | 19 (38.8%) | 2 (8.0%) |
Disability Class: Self-Care Difficulty
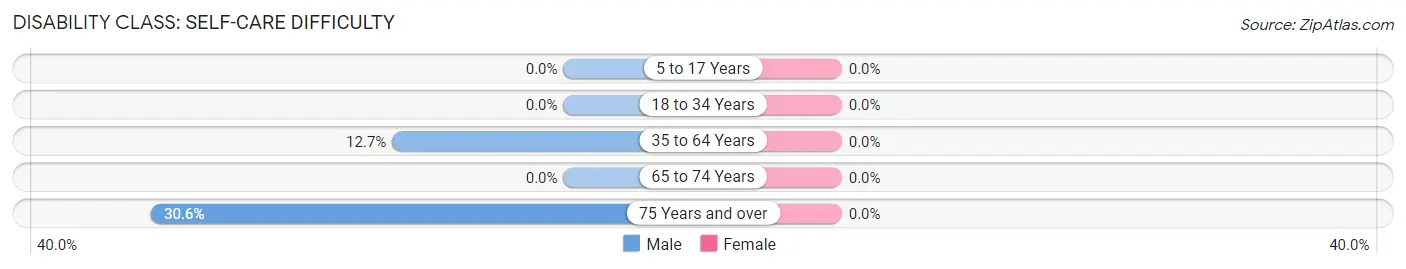
| Age Bracket | Male | Female |
| 5 to 17 Years | 0 (0.0%) | 0 (0.0%) |
| 18 to 34 Years | 0 (0.0%) | 0 (0.0%) |
| 35 to 64 Years | 15 (12.7%) | 0 (0.0%) |
| 65 to 74 Years | 0 (0.0%) | 0 (0.0%) |
| 75 Years and over | 15 (30.6%) | 0 (0.0%) |
Technology Access in Long Lake
Computing Device Access in Long Lake
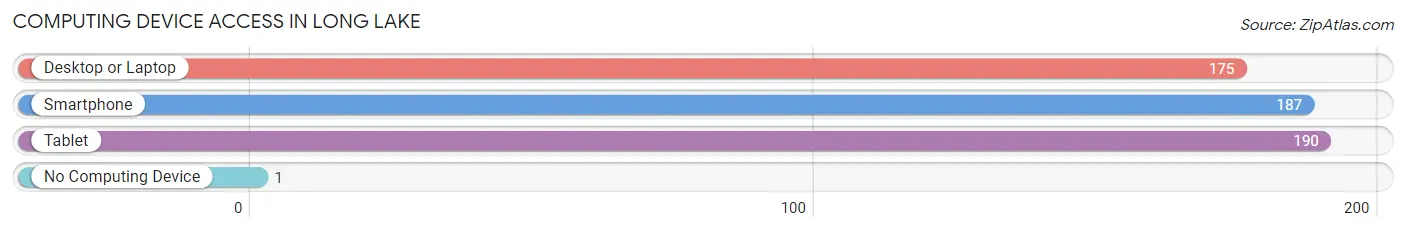
| Device Type | # Households | % Households |
| Desktop or Laptop | 175 | 77.8% |
| Smartphone | 187 | 83.1% |
| Tablet | 190 | 84.4% |
| No Computing Device | 1 | 0.4% |
| Total | 225 | 100.0% |
Internet Access in Long Lake
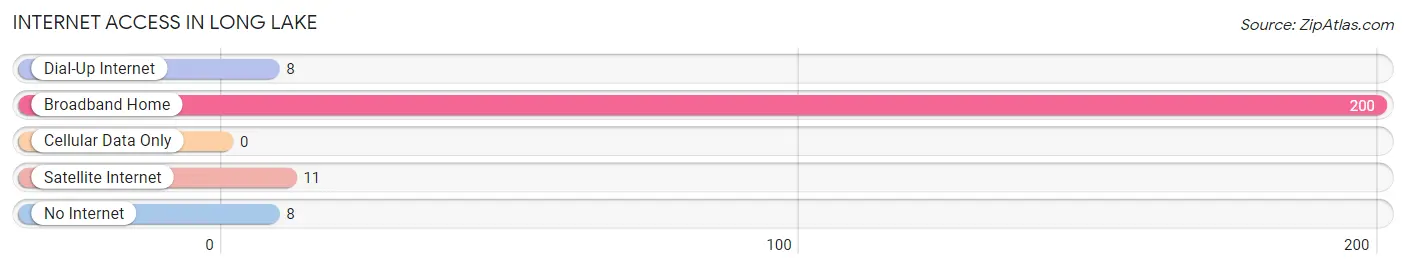
| Internet Type | # Households | % Households |
| Dial-Up Internet | 8 | 3.6% |
| Broadband Home | 200 | 88.9% |
| Cellular Data Only | 0 | 0.0% |
| Satellite Internet | 11 | 4.9% |
| No Internet | 8 | 3.6% |
| Total | 225 | 100.0% |
Long Lake Summary
Long Lake is a town located in Hamilton County, New York, United States. The population was 1,972 at the 2010 census. The town is in the Adirondack Park and is named after the lake of the same name.
History
Long Lake was first settled in 1837 by a group of settlers from Vermont. The town was formed in 1845 from parts of the towns of Arietta and Morehouse. The town was named after the lake of the same name.
The first post office in Long Lake was established in 1845. The first school was built in 1848. The first church was built in 1851.
The Long Lake Railroad was built in 1892 and ran from North Creek to Long Lake. The railroad was used to transport lumber and other goods to and from the area. The railroad was abandoned in the 1950s.
Geography
Long Lake is located in the Adirondack Park in the northern part of Hamilton County. The town is bordered by the towns of Arietta to the north, Morehouse to the east, Indian Lake to the south, and Lake Pleasant to the west.
The town is located on the western shore of Long Lake, a large lake that is approximately 8 miles long and 1 mile wide. The lake is fed by several small streams and is the source of the Raquette River.
The highest point in the town is an unnamed peak in the Adirondack Mountains, with an elevation of 2,890 feet (881 m).
Economy
The economy of Long Lake is largely based on tourism. The town is a popular destination for outdoor recreation, including fishing, hunting, camping, hiking, and boating.
The town is also home to several small businesses, including restaurants, lodging, and retail stores.
Demographics
As of the census of 2010, there were 1,972 people, 845 households, and 545 families residing in the town. The population density was 24.2 people per square mile (9.3/km2). There were 1,541 housing units at an average density of 19.2 per square mile (7.4/km2). The racial makeup of the town was 97.2% White, 0.3% African American, 0.3% Native American, 0.3% Asian, 0.1% Pacific Islander, 0.3% from other races, and 1.5% from two or more races. Hispanic or Latino of any race were 1.2% of the population.
There were 845 households, out of which 24.2% had children under the age of 18 living with them, 51.2% were married couples living together, 8.7% had a female householder with no husband present, and 35.7% were non-families. 29.7% of all households were made up of individuals, and 11.7% had someone living alone who was 65 years of age or older. The average household size was 2.33 and the average family size was 2.86.
In the town, the population was spread out, with 21.2% under the age of 18, 6.2% from 18 to 24, 24.2% from 25 to 44, 30.2% from 45 to 64, and 18.2% who were 65 years of age or older. The median age was 44 years. For every 100 females, there were 97.2 males. For every 100 females age 18 and over, there were 95.2 males.
The median income for a household in the town was $37,500, and the median income for a family was $45,000. Males had a median income of $30,000 versus $25,000 for females. The per capita income for the town was $20,945. About 8.2% of families and 11.2% of the population were below the poverty line, including 16.2% of those under age 18 and 8.2% of those age 65 or over.
Common Questions
What is Per Capita Income in Long Lake?
Per Capita income in Long Lake is $40,760.
What is the Median Family Income in Long Lake?
Median Family Income in Long Lake is $85,625.
What is the Median Household income in Long Lake?
Median Household Income in Long Lake is $67,917.
What is Income or Wage Gap in Long Lake?
Income or Wage Gap in Long Lake is 47.1%.
Women in Long Lake earn 52.9 cents for every dollar earned by a man.
What is Inequality or Gini Index in Long Lake?
Inequality or Gini Index in Long Lake is 0.45.
What is the Total Population of Long Lake?
Total Population of Long Lake is 666.
What is the Total Male Population of Long Lake?
Total Male Population of Long Lake is 330.
What is the Total Female Population of Long Lake?
Total Female Population of Long Lake is 336.
What is the Ratio of Males per 100 Females in Long Lake?
There are 98.21 Males per 100 Females in Long Lake.
What is the Ratio of Females per 100 Males in Long Lake?
There are 101.82 Females per 100 Males in Long Lake.
What is the Median Population Age in Long Lake?
Median Population Age in Long Lake is 59.3 Years.
What is the Average Family Size in Long Lake
Average Family Size in Long Lake is 3.5 People.
What is the Average Household Size in Long Lake
Average Household Size in Long Lake is 2.8 People.
How Large is the Labor Force in Long Lake?
There are 315 People in the Labor Forcein in Long Lake.
What is the Percentage of People in the Labor Force in Long Lake?
53.0% of People are in the Labor Force in Long Lake.
What is the Unemployment Rate in Long Lake?
Unemployment Rate in Long Lake is 15.2%.