Baxter Estates, NY Map & Demographics
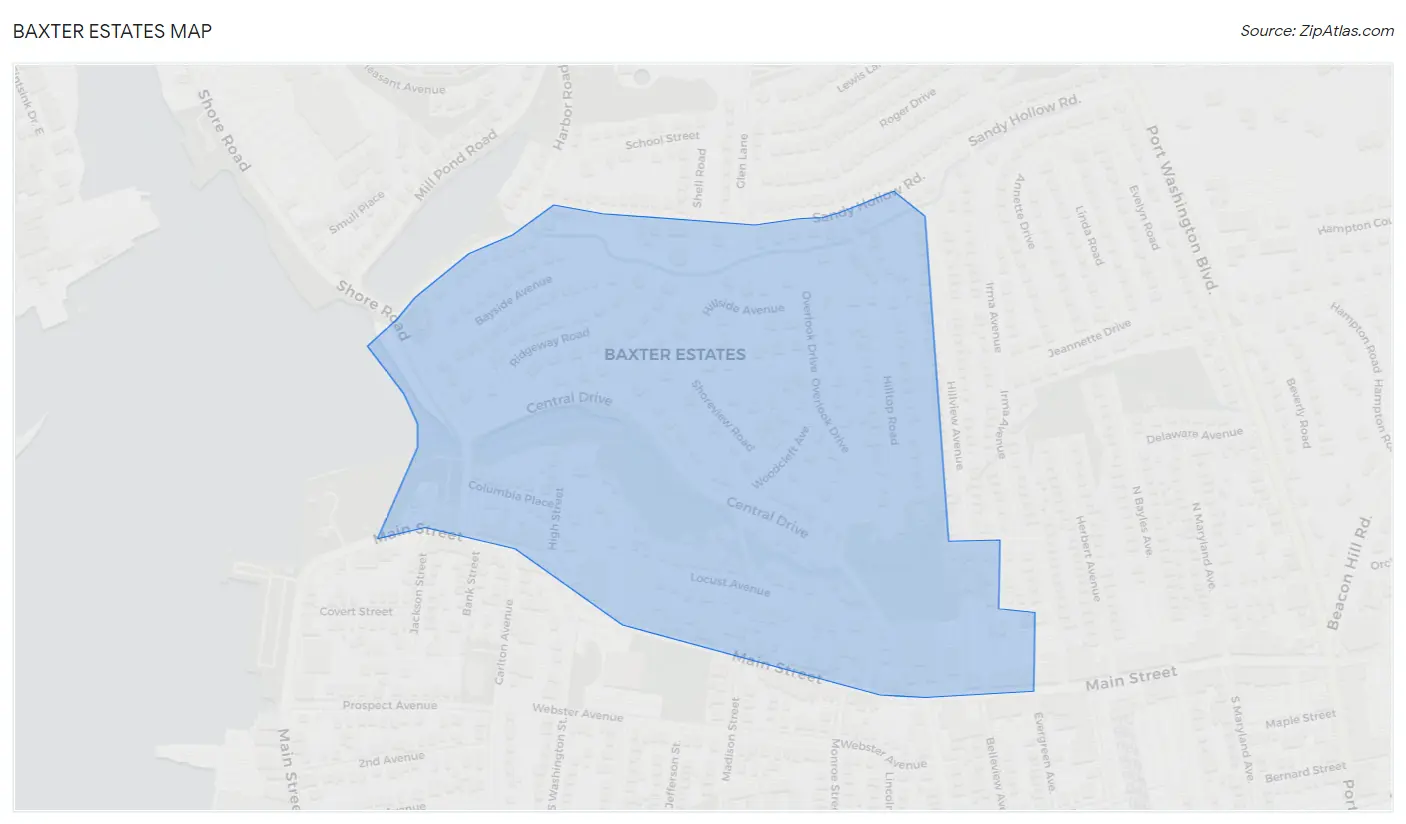
Baxter Estates Map
Baxter Estates Overview
$91,789
PER CAPITA INCOME
$216,667
AVG FAMILY INCOME
$172,292
AVG HOUSEHOLD INCOME
7.6%
WAGE / INCOME GAP [ % ]
92.4¢/ $1
WAGE / INCOME GAP [ $ ]
0.46
INEQUALITY / GINI INDEX
1,148
TOTAL POPULATION
622
MALE POPULATION
526
FEMALE POPULATION
118.25
MALES / 100 FEMALES
84.57
FEMALES / 100 MALES
41.0
MEDIAN AGE
3.1
AVG FAMILY SIZE
2.6
AVG HOUSEHOLD SIZE
614
LABOR FORCE [ PEOPLE ]
68.9%
PERCENT IN LABOR FORCE
2.8%
UNEMPLOYMENT RATE
Income in Baxter Estates
Income Overview in Baxter Estates
Per Capita Income in Baxter Estates is $91,789, while median incomes of families and households are $216,667 and $172,292 respectively.
| Characteristic | Number | Measure |
| Per Capita Income | 1,148 | $91,789 |
| Median Family Income | 324 | $216,667 |
| Mean Family Income | 324 | $277,689 |
| Median Household Income | 445 | $172,292 |
| Mean Household Income | 445 | $233,085 |
| Income Deficit | 324 | $0 |
| Wage / Income Gap (%) | 1,148 | 7.64% |
| Wage / Income Gap ($) | 1,148 | 92.36¢ per $1 |
| Gini / Inequality Index | 1,148 | 0.46 |
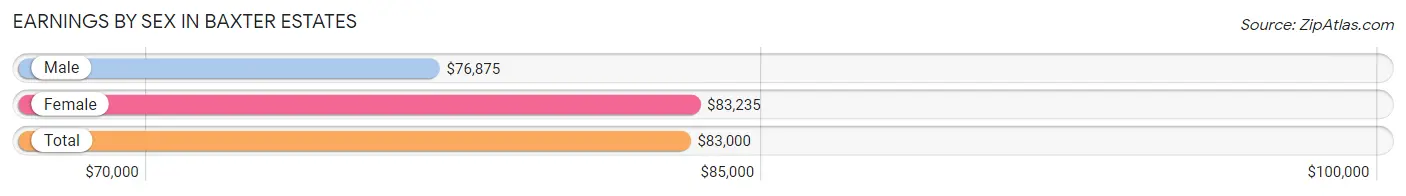
Earnings by Sex in Baxter Estates
Average Earnings in Baxter Estates are $83,000, $76,875 for men and $83,235 for women, a difference of 7.6%.
| Sex | Number | Average Earnings |
| Male | 350 (55.2%) | $76,875 |
| Female | 284 (44.8%) | $83,235 |
| Total | 634 (100.0%) | $83,000 |
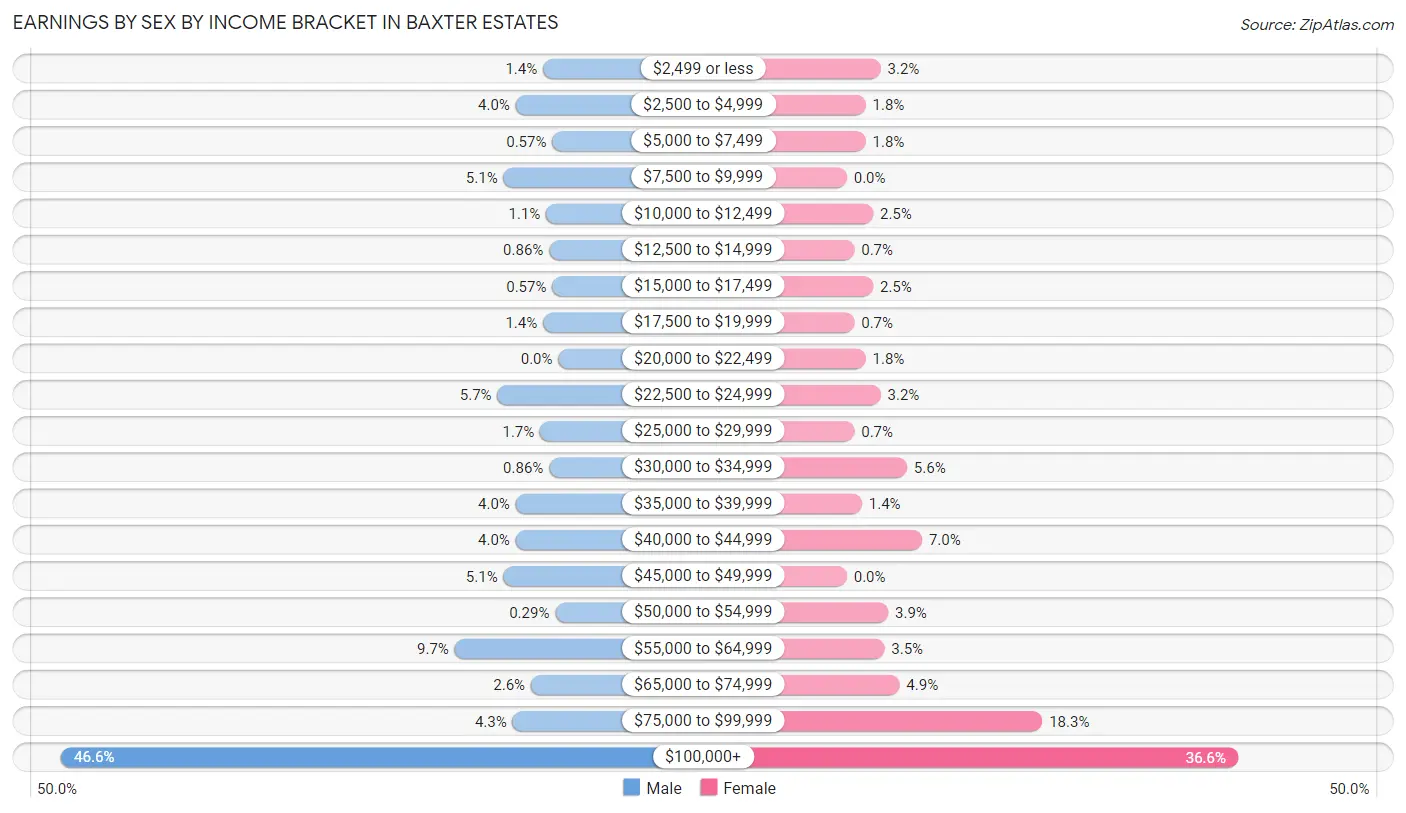
Earnings by Sex by Income Bracket in Baxter Estates
The most common earnings brackets in Baxter Estates are $100,000+ for men (163 | 46.6%) and $100,000+ for women (104 | 36.6%).
| Income | Male | Female |
| $2,499 or less | 5 (1.4%) | 9 (3.2%) |
| $2,500 to $4,999 | 14 (4.0%) | 5 (1.8%) |
| $5,000 to $7,499 | 2 (0.6%) | 5 (1.8%) |
| $7,500 to $9,999 | 18 (5.1%) | 0 (0.0%) |
| $10,000 to $12,499 | 4 (1.1%) | 7 (2.5%) |
| $12,500 to $14,999 | 3 (0.9%) | 2 (0.7%) |
| $15,000 to $17,499 | 2 (0.6%) | 7 (2.5%) |
| $17,500 to $19,999 | 5 (1.4%) | 2 (0.7%) |
| $20,000 to $22,499 | 0 (0.0%) | 5 (1.8%) |
| $22,500 to $24,999 | 20 (5.7%) | 9 (3.2%) |
| $25,000 to $29,999 | 6 (1.7%) | 2 (0.7%) |
| $30,000 to $34,999 | 3 (0.9%) | 16 (5.6%) |
| $35,000 to $39,999 | 14 (4.0%) | 4 (1.4%) |
| $40,000 to $44,999 | 14 (4.0%) | 20 (7.0%) |
| $45,000 to $49,999 | 18 (5.1%) | 0 (0.0%) |
| $50,000 to $54,999 | 1 (0.3%) | 11 (3.9%) |
| $55,000 to $64,999 | 34 (9.7%) | 10 (3.5%) |
| $65,000 to $74,999 | 9 (2.6%) | 14 (4.9%) |
| $75,000 to $99,999 | 15 (4.3%) | 52 (18.3%) |
| $100,000+ | 163 (46.6%) | 104 (36.6%) |
| Total | 350 (100.0%) | 284 (100.0%) |
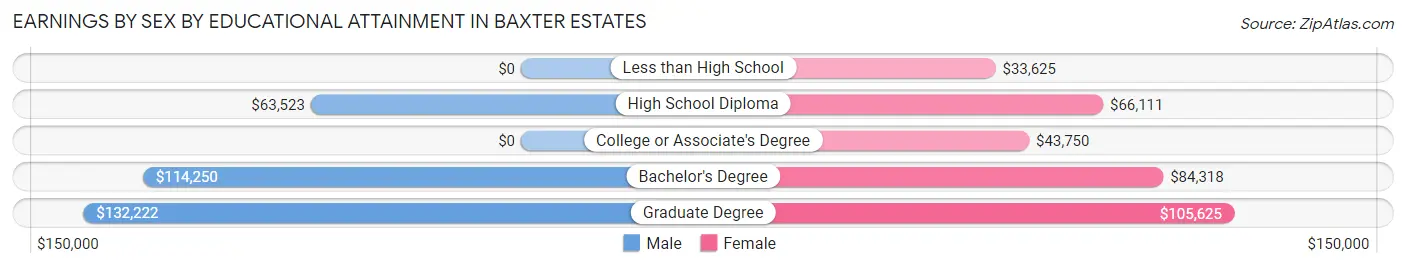
Earnings by Sex by Educational Attainment in Baxter Estates
Average earnings in Baxter Estates are $109,375 for men and $83,529 for women, a difference of 23.6%. Men with an educational attainment of graduate degree enjoy the highest average annual earnings of $132,222, while those with high school diploma education earn the least with $63,523. Women with an educational attainment of graduate degree earn the most with the average annual earnings of $105,625, while those with less than high school education have the smallest earnings of $33,625.
| Educational Attainment | Male Income | Female Income |
| Less than High School | - | - |
| High School Diploma | $63,523 | $66,111 |
| College or Associate's Degree | - | - |
| Bachelor's Degree | $114,250 | $84,318 |
| Graduate Degree | $132,222 | $105,625 |
| Total | $109,375 | $83,529 |
Family Income in Baxter Estates
Family Income Brackets in Baxter Estates
According to the Baxter Estates family income data, there are 177 families falling into the $200,000+ income range, which is the most common income bracket and makes up 54.6% of all families.
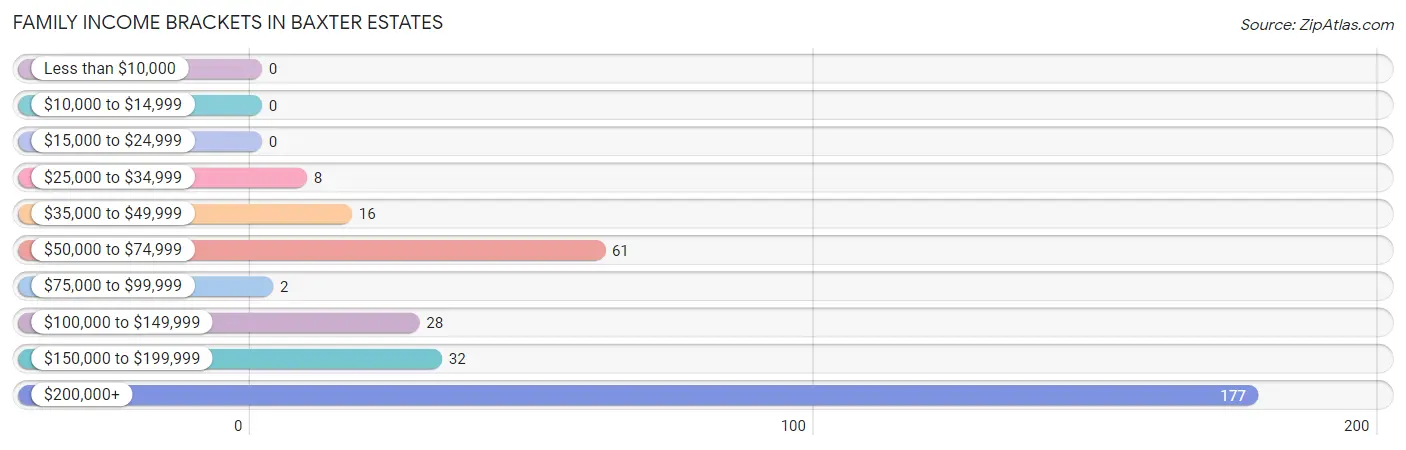
| Income Bracket | # Families | % Families |
| Less than $10,000 | 0 | 0.0% |
| $10,000 to $14,999 | 0 | 0.0% |
| $15,000 to $24,999 | 0 | 0.0% |
| $25,000 to $34,999 | 8 | 2.5% |
| $35,000 to $49,999 | 16 | 4.9% |
| $50,000 to $74,999 | 61 | 18.8% |
| $75,000 to $99,999 | 2 | 0.6% |
| $100,000 to $149,999 | 28 | 8.6% |
| $150,000 to $199,999 | 32 | 9.9% |
| $200,000+ | 177 | 54.6% |
Family Income by Famaliy Size in Baxter Estates
3-person families (49 | 15.1%) account for the highest median family income in Baxter Estates with $250,001 per family, while 3-person families (49 | 15.1%) have the highest median income of $83,334 per family member.
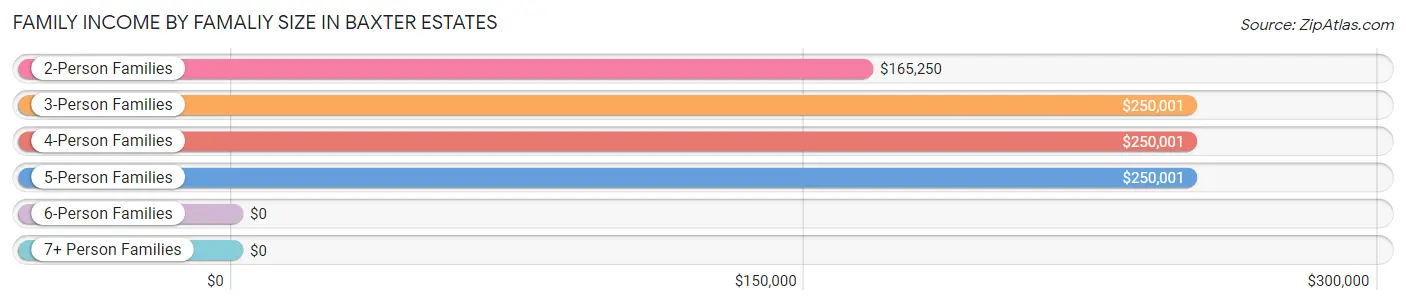
| Income Bracket | # Families | Median Income |
| 2-Person Families | 141 (43.5%) | $165,250 |
| 3-Person Families | 49 (15.1%) | $250,001 |
| 4-Person Families | 108 (33.3%) | $250,001 |
| 5-Person Families | 21 (6.5%) | $250,001 |
| 6-Person Families | 5 (1.5%) | $0 |
| 7+ Person Families | 0 (0.0%) | $0 |
| Total | 324 (100.0%) | $216,667 |
Family Income by Number of Earners in Baxter Estates
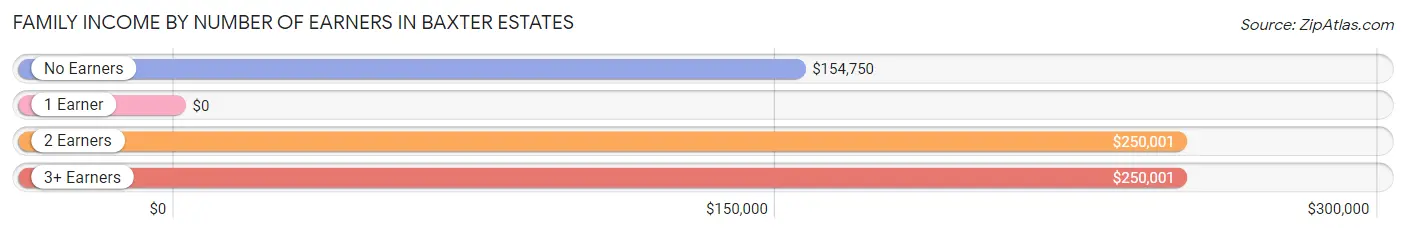
| Number of Earners | # Families | Median Income |
| No Earners | 35 (10.8%) | $154,750 |
| 1 Earner | 87 (26.9%) | $0 |
| 2 Earners | 179 (55.2%) | $250,001 |
| 3+ Earners | 23 (7.1%) | $250,001 |
| Total | 324 (100.0%) | $216,667 |
Household Income in Baxter Estates
Household Income Brackets in Baxter Estates
With 187 households falling in the category, the $200,000+ income range is the most frequent in Baxter Estates, accounting for 42.0% of all households.
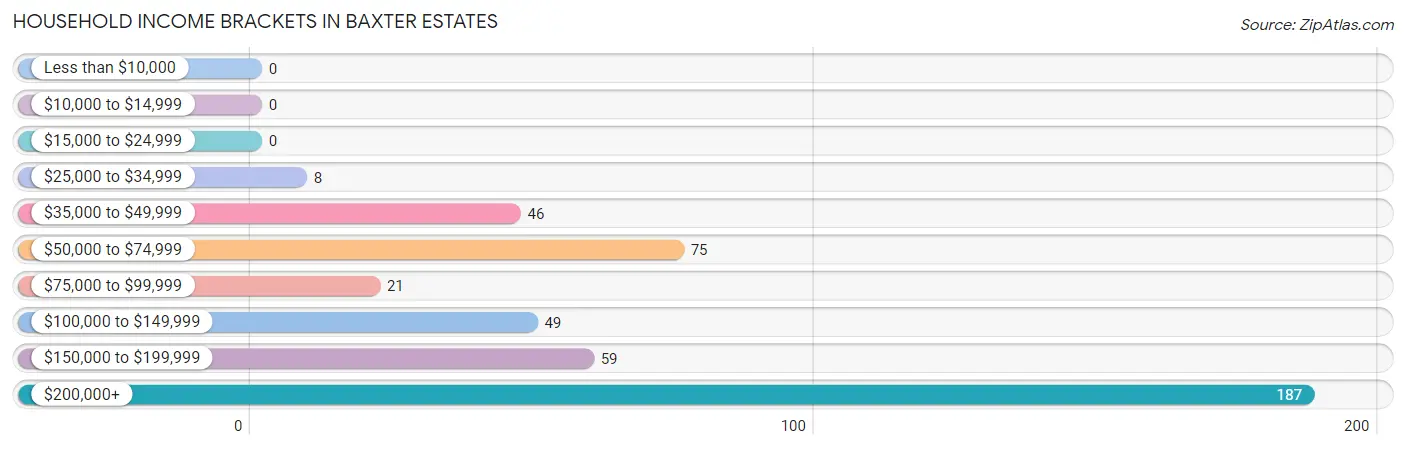
| Income Bracket | # Households | % Households |
| Less than $10,000 | 0 | 0.0% |
| $10,000 to $14,999 | 0 | 0.0% |
| $15,000 to $24,999 | 0 | 0.0% |
| $25,000 to $34,999 | 8 | 1.8% |
| $35,000 to $49,999 | 46 | 10.3% |
| $50,000 to $74,999 | 75 | 16.9% |
| $75,000 to $99,999 | 21 | 4.7% |
| $100,000 to $149,999 | 49 | 11.0% |
| $150,000 to $199,999 | 59 | 13.3% |
| $200,000+ | 187 | 42.0% |
Household Income by Householder Age in Baxter Estates
The median household income in Baxter Estates is $172,292, with the highest median household income of $231,250 found in the 25 to 44 years age bracket for the primary householder. A total of 116 households (26.1%) fall into this category.
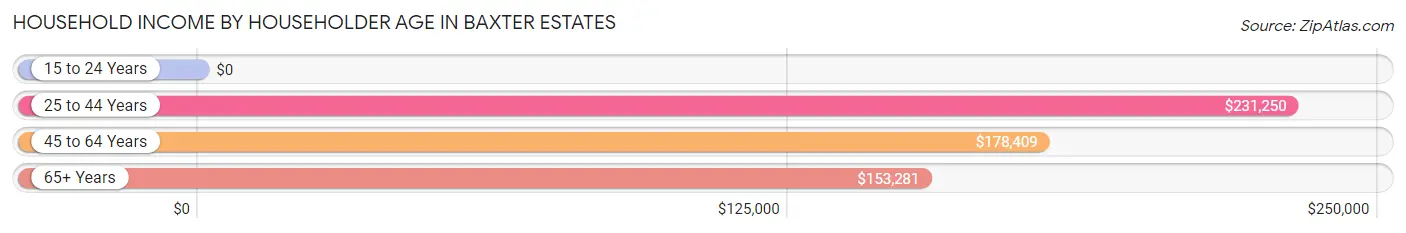
| Income Bracket | # Households | Median Income |
| 15 to 24 Years | 0 (0.0%) | $0 |
| 25 to 44 Years | 116 (26.1%) | $231,250 |
| 45 to 64 Years | 188 (42.2%) | $178,409 |
| 65+ Years | 141 (31.7%) | $153,281 |
| Total | 445 (100.0%) | $172,292 |
Poverty in Baxter Estates
Income Below Poverty by Sex and Age in Baxter Estates
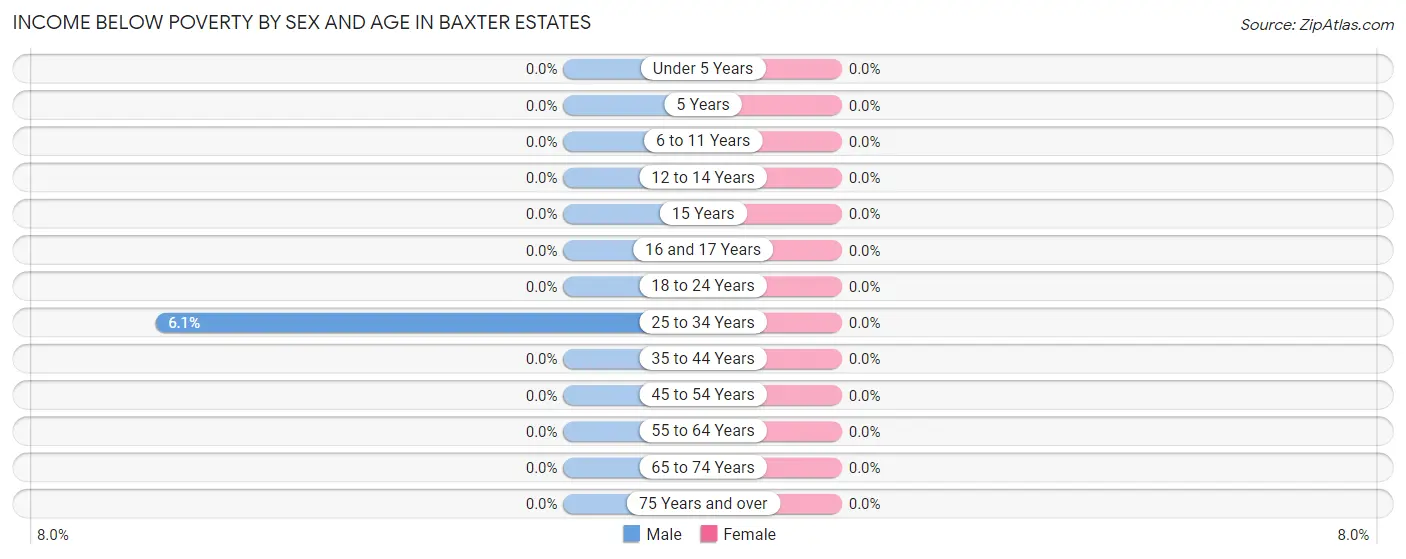
| Age Bracket | Male | Female |
| Under 5 Years | 0 (0.0%) | 0 (0.0%) |
| 5 Years | 0 (0.0%) | 0 (0.0%) |
| 6 to 11 Years | 0 (0.0%) | 0 (0.0%) |
| 12 to 14 Years | 0 (0.0%) | 0 (0.0%) |
| 15 Years | 0 (0.0%) | 0 (0.0%) |
| 16 and 17 Years | 0 (0.0%) | 0 (0.0%) |
| 18 to 24 Years | 0 (0.0%) | 0 (0.0%) |
| 25 to 34 Years | 2 (6.1%) | 0 (0.0%) |
| 35 to 44 Years | 0 (0.0%) | 0 (0.0%) |
| 45 to 54 Years | 0 (0.0%) | 0 (0.0%) |
| 55 to 64 Years | 0 (0.0%) | 0 (0.0%) |
| 65 to 74 Years | 0 (0.0%) | 0 (0.0%) |
| 75 Years and over | 0 (0.0%) | 0 (0.0%) |
| Total | 2 (0.3%) | 0 (0.0%) |
Income Above Poverty by Sex and Age in Baxter Estates
According to the poverty statistics in Baxter Estates, males aged under 5 years and females aged under 5 years are the age groups that are most secure financially, with 100.0% of males and 100.0% of females in these age groups living above the poverty line.
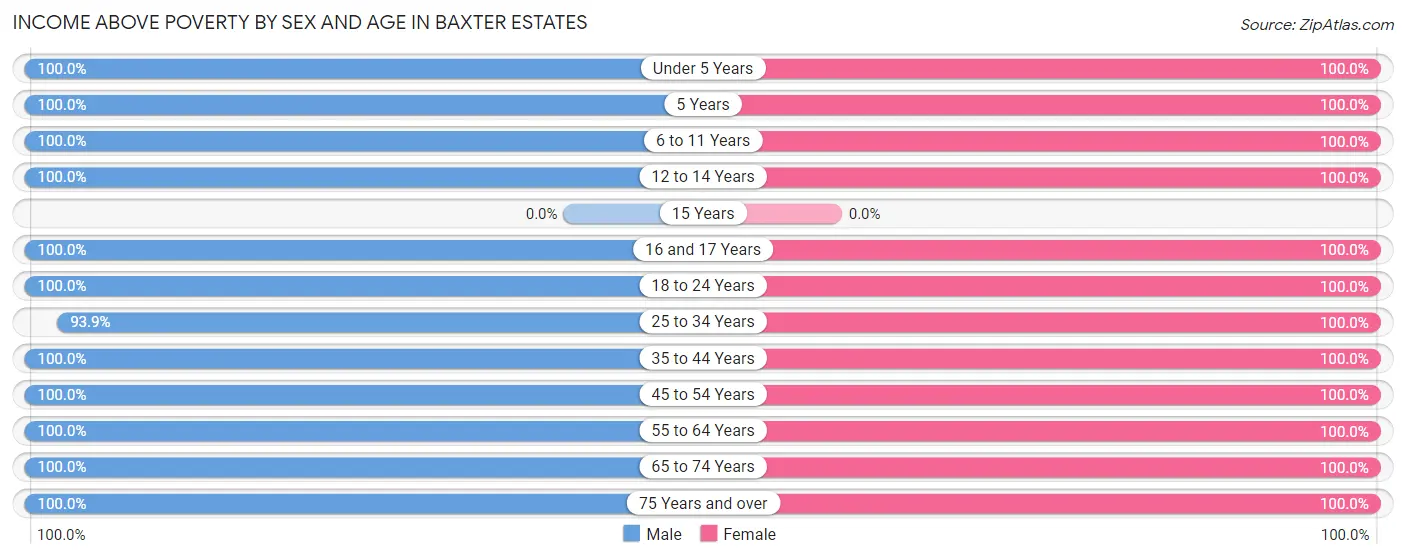
| Age Bracket | Male | Female |
| Under 5 Years | 64 (100.0%) | 53 (100.0%) |
| 5 Years | 4 (100.0%) | 8 (100.0%) |
| 6 to 11 Years | 44 (100.0%) | 43 (100.0%) |
| 12 to 14 Years | 29 (100.0%) | 12 (100.0%) |
| 15 Years | 0 (0.0%) | 0 (0.0%) |
| 16 and 17 Years | 19 (100.0%) | 4 (100.0%) |
| 18 to 24 Years | 69 (100.0%) | 15 (100.0%) |
| 25 to 34 Years | 31 (93.9%) | 19 (100.0%) |
| 35 to 44 Years | 117 (100.0%) | 118 (100.0%) |
| 45 to 54 Years | 76 (100.0%) | 62 (100.0%) |
| 55 to 64 Years | 65 (100.0%) | 77 (100.0%) |
| 65 to 74 Years | 51 (100.0%) | 50 (100.0%) |
| 75 Years and over | 51 (100.0%) | 65 (100.0%) |
| Total | 620 (99.7%) | 526 (100.0%) |
Income Below Poverty Among Married-Couple Families in Baxter Estates
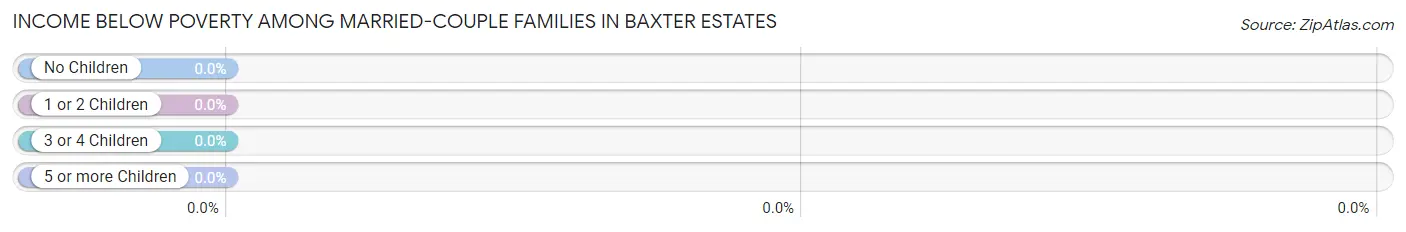
| Children | Above Poverty | Below Poverty |
| No Children | 160 (100.0%) | 0 (0.0%) |
| 1 or 2 Children | 115 (100.0%) | 0 (0.0%) |
| 3 or 4 Children | 15 (100.0%) | 0 (0.0%) |
| 5 or more Children | 0 (0.0%) | 0 (0.0%) |
| Total | 290 (100.0%) | 0 (0.0%) |
Income Below Poverty Among Single-Parent Households in Baxter Estates
| Children | Single Father | Single Mother |
| No Children | 0 (0.0%) | 0 (0.0%) |
| 1 or 2 Children | 0 (0.0%) | 0 (0.0%) |
| 3 or 4 Children | 0 (0.0%) | 0 (0.0%) |
| 5 or more Children | 0 (0.0%) | 0 (0.0%) |
| Total | 0 (0.0%) | 0 (0.0%) |
Income Below Poverty Among Married-Couple vs Single-Parent Households in Baxter Estates
| Children | Married-Couple Families | Single-Parent Households |
| No Children | 0 (0.0%) | 0 (0.0%) |
| 1 or 2 Children | 0 (0.0%) | 0 (0.0%) |
| 3 or 4 Children | 0 (0.0%) | 0 (0.0%) |
| 5 or more Children | 0 (0.0%) | 0 (0.0%) |
| Total | 0 (0.0%) | 0 (0.0%) |
Race in Baxter Estates
The most populous races in Baxter Estates are White / Caucasian (814 | 70.9%), Hispanic or Latino (240 | 20.9%), and Asian (126 | 11.0%).
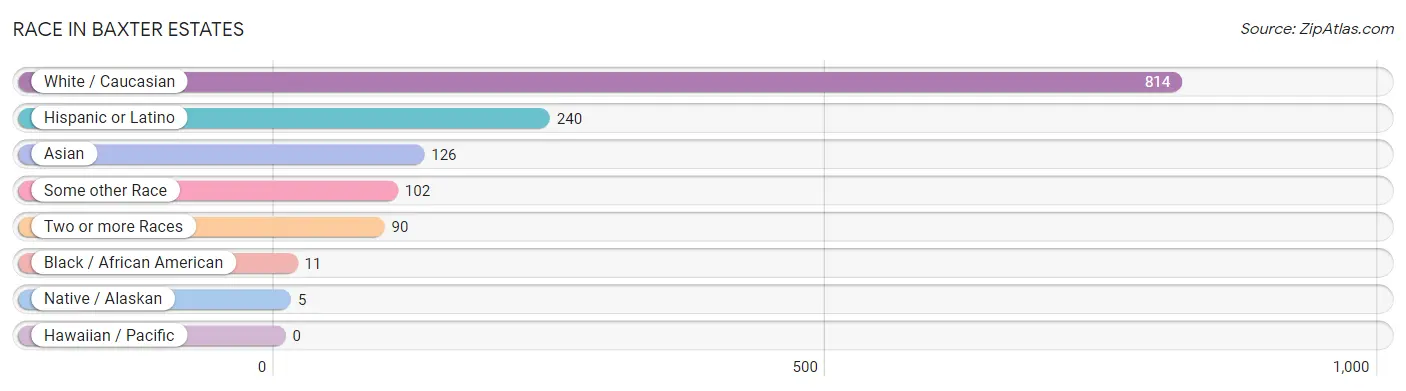
| Race | # Population | % Population |
| Asian | 126 | 11.0% |
| Black / African American | 11 | 1.0% |
| Hawaiian / Pacific | 0 | 0.0% |
| Hispanic or Latino | 240 | 20.9% |
| Native / Alaskan | 5 | 0.4% |
| White / Caucasian | 814 | 70.9% |
| Two or more Races | 90 | 7.8% |
| Some other Race | 102 | 8.9% |
| Total | 1,148 | 100.0% |
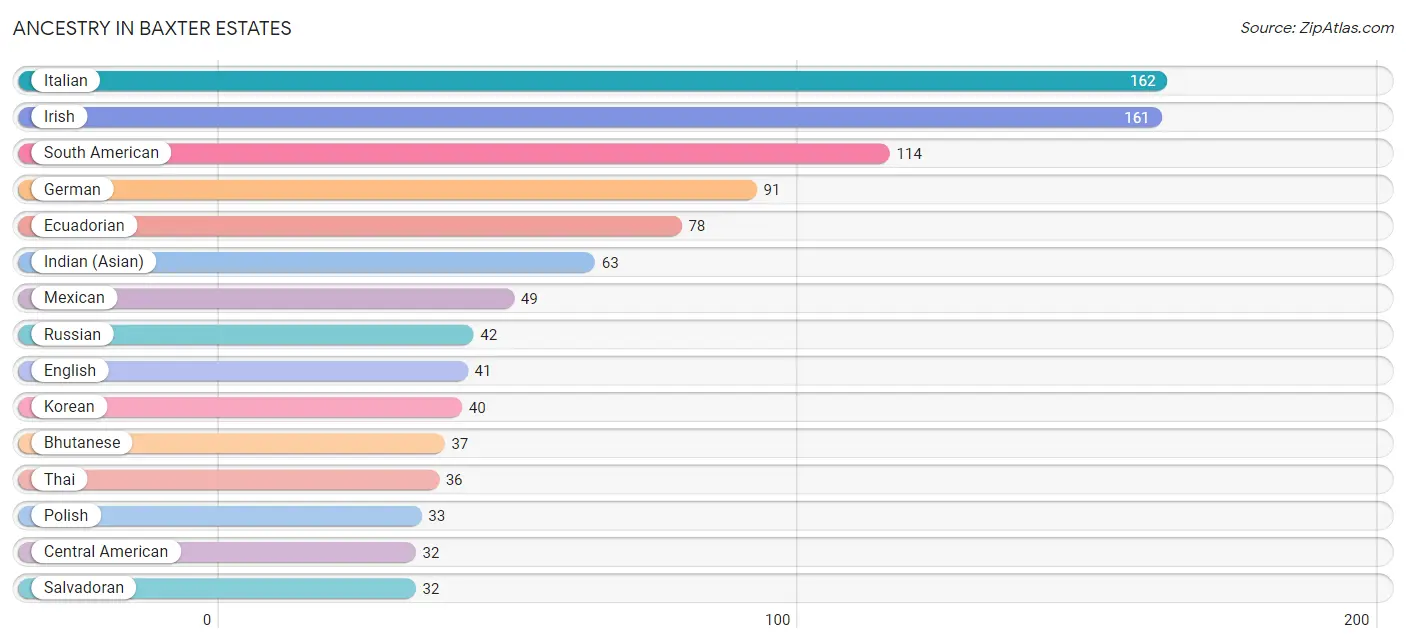
Ancestry in Baxter Estates
The most populous ancestries reported in Baxter Estates are Italian (162 | 14.1%), Irish (161 | 14.0%), South American (114 | 9.9%), German (91 | 7.9%), and Ecuadorian (78 | 6.8%), together accounting for 52.8% of all Baxter Estates residents.
| Ancestry | # Population | % Population |
| American | 30 | 2.6% |
| Austrian | 7 | 0.6% |
| Bhutanese | 37 | 3.2% |
| British | 6 | 0.5% |
| Burmese | 19 | 1.7% |
| Canadian | 2 | 0.2% |
| Central American | 32 | 2.8% |
| Chilean | 20 | 1.7% |
| Colombian | 16 | 1.4% |
| Cuban | 8 | 0.7% |
| Czech | 11 | 1.0% |
| Danish | 3 | 0.3% |
| Eastern European | 23 | 2.0% |
| Ecuadorian | 78 | 6.8% |
| English | 41 | 3.6% |
| Estonian | 6 | 0.5% |
| European | 31 | 2.7% |
| Finnish | 3 | 0.3% |
| French | 3 | 0.3% |
| French Canadian | 4 | 0.4% |
| German | 91 | 7.9% |
| Greek | 16 | 1.4% |
| Haitian | 1 | 0.1% |
| Hungarian | 7 | 0.6% |
| Indian (Asian) | 63 | 5.5% |
| Iranian | 9 | 0.8% |
| Irish | 161 | 14.0% |
| Italian | 162 | 14.1% |
| Korean | 40 | 3.5% |
| Lithuanian | 4 | 0.4% |
| Mexican | 49 | 4.3% |
| Norwegian | 13 | 1.1% |
| Polish | 33 | 2.9% |
| Portuguese | 18 | 1.6% |
| Puerto Rican | 8 | 0.7% |
| Romanian | 5 | 0.4% |
| Russian | 42 | 3.7% |
| Salvadoran | 32 | 2.8% |
| Scotch-Irish | 7 | 0.6% |
| Scottish | 5 | 0.4% |
| South American | 114 | 9.9% |
| Spaniard | 14 | 1.2% |
| Spanish | 15 | 1.3% |
| Swedish | 21 | 1.8% |
| Swiss | 6 | 0.5% |
| Thai | 36 | 3.1% |
| Turkish | 7 | 0.6% |
| Ukrainian | 4 | 0.4% |
| West Indian | 10 | 0.9% | View All 49 Rows |
Immigrants in Baxter Estates
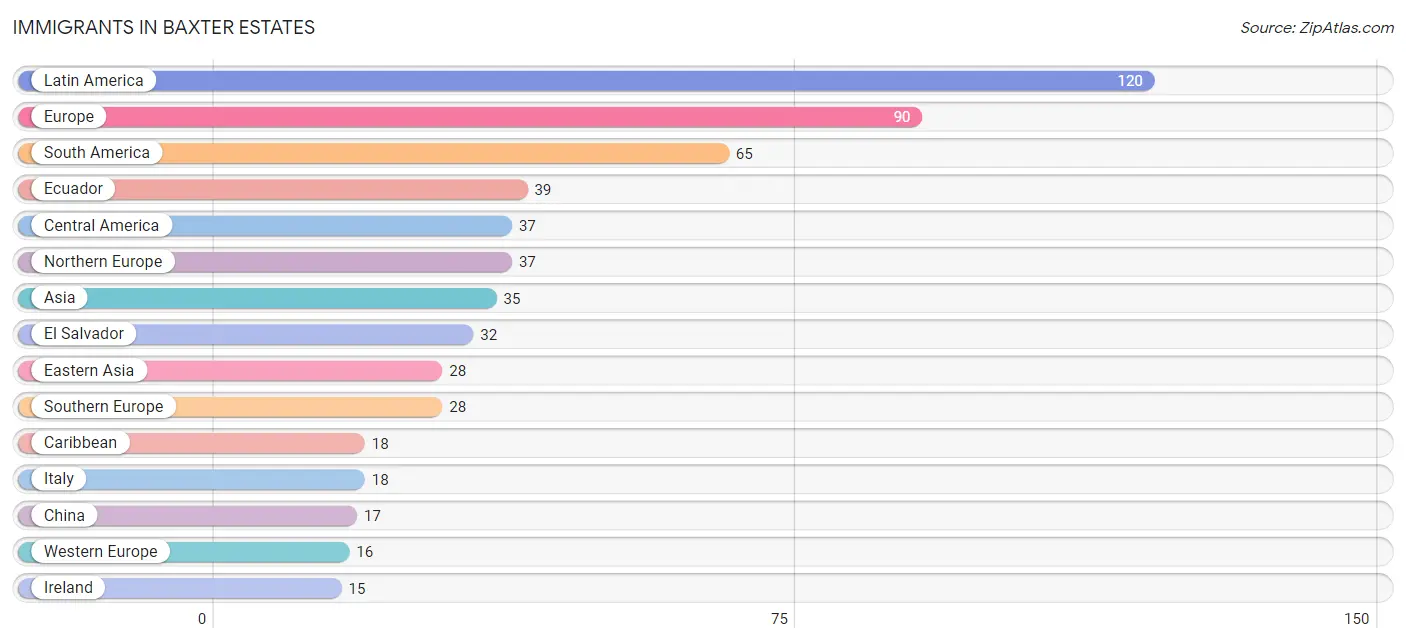
The most numerous immigrant groups reported in Baxter Estates came from Latin America (120 | 10.4%), Europe (90 | 7.8%), South America (65 | 5.7%), Ecuador (39 | 3.4%), and Central America (37 | 3.2%), together accounting for 30.6% of all Baxter Estates residents.
| Immigration Origin | # Population | % Population |
| Africa | 9 | 0.8% |
| Asia | 35 | 3.0% |
| Brazil | 2 | 0.2% |
| Caribbean | 18 | 1.6% |
| Central America | 37 | 3.2% |
| Chile | 9 | 0.8% |
| China | 17 | 1.5% |
| Colombia | 9 | 0.8% |
| Cuba | 8 | 0.7% |
| Czechoslovakia | 3 | 0.3% |
| Eastern Africa | 7 | 0.6% |
| Eastern Asia | 28 | 2.4% |
| Eastern Europe | 9 | 0.8% |
| Ecuador | 39 | 3.4% |
| El Salvador | 32 | 2.8% |
| England | 5 | 0.4% |
| Europe | 90 | 7.8% |
| France | 2 | 0.2% |
| Germany | 11 | 1.0% |
| India | 2 | 0.2% |
| Ireland | 15 | 1.3% |
| Italy | 18 | 1.6% |
| Japan | 11 | 1.0% |
| Kazakhstan | 2 | 0.2% |
| Latin America | 120 | 10.4% |
| Mexico | 5 | 0.4% |
| Northern Europe | 37 | 3.2% |
| Poland | 4 | 0.4% |
| Portugal | 6 | 0.5% |
| South Africa | 2 | 0.2% |
| South America | 65 | 5.7% |
| South Central Asia | 4 | 0.4% |
| Southern Europe | 28 | 2.4% |
| Spain | 4 | 0.4% |
| Sweden | 10 | 0.9% |
| Switzerland | 3 | 0.3% |
| Trinidad and Tobago | 10 | 0.9% |
| Turkey | 3 | 0.3% |
| Ukraine | 2 | 0.2% |
| Venezuela | 6 | 0.5% |
| Western Asia | 3 | 0.3% |
| Western Europe | 16 | 1.4% | View All 42 Rows |
Sex and Age in Baxter Estates
Sex and Age in Baxter Estates
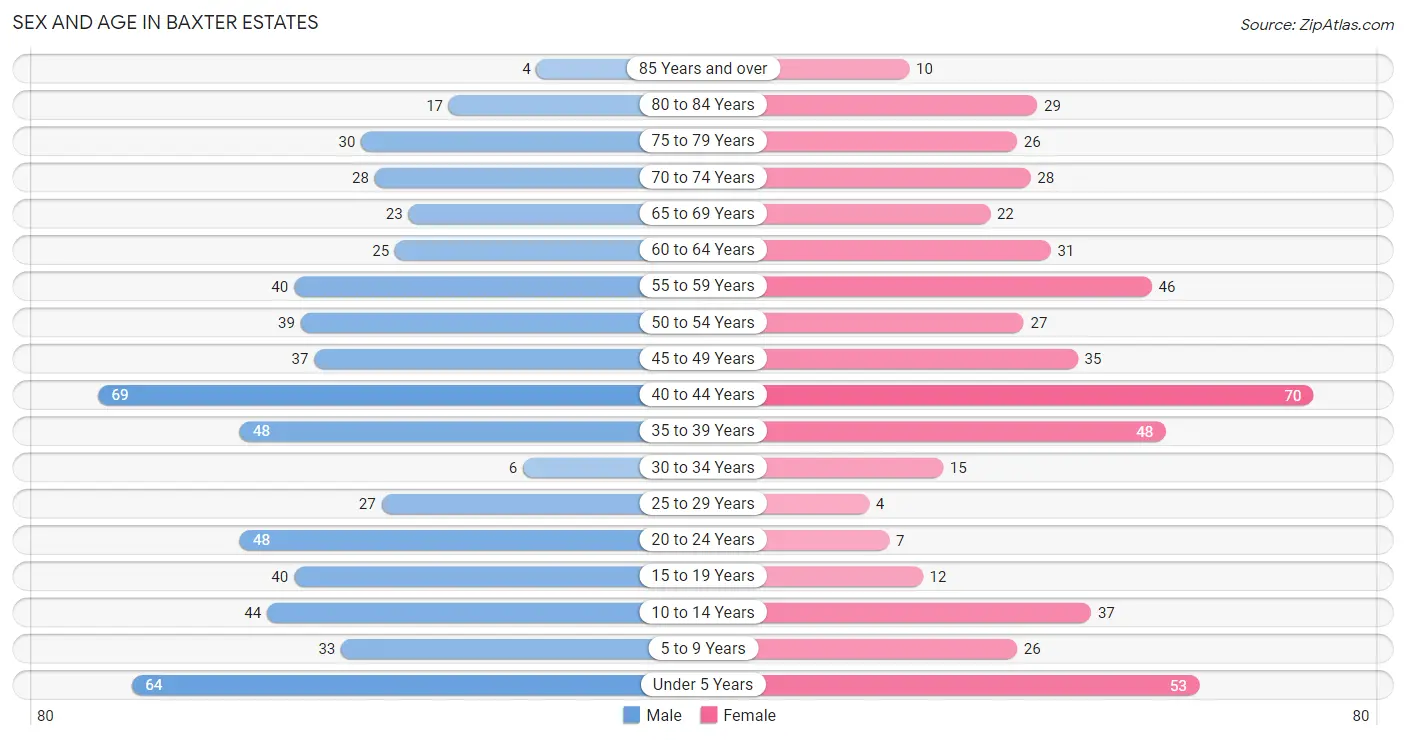
The most populous age groups in Baxter Estates are 40 to 44 Years (69 | 11.1%) for men and 40 to 44 Years (70 | 13.3%) for women.
| Age Bracket | Male | Female |
| Under 5 Years | 64 (10.3%) | 53 (10.1%) |
| 5 to 9 Years | 33 (5.3%) | 26 (4.9%) |
| 10 to 14 Years | 44 (7.1%) | 37 (7.0%) |
| 15 to 19 Years | 40 (6.4%) | 12 (2.3%) |
| 20 to 24 Years | 48 (7.7%) | 7 (1.3%) |
| 25 to 29 Years | 27 (4.3%) | 4 (0.8%) |
| 30 to 34 Years | 6 (1.0%) | 15 (2.9%) |
| 35 to 39 Years | 48 (7.7%) | 48 (9.1%) |
| 40 to 44 Years | 69 (11.1%) | 70 (13.3%) |
| 45 to 49 Years | 37 (5.9%) | 35 (6.7%) |
| 50 to 54 Years | 39 (6.3%) | 27 (5.1%) |
| 55 to 59 Years | 40 (6.4%) | 46 (8.7%) |
| 60 to 64 Years | 25 (4.0%) | 31 (5.9%) |
| 65 to 69 Years | 23 (3.7%) | 22 (4.2%) |
| 70 to 74 Years | 28 (4.5%) | 28 (5.3%) |
| 75 to 79 Years | 30 (4.8%) | 26 (4.9%) |
| 80 to 84 Years | 17 (2.7%) | 29 (5.5%) |
| 85 Years and over | 4 (0.6%) | 10 (1.9%) |
| Total | 622 (100.0%) | 526 (100.0%) |
Families and Households in Baxter Estates
Median Family Size in Baxter Estates
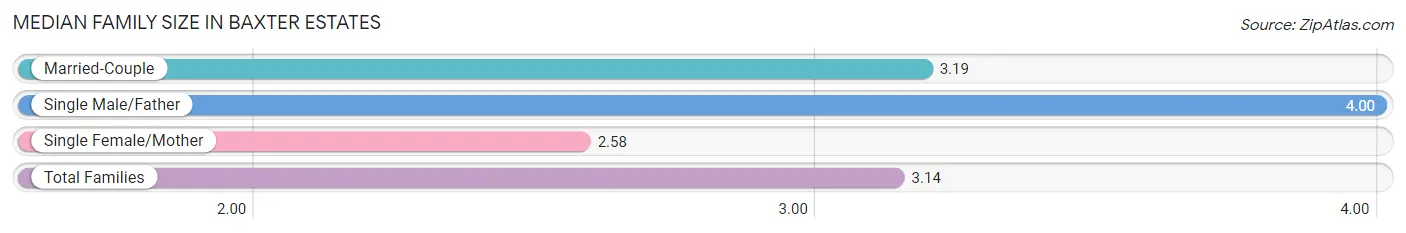
The median family size in Baxter Estates is 3.14 persons per family, with single male/father families (3 | 0.9%) accounting for the largest median family size of 4 persons per family. On the other hand, single female/mother families (31 | 9.6%) represent the smallest median family size with 2.58 persons per family.
| Family Type | # Families | Family Size |
| Married-Couple | 290 (89.5%) | 3.19 |
| Single Male/Father | 3 (0.9%) | 4.00 |
| Single Female/Mother | 31 (9.6%) | 2.58 |
| Total Families | 324 (100.0%) | 3.14 |
Median Household Size in Baxter Estates
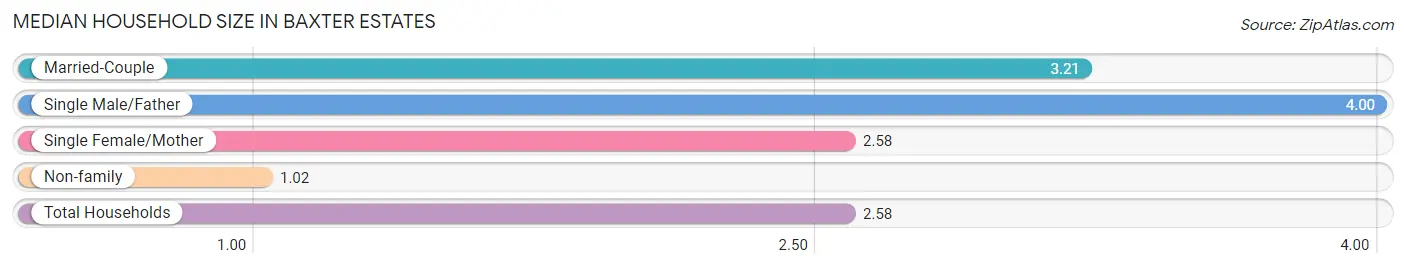
The median household size in Baxter Estates is 2.58 persons per household, with single male/father households (3 | 0.7%) accounting for the largest median household size of 4 persons per household. non-family households (121 | 27.2%) represent the smallest median household size with 1.02 persons per household.
| Household Type | # Households | Household Size |
| Married-Couple | 290 (65.2%) | 3.21 |
| Single Male/Father | 3 (0.7%) | 4.00 |
| Single Female/Mother | 31 (7.0%) | 2.58 |
| Non-family | 121 (27.2%) | 1.02 |
| Total Households | 445 (100.0%) | 2.58 |
Household Size by Marriage Status in Baxter Estates
Out of a total of 445 households in Baxter Estates, 324 (72.8%) are family households, while 121 (27.2%) are nonfamily households. The most numerous type of family households are 2-person households, comprising 139, and the most common type of nonfamily households are 1-person households, comprising 118.
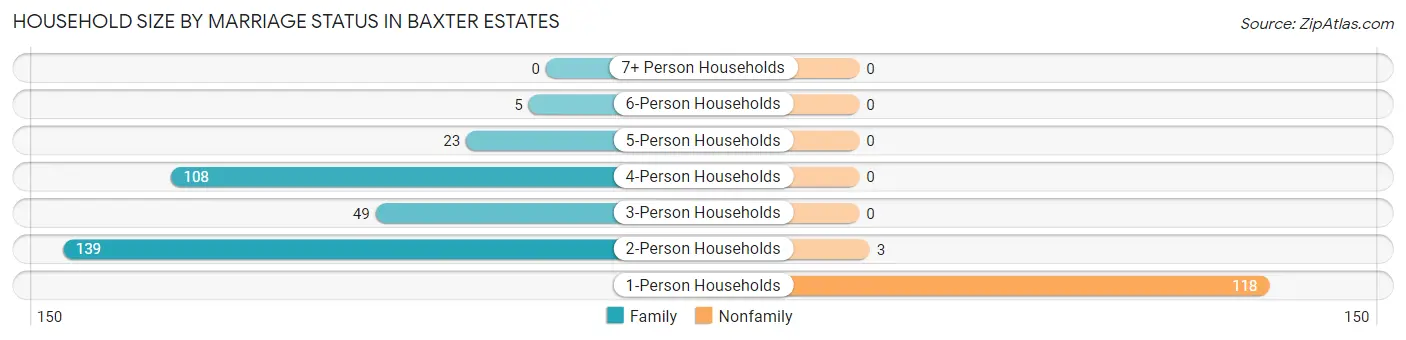
| Household Size | Family Households | Nonfamily Households |
| 1-Person Households | - | 118 (26.5%) |
| 2-Person Households | 139 (31.2%) | 3 (0.7%) |
| 3-Person Households | 49 (11.0%) | 0 (0.0%) |
| 4-Person Households | 108 (24.3%) | 0 (0.0%) |
| 5-Person Households | 23 (5.2%) | 0 (0.0%) |
| 6-Person Households | 5 (1.1%) | 0 (0.0%) |
| 7+ Person Households | 0 (0.0%) | 0 (0.0%) |
| Total | 324 (72.8%) | 121 (27.2%) |
Female Fertility in Baxter Estates
Fertility by Age in Baxter Estates
Average fertility rate in Baxter Estates is 81.0 births per 1,000 women. Women in the age bracket of 20 to 34 years have the highest fertility rate with 154.0 births per 1,000 women. Women in the age bracket of 35 to 50 years acount for 75.0% of all women with births.
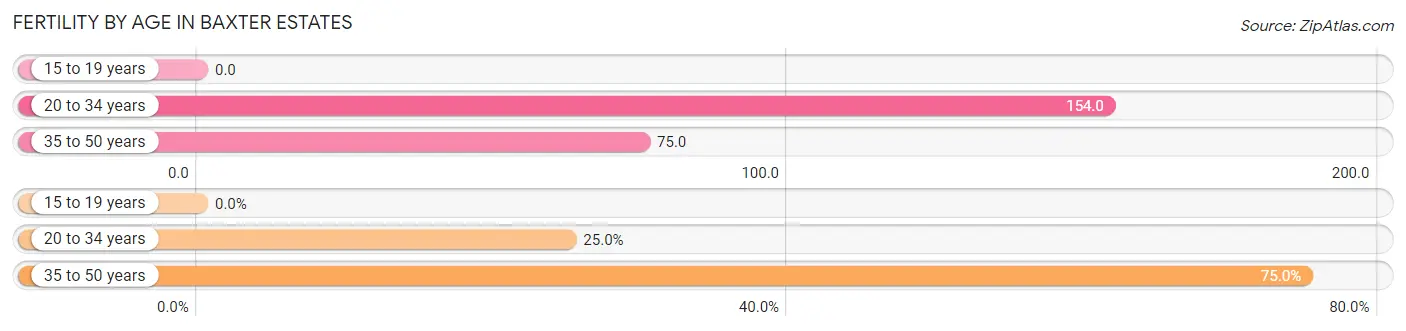
| Age Bracket | Women with Births | Births / 1,000 Women |
| 15 to 19 years | 0 (0.0%) | 0.0 |
| 20 to 34 years | 4 (25.0%) | 154.0 |
| 35 to 50 years | 12 (75.0%) | 75.0 |
| Total | 16 (100.0%) | 81.0 |
Fertility by Age by Marriage Status in Baxter Estates
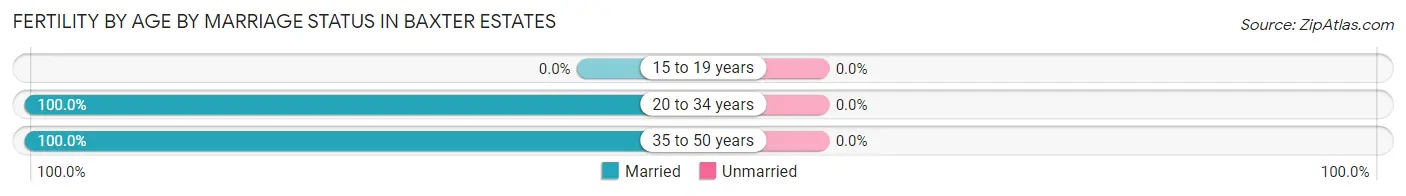
| Age Bracket | Married | Unmarried |
| 15 to 19 years | 0 (0.0%) | 0 (0.0%) |
| 20 to 34 years | 4 (100.0%) | 0 (0.0%) |
| 35 to 50 years | 12 (100.0%) | 0 (0.0%) |
| Total | 16 (100.0%) | 0 (0.0%) |
Fertility by Education in Baxter Estates
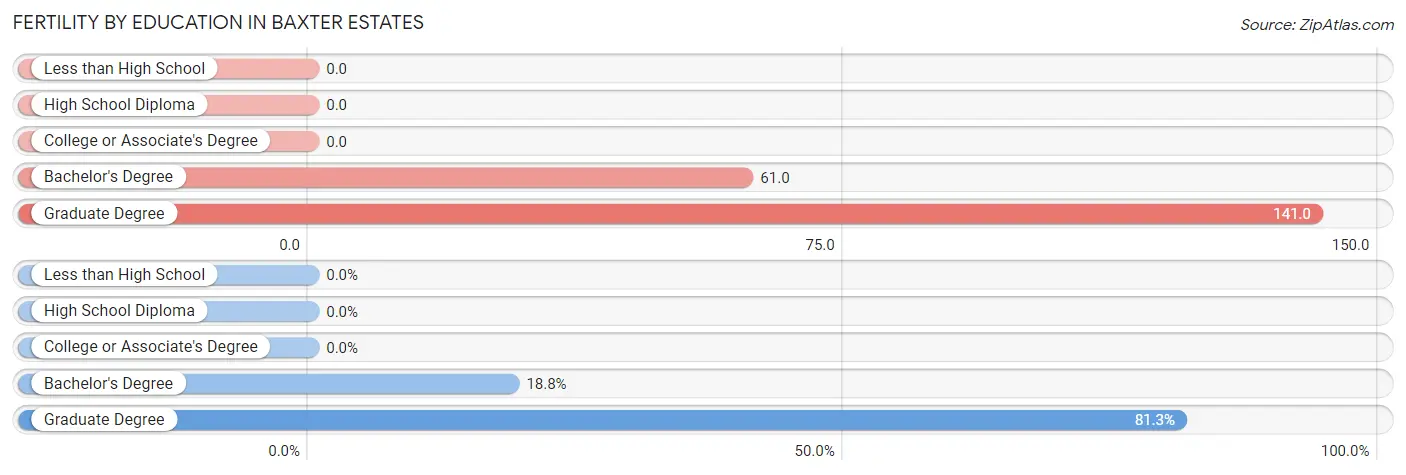
| Educational Attainment | Women with Births | Births / 1,000 Women |
| Less than High School | 0 (0.0%) | 0.0 |
| High School Diploma | 0 (0.0%) | 0.0 |
| College or Associate's Degree | 0 (0.0%) | 0.0 |
| Bachelor's Degree | 3 (18.8%) | 61.0 |
| Graduate Degree | 13 (81.2%) | 141.0 |
| Total | 16 (100.0%) | 81.0 |
Fertility by Education by Marriage Status in Baxter Estates
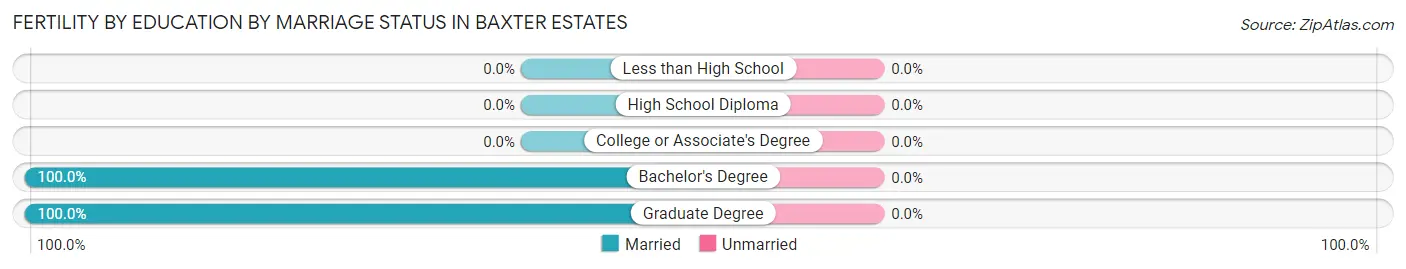
| Educational Attainment | Married | Unmarried |
| Less than High School | 0 (0.0%) | 0 (0.0%) |
| High School Diploma | 0 (0.0%) | 0 (0.0%) |
| College or Associate's Degree | 0 (0.0%) | 0 (0.0%) |
| Bachelor's Degree | 3 (100.0%) | 0 (0.0%) |
| Graduate Degree | 13 (100.0%) | 0 (0.0%) |
| Total | 16 (100.0%) | 0 (0.0%) |
Employment Characteristics in Baxter Estates
Employment by Class of Employer in Baxter Estates
Among the 581 employed individuals in Baxter Estates, private company employees (316 | 54.4%), self-employed (incorporated) (82 | 14.1%), and self-employed (not incorporated) (61 | 10.5%) make up the most common classes of employment.
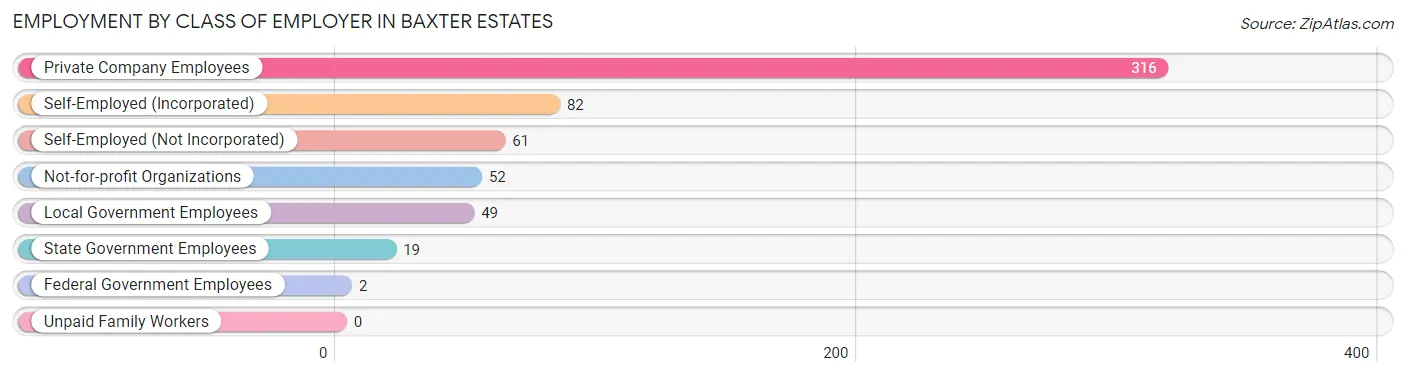
| Employer Class | # Employees | % Employees |
| Private Company Employees | 316 | 54.4% |
| Self-Employed (Incorporated) | 82 | 14.1% |
| Self-Employed (Not Incorporated) | 61 | 10.5% |
| Not-for-profit Organizations | 52 | 8.9% |
| Local Government Employees | 49 | 8.4% |
| State Government Employees | 19 | 3.3% |
| Federal Government Employees | 2 | 0.3% |
| Unpaid Family Workers | 0 | 0.0% |
| Total | 581 | 100.0% |
Employment Status by Age in Baxter Estates
According to the labor force statistics for Baxter Estates, out of the total population over 16 years of age (891), 68.9% or 614 individuals are in the labor force, with 2.8% or 17 of them unemployed. The age group with the highest labor force participation rate is 25 to 29 years, with 100.0% or 31 individuals in the labor force. Within the labor force, the 16 to 19 years age range has the highest percentage of unemployed individuals, with 40.0% or 2 of them being unemployed.
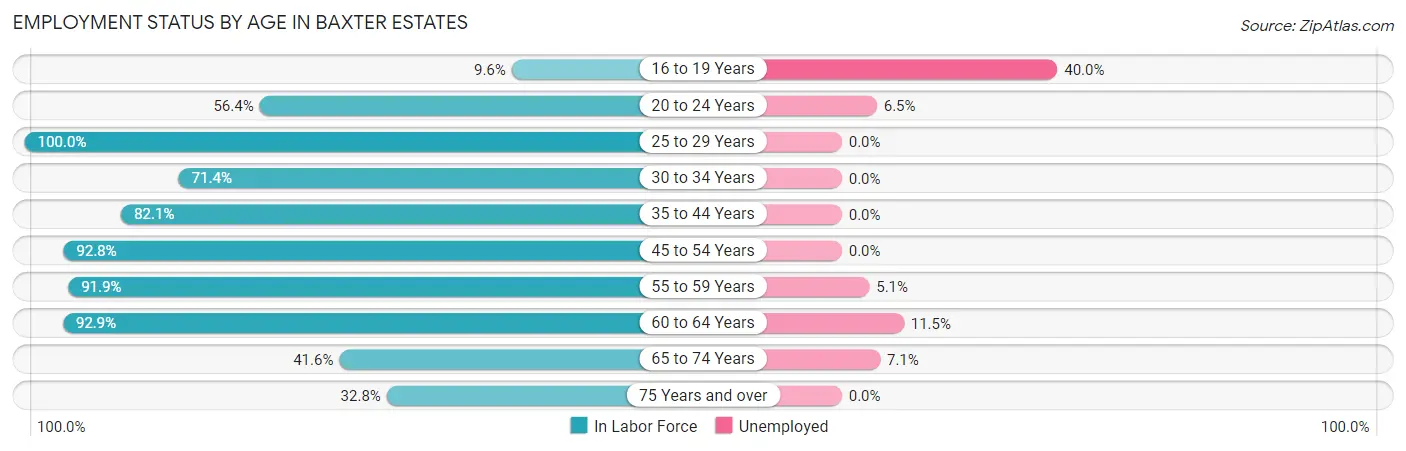
| Age Bracket | In Labor Force | Unemployed |
| 16 to 19 Years | 5 (9.6%) | 2 (40.0%) |
| 20 to 24 Years | 31 (56.4%) | 2 (6.5%) |
| 25 to 29 Years | 31 (100.0%) | 0 (0.0%) |
| 30 to 34 Years | 15 (71.4%) | 0 (0.0%) |
| 35 to 44 Years | 193 (82.1%) | 0 (0.0%) |
| 45 to 54 Years | 128 (92.8%) | 0 (0.0%) |
| 55 to 59 Years | 79 (91.9%) | 4 (5.1%) |
| 60 to 64 Years | 52 (92.9%) | 6 (11.5%) |
| 65 to 74 Years | 42 (41.6%) | 3 (7.1%) |
| 75 Years and over | 38 (32.8%) | 0 (0.0%) |
| Total | 614 (68.9%) | 17 (2.8%) |
Employment Status by Educational Attainment in Baxter Estates
According to labor force statistics for Baxter Estates, 87.8% of individuals (498) out of the total population between 25 and 64 years of age (567) are in the labor force, with 2.0% or 10 of them being unemployed. The group with the highest labor force participation rate are those with the educational attainment of less than high school, with 100.0% or 34 individuals in the labor force. Within the labor force, individuals with college / associate degree education have the highest percentage of unemployment, with 7.4% or 4 of them being unemployed.
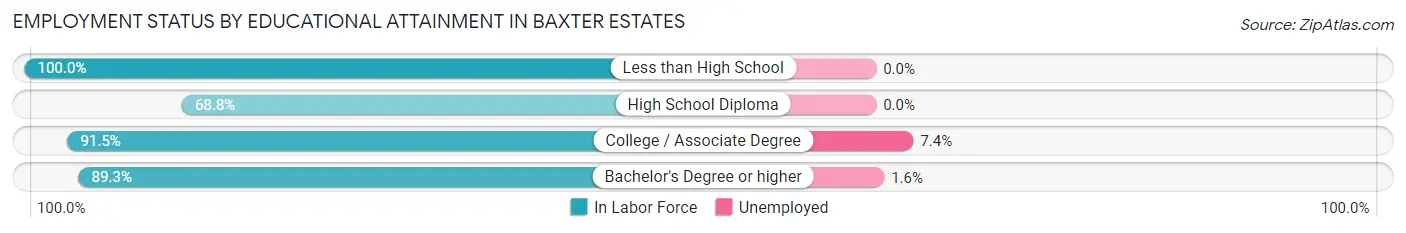
| Educational Attainment | In Labor Force | Unemployed |
| Less than High School | 34 (100.0%) | 0 (0.0%) |
| High School Diploma | 44 (68.8%) | 0 (0.0%) |
| College / Associate Degree | 54 (91.5%) | 4 (7.4%) |
| Bachelor's Degree or higher | 366 (89.3%) | 7 (1.6%) |
| Total | 498 (87.8%) | 11 (2.0%) |
Employment Occupations by Sex in Baxter Estates
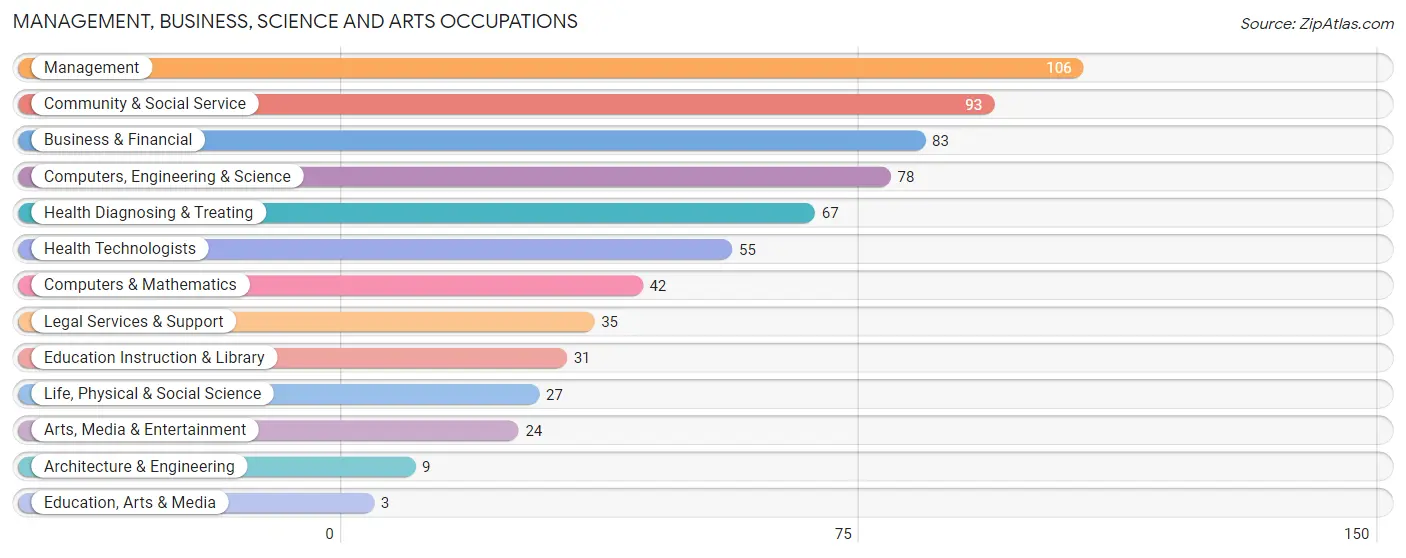
Management, Business, Science and Arts Occupations
The most common Management, Business, Science and Arts occupations in Baxter Estates are Management (106 | 17.8%), Community & Social Service (93 | 15.6%), Business & Financial (83 | 13.9%), Computers, Engineering & Science (78 | 13.1%), and Health Diagnosing & Treating (67 | 11.2%).
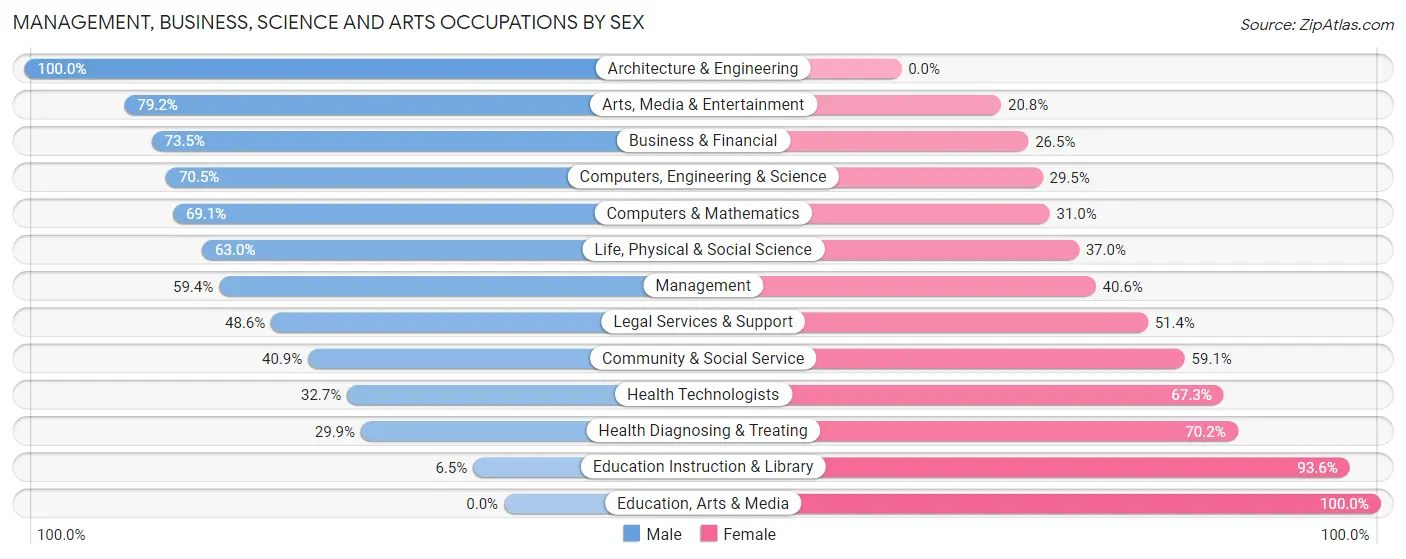
Management, Business, Science and Arts Occupations by Sex
Within the Management, Business, Science and Arts occupations in Baxter Estates, the most male-oriented occupations are Architecture & Engineering (100.0%), Arts, Media & Entertainment (79.2%), and Business & Financial (73.5%), while the most female-oriented occupations are Education, Arts & Media (100.0%), Education Instruction & Library (93.5%), and Health Diagnosing & Treating (70.2%).
| Occupation | Male | Female |
| Management | 63 (59.4%) | 43 (40.6%) |
| Business & Financial | 61 (73.5%) | 22 (26.5%) |
| Computers, Engineering & Science | 55 (70.5%) | 23 (29.5%) |
| Computers & Mathematics | 29 (69.1%) | 13 (30.9%) |
| Architecture & Engineering | 9 (100.0%) | 0 (0.0%) |
| Life, Physical & Social Science | 17 (63.0%) | 10 (37.0%) |
| Community & Social Service | 38 (40.9%) | 55 (59.1%) |
| Education, Arts & Media | 0 (0.0%) | 3 (100.0%) |
| Legal Services & Support | 17 (48.6%) | 18 (51.4%) |
| Education Instruction & Library | 2 (6.5%) | 29 (93.5%) |
| Arts, Media & Entertainment | 19 (79.2%) | 5 (20.8%) |
| Health Diagnosing & Treating | 20 (29.8%) | 47 (70.2%) |
| Health Technologists | 18 (32.7%) | 37 (67.3%) |
| Total (Category) | 237 (55.5%) | 190 (44.5%) |
| Total (Overall) | 334 (55.9%) | 263 (44.1%) |
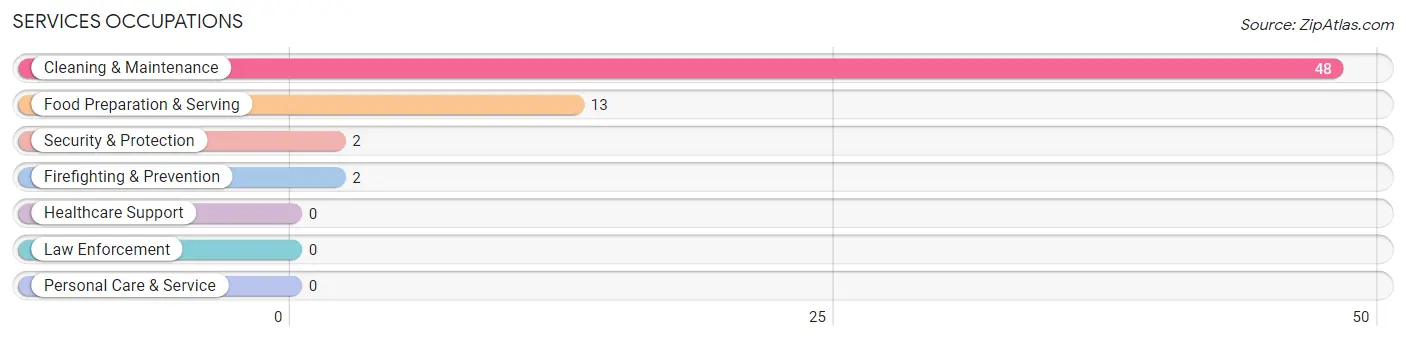
Services Occupations
The most common Services occupations in Baxter Estates are Cleaning & Maintenance (48 | 8.0%), Food Preparation & Serving (13 | 2.2%), Security & Protection (2 | 0.3%), and Firefighting & Prevention (2 | 0.3%).
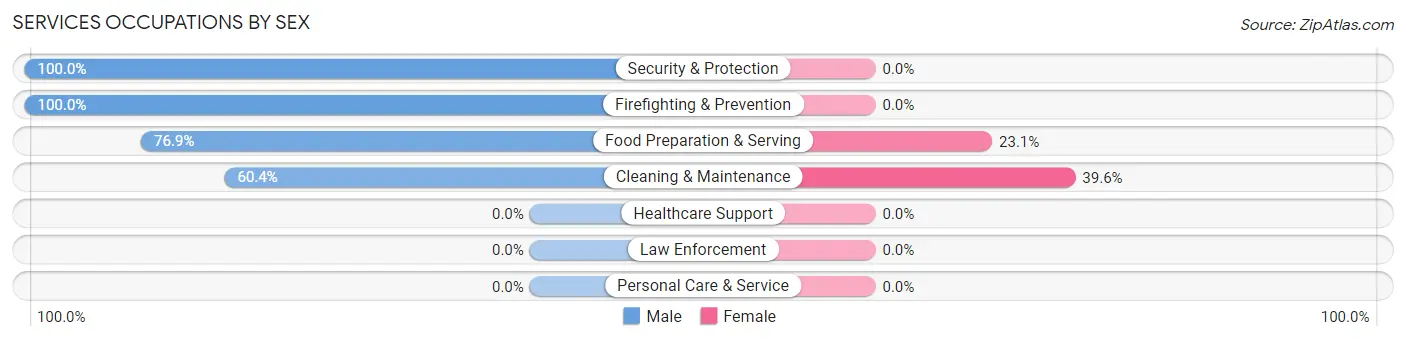
Services Occupations by Sex
Within the Services occupations in Baxter Estates, the most male-oriented occupations are Security & Protection (100.0%), Firefighting & Prevention (100.0%), and Food Preparation & Serving (76.9%), while the most female-oriented occupations are Cleaning & Maintenance (39.6%), and Food Preparation & Serving (23.1%).
| Occupation | Male | Female |
| Healthcare Support | 0 (0.0%) | 0 (0.0%) |
| Security & Protection | 2 (100.0%) | 0 (0.0%) |
| Firefighting & Prevention | 2 (100.0%) | 0 (0.0%) |
| Law Enforcement | 0 (0.0%) | 0 (0.0%) |
| Food Preparation & Serving | 10 (76.9%) | 3 (23.1%) |
| Cleaning & Maintenance | 29 (60.4%) | 19 (39.6%) |
| Personal Care & Service | 0 (0.0%) | 0 (0.0%) |
| Total (Category) | 41 (65.1%) | 22 (34.9%) |
| Total (Overall) | 334 (55.9%) | 263 (44.1%) |
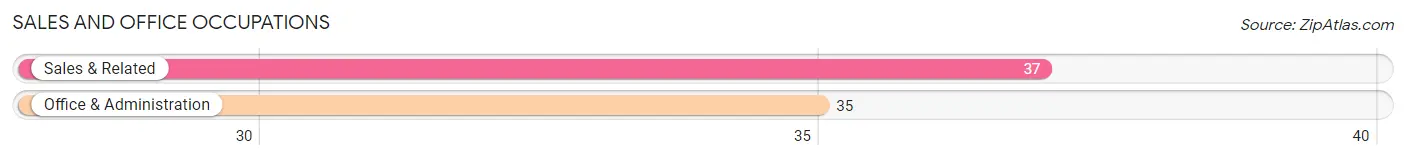
Sales and Office Occupations
The most common Sales and Office occupations in Baxter Estates are Sales & Related (37 | 6.2%), and Office & Administration (35 | 5.9%).
Sales and Office Occupations by Sex
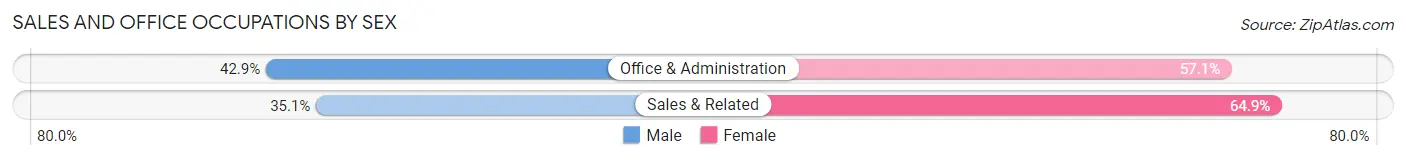
| Occupation | Male | Female |
| Sales & Related | 13 (35.1%) | 24 (64.9%) |
| Office & Administration | 15 (42.9%) | 20 (57.1%) |
| Total (Category) | 28 (38.9%) | 44 (61.1%) |
| Total (Overall) | 334 (55.9%) | 263 (44.1%) |
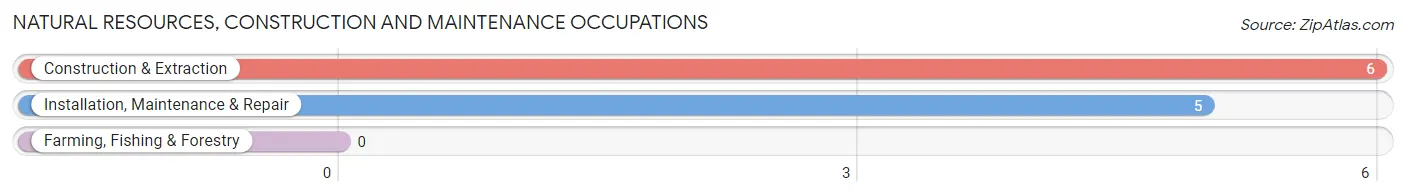
Natural Resources, Construction and Maintenance Occupations
The most common Natural Resources, Construction and Maintenance occupations in Baxter Estates are Construction & Extraction (6 | 1.0%), and Installation, Maintenance & Repair (5 | 0.8%).
Natural Resources, Construction and Maintenance Occupations by Sex
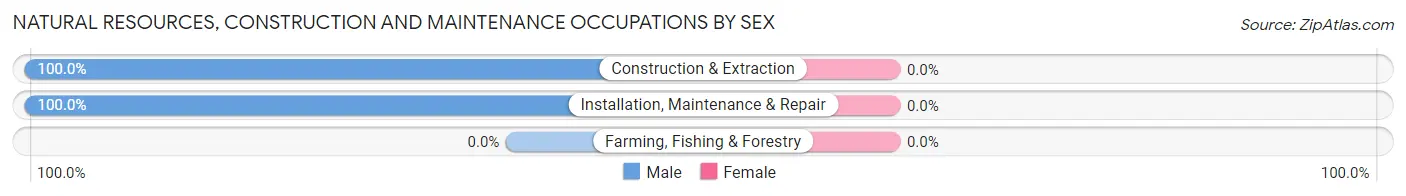
| Occupation | Male | Female |
| Farming, Fishing & Forestry | 0 (0.0%) | 0 (0.0%) |
| Construction & Extraction | 6 (100.0%) | 0 (0.0%) |
| Installation, Maintenance & Repair | 5 (100.0%) | 0 (0.0%) |
| Total (Category) | 11 (100.0%) | 0 (0.0%) |
| Total (Overall) | 334 (55.9%) | 263 (44.1%) |
Production, Transportation and Moving Occupations
The most common Production, Transportation and Moving occupations in Baxter Estates are Transportation (13 | 2.2%), and Production (11 | 1.8%).
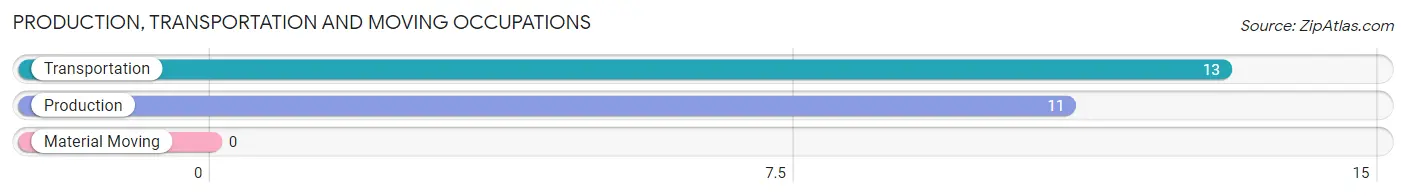
Production, Transportation and Moving Occupations by Sex
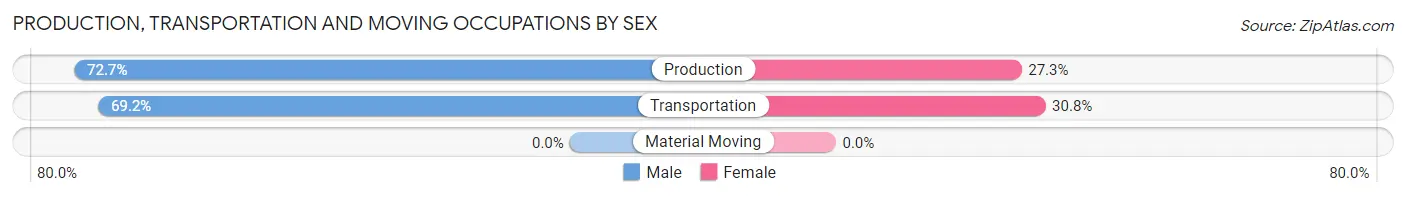
| Occupation | Male | Female |
| Production | 8 (72.7%) | 3 (27.3%) |
| Transportation | 9 (69.2%) | 4 (30.8%) |
| Material Moving | 0 (0.0%) | 0 (0.0%) |
| Total (Category) | 17 (70.8%) | 7 (29.2%) |
| Total (Overall) | 334 (55.9%) | 263 (44.1%) |
Employment Industries by Sex in Baxter Estates
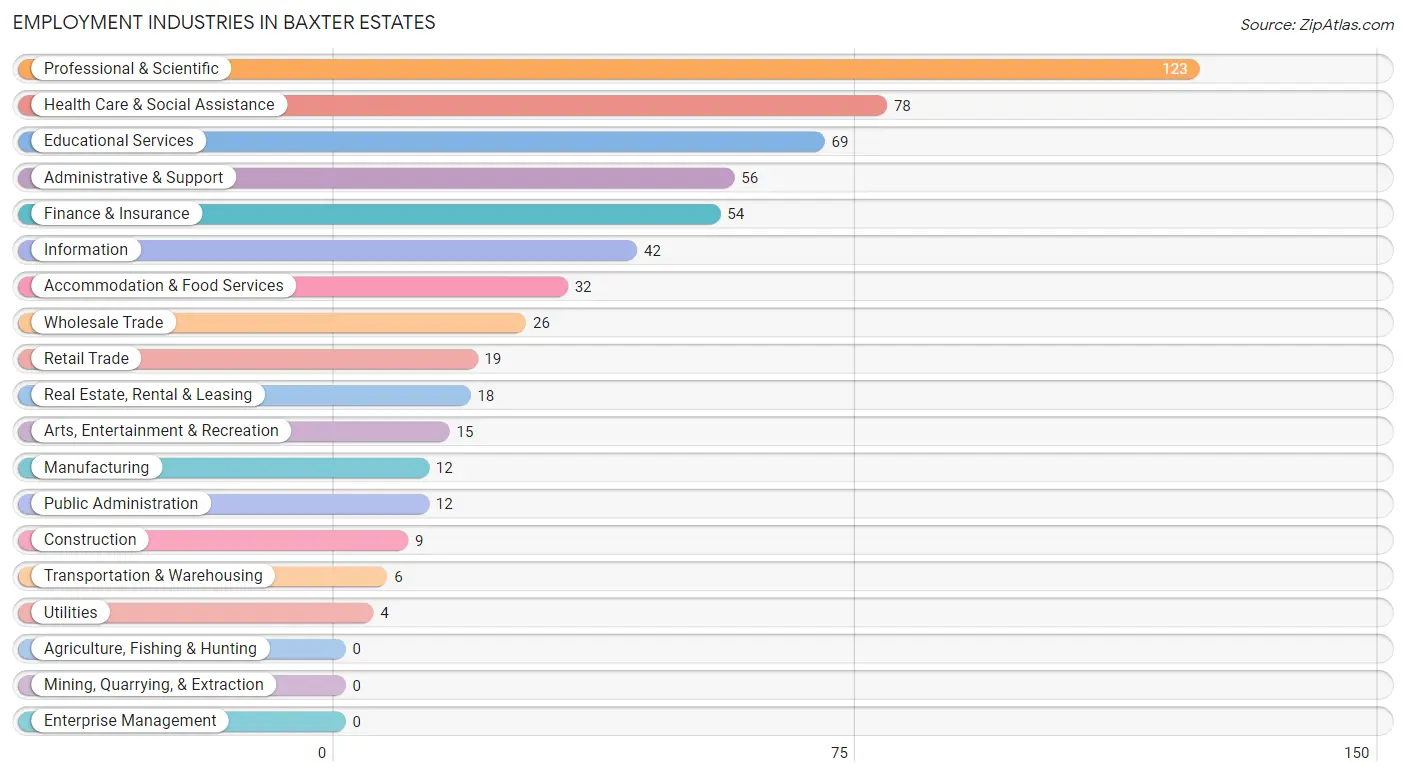
Employment Industries in Baxter Estates
The major employment industries in Baxter Estates include Professional & Scientific (123 | 20.6%), Health Care & Social Assistance (78 | 13.1%), Educational Services (69 | 11.6%), Administrative & Support (56 | 9.4%), and Finance & Insurance (54 | 9.0%).
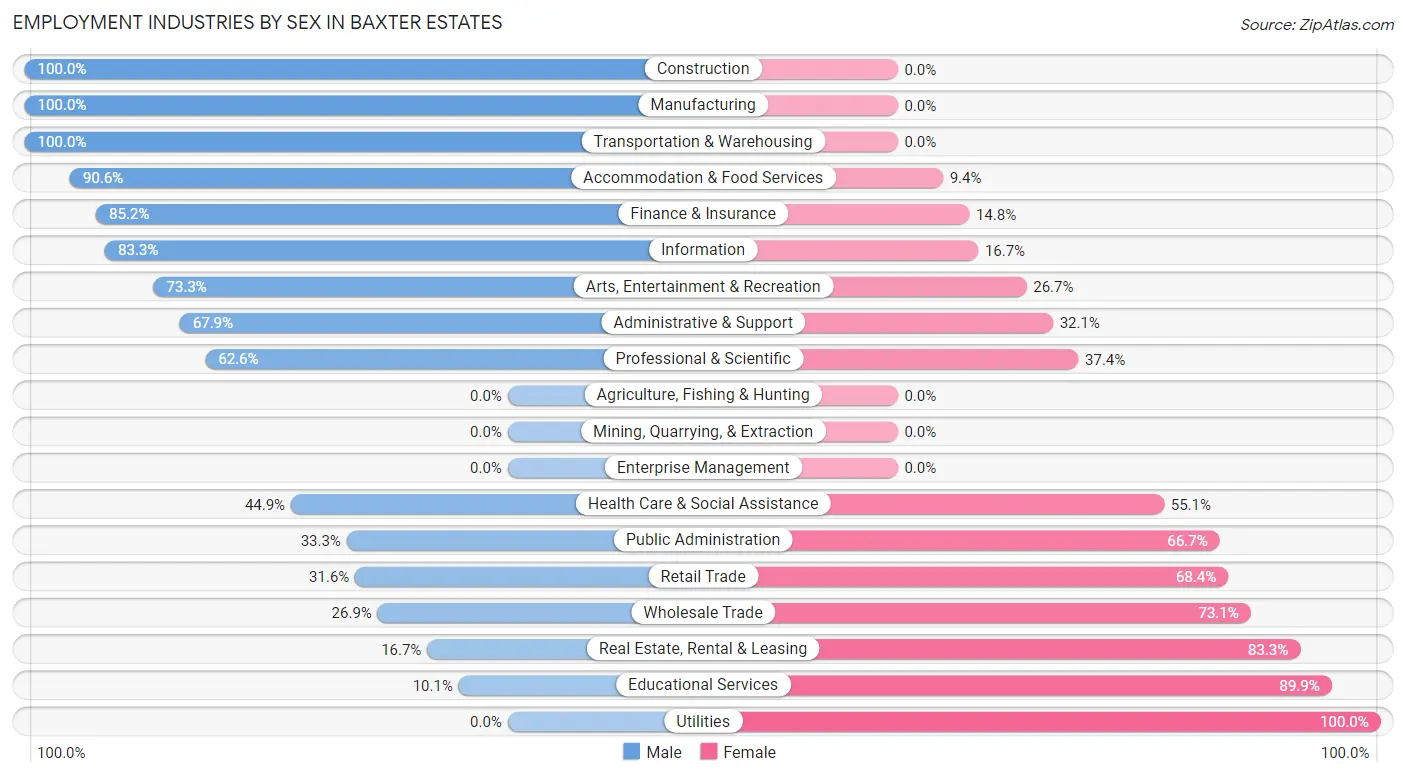
Employment Industries by Sex in Baxter Estates
The Baxter Estates industries that see more men than women are Construction (100.0%), Manufacturing (100.0%), and Transportation & Warehousing (100.0%), whereas the industries that tend to have a higher number of women are Utilities (100.0%), Educational Services (89.9%), and Real Estate, Rental & Leasing (83.3%).
| Industry | Male | Female |
| Agriculture, Fishing & Hunting | 0 (0.0%) | 0 (0.0%) |
| Mining, Quarrying, & Extraction | 0 (0.0%) | 0 (0.0%) |
| Construction | 9 (100.0%) | 0 (0.0%) |
| Manufacturing | 12 (100.0%) | 0 (0.0%) |
| Wholesale Trade | 7 (26.9%) | 19 (73.1%) |
| Retail Trade | 6 (31.6%) | 13 (68.4%) |
| Transportation & Warehousing | 6 (100.0%) | 0 (0.0%) |
| Utilities | 0 (0.0%) | 4 (100.0%) |
| Information | 35 (83.3%) | 7 (16.7%) |
| Finance & Insurance | 46 (85.2%) | 8 (14.8%) |
| Real Estate, Rental & Leasing | 3 (16.7%) | 15 (83.3%) |
| Professional & Scientific | 77 (62.6%) | 46 (37.4%) |
| Enterprise Management | 0 (0.0%) | 0 (0.0%) |
| Administrative & Support | 38 (67.9%) | 18 (32.1%) |
| Educational Services | 7 (10.1%) | 62 (89.9%) |
| Health Care & Social Assistance | 35 (44.9%) | 43 (55.1%) |
| Arts, Entertainment & Recreation | 11 (73.3%) | 4 (26.7%) |
| Accommodation & Food Services | 29 (90.6%) | 3 (9.4%) |
| Public Administration | 4 (33.3%) | 8 (66.7%) |
| Total | 334 (55.9%) | 263 (44.1%) |
Education in Baxter Estates
School Enrollment in Baxter Estates
The most common levels of schooling among the 281 students in Baxter Estates are college / undergraduate (70 | 24.9%), elementary school (64 | 22.8%), and middle school (56 | 19.9%).
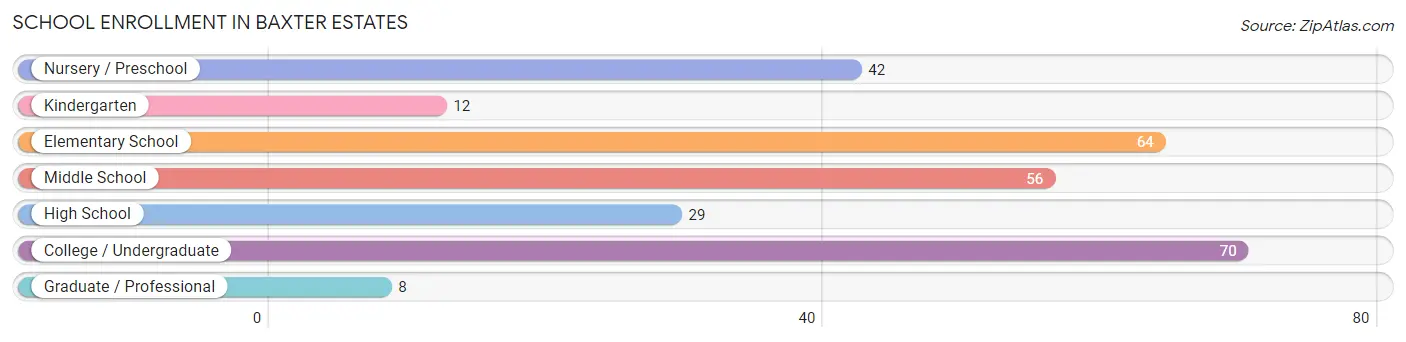
| School Level | # Students | % Students |
| Nursery / Preschool | 42 | 14.9% |
| Kindergarten | 12 | 4.3% |
| Elementary School | 64 | 22.8% |
| Middle School | 56 | 19.9% |
| High School | 29 | 10.3% |
| College / Undergraduate | 70 | 24.9% |
| Graduate / Professional | 8 | 2.9% |
| Total | 281 | 100.0% |
School Enrollment by Age by Funding Source in Baxter Estates
Out of a total of 281 students who are enrolled in schools in Baxter Estates, 61 (21.7%) attend a private institution, while the remaining 220 (78.3%) are enrolled in public schools. The age group of 35 years and over has the highest likelihood of being enrolled in private schools, with 5 (62.5% in the age bracket) enrolled. Conversely, the age group of 25 to 34 year olds has the lowest likelihood of being enrolled in a private school, with 4 (100.0% in the age bracket) attending a public institution.
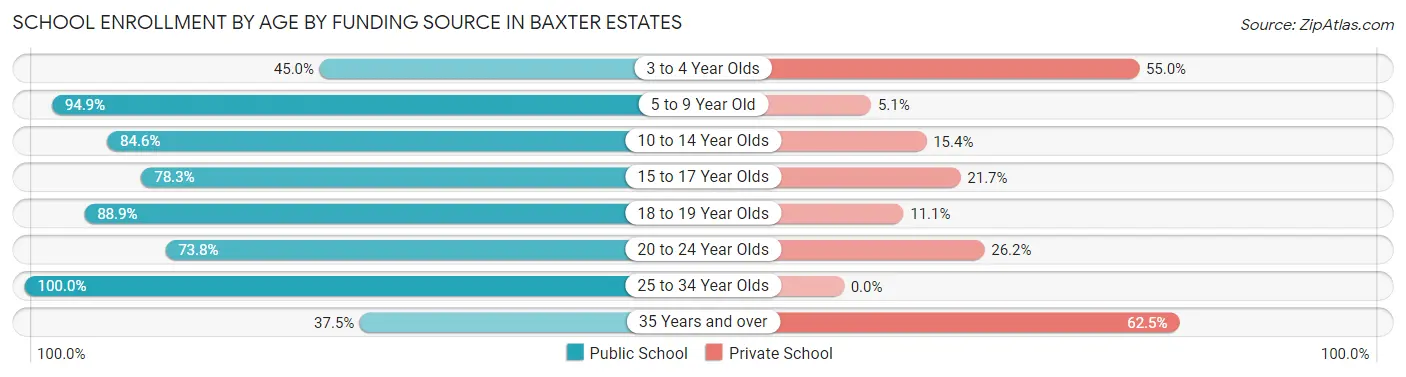
| Age Bracket | Public School | Private School |
| 3 to 4 Year Olds | 18 (45.0%) | 22 (55.0%) |
| 5 to 9 Year Old | 56 (94.9%) | 3 (5.1%) |
| 10 to 14 Year Olds | 66 (84.6%) | 12 (15.4%) |
| 15 to 17 Year Olds | 18 (78.3%) | 5 (21.7%) |
| 18 to 19 Year Olds | 24 (88.9%) | 3 (11.1%) |
| 20 to 24 Year Olds | 31 (73.8%) | 11 (26.2%) |
| 25 to 34 Year Olds | 4 (100.0%) | 0 (0.0%) |
| 35 Years and over | 3 (37.5%) | 5 (62.5%) |
| Total | 220 (78.3%) | 61 (21.7%) |
Educational Attainment by Field of Study in Baxter Estates
Social sciences (97 | 15.6%), liberal arts & history (89 | 14.3%), business (71 | 11.4%), computers & mathematics (59 | 9.5%), and education (57 | 9.1%) are the most common fields of study among 623 individuals in Baxter Estates who have obtained a bachelor's degree or higher.
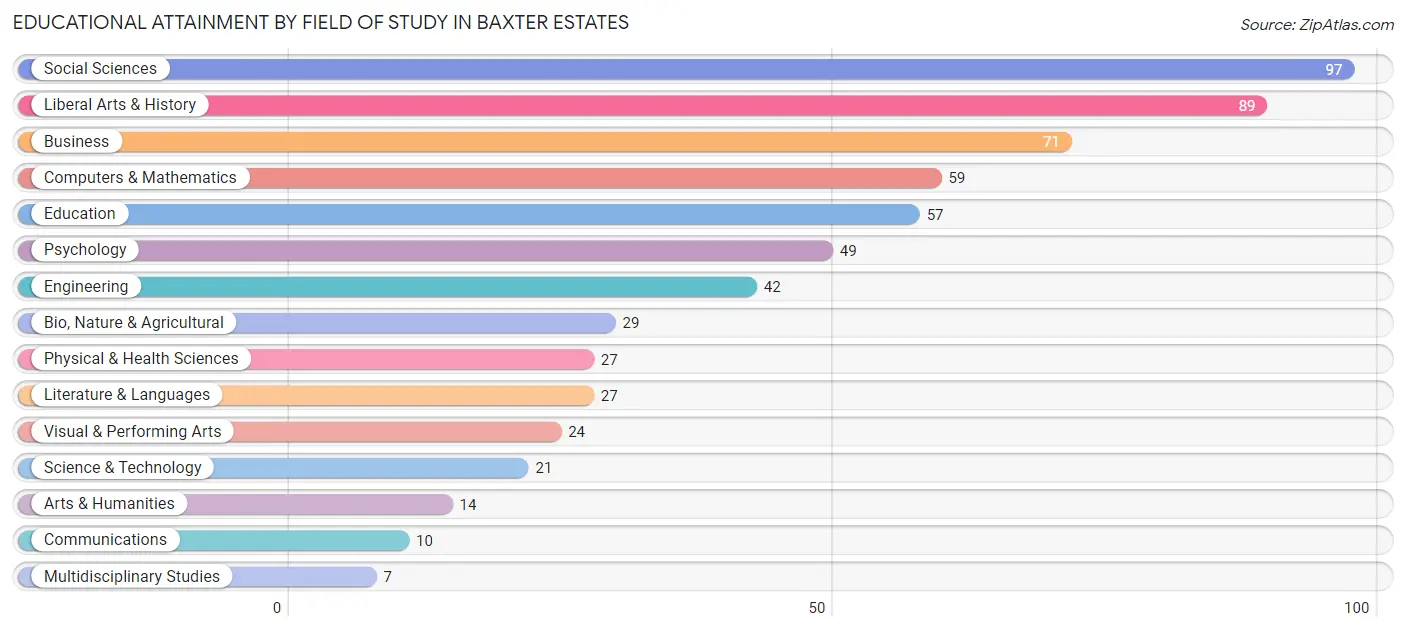
| Field of Study | # Graduates | % Graduates |
| Computers & Mathematics | 59 | 9.5% |
| Bio, Nature & Agricultural | 29 | 4.6% |
| Physical & Health Sciences | 27 | 4.3% |
| Psychology | 49 | 7.9% |
| Social Sciences | 97 | 15.6% |
| Engineering | 42 | 6.7% |
| Multidisciplinary Studies | 7 | 1.1% |
| Science & Technology | 21 | 3.4% |
| Business | 71 | 11.4% |
| Education | 57 | 9.1% |
| Literature & Languages | 27 | 4.3% |
| Liberal Arts & History | 89 | 14.3% |
| Visual & Performing Arts | 24 | 3.8% |
| Communications | 10 | 1.6% |
| Arts & Humanities | 14 | 2.2% |
| Total | 623 | 100.0% |
Transportation & Commute in Baxter Estates
Vehicle Availability by Sex in Baxter Estates
The most prevalent vehicle ownership categories in Baxter Estates are males with 2 vehicles (135, accounting for 42.2%) and females with 2 vehicles (114, making up 51.7%).
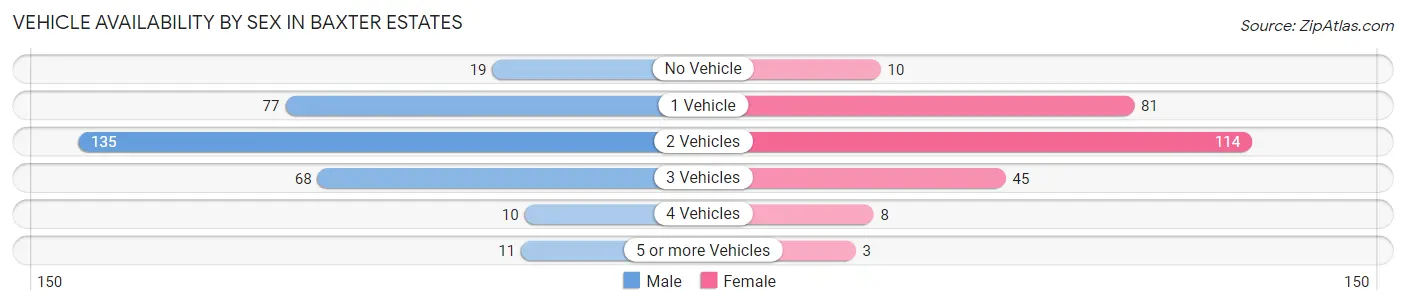
| Vehicles Available | Male | Female |
| No Vehicle | 19 (5.9%) | 10 (3.8%) |
| 1 Vehicle | 77 (24.1%) | 81 (31.0%) |
| 2 Vehicles | 135 (42.2%) | 114 (43.7%) |
| 3 Vehicles | 68 (21.2%) | 45 (17.2%) |
| 4 Vehicles | 10 (3.1%) | 8 (3.1%) |
| 5 or more Vehicles | 11 (3.4%) | 3 (1.1%) |
| Total | 320 (100.0%) | 261 (100.0%) |
Commute Time in Baxter Estates
The most frequently occuring commute durations in Baxter Estates are 45 to 59 minutes (73 commuters, 15.7%), 5 to 9 minutes (66 commuters, 14.2%), and 10 to 14 minutes (64 commuters, 13.8%).
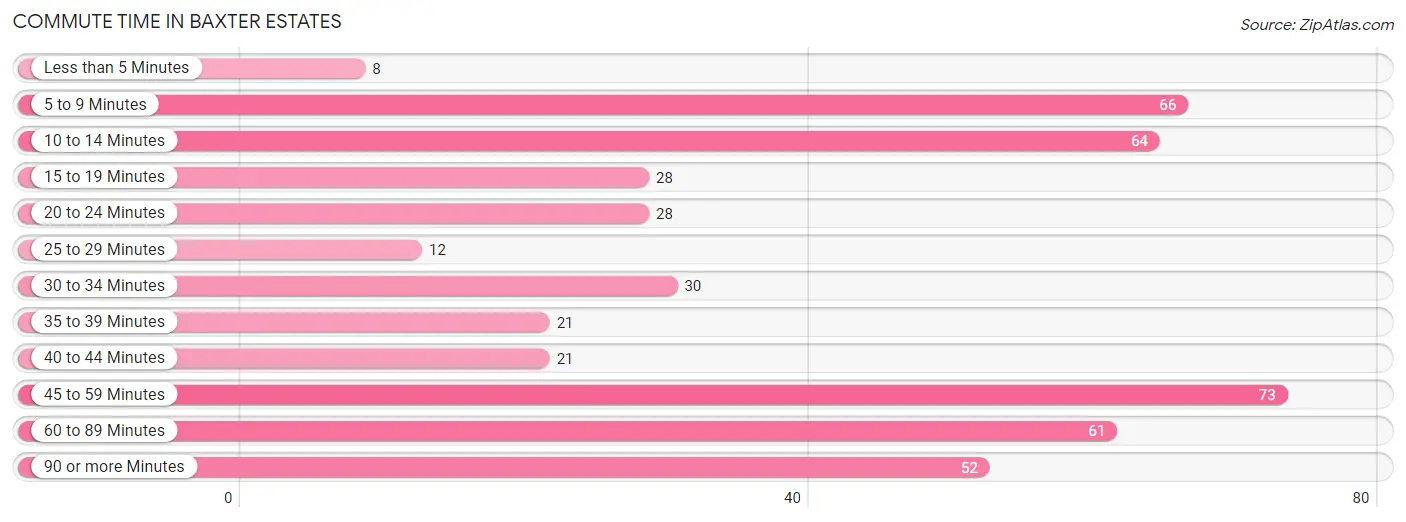
| Commute Time | # Commuters | % Commuters |
| Less than 5 Minutes | 8 | 1.7% |
| 5 to 9 Minutes | 66 | 14.2% |
| 10 to 14 Minutes | 64 | 13.8% |
| 15 to 19 Minutes | 28 | 6.0% |
| 20 to 24 Minutes | 28 | 6.0% |
| 25 to 29 Minutes | 12 | 2.6% |
| 30 to 34 Minutes | 30 | 6.5% |
| 35 to 39 Minutes | 21 | 4.5% |
| 40 to 44 Minutes | 21 | 4.5% |
| 45 to 59 Minutes | 73 | 15.7% |
| 60 to 89 Minutes | 61 | 13.2% |
| 90 or more Minutes | 52 | 11.2% |
Commute Time by Sex in Baxter Estates
The most common commute times in Baxter Estates are 10 to 14 minutes (49 commuters, 18.3%) for males and 45 to 59 minutes (34 commuters, 17.3%) for females.
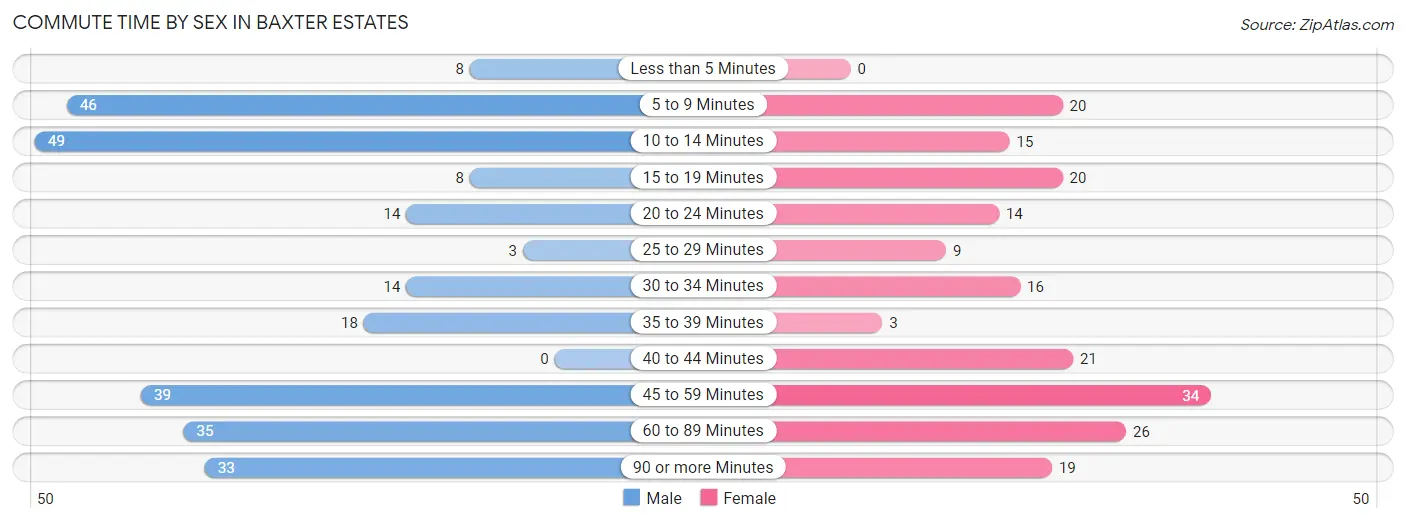
| Commute Time | Male | Female |
| Less than 5 Minutes | 8 (3.0%) | 0 (0.0%) |
| 5 to 9 Minutes | 46 (17.2%) | 20 (10.2%) |
| 10 to 14 Minutes | 49 (18.3%) | 15 (7.6%) |
| 15 to 19 Minutes | 8 (3.0%) | 20 (10.2%) |
| 20 to 24 Minutes | 14 (5.2%) | 14 (7.1%) |
| 25 to 29 Minutes | 3 (1.1%) | 9 (4.6%) |
| 30 to 34 Minutes | 14 (5.2%) | 16 (8.1%) |
| 35 to 39 Minutes | 18 (6.7%) | 3 (1.5%) |
| 40 to 44 Minutes | 0 (0.0%) | 21 (10.7%) |
| 45 to 59 Minutes | 39 (14.6%) | 34 (17.3%) |
| 60 to 89 Minutes | 35 (13.1%) | 26 (13.2%) |
| 90 or more Minutes | 33 (12.4%) | 19 (9.6%) |
Time of Departure to Work by Sex in Baxter Estates
The most frequent times of departure to work in Baxter Estates are 8:00 AM to 8:29 AM (51, 19.1%) for males and 8:00 AM to 8:29 AM (36, 18.3%) for females.
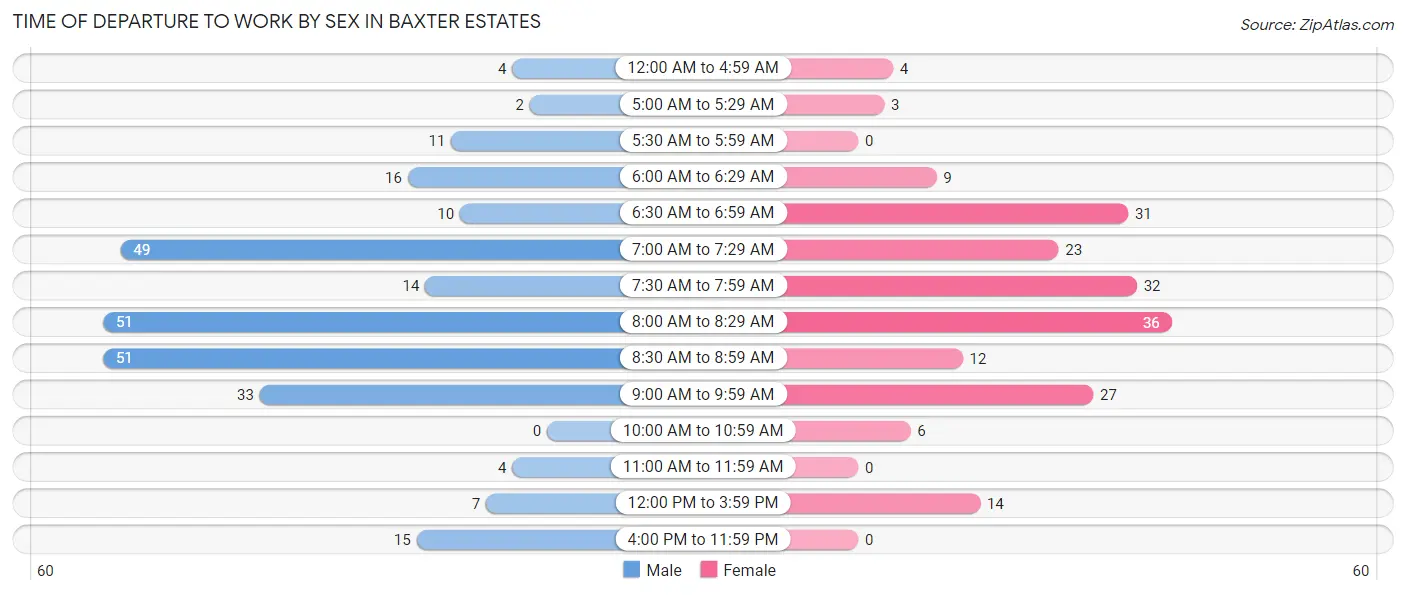
| Time of Departure | Male | Female |
| 12:00 AM to 4:59 AM | 4 (1.5%) | 4 (2.0%) |
| 5:00 AM to 5:29 AM | 2 (0.7%) | 3 (1.5%) |
| 5:30 AM to 5:59 AM | 11 (4.1%) | 0 (0.0%) |
| 6:00 AM to 6:29 AM | 16 (6.0%) | 9 (4.6%) |
| 6:30 AM to 6:59 AM | 10 (3.7%) | 31 (15.7%) |
| 7:00 AM to 7:29 AM | 49 (18.3%) | 23 (11.7%) |
| 7:30 AM to 7:59 AM | 14 (5.2%) | 32 (16.2%) |
| 8:00 AM to 8:29 AM | 51 (19.1%) | 36 (18.3%) |
| 8:30 AM to 8:59 AM | 51 (19.1%) | 12 (6.1%) |
| 9:00 AM to 9:59 AM | 33 (12.4%) | 27 (13.7%) |
| 10:00 AM to 10:59 AM | 0 (0.0%) | 6 (3.0%) |
| 11:00 AM to 11:59 AM | 4 (1.5%) | 0 (0.0%) |
| 12:00 PM to 3:59 PM | 7 (2.6%) | 14 (7.1%) |
| 4:00 PM to 11:59 PM | 15 (5.6%) | 0 (0.0%) |
| Total | 267 (100.0%) | 197 (100.0%) |
Housing Occupancy in Baxter Estates
Occupancy by Ownership in Baxter Estates
Of the total 445 dwellings in Baxter Estates, owner-occupied units account for 325 (73.0%), while renter-occupied units make up 120 (27.0%).
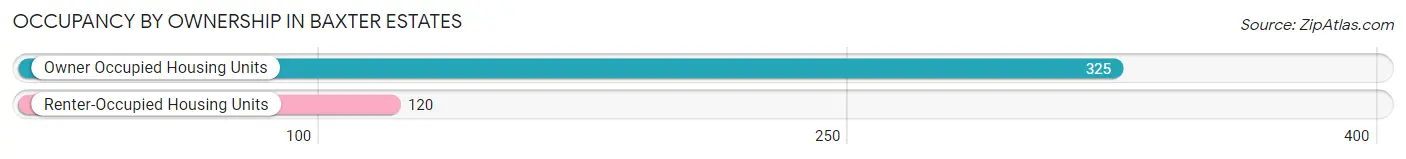
| Occupancy | # Housing Units | % Housing Units |
| Owner Occupied Housing Units | 325 | 73.0% |
| Renter-Occupied Housing Units | 120 | 27.0% |
| Total Occupied Housing Units | 445 | 100.0% |
Occupancy by Household Size in Baxter Estates
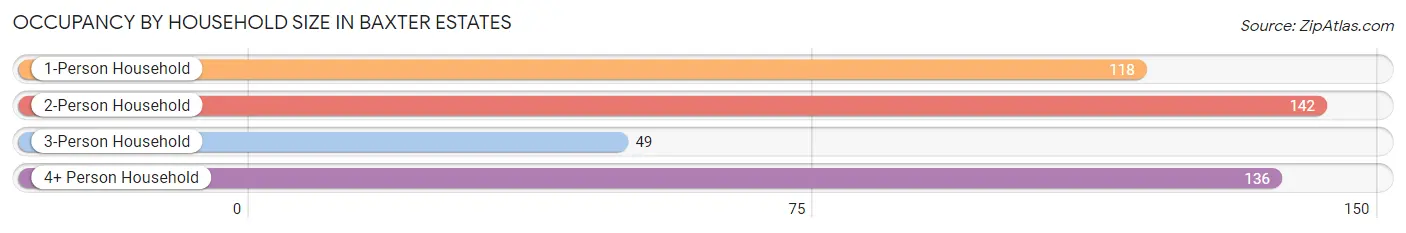
| Household Size | # Housing Units | % Housing Units |
| 1-Person Household | 118 | 26.5% |
| 2-Person Household | 142 | 31.9% |
| 3-Person Household | 49 | 11.0% |
| 4+ Person Household | 136 | 30.6% |
| Total Housing Units | 445 | 100.0% |
Occupancy by Ownership by Household Size in Baxter Estates
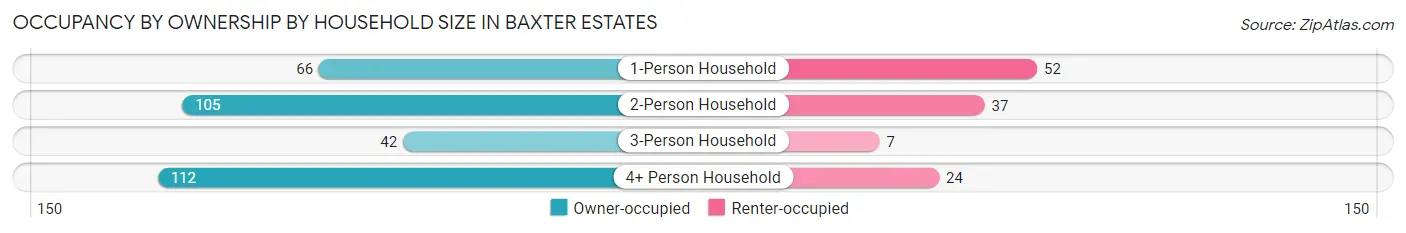
| Household Size | Owner-occupied | Renter-occupied |
| 1-Person Household | 66 (55.9%) | 52 (44.1%) |
| 2-Person Household | 105 (73.9%) | 37 (26.1%) |
| 3-Person Household | 42 (85.7%) | 7 (14.3%) |
| 4+ Person Household | 112 (82.4%) | 24 (17.6%) |
| Total Housing Units | 325 (73.0%) | 120 (27.0%) |
Occupancy by Educational Attainment in Baxter Estates
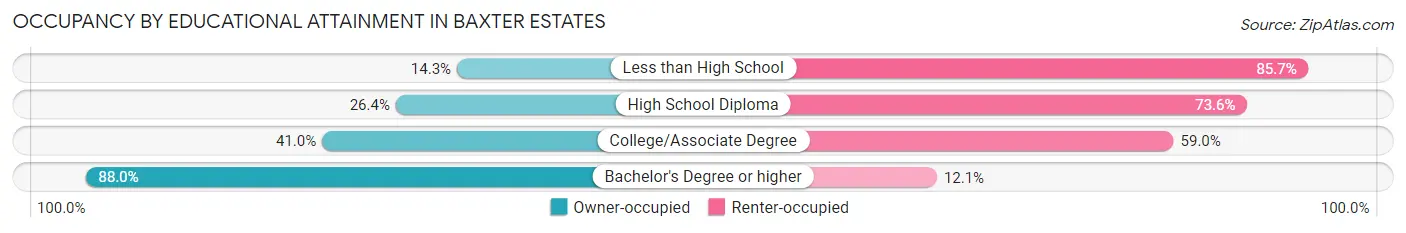
| Household Size | Owner-occupied | Renter-occupied |
| Less than High School | 3 (14.3%) | 18 (85.7%) |
| High School Diploma | 14 (26.4%) | 39 (73.6%) |
| College/Associate Degree | 16 (41.0%) | 23 (59.0%) |
| Bachelor's Degree or higher | 292 (87.9%) | 40 (12.0%) |
Occupancy by Age of Householder in Baxter Estates
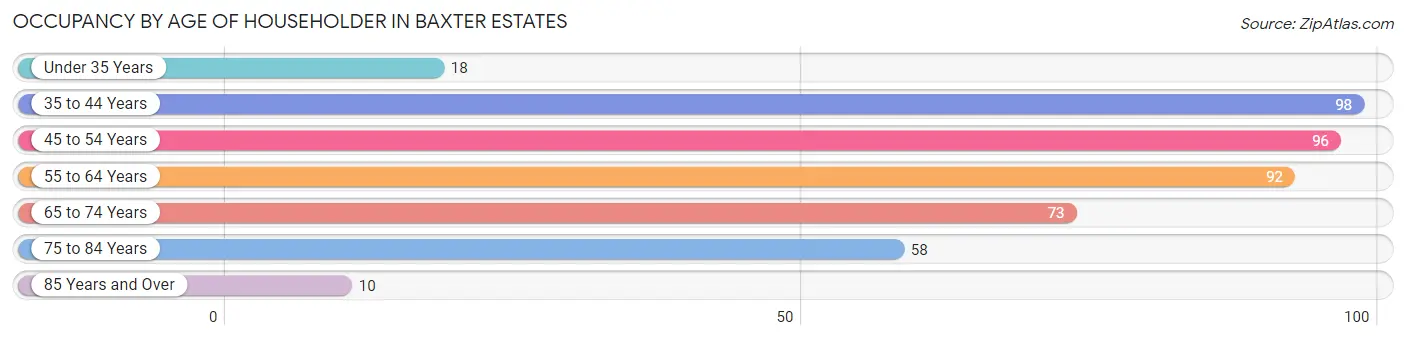
| Age Bracket | # Households | % Households |
| Under 35 Years | 18 | 4.0% |
| 35 to 44 Years | 98 | 22.0% |
| 45 to 54 Years | 96 | 21.6% |
| 55 to 64 Years | 92 | 20.7% |
| 65 to 74 Years | 73 | 16.4% |
| 75 to 84 Years | 58 | 13.0% |
| 85 Years and Over | 10 | 2.2% |
| Total | 445 | 100.0% |
Housing Finances in Baxter Estates
Median Income by Occupancy in Baxter Estates
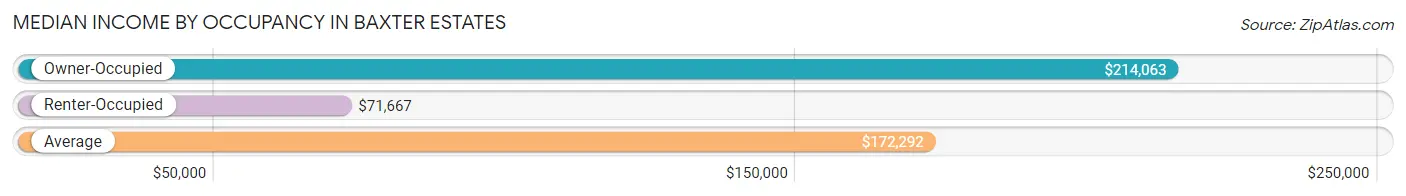
| Occupancy Type | # Households | Median Income |
| Owner-Occupied | 325 (73.0%) | $214,063 |
| Renter-Occupied | 120 (27.0%) | $71,667 |
| Average | 445 (100.0%) | $172,292 |
Occupancy by Householder Income Bracket in Baxter Estates
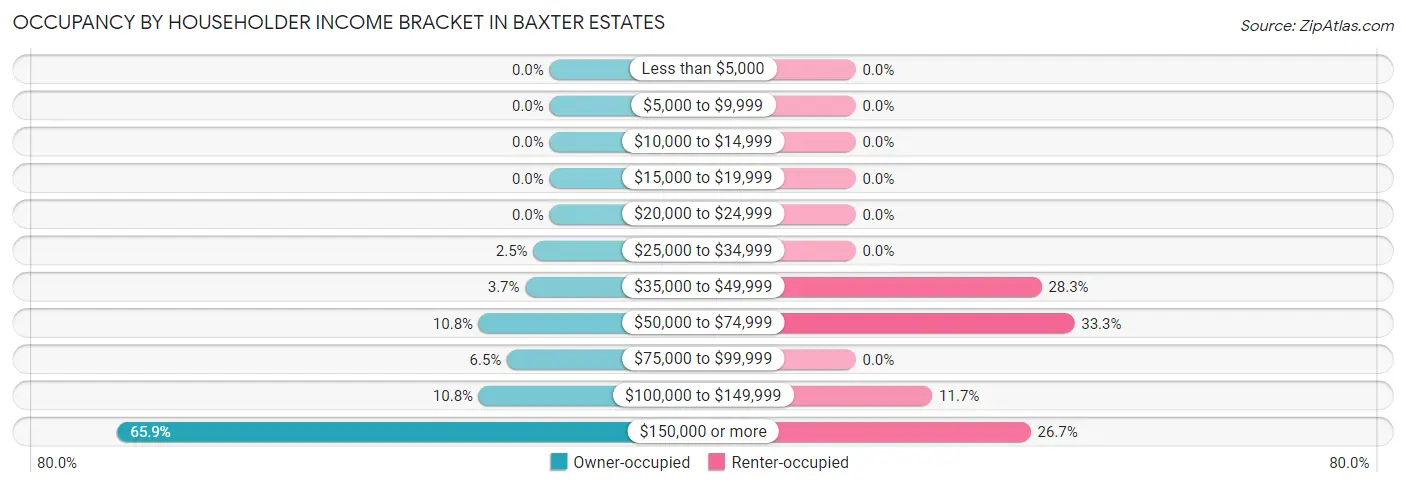
| Income Bracket | Owner-occupied | Renter-occupied |
| Less than $5,000 | 0 (0.0%) | 0 (0.0%) |
| $5,000 to $9,999 | 0 (0.0%) | 0 (0.0%) |
| $10,000 to $14,999 | 0 (0.0%) | 0 (0.0%) |
| $15,000 to $19,999 | 0 (0.0%) | 0 (0.0%) |
| $20,000 to $24,999 | 0 (0.0%) | 0 (0.0%) |
| $25,000 to $34,999 | 8 (2.5%) | 0 (0.0%) |
| $35,000 to $49,999 | 12 (3.7%) | 34 (28.3%) |
| $50,000 to $74,999 | 35 (10.8%) | 40 (33.3%) |
| $75,000 to $99,999 | 21 (6.5%) | 0 (0.0%) |
| $100,000 to $149,999 | 35 (10.8%) | 14 (11.7%) |
| $150,000 or more | 214 (65.8%) | 32 (26.7%) |
| Total | 325 (100.0%) | 120 (100.0%) |
Monthly Housing Cost Tiers in Baxter Estates
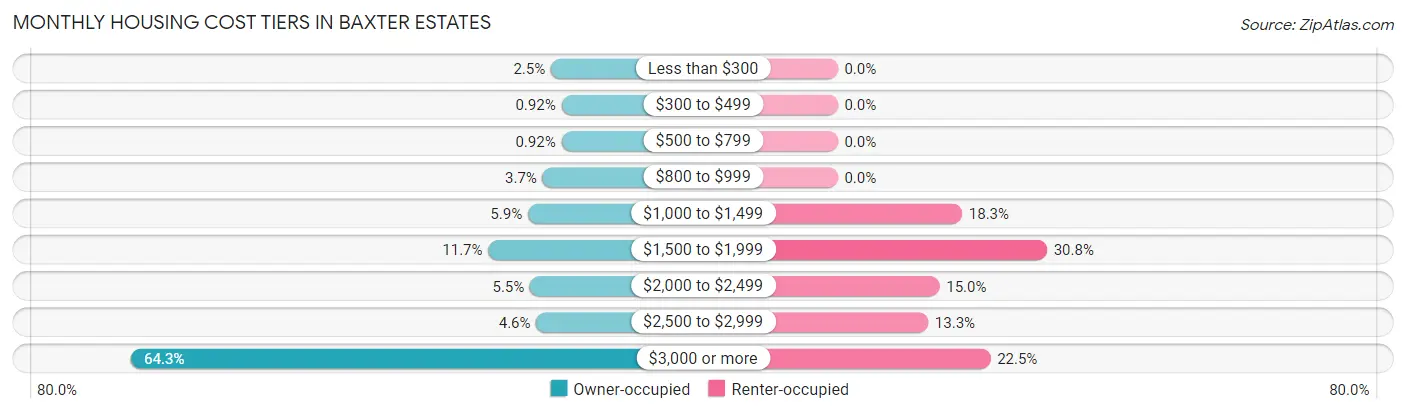
| Monthly Cost | Owner-occupied | Renter-occupied |
| Less than $300 | 8 (2.5%) | 0 (0.0%) |
| $300 to $499 | 3 (0.9%) | 0 (0.0%) |
| $500 to $799 | 3 (0.9%) | 0 (0.0%) |
| $800 to $999 | 12 (3.7%) | 0 (0.0%) |
| $1,000 to $1,499 | 19 (5.9%) | 22 (18.3%) |
| $1,500 to $1,999 | 38 (11.7%) | 37 (30.8%) |
| $2,000 to $2,499 | 18 (5.5%) | 18 (15.0%) |
| $2,500 to $2,999 | 15 (4.6%) | 16 (13.3%) |
| $3,000 or more | 209 (64.3%) | 27 (22.5%) |
| Total | 325 (100.0%) | 120 (100.0%) |
Physical Housing Characteristics in Baxter Estates
Housing Structures in Baxter Estates
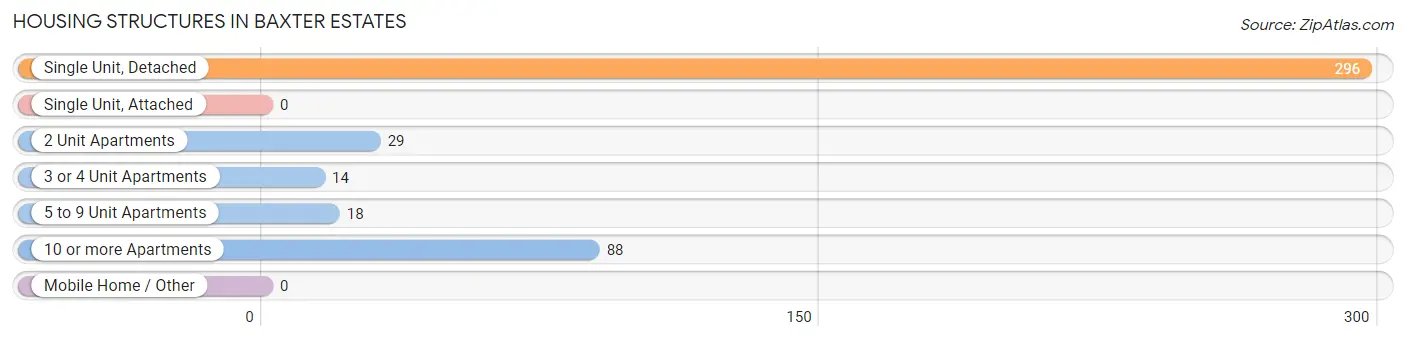
| Structure Type | # Housing Units | % Housing Units |
| Single Unit, Detached | 296 | 66.5% |
| Single Unit, Attached | 0 | 0.0% |
| 2 Unit Apartments | 29 | 6.5% |
| 3 or 4 Unit Apartments | 14 | 3.2% |
| 5 to 9 Unit Apartments | 18 | 4.0% |
| 10 or more Apartments | 88 | 19.8% |
| Mobile Home / Other | 0 | 0.0% |
| Total | 445 | 100.0% |
Housing Structures by Occupancy in Baxter Estates
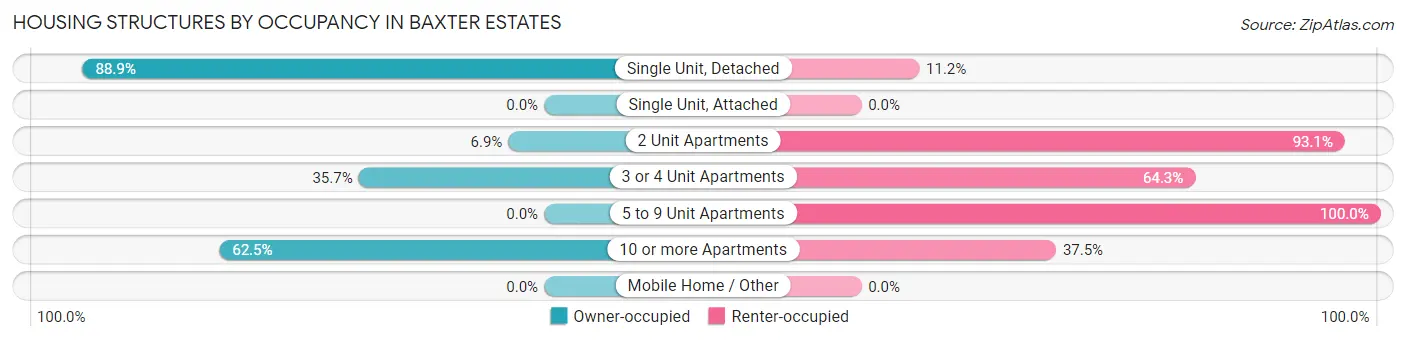
| Structure Type | Owner-occupied | Renter-occupied |
| Single Unit, Detached | 263 (88.8%) | 33 (11.2%) |
| Single Unit, Attached | 0 (0.0%) | 0 (0.0%) |
| 2 Unit Apartments | 2 (6.9%) | 27 (93.1%) |
| 3 or 4 Unit Apartments | 5 (35.7%) | 9 (64.3%) |
| 5 to 9 Unit Apartments | 0 (0.0%) | 18 (100.0%) |
| 10 or more Apartments | 55 (62.5%) | 33 (37.5%) |
| Mobile Home / Other | 0 (0.0%) | 0 (0.0%) |
| Total | 325 (73.0%) | 120 (27.0%) |
Housing Structures by Number of Rooms in Baxter Estates
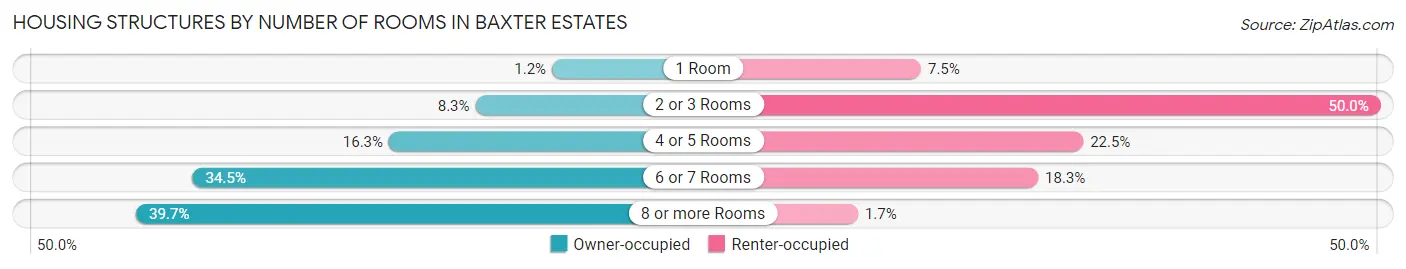
| Number of Rooms | Owner-occupied | Renter-occupied |
| 1 Room | 4 (1.2%) | 9 (7.5%) |
| 2 or 3 Rooms | 27 (8.3%) | 60 (50.0%) |
| 4 or 5 Rooms | 53 (16.3%) | 27 (22.5%) |
| 6 or 7 Rooms | 112 (34.5%) | 22 (18.3%) |
| 8 or more Rooms | 129 (39.7%) | 2 (1.7%) |
| Total | 325 (100.0%) | 120 (100.0%) |
Housing Structure by Heating Type in Baxter Estates
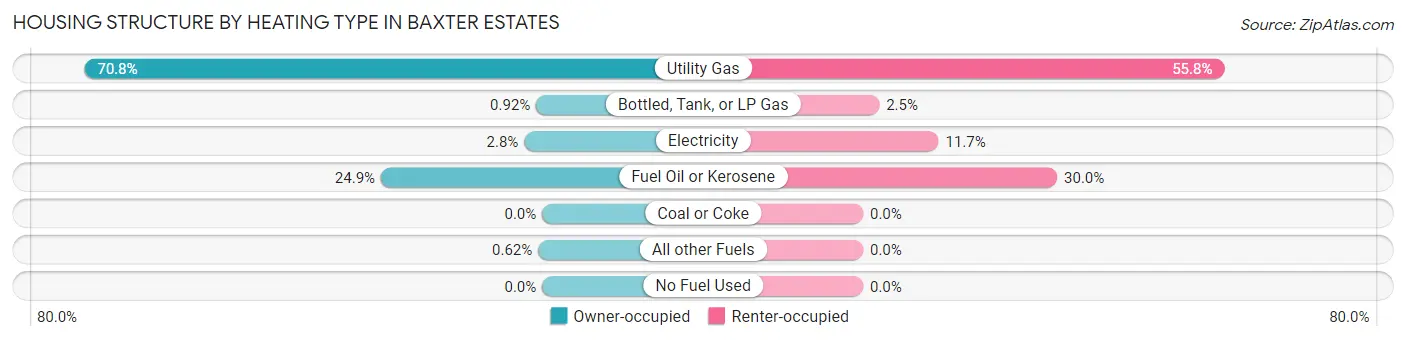
| Heating Type | Owner-occupied | Renter-occupied |
| Utility Gas | 230 (70.8%) | 67 (55.8%) |
| Bottled, Tank, or LP Gas | 3 (0.9%) | 3 (2.5%) |
| Electricity | 9 (2.8%) | 14 (11.7%) |
| Fuel Oil or Kerosene | 81 (24.9%) | 36 (30.0%) |
| Coal or Coke | 0 (0.0%) | 0 (0.0%) |
| All other Fuels | 2 (0.6%) | 0 (0.0%) |
| No Fuel Used | 0 (0.0%) | 0 (0.0%) |
| Total | 325 (100.0%) | 120 (100.0%) |
Household Vehicle Usage in Baxter Estates
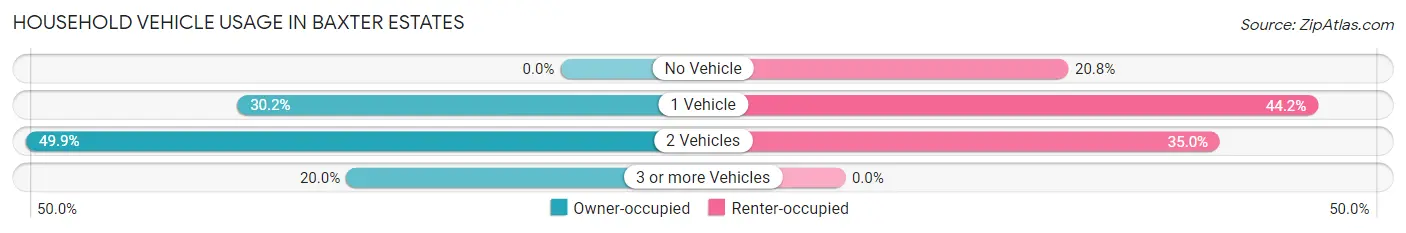
| Vehicles per Household | Owner-occupied | Renter-occupied |
| No Vehicle | 0 (0.0%) | 25 (20.8%) |
| 1 Vehicle | 98 (30.1%) | 53 (44.2%) |
| 2 Vehicles | 162 (49.8%) | 42 (35.0%) |
| 3 or more Vehicles | 65 (20.0%) | 0 (0.0%) |
| Total | 325 (100.0%) | 120 (100.0%) |
Real Estate & Mortgages in Baxter Estates
Real Estate and Mortgage Overview in Baxter Estates
| Characteristic | Without Mortgage | With Mortgage |
| Housing Units | 106 | 219 |
| Median Property Value | $830,000 | $1,075,000 |
| Median Household Income | $160,000 | $159 |
| Monthly Housing Costs | $1,501 | $185 |
| Real Estate Taxes | $10,001 | $8 |
Property Value by Mortgage Status in Baxter Estates
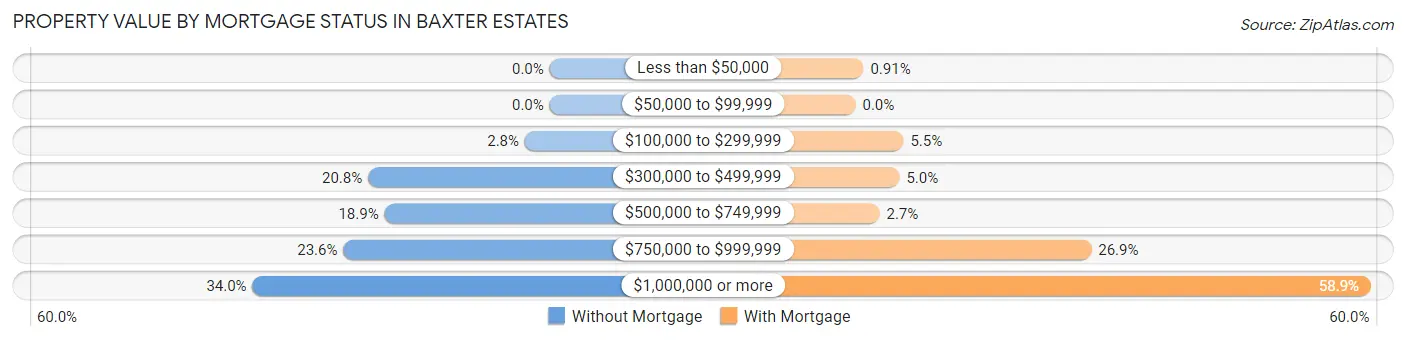
| Property Value | Without Mortgage | With Mortgage |
| Less than $50,000 | 0 (0.0%) | 2 (0.9%) |
| $50,000 to $99,999 | 0 (0.0%) | 0 (0.0%) |
| $100,000 to $299,999 | 3 (2.8%) | 12 (5.5%) |
| $300,000 to $499,999 | 22 (20.7%) | 11 (5.0%) |
| $500,000 to $749,999 | 20 (18.9%) | 6 (2.7%) |
| $750,000 to $999,999 | 25 (23.6%) | 59 (26.9%) |
| $1,000,000 or more | 36 (34.0%) | 129 (58.9%) |
| Total | 106 (100.0%) | 219 (100.0%) |
Household Income by Mortgage Status in Baxter Estates
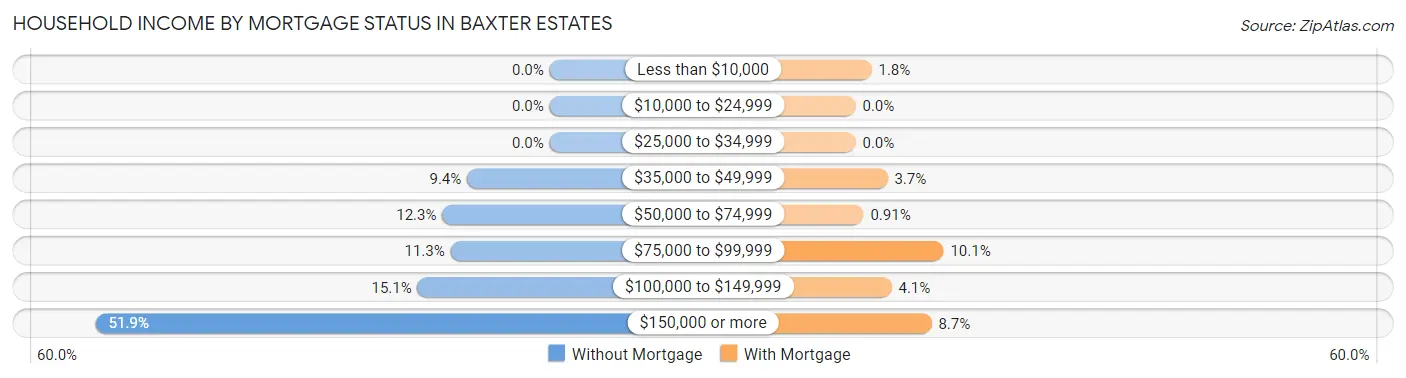
| Household Income | Without Mortgage | With Mortgage |
| Less than $10,000 | 0 (0.0%) | 4 (1.8%) |
| $10,000 to $24,999 | 0 (0.0%) | 0 (0.0%) |
| $25,000 to $34,999 | 0 (0.0%) | 0 (0.0%) |
| $35,000 to $49,999 | 10 (9.4%) | 8 (3.6%) |
| $50,000 to $74,999 | 13 (12.3%) | 2 (0.9%) |
| $75,000 to $99,999 | 12 (11.3%) | 22 (10.1%) |
| $100,000 to $149,999 | 16 (15.1%) | 9 (4.1%) |
| $150,000 or more | 55 (51.9%) | 19 (8.7%) |
| Total | 106 (100.0%) | 219 (100.0%) |
Property Value to Household Income Ratio in Baxter Estates
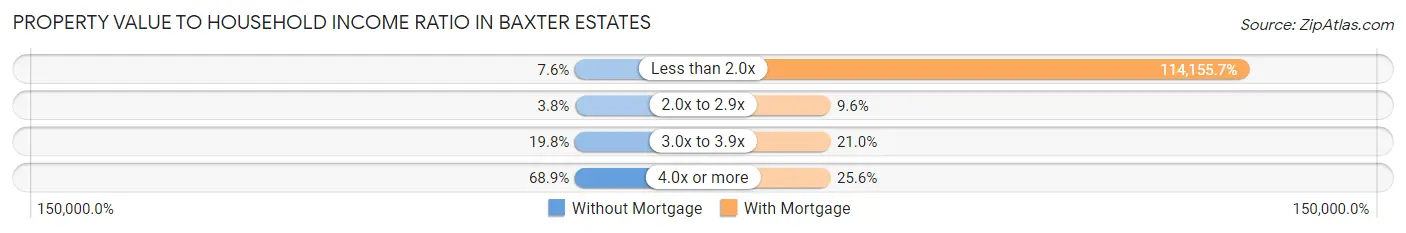
| Value-to-Income Ratio | Without Mortgage | With Mortgage |
| Less than 2.0x | 8 (7.5%) | 250,001 (114,155.7%) |
| 2.0x to 2.9x | 4 (3.8%) | 21 (9.6%) |
| 3.0x to 3.9x | 21 (19.8%) | 46 (21.0%) |
| 4.0x or more | 73 (68.9%) | 56 (25.6%) |
| Total | 106 (100.0%) | 219 (100.0%) |
Real Estate Taxes by Mortgage Status in Baxter Estates
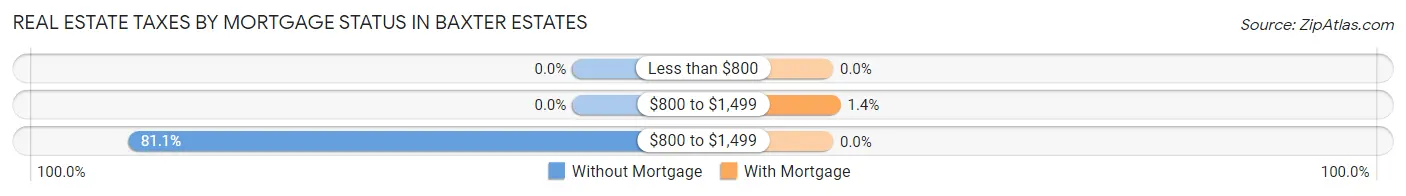
| Property Taxes | Without Mortgage | With Mortgage |
| Less than $800 | 0 (0.0%) | 0 (0.0%) |
| $800 to $1,499 | 0 (0.0%) | 3 (1.4%) |
| $800 to $1,499 | 86 (81.1%) | 0 (0.0%) |
| Total | 106 (100.0%) | 219 (100.0%) |
Health & Disability in Baxter Estates
Health Insurance Coverage by Age in Baxter Estates
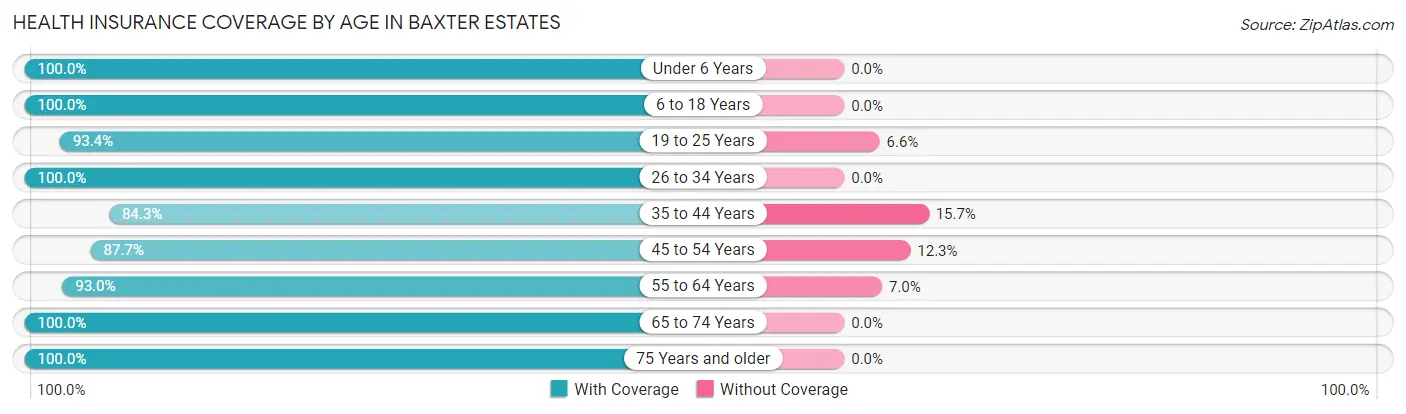
| Age Bracket | With Coverage | Without Coverage |
| Under 6 Years | 129 (100.0%) | 0 (0.0%) |
| 6 to 18 Years | 178 (100.0%) | 0 (0.0%) |
| 19 to 25 Years | 71 (93.4%) | 5 (6.6%) |
| 26 to 34 Years | 33 (100.0%) | 0 (0.0%) |
| 35 to 44 Years | 198 (84.3%) | 37 (15.7%) |
| 45 to 54 Years | 121 (87.7%) | 17 (12.3%) |
| 55 to 64 Years | 132 (93.0%) | 10 (7.0%) |
| 65 to 74 Years | 101 (100.0%) | 0 (0.0%) |
| 75 Years and older | 116 (100.0%) | 0 (0.0%) |
| Total | 1,079 (94.0%) | 69 (6.0%) |
Health Insurance Coverage by Citizenship Status in Baxter Estates
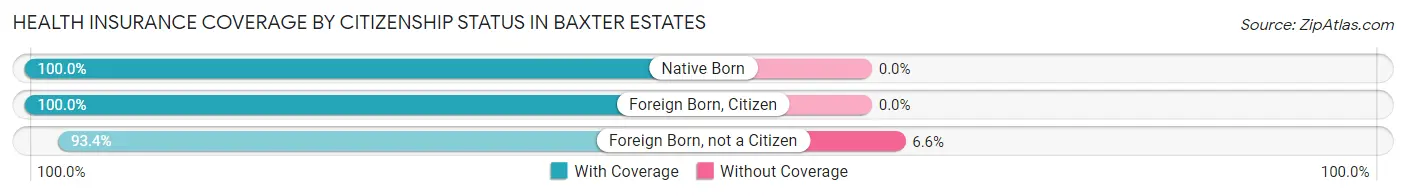
| Citizenship Status | With Coverage | Without Coverage |
| Native Born | 129 (100.0%) | 0 (0.0%) |
| Foreign Born, Citizen | 178 (100.0%) | 0 (0.0%) |
| Foreign Born, not a Citizen | 71 (93.4%) | 5 (6.6%) |
Health Insurance Coverage by Household Income in Baxter Estates
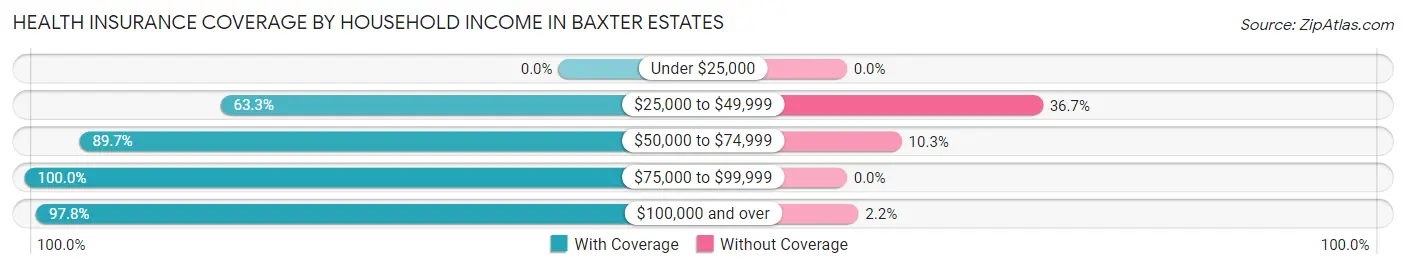
| Household Income | With Coverage | Without Coverage |
| Under $25,000 | 0 (0.0%) | 0 (0.0%) |
| $25,000 to $49,999 | 50 (63.3%) | 29 (36.7%) |
| $50,000 to $74,999 | 192 (89.7%) | 22 (10.3%) |
| $75,000 to $99,999 | 26 (100.0%) | 0 (0.0%) |
| $100,000 and over | 811 (97.8%) | 18 (2.2%) |
Public vs Private Health Insurance Coverage by Age in Baxter Estates
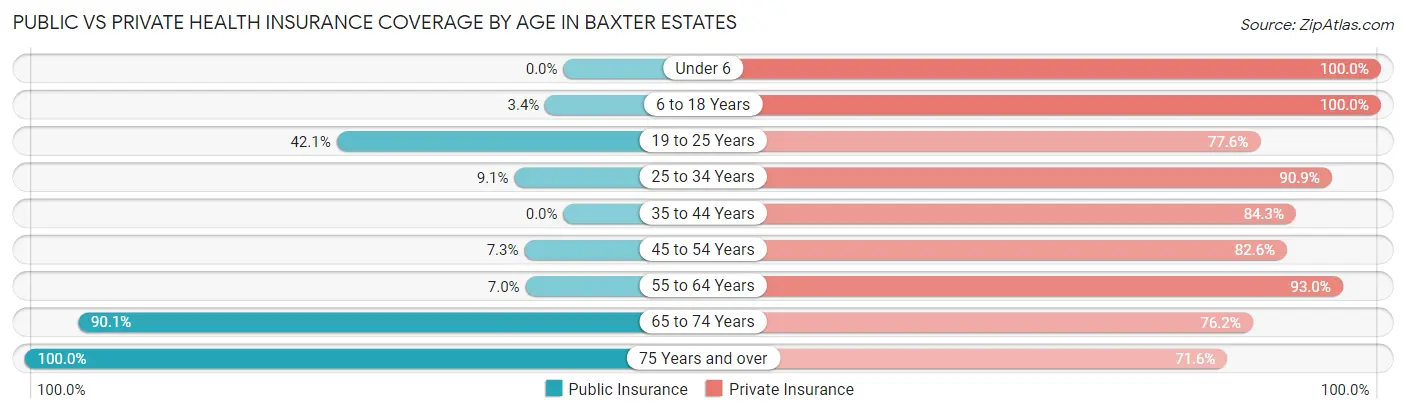
| Age Bracket | Public Insurance | Private Insurance |
| Under 6 | 0 (0.0%) | 129 (100.0%) |
| 6 to 18 Years | 6 (3.4%) | 178 (100.0%) |
| 19 to 25 Years | 32 (42.1%) | 59 (77.6%) |
| 25 to 34 Years | 3 (9.1%) | 30 (90.9%) |
| 35 to 44 Years | 0 (0.0%) | 198 (84.3%) |
| 45 to 54 Years | 10 (7.2%) | 114 (82.6%) |
| 55 to 64 Years | 10 (7.0%) | 132 (93.0%) |
| 65 to 74 Years | 91 (90.1%) | 77 (76.2%) |
| 75 Years and over | 116 (100.0%) | 83 (71.6%) |
| Total | 268 (23.3%) | 1,000 (87.1%) |
Disability Status by Sex by Age in Baxter Estates
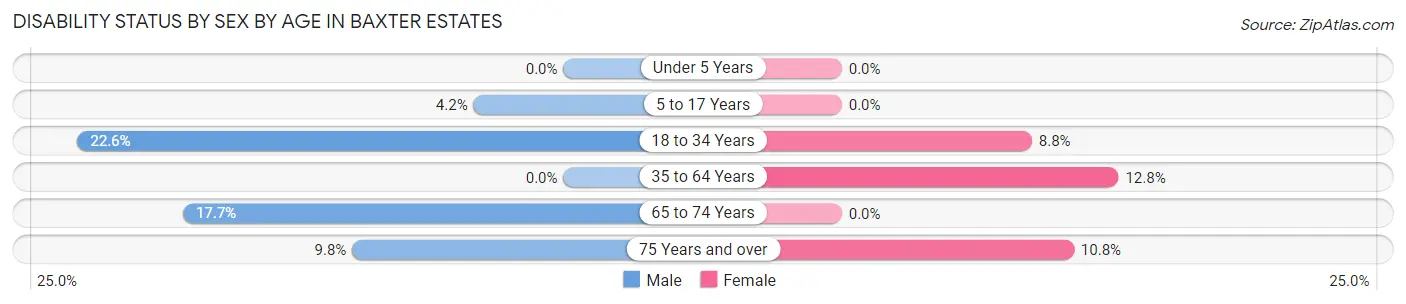
| Age Bracket | Male | Female |
| Under 5 Years | 0 (0.0%) | 0 (0.0%) |
| 5 to 17 Years | 4 (4.2%) | 0 (0.0%) |
| 18 to 34 Years | 23 (22.6%) | 3 (8.8%) |
| 35 to 64 Years | 0 (0.0%) | 33 (12.8%) |
| 65 to 74 Years | 9 (17.6%) | 0 (0.0%) |
| 75 Years and over | 5 (9.8%) | 7 (10.8%) |
Disability Class by Sex by Age in Baxter Estates
Disability Class: Hearing Difficulty
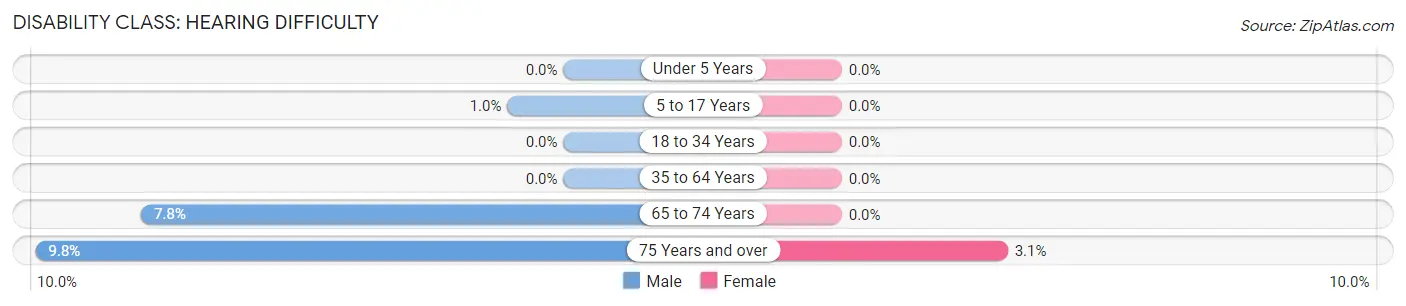
| Age Bracket | Male | Female |
| Under 5 Years | 0 (0.0%) | 0 (0.0%) |
| 5 to 17 Years | 1 (1.0%) | 0 (0.0%) |
| 18 to 34 Years | 0 (0.0%) | 0 (0.0%) |
| 35 to 64 Years | 0 (0.0%) | 0 (0.0%) |
| 65 to 74 Years | 4 (7.8%) | 0 (0.0%) |
| 75 Years and over | 5 (9.8%) | 2 (3.1%) |
Disability Class: Vision Difficulty
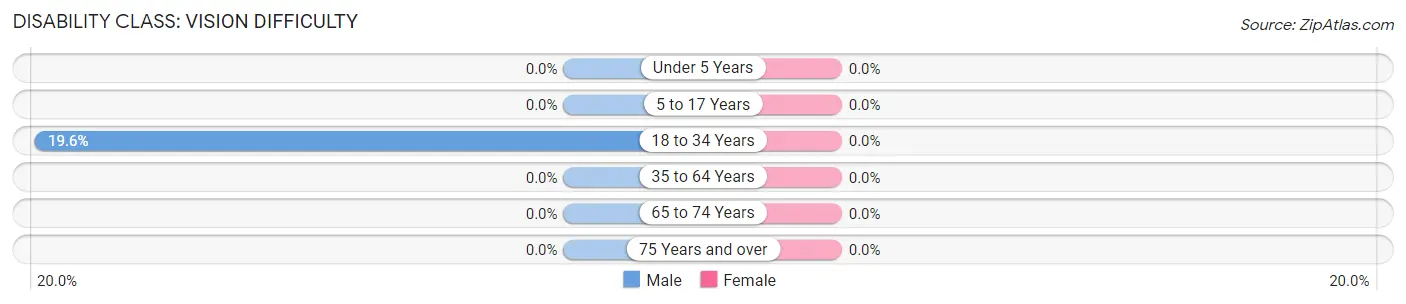
| Age Bracket | Male | Female |
| Under 5 Years | 0 (0.0%) | 0 (0.0%) |
| 5 to 17 Years | 0 (0.0%) | 0 (0.0%) |
| 18 to 34 Years | 20 (19.6%) | 0 (0.0%) |
| 35 to 64 Years | 0 (0.0%) | 0 (0.0%) |
| 65 to 74 Years | 0 (0.0%) | 0 (0.0%) |
| 75 Years and over | 0 (0.0%) | 0 (0.0%) |
Disability Class: Cognitive Difficulty
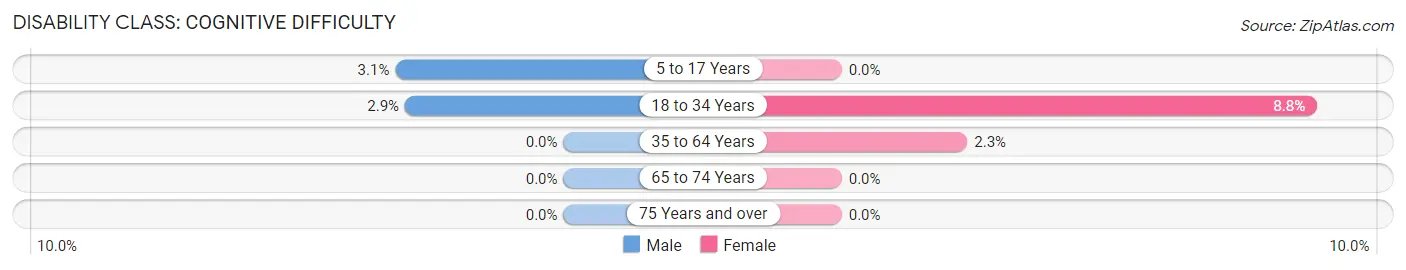
| Age Bracket | Male | Female |
| 5 to 17 Years | 3 (3.1%) | 0 (0.0%) |
| 18 to 34 Years | 3 (2.9%) | 3 (8.8%) |
| 35 to 64 Years | 0 (0.0%) | 6 (2.3%) |
| 65 to 74 Years | 0 (0.0%) | 0 (0.0%) |
| 75 Years and over | 0 (0.0%) | 0 (0.0%) |
Disability Class: Ambulatory Difficulty
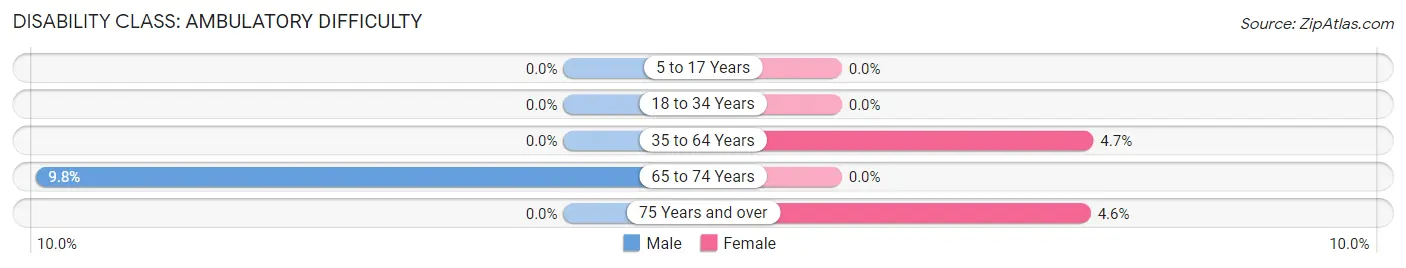
| Age Bracket | Male | Female |
| 5 to 17 Years | 0 (0.0%) | 0 (0.0%) |
| 18 to 34 Years | 0 (0.0%) | 0 (0.0%) |
| 35 to 64 Years | 0 (0.0%) | 12 (4.7%) |
| 65 to 74 Years | 5 (9.8%) | 0 (0.0%) |
| 75 Years and over | 0 (0.0%) | 3 (4.6%) |
Disability Class: Self-Care Difficulty
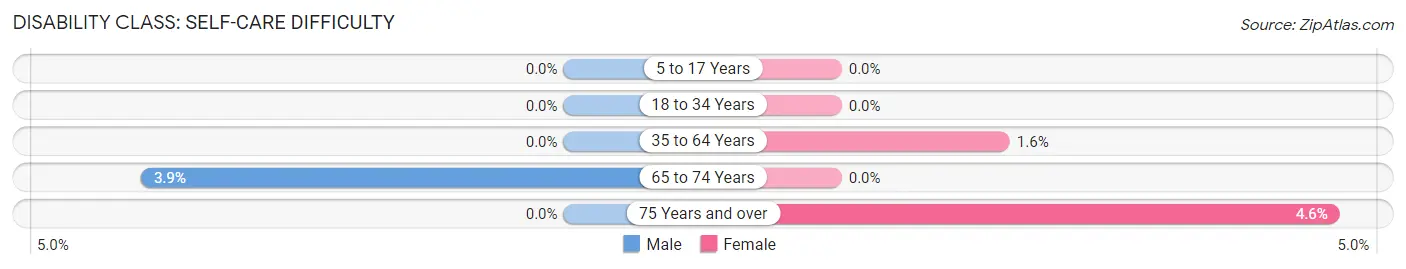
| Age Bracket | Male | Female |
| 5 to 17 Years | 0 (0.0%) | 0 (0.0%) |
| 18 to 34 Years | 0 (0.0%) | 0 (0.0%) |
| 35 to 64 Years | 0 (0.0%) | 4 (1.6%) |
| 65 to 74 Years | 2 (3.9%) | 0 (0.0%) |
| 75 Years and over | 0 (0.0%) | 3 (4.6%) |
Technology Access in Baxter Estates
Computing Device Access in Baxter Estates
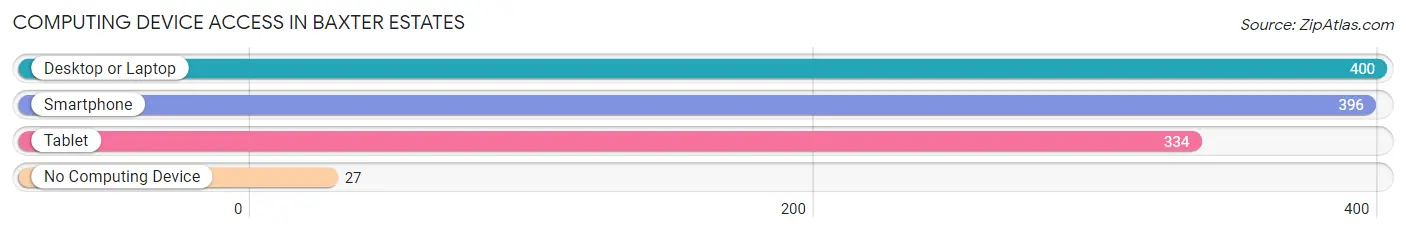
| Device Type | # Households | % Households |
| Desktop or Laptop | 400 | 89.9% |
| Smartphone | 396 | 89.0% |
| Tablet | 334 | 75.1% |
| No Computing Device | 27 | 6.1% |
| Total | 445 | 100.0% |
Internet Access in Baxter Estates
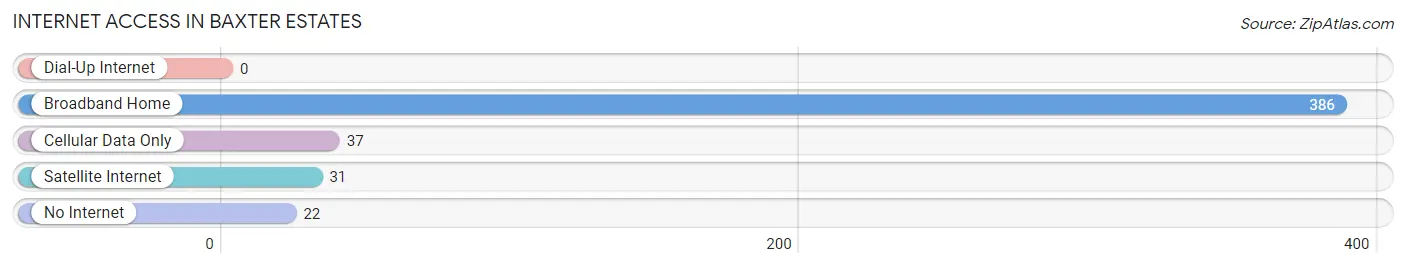
| Internet Type | # Households | % Households |
| Dial-Up Internet | 0 | 0.0% |
| Broadband Home | 386 | 86.7% |
| Cellular Data Only | 37 | 8.3% |
| Satellite Internet | 31 | 7.0% |
| No Internet | 22 | 4.9% |
| Total | 445 | 100.0% |
Baxter Estates Summary
Baxter Estates is a village located in Nassau County, New York, United States. The village is located on the North Shore of Long Island and is part of the Greater New York City metropolitan area. As of the 2010 census, the village had a population of 1,093.
History
The area that is now Baxter Estates was originally inhabited by the Matinecock Native American tribe. The first European settlers arrived in the area in the 1640s, and the village was officially incorporated in 1931. The village was named after James Baxter, who was a prominent local landowner in the late 19th century.
Geography
Baxter Estates is located at 40°51'25" North, 73°41'17" West (40.856944, -73.688056). The village is situated on the North Shore of Long Island, approximately 25 miles east of Manhattan. Baxter Estates is bordered by the villages of Port Washington and Sands Point to the east, and the town of North Hempstead to the south.
The village has a total area of 0.3 square miles, all of which is land. Baxter Estates is located on a peninsula that juts out into Manhasset Bay. The village is home to several parks, including Baxter Estates Park, which features a playground, basketball court, and picnic area.
Economy
The economy of Baxter Estates is largely based on the service industry. The village is home to several restaurants, retail stores, and professional services. The village is also home to several small businesses, including a bakery, a florist, and a pet store.
Demographics
As of the 2010 census, there were 1,093 people, 441 households, and 315 families residing in the village. The population density was 3,633.3 people per square mile. The racial makeup of the village was 94.2% White, 1.2% African American, 0.2% Native American, 2.2% Asian, 0.9% from other races, and 1.3% from two or more races. Hispanic or Latino of any race were 4.2% of the population.
The median income for a household in the village was $117,917, and the median income for a family was $136,250. The per capita income for the village was $63,945. About 1.2% of families and 2.2% of the population were below the poverty line, including 1.2% of those under age 18 and 0.0% of those age 65 or over.
Conclusion
Baxter Estates is a small village located on the North Shore of Long Island. The village has a rich history, and was originally inhabited by the Matinecock Native American tribe. The village has a total area of 0.3 square miles, and is home to several parks and small businesses. As of the 2010 census, the village had a population of 1,093, with a median household income of $117,917. The economy of Baxter Estates is largely based on the service industry, and the village is home to several restaurants, retail stores, and professional services.
Common Questions
What is Per Capita Income in Baxter Estates?
Per Capita income in Baxter Estates is $91,789.
What is the Median Family Income in Baxter Estates?
Median Family Income in Baxter Estates is $216,667.
What is the Median Household income in Baxter Estates?
Median Household Income in Baxter Estates is $172,292.
What is Income or Wage Gap in Baxter Estates?
Income or Wage Gap in Baxter Estates is 7.6%.
Women in Baxter Estates earn 92.4 cents for every dollar earned by a man.
What is Inequality or Gini Index in Baxter Estates?
Inequality or Gini Index in Baxter Estates is 0.46.
What is the Total Population of Baxter Estates?
Total Population of Baxter Estates is 1,148.
What is the Total Male Population of Baxter Estates?
Total Male Population of Baxter Estates is 622.
What is the Total Female Population of Baxter Estates?
Total Female Population of Baxter Estates is 526.
What is the Ratio of Males per 100 Females in Baxter Estates?
There are 118.25 Males per 100 Females in Baxter Estates.
What is the Ratio of Females per 100 Males in Baxter Estates?
There are 84.57 Females per 100 Males in Baxter Estates.
What is the Median Population Age in Baxter Estates?
Median Population Age in Baxter Estates is 41.0 Years.
What is the Average Family Size in Baxter Estates
Average Family Size in Baxter Estates is 3.1 People.
What is the Average Household Size in Baxter Estates
Average Household Size in Baxter Estates is 2.6 People.
How Large is the Labor Force in Baxter Estates?
There are 614 People in the Labor Forcein in Baxter Estates.
What is the Percentage of People in the Labor Force in Baxter Estates?
68.9% of People are in the Labor Force in Baxter Estates.
What is the Unemployment Rate in Baxter Estates?
Unemployment Rate in Baxter Estates is 2.8%.