Santa Cruz County, CA Map & Demographics
Santa Cruz County Overview
$52,887
PER CAPITA INCOME
$127,331
AVG FAMILY INCOME
$104,409
AVG HOUSEHOLD INCOME
35.5%
WAGE / INCOME GAP [ % ]
64.5¢/ $1
WAGE / INCOME GAP [ $ ]
$10,002
FAMILY INCOME DEFICIT
0.48
INEQUALITY / GINI INDEX
268,571
TOTAL POPULATION
134,256
MALE POPULATION
134,315
FEMALE POPULATION
99.96
MALES / 100 FEMALES
100.04
FEMALES / 100 MALES
39.2
MEDIAN AGE
3.1
AVG FAMILY SIZE
2.6
AVG HOUSEHOLD SIZE
142,591
LABOR FORCE [ PEOPLE ]
63.5%
PERCENT IN LABOR FORCE
5.9%
UNEMPLOYMENT RATE
Income in Santa Cruz County
Income Overview in Santa Cruz County
Per Capita Income in Santa Cruz County is $52,887, while median incomes of families and households are $127,331 and $104,409 respectively.
| Characteristic | Number | Measure |
| Per Capita Income | 268,571 | $52,887 |
| Median Family Income | 61,034 | $127,331 |
| Mean Family Income | 61,034 | $169,323 |
| Median Household Income | 96,487 | $104,409 |
| Mean Household Income | 96,487 | $146,532 |
| Income Deficit | 61,034 | $10,002 |
| Wage / Income Gap (%) | 268,571 | 35.49% |
| Wage / Income Gap ($) | 268,571 | 64.51¢ per $1 |
| Gini / Inequality Index | 268,571 | 0.48 |
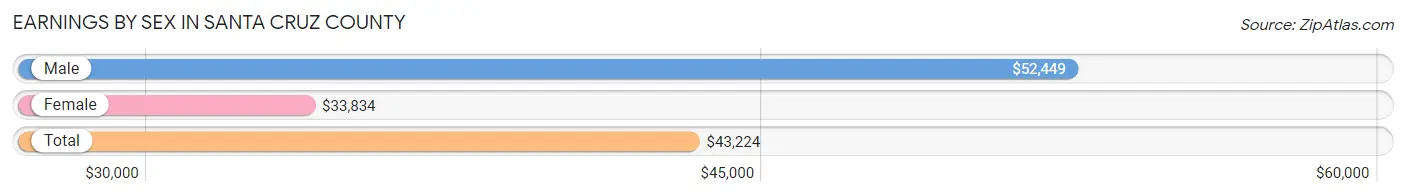
Earnings by Sex in Santa Cruz County
Average Earnings in Santa Cruz County are $43,224, $52,449 for men and $33,834 for women, a difference of 35.5%.
| Sex | Number | Average Earnings |
| Male | 80,625 (52.9%) | $52,449 |
| Female | 71,635 (47.0%) | $33,834 |
| Total | 152,260 (100.0%) | $43,224 |
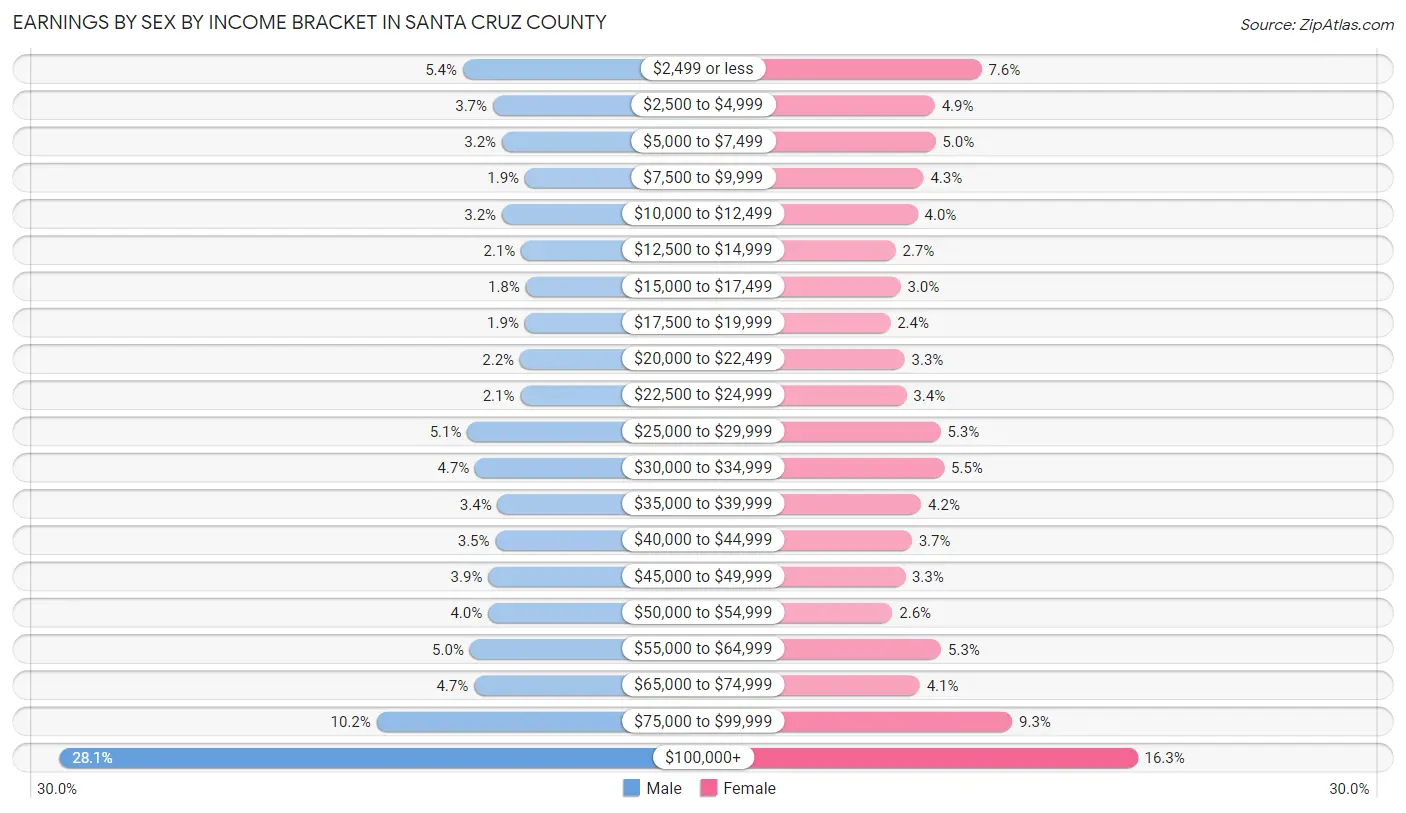
Earnings by Sex by Income Bracket in Santa Cruz County
The most common earnings brackets in Santa Cruz County are $100,000+ for men (22,615 | 28.1%) and $100,000+ for women (11,703 | 16.3%).
| Income | Male | Female |
| $2,499 or less | 4,333 (5.4%) | 5,420 (7.6%) |
| $2,500 to $4,999 | 2,963 (3.7%) | 3,539 (4.9%) |
| $5,000 to $7,499 | 2,554 (3.2%) | 3,569 (5.0%) |
| $7,500 to $9,999 | 1,513 (1.9%) | 3,084 (4.3%) |
| $10,000 to $12,499 | 2,554 (3.2%) | 2,848 (4.0%) |
| $12,500 to $14,999 | 1,684 (2.1%) | 1,963 (2.7%) |
| $15,000 to $17,499 | 1,484 (1.8%) | 2,160 (3.0%) |
| $17,500 to $19,999 | 1,521 (1.9%) | 1,749 (2.4%) |
| $20,000 to $22,499 | 1,741 (2.2%) | 2,331 (3.3%) |
| $22,500 to $24,999 | 1,723 (2.1%) | 2,399 (3.4%) |
| $25,000 to $29,999 | 4,125 (5.1%) | 3,775 (5.3%) |
| $30,000 to $34,999 | 3,773 (4.7%) | 3,921 (5.5%) |
| $35,000 to $39,999 | 2,755 (3.4%) | 2,992 (4.2%) |
| $40,000 to $44,999 | 2,851 (3.5%) | 2,615 (3.6%) |
| $45,000 to $49,999 | 3,175 (3.9%) | 2,343 (3.3%) |
| $50,000 to $54,999 | 3,188 (4.0%) | 1,837 (2.6%) |
| $55,000 to $64,999 | 4,014 (5.0%) | 3,795 (5.3%) |
| $65,000 to $74,999 | 3,819 (4.7%) | 2,938 (4.1%) |
| $75,000 to $99,999 | 8,240 (10.2%) | 6,654 (9.3%) |
| $100,000+ | 22,615 (28.1%) | 11,703 (16.3%) |
| Total | 80,625 (100.0%) | 71,635 (100.0%) |
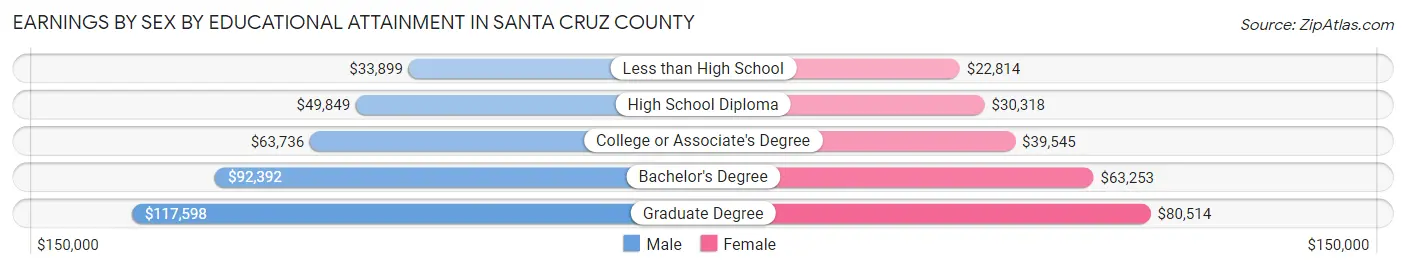
Earnings by Sex by Educational Attainment in Santa Cruz County
Average earnings in Santa Cruz County are $67,871 for men and $45,368 for women, a difference of 33.2%. Men with an educational attainment of graduate degree enjoy the highest average annual earnings of $117,598, while those with less than high school education earn the least with $33,899. Women with an educational attainment of graduate degree earn the most with the average annual earnings of $80,514, while those with less than high school education have the smallest earnings of $22,814.
| Educational Attainment | Male Income | Female Income |
| Less than High School | $33,899 | $22,814 |
| High School Diploma | $49,849 | $30,318 |
| College or Associate's Degree | $63,736 | $39,545 |
| Bachelor's Degree | $92,392 | $63,253 |
| Graduate Degree | $117,598 | $80,514 |
| Total | $67,871 | $45,368 |
Family Income in Santa Cruz County
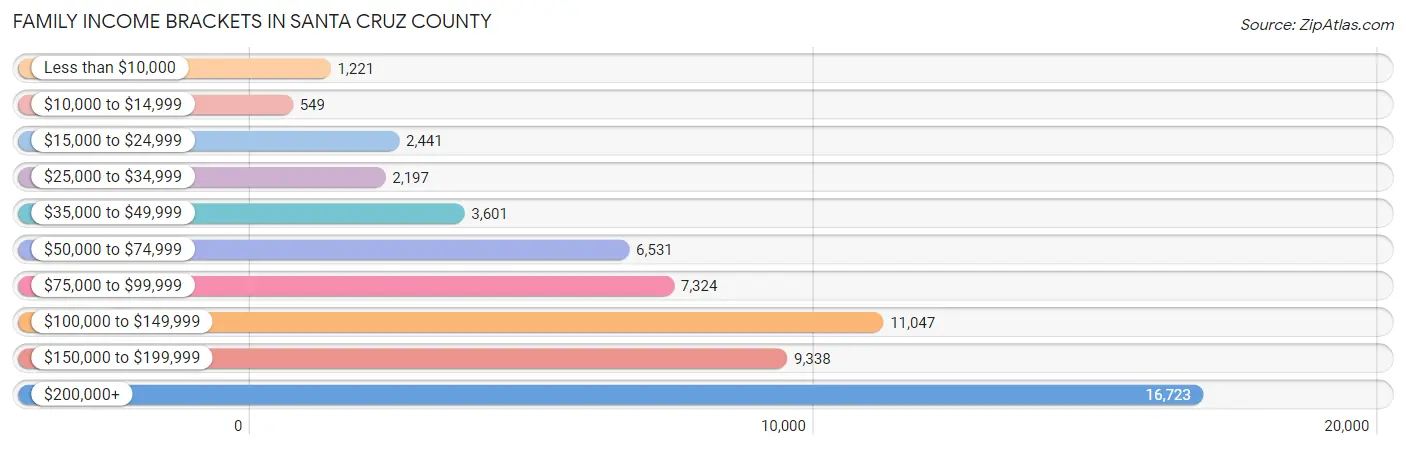
Family Income Brackets in Santa Cruz County
According to the Santa Cruz County family income data, there are 16,723 families falling into the $200,000+ income range, which is the most common income bracket and makes up 27.4% of all families. Conversely, the $10,000 to $14,999 income bracket is the least frequent group with only 549 families (0.9%) belonging to this category.
| Income Bracket | # Families | % Families |
| Less than $10,000 | 1,221 | 2.0% |
| $10,000 to $14,999 | 549 | 0.9% |
| $15,000 to $24,999 | 2,441 | 4.0% |
| $25,000 to $34,999 | 2,197 | 3.6% |
| $35,000 to $49,999 | 3,601 | 5.9% |
| $50,000 to $74,999 | 6,531 | 10.7% |
| $75,000 to $99,999 | 7,324 | 12.0% |
| $100,000 to $149,999 | 11,047 | 18.1% |
| $150,000 to $199,999 | 9,338 | 15.3% |
| $200,000+ | 16,723 | 27.4% |
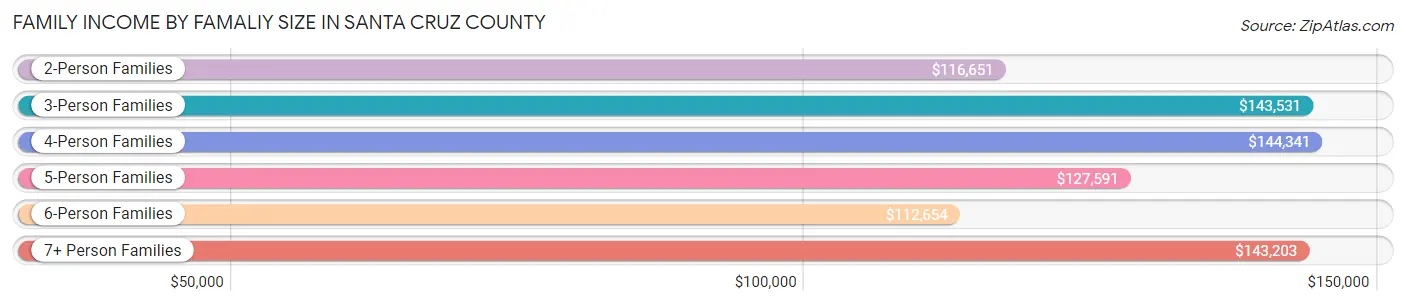
Family Income by Famaliy Size in Santa Cruz County
4-person families (12,287 | 20.1%) account for the highest median family income in Santa Cruz County with $144,341 per family, while 2-person families (28,747 | 47.1%) have the highest median income of $58,326 per family member.
| Income Bracket | # Families | Median Income |
| 2-Person Families | 28,747 (47.1%) | $116,651 |
| 3-Person Families | 12,634 (20.7%) | $143,531 |
| 4-Person Families | 12,287 (20.1%) | $144,341 |
| 5-Person Families | 4,315 (7.1%) | $127,591 |
| 6-Person Families | 1,804 (3.0%) | $112,654 |
| 7+ Person Families | 1,247 (2.0%) | $143,203 |
| Total | 61,034 (100.0%) | $127,331 |
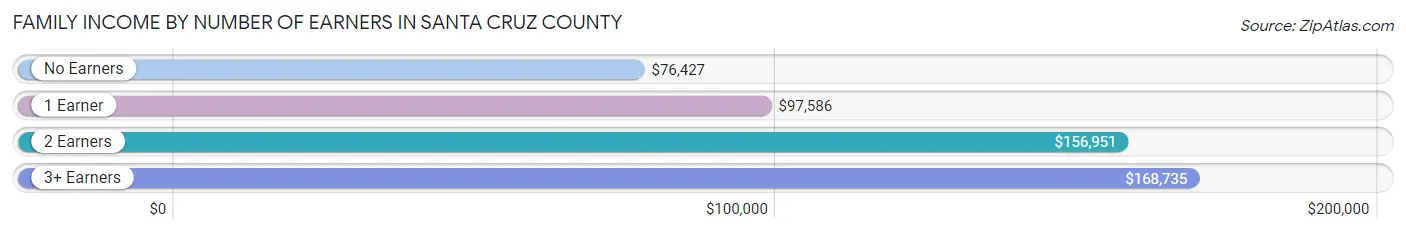
Family Income by Number of Earners in Santa Cruz County
The median family income in Santa Cruz County is $127,331, with families comprising 3+ earners (9,111) having the highest median family income of $168,735, while families with no earners (8,103) have the lowest median family income of $76,427, accounting for 14.9% and 13.3% of families, respectively.
| Number of Earners | # Families | Median Income |
| No Earners | 8,103 (13.3%) | $76,427 |
| 1 Earner | 17,677 (29.0%) | $97,586 |
| 2 Earners | 26,143 (42.8%) | $156,951 |
| 3+ Earners | 9,111 (14.9%) | $168,735 |
| Total | 61,034 (100.0%) | $127,331 |
Household Income in Santa Cruz County
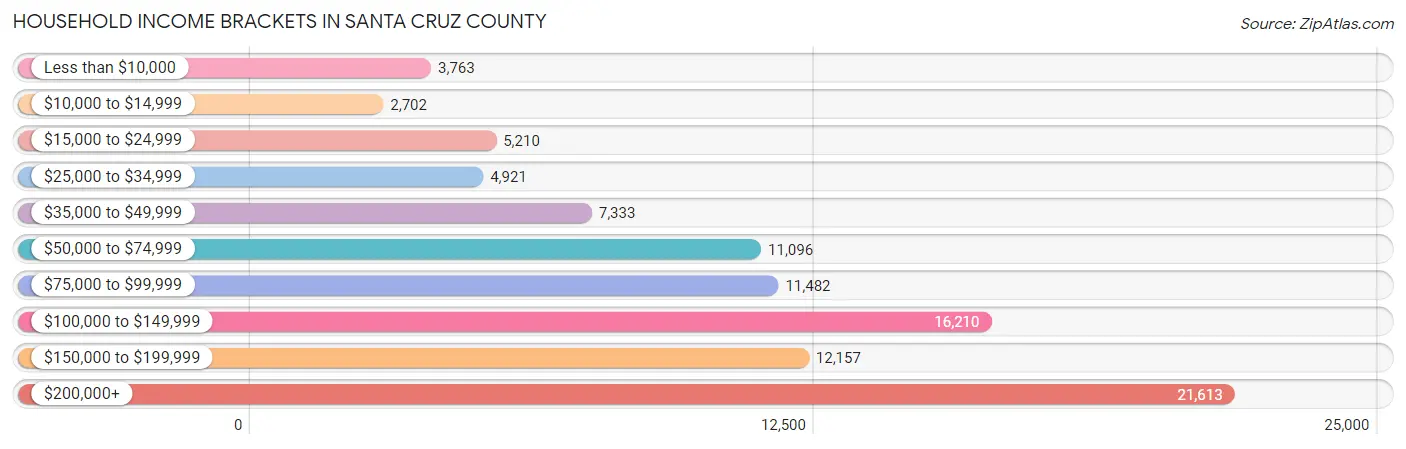
Household Income Brackets in Santa Cruz County
With 21,613 households falling in the category, the $200,000+ income range is the most frequent in Santa Cruz County, accounting for 22.4% of all households. In contrast, only 2,702 households (2.8%) fall into the $10,000 to $14,999 income bracket, making it the least populous group.
| Income Bracket | # Households | % Households |
| Less than $10,000 | 3,763 | 3.9% |
| $10,000 to $14,999 | 2,702 | 2.8% |
| $15,000 to $24,999 | 5,210 | 5.4% |
| $25,000 to $34,999 | 4,921 | 5.1% |
| $35,000 to $49,999 | 7,333 | 7.6% |
| $50,000 to $74,999 | 11,096 | 11.5% |
| $75,000 to $99,999 | 11,482 | 11.9% |
| $100,000 to $149,999 | 16,210 | 16.8% |
| $150,000 to $199,999 | 12,157 | 12.6% |
| $200,000+ | 21,613 | 22.4% |
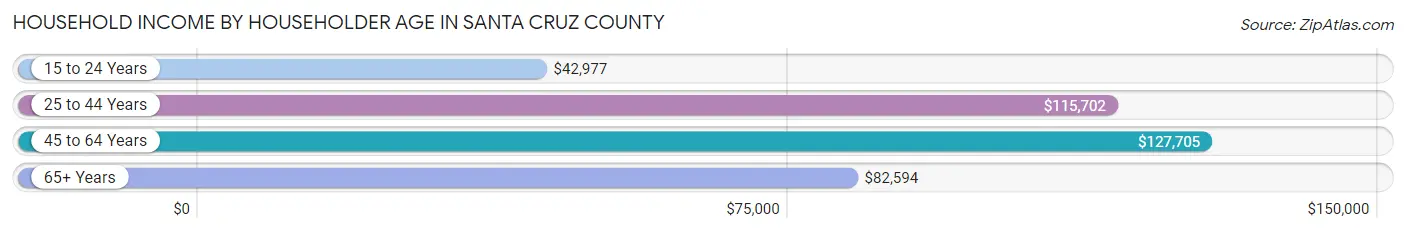
Household Income by Householder Age in Santa Cruz County
The median household income in Santa Cruz County is $104,409, with the highest median household income of $127,705 found in the 45 to 64 years age bracket for the primary householder. A total of 37,146 households (38.5%) fall into this category. Meanwhile, the 15 to 24 years age bracket for the primary householder has the lowest median household income of $42,977, with 4,631 households (4.8%) in this group.
| Income Bracket | # Households | Median Income |
| 15 to 24 Years | 4,631 (4.8%) | $42,977 |
| 25 to 44 Years | 25,040 (26.0%) | $115,702 |
| 45 to 64 Years | 37,146 (38.5%) | $127,705 |
| 65+ Years | 29,670 (30.7%) | $82,594 |
| Total | 96,487 (100.0%) | $104,409 |
Poverty in Santa Cruz County
Income Below Poverty by Sex and Age in Santa Cruz County
With 10.8% poverty level for males and 11.9% for females among the residents of Santa Cruz County, 15 year old males and 18 to 24 year old females are the most vulnerable to poverty, with 423 males (26.0%) and 4,264 females (29.0%) in their respective age groups living below the poverty level.
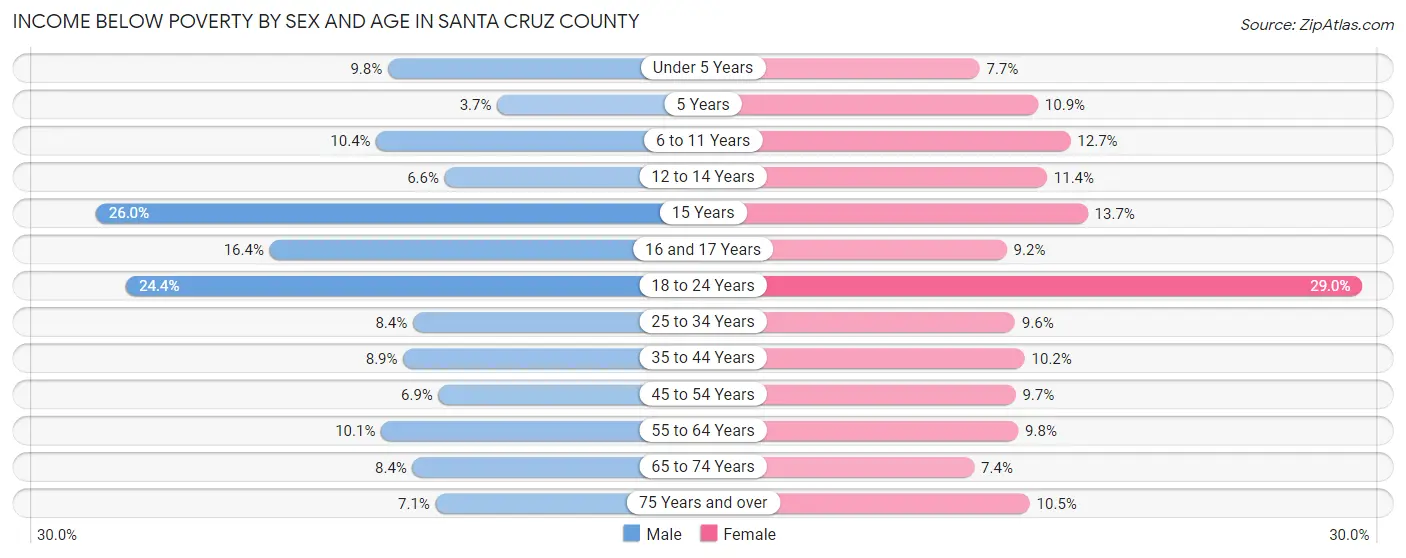
| Age Bracket | Male | Female |
| Under 5 Years | 594 (9.8%) | 454 (7.7%) |
| 5 Years | 36 (3.7%) | 127 (10.9%) |
| 6 to 11 Years | 953 (10.4%) | 1,015 (12.7%) |
| 12 to 14 Years | 272 (6.6%) | 482 (11.4%) |
| 15 Years | 423 (26.0%) | 201 (13.7%) |
| 16 and 17 Years | 508 (16.4%) | 277 (9.2%) |
| 18 to 24 Years | 3,671 (24.3%) | 4,264 (29.0%) |
| 25 to 34 Years | 1,393 (8.4%) | 1,493 (9.6%) |
| 35 to 44 Years | 1,429 (8.9%) | 1,583 (10.2%) |
| 45 to 54 Years | 1,168 (6.9%) | 1,539 (9.7%) |
| 55 to 64 Years | 1,753 (10.1%) | 1,751 (9.8%) |
| 65 to 74 Years | 1,238 (8.4%) | 1,132 (7.4%) |
| 75 Years and over | 512 (7.1%) | 1,034 (10.5%) |
| Total | 13,950 (10.8%) | 15,352 (11.9%) |
Income Above Poverty by Sex and Age in Santa Cruz County
According to the poverty statistics in Santa Cruz County, males aged 5 years and females aged 65 to 74 years are the age groups that are most secure financially, with 96.3% of males and 92.6% of females in these age groups living above the poverty line.
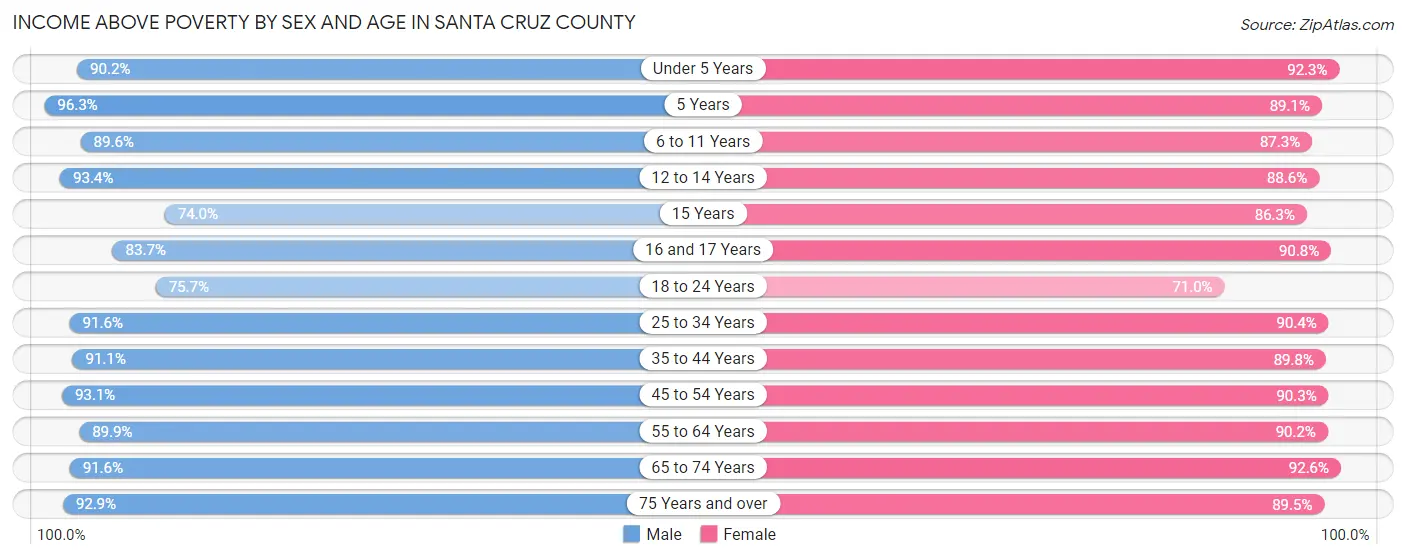
| Age Bracket | Male | Female |
| Under 5 Years | 5,489 (90.2%) | 5,464 (92.3%) |
| 5 Years | 942 (96.3%) | 1,036 (89.1%) |
| 6 to 11 Years | 8,199 (89.6%) | 6,957 (87.3%) |
| 12 to 14 Years | 3,852 (93.4%) | 3,740 (88.6%) |
| 15 Years | 1,202 (74.0%) | 1,267 (86.3%) |
| 16 and 17 Years | 2,599 (83.7%) | 2,741 (90.8%) |
| 18 to 24 Years | 11,402 (75.6%) | 10,451 (71.0%) |
| 25 to 34 Years | 15,245 (91.6%) | 13,995 (90.4%) |
| 35 to 44 Years | 14,602 (91.1%) | 13,972 (89.8%) |
| 45 to 54 Years | 15,674 (93.1%) | 14,382 (90.3%) |
| 55 to 64 Years | 15,529 (89.9%) | 16,086 (90.2%) |
| 65 to 74 Years | 13,514 (91.6%) | 14,230 (92.6%) |
| 75 Years and over | 6,694 (92.9%) | 8,849 (89.5%) |
| Total | 114,943 (89.2%) | 113,170 (88.0%) |
Income Below Poverty Among Married-Couple Families in Santa Cruz County
The poverty statistics for married-couple families in Santa Cruz County show that 3.6% or 1,664 of the total 46,417 families live below the poverty line. Families with 3 or 4 children have the highest poverty rate of 10.2%, comprising of 282 families. On the other hand, families with 5 or more children have the lowest poverty rate of 0.0%, which includes 0 families.
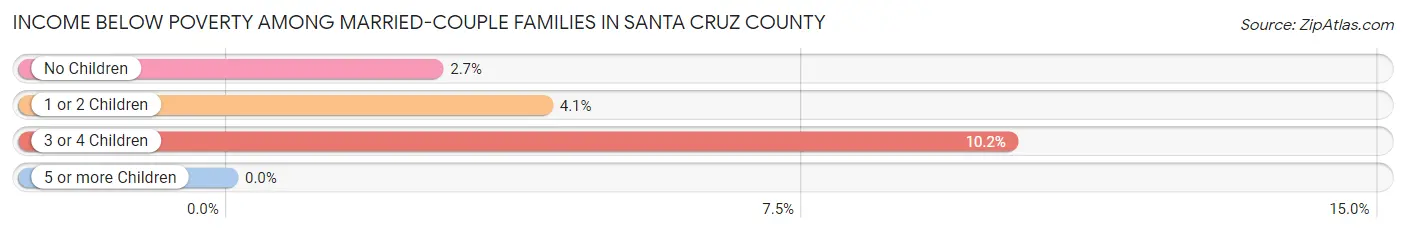
| Children | Above Poverty | Below Poverty |
| No Children | 27,715 (97.3%) | 764 (2.7%) |
| 1 or 2 Children | 14,409 (95.9%) | 618 (4.1%) |
| 3 or 4 Children | 2,488 (89.8%) | 282 (10.2%) |
| 5 or more Children | 141 (100.0%) | 0 (0.0%) |
| Total | 44,753 (96.4%) | 1,664 (3.6%) |
Income Below Poverty Among Single-Parent Households in Santa Cruz County
According to the poverty data in Santa Cruz County, 10.6% or 488 single-father households and 16.2% or 1,622 single-mother households are living below the poverty line. Among single-father households, those with 1 or 2 children have the highest poverty rate, with 230 households (12.0%) experiencing poverty. Likewise, among single-mother households, those with 5 or more children have the highest poverty rate, with 49 households (50.5%) falling below the poverty line.
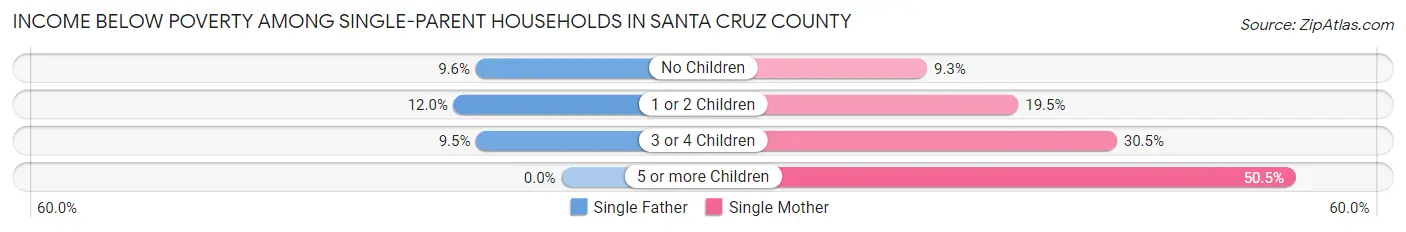
| Children | Single Father | Single Mother |
| No Children | 210 (9.6%) | 408 (9.3%) |
| 1 or 2 Children | 230 (12.0%) | 930 (19.5%) |
| 3 or 4 Children | 48 (9.5%) | 235 (30.5%) |
| 5 or more Children | 0 (0.0%) | 49 (50.5%) |
| Total | 488 (10.6%) | 1,622 (16.2%) |
Income Below Poverty Among Married-Couple vs Single-Parent Households in Santa Cruz County
The poverty data for Santa Cruz County shows that 1,664 of the married-couple family households (3.6%) and 2,110 of the single-parent households (14.4%) are living below the poverty level. Within the married-couple family households, those with 3 or 4 children have the highest poverty rate, with 282 households (10.2%) falling below the poverty line. Among the single-parent households, those with 5 or more children have the highest poverty rate, with 49 household (50.5%) living below poverty.
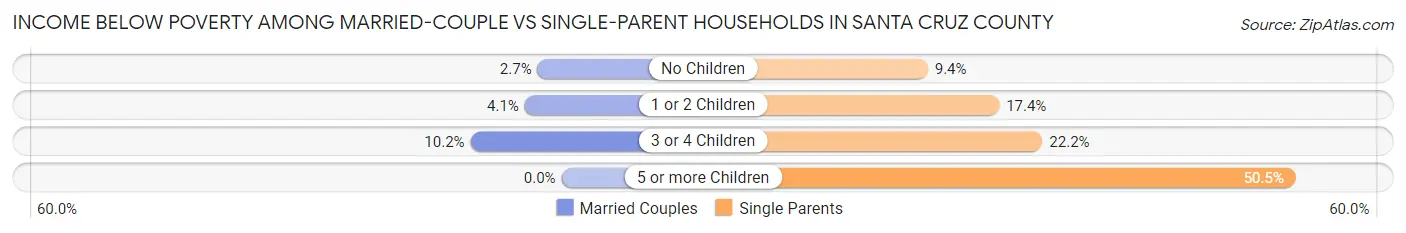
| Children | Married-Couple Families | Single-Parent Households |
| No Children | 764 (2.7%) | 618 (9.4%) |
| 1 or 2 Children | 618 (4.1%) | 1,160 (17.4%) |
| 3 or 4 Children | 282 (10.2%) | 283 (22.2%) |
| 5 or more Children | 0 (0.0%) | 49 (50.5%) |
| Total | 1,664 (3.6%) | 2,110 (14.4%) |
Race in Santa Cruz County
The most populous races in Santa Cruz County are White / Caucasian (176,572 | 65.7%), Hispanic or Latino (91,923 | 34.2%), and Some other Race (40,948 | 15.2%).
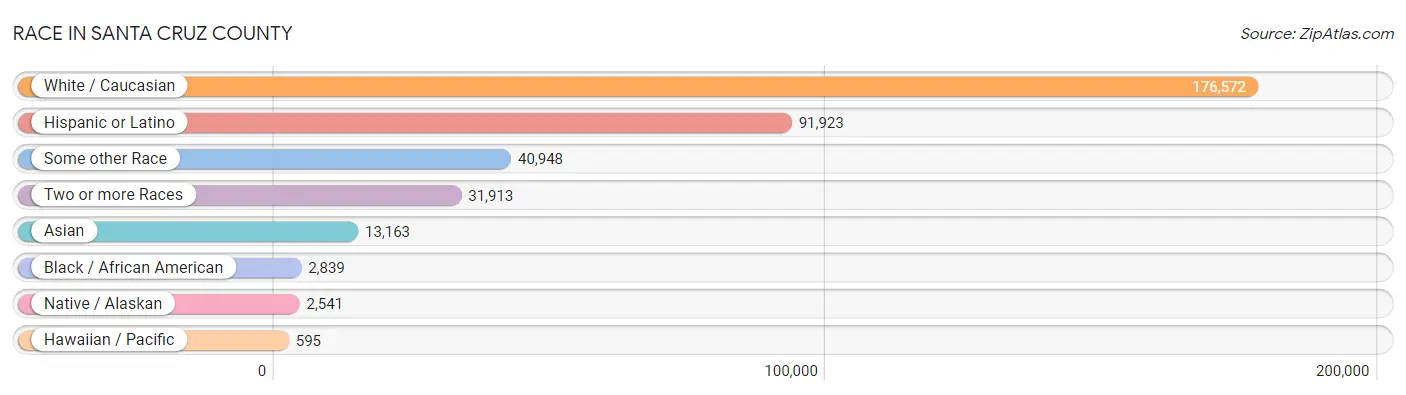
| Race | # Population | % Population |
| Asian | 13,163 | 4.9% |
| Black / African American | 2,839 | 1.1% |
| Hawaiian / Pacific | 595 | 0.2% |
| Hispanic or Latino | 91,923 | 34.2% |
| Native / Alaskan | 2,541 | 0.9% |
| White / Caucasian | 176,572 | 65.7% |
| Two or more Races | 31,913 | 11.9% |
| Some other Race | 40,948 | 15.2% |
| Total | 268,571 | 100.0% |
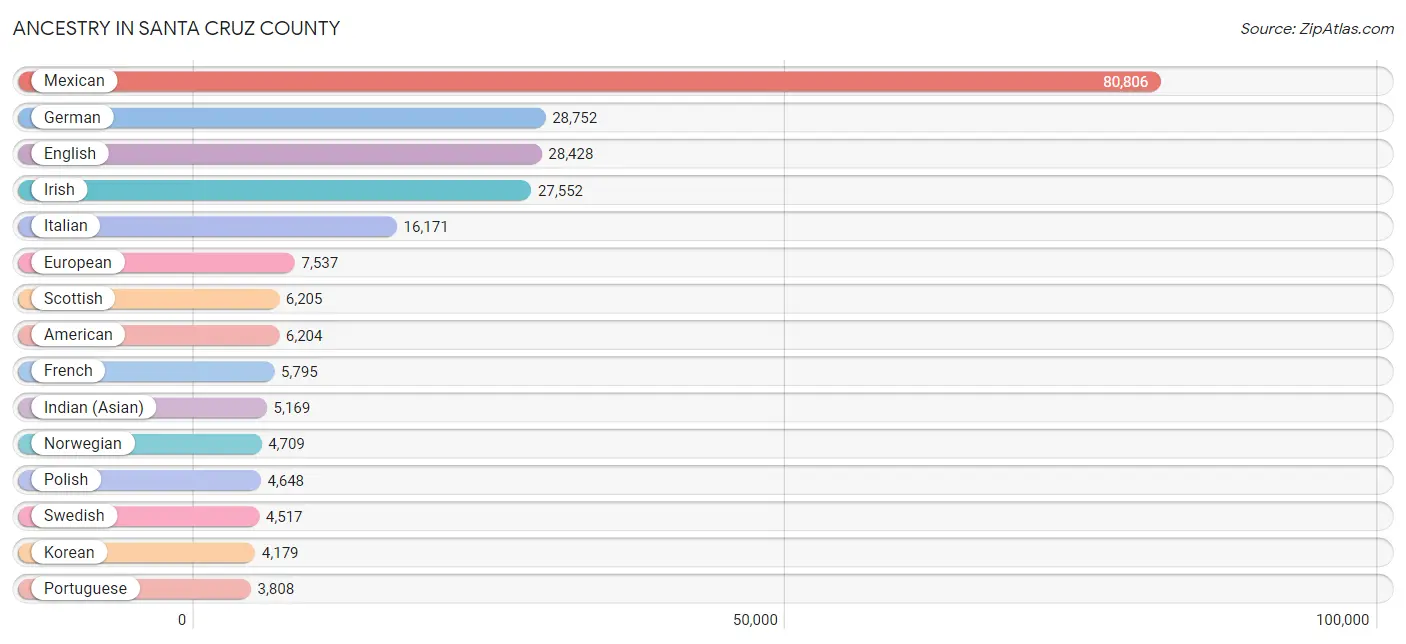
Ancestry in Santa Cruz County
The most populous ancestries reported in Santa Cruz County are Mexican (80,806 | 30.1%), German (28,752 | 10.7%), English (28,428 | 10.6%), Irish (27,552 | 10.3%), and Italian (16,171 | 6.0%), together accounting for 67.7% of all Santa Cruz County residents.
| Ancestry | # Population | % Population |
| Afghan | 150 | 0.1% |
| African | 572 | 0.2% |
| Alaska Native | 7 | 0.0% |
| Albanian | 27 | 0.0% |
| Alsatian | 40 | 0.0% |
| American | 6,204 | 2.3% |
| Apache | 171 | 0.1% |
| Arab | 1,719 | 0.6% |
| Argentinean | 251 | 0.1% |
| Armenian | 571 | 0.2% |
| Assyrian / Chaldean / Syriac | 72 | 0.0% |
| Australian | 125 | 0.1% |
| Austrian | 820 | 0.3% |
| Bangladeshi | 105 | 0.0% |
| Barbadian | 42 | 0.0% |
| Basque | 94 | 0.0% |
| Belgian | 348 | 0.1% |
| Belizean | 66 | 0.0% |
| Bhutanese | 3,233 | 1.2% |
| Blackfeet | 184 | 0.1% |
| Bolivian | 17 | 0.0% |
| Brazilian | 408 | 0.2% |
| British | 2,926 | 1.1% |
| British West Indian | 22 | 0.0% |
| Bulgarian | 11 | 0.0% |
| Burmese | 1,263 | 0.5% |
| Cajun | 59 | 0.0% |
| Cambodian | 20 | 0.0% |
| Canadian | 572 | 0.2% |
| Celtic | 120 | 0.0% |
| Central American | 3,264 | 1.2% |
| Central American Indian | 417 | 0.2% |
| Cherokee | 1,157 | 0.4% |
| Chickasaw | 78 | 0.0% |
| Chilean | 196 | 0.1% |
| Chippewa | 155 | 0.1% |
| Choctaw | 231 | 0.1% |
| Colombian | 222 | 0.1% |
| Comanche | 73 | 0.0% |
| Costa Rican | 120 | 0.0% |
| Cree | 3 | 0.0% |
| Creek | 9 | 0.0% |
| Croatian | 881 | 0.3% |
| Cuban | 690 | 0.3% |
| Czech | 1,562 | 0.6% |
| Czechoslovakian | 71 | 0.0% |
| Danish | 2,217 | 0.8% |
| Dominican | 56 | 0.0% |
| Dutch | 3,732 | 1.4% |
| Dutch West Indian | 20 | 0.0% |
| Eastern European | 1,109 | 0.4% |
| Ecuadorian | 114 | 0.0% |
| Egyptian | 85 | 0.0% |
| English | 28,428 | 10.6% |
| Estonian | 117 | 0.0% |
| Ethiopian | 72 | 0.0% |
| European | 7,537 | 2.8% |
| Filipino | 347 | 0.1% |
| Finnish | 611 | 0.2% |
| French | 5,795 | 2.2% |
| French American Indian | 98 | 0.0% |
| French Canadian | 1,197 | 0.4% |
| German | 28,752 | 10.7% |
| German Russian | 22 | 0.0% |
| Greek | 1,061 | 0.4% |
| Guamanian / Chamorro | 53 | 0.0% |
| Guatemalan | 582 | 0.2% |
| Haitian | 8 | 0.0% |
| Honduran | 147 | 0.1% |
| Hungarian | 849 | 0.3% |
| Icelander | 220 | 0.1% |
| Indian (Asian) | 5,169 | 1.9% |
| Indonesian | 3 | 0.0% |
| Inupiat | 44 | 0.0% |
| Iranian | 760 | 0.3% |
| Iraqi | 67 | 0.0% |
| Irish | 27,552 | 10.3% |
| Iroquois | 32 | 0.0% |
| Israeli | 183 | 0.1% |
| Italian | 16,171 | 6.0% |
| Jamaican | 116 | 0.0% |
| Japanese | 211 | 0.1% |
| Kenyan | 30 | 0.0% |
| Korean | 4,179 | 1.6% |
| Laotian | 74 | 0.0% |
| Latvian | 96 | 0.0% |
| Lebanese | 571 | 0.2% |
| Lithuanian | 644 | 0.2% |
| Lumbee | 3 | 0.0% |
| Luxembourger | 126 | 0.1% |
| Macedonian | 143 | 0.1% |
| Malaysian | 47 | 0.0% |
| Maltese | 23 | 0.0% |
| Menominee | 20 | 0.0% |
| Mexican | 80,806 | 30.1% |
| Mexican American Indian | 1,457 | 0.5% |
| Mongolian | 74 | 0.0% |
| Moroccan | 44 | 0.0% |
| Native Hawaiian | 558 | 0.2% |
| Navajo | 137 | 0.1% |
| New Zealander | 15 | 0.0% |
| Nicaraguan | 370 | 0.1% |
| Nigerian | 43 | 0.0% |
| Northern European | 1,376 | 0.5% |
| Norwegian | 4,709 | 1.8% |
| Okinawan | 4 | 0.0% |
| Osage | 2 | 0.0% |
| Paiute | 51 | 0.0% |
| Pakistani | 335 | 0.1% |
| Palestinian | 136 | 0.1% |
| Panamanian | 174 | 0.1% |
| Pennsylvania German | 33 | 0.0% |
| Peruvian | 466 | 0.2% |
| Pima | 5 | 0.0% |
| Polish | 4,648 | 1.7% |
| Portuguese | 3,808 | 1.4% |
| Pueblo | 71 | 0.0% |
| Puerto Rican | 1,029 | 0.4% |
| Romanian | 376 | 0.1% |
| Russian | 3,212 | 1.2% |
| Salvadoran | 1,817 | 0.7% |
| Samoan | 240 | 0.1% |
| Scandinavian | 935 | 0.4% |
| Scotch-Irish | 2,604 | 1.0% |
| Scottish | 6,205 | 2.3% |
| Seminole | 31 | 0.0% |
| Serbian | 252 | 0.1% |
| Shoshone | 23 | 0.0% |
| Sierra Leonean | 11 | 0.0% |
| Sioux | 165 | 0.1% |
| Slavic | 107 | 0.0% |
| Slovak | 245 | 0.1% |
| Slovene | 166 | 0.1% |
| South African | 62 | 0.0% |
| South American | 1,447 | 0.5% |
| South American Indian | 32 | 0.0% |
| Spaniard | 1,241 | 0.5% |
| Spanish | 1,084 | 0.4% |
| Spanish American | 37 | 0.0% |
| Spanish American Indian | 9 | 0.0% |
| Sri Lankan | 1,018 | 0.4% |
| Subsaharan African | 866 | 0.3% |
| Swedish | 4,517 | 1.7% |
| Swiss | 1,072 | 0.4% |
| Syrian | 383 | 0.1% |
| Thai | 2,465 | 0.9% |
| Tlingit-Haida | 90 | 0.0% |
| Tongan | 133 | 0.1% |
| Trinidadian and Tobagonian | 29 | 0.0% |
| Turkish | 434 | 0.2% |
| Ugandan | 21 | 0.0% |
| Ukrainian | 824 | 0.3% |
| Uruguayan | 26 | 0.0% |
| Ute | 20 | 0.0% |
| Venezuelan | 155 | 0.1% |
| Vietnamese | 28 | 0.0% |
| Welsh | 2,070 | 0.8% |
| West Indian | 150 | 0.1% |
| Yaqui | 118 | 0.0% |
| Yugoslavian | 129 | 0.1% | View All 160 Rows |
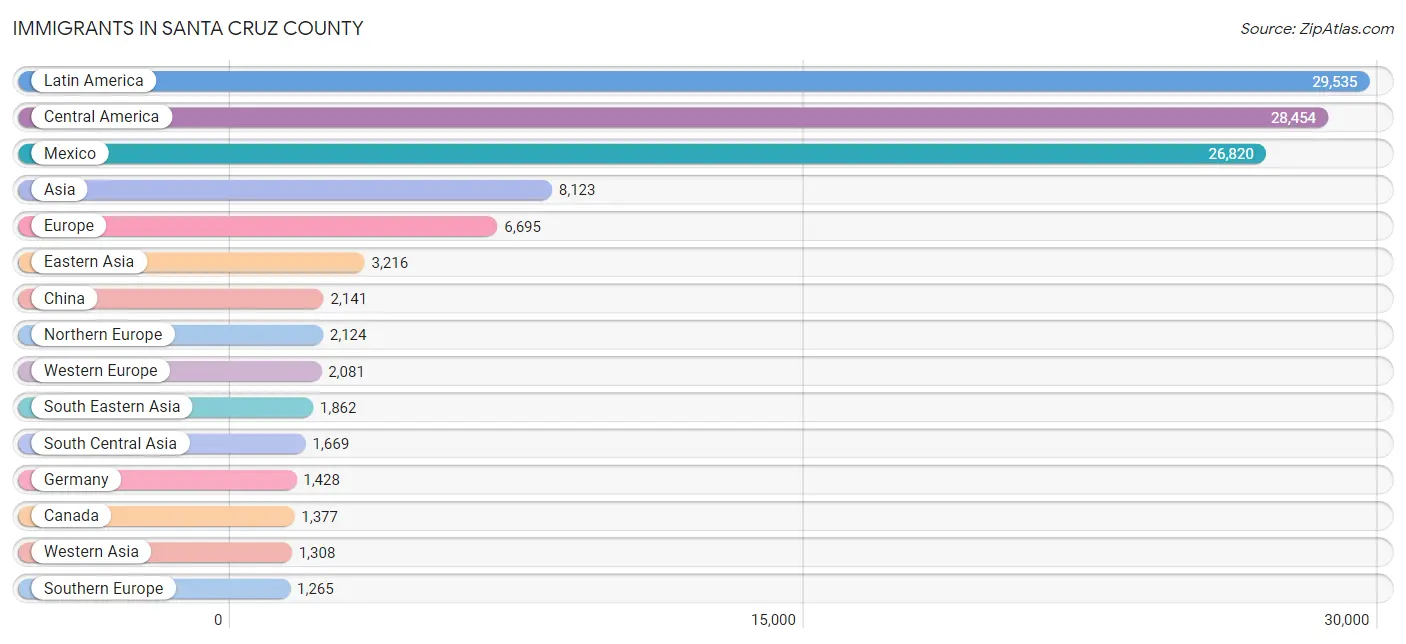
Immigrants in Santa Cruz County
The most numerous immigrant groups reported in Santa Cruz County came from Latin America (29,535 | 11.0%), Central America (28,454 | 10.6%), Mexico (26,820 | 10.0%), Asia (8,123 | 3.0%), and Europe (6,695 | 2.5%), together accounting for 37.1% of all Santa Cruz County residents.
| Immigration Origin | # Population | % Population |
| Afghanistan | 41 | 0.0% |
| Africa | 497 | 0.2% |
| Argentina | 105 | 0.0% |
| Armenia | 60 | 0.0% |
| Asia | 8,123 | 3.0% |
| Australia | 172 | 0.1% |
| Austria | 32 | 0.0% |
| Azores | 126 | 0.1% |
| Bangladesh | 6 | 0.0% |
| Barbados | 12 | 0.0% |
| Belarus | 98 | 0.0% |
| Belgium | 34 | 0.0% |
| Belize | 45 | 0.0% |
| Bolivia | 18 | 0.0% |
| Brazil | 297 | 0.1% |
| Bulgaria | 19 | 0.0% |
| Cambodia | 94 | 0.0% |
| Cameroon | 1 | 0.0% |
| Canada | 1,377 | 0.5% |
| Caribbean | 90 | 0.0% |
| Central America | 28,454 | 10.6% |
| Chile | 83 | 0.0% |
| China | 2,141 | 0.8% |
| Colombia | 69 | 0.0% |
| Costa Rica | 89 | 0.0% |
| Croatia | 109 | 0.0% |
| Cuba | 58 | 0.0% |
| Czechoslovakia | 149 | 0.1% |
| Denmark | 58 | 0.0% |
| Dominica | 13 | 0.0% |
| Eastern Africa | 200 | 0.1% |
| Eastern Asia | 3,216 | 1.2% |
| Eastern Europe | 1,200 | 0.4% |
| Ecuador | 29 | 0.0% |
| Egypt | 46 | 0.0% |
| El Salvador | 773 | 0.3% |
| England | 673 | 0.3% |
| Ethiopia | 33 | 0.0% |
| Europe | 6,695 | 2.5% |
| Fiji | 10 | 0.0% |
| France | 240 | 0.1% |
| Germany | 1,428 | 0.5% |
| Greece | 17 | 0.0% |
| Guatemala | 442 | 0.2% |
| Guyana | 36 | 0.0% |
| Honduras | 83 | 0.0% |
| Hong Kong | 103 | 0.0% |
| Hungary | 69 | 0.0% |
| India | 975 | 0.4% |
| Indonesia | 48 | 0.0% |
| Iran | 468 | 0.2% |
| Iraq | 110 | 0.0% |
| Ireland | 93 | 0.0% |
| Israel | 177 | 0.1% |
| Italy | 433 | 0.2% |
| Japan | 529 | 0.2% |
| Kazakhstan | 10 | 0.0% |
| Kenya | 70 | 0.0% |
| Korea | 546 | 0.2% |
| Laos | 10 | 0.0% |
| Latin America | 29,535 | 11.0% |
| Latvia | 9 | 0.0% |
| Lebanon | 270 | 0.1% |
| Lithuania | 2 | 0.0% |
| Malaysia | 89 | 0.0% |
| Mexico | 26,820 | 10.0% |
| Middle Africa | 1 | 0.0% |
| Moldova | 38 | 0.0% |
| Morocco | 7 | 0.0% |
| Nepal | 64 | 0.0% |
| Netherlands | 298 | 0.1% |
| Nicaragua | 131 | 0.1% |
| Nigeria | 13 | 0.0% |
| Northern Africa | 86 | 0.0% |
| Northern Europe | 2,124 | 0.8% |
| Norway | 35 | 0.0% |
| Oceania | 496 | 0.2% |
| Pakistan | 47 | 0.0% |
| Panama | 71 | 0.0% |
| Peru | 245 | 0.1% |
| Philippines | 1,132 | 0.4% |
| Poland | 147 | 0.1% |
| Portugal | 778 | 0.3% |
| Romania | 67 | 0.0% |
| Russia | 208 | 0.1% |
| Saudi Arabia | 16 | 0.0% |
| Scotland | 120 | 0.0% |
| Senegal | 19 | 0.0% |
| Serbia | 63 | 0.0% |
| Sierra Leone | 11 | 0.0% |
| Singapore | 52 | 0.0% |
| South Africa | 167 | 0.1% |
| South America | 991 | 0.4% |
| South Central Asia | 1,669 | 0.6% |
| South Eastern Asia | 1,862 | 0.7% |
| Southern Europe | 1,265 | 0.5% |
| Spain | 37 | 0.0% |
| Sri Lanka | 38 | 0.0% |
| Sudan | 3 | 0.0% |
| Sweden | 93 | 0.0% |
| Switzerland | 49 | 0.0% |
| Syria | 322 | 0.1% |
| Taiwan | 342 | 0.1% |
| Thailand | 151 | 0.1% |
| Trinidad and Tobago | 7 | 0.0% |
| Turkey | 205 | 0.1% |
| Uganda | 15 | 0.0% |
| Ukraine | 34 | 0.0% |
| Uruguay | 26 | 0.0% |
| Uzbekistan | 20 | 0.0% |
| Venezuela | 83 | 0.0% |
| Vietnam | 286 | 0.1% |
| Western Africa | 43 | 0.0% |
| Western Asia | 1,308 | 0.5% |
| Western Europe | 2,081 | 0.8% |
| Yemen | 70 | 0.0% |
| Zimbabwe | 36 | 0.0% | View All 117 Rows |
Sex and Age in Santa Cruz County
Sex and Age in Santa Cruz County
The most populous age groups in Santa Cruz County are 20 to 24 Years (12,973 | 9.7%) for men and 20 to 24 Years (12,741 | 9.5%) for women.
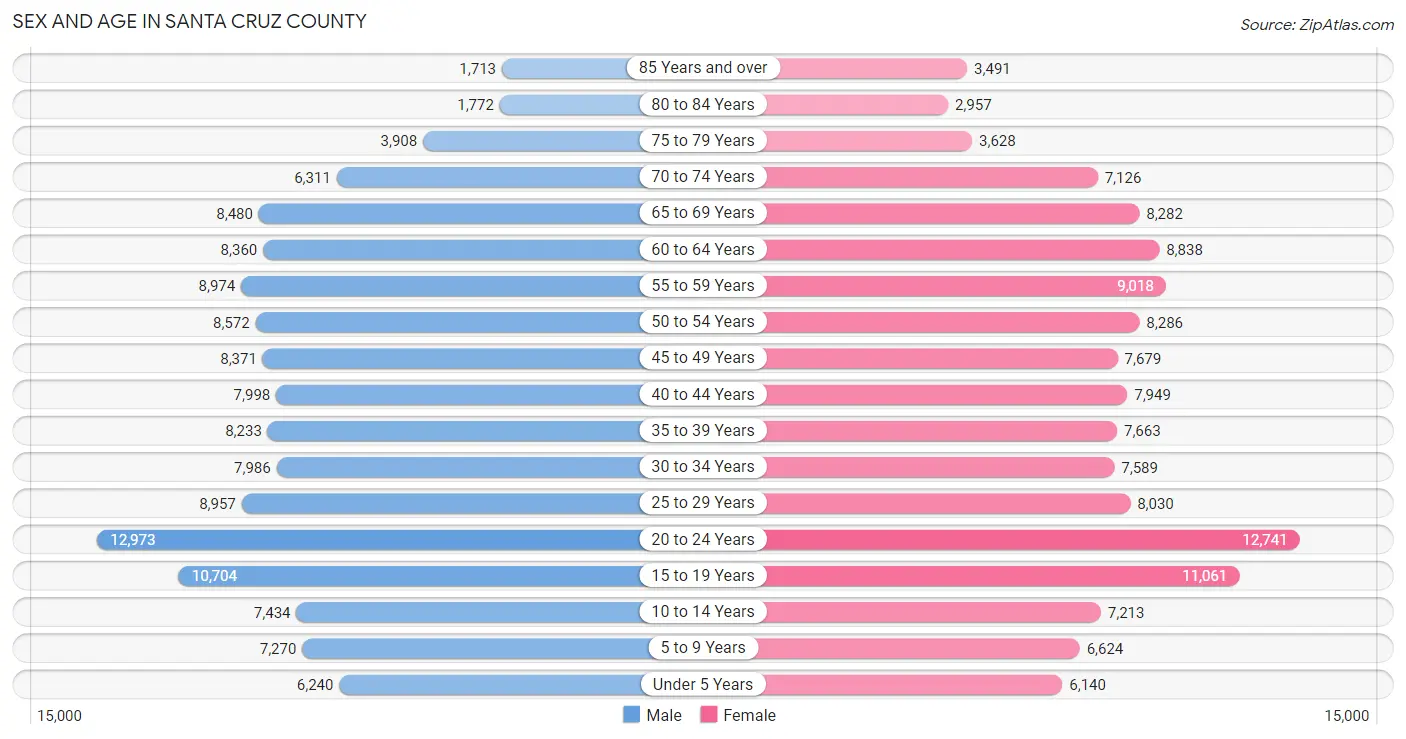
| Age Bracket | Male | Female |
| Under 5 Years | 6,240 (4.6%) | 6,140 (4.6%) |
| 5 to 9 Years | 7,270 (5.4%) | 6,624 (4.9%) |
| 10 to 14 Years | 7,434 (5.5%) | 7,213 (5.4%) |
| 15 to 19 Years | 10,704 (8.0%) | 11,061 (8.2%) |
| 20 to 24 Years | 12,973 (9.7%) | 12,741 (9.5%) |
| 25 to 29 Years | 8,957 (6.7%) | 8,030 (6.0%) |
| 30 to 34 Years | 7,986 (5.9%) | 7,589 (5.7%) |
| 35 to 39 Years | 8,233 (6.1%) | 7,663 (5.7%) |
| 40 to 44 Years | 7,998 (6.0%) | 7,949 (5.9%) |
| 45 to 49 Years | 8,371 (6.2%) | 7,679 (5.7%) |
| 50 to 54 Years | 8,572 (6.4%) | 8,286 (6.2%) |
| 55 to 59 Years | 8,974 (6.7%) | 9,018 (6.7%) |
| 60 to 64 Years | 8,360 (6.2%) | 8,838 (6.6%) |
| 65 to 69 Years | 8,480 (6.3%) | 8,282 (6.2%) |
| 70 to 74 Years | 6,311 (4.7%) | 7,126 (5.3%) |
| 75 to 79 Years | 3,908 (2.9%) | 3,628 (2.7%) |
| 80 to 84 Years | 1,772 (1.3%) | 2,957 (2.2%) |
| 85 Years and over | 1,713 (1.3%) | 3,491 (2.6%) |
| Total | 134,256 (100.0%) | 134,315 (100.0%) |
Families and Households in Santa Cruz County
Median Family Size in Santa Cruz County
The median family size in Santa Cruz County is 3.15 persons per family, with single female/mother families (10,012 | 16.4%) accounting for the largest median family size of 3.18 persons per family. On the other hand, single male/father families (4,605 | 7.5%) represent the smallest median family size with 3.06 persons per family.
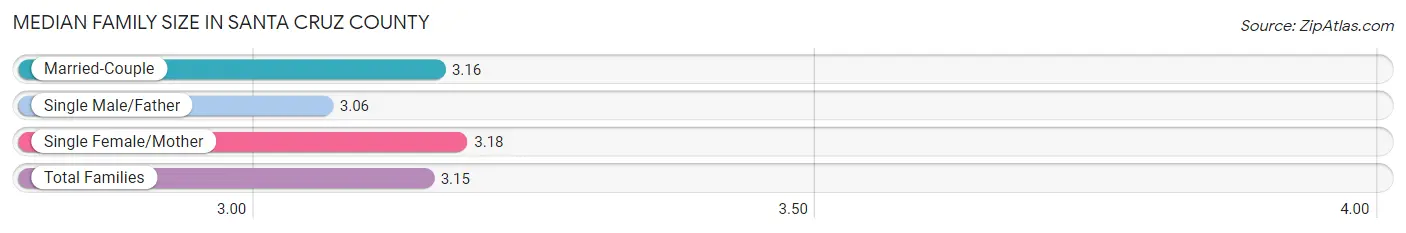
| Family Type | # Families | Family Size |
| Married-Couple | 46,417 (76.0%) | 3.16 |
| Single Male/Father | 4,605 (7.5%) | 3.06 |
| Single Female/Mother | 10,012 (16.4%) | 3.18 |
| Total Families | 61,034 (100.0%) | 3.15 |
Median Household Size in Santa Cruz County
The median household size in Santa Cruz County is 2.64 persons per household, with single male/father households (4,605 | 4.8%) accounting for the largest median household size of 3.67 persons per household. non-family households (35,453 | 36.7%) represent the smallest median household size with 1.49 persons per household.
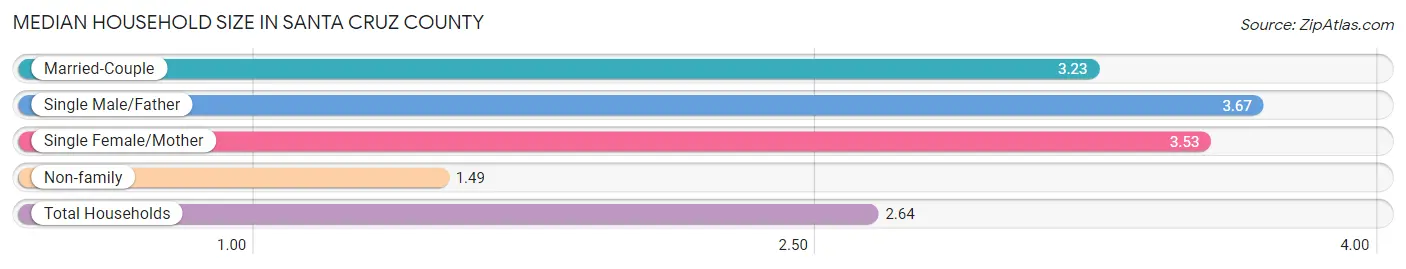
| Household Type | # Households | Household Size |
| Married-Couple | 46,417 (48.1%) | 3.23 |
| Single Male/Father | 4,605 (4.8%) | 3.67 |
| Single Female/Mother | 10,012 (10.4%) | 3.53 |
| Non-family | 35,453 (36.7%) | 1.49 |
| Total Households | 96,487 (100.0%) | 2.64 |
Household Size by Marriage Status in Santa Cruz County
Out of a total of 96,487 households in Santa Cruz County, 61,034 (63.3%) are family households, while 35,453 (36.7%) are nonfamily households. The most numerous type of family households are 2-person households, comprising 25,865, and the most common type of nonfamily households are 1-person households, comprising 23,748.
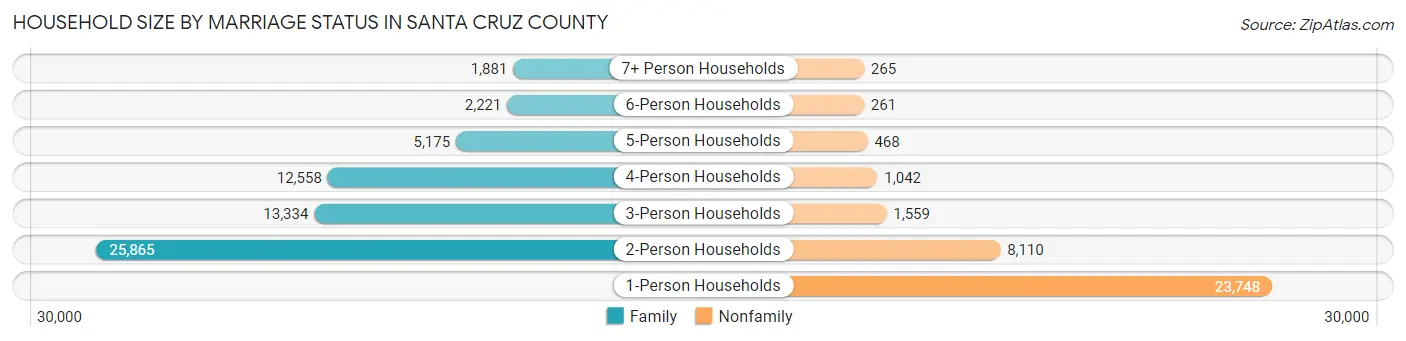
| Household Size | Family Households | Nonfamily Households |
| 1-Person Households | - | 23,748 (24.6%) |
| 2-Person Households | 25,865 (26.8%) | 8,110 (8.4%) |
| 3-Person Households | 13,334 (13.8%) | 1,559 (1.6%) |
| 4-Person Households | 12,558 (13.0%) | 1,042 (1.1%) |
| 5-Person Households | 5,175 (5.4%) | 468 (0.5%) |
| 6-Person Households | 2,221 (2.3%) | 261 (0.3%) |
| 7+ Person Households | 1,881 (1.9%) | 265 (0.3%) |
| Total | 61,034 (63.3%) | 35,453 (36.7%) |
Female Fertility in Santa Cruz County
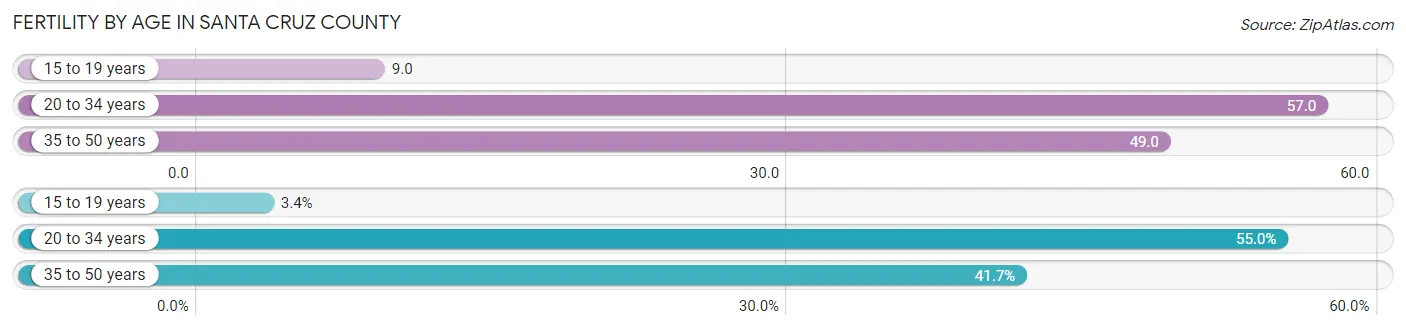
Fertility by Age in Santa Cruz County
Average fertility rate in Santa Cruz County is 46.0 births per 1,000 women. Women in the age bracket of 20 to 34 years have the highest fertility rate with 57.0 births per 1,000 women. Women in the age bracket of 20 to 34 years acount for 55.0% of all women with births.
| Age Bracket | Women with Births | Births / 1,000 Women |
| 15 to 19 years | 99 (3.4%) | 9.0 |
| 20 to 34 years | 1,626 (55.0%) | 57.0 |
| 35 to 50 years | 1,233 (41.7%) | 49.0 |
| Total | 2,958 (100.0%) | 46.0 |
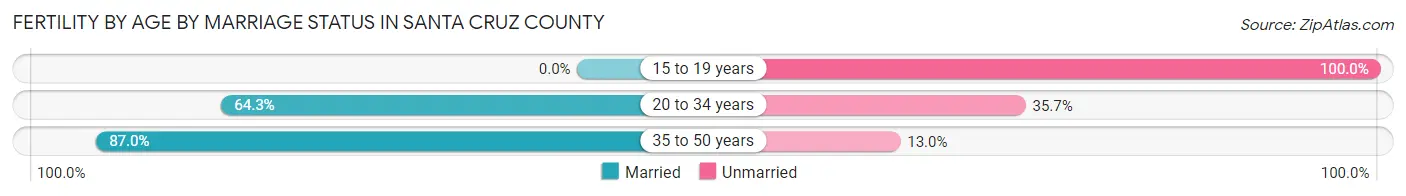
Fertility by Age by Marriage Status in Santa Cruz County
71.6% of women with births (2,958) in Santa Cruz County are married. The highest percentage of unmarried women with births falls into 15 to 19 years age bracket with 100.0% of them unmarried at the time of birth, while the lowest percentage of unmarried women with births belong to 35 to 50 years age bracket with 13.0% of them unmarried.
| Age Bracket | Married | Unmarried |
| 15 to 19 years | 0 (0.0%) | 99 (100.0%) |
| 20 to 34 years | 1,046 (64.3%) | 580 (35.7%) |
| 35 to 50 years | 1,073 (87.0%) | 160 (13.0%) |
| Total | 2,118 (71.6%) | 840 (28.4%) |
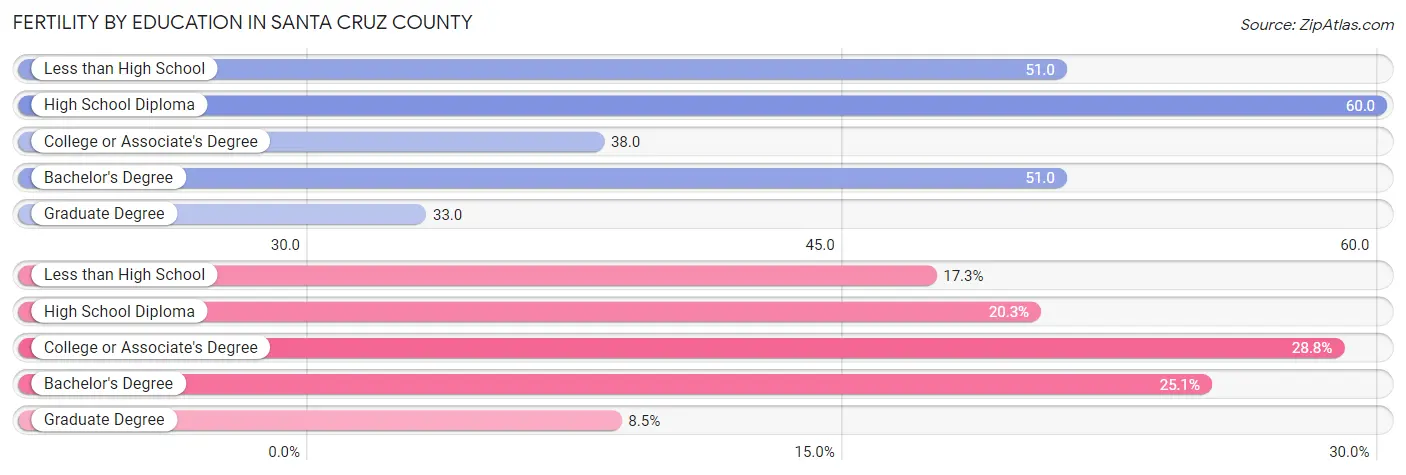
Fertility by Education in Santa Cruz County
Average fertility rate in Santa Cruz County is 46.0 births per 1,000 women. Women with the education attainment of high school diploma have the highest fertility rate of 60.0 births per 1,000 women, while women with the education attainment of graduate degree have the lowest fertility at 33.0 births per 1,000 women. Women with the education attainment of college or associate's degree represent 28.8% of all women with births.
| Educational Attainment | Women with Births | Births / 1,000 Women |
| Less than High School | 513 (17.3%) | 51.0 |
| High School Diploma | 600 (20.3%) | 60.0 |
| College or Associate's Degree | 852 (28.8%) | 38.0 |
| Bachelor's Degree | 742 (25.1%) | 51.0 |
| Graduate Degree | 251 (8.5%) | 33.0 |
| Total | 2,958 (100.0%) | 46.0 |
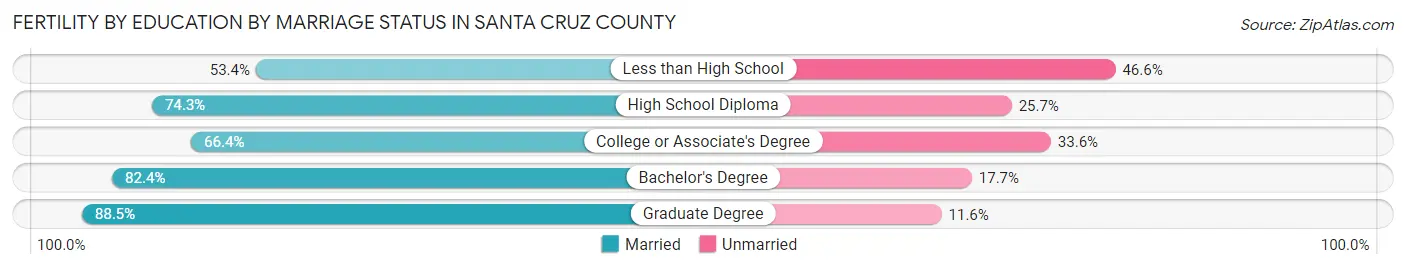
Fertility by Education by Marriage Status in Santa Cruz County
28.4% of women with births in Santa Cruz County are unmarried. Women with the educational attainment of graduate degree are most likely to be married with 88.4% of them married at childbirth, while women with the educational attainment of less than high school are least likely to be married with 46.6% of them unmarried at childbirth.
| Educational Attainment | Married | Unmarried |
| Less than High School | 274 (53.4%) | 239 (46.6%) |
| High School Diploma | 446 (74.3%) | 154 (25.7%) |
| College or Associate's Degree | 566 (66.4%) | 286 (33.6%) |
| Bachelor's Degree | 611 (82.4%) | 131 (17.6%) |
| Graduate Degree | 222 (88.4%) | 29 (11.6%) |
| Total | 2,118 (71.6%) | 840 (28.4%) |
Employment Characteristics in Santa Cruz County
Employment by Class of Employer in Santa Cruz County
Among the 129,470 employed individuals in Santa Cruz County, private company employees (79,216 | 61.2%), local government employees (12,294 | 9.5%), and self-employed (not incorporated) (12,290 | 9.5%) make up the most common classes of employment.
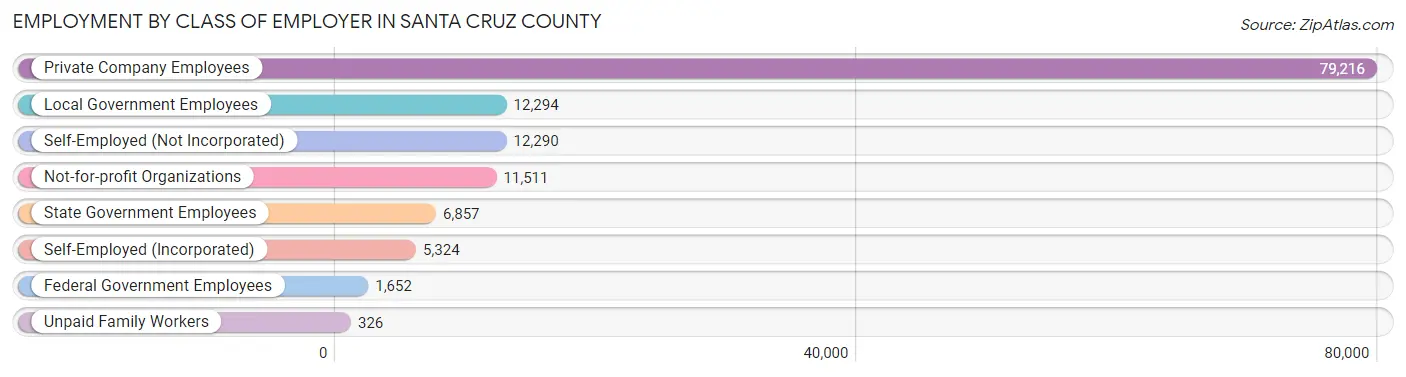
| Employer Class | # Employees | % Employees |
| Private Company Employees | 79,216 | 61.2% |
| Self-Employed (Incorporated) | 5,324 | 4.1% |
| Self-Employed (Not Incorporated) | 12,290 | 9.5% |
| Not-for-profit Organizations | 11,511 | 8.9% |
| Local Government Employees | 12,294 | 9.5% |
| State Government Employees | 6,857 | 5.3% |
| Federal Government Employees | 1,652 | 1.3% |
| Unpaid Family Workers | 326 | 0.3% |
| Total | 129,470 | 100.0% |
Employment Status by Age in Santa Cruz County
According to the labor force statistics for Santa Cruz County, out of the total population over 16 years of age (224,553), 63.5% or 142,591 individuals are in the labor force, with 5.9% or 8,413 of them unemployed. The age group with the highest labor force participation rate is 30 to 34 years, with 86.0% or 13,394 individuals in the labor force. Within the labor force, the 16 to 19 years age range has the highest percentage of unemployed individuals, with 14.8% or 964 of them being unemployed.
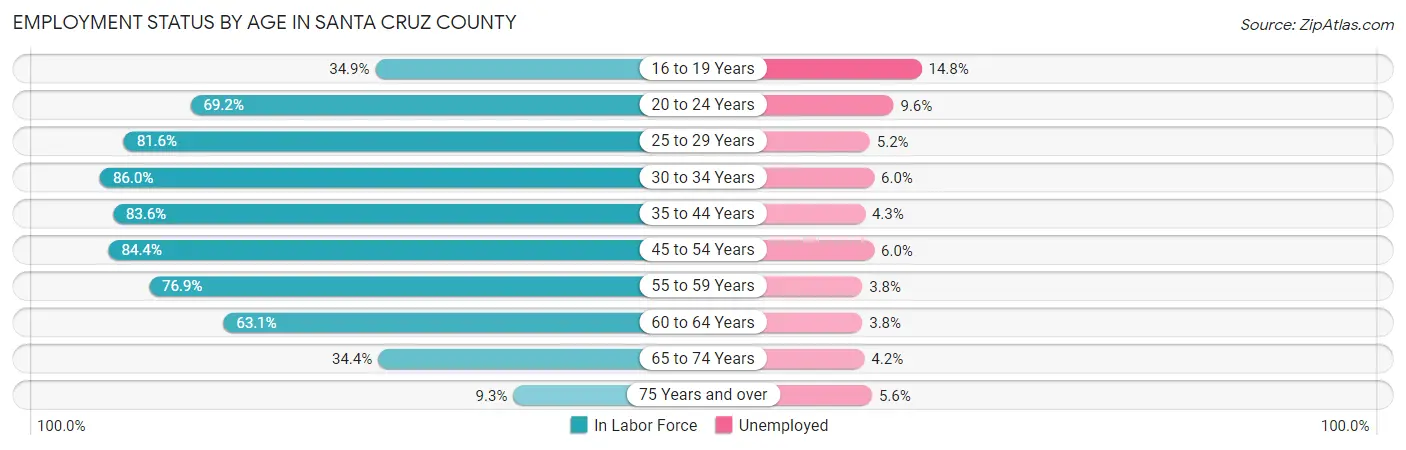
| Age Bracket | In Labor Force | Unemployed |
| 16 to 19 Years | 6,515 (34.9%) | 964 (14.8%) |
| 20 to 24 Years | 17,794 (69.2%) | 1,708 (9.6%) |
| 25 to 29 Years | 13,861 (81.6%) | 721 (5.2%) |
| 30 to 34 Years | 13,394 (86.0%) | 804 (6.0%) |
| 35 to 44 Years | 26,621 (83.6%) | 1,145 (4.3%) |
| 45 to 54 Years | 27,774 (84.4%) | 1,666 (6.0%) |
| 55 to 59 Years | 13,836 (76.9%) | 526 (3.8%) |
| 60 to 64 Years | 10,852 (63.1%) | 412 (3.8%) |
| 65 to 74 Years | 10,388 (34.4%) | 436 (4.2%) |
| 75 Years and over | 1,625 (9.3%) | 91 (5.6%) |
| Total | 142,591 (63.5%) | 8,413 (5.9%) |
Employment Status by Educational Attainment in Santa Cruz County
According to labor force statistics for Santa Cruz County, 80.2% of individuals (106,267) out of the total population between 25 and 64 years of age (132,503) are in the labor force, with 5.0% or 5,313 of them being unemployed. The group with the highest labor force participation rate are those with the educational attainment of bachelor's degree or higher, with 86.7% or 48,519 individuals in the labor force. Within the labor force, individuals with less than high school education have the highest percentage of unemployment, with 10.4% or 1,160 of them being unemployed.
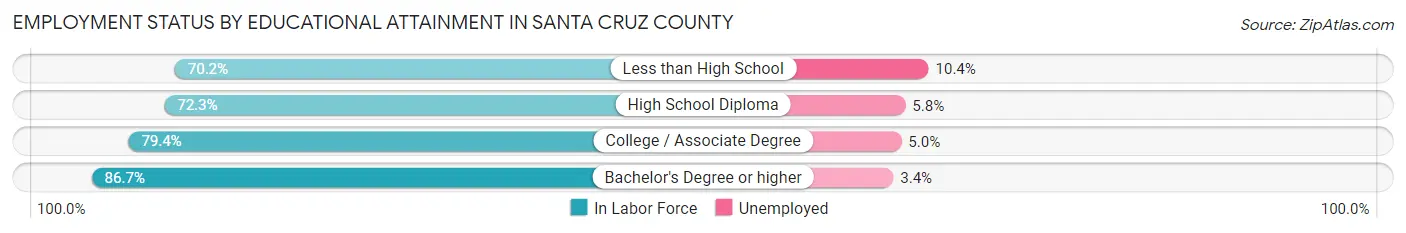
| Educational Attainment | In Labor Force | Unemployed |
| Less than High School | 11,155 (70.2%) | 1,653 (10.4%) |
| High School Diploma | 15,427 (72.3%) | 1,238 (5.8%) |
| College / Associate Degree | 31,215 (79.4%) | 1,966 (5.0%) |
| Bachelor's Degree or higher | 48,519 (86.7%) | 1,903 (3.4%) |
| Total | 106,267 (80.2%) | 6,625 (5.0%) |
Employment Occupations by Sex in Santa Cruz County
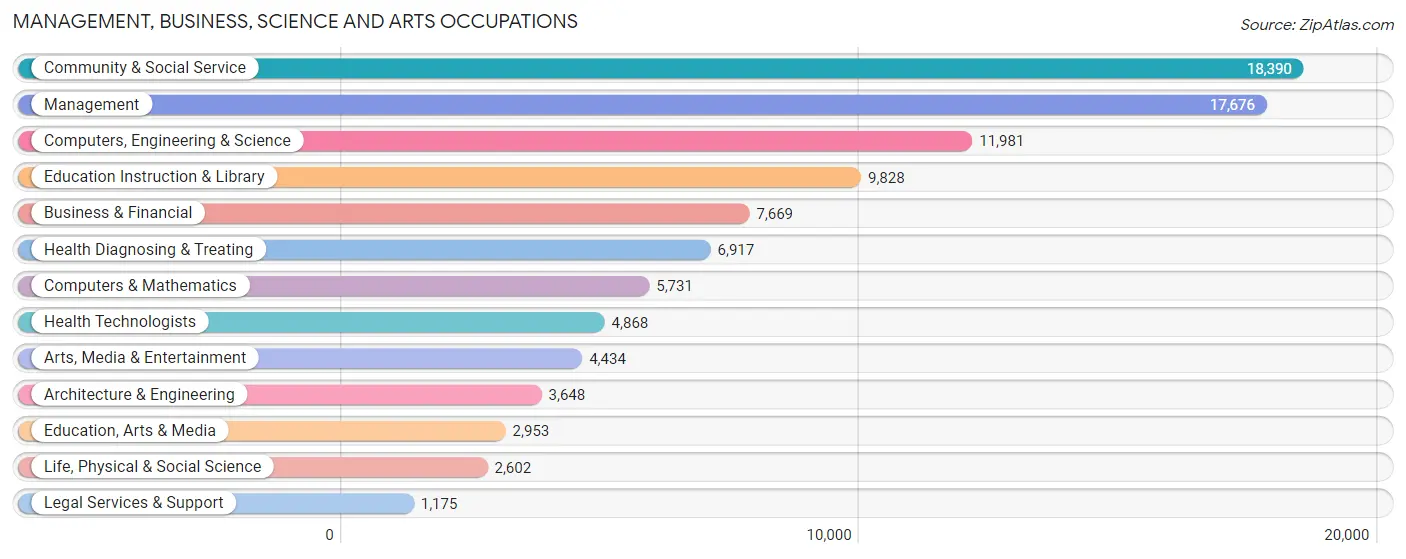
Management, Business, Science and Arts Occupations
The most common Management, Business, Science and Arts occupations in Santa Cruz County are Community & Social Service (18,390 | 13.7%), Management (17,676 | 13.2%), Computers, Engineering & Science (11,981 | 8.9%), Education Instruction & Library (9,828 | 7.3%), and Business & Financial (7,669 | 5.7%).
Management, Business, Science and Arts Occupations by Sex
Within the Management, Business, Science and Arts occupations in Santa Cruz County, the most male-oriented occupations are Architecture & Engineering (85.6%), Computers & Mathematics (78.1%), and Computers, Engineering & Science (74.1%), while the most female-oriented occupations are Health Technologists (71.6%), Health Diagnosing & Treating (70.3%), and Education Instruction & Library (65.4%).
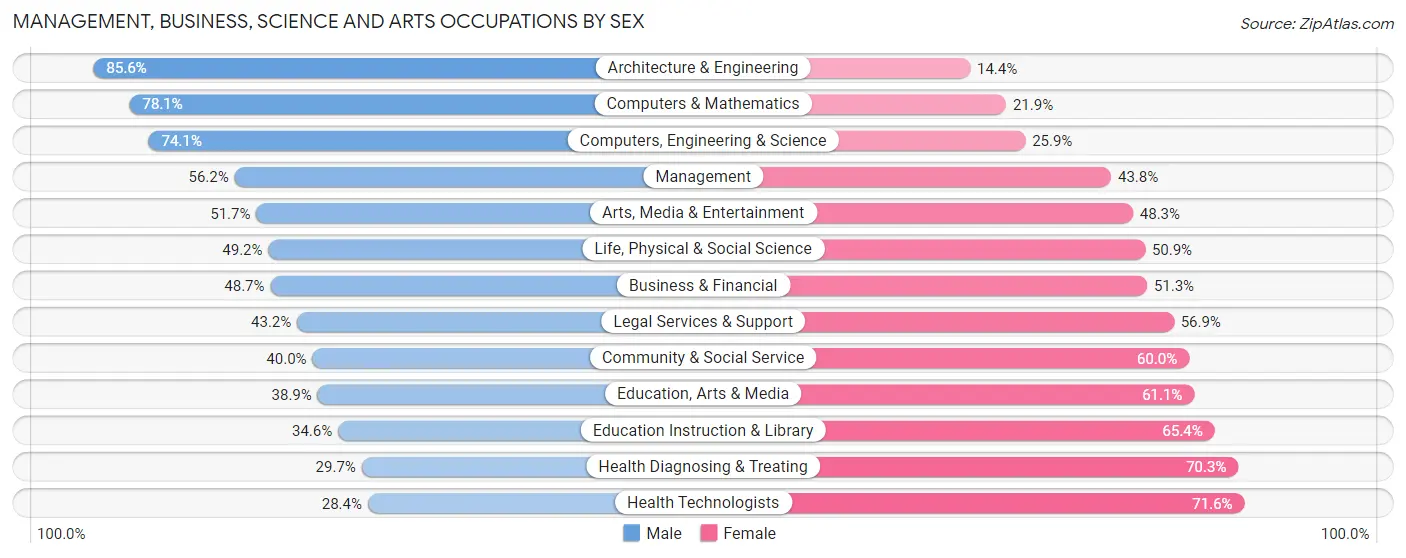
| Occupation | Male | Female |
| Management | 9,936 (56.2%) | 7,740 (43.8%) |
| Business & Financial | 3,737 (48.7%) | 3,932 (51.3%) |
| Computers, Engineering & Science | 8,881 (74.1%) | 3,100 (25.9%) |
| Computers & Mathematics | 4,478 (78.1%) | 1,253 (21.9%) |
| Architecture & Engineering | 3,124 (85.6%) | 524 (14.4%) |
| Life, Physical & Social Science | 1,279 (49.1%) | 1,323 (50.8%) |
| Community & Social Service | 7,348 (40.0%) | 11,042 (60.0%) |
| Education, Arts & Media | 1,148 (38.9%) | 1,805 (61.1%) |
| Legal Services & Support | 507 (43.1%) | 668 (56.9%) |
| Education Instruction & Library | 3,402 (34.6%) | 6,426 (65.4%) |
| Arts, Media & Entertainment | 2,291 (51.7%) | 2,143 (48.3%) |
| Health Diagnosing & Treating | 2,054 (29.7%) | 4,863 (70.3%) |
| Health Technologists | 1,383 (28.4%) | 3,485 (71.6%) |
| Total (Category) | 31,956 (51.0%) | 30,677 (49.0%) |
| Total (Overall) | 71,718 (53.5%) | 62,386 (46.5%) |
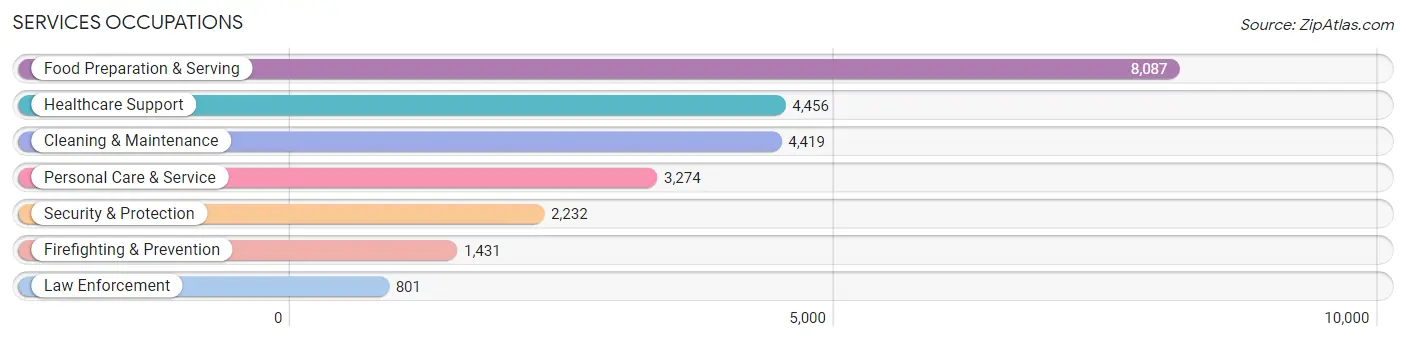
Services Occupations
The most common Services occupations in Santa Cruz County are Food Preparation & Serving (8,087 | 6.0%), Healthcare Support (4,456 | 3.3%), Cleaning & Maintenance (4,419 | 3.3%), Personal Care & Service (3,274 | 2.4%), and Security & Protection (2,232 | 1.7%).
Services Occupations by Sex
Within the Services occupations in Santa Cruz County, the most male-oriented occupations are Law Enforcement (85.5%), Security & Protection (78.2%), and Firefighting & Prevention (74.1%), while the most female-oriented occupations are Healthcare Support (79.3%), Personal Care & Service (71.8%), and Food Preparation & Serving (57.2%).
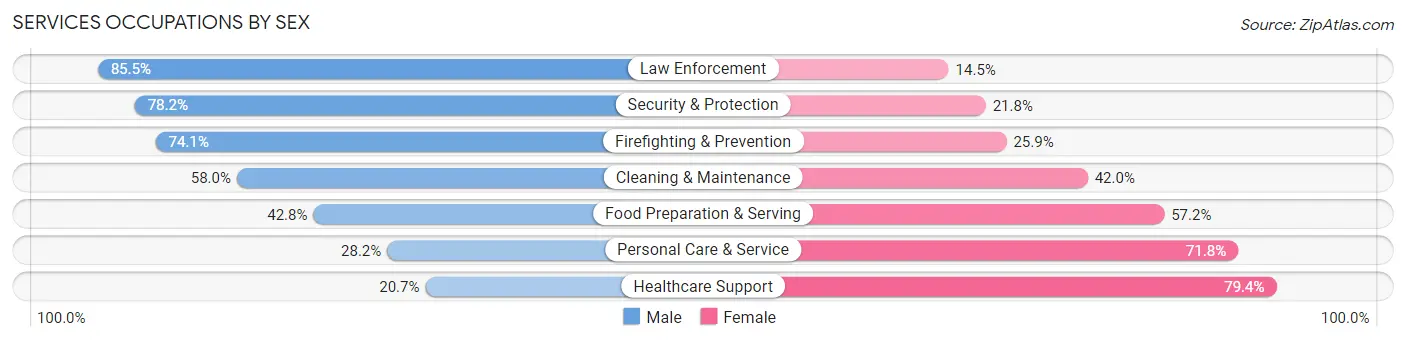
| Occupation | Male | Female |
| Healthcare Support | 920 (20.6%) | 3,536 (79.3%) |
| Security & Protection | 1,745 (78.2%) | 487 (21.8%) |
| Firefighting & Prevention | 1,060 (74.1%) | 371 (25.9%) |
| Law Enforcement | 685 (85.5%) | 116 (14.5%) |
| Food Preparation & Serving | 3,464 (42.8%) | 4,623 (57.2%) |
| Cleaning & Maintenance | 2,562 (58.0%) | 1,857 (42.0%) |
| Personal Care & Service | 924 (28.2%) | 2,350 (71.8%) |
| Total (Category) | 9,615 (42.8%) | 12,853 (57.2%) |
| Total (Overall) | 71,718 (53.5%) | 62,386 (46.5%) |
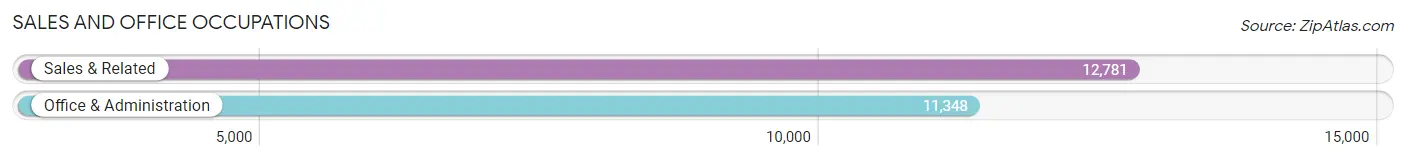
Sales and Office Occupations
The most common Sales and Office occupations in Santa Cruz County are Sales & Related (12,781 | 9.5%), and Office & Administration (11,348 | 8.5%).
Sales and Office Occupations by Sex
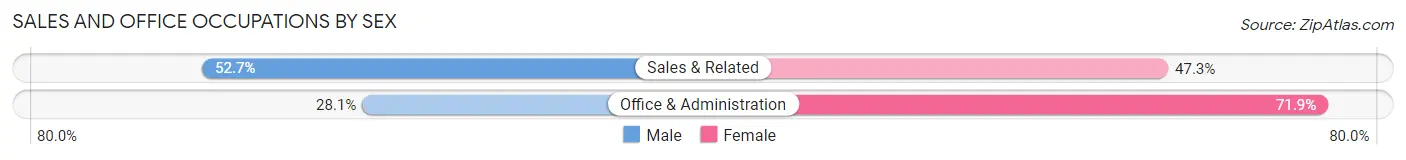
| Occupation | Male | Female |
| Sales & Related | 6,733 (52.7%) | 6,048 (47.3%) |
| Office & Administration | 3,185 (28.1%) | 8,163 (71.9%) |
| Total (Category) | 9,918 (41.1%) | 14,211 (58.9%) |
| Total (Overall) | 71,718 (53.5%) | 62,386 (46.5%) |
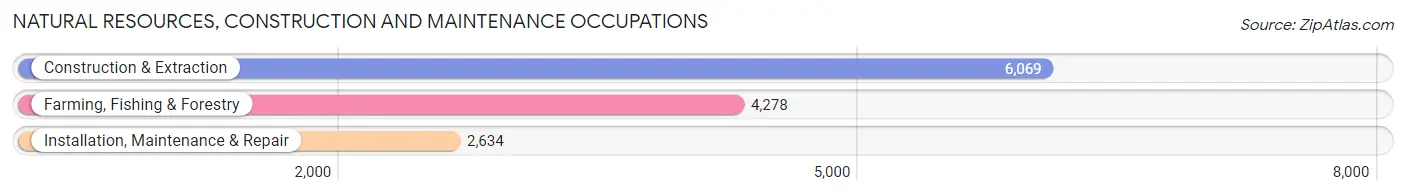
Natural Resources, Construction and Maintenance Occupations
The most common Natural Resources, Construction and Maintenance occupations in Santa Cruz County are Construction & Extraction (6,069 | 4.5%), Farming, Fishing & Forestry (4,278 | 3.2%), and Installation, Maintenance & Repair (2,634 | 2.0%).
Natural Resources, Construction and Maintenance Occupations by Sex
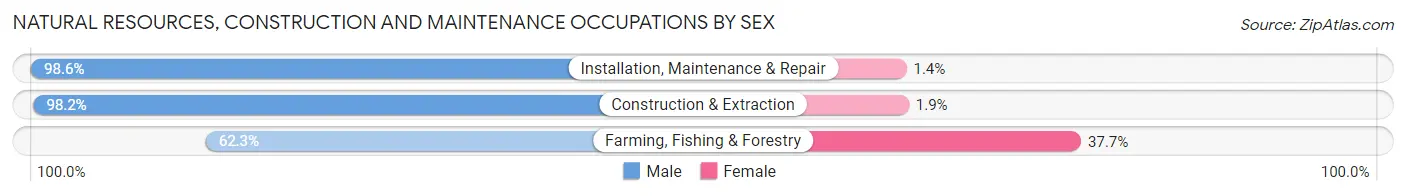
| Occupation | Male | Female |
| Farming, Fishing & Forestry | 2,665 (62.3%) | 1,613 (37.7%) |
| Construction & Extraction | 5,957 (98.2%) | 112 (1.8%) |
| Installation, Maintenance & Repair | 2,598 (98.6%) | 36 (1.4%) |
| Total (Category) | 11,220 (86.4%) | 1,761 (13.6%) |
| Total (Overall) | 71,718 (53.5%) | 62,386 (46.5%) |
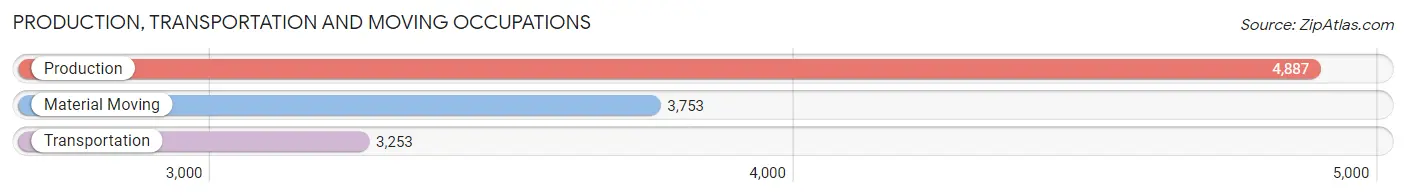
Production, Transportation and Moving Occupations
The most common Production, Transportation and Moving occupations in Santa Cruz County are Production (4,887 | 3.6%), Material Moving (3,753 | 2.8%), and Transportation (3,253 | 2.4%).
Production, Transportation and Moving Occupations by Sex
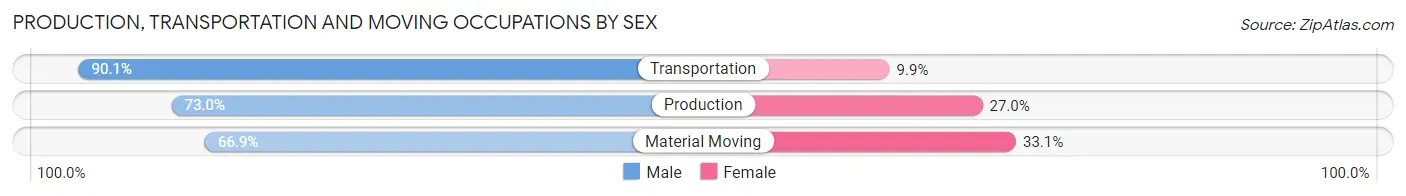
| Occupation | Male | Female |
| Production | 3,569 (73.0%) | 1,318 (27.0%) |
| Transportation | 2,930 (90.1%) | 323 (9.9%) |
| Material Moving | 2,510 (66.9%) | 1,243 (33.1%) |
| Total (Category) | 9,009 (75.7%) | 2,884 (24.2%) |
| Total (Overall) | 71,718 (53.5%) | 62,386 (46.5%) |
Employment Industries by Sex in Santa Cruz County
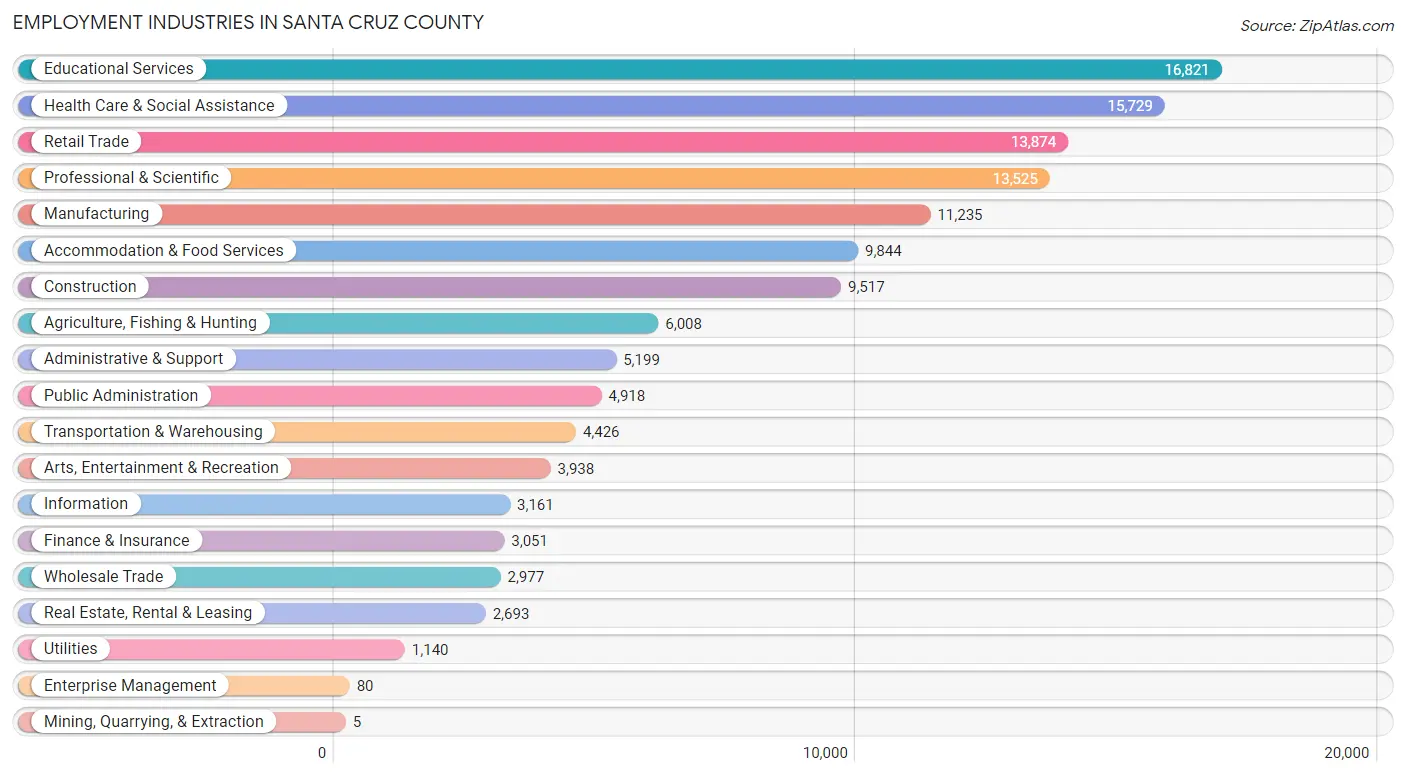
Employment Industries in Santa Cruz County
The major employment industries in Santa Cruz County include Educational Services (16,821 | 12.5%), Health Care & Social Assistance (15,729 | 11.7%), Retail Trade (13,874 | 10.3%), Professional & Scientific (13,525 | 10.1%), and Manufacturing (11,235 | 8.4%).
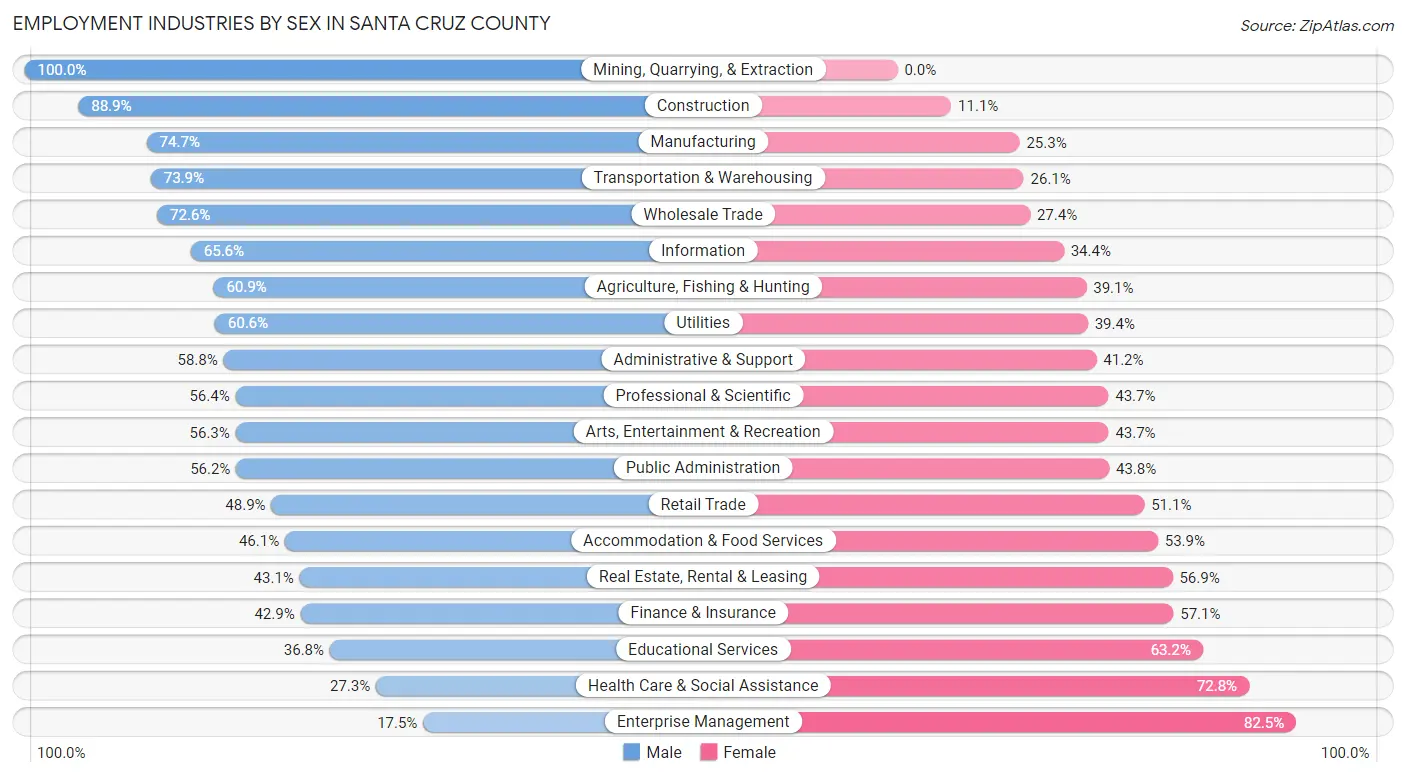
Employment Industries by Sex in Santa Cruz County
The Santa Cruz County industries that see more men than women are Mining, Quarrying, & Extraction (100.0%), Construction (88.9%), and Manufacturing (74.7%), whereas the industries that tend to have a higher number of women are Enterprise Management (82.5%), Health Care & Social Assistance (72.8%), and Educational Services (63.2%).
| Industry | Male | Female |
| Agriculture, Fishing & Hunting | 3,659 (60.9%) | 2,349 (39.1%) |
| Mining, Quarrying, & Extraction | 5 (100.0%) | 0 (0.0%) |
| Construction | 8,459 (88.9%) | 1,058 (11.1%) |
| Manufacturing | 8,396 (74.7%) | 2,839 (25.3%) |
| Wholesale Trade | 2,160 (72.6%) | 817 (27.4%) |
| Retail Trade | 6,786 (48.9%) | 7,088 (51.1%) |
| Transportation & Warehousing | 3,270 (73.9%) | 1,156 (26.1%) |
| Utilities | 691 (60.6%) | 449 (39.4%) |
| Information | 2,073 (65.6%) | 1,088 (34.4%) |
| Finance & Insurance | 1,309 (42.9%) | 1,742 (57.1%) |
| Real Estate, Rental & Leasing | 1,160 (43.1%) | 1,533 (56.9%) |
| Professional & Scientific | 7,622 (56.4%) | 5,903 (43.6%) |
| Enterprise Management | 14 (17.5%) | 66 (82.5%) |
| Administrative & Support | 3,058 (58.8%) | 2,141 (41.2%) |
| Educational Services | 6,191 (36.8%) | 10,630 (63.2%) |
| Health Care & Social Assistance | 4,286 (27.3%) | 11,443 (72.8%) |
| Arts, Entertainment & Recreation | 2,218 (56.3%) | 1,720 (43.7%) |
| Accommodation & Food Services | 4,538 (46.1%) | 5,306 (53.9%) |
| Public Administration | 2,764 (56.2%) | 2,154 (43.8%) |
| Total | 71,718 (53.5%) | 62,386 (46.5%) |
Education in Santa Cruz County
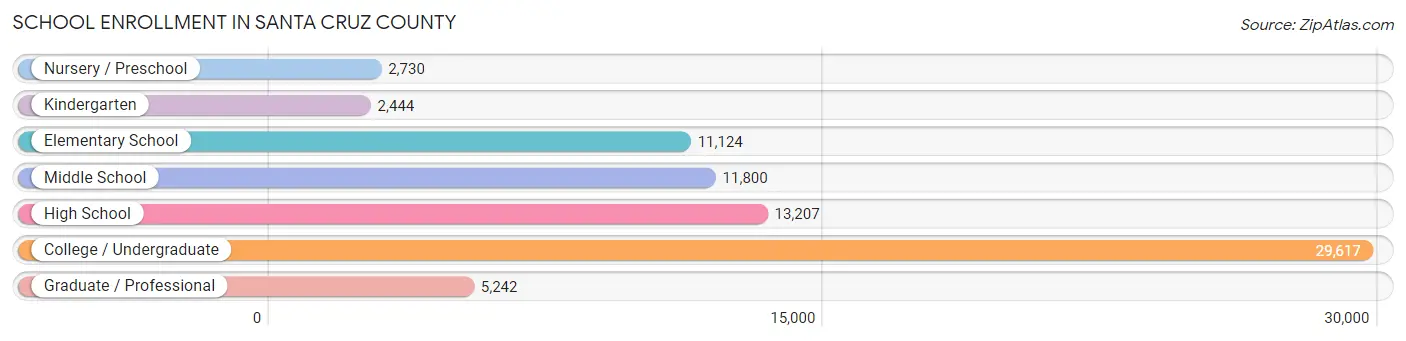
School Enrollment in Santa Cruz County
The most common levels of schooling among the 76,164 students in Santa Cruz County are college / undergraduate (29,617 | 38.9%), high school (13,207 | 17.3%), and middle school (11,800 | 15.5%).
| School Level | # Students | % Students |
| Nursery / Preschool | 2,730 | 3.6% |
| Kindergarten | 2,444 | 3.2% |
| Elementary School | 11,124 | 14.6% |
| Middle School | 11,800 | 15.5% |
| High School | 13,207 | 17.3% |
| College / Undergraduate | 29,617 | 38.9% |
| Graduate / Professional | 5,242 | 6.9% |
| Total | 76,164 | 100.0% |
School Enrollment by Age by Funding Source in Santa Cruz County
Out of a total of 76,164 students who are enrolled in schools in Santa Cruz County, 10,663 (14.0%) attend a private institution, while the remaining 65,501 (86.0%) are enrolled in public schools. The age group of 3 to 4 year olds has the highest likelihood of being enrolled in private schools, with 1,307 (61.4% in the age bracket) enrolled. Conversely, the age group of 18 to 19 year olds has the lowest likelihood of being enrolled in a private school, with 10,246 (91.3% in the age bracket) attending a public institution.
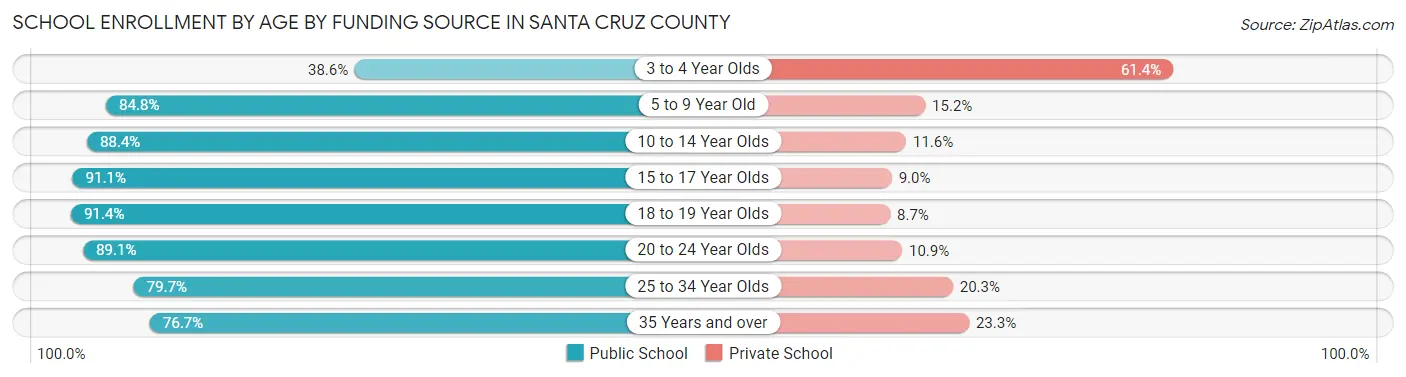
| Age Bracket | Public School | Private School |
| 3 to 4 Year Olds | 823 (38.6%) | 1,307 (61.4%) |
| 5 to 9 Year Old | 11,216 (84.8%) | 2,007 (15.2%) |
| 10 to 14 Year Olds | 12,753 (88.4%) | 1,676 (11.6%) |
| 15 to 17 Year Olds | 8,310 (91.0%) | 817 (8.9%) |
| 18 to 19 Year Olds | 10,246 (91.3%) | 970 (8.6%) |
| 20 to 24 Year Olds | 14,209 (89.1%) | 1,734 (10.9%) |
| 25 to 34 Year Olds | 4,495 (79.7%) | 1,146 (20.3%) |
| 35 Years and over | 3,415 (76.7%) | 1,040 (23.3%) |
| Total | 65,501 (86.0%) | 10,663 (14.0%) |
Educational Attainment by Field of Study in Santa Cruz County
Social sciences (10,465 | 12.5%), business (9,280 | 11.1%), bio, nature & agricultural (8,450 | 10.1%), visual & performing arts (6,247 | 7.5%), and engineering (5,951 | 7.1%) are the most common fields of study among 83,599 individuals in Santa Cruz County who have obtained a bachelor's degree or higher.
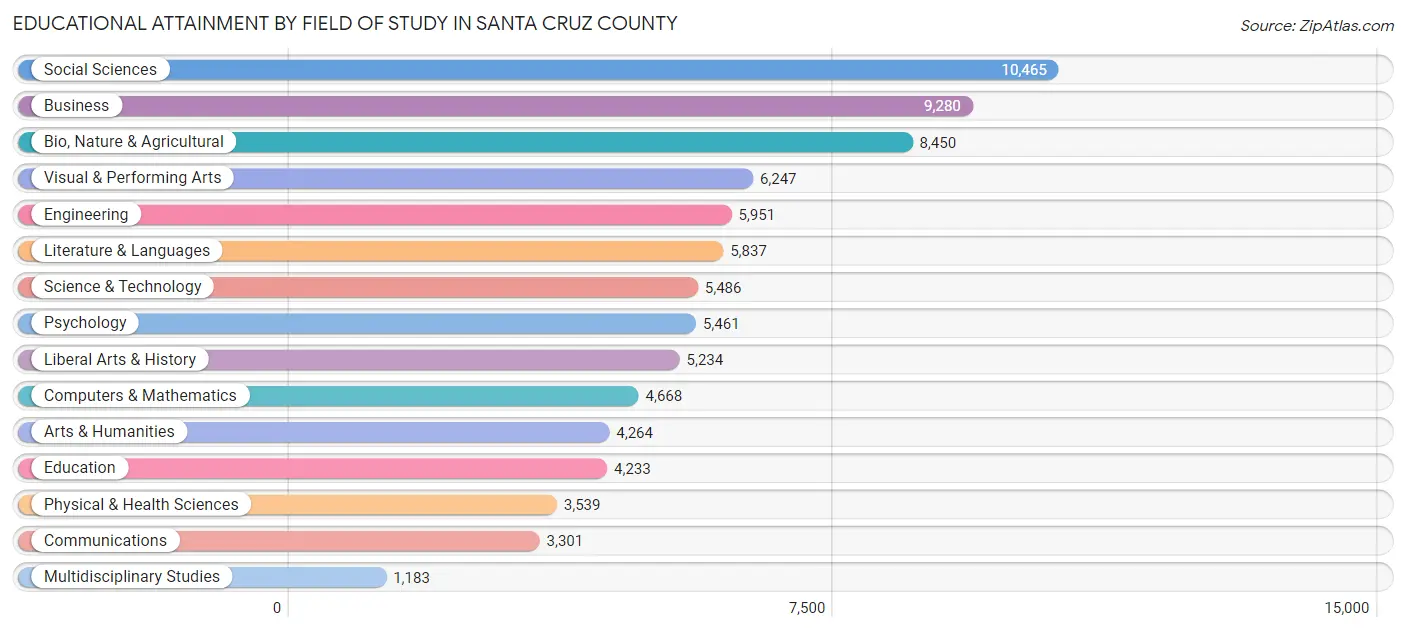
| Field of Study | # Graduates | % Graduates |
| Computers & Mathematics | 4,668 | 5.6% |
| Bio, Nature & Agricultural | 8,450 | 10.1% |
| Physical & Health Sciences | 3,539 | 4.2% |
| Psychology | 5,461 | 6.5% |
| Social Sciences | 10,465 | 12.5% |
| Engineering | 5,951 | 7.1% |
| Multidisciplinary Studies | 1,183 | 1.4% |
| Science & Technology | 5,486 | 6.6% |
| Business | 9,280 | 11.1% |
| Education | 4,233 | 5.1% |
| Literature & Languages | 5,837 | 7.0% |
| Liberal Arts & History | 5,234 | 6.3% |
| Visual & Performing Arts | 6,247 | 7.5% |
| Communications | 3,301 | 4.0% |
| Arts & Humanities | 4,264 | 5.1% |
| Total | 83,599 | 100.0% |
Transportation & Commute in Santa Cruz County
Vehicle Availability by Sex in Santa Cruz County
The most prevalent vehicle ownership categories in Santa Cruz County are males with 2 vehicles (27,121, accounting for 39.5%) and females with 2 vehicles (22,029, making up 47.3%).
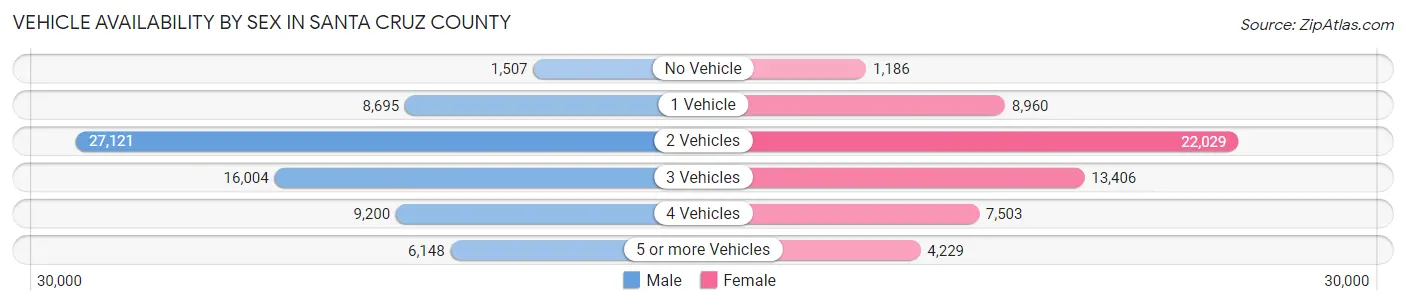
| Vehicles Available | Male | Female |
| No Vehicle | 1,507 (2.2%) | 1,186 (2.1%) |
| 1 Vehicle | 8,695 (12.7%) | 8,960 (15.6%) |
| 2 Vehicles | 27,121 (39.5%) | 22,029 (38.4%) |
| 3 Vehicles | 16,004 (23.3%) | 13,406 (23.4%) |
| 4 Vehicles | 9,200 (13.4%) | 7,503 (13.1%) |
| 5 or more Vehicles | 6,148 (8.9%) | 4,229 (7.4%) |
| Total | 68,675 (100.0%) | 57,313 (100.0%) |
Commute Time in Santa Cruz County
The most frequently occuring commute durations in Santa Cruz County are 10 to 14 minutes (17,198 commuters, 15.9%), 15 to 19 minutes (16,219 commuters, 15.0%), and 20 to 24 minutes (14,267 commuters, 13.2%).
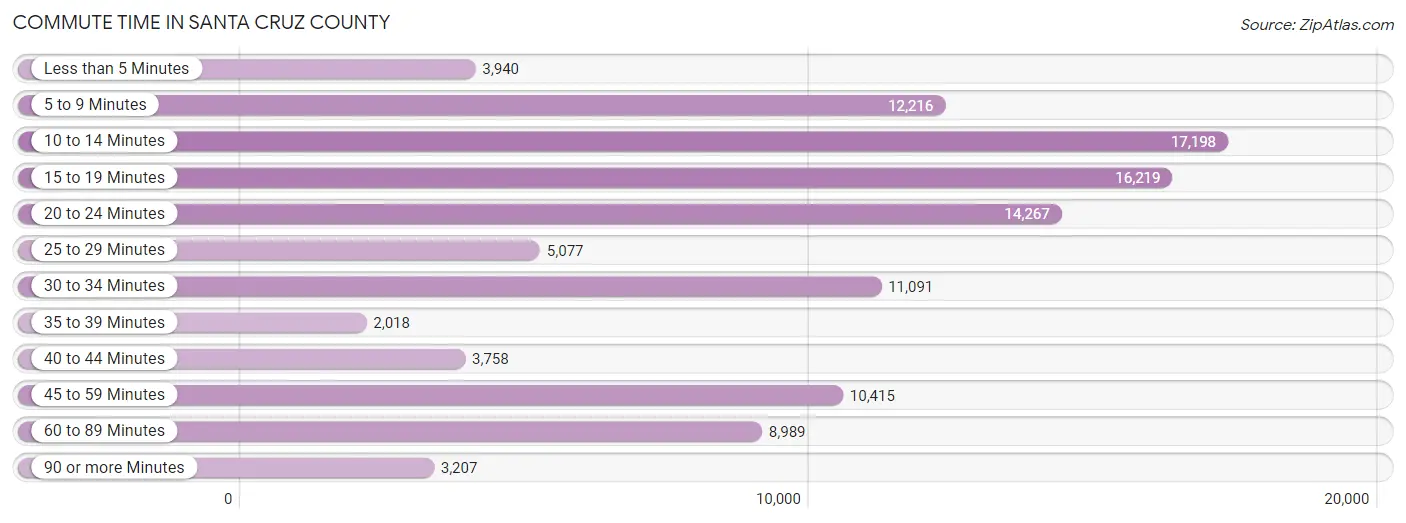
| Commute Time | # Commuters | % Commuters |
| Less than 5 Minutes | 3,940 | 3.6% |
| 5 to 9 Minutes | 12,216 | 11.3% |
| 10 to 14 Minutes | 17,198 | 15.9% |
| 15 to 19 Minutes | 16,219 | 15.0% |
| 20 to 24 Minutes | 14,267 | 13.2% |
| 25 to 29 Minutes | 5,077 | 4.7% |
| 30 to 34 Minutes | 11,091 | 10.2% |
| 35 to 39 Minutes | 2,018 | 1.9% |
| 40 to 44 Minutes | 3,758 | 3.5% |
| 45 to 59 Minutes | 10,415 | 9.6% |
| 60 to 89 Minutes | 8,989 | 8.3% |
| 90 or more Minutes | 3,207 | 3.0% |
Commute Time by Sex in Santa Cruz County
The most common commute times in Santa Cruz County are 10 to 14 minutes (9,242 commuters, 15.7%) for males and 15 to 19 minutes (8,086 commuters, 16.4%) for females.
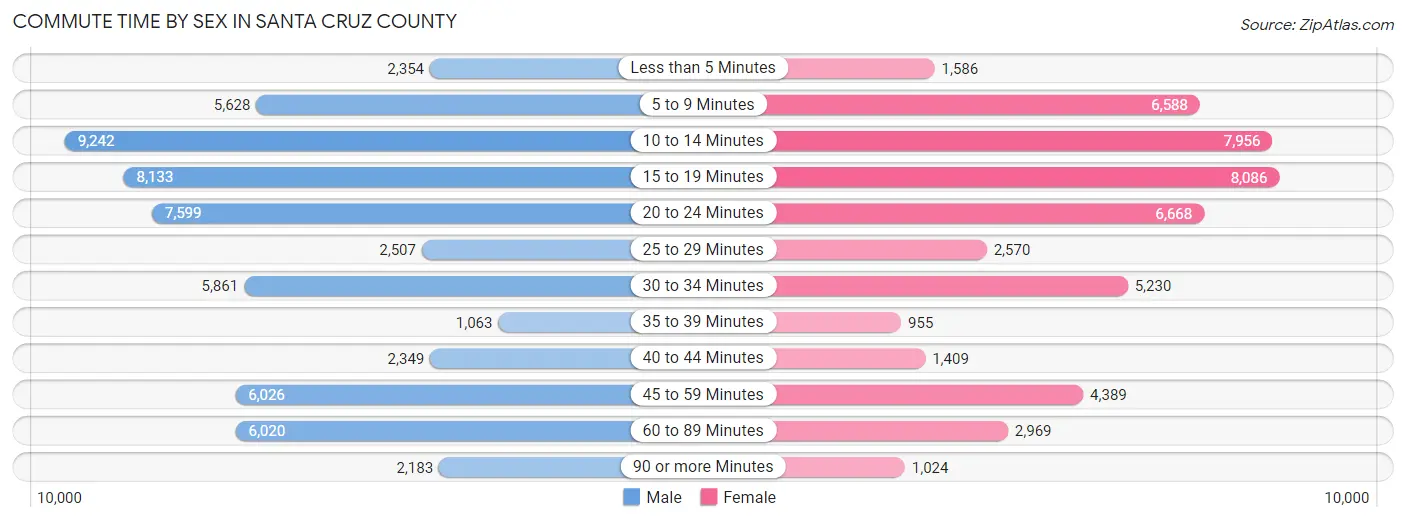
| Commute Time | Male | Female |
| Less than 5 Minutes | 2,354 (4.0%) | 1,586 (3.2%) |
| 5 to 9 Minutes | 5,628 (9.5%) | 6,588 (13.3%) |
| 10 to 14 Minutes | 9,242 (15.7%) | 7,956 (16.1%) |
| 15 to 19 Minutes | 8,133 (13.8%) | 8,086 (16.4%) |
| 20 to 24 Minutes | 7,599 (12.9%) | 6,668 (13.5%) |
| 25 to 29 Minutes | 2,507 (4.3%) | 2,570 (5.2%) |
| 30 to 34 Minutes | 5,861 (9.9%) | 5,230 (10.6%) |
| 35 to 39 Minutes | 1,063 (1.8%) | 955 (1.9%) |
| 40 to 44 Minutes | 2,349 (4.0%) | 1,409 (2.9%) |
| 45 to 59 Minutes | 6,026 (10.2%) | 4,389 (8.9%) |
| 60 to 89 Minutes | 6,020 (10.2%) | 2,969 (6.0%) |
| 90 or more Minutes | 2,183 (3.7%) | 1,024 (2.1%) |
Time of Departure to Work by Sex in Santa Cruz County
The most frequent times of departure to work in Santa Cruz County are 7:00 AM to 7:29 AM (7,823, 13.3%) for males and 7:30 AM to 7:59 AM (6,954, 14.1%) for females.
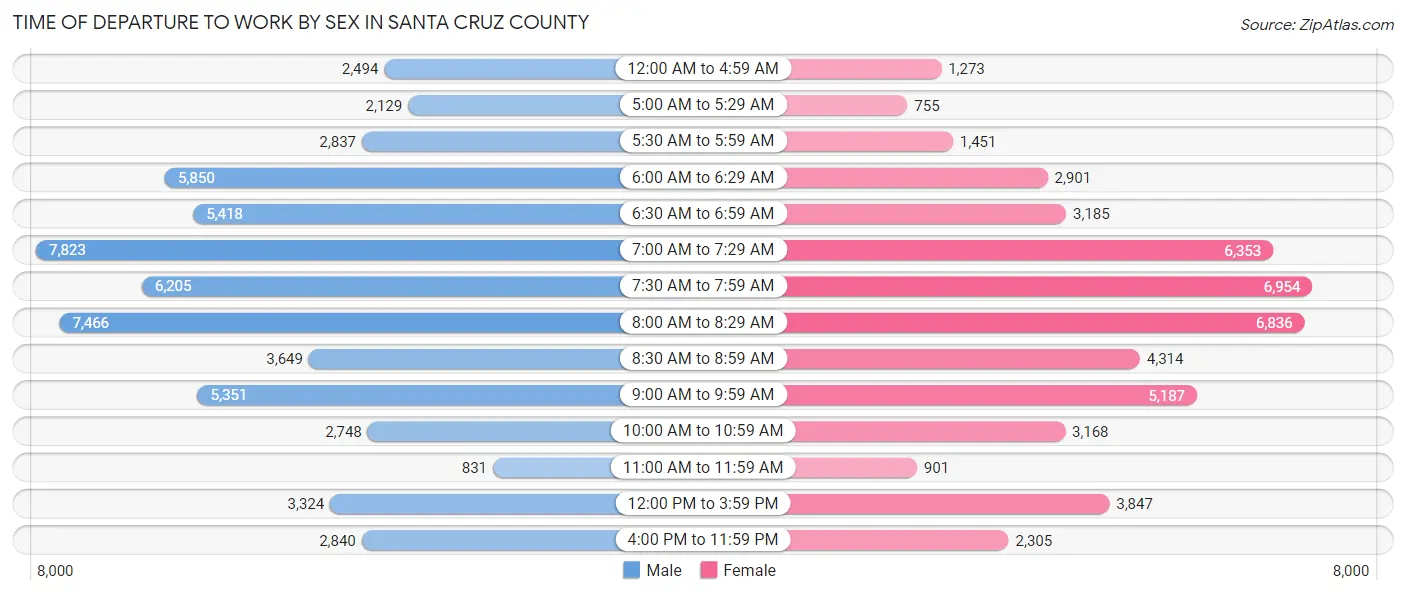
| Time of Departure | Male | Female |
| 12:00 AM to 4:59 AM | 2,494 (4.2%) | 1,273 (2.6%) |
| 5:00 AM to 5:29 AM | 2,129 (3.6%) | 755 (1.5%) |
| 5:30 AM to 5:59 AM | 2,837 (4.8%) | 1,451 (2.9%) |
| 6:00 AM to 6:29 AM | 5,850 (9.9%) | 2,901 (5.9%) |
| 6:30 AM to 6:59 AM | 5,418 (9.2%) | 3,185 (6.4%) |
| 7:00 AM to 7:29 AM | 7,823 (13.3%) | 6,353 (12.9%) |
| 7:30 AM to 7:59 AM | 6,205 (10.5%) | 6,954 (14.1%) |
| 8:00 AM to 8:29 AM | 7,466 (12.7%) | 6,836 (13.8%) |
| 8:30 AM to 8:59 AM | 3,649 (6.2%) | 4,314 (8.7%) |
| 9:00 AM to 9:59 AM | 5,351 (9.1%) | 5,187 (10.5%) |
| 10:00 AM to 10:59 AM | 2,748 (4.7%) | 3,168 (6.4%) |
| 11:00 AM to 11:59 AM | 831 (1.4%) | 901 (1.8%) |
| 12:00 PM to 3:59 PM | 3,324 (5.6%) | 3,847 (7.8%) |
| 4:00 PM to 11:59 PM | 2,840 (4.8%) | 2,305 (4.7%) |
| Total | 58,965 (100.0%) | 49,430 (100.0%) |
Housing Occupancy in Santa Cruz County
Occupancy by Ownership in Santa Cruz County
Of the total 96,487 dwellings in Santa Cruz County, owner-occupied units account for 57,852 (60.0%), while renter-occupied units make up 38,635 (40.0%).
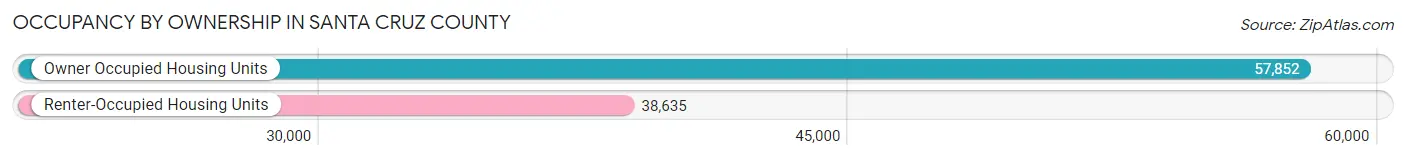
| Occupancy | # Housing Units | % Housing Units |
| Owner Occupied Housing Units | 57,852 | 60.0% |
| Renter-Occupied Housing Units | 38,635 | 40.0% |
| Total Occupied Housing Units | 96,487 | 100.0% |
Occupancy by Household Size in Santa Cruz County
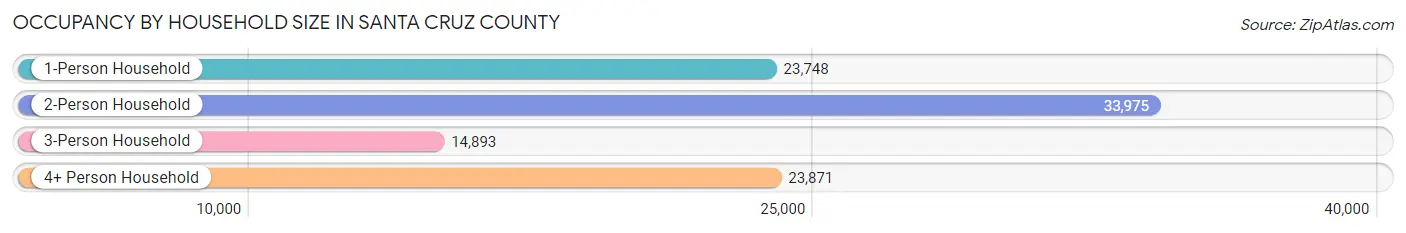
| Household Size | # Housing Units | % Housing Units |
| 1-Person Household | 23,748 | 24.6% |
| 2-Person Household | 33,975 | 35.2% |
| 3-Person Household | 14,893 | 15.4% |
| 4+ Person Household | 23,871 | 24.7% |
| Total Housing Units | 96,487 | 100.0% |
Occupancy by Ownership by Household Size in Santa Cruz County
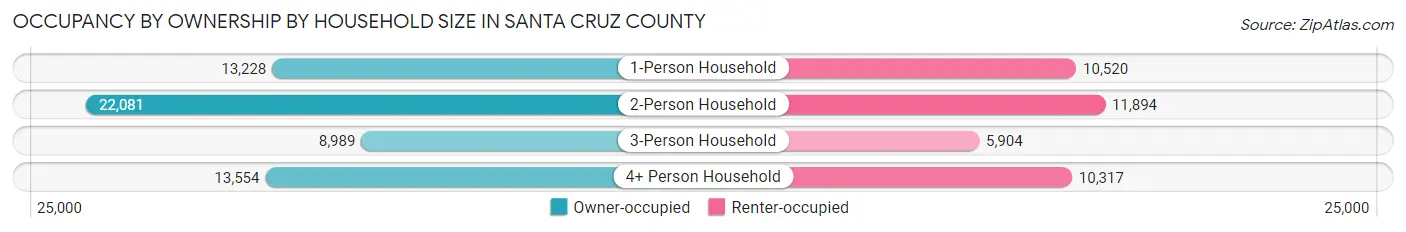
| Household Size | Owner-occupied | Renter-occupied |
| 1-Person Household | 13,228 (55.7%) | 10,520 (44.3%) |
| 2-Person Household | 22,081 (65.0%) | 11,894 (35.0%) |
| 3-Person Household | 8,989 (60.4%) | 5,904 (39.6%) |
| 4+ Person Household | 13,554 (56.8%) | 10,317 (43.2%) |
| Total Housing Units | 57,852 (60.0%) | 38,635 (40.0%) |
Occupancy by Educational Attainment in Santa Cruz County
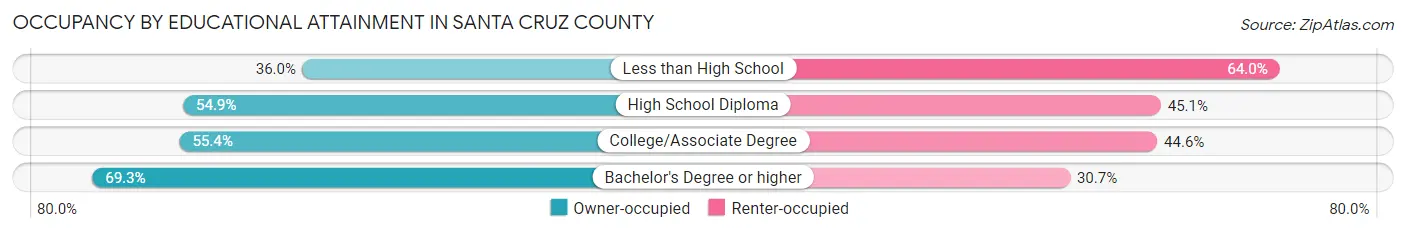
| Household Size | Owner-occupied | Renter-occupied |
| Less than High School | 3,278 (36.0%) | 5,819 (64.0%) |
| High School Diploma | 6,762 (54.9%) | 5,565 (45.1%) |
| College/Associate Degree | 16,753 (55.4%) | 13,469 (44.6%) |
| Bachelor's Degree or higher | 31,059 (69.3%) | 13,782 (30.7%) |
Occupancy by Age of Householder in Santa Cruz County
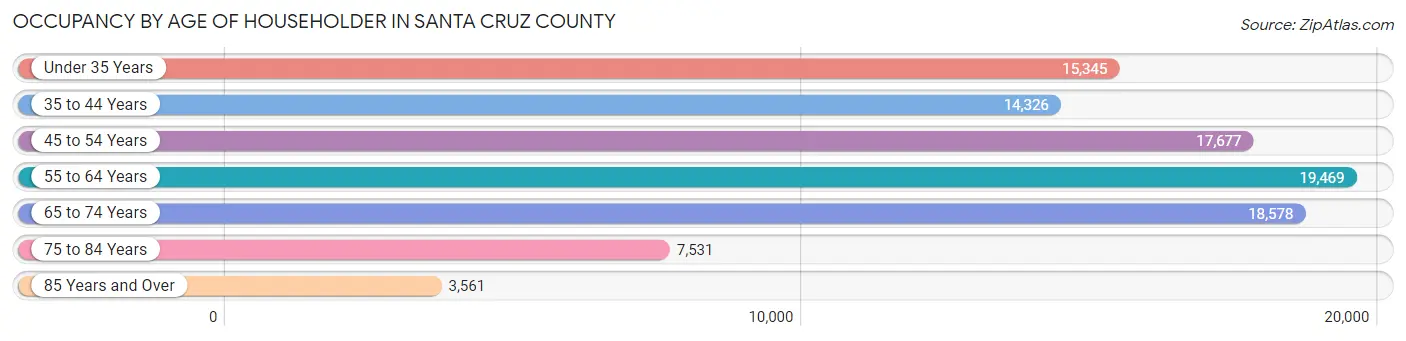
| Age Bracket | # Households | % Households |
| Under 35 Years | 15,345 | 15.9% |
| 35 to 44 Years | 14,326 | 14.8% |
| 45 to 54 Years | 17,677 | 18.3% |
| 55 to 64 Years | 19,469 | 20.2% |
| 65 to 74 Years | 18,578 | 19.3% |
| 75 to 84 Years | 7,531 | 7.8% |
| 85 Years and Over | 3,561 | 3.7% |
| Total | 96,487 | 100.0% |
Housing Finances in Santa Cruz County
Median Income by Occupancy in Santa Cruz County
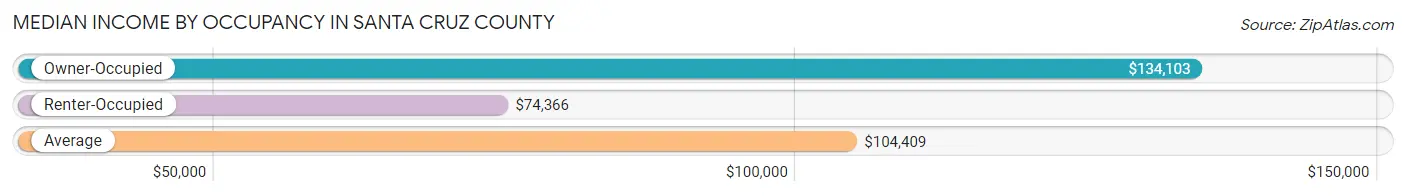
| Occupancy Type | # Households | Median Income |
| Owner-Occupied | 57,852 (60.0%) | $134,103 |
| Renter-Occupied | 38,635 (40.0%) | $74,366 |
| Average | 96,487 (100.0%) | $104,409 |
Occupancy by Householder Income Bracket in Santa Cruz County
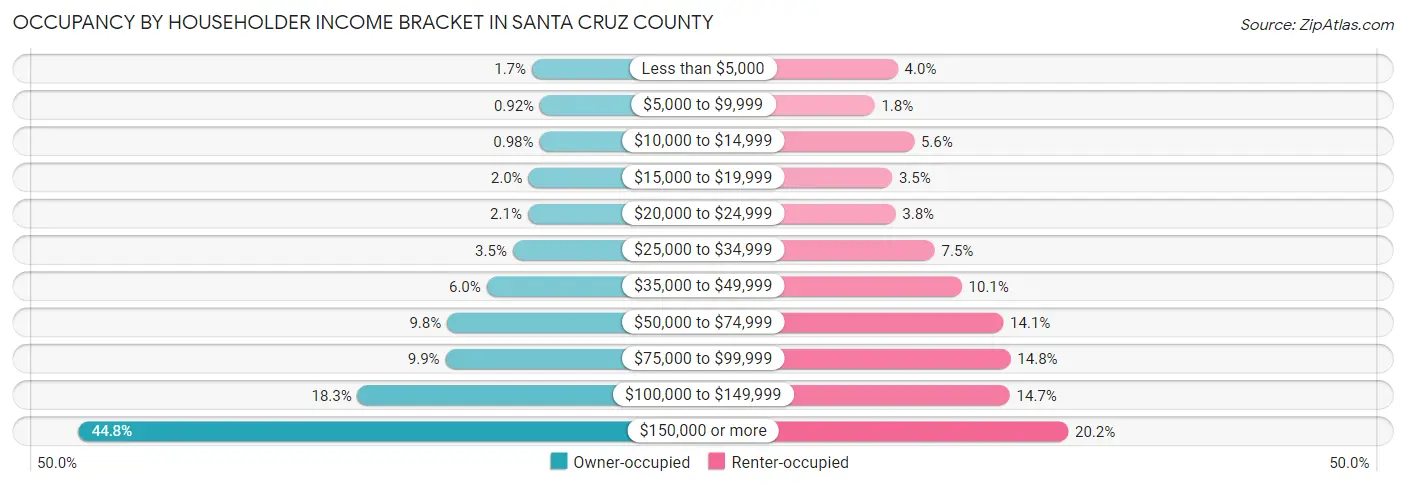
| Income Bracket | Owner-occupied | Renter-occupied |
| Less than $5,000 | 975 (1.7%) | 1,551 (4.0%) |
| $5,000 to $9,999 | 532 (0.9%) | 694 (1.8%) |
| $10,000 to $14,999 | 565 (1.0%) | 2,150 (5.6%) |
| $15,000 to $19,999 | 1,166 (2.0%) | 1,340 (3.5%) |
| $20,000 to $24,999 | 1,201 (2.1%) | 1,463 (3.8%) |
| $25,000 to $34,999 | 2,029 (3.5%) | 2,909 (7.5%) |
| $35,000 to $49,999 | 3,471 (6.0%) | 3,904 (10.1%) |
| $50,000 to $74,999 | 5,654 (9.8%) | 5,433 (14.1%) |
| $75,000 to $99,999 | 5,740 (9.9%) | 5,700 (14.7%) |
| $100,000 to $149,999 | 10,583 (18.3%) | 5,670 (14.7%) |
| $150,000 or more | 25,936 (44.8%) | 7,821 (20.2%) |
| Total | 57,852 (100.0%) | 38,635 (100.0%) |
Monthly Housing Cost Tiers in Santa Cruz County
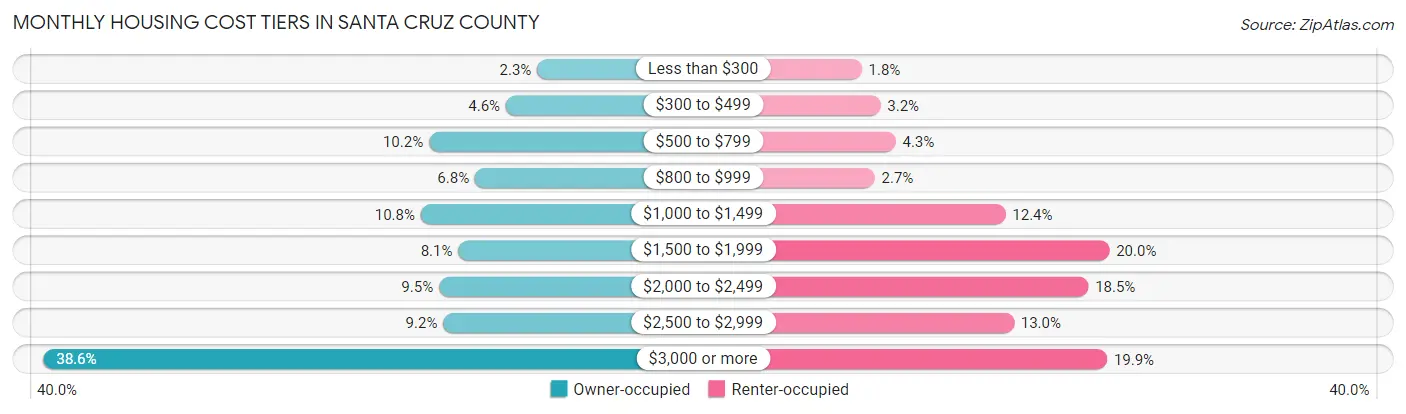
| Monthly Cost | Owner-occupied | Renter-occupied |
| Less than $300 | 1,299 (2.2%) | 688 (1.8%) |
| $300 to $499 | 2,633 (4.5%) | 1,221 (3.2%) |
| $500 to $799 | 5,913 (10.2%) | 1,655 (4.3%) |
| $800 to $999 | 3,953 (6.8%) | 1,060 (2.7%) |
| $1,000 to $1,499 | 6,259 (10.8%) | 4,778 (12.4%) |
| $1,500 to $1,999 | 4,665 (8.1%) | 7,736 (20.0%) |
| $2,000 to $2,499 | 5,482 (9.5%) | 7,137 (18.5%) |
| $2,500 to $2,999 | 5,307 (9.2%) | 5,018 (13.0%) |
| $3,000 or more | 22,341 (38.6%) | 7,669 (19.9%) |
| Total | 57,852 (100.0%) | 38,635 (100.0%) |
Physical Housing Characteristics in Santa Cruz County
Housing Structures in Santa Cruz County
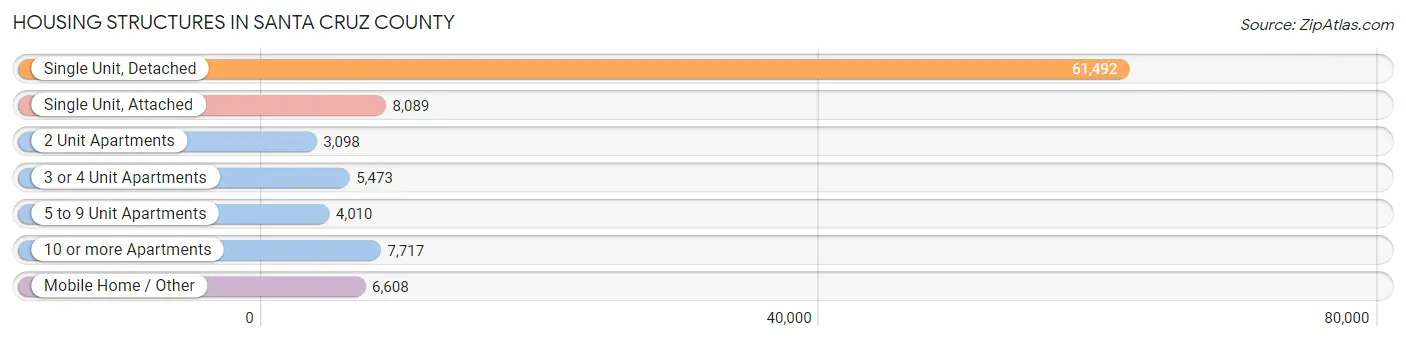
| Structure Type | # Housing Units | % Housing Units |
| Single Unit, Detached | 61,492 | 63.7% |
| Single Unit, Attached | 8,089 | 8.4% |
| 2 Unit Apartments | 3,098 | 3.2% |
| 3 or 4 Unit Apartments | 5,473 | 5.7% |
| 5 to 9 Unit Apartments | 4,010 | 4.2% |
| 10 or more Apartments | 7,717 | 8.0% |
| Mobile Home / Other | 6,608 | 6.9% |
| Total | 96,487 | 100.0% |
Housing Structures by Occupancy in Santa Cruz County
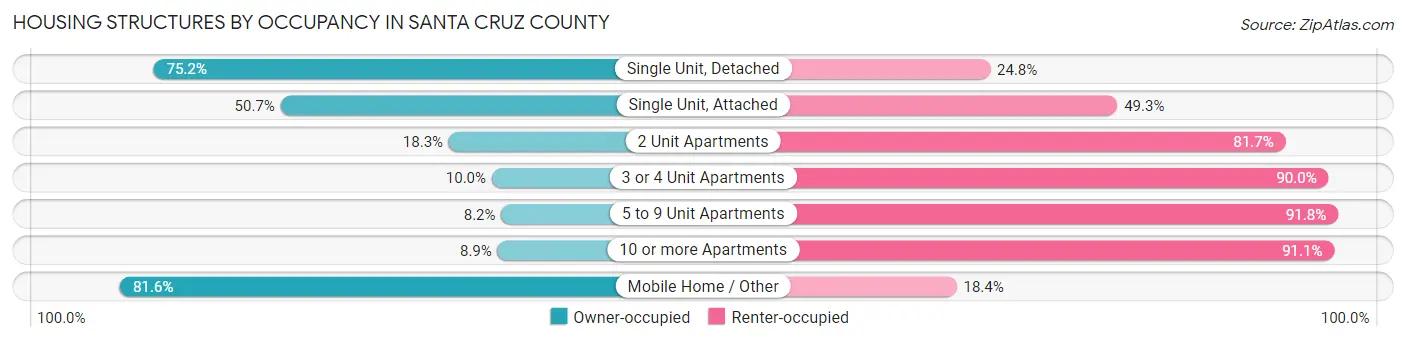
| Structure Type | Owner-occupied | Renter-occupied |
| Single Unit, Detached | 46,224 (75.2%) | 15,268 (24.8%) |
| Single Unit, Attached | 4,101 (50.7%) | 3,988 (49.3%) |
| 2 Unit Apartments | 567 (18.3%) | 2,531 (81.7%) |
| 3 or 4 Unit Apartments | 549 (10.0%) | 4,924 (90.0%) |
| 5 to 9 Unit Apartments | 329 (8.2%) | 3,681 (91.8%) |
| 10 or more Apartments | 688 (8.9%) | 7,029 (91.1%) |
| Mobile Home / Other | 5,394 (81.6%) | 1,214 (18.4%) |
| Total | 57,852 (60.0%) | 38,635 (40.0%) |
Housing Structures by Number of Rooms in Santa Cruz County
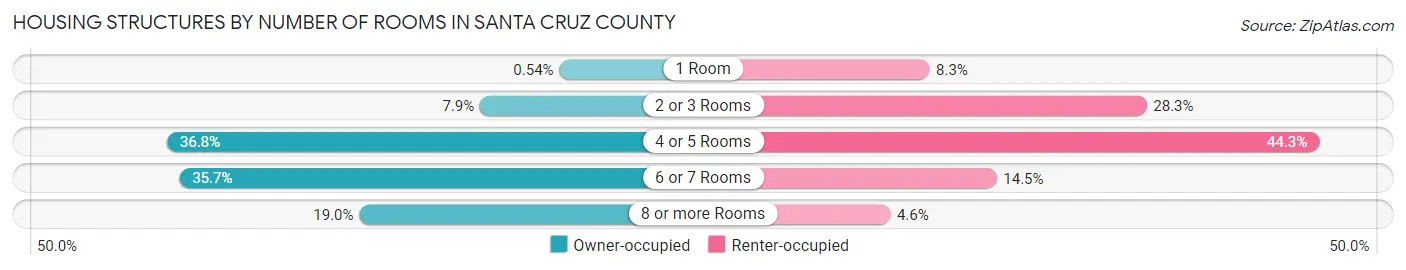
| Number of Rooms | Owner-occupied | Renter-occupied |
| 1 Room | 313 (0.5%) | 3,187 (8.3%) |
| 2 or 3 Rooms | 4,557 (7.9%) | 10,951 (28.3%) |
| 4 or 5 Rooms | 21,315 (36.8%) | 17,118 (44.3%) |
| 6 or 7 Rooms | 20,652 (35.7%) | 5,591 (14.5%) |
| 8 or more Rooms | 11,015 (19.0%) | 1,788 (4.6%) |
| Total | 57,852 (100.0%) | 38,635 (100.0%) |
Housing Structure by Heating Type in Santa Cruz County
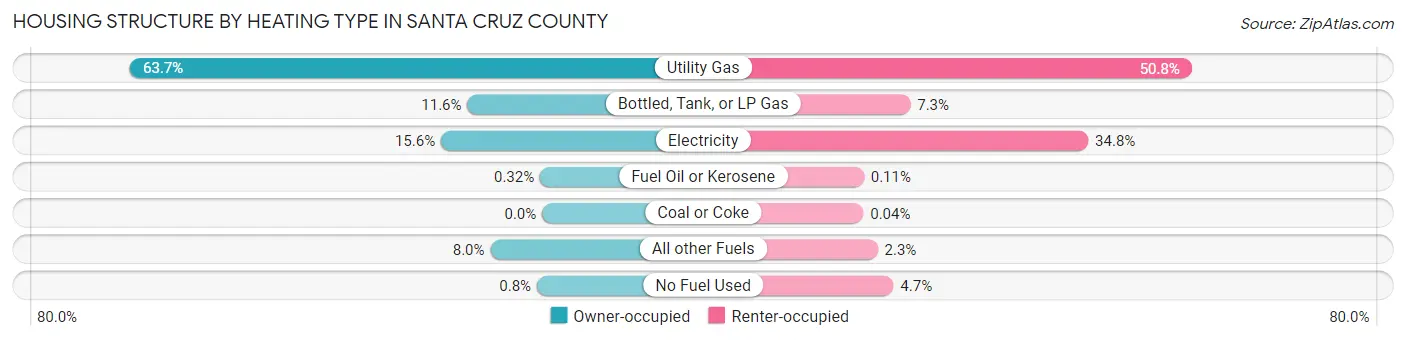
| Heating Type | Owner-occupied | Renter-occupied |
| Utility Gas | 36,855 (63.7%) | 19,628 (50.8%) |
| Bottled, Tank, or LP Gas | 6,684 (11.6%) | 2,822 (7.3%) |
| Electricity | 9,040 (15.6%) | 13,444 (34.8%) |
| Fuel Oil or Kerosene | 185 (0.3%) | 42 (0.1%) |
| Coal or Coke | 0 (0.0%) | 17 (0.0%) |
| All other Fuels | 4,626 (8.0%) | 870 (2.2%) |
| No Fuel Used | 462 (0.8%) | 1,812 (4.7%) |
| Total | 57,852 (100.0%) | 38,635 (100.0%) |
Household Vehicle Usage in Santa Cruz County
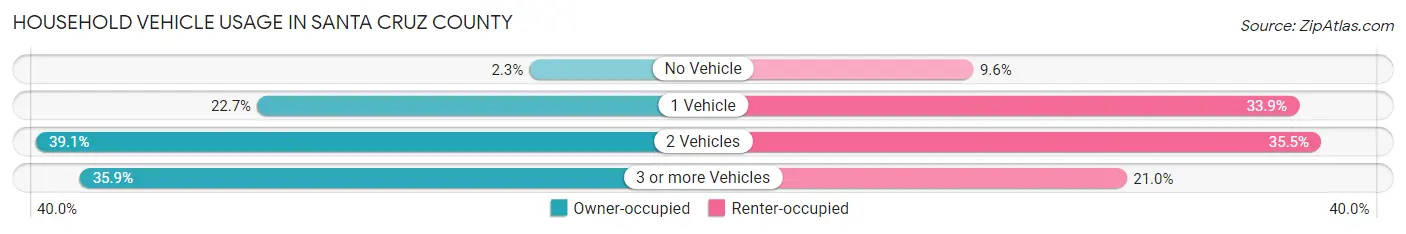
| Vehicles per Household | Owner-occupied | Renter-occupied |
| No Vehicle | 1,348 (2.3%) | 3,692 (9.6%) |
| 1 Vehicle | 13,102 (22.7%) | 13,095 (33.9%) |
| 2 Vehicles | 22,642 (39.1%) | 13,732 (35.5%) |
| 3 or more Vehicles | 20,760 (35.9%) | 8,116 (21.0%) |
| Total | 57,852 (100.0%) | 38,635 (100.0%) |
Real Estate & Mortgages in Santa Cruz County
Real Estate and Mortgage Overview in Santa Cruz County
| Characteristic | Without Mortgage | With Mortgage |
| Housing Units | 20,034 | 37,818 |
| Median Property Value | $838,900 | $998,400 |
| Median Household Income | $84,594 | $20,838 |
| Monthly Housing Costs | $828 | $22,111 |
| Real Estate Taxes | $3,968 | $539 |
Property Value by Mortgage Status in Santa Cruz County
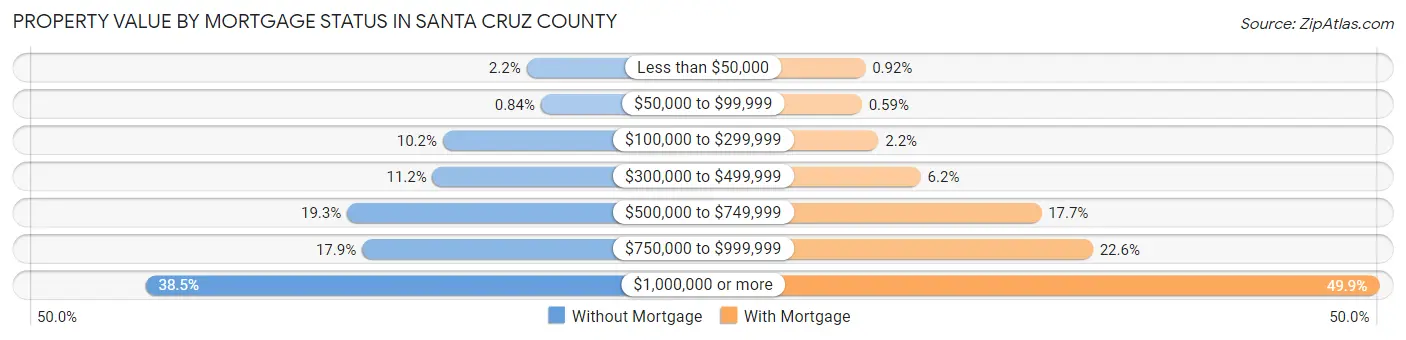
| Property Value | Without Mortgage | With Mortgage |
| Less than $50,000 | 441 (2.2%) | 347 (0.9%) |
| $50,000 to $99,999 | 168 (0.8%) | 223 (0.6%) |
| $100,000 to $299,999 | 2,037 (10.2%) | 822 (2.2%) |
| $300,000 to $499,999 | 2,234 (11.2%) | 2,343 (6.2%) |
| $500,000 to $749,999 | 3,864 (19.3%) | 6,686 (17.7%) |
| $750,000 to $999,999 | 3,580 (17.9%) | 8,543 (22.6%) |
| $1,000,000 or more | 7,710 (38.5%) | 18,854 (49.8%) |
| Total | 20,034 (100.0%) | 37,818 (100.0%) |
Household Income by Mortgage Status in Santa Cruz County
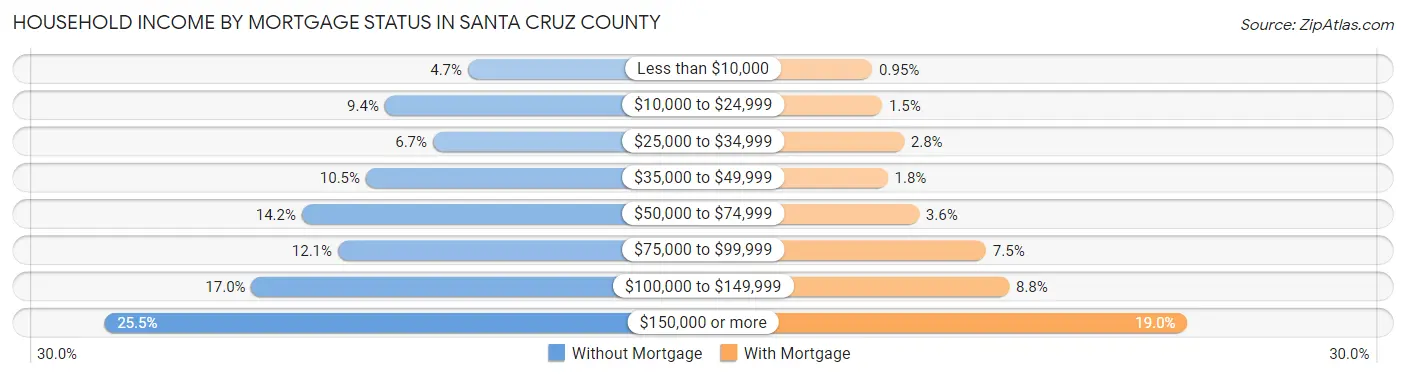
| Household Income | Without Mortgage | With Mortgage |
| Less than $10,000 | 935 (4.7%) | 361 (0.9%) |
| $10,000 to $24,999 | 1,888 (9.4%) | 572 (1.5%) |
| $25,000 to $34,999 | 1,336 (6.7%) | 1,044 (2.8%) |
| $35,000 to $49,999 | 2,103 (10.5%) | 693 (1.8%) |
| $50,000 to $74,999 | 2,836 (14.2%) | 1,368 (3.6%) |
| $75,000 to $99,999 | 2,425 (12.1%) | 2,818 (7.4%) |
| $100,000 to $149,999 | 3,413 (17.0%) | 3,315 (8.8%) |
| $150,000 or more | 5,098 (25.5%) | 7,170 (19.0%) |
| Total | 20,034 (100.0%) | 37,818 (100.0%) |
Property Value to Household Income Ratio in Santa Cruz County
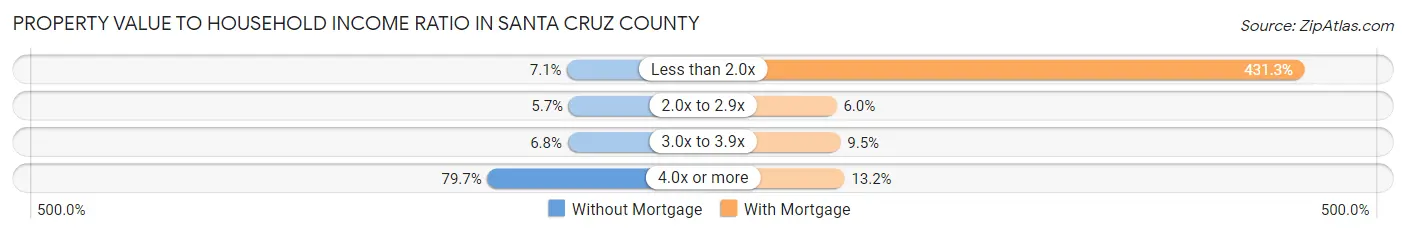
| Value-to-Income Ratio | Without Mortgage | With Mortgage |
| Less than 2.0x | 1,422 (7.1%) | 163,101 (431.3%) |
| 2.0x to 2.9x | 1,143 (5.7%) | 2,255 (6.0%) |
| 3.0x to 3.9x | 1,353 (6.8%) | 3,587 (9.5%) |
| 4.0x or more | 15,958 (79.6%) | 4,991 (13.2%) |
| Total | 20,034 (100.0%) | 37,818 (100.0%) |
Real Estate Taxes by Mortgage Status in Santa Cruz County
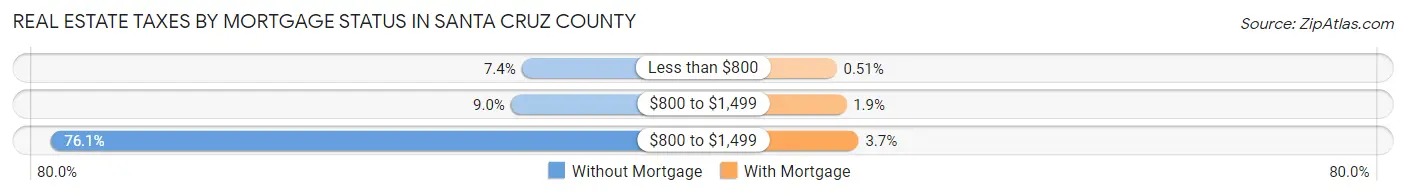
| Property Taxes | Without Mortgage | With Mortgage |
| Less than $800 | 1,481 (7.4%) | 191 (0.5%) |
| $800 to $1,499 | 1,799 (9.0%) | 727 (1.9%) |
| $800 to $1,499 | 15,244 (76.1%) | 1,406 (3.7%) |
| Total | 20,034 (100.0%) | 37,818 (100.0%) |
Health & Disability in Santa Cruz County
Health Insurance Coverage by Age in Santa Cruz County
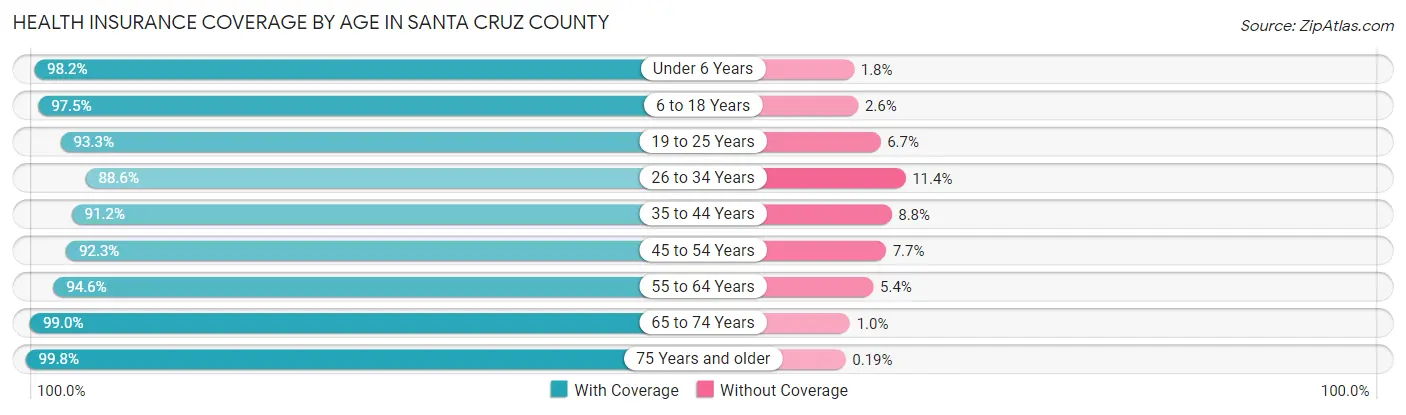
| Age Bracket | With Coverage | Without Coverage |
| Under 6 Years | 14,397 (98.2%) | 260 (1.8%) |
| 6 to 18 Years | 41,178 (97.5%) | 1,076 (2.5%) |
| 19 to 25 Years | 32,241 (93.3%) | 2,314 (6.7%) |
| 26 to 34 Years | 25,907 (88.6%) | 3,319 (11.4%) |
| 35 to 44 Years | 28,886 (91.2%) | 2,775 (8.8%) |
| 45 to 54 Years | 30,244 (92.3%) | 2,529 (7.7%) |
| 55 to 64 Years | 33,232 (94.6%) | 1,887 (5.4%) |
| 65 to 74 Years | 29,810 (99.0%) | 304 (1.0%) |
| 75 Years and older | 17,057 (99.8%) | 32 (0.2%) |
| Total | 252,952 (94.6%) | 14,496 (5.4%) |
Health Insurance Coverage by Citizenship Status in Santa Cruz County
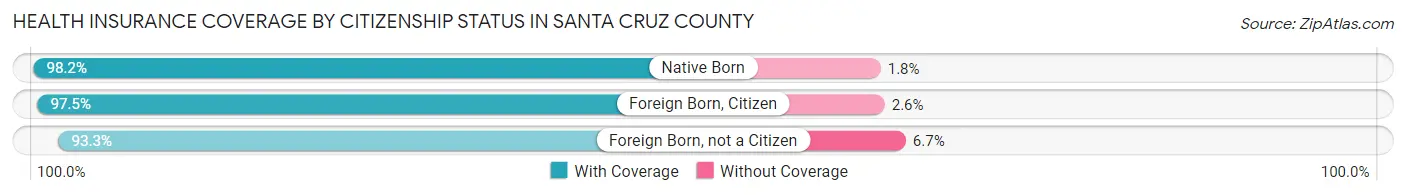
| Citizenship Status | With Coverage | Without Coverage |
| Native Born | 14,397 (98.2%) | 260 (1.8%) |
| Foreign Born, Citizen | 41,178 (97.5%) | 1,076 (2.5%) |
| Foreign Born, not a Citizen | 32,241 (93.3%) | 2,314 (6.7%) |
Health Insurance Coverage by Household Income in Santa Cruz County
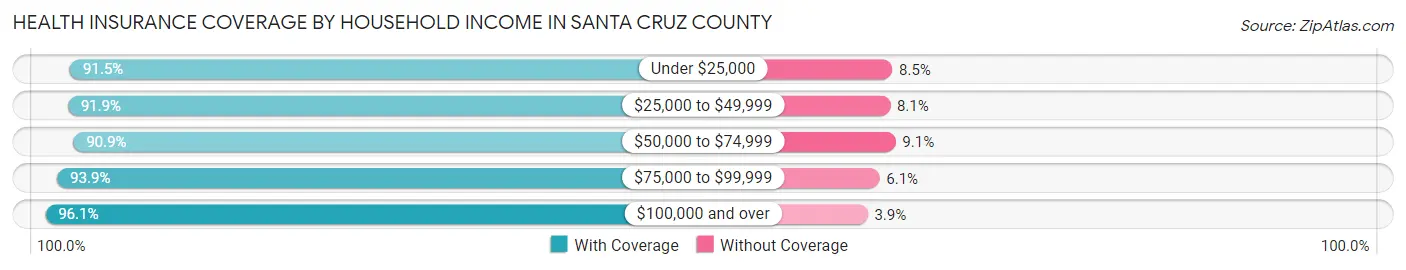
| Household Income | With Coverage | Without Coverage |
| Under $25,000 | 18,777 (91.5%) | 1,742 (8.5%) |
| $25,000 to $49,999 | 23,555 (91.9%) | 2,070 (8.1%) |
| $50,000 to $74,999 | 23,665 (90.9%) | 2,373 (9.1%) |
| $75,000 to $99,999 | 29,289 (93.9%) | 1,904 (6.1%) |
| $100,000 and over | 145,465 (96.1%) | 5,850 (3.9%) |
Public vs Private Health Insurance Coverage by Age in Santa Cruz County
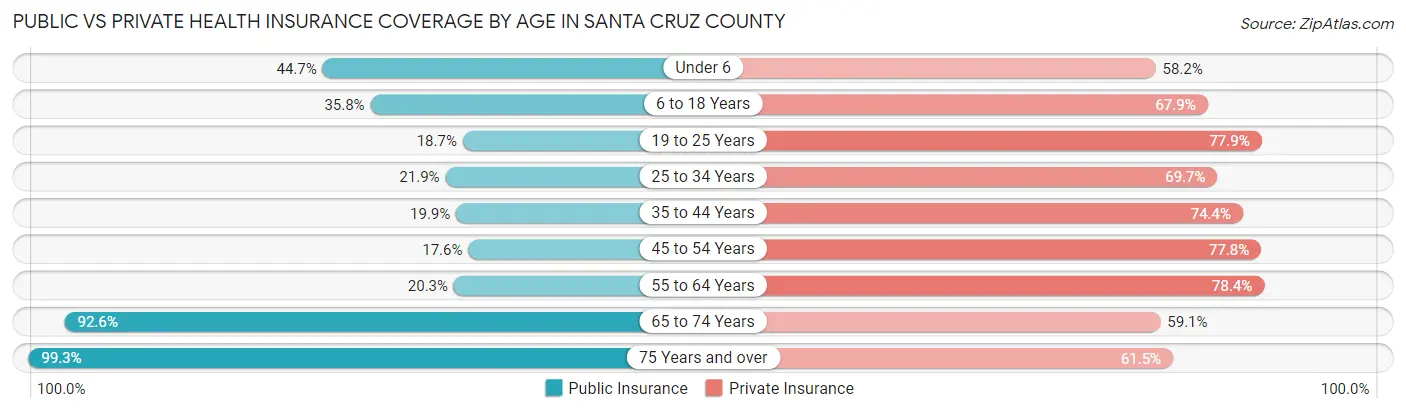
| Age Bracket | Public Insurance | Private Insurance |
| Under 6 | 6,551 (44.7%) | 8,535 (58.2%) |
| 6 to 18 Years | 15,130 (35.8%) | 28,677 (67.9%) |
| 19 to 25 Years | 6,456 (18.7%) | 26,914 (77.9%) |
| 25 to 34 Years | 6,397 (21.9%) | 20,371 (69.7%) |
| 35 to 44 Years | 6,302 (19.9%) | 23,566 (74.4%) |
| 45 to 54 Years | 5,782 (17.6%) | 25,505 (77.8%) |
| 55 to 64 Years | 7,136 (20.3%) | 27,529 (78.4%) |
| 65 to 74 Years | 27,880 (92.6%) | 17,805 (59.1%) |
| 75 Years and over | 16,967 (99.3%) | 10,503 (61.5%) |
| Total | 98,601 (36.9%) | 189,405 (70.8%) |
Disability Status by Sex by Age in Santa Cruz County
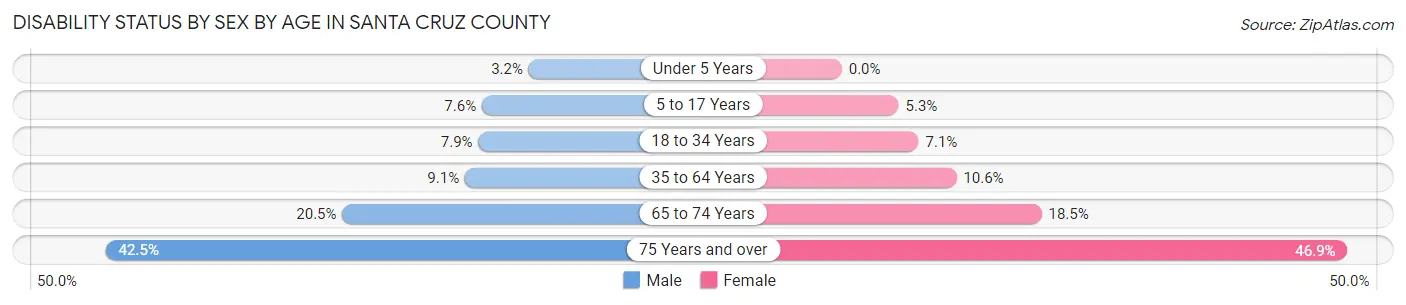
| Age Bracket | Male | Female |
| Under 5 Years | 200 (3.2%) | 0 (0.0%) |
| 5 to 17 Years | 1,472 (7.5%) | 971 (5.3%) |
| 18 to 34 Years | 2,807 (7.9%) | 2,480 (7.1%) |
| 35 to 64 Years | 4,580 (9.1%) | 5,252 (10.6%) |
| 65 to 74 Years | 3,026 (20.5%) | 2,848 (18.5%) |
| 75 Years and over | 3,062 (42.5%) | 4,637 (46.9%) |
Disability Class by Sex by Age in Santa Cruz County
Disability Class: Hearing Difficulty
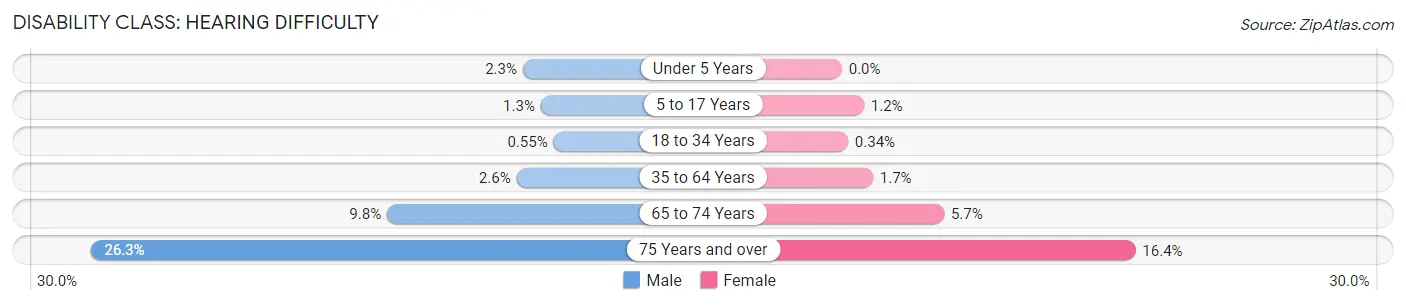
| Age Bracket | Male | Female |
| Under 5 Years | 141 (2.3%) | 0 (0.0%) |
| 5 to 17 Years | 246 (1.3%) | 226 (1.2%) |
| 18 to 34 Years | 197 (0.5%) | 117 (0.3%) |
| 35 to 64 Years | 1,312 (2.6%) | 856 (1.7%) |
| 65 to 74 Years | 1,449 (9.8%) | 874 (5.7%) |
| 75 Years and over | 1,894 (26.3%) | 1,616 (16.4%) |
Disability Class: Vision Difficulty
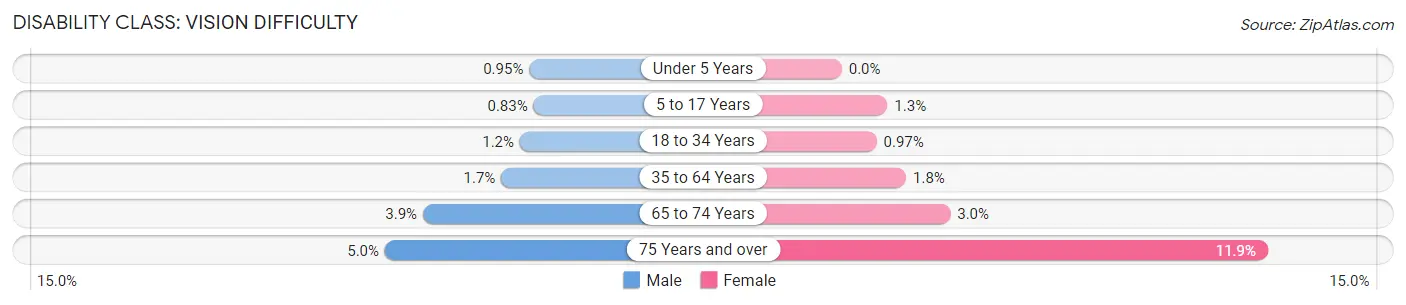
| Age Bracket | Male | Female |
| Under 5 Years | 59 (0.9%) | 0 (0.0%) |
| 5 to 17 Years | 162 (0.8%) | 233 (1.3%) |
| 18 to 34 Years | 430 (1.2%) | 336 (1.0%) |
| 35 to 64 Years | 870 (1.7%) | 883 (1.8%) |
| 65 to 74 Years | 577 (3.9%) | 464 (3.0%) |
| 75 Years and over | 358 (5.0%) | 1,172 (11.9%) |
Disability Class: Cognitive Difficulty
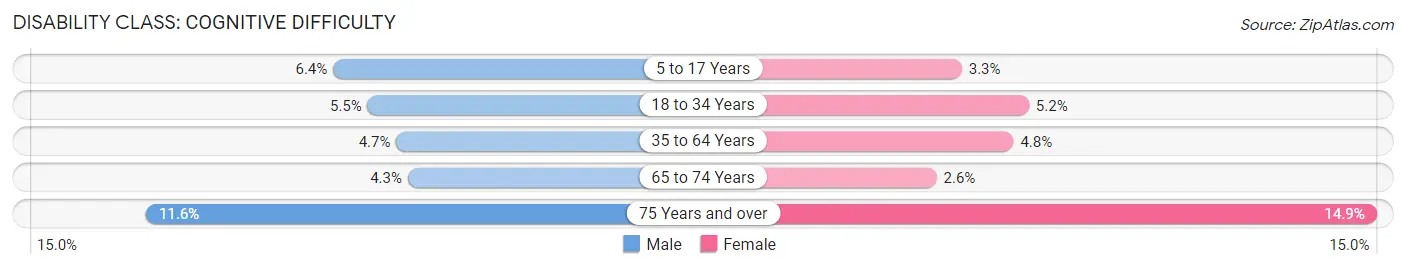
| Age Bracket | Male | Female |
| 5 to 17 Years | 1,249 (6.4%) | 614 (3.3%) |
| 18 to 34 Years | 1,942 (5.4%) | 1,814 (5.2%) |
| 35 to 64 Years | 2,335 (4.6%) | 2,360 (4.8%) |
| 65 to 74 Years | 639 (4.3%) | 406 (2.6%) |
| 75 Years and over | 837 (11.6%) | 1,472 (14.9%) |
Disability Class: Ambulatory Difficulty
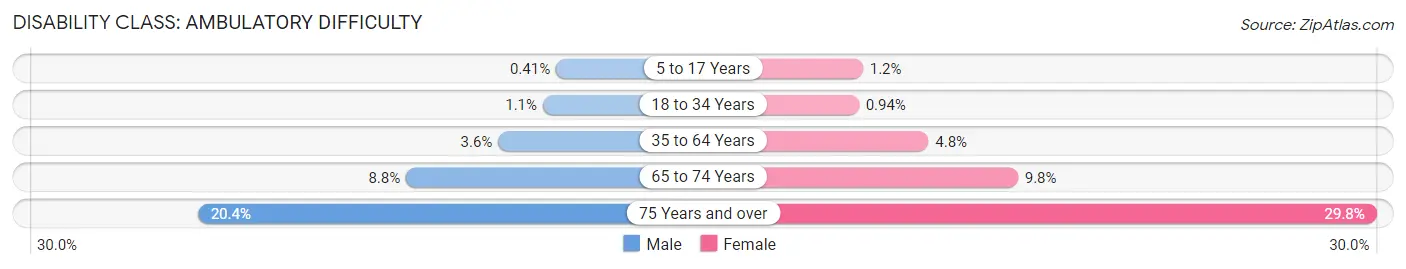
| Age Bracket | Male | Female |
| 5 to 17 Years | 79 (0.4%) | 216 (1.2%) |
| 18 to 34 Years | 407 (1.1%) | 326 (0.9%) |
| 35 to 64 Years | 1,821 (3.6%) | 2,380 (4.8%) |
| 65 to 74 Years | 1,292 (8.8%) | 1,505 (9.8%) |
| 75 Years and over | 1,467 (20.4%) | 2,943 (29.8%) |
Disability Class: Self-Care Difficulty
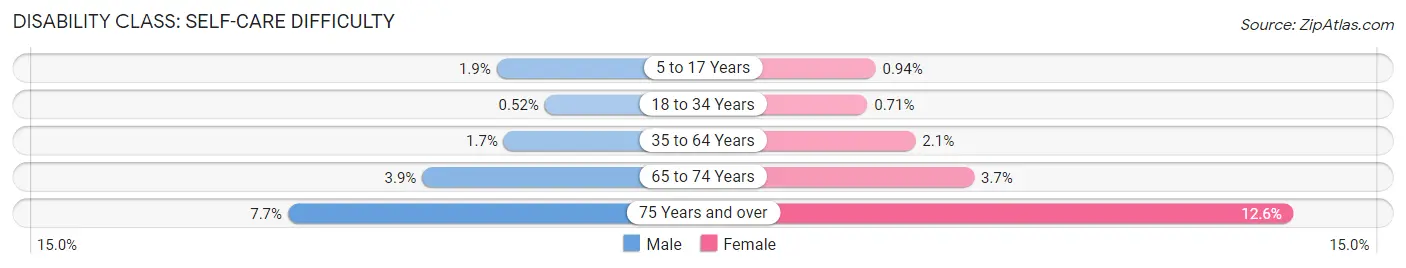
| Age Bracket | Male | Female |
| 5 to 17 Years | 362 (1.9%) | 173 (0.9%) |
| 18 to 34 Years | 185 (0.5%) | 247 (0.7%) |
| 35 to 64 Years | 831 (1.7%) | 1,013 (2.1%) |
| 65 to 74 Years | 580 (3.9%) | 565 (3.7%) |
| 75 Years and over | 553 (7.7%) | 1,243 (12.6%) |
Technology Access in Santa Cruz County
Computing Device Access in Santa Cruz County
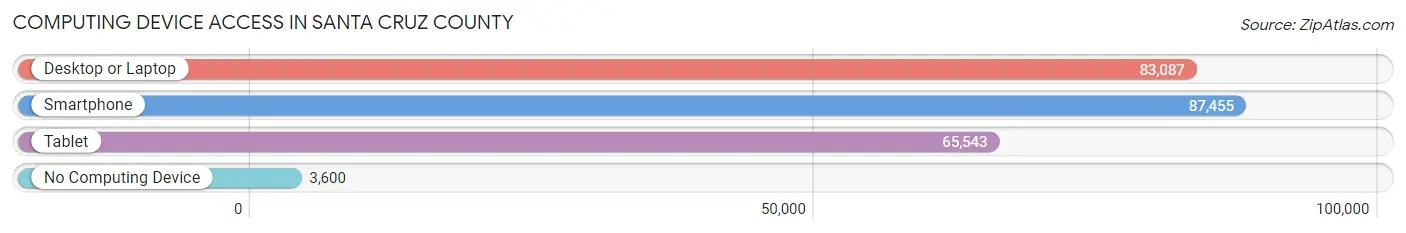
| Device Type | # Households | % Households |
| Desktop or Laptop | 83,087 | 86.1% |
| Smartphone | 87,455 | 90.6% |
| Tablet | 65,543 | 67.9% |
| No Computing Device | 3,600 | 3.7% |
| Total | 96,487 | 100.0% |
Internet Access in Santa Cruz County
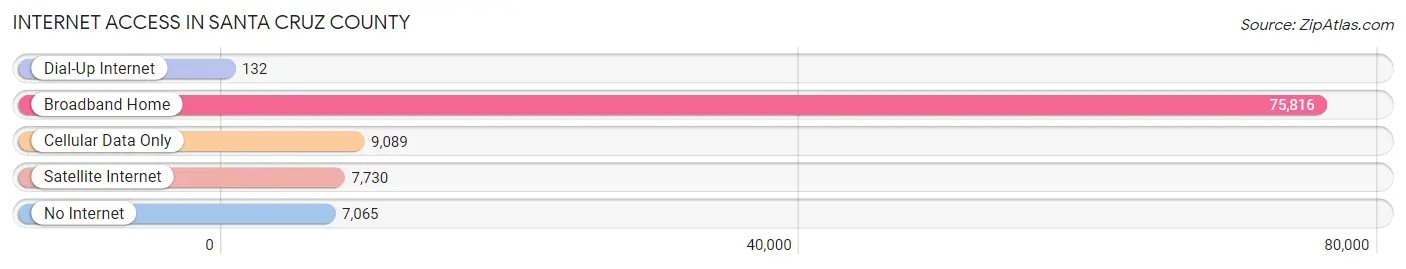
| Internet Type | # Households | % Households |
| Dial-Up Internet | 132 | 0.1% |
| Broadband Home | 75,816 | 78.6% |
| Cellular Data Only | 9,089 | 9.4% |
| Satellite Internet | 7,730 | 8.0% |
| No Internet | 7,065 | 7.3% |
| Total | 96,487 | 100.0% |
Santa Cruz County Summary
Santa Cruz County is located in the northern part of the state of California, along the Pacific Ocean. It is bordered by San Mateo County to the north, Monterey County to the south, and Santa Clara County to the east. The county seat is Santa Cruz, and the largest city is Watsonville. The county has a total area of 607 square miles, of which 545 square miles is land and 62 square miles is water.
History
The first inhabitants of Santa Cruz County were the Ohlone people, who lived in the area for thousands of years before the arrival of Europeans. The first Europeans to explore the area were Spanish explorers, who arrived in 1769. The area was part of the Spanish Empire until 1822, when it became part of Mexico. In 1848, the area was ceded to the United States as part of the Treaty of Guadalupe Hidalgo.
In 1850, Santa Cruz County was established as one of the original 27 counties of California. The county was named after the Mission Santa Cruz, which was founded in 1791. The county seat was established in Santa Cruz in 1856.
Geography
Santa Cruz County is located in the northern part of the state of California, along the Pacific Ocean. It is bordered by San Mateo County to the north, Monterey County to the south, and Santa Clara County to the east. The county has a total area of 607 square miles, of which 545 square miles is land and 62 square miles is water.
The county is divided into two distinct regions: the coastal region and the inland region. The coastal region is characterized by its rugged coastline, which is dotted with numerous beaches and coves. The inland region is characterized by rolling hills and valleys, and is home to the Santa Cruz Mountains.
Economy
The economy of Santa Cruz County is largely based on tourism, agriculture, and technology. Tourism is the largest industry in the county, with visitors drawn to the area’s beaches, redwood forests, and other attractions. Agriculture is also an important part of the economy, with the county’s farms producing a variety of fruits and vegetables. The county is also home to several technology companies, including Plantronics, Plantronics, and Plantronics.
Demographics
As of the 2010 census, the population of Santa Cruz County was 265,618. The racial makeup of the county was 68.2% White, 2.3% African American, 0.7% Native American, 11.2% Asian, 0.3% Pacific Islander, 11.7% from other races, and 5.7% from two or more races. Hispanic or Latino of any race were 24.4% of the population.
The median household income in the county was $63,845, and the median family income was $76,845. The per capita income was $31,945. About 11.2% of the population was below the poverty line.
Conclusion
Santa Cruz County is located in the northern part of the state of California, along the Pacific Ocean. It is bordered by San Mateo County to the north, Monterey County to the south, and Santa Clara County to the east. The county has a total area of 607 square miles, of which 545 square miles is land and 62 square miles is water. The economy of Santa Cruz County is largely based on tourism, agriculture, and technology. As of the 2010 census, the population of Santa Cruz County was 265,618. The racial makeup of the county was 68.2% White, 2.3% African American, 0.7% Native American, 11.2% Asian, 0.3% Pacific Islander, 11.7% from other races, and 5.7% from two or more races. Hispanic or Latino of any race were 24.4% of the population.
Common Questions
What is Per Capita Income in Santa Cruz County?
Per Capita income in Santa Cruz County is $52,887.
What is the Median Family Income in Santa Cruz County?
Median Family Income in Santa Cruz County is $127,331.
What is the Median Household income in Santa Cruz County?
Median Household Income in Santa Cruz County is $104,409.
What is Income or Wage Gap in Santa Cruz County?
Income or Wage Gap in Santa Cruz County is 35.5%.
Women in Santa Cruz County earn 64.5 cents for every dollar earned by a man.
What is Family Income Deficit in Santa Cruz County?
Family Income Deficit in Santa Cruz County is $10,002.
Families that are below poverty line in Santa Cruz County earn $10,002 less on average than the poverty threshold level.
What is Inequality or Gini Index in Santa Cruz County?
Inequality or Gini Index in Santa Cruz County is 0.48.
What is the Total Population of Santa Cruz County?
Total Population of Santa Cruz County is 268,571.
What is the Total Male Population of Santa Cruz County?
Total Male Population of Santa Cruz County is 134,256.
What is the Total Female Population of Santa Cruz County?
Total Female Population of Santa Cruz County is 134,315.
What is the Ratio of Males per 100 Females in Santa Cruz County?
There are 99.96 Males per 100 Females in Santa Cruz County.
What is the Ratio of Females per 100 Males in Santa Cruz County?
There are 100.04 Females per 100 Males in Santa Cruz County.
What is the Median Population Age in Santa Cruz County?
Median Population Age in Santa Cruz County is 39.2 Years.
What is the Average Family Size in Santa Cruz County
Average Family Size in Santa Cruz County is 3.1 People.
What is the Average Household Size in Santa Cruz County
Average Household Size in Santa Cruz County is 2.6 People.
How Large is the Labor Force in Santa Cruz County?
There are 142,591 People in the Labor Forcein in Santa Cruz County.
What is the Percentage of People in the Labor Force in Santa Cruz County?
63.5% of People are in the Labor Force in Santa Cruz County.
What is the Unemployment Rate in Santa Cruz County?
Unemployment Rate in Santa Cruz County is 5.9%.